Atlassian DevOps Trends Survey 2020a87265a6-4a4d... · faced, and the impact of tools and culture...
38
2020 DevOps Trends Survey by Atlassian & CITE Research
Transcript of Atlassian DevOps Trends Survey 2020a87265a6-4a4d... · faced, and the impact of tools and culture...

2020 DevOps Trends Surveyby Atlassian & CITE Research

2
Foreword Over the last 15 years, tens of thousands of organizations have adopted a DevOps way of working with the help of our tools. We’ve seen how DevOps has grown from a term only familiar to technical teams to becoming part of the C-suite vocabulary. Practices like CI/CD and automation have become the norm in every engineering organization.
In February of this year, we conducted a DevOps trends survey to understand where DevOps is going. We surveyed 500 professionals about their success with DevOps, the barriers they faced, and the impact of tools and culture on their work.
The three major trends we found all speak to one fact. The path to DevOps is a matter of when, not if - but there are still significant obstacles along the way.
The research contained in this report has been completed with the advice and assistance of CITE Research. This survey was conducted in a pre-pandemic world and may not be reflective of the realities of DevOps today.
Background & methodology
Executive summary
Detailed findings Appendix
Table of Contents
Page 4 Page 6 Page 11 Page 36

Background & methodology
4

‣Employed full-time
‣Be in Software Development or IT
‣Manager-level or above
‣At companies with 101+ employees
‣Work at an organization that practices DevOps
‣CITE Research, on behalf of Atlassian, conducted an online survey among 500 Developers & IT Decision Makers in February 2020.
Explore how companies are managing DevOps:
‣What practices companies have in place for DevOps
‣How do companies measure DevOps success
‣Barriers to DevOps transformation
‣ Impact of DevOps practices
‣Differences in perceptions of DevOps by level, team, etc.
OBJECTIVE METHODOLOGY
RESPONDENT CRITERIA
5

Executive summary
6

Executive Summary / Survey Highlights
Executives and practitioners don’t see eye to eye. ‣ Confidence in
measurements of DevOps success vary
‣ Practitioners emphasize collaboration culture while executives value individual mindset
There are still obstacles. ‣ 85% of respondents have
faced barriers in their DevOps implementation
‣ Lack of skills, legacy infrastructure, and adjusting corporate culture are top complaints
DevOps is now a corporate term. ‣ More than half of orgs
have been practicing DevOps for over three years
‣ Over 90% said DevOps had a direct impact on business metrics
7

Executive Summary / The positive impact of DevOps
99% of respondents say DevOps has had a positive impact on their organization
Impact on career 78% had to learn a new skill 48% of respondents say it helped them get a raise
Better deliverables 61% say it helped them produce higher quality deliverables
Faster deliverables 49% say they see a faster time to market 49% say it improved their deployment frequency
The top factors in implementing
DevOps successfully are the right tools
and the right people.
The top factors in a DevOps team
performing well are collaboration and
the ability to problem-solve.
8

Executive Summary However, most face issues with DevOps implementation
Nearly all (85%) of organizations face some type of hurdle when implementing DevOps, with lack of skills in employees, legacy infrastructure, and adjusting corporate culture being the top complaints.
85%Barrier to Implementation of DevOps
Lack of skills in employees
Legacy infrastructure
Adjusting corporate culture35%
37%
36%
9

Executive Summary While most feel they can effectively measure DevOps success, executives feel much more confident in their measurements than the practitioners.
Compared to Executives, the Practitioner is:
More likely to agree it is difficult to measure the impact of DevOps progress and success – 62% agree compared to 49% of decision-makers
More likely to agree my organization has no clear way to measure DevOps success – 58% agree compared to 47% of decision-makers
More likely to agree I’m unsure how to improve my organization’s DevOps processes – 47% agree compared to 34% of decision-makers
74%Have a way to measure DevOps success (most commonly deployment frequency)
97%Feel they are very or
somewhat effective in measuring DevOps success
Most are measuring DevOps success/impact and feel they are doing it effectively…
10

Detailed findings
DevOps Practices11

Detailed findingsDEVOPS PRACTICES
PART 1
12

DevOps titles are the norm…
Organizations use DevOps in titles – 69% have a team with DevOps in the name and/or employees with DevOps in their titles.
‣ Larger organizations with 500+ employees are especially likely to have a team with DevOps in the title (57%).
‣ Organizations that have been using DevOps for 3+ years are also more likely to have a team with DevOps in the name (57%).
20%
42%
49%52%
We have a team with the name DevOps in
the title
We have employee(s) with
DevOps titles
We have dedicated teams
responsible for DevOps, but
without DevOps in their title
We have employees who are responsible
for this, but without DevOps
in their title
DEVOPS PRACTICES
Which of the following best describes your organization’s management of DevOps? Please select all that apply.
13

…but almost half of organizations are just starting with DevOps, practicing it for less than 3 years.
‣ 46% of organizations are relatively new to DevOps with under 3 years of doing it.
‣ 54% of organizations have been practicing DevOps for 3 years or more.
1%
18%
36%
39%
7%
Approximately how long has your organization used DevOps practices?
Less than one year 1 year to less than 3 years
3 years to less than 5 years
5 years or more
LONGEVITY OF DEVOPS PRACTICES
Unsure
14

Source code management and code development are the most widespread toolchains used
Respondents are using an average of 10.3 toolchains, with 80%+ using source code management, code development and review and applications performance monitoring. The least common is artifact repository, although almost half are using this toolchain as well.
Which of the following DevOps toolchains does your company currently use? [N=417 who have use source code management toolchain]
Source code management
Code development and review
Applications performance monitoring
Agile planning
Continuous testing tools
Incident response and management
Continuous integration
Infrastructure configuration and…
Application release automation and…
End-user experience
Change and release management
Packaging
Artifact repository 53%
59%
72%
74%
76%
77%
79%
79%
79%
79%
82%
90%
100%
TOOLCHAIN USAGE
15

Detailed findingsPERCEPTIONS OF DEVOPS – IMPACT & CHALLENGES
PART 2
16

DevOps has a resoundingly positive impact on organizations…
Nearly all respondents say the implementation of DevOps will have a positive impact on their organization on the future.
‣ Interestingly, decision-maker employees are more likely to say very positive (75% compared to only 60% of practitioners).
‣ Those who measure DevOps success are more likely to say its very positive as well (76%).
Positive Negative
30%
1%
69%
Generally, what impact do you expect implementing DevOps will have on your organization in the future?
DEVOPS IMPACT
Very
Somewhat
17

...across a variety of metrics...
‣ Organizations see a multitude of positive results from DevOps implementation, most frequently higher quality deliverables (61%).
‣ About half see faster time to market/lead time, improvement deployment frequency, better team culture and increased collaboration across teams/departments.
‣ Those who work on both Developing and Operations are significantly more likely to see various impacts, such higher quality deliverables (65%), faster recovery times (52%), building better products and services (48%), and lower failure rate of new releases (45%).
‣ Those who have been practicing DevOps for longer (3+ years) are more likely to have seen higher-quality deliverables (66%), lower failure rate of new releases (45%) and less incidents (40%).
Which of the following, if any, have been the impact of implementing DevOps practices on your organization? Please select all that apply.
IMPACT OF DEVOPS ON ORGANIZATION
Higher quality deliverables
Faster time to market / lead time
Improved deployment frequency
Better team culture
Increased collaboration across different teams and departments
Faster recovery times
Building better products and services
Lower failure rate of new releases
Increased collaboration with non-technical departments
Less incidents
None of the above
Other (please specify) 0%
1%
35%
36%
40%
46%
47%
48%
48%
49%
49%
61%
18

...and it leads to career transformation.
9 out of 10 respondents say DevOps impacted their career
‣ The majority of respondents say DevOps implementation has required them to learn new skills.
‣ Almost half (48%) say it helped them get a raise.
‣ A third had to shift roles.
I have had to learn new skills
It helped me get a raise
I have had to shift roles
It has had no impact on my career 8%
31%
48%
78%
What impact has DevOps implementation had on your career, personally?
IMPACT OF DEVOPS ON CAREER
19

Collaboration is the key for DevOps success…
Overall, Collaboration and Ability to problem solve are ranked first among traits of a successful DevOps team
‣ Ops respondents are more likely to rank Ability to problem solve and autonomy #1 at 32%.
‣ Devs are more likely to rank Collaboration #1 36%.
‣ Decision-makers are more likely to rate Forward-thinking as #1 at 18%.
Which of the following are the most important traits for a DevOps team/department to have in order to perform well? Please rate the top 3 traits, with 1 being the most important to a successful DevOps team.
Collaboration Ability to problem-solve
Alignment/coordination
with other teams
Forward-thinking
EmpathyOpennessAutonomyVisibility within the
organization
MOST IMPORTANT TRAITS FOR DEVOPS TEAM TO PERFORM WELL
20

…And the right people and culture lead to successful implementation.
The right people and/or company culture is the top trait for successful DevOps implementation. The right tools and support from senior leadership are also important.
‣ Devs respondents are especially likely to say A way to measure DevOps success is #1 (19%).
‣ Software Developers are more likely than IT professionals to feel they need The right tools (38% rank this #1).
Which of the following, if any, are the most important factors to a successful DevOps implementation? Please rate the top 3 factors, with 1 being the most important to a successful DevOps team.
The right people / Company Culture
The right tools Support from senior leadership
A way to measure DevOps
success
MOST IMPORTANT TRAITS FOR SUCCESSFUL DEVOPS IMPLEMENTATION
21

Lack of skills, legacy infrastructure and corporate culture are biggest hurdles to DevOps implementation.
The majority of respondents (84%) have faced barriers to their DevOps implementation. Most common hurdles are lack of skills in employees, legacy infrastructure and adjusting corporate culture.
‣ C-suite respondents are more likely to see inability to cleanly coordinate well with other teams (38%) as a barrier.
Which of the following, if any, have been barriers to implementing DevOps practices into your organization? Please select all that apply.
Lack of skills in
employees
Legacy infrastructure
BARRIERS TO DEVOPS IMPLEMENTATION
Adjusting corporate
culture
Silos between
Developers and
Operations teams
Inability to cleanly
coordinate well with
other teams
Wrong / insufficient
tools
Other (please specify)
No clear plan
None of the above
No clear way to
measure DevOps success
1%
12%16%16%
24%26%30%
35%36%37%
22

Detailed findingsMEASURING TEAM SUCCESS
PART 3
23

Three quarters measure DevOps success, most commonly through deployment frequency
‣ Most measure DevOps success or impact (74%).
‣ Deployment frequency is by far the most common method of DevOps success measurement as companies want to be more agile and move faster.
‣ Nearly half of respondents leverage the four key DevOps metrics identified by DORA.
‣ Interestingly, 79% of decision-makers say they measure success compared to only 67% of practitioners. Decision-makers are more likely to say they use MTTR to measure success at 60% vs. 45% of practitioners. Deployment frequency
Mean time to restore (MTTR)Lead time
Change fail percentageOther (please specify) 1%
48%
53%
55%
75%
Unsure7%
No19%
Yes74%
MEASURE DEVOPS SUCCESS / IMPACT
METHODS OF DEVOPS SUCCESS MEASUREMENT
Does your organization have a way to measure DevOps success or impact?
Which of the following does your organization use to measure DevOps success? Please select all that apply. [N=372]
24

Most agree it is important to measure the impact of DevOps, but don’t have a clear way to do so
‣ Respondents agree it is important to measure DevOps progress/success (95%), DevOps has an impact on important metrics (94%) and has an impact on business metrics (93%).
‣ Three quarters prefer to use best of breed tools versus one toolchain.
‣ Half of respondents say that it is difficult to measure the impact of DevOps progress, and that their organization does not have a clear way to measure success.
How much do you agree or disagree with each of the following statements?
AGREEMENT WITH DEVOPS MEASUREMENT / IMPACT STATEMENTS
It is important to measure the impact of DevOps progress and success
It is clear that DevOps has an impact on mean time to repair, cycle time and other important metrics
It is clear that DevOps has an impact on business metrics, such as revenue and profitability
I prefer using best of breed tools over one toolchain for DevOps
It is difficult to measure the impact of DevOps progress and success
My organization does not have a clear way to measure DevOps success
I’m unsure how to improve my organization’s DevOps process 35%
22%
28%
20%
6%
6%
4%
26%
30%
33%
41%
42%
44%
37%
13%
21%
21%
36%
51%
50%
58%
Completely agree Somewhat agree Somewhat disagree Completely disagree
1%
0%
1%
3%
17%
26%
26%
25
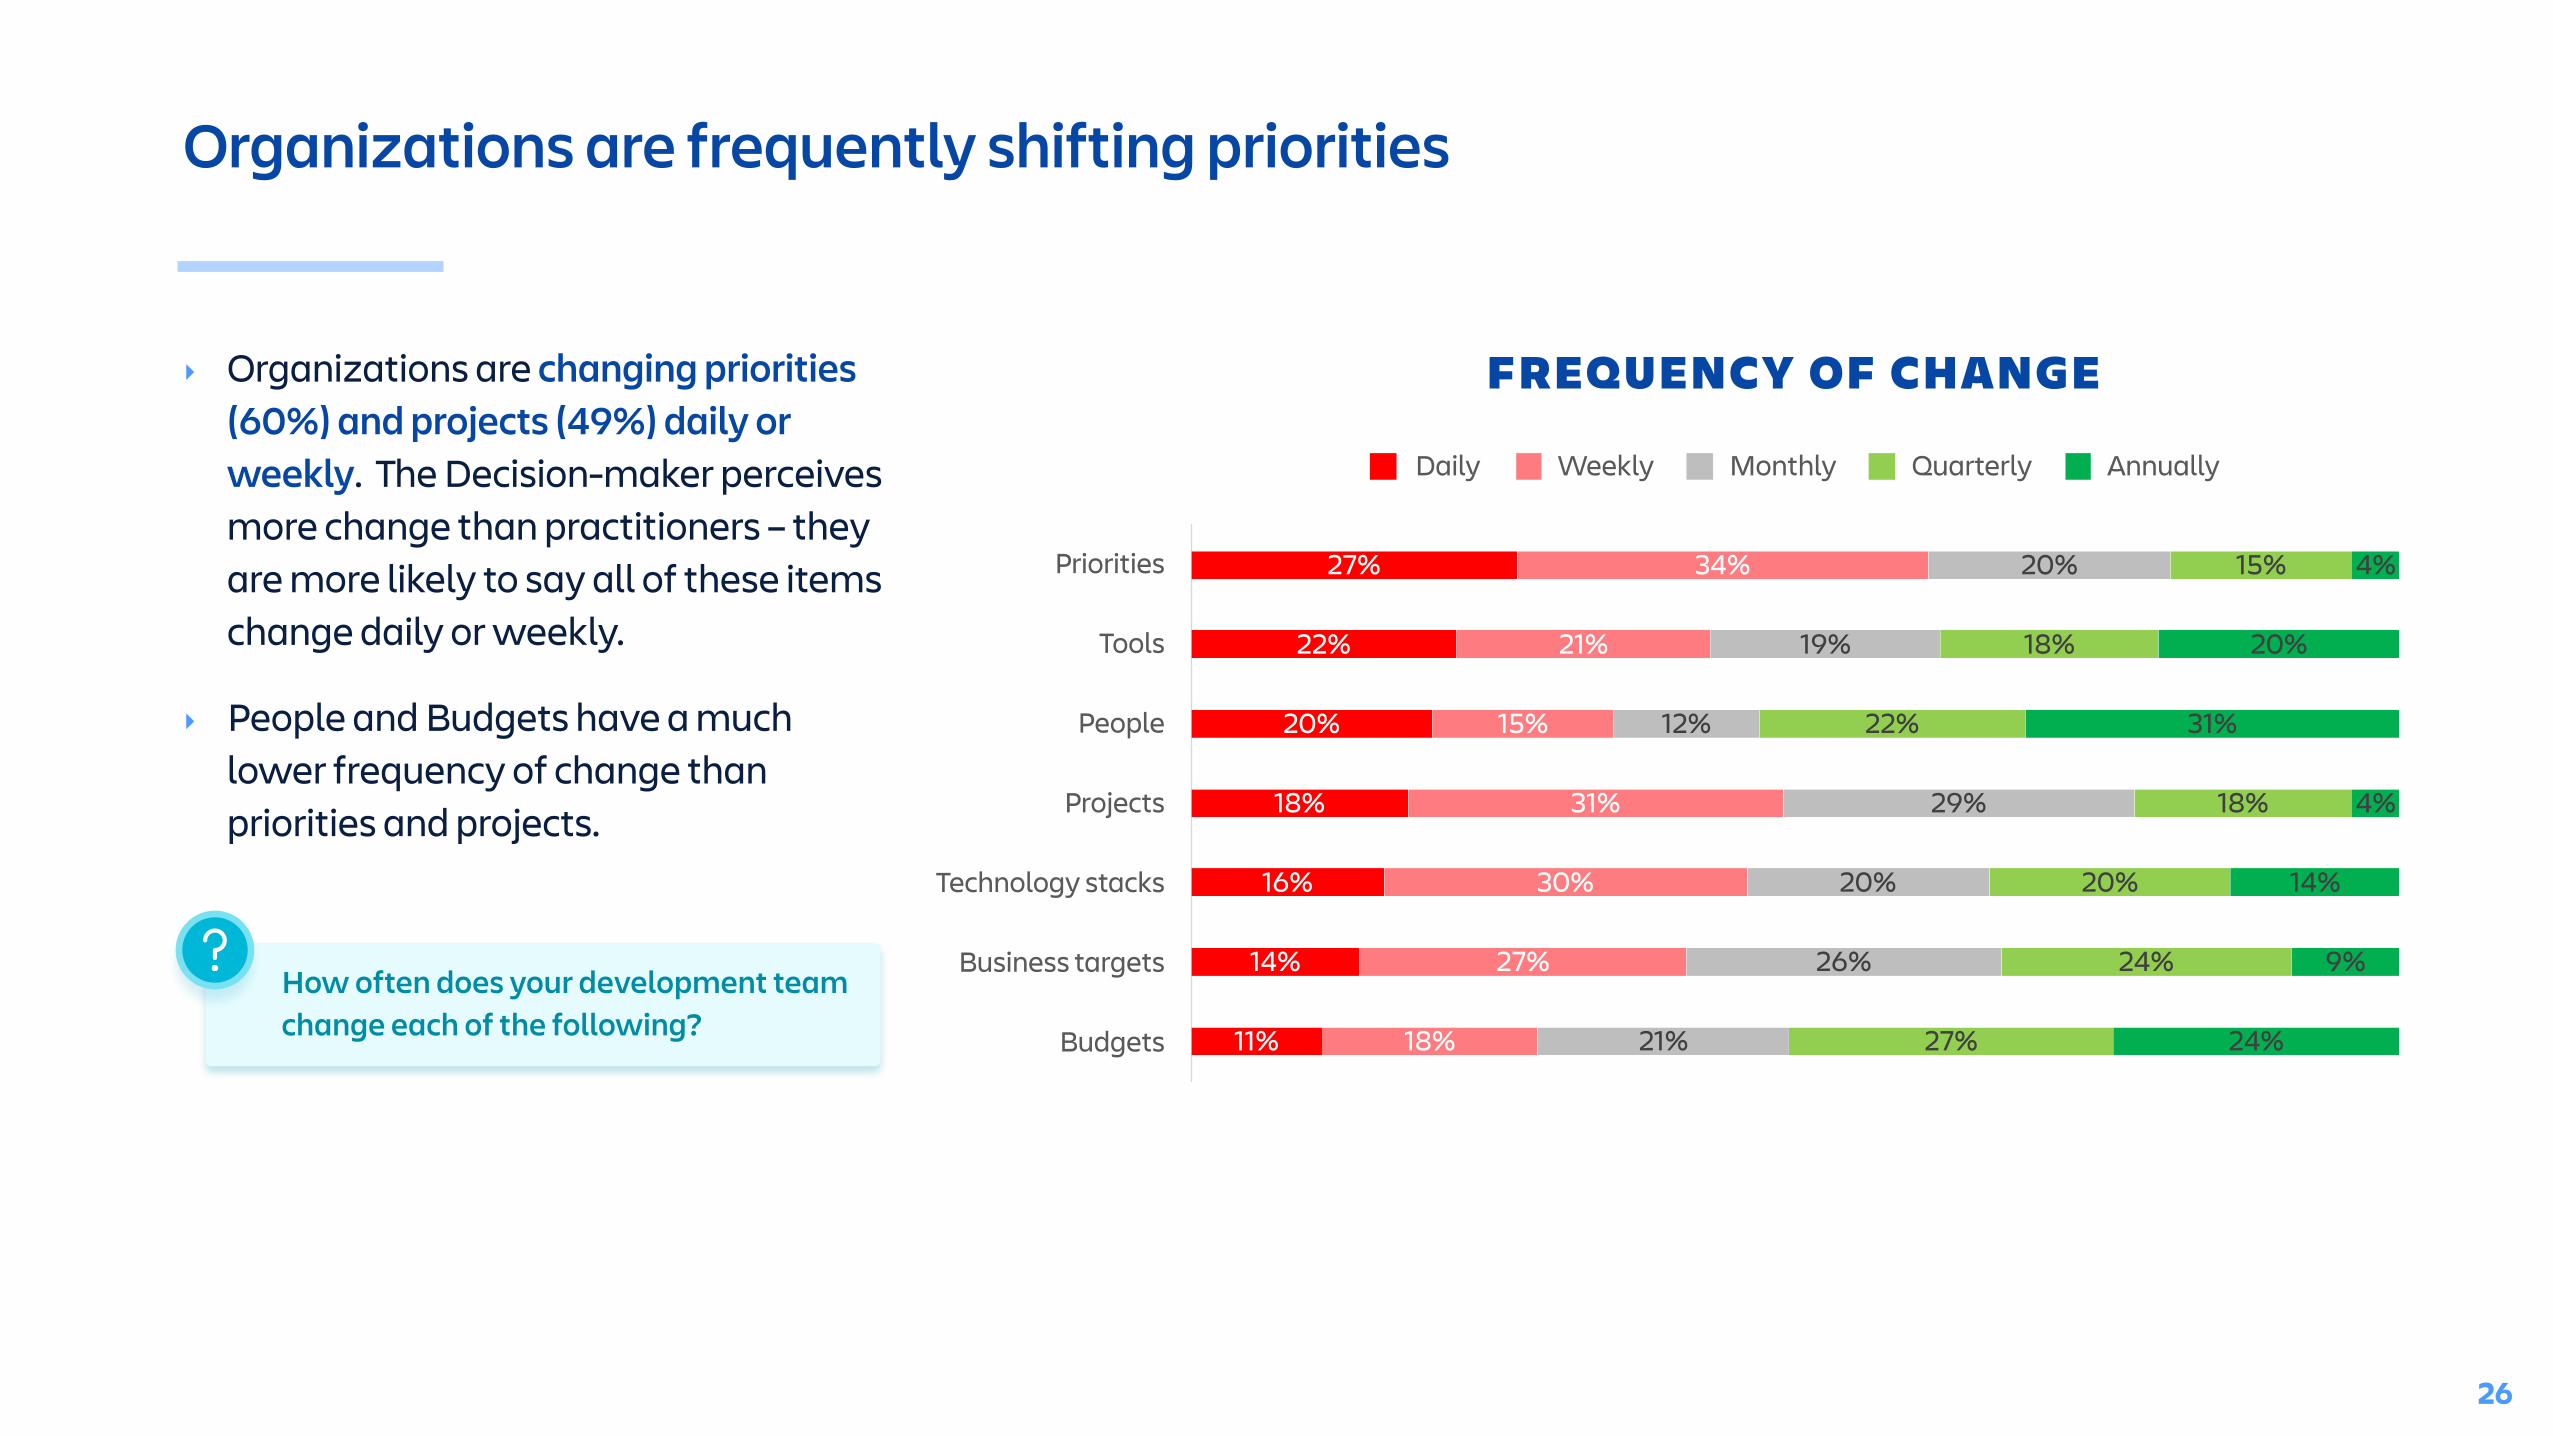
Organizations are frequently shifting priorities
‣ Organizations are changing priorities (60%) and projects (49%) daily or weekly. The Decision-maker perceives more change than practitioners – they are more likely to say all of these items change daily or weekly.
‣ People and Budgets have a much lower frequency of change than priorities and projects.
Priorities
Tools
People
Projects
Technology stacks
Business targets
Budgets 24%
9%
14%
4%
31%
20%
4%
27%
24%
20%
18%
22%
18%
15%
21%
26%
20%
29%
12%
19%
20%
18%
27%
30%
31%
15%
21%
34%
11%
14%
16%
18%
20%
22%
27%
Daily Weekly Monthly Quarterly Annually
How often does your development team change each of the following?
FREQUENCY OF CHANGE
26

Detailed findingsTRACKING MODERN SOFTWARE TRENDS
PART 4
27

Most organizations continue to spend up to 30% of their time on updates
‣ There are no statistically significant changes in the amount of time spent on upgrades and updates since the 2018 report.
‣ Seven in ten (70%) are spending up to 30% of their time on upgrades and updates.
Zero 1-10% 11-20% 21-30% 41-50% 51-60% 70% or more
5%
10%
15%
27%28%
14%
1%
5%7%
19%
28%26%
15%
1%
2018 2020
Approximately what percentage of your team’s time each month is spent on updates or upgrades to self-hosted software you use?
TIME SPENT ON UPGRADES/UPDATES
28

The frequency of being asked status and updating status may be declining...
Since 2018, the frequency respondents are asked status and the frequency they update status in a tool is statistically less often.
‣ In 2020, respondents are less likely to say they are asked a few times a day or once a day to provide their work status.
‣ They are also less likely to stay they need to update status in a tool a few times a day or once a day.
How many times a day do you have to update status in a software development tool?
Approximately how often are you asked by someone to provide the status of your or your team’s work?
FREQUENCY ASKED STATUS FREQUENCY UPDATE STATUS IN TOOL
29

…But the number of tools to understand a project status is on the rise.
The number of tools respondents use to understand the status of their software development projects are on the rise:
‣ Significantly less say they need 3-4 tools to know their status, while significantly more say they need 5+ tools to understand their status.
1 to 2 3 to 4 5 or more
32%33%35%
21%
39%39%
2018 2020
How many tools do you need to consult to understand the status of your software development projects?
NUMBER OF TOOLS CONSULTED TO UNDERSTAND PROJECT STATUS
30

Bugs and delays remain the top issues with releases
Issues with releases are similar to 2018 in that defects / bugs are the most common issue, followed by unexpected delays and outages/downtimes.
‣ Significantly less say they deal with bugs, but it is still the most common release issue.
Significantly more say they deal with none of the issues listed. Notably, this is still a minority of 12%.
Defects / bugs
Unexpected delays
Outages / downtime
Over budget
Customer complaints
Missed deadlines
Dropped important features
None of the above 12%
21%
32%
26%
27%
29%
46%
48%
4%
21%
29%
30%
30%
34%
50%
57%
2018 2020
Which of the following issues has your current team faced with a release? Please select all that apply.
ISSUES WITH RELEASES
31

Organizations are measuring customer satisfaction on new releases less often
‣ Organizations are statistically less likely since 2018 to be measuring customer satisfaction on new releases now. The proportion that say they do measure customer satisfaction has decreased significantly, while the proportion that do not has increased significantly.
‣ Even so, the majority continue to measure customer satisfaction on new releases.
Yes No Unsure
4%
20%
76%
5%11%
84%
2018 2020
Does your organization have practices in place to measure customer satisfaction on newly released features?
MEASUREMENT OF CUSTOMER SATISFACTION OF NEW RELEASES
32

Having too many manual processes is becoming a more pervasive issue
‣ Respondents are reporting fewer overall issues preventing them from going faster in moving code from development to production since 2018. Significantly more say they experience none of the issues tested.
‣ The proportion that say they lack sufficient automated test coverage to avoid manual testing and that say we have too many tools has integrated in a fragile way have decreased significantly.
‣ Meanwhile, the proportion that says we have too many manual processes has increased (although not at a statistically significant level) to become the most common issue.
18%
19%
21%
19%
18%
22%
31%
23%
26%
24%
8%
18%
21%
22%
25%
26%
27%
27%
27%
32%
2018 2020
ISSUES PREVENTING GOING FASTER FROM CODE TO DEVELOPMENT
We lack sufficient automated test coverage to avoid manual testing
We have people who understand how the build pipeline works
We haven’t automated the whole build and deployment pipeline
We have too many manual processes
We have defects caused by code merges
We have too many tools, integrated in a fragile way
We lack visibility into dependencies across code bases
We have a slow build process
We lack tracking for code from dev to production
None of the above
Which of the following prevent your current team from going faster in moving code from development to production? Please select all that apply.
33

Customer satisfaction remains the chief means of measuring team success
While customer satisfaction remains the most commonly used metric for software teams to evaluate and track success, usage of several metrics have increased:
‣ Team velocity
‣ Revenue
‣ Mean time between failures
Customer satisfaction
Mean time to recover/repair
Application crash rate
Issues closed
Open / close rate
Feature usage
Team velocity
Number of story points
Revenue
Mean time between failures
Features shipped
None of the above 2%
22%
30%
36%
21%
32%
29%
31%
31%
36%
35%
49%
1%
20%
22%
25%
25%
25%
28%
29%
30%
31%
33%
46%
2018 2020
Which of the following metrics does your team use to evaluate and track your team’s success? Please think of these measurements specifically related to the software development team, rather than the organization overall. Please select all that apply.
METRICS MEASURING TEAM SUCCESS
34

IT may be more responsible for resolving incidents now
The percentage of respondents who say IT is responsible for resolving major incidents and the percentage that prefer IT to resolve major incidents has increased since 2018. However, this may be due to IT professionals being a larger part of the sample in the 2020 survey.
0%
39%
60%
1%
49%51%
2018 2020
41%
59%
51%49%
2018 2020
PRIMARY RESPONSIBILITY FOR RESOLVING MA JOR INCIDENTS
PREFERRED PARTY RESPONSIBLE FOR RESOLVING MA JOR INCIDENTS
For major incidents, which team would you prefer to be primarily responsible for responding and resolving them?
For major incidents, which team is currently primarily responsible for responding and resolving them?
A central IT Operations team
Application development team Other (please specify) A central IT Operations team Application development team
35

Appendix
36
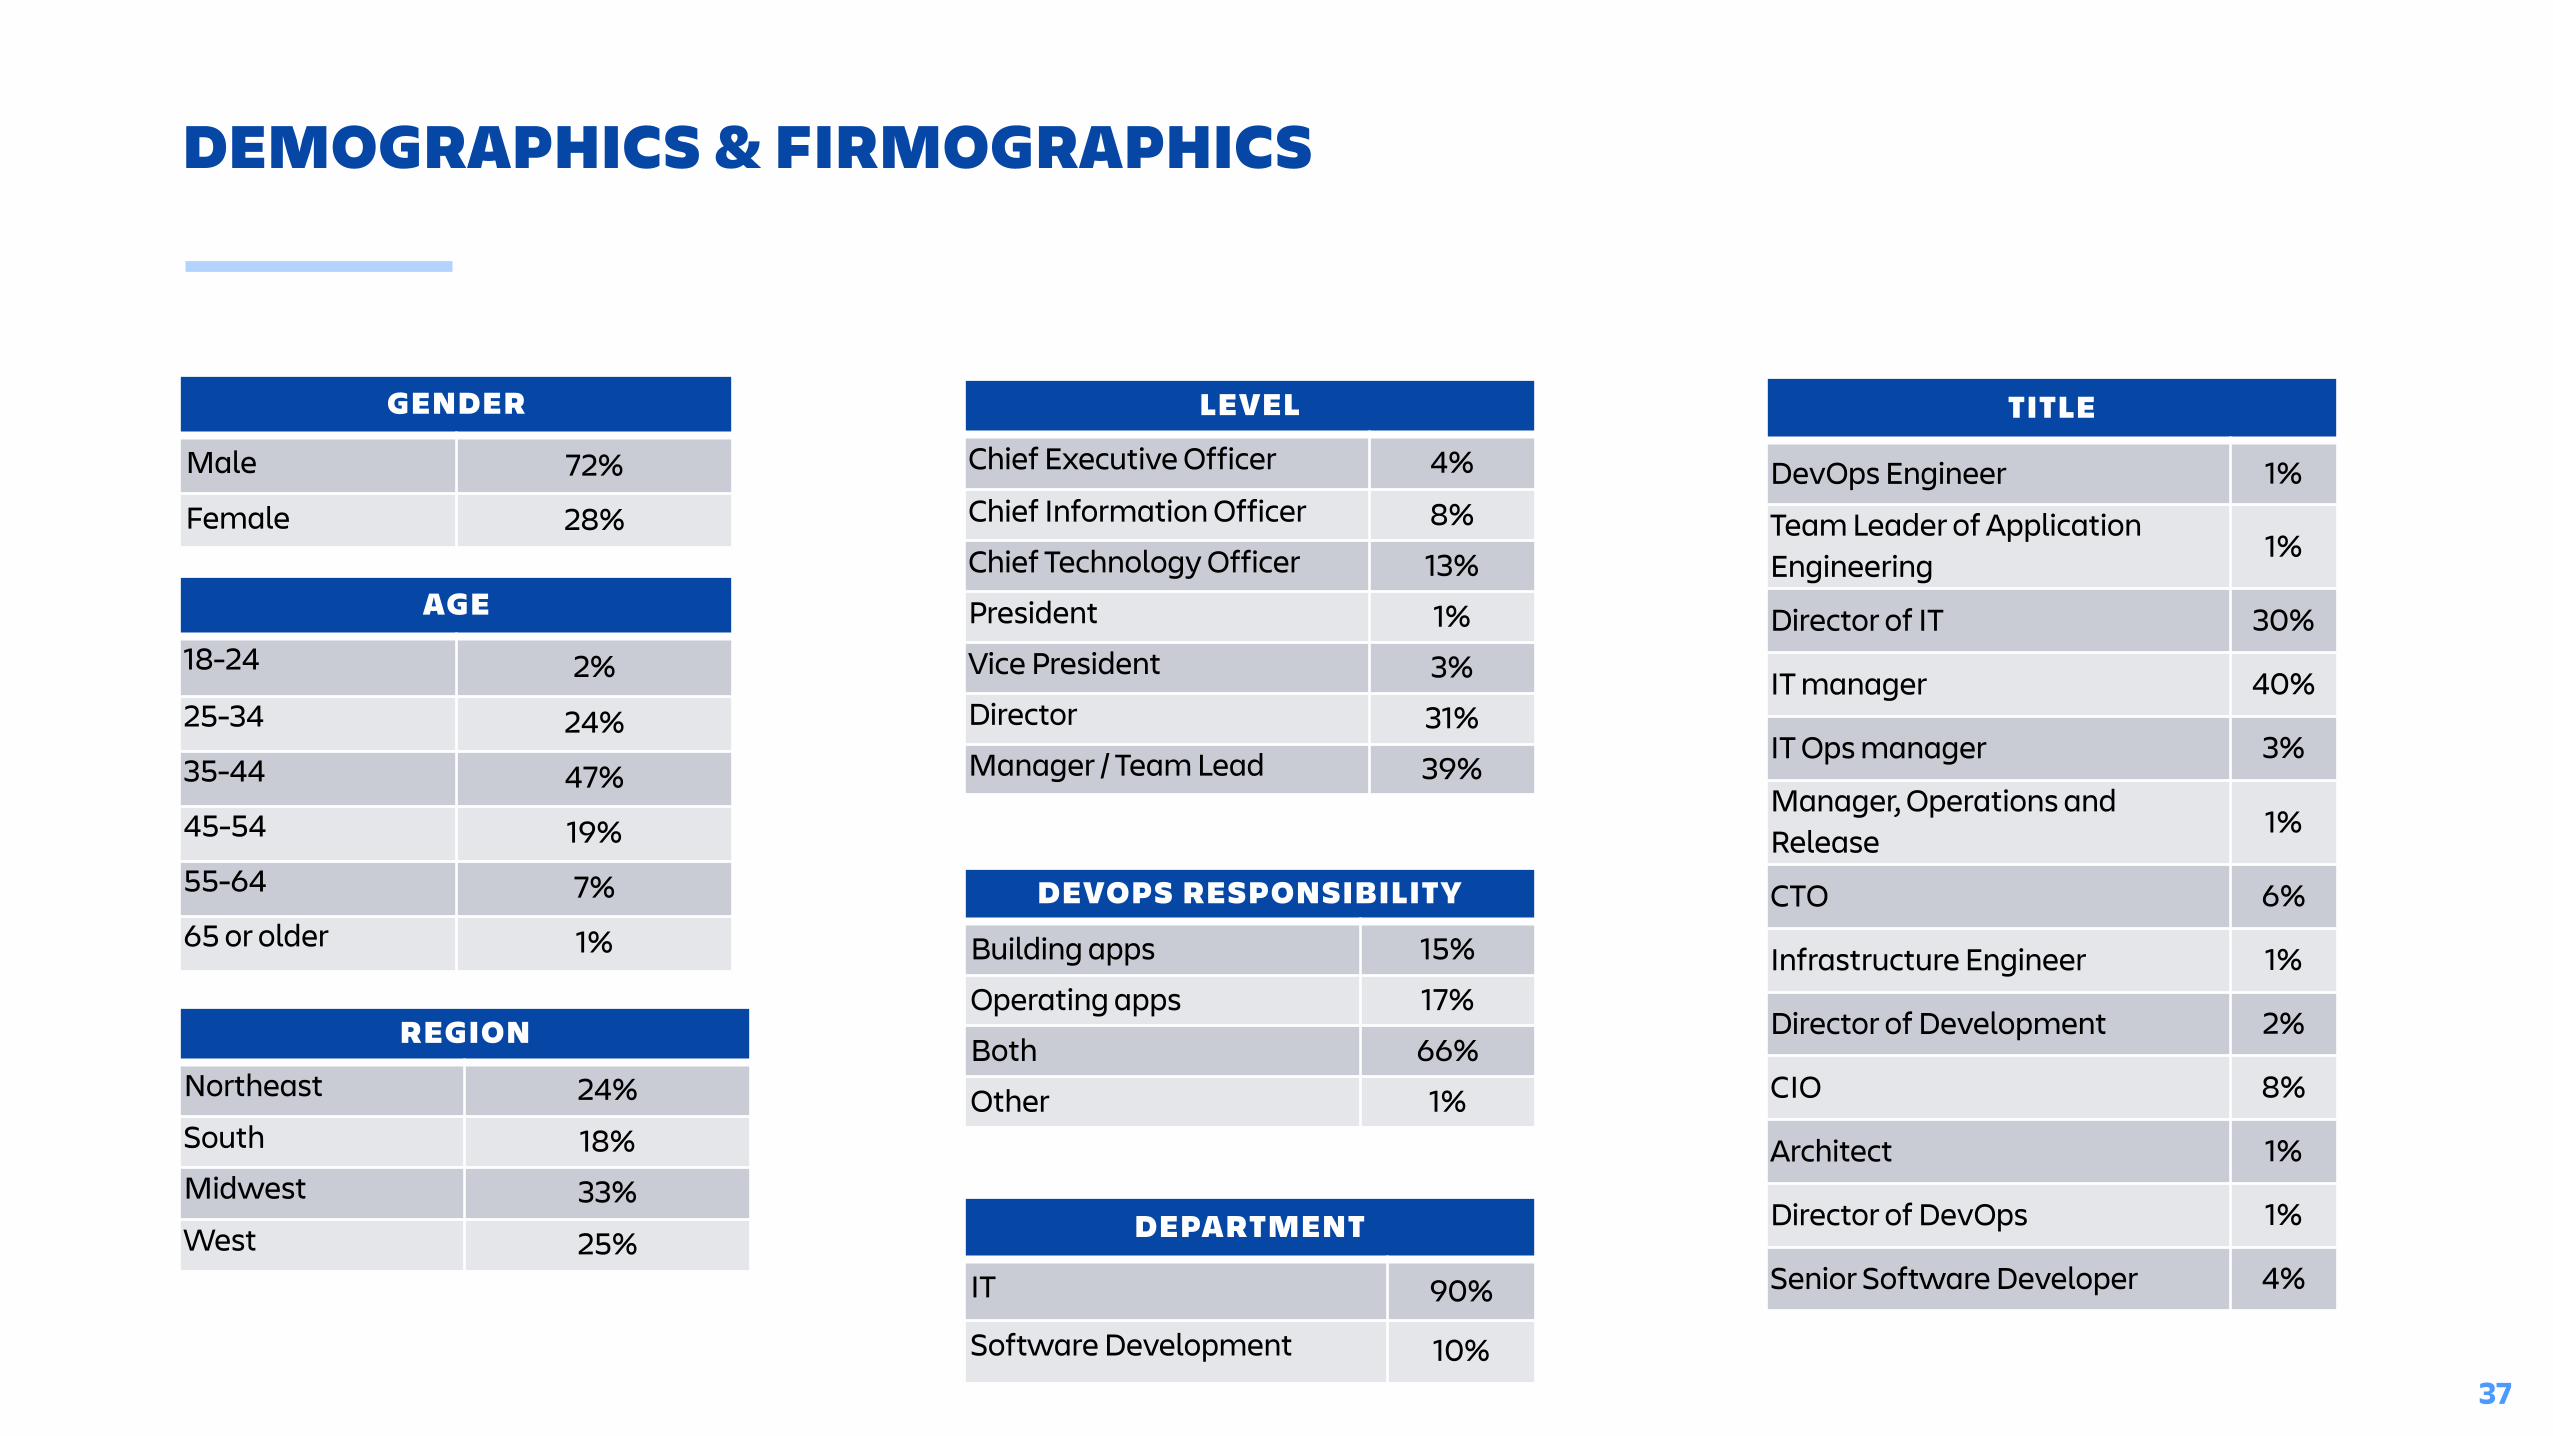
DEMOGRAPHICS & FIRMOGRAPHICS
GENDER
Male 72%
Female 28%
AGE
18-24 2%25-34 24%35-44 47%45-54 19%55-64 7%65 or older 1%
LEVEL
Chief Executive Officer 4%Chief Information Officer 8%Chief Technology Officer 13%President 1%Vice President 3%Director 31%Manager / Team Lead 39%
DEPARTMENT
IT 90%
Software Development 10%
REGION
Northeast 24%South 18%Midwest 33%West 25%
DEVOPS RESPONSIBILITY
Building apps 15%Operating apps 17%Both 66%Other 1%
TITLE
DevOps Engineer 1%Team Leader of Application Engineering 1%
Director of IT 30%
IT manager 40%
IT Ops manager 3%
Manager, Operations and Release 1%
CTO 6%
Infrastructure Engineer 1%
Director of Development 2%
CIO 8%
Architect 1%
Director of DevOps 1%
Senior Software Developer 4%
37
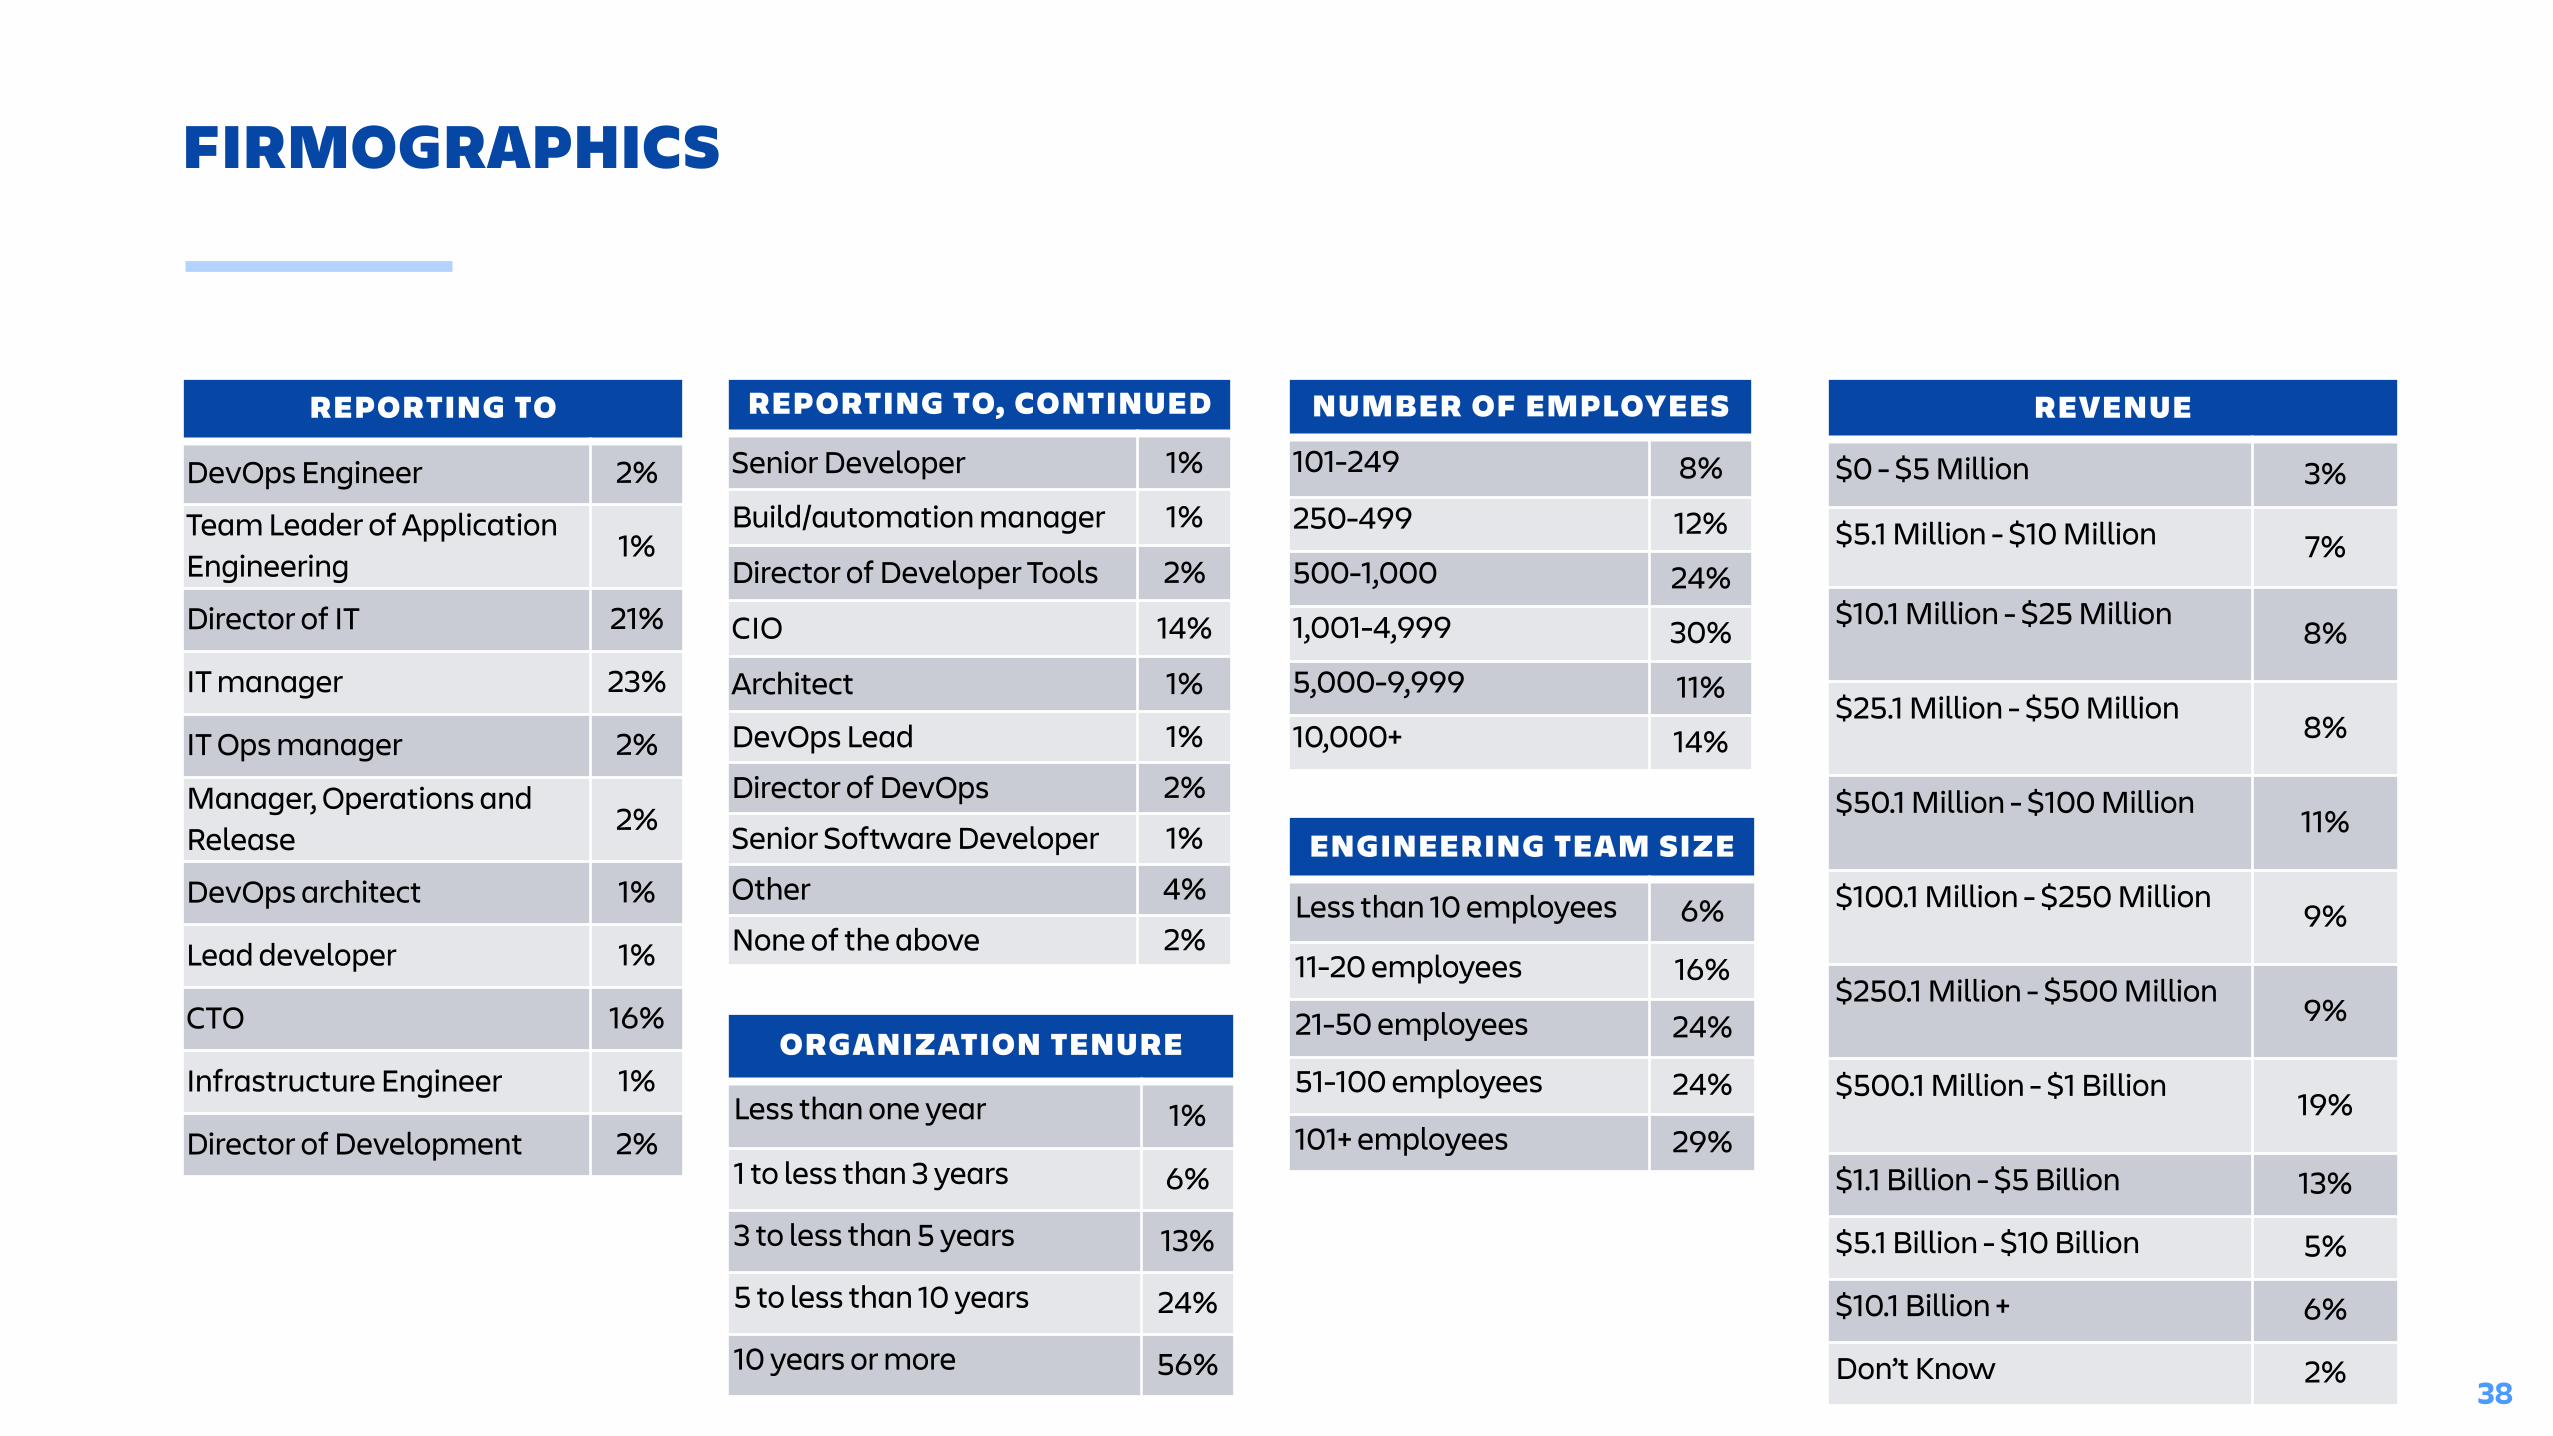
FIRMOGRAPHICS
REPORTING TO
DevOps Engineer 2%
Team Leader of Application Engineering 1%
Director of IT 21%
IT manager 23%
IT Ops manager 2%
Manager, Operations and Release 2%
DevOps architect 1%
Lead developer 1%
CTO 16%
Infrastructure Engineer 1%
Director of Development 2%
REPORTING TO, CONTINUED
Senior Developer 1%
Build/automation manager 1%
Director of Developer Tools 2%
CIO 14%
Architect 1%
DevOps Lead 1%Director of DevOps 2%Senior Software Developer 1%Other 4%None of the above 2%
REVENUE
$0 - $5 Million 3%
$5.1 Million - $10 Million 7%
$10.1 Million - $25 Million 8%
$25.1 Million - $50 Million 8%
$50.1 Million - $100 Million 11%
$100.1 Million - $250 Million 9%
$250.1 Million - $500 Million 9%
$500.1 Million - $1 Billion 19%
$1.1 Billion - $5 Billion 13%
$5.1 Billion - $10 Billion 5%
$10.1 Billion + 6%
Don’t Know 2%
NUMBER OF EMPLOYEES
101-249 8%250-499 12%500-1,000 24%1,001-4,999 30%5,000-9,999 11%10,000+ 14%
ORGANIZATION TENURE
Less than one year 1%
1 to less than 3 years 6%
3 to less than 5 years 13%
5 to less than 10 years 24%
10 years or more 56%
ENGINEERING TEAM SIZE
Less than 10 employees 6%
11-20 employees 16%
21-50 employees 24%
51-100 employees 24%
101+ employees 29%
38