Atlas of Ambulatory EEG - ele · PDF fileAtlas of Ambulatory EEG Bernard S. Chang, M.D....
119
Transcript of Atlas of Ambulatory EEG - ele · PDF fileAtlas of Ambulatory EEG Bernard S. Chang, M.D....

Atlas of Ambulatory EEG

Atlas of Ambulatory EEG
Bernard S. Chang, M.D.Comprehensive Epilepsy CenterBeth Israel Deaconess Medical CenterBoston, Massachusetts
Amsterdam Boston Heidelberg London New York Oxford
Paris San Diego San Francisco Singapore Sydney Tokyo
Steven C. Schachter, M.D.Comprehensive Epilepsy CenterBeth Israel Deaconess Medical CenterBoston, Massachusetts
Donald L. Schomer, M.D.Comprehensive Epilepsy CenterBeth Israel Deaconess Medical CenterBoston, Massachusetts
Editors
Elsevier Academic Press
30 Corporate Drive, Suite 400, Burlington, MA 01803, USA
525 B Street, Suite 1900, San Diego, California 92101-4495, USA
84 Theobald’s Road, London WC1X 8RR, UK
This book is printed on acid-free paper.
Copyright © 2005, Elsevier Inc. All rights reserved.
No part of this publication may be reproduced or transmitted in any form or by any means,
electronic or mechanical, including photocopy, recording, or any information storage and retrieval
system, without permission in writing from the publisher.
Permissions may be sought directly from Elsevier’s Science & Technology Rights Department
in Oxford, UK: phone: (+44) 1865 843830, fax: (+44) 1865 853333, E-mail:
[email protected]. You may also complete your request on-line via the Elsevier homepage
(http://elsevier.com), by selecting “Customer Support” and then “Obtaining Permissions.”
Library of Congress Cataloging-in-Publication Data
British Library Cataloguing in Publication Data
A catalogue record for this book is available from the British Library
ISBN 13: 978-0-12-621345-4
ISBN 10: 0-12-621345-3
For all information on all Elsevier Academic Press publications visit our Web site at
www.books.elsevier.com
Working together to grow libraries in developing countries
www.elsevier.com | www.bookaid.org | www.sabre.org
Printed in the United States of America
05 06 07 08 09 10 9 8 7 6 5 4 3 2 1

To Amanda and Benjamin (B.S.C.)
To Sue, Michael and David (S.C.S.)
To Peter Gloor, mentor and friend (D.L.S.)

Contents
Acknowledgments ixContributors ixIntroduction 1
Chapter 1A Brief History of Ambulatory EEG 3John R. Ives and Donald L. Schomer
I. Introduction 3
II. The Rationale for Ambulatory Monitoring 4
III. Continuous versus Event/Intermittent Recording 5
IV. Clinical Application 7
V. Summary 8
References 8
Chapter 2Automated Spike and Seizure Detection Algorithms 11K. B. Krishnamurthy
I. Introduction 11
II. Automatic Spike Detection 12
III. Seizure Detection 14
IV. Conclusion 15
References 15
Chapter 3The Clinical Use of Ambulatory EEG 17Frank W. Drislane
I. Purposes of EEG Monitoring 17
II. Event Monitoring 20
III. Ambulatory EEG Monitoring 21
IV. Practical and Technical Considerations 23
References 24
The Atlas
Technical Aspects
Technical 1. A Typical Screen or Printed Page of Ambulatory EEG Recording 28
Technical 2. Left Temporal Seizure: No Filter Used 30
Technical 3. Left Temporal Seizure: 60-Hz Notch Filter 32
Technical 4. Left Temporal Seizure: High Frequency 35-Hz Filter 34
Technical 5. Left Temporal Seizure: High Frequency 15-Hz Filter 36
Technical 6. Generalized Spike-Wave Activity: Paper Speed 30 Seconds Per Page 38
Technical 7. Generalized Spike-Wave Activity: Paper Speed 15 Seconds Per Page 40
Technical 8. Generalized Spike-Wave Activity: Gain = 2 42
Technical 9. Generalized Spike-Wave Activity: Gain = 1 44
Normal Sleep Morphologies
Normal Sleep 1. Sleep Spindles 48
Normal Sleep 2. K-Complexes and Sleep Spindles Recorded by Spike
Detection Algorithm 50
Normal Sleep 3. Rapid Eye Movement of Sleep 52
Ambulatory Artifacts
Artifacts 1. Horizontal Eye Movement and Blink Artifacts 56
Artifacts 2. Eye-Blink Artifact 58
vii

Artifacts 3. Eye Flutter Artifact Recorded by Seizure Detection Algorithm 60
Artifacts 4. Electrode Tapping Artifact 62
Artifacts 5. Jaw-Clenching Artifact 64
Artifacts 6. Chewing Artifact 66
Artifacts 7. Chewing Artifact Recorded by Spike Detection Algorithm 68
Artifacts 8. Dry Electrode Artifact 70
Artifacts 9. Forehead Rubbing Artifact 72
Artifacts 10. Pulse Artifact 74
Abnormal Epileptiform Activity
Epileptiform 1. Focal Mesial Temporal Spikes Recorded by Spike Detection
Algorithm 78
Epileptiform 2. Focal Anterior Temporal Spikes Recorded by Spike Detection
Algorithm 80
Epileptiform 3. Bifrontal Spike-Wave Complexes Recorded by Spike Detection
Algorithm 82
Epileptiform 4. Rolandic Spikes 84
Epileptiform 5. Three-Per-Second Spike-and-Wave Activity Recorded by Spike
Detection Algorithm 86
viii Contents
Epileptiform 6A. Generalized Spike-and-Wave Activity Recorded by Seizure
Detection Algorithm (Page 1 of 2) 88
Epileptiform 6B. Generalized Spike-and-Wave Activity Recorded by Seizure
Detection Algorithm (Page 2 of 2) 90
Epileptiform 7. Brief Generalized Spike-and-Wave Activity Recorded by Seizure
Detection Algorithm 92
Epileptiform 8A. Left Frontotemporal Seizure Recorded by Pushbutton Activation
(Page 1 of 2) 94
Epileptiform 8B. Left Frontotemporal Seizure Recorded by Pushbutton Activation
(Page 2 of 2) 96
Epileptiform 9. Frontal Onset Epileptiform Activity Recorded by Seizure Detection
Algorithm 98
Epileptiform 10A. Right Mesial Temporal Seizure Recorded by Pushbutton Activation
(Page 1 of 2) 100
Epileptiform 10B. Right Mesial Temporal Seizure Recorded by Pushbutton Activation
(Page 2 of 2) 102
Epileptiform 11. Frontal Seizure Recorded by Pushbutton Activation 104
Index 107
ix
The authors gratefully acknowledge SleepMed for providing EEG tracings.
Acknowledgments
Frank W. Drislane, M.D.
Comprehensive Epilepsy Center
Beth Israel Deaconess Medical Center
Boston, Massachusetts
John R. Ives, B.Sc.
Department of Clinical Neurological Sciences
University of Western Ontario
London, Ontario, Canada
K. B. Krishnamurthy, M.D.
Comprehensive Epilepsy Center
Beth Israel Deaconess Medical Center
Boston, Massachusetts
Contributors

1
Introduction
In the past few decades, ambulatory EEG has evolved from its inception as
a novelty of clinical neurophysiology engineering to its current mature
form as a routine clinical test ordered at local laboratories by neurologists
worldwide. The rapid pace at which the technology, availability, and clinical
utility of ambulatory EEG have advanced during this time has required
electroencephalographers to keep up with the capabilities of this recording
technique at an impressive rate.
Over this same time period the clinical neurophysiology world, of which
ambulatory EEG is just one part, has been transformed. The development
of specialized epilepsy centers has revolutionized the diagnosis and manage-
ment of seizure disorders and brought focus to the need for prolonged EEG
recording of high quality. In particular, the advent of epilepsy surgery as a
major treatment option for some patients with medically refractory seizures
has propelled the field of EEG monitoring forward. In addition, the increas-
ing recognition of disorders that mimic epilepsy, including both psychogenic
nonepileptic seizures (PNES) and physiological paroxysmal episodes that are
nonepileptic, has also widened the spectrum of patients for whom EEG
monitoring is appropriate.
However, financial and other constraints have affected the clinical use of
neurophysiological studies to a significant degree. Physicians who are plan-
ning long hospitalizations for inpatient EEG recording must face the pres-
sures of decreasing reimbursement, hospital space constraints, and patient
dissatisfaction with in-hospital care. As the acuity of most hospitalized
patients rises, so does the disparity between the typical neurology inpatient
and the elective EEG-monitoring patient who has infrequent spells that may
or may not be epileptic seizures.
Ambulatory EEG thus occupies an important niche in the clinical neurophys-
iology laboratory. Many patients who require prolonged EEG recording with
event detection algorithms need not be admitted to the hospital; in fact both
doctor and patient may prefer recording at home for convenience, the ability
to capture events in the patient’s natural environment, and the avoidance of
inpatient nosocomial infection risk, among many other factors. The assumed
sacrifice in recording quality that accompanied ambulatory EEG in its early
days is now generally minimal or nonexistent, and the full extent of video
recording and associated physiological parameter monitoring is now available
on an ambulatory basis at many centers.
In this context, the clinical utility of an atlas of ambulatory EEG is clear.
Although the principles of EEG interpretation remain unchanged
regardless of recording environment, we believe that the ability of an
electroencephalographer to review instructive examples of both normal and
abnormal EEG activity recorded on an ambulatory basis will be significantly
beneficial. Reference examples of common artifacts seen on ambulatory EEG
and ictal events recorded using ambulatory systems may be particularly
useful.
2 Introduction
The three chapters in this book help to set the stage for the collection of
ambulatory EEG excerpts and annotations presented later. In Chapter 1, John
Ives and Don Schomer relate a brief history of ambulatory EEG technology
from its inception to the present. Chapter 2, by K. Babu Krishnamurthy,
describes the event-detection algorithms—both spike and seizure detection—
that have facilitated the widespread use and interpretation of ambulatory
EEG. Finally, in Chapter 3, Frank Drislane discusses the clinical role of ambu-
latory EEG in modern day epilepsy practice. The atlas figures that follow
comprise those most likely to be of use to the practicing electroencephalogra-
pher, and are divided into examples of technical aspects, normal sleep mor-
phologies, ambulatory artifacts, and abnormal epileptiform activity.
We believe our book will serve as a useful reference for a wide range of clini-
cal neurophysiology practitioners, from trainees to experienced EEG readers,
as well as for EEG technologists and others involved in the development and
application of EEG recording software and hardware. After 30 years, countless
innovations, and thousands of patient studies, ambulatory EEG now has its
own atlas.
Bernard S. Chang
Steven C. Schachter
Donald L. Schomer
Boston, Massachusetts
July 2005
3
C H A P T E R 1
A Brief History of Ambulatory EEGJ O H N R . I V E S A N D D O N A L D L . S C H O M E R
I. IntroductionThe first patient with epilepsy to be sent home with an ambulatory elec-
troencephalogram (EEG) cassette recorder was evaluated at the Montreal
Neurological Institute in the fall of 1973. [1, 2] Wearing a continuous
recording, 4-channel, 24-hour device, he went downhill skiing. Later play-
back of that EEG (electroencephalogram) revealed several bursts of spike-
and-wave discharges during that activity.
In the late 1980s, a patient with refractory seizures who was under consider-
ation for epilepsy surgery was sent home from the Beth Israel Deaconess
Medical Center, Boston, wearing a 27-channel event type ambulatory EEG
recorder. The patient carried a solid-state small, 6-pound portable com-
puter/hard drive EEG data acquisition unit that was capable of automatically
detecting and recording spikes, sharp waves, and electrographic seizures.
Between the seventies and eighties there had been a natural evolution in the
field of ambulatory-home EEG monitoring. This trend has continued over
the past 15 years. Now, the use of ambulatory EEG monitoring for the diag-
nosis of patients with seizures, sleep disorders, and difficult-to-diagnose
episodic events is common.
This chapter reviews the history of technological achievements that have led
to today’s ambulatory EEG monitoring systems.
Copyright 2005, Elsevier Inc. (USA)All rights reserved.
Atlas of Ambulatory EEG

II. The Rationale for AmbulatoryMonitoring
Long-term ambulatory EEG monitoring (LTAM) is an important tool in the
investigation of patients with epilepsy or those patients where a differential
diagnosis exists that includes epilepsy. [3–5] In particular, LTAM can deter-
mine whether there is an EEG correlate to a particular event experienced by a
patient. The clinical strategy is to record spontaneous events, using as many
EEG channels as is practical, to provide clinically meaningful electrophysio-
logical information concerning the nature and possible location of the
patient’s problem. These findings aid in the diagnosis of the disorder, and
hence contribute to the treatment program.
Routinely acquired EEG documents the patient’s background rhythm
obtained in a very controlled state. One may capture interictal epileptiform
activity as well. Routine EEG, however, is limited in duration and therefore
is unlikely to record ictal events. Before the advent of long-term EEG
monitoring of any kind, a survey of a large group of patients with focal onset
seizure disorders who were under investigation for surgery at the Montreal
Neurological Institute revealed that fewer than 25% of them had experienced
a seizure while undergoing routine or prolonged routine recordings. [3, 6]
Although a detailed review was not done, it is reasonable to expect that some
of the seizures were recorded using montages that were not designed for
seizure localization. Furthermore, the EEG activity on a significant number
of the recorded seizures was likely obliterated by movement artifact due to
the long electrode leads that were used to connect the patient to the EEG
amplifiers. Other ictal tracings were likely obscured by muscle artifact
due to the open bandwidth (0.5 to 70 Hz) routinely used during standard
recordings. Therefore, a conservative estimate would be that fewer than
1 in 10 surgical candidates in this study had a technically acceptable ictal
recording obtained during routine EEG acquisition. Consequently, the over-
whelming majority of patients prior to 1970 underwent cortical resections
4 A Brief History of Ambulatory EEG
based, in part, on the location of interictal epileptiform abnormalities
recorded during conventional EEG testing. By contrast, today, surgical plan-
ning is based on the results of digitally recorded seizures.
During the 1970s, the development of video technology allowed the patient’s
peri-ictal behavior to be captured and time-locked to the EEG. As a result of
this enhancement, there was a steady increase in the number and utilization
of inpatient long-term EEG and video monitoring units. The requirement for
documented seizures with video display of the behavior as an essential part of
a presurgical workup also increased. [7–14] Inpatient EEG monitoring units
using 16 or more channels of EEG with simultaneous video/audio soon
became the standard method for documenting these ictal events. However,
this testing paradigm became expensive and labor intensive, thus limiting the
absolute number of facilities that could offer these services and hence limit-
ing the number of patients that could be evaluated.
Ambulatory EEG monitoring was initially slow to gain acceptance due pri-
marily to the lack of continuous video monitoring, which was considered
essential. The technology of the day was not readily adaptable to the home
environment. However, clinicians felt that the EEG was the more useful of
the two streams of data (EEG and video) in the diagnosis of patients with
epilepsy. LTAM was then used to determine which patients were more appro-
priate for the costlier hospital-based intensive EEG with video recording.
When patients who were initially studied with LTAM were then hospitalized
for EEG/video monitoring, there was a greater likelihood of obtaining rele-
vant diagnostic information than in patients who underwent inpatient evalu-
ation only.
Besides the cost and resource concerns, LTAM proved to be far more conve-
nient for most patients. In some centers, including our own, inpatient moni-
toring became primarily utilized for patients whose seizures could only be
recorded in the setting of anticonvulsant drug withdrawal. It was also used
when simultaneous video recording was essential for diagnosis or surgical
evaluation or in the setting where invasive electrodes needed to be used.

A Brief History of Ambulatory EEG 5
III. Continuous versus Event/IntermittentRecordingTwo distinct types of ambulatory recording systems evolved largely indepen-
dently of each other. One system provides continuous recording of EEG
activity and the other obtains intermittent recording of events/seizures (i.e.,
noncontinuous).
A. Continuous Ambulatory Cassette Recording [16, 17]The continuous recorder had its beginnings in 1947 when Norman Holter
demonstrated a single-channel, radio-telemetry system that he used to trans-
mit ECG signals. [18] His cardiac rhythm monitoring needed only a single
channel of recording, which led to the development of the “Holter-type” elec-
trocardiogram (ECG) monitors. [18] However, because a single channel of
EEG is not very useful clinically, application to the ambulatory evaluation of
patients with epilepsy awaited further technical development. A 4-channel
continuous cassette recorder [19] was introduced and was later expanded to 8
channels of recording in the early 1980s and then to 32 channels in the late
1990s. The initial 4- and 8-channel EEG systems were used by the British
navy for sleep research on subjects in the Antarctic (personal communica-
tions, Oxford Medical Systems). With the addition of neck-mounted minia-
turized preamplifiers, a clinically useful ambulatory EEG system became
practical. [1, 2]
The continuous ambulatory EEG recorder is essentially an extension of the
routine EEG. All EEG activity is recorded and stored for later playback and
review. As the technology evolved, so did the playback, recovery, analysis, and
extraction of relevant EEG data from the 24-hour recorder. Initially, the 24-
hour tapes could be recorded and replayed at a slower speed to permit the
EEG to be transcribed through a conventional EEG machine onto paper. [20]
An ink-jet EEG machine with significantly better high-frequency responses
(700 Hz) enabled the entire EEG to be written out in less than 30 minutes in
a highly compressed fashion (e.g., 20 minutes per standard EEG page). Elec-
trographic ictal events stood out and were easily identified by the characteris-
tic high-amplitude signatures that appeared when compared to baseline
activity. Alternatively, the EEG could be reviewed through auditory analysis.
Electrographic seizure discharges, background EEG rhythms, muscle artifact,
etc., all produce very distinct and identifiable sounds [3, 17, 21] when played
back at high speeds. Additionally, the 24-hour EEG could be automatically
scanned by off-line data analysis software for morphologically distinct events
such as spikes and seizures. Video display of the rapid pagination of 4-
channel EEG was also developed as an efficient analysis technique for contin-
uous 24-hour EEG. [23]
The advantage to the continuous recording methodology is that all of the
EEG is recorded for an entire 24-hour period. This is useful when evaluating
patients who have little to no advance warning of an impending seizure, such
as patients with absence seizures. Electrographic seizures during sleep can
also be identified. Having continuous EEG recording during sleep increases
the probability of detecting interictal epileptiform activity in patients who do
not have seizures during the daytime while being monitored. This may help
to support a diagnosis of epilepsy.
Continuous EEG monitoring is also more appropriate for studies that quan-
tify the number or duration of spike-wave paroxysms over a period of time.
The video/audio replay technology of the day allowed the user to quickly
identify the relevant EEG waveforms and to then review them visually via a
variety of viewing systems. Continuous EEG recording was also necessary for
most sleep evaluations, particularly if identification and characterization of
sleep architecture was considered important.
The disadvantage of continuous ambulatory EEG monitoring, until recently,
was the limited number of channels (4 or 8). This precluded detailed topo-
graphic characterization of abnormalities. Additionally, reviewers
needed to be very experienced in order to play back the data in a way that
was cost-effective.
Newer technological developments have eliminated the problems noted
above. In the mid-1980s, a continuous 8-channel ambulatory system was
introduced, followed by 16+ channel systems. A number of analysis features
were added including digital, real-time automatic search capabilities based on
either a specific time or an event marker. The new display included over a
minute of data so that approximately 30 seconds before and after the “event”
were presented on the screen. Gain and filter adjustments could be done on
the screen without tape movement. Printout of the EEG, as displayed on the
screen, was also possible. These new systems were able to record other forms
of polygraphic data such as eye movement, muscle activity, cardiogram, and
respiration, and opened the way for additional investigation. These advances
allowed for testing other diagnostic disorders such as disordered cardiac
rhythms or disordered sleep that may present as seizure-like behavior.
B. Event Type Ambulatory Cassette RecordingIn the early 1970s, it was clear that obtaining weeks of continuous, paper-
recorded EEG from inpatients undergoing depth electrode evaluations was
unmanageable and overwhelming. Because the objective was to record the
EEG during habitual seizures in these patients, the first step toward a rational
solution was to develop a telemetry system that allowed patients to have some
degree of freedom of movement during their hospitalization while recording
their EEG rhythms. A system including on-the-head mounted amplifiers of
the EEG-derived signal permitted this freedom. Artifact was significantly
reduced using this “close to the source” amplification concept due to the lack
of movement-related artifacts that are seen when recording with long elec-
trode leads. The EEG signals were multiplexed, so 16 channels of EEG could
be transmitted via a small wire to a DEC PDP-12 computer. A two-minute
delay in the 16 channels of EEG was created by programming the digital
computer to store EEG from the previous two minutes in a memory loop
(i.e., buffering). This allowed the clinician to capture the onset of a clinical
event even soon after it was in progress. [24] This started the era of EEG data
manipulation and reduction.
6 A Brief History of Ambulatory EEG
Eventually, this loop concept was closed by including output software that
reassembled the delayed EEG into the multiplexed format for transmission
to another demultiplexing unit that was coupled to a Mingograph EEG
machine. If a clinical event occurred, the activation of the seizure button
caused it to be permanently stored on the computer tape. It also signaled the
EEG machine to write out the two minutes of delayed EEG leading up to the
event. The EEG machine was also programmed to take regular samples
during the night in order to capture the natural sleep of the patient. [25]
As smaller microcomputers and larger memory systems became available,
a stand-alone system was developed that could be moved to the patient’s
bedside. [26] This system consisted of an Intel 8085 computer with 1 Mbyte
of RAM, an A/D-D/A input/output board, and a standard cassette tape deck
to record the stored data. This unit emulated previous concepts that were on
the larger computer, i.e., a delay loop with multiple multiplexed channels. A
timecode generator was later added and this allowed independently recorded
video to be synchronized to the EEG. [27] An EEG sample control unit auto-
matically saved timed EEG samples at preset intervals, which allowed the
clinician to see pieces of the patient’s routinely generated EEG.
In the early 1980s, further electronic miniaturization enabled the functions
of this bedside system to fit into an ambulatory cassette recorder. This
“Walkman” audiocassette recorder stored the multiplexed EEG signals and the
time-of-day signal. [28]. Initially, a number of technological constraints—
power consumption, limited by the availability of static RAM—allowed for
only a 5-second delay on the EEG. However, advancements in the field of
SRAM memory circuits allowed two or more minutes of delay to be archived
on ambulatory units. It also became possible to increase the channel capacity
from 16 to 24 channels. [29] Thus, all major head regions could be covered
simultaneously, including the use of sphenoidal electrodes. [30–32]
During a seizure, high-frequency muscle artifact can completely obscure the
underlying EEG. A variety of filtering techniques have been developed in
both digital [33] and analog [34] formats. Technical developments in the field

A Brief History of Ambulatory EEG 7
of charge-coupled capacitive filters provided a simple and inexpensive means
of replaying events that have been contaminated by high-frequency muscle
artifact using a 6-pole filter with variable frequency settings ranging from 9
to 70 Hz. [35] This allows the clinician to replay events with a relatively open
setting and compare that recording to playbacks with more extreme filtering
and to note rhythms that are suspicious for seizure events.
Finally, a “time-scribe” digital clock capable of both displaying replay time
and writing it out in a readable fashion on the EEG paper was developed to
aid the time-locking of EEG with video, computer, or observation. [36, 37]
There were numerous advantages to the early periodic/event system. A greater
number of recording channels was possible, which resulted in greater spatial
resolution on recorded events. Patients and observers aided the EEG reader
by selecting times of greater interest by pushing an event button when symp-
toms were experienced or clinical signs were observed. This also meant that
there was less data to review. These systems were considerably less expensive
than continuous recorders. The computer used for the automatic detection of
relevant electrographic events could also be used to aid in the off-line analysis
of a study.
There were also several disadvantages to the early intermittent ambulatory
EEG recorders. There was dependence on an independent observer or the
patient to know when a seizure was coming so the event button could be
pushed. Also, the clinician could not go back and look at data prior to the
delay time in cases where the event had a longer lead into it.
IV. Clinical ApplicationThe continuous 4- and 8-channel systems and the event/periodic 16- and 24-
channel systems have been used extensively in a variety of clinical settings.
[16, 17] Their utility continues to expand as the technology of the systems
matures and researchers define appropriate use. An example of this expand-
ing role is the use of the 8-channel continuous system in polysomnography.
[38, 39] The technological expansion from four to eight channels did not
mean that the 4-channel systems were obsolete. It remains an ideal and useful
24-hour monitoring system for patients with spike-and-wave EEG abnormal-
ities, especially if the goal is to determine the number or duration of dis-
charges over a specific period of time.
In our center, all long-term monitoring is performed using the ambulatory
systems. The degree of physical freedom for the patient depends on the clini-
cal applications. In the outpatient environment, the patient may be sent
home wearing the 16- or 24-channel ambulatory recorder and carrying a
small event detection computer that is connected to the patient once they
arrive at their home. In our hospitalized patient population, the recording
options also depend upon the clinical situation. One option is to have the
patient wear the 16- or 24-channel event recorder. This is done when
the patient wants to go for a short walk or needs to be in another part of
the hospital for other tests. When the patient is in their hospital room, they
are plugged into a recorder via a telephone jack that connects the event
detection computer to the patient and synchronizes the EEG signal to the
continuous video recording.
By incorporating sleep montages into the ambulatory digital system and cou-
pling this system with various other physiological recorders such as a portable
SpO2 sensor, one can perform ambulatory sleep recordings. The integration
of an SpO2 measuring transducer into the bedside EEG data acquisition
device enables SpO2 to be obtained simultaneously with EEG during seizures
or during sleep. [40] One can now measure the depth of a hypopnea related
to a stage of sleep or look for apnea during seizures. The recent introduction
of a completely integrated, small, portable, and reliable home video/EEG
recording system has addressed one of the last technical barriers for monitor-
ing in the home. Now it is possible to obtain full EEG/video monitoring in
the home environment.
There have been several additional advances in ambulatory EEG recording
worth noting. [41] Continued development of digital storage devices has
allowed the two fields of ambulatory monitoring to merge. One can now
easily and conveniently record either continuous or intermittent data. The
potential number of channels available for data has expanded to more than
128. The EEG activity can be easily remontaged so that events can be viewed
with full remontage capability. Data transmission can be accomplished via a
high-speed Internet link. This is more conducive to recording in outlying
clinics or hospitals that are linked to a centralized site through a high-speed
Internet link rather than to recording in the home environment, however.
The video recordings are now all in digital formats, which allows for close-
ups or wide angle viewing and high-resolution or low-light recordings. Addi-
tional sensors are being modified and adapted to run on low-power
ambulatory systems that can be easily linked to the home recording platform.
V. SummaryAs ambulatory EEG technology has become more of a routine and clinically
established tool, its integration into the diagnostic evaluation of patients with
possible or definite epilepsy is more widely accepted. At our center, for
example, 30% of all EEG studies involve some ambulatory home monitoring.
It seems likely that systems will continue to evolve and combine the best
qualities of the continuous and event recorders. Ideally, these hybrid systems
will replace both the current continuous recording systems and the event
recorders. We are now looking forward to the 21st century where new devel-
opments may allow us to predict seizures and react to that information thera-
peutically.
References1. Ives J. R., Woods J. F. 4-channel 24-hour cassette recorder for long term EEG
monitoring of ambulatory patients. Electroenceph. Clin. Neurophysiol. 1975;
39:88–92.
8 A Brief History of Ambulatory EEG
2. Ives J. R. Electroencephalogram monitoring of ambulatory epileptic patients. Post-
grad. Med. J. 1976; 52 (Suppl. 7):86–91.
3. Ives J. R., Woods J. F. The contribution of ambulatory EEG to the management of
epileptic patients. In: Clinical Ambulatory Monitoring, Littler, W. A., ed. London:
Chapman and Hall, 1980; 122–147.
4. Gotman J., Ives J. R., Gloor P., eds. Long-Term Monitoring in Epilepsy (EEG
Suppl. No 37), Amsterdam: Elsevier Science Publishers BV, Biomedical Division,
1985.
5. Gumnit R. J., ed. Intensive Neurodiagnostic Monitoring, Advances in Neurology,
Vol. 46, New York: Raven Press, 1987.
6. Rasmussen T. Localization aspects of epileptic seizure phenomena. In: New Per-
spectives in Cerebral Localization, Thompson R. A., Green J. R., eds. New York:
Raven Press, 1982; 177–203.
7. Gotman J., Ives J. R., Gloor P., Quesney L. F., Bergsma P. Monitoring at the Mon-
treal Neurological Institute. In: Long-Term Monitoring in Epilepsy (EEG Suppl. No
37), Gotman J., Ives J. R., Gloor P., eds. Amsterdam: Elsevier Science Publishers
BV, Biomedical Division, 1985; 327–340.
8. Binnie C. D., Aarts J. H. P., Van Bentum-De Boer P. T. E., Wisman T.
Monitoring at the Instituut voor Epilepsiebestrijding Meer en Bosch. In:
Long-Term Monitoring in Epilepsy (EEG Suppl. No 37), Gotman J., Ives J. R.,
Gloor P., eds. Amsterdam: Elsevier Science Publishers BV, Biomedical Division,
1985; 341–356.
9. Ebersole J. S., Mattson R. H., Williamson P. D., Spencer S. S., Glaser G. H. Moni-
toring at the West Haven VA/Yale University School of Medicine Epilepsy Center.
In: Long-Term Monitoring in Epilepsy (EEG Suppl. No 37), Gotman J., Ives J. R.,
Gloor P., eds. Amsterdam: Elsevier Science Publishers BV, Biomedical Division,
1985; 357–370.
10. Egli M., O’Kane M., Mothersill I., O’Kane F., Rai V. P. Monitoring at the Swiss
Epilepsy Center. In: Long-Term Monitoring in Epilepsy (EEG Suppl. No 37),
Gotman J., Ives J. R., Gloor P., eds. Amsterdam: Elsevier Science Publishers BV,
Biomedical Division, 1985; 371–384.
11. Nuwer M. R., Engel J. Jr., Sutherling W. W., Babb T. L. Monitoring at the Univer-
sity of California, Los Angeles. In: Long-Term Monitoring in Epilepsy (EEG Suppl.
No 37), Gotman J., Ives J. R., Gloor P., eds. Amsterdam: Elsevier Science Publish-
ers BV, Biomedical Division, 1985; 371–384.
A Brief History of Ambulatory EEG 9
12. Kellaway P., Frost J. D. Jr. Monitoring at the Baylor College of Medicine, Houston.
In: Long-Term Monitoring in Epilepsy (EEG Suppl. No 37), Gotman J., Ives J. R.,
Gloor P., eds. Amsterdam: Elsevier Science Publishers BV, Biomedical Division,
1985; 403–414.
13. Sato S., Long R. L., Porter R. J. Monitoring at the National Institute of Neurologi-
cal Communicative Disorders and Stroke. In: Long-Term Monitoring in Epilepsy
(EEG Suppl. No 37), Gotman J., Ives J. R., Gloor P., eds. Amsterdam: Elsevier
Science Publishers BV, Biomedical Division, 1985; 415–422.
14. Roberts R., Fitch P. Monitoring at the National Hospital, Queen Square, London.
In: Long-Term Monitoring in Epilepsy (EEG Suppl. No 37), Gotman J., Ives J. R.,
Gloor P., eds. Amsterdam: Elsevier Science Publishers BV, Biomedical Division,
1985; 423–436.
15. Riley T. L., Porter R. J., White B. G., Penry J. K. The hospital experience and
seizure control. Neurology (Cleveland) 1981; 31:912–915.
16. Ebersole J. S. Ambulatory cassette EEG. J. Clin. Neurophysiol. 1985;
2(4):397–418.
17. Ebersole J. S., Bridges S. L. Ambulatory EEG monitoring. In: Recent Advances in
Epilepsy No. 3, Pedley T. A., Meldrum B. S., eds. Edinburgh: Churchill Livingston,
1986; 111–135.
18. Holter N. J. New method for heart studies. Science 1961; 134:1214–1220.
19. Marson G. B., McKinnon J. B. A miniature tape recorder for many applications.
Control Instrum. 1972; 4:46–47.
20. Wilkinson R. T., Mullaney D. Electroencephalogram recording of sleep in the
home. Postgrad. Med. J. 1976; 52 (Suppl. 7):92–96.
21. Stalberg E. Experience with long-term telemetry in routine diagnostic work. In:
Quantitative Analytic Studies in Epilepsy, Kellaway P., Petersen I., eds. New York:
Raven Press, 1976; 269–278.
22. Quy R. J. A miniature preamplifier for ambulatory monitoring of the electroen-
cephalogram. J. Physiol. (London) 1978; 284:23–24.
23. Stores G., Hennion T., Quy R. J. EEG ambulatory monitoring system with
visual playback display. In: Advances in Epileptology, Woods J. A., Penry J. K.,
eds. The Xth Epilepsy International Symposium, New York: Raven Press, 1980;
89–94.
24. Ives J. R., Thompson C. J., Gloor P. Seizure monitoring: A new tool in electroen-
cephalography. Electroenceph. Clin. Neurophysiol. 1976; 41:422–427.
25. Ives J. R., Gloor P. Automatic nocturnal sleep sampling: A useful method in
clinical electroencephalography. Electroenceph. Clin. Neurophysiol. 1977;
43:880–884.
26. Ives J. R. “F4-P4”: A self-contained mobile 16-channel EEG data acquisition
system for recording seizures. Electroenceph. Clin. Neurophysiol. 1982; 54:37p.
27. Ives, J. R., Gloor P. A long-term time-lapse video system to document the patient’s
spontaneous clinical seizures synchronized with the EEG. Electroenceph. Clin.
Neurophysiol. 1978; 45:412.
28. Ives J. R. A completely ambulatory 16-channel recording system. In: Mobile Long-
Term EEG Monitoring, Stefan H., Burr W., eds. Stuttgard: Gustav Fischer, 1982;
205–217.
29. Ives J. R., Schomer D. L. Recent technical advances in long-term ambulatory out-
patient monitoring. Electroenceph. Clin. Neurophysiol. 1986; 64:37p.
30. Ives J. R., Gloor P. New sphenoidal electrode assembly to permit long-term moni-
toring of the patient’s ictal or interictal EEG. Electroenceph. Clin. Neurophysiol.
1977; 46:575–580.
31. Ives J. R., Gloor P. Update: Chronic sphenoidal electrode. Electroenceph. Clin. Neu-
rophysiol. 1978; 44:789–790.
32. Ives J. R., Schomer D. L. The significance of using chronic sphenoidal electrodes
during the recording of spontaneous ictal events in patients suspected of having
temporal lobe seizures. Electroencephal. Clin. Neurophysiol. 1986; 64:23p.
33. Gotman J., Ives J. R., Gloor P. Frequency content of EEG and EMG at seizure
onset: Possibility of removal of EMG artifact by digital filtering. Electroenceph.
Clin. Neurophysiol. 1981; 52:626–639.
34. Barlow J. S. EMG artifact minimization during clinical EEG recordings by special
analog filters. Electroenceph. Clin. Neurophysiol. 1984; 58:161–174.
35. Ives J. R., Schomer D. L. A 6-pole filter for improving the readability of muscle
contaminated EEG. Electroenceph. Clin. Neurophysiol. 1988; 69:486–490.
36. Ives J. R. “Time-scribe”: A universal time writer for any EEG/polygraph chart
recorder. Electroenceph. Clin. Neurophysiol. 1984; 57:388–391.
37. Ives, J. R. Recording the time of day. Long-Term Monitoring in Epilepsy (EEG
Suppl. No 37), Gotman J., Ives J. R., Gloor P., eds. Amsterdam: Elsevier Science
Publishers BV, Biomedical Division, 1985; 83–89.
38. Wilkinson R. T., Mullaney D. Electroencephalogram recording of sleep in the
home. Postgrad. Med. J. 1976; 52(7):92–96.

39. Hoelscher T. J., Erwin C. W., Marsh G. R., Webb M. D., Radtke A. A., Linnger A.
Ambulatory sleep monitoring with the Oxford-Medilog 9000: Technical accept-
ability, patient acceptance, and clinical indications. Sleep 1987; 10:606–607.
40. Ives J. R., Mainwaring N. R., Krishnamurthy K. B., Blum A. S., Drislane F. W.,
Schachter S. C., Schomer D. L. Technical implementation and clinical
10 A Brief History of Ambulatory EEG
findings/results of monitoring oxygen saturation in patients referred for long term
EEG monitoring. Electroenceph. Clin. Neurophysiol. 1996; 99:432–439.
41. Schomer, D. L., Advances in EEG telemetry. In: Advances in Clinical Neurophysiol-
ogy 57, Hallett, M., Phillips, L., Schomer, D. L., Massey K.M. eds. Amsterdam:
Elsevier, 2005; 477–484.

C H A P T E R 2
Automated Spike and SeizureDetection AlgorithmsK . B . K R I S H N A M U R T H Y
I. IntroductionThe development and application of automated spike and seizure detection
algorithms has revolutionized ambulatory electroencephalogram (EEG)
monitoring. Initially, prolonged EEG monitoring was used to characterize
the electrographic correlate of spells that were detectable clinically. There-
fore, in order for the monitoring to be successful, the events had to have a
clinical manifestation that was identifiable either by the patient or by an
observer. [1] Prior to the introduction of automatic detection, EEG monitor-
ing could not identify subclinical events, i.e., events that were not reported
by the patient or obvious to an observer. For this reason, the early versions
of EEG monitoring devices recorded 24 hours of continuous data that were
then manually reviewed by a technologist and electroencephalographer—a
labor-intensive and time-consuming process. [1] Typically, a trained technol-
ogist performed the initial review by screening the 24 hours of data and iso-
lating events of interest for the EEG reader to further scrutinize. Another
approach was for the entire record to be reviewed at speeds of up to 60
times real time by the EEG reader. [1]
The addition of computer-assisted spike and seizure detection has permitted
the identification of interictal epileptiform abnormalities or electrographic
11 Copyright 2005, Elsevier Inc. (USA)All rights reserved.
Atlas of Ambulatory EEG

seizures that are present at any time during the monitoring session. Liporace
et al. demonstrated the increase in detection of interictal epileptiform abnor-
malities as well as subclinical seizures using ambulatory EEG with automated
spike and seizure detection algorithms over sleep-deprived EEG. [2] Another
study performed using an ambulatory EEG system that included automated
spike and seizure detection algorithms showed that the likelihood of these
computerized algorithms alone detecting an abnormality was 26.2%. [3]
Automated seizure detection is particularly useful for patients who are not
able to report clinical events or for those in whom seizures are not readily
apparent to observers (such as those that might occur during sleep). In these
patient groups, the use of automated algorithms for seizure detection enables
clinicians to identify subclinical seizures and seizures for which the patient is
amnestic without the need for a technologist to review the patient’s entire
EEG record. The ability to perform the recordings with the patients in their
usual surroundings also allows for an increased possibility of capturing rele-
vant events at a lower cost than inpatient telemetry. [4]
II. Automatic Spike DetectionAs in routine EEGs, the detection of interictal epileptiform activity by auto-
matic detection algorithms supports the diagnosis of epilepsy. [1] Among
patients with known epilepsy and interictal abnormalities, as few as 40%
may have a clinical seizure recorded over 48 to 72 hours of EEG monitoring.
Thus the presence of interictal abnormalities in some cases may be the only
abnormality present that is consistent with a diagnosis of epilepsy. [5]
Automatic spike detection greatly reduces the time necessary to detect
interictal discharges; a few pages contain the findings of interest without the
need to laboriously scan the entire EEG.
Rigorous mathematical equations that precisely detect spike and sharp waves
have not been established. The general strategy behind spike or sharp wave
detection algorithms is to identify false detections in preference to missing
12 Automated Spike and Seizure Detection Algorithms
true epileptiform discharges. However, the presence of short duration arti-
facts can contaminate the record, so artifact-free portions of the recording
must be used.
A. Spike Detection AlgorithmsThe spike detection algorithms often used in ambulatory EEG monitoring
systems are based upon pattern recognition. Complex EEG signals are rede-
fined by a series of simpler elements through a series of steps that address
three specific characteristics of the wave in question.
The first characteristic is the relative amplitude of sequential half-waves. For
this analysis, every channel of EEG is divided into a series of segments; each
segment consists of a section of EEG between two extremes of amplitude, for
example, between the most negative and most positive positions. Because
low-amplitude, high-frequency activity (e.g., muscle activity) can falsely
influence the determination of a segment, some algorithms use filtering to
attenuate such activity.
The Gotman/Gloor spike detection algorithm is designed to recreate the slow
frequency wave while “smoothing” out low-amplitude fast activity. [6] It does
this by evaluating trends in the directions of amplitudes—small segments
going in a direction opposite to the major direction of activity are eliminated.
This essentially eliminates high-frequency, low-amplitude elements. Pairs of
segments, sequences, or a segment and a sequence are then combined into
waves. Each wave consists of two elements with opposite directions.
Defining the amplitude of a segment or sequence comprising a half-wave is
the next step in spike detection. Because this amplitude can only be relative
to the background, it is necessary to constantly have a fix on the EEG back-
ground amplitude. This background amplitude is calculated three times per
second continuously as the average amplitude of the sequences from the pre-
ceding 5 seconds. Thus, the relative amplitude of a half-wave is the ratio of its
absolute amplitude to the background amplitude rounded to the closest
integer from 0 to 20.

Automated Spike and Seizure Detection Algorithms 13
Another characteristic that determines whether a wave will be identified as a
spike is a measure of its sharpness. This is calculated as the relative second
derivative of the apex of its wave, using a portion of the waveform that
includes 15 msec before and 15 msec after the apex. The background ampli-
tude for the preceding 5 seconds of signal is used as a normalization
factor.
The third and final characteristic that is analyzed is the pseudo-duration of
each half-wave. This pseudo-duration incorporates information about the
convexity of the half-wave, which makes it easier to differentiate between
half-waves that are more or less likely to be part of a spike or sharp wave.
The pseudo-duration compares the convexity of the beginning portion of a
segment to the convexity of the final portion, which is felt to be a more
appropriate and efficient measure of the duration of a half-wave. [6]
The spike detection algorithm is then applied to each half-wave of each
channel independently. The following conditions must be met in order to
categorize a given wave as a spike or sharp wave.
1. The relative amplitude of the current and preceding half-waves must be
above a preset threshold.
2. The pseudo-durations of the current and preceding half-waves must be
under a preset limit.
3. The relative amplitude must be large enough given the relative sharpness
of the half-wave.
4. The total duration of the wave must be greater than or equal to a preset
minimum value.
If all four conditions are met, the wave is selected as a possible spike or sharp
wave. If any condition is not met, the wave is eliminated from consideration
as a spike or sharp wave.
This algorithm does not identify electromyography (EMG) activity as spikes,
because EMG activity is of short duration or because dividing it into seg-
ments causes too many segments for the calculation procedure. Similarly, it
rejects eye-blink artifact seen in a frontal channel if a similar wave occurs in
the same channel on the contralateral side, if it has a duration greater than
150 msec and if it has positive polarity. Finally, sharp or suddenly appearing
alpha rhythm will be rejected if the wave in question is determined to be part
of a section with a dominant frequency of 8 to 12 Hz.
B. ValidationThe absolute accuracy of a computerized detection method is difficult,
if not impossible, to ascertain. It can only be compared with the “standard”
method, i.e., human review of EEG data. As concordance between human
reviewers can be quite low, the validity of comparing the outcome of any
algorithm with the results of a group of human interpreters can be ques-
tioned. Ultimately, because the spikes identified by the computer algorithm
are also checked for accuracy by human observers, the capability of the com-
puter program to identify events of interest is most important.
Because of this, Gotman et al. undertook a two-part study. [7] Initially, infor-
mation about the likelihood of false positive and false negative identifications
by the automated detection system was obtained. Secondly, a direct compari-
son between epileptiform activity identified by the computer algorithm and
that identified by human reviewers was made.
To do this study EEGs were obtained in 30 healthy subjects, 30 patients with
supratentorial brain lesions but no epilepsy, and in 50 patients with epilepsy.
Two to three minutes of EEG were obtained for each subject in the resting
state with eyes closed.
All computer-detected events identified in records from normal subjects and
those obtained in nonepileptic patients were reviewed to determine if the
event was an artifact (e.g., EMG, sharp alpha, or eye blinks). There were 21
detections that were identified as artifacts.
It was assumed that any interictal spikes or sharp waves identified by the
detection algorithm in EEGs of healthy subjects and nonepileptic patients

had to be false detections; this assumption is reasonable based on normative
studies. [8] Therefore, all events identified in the EEGs of these subjects were
initially categorized as “clearly erroneous detections.” Later, these detections
were visually inspected to determine if they truly were erroneous. In addition,
the events identified as epileptiform in patients with epilepsy that were arti-
factual from EMG activity, eye blinks, or sharp alpha activity were also char-
acterized as clearly erroneous detections. For the remaining detections,
namely those in EEGs from patients with epilepsy, two EEG readers indepen-
dently reviewed the paper recordings and each event identified by the com-
puter. They had no knowledge of which detection came from which patient
and filled out questionnaires (called structured reports) that were then com-
pared.
These comparisons demonstrated that 4 out of the 50 paper tracings from
patients with epilepsy contained no spikes according to both EEG readers;
the computer algorithm also found no epileptiform abnormalities. In one
case, after reviewing a paper recording both EEG readers found “mild and
doubtful” abnormalities, which the computer detection algorithm failed to
identify.
In general, there was 58 to 61% correlation between the findings of the EEG
reading by the EEG readers and the computer detection algorithm. There was
a 72% correlation between the two EEG readers for paper recordings, and a
remarkable 84% agreement between EEG readers for review of the events
identified by the computerized spike detection algorithm. This study demon-
strated that computerized data acquisition/spike detection may diminish the
inter-observer variability that characterizes the interpretation of paper
EEGs.
III. Seizure DetectionFor a seizure detection algorithm to be useful it must have a low number
of missed detections (false negatives). False positive detections are not both-
ersome unless a large number occur. [9] The difficulty, however, lies in the
14 Automated Spike and Seizure Detection Algorithms
fact that electrographic seizures can have a variety of patterns and are there-
fore much less likely to be uniform. [10] Also, rhythmic artifacts that fre-
quently occur, such as EMG or eye-blink artifact, can be identified as possible
seizures by some seizure detection algorithms. [10]
The first attempt at such an algorithm was by Prior et al., who used the com-
bination of EMG activity and change in EEG amplitude (initial large increase
in amplitude followed by a clear decrease) to identify generalized tonic-clonic
seizures. [10, 11] This method was not useful for other seizure patterns such
as those characterized by an electrodecremental response.
A. Seizure Detection Algorithms The Gotman algorithm for seizure detection is capable of recognizing
seizures of different types as long as at least a part of the seizure contains sus-
tained paroxysmal rhythmic activity of 3 to 20 Hz. There are five steps to this
algorithm.
First, a digital filter is applied to remove 60-Hz contamination. Then, a
2-second segment of one channel of EEG data, referred to as an epoch, is
broken down into half-waves, further eliminating low-amplitude fast fre-
quency activity.
Next the average amplitude (to confirm that an epoch is paroxysmal), average
duration (a measure of frequency), and coefficient of variation of duration of
half-waves in one epoch are calculated. [10] The coefficient of variation is a
measure of the rhythmicity of the EEG, independent of the frequency of the
waves involved.
The average amplitude in the previous step is calculated based upon the dif-
ference from the “background.” This background period is updated for each
new epoch and is calculated as follows:
1. The current epoch lasts for 2 seconds.
2. A 12-second gap is left which ends at the beginning of the current epoch.

Automated Spike and Seizure Detection Algorithms 15
3. The background section is a 16-second period that ends at the beginning
of the 12-second gap.
Finally, a seizure detection is made when two or more channel detections
occur in the same or adjacent epochs. If the two channel detections are in
the same epoch but in two different channels, the average amplitude of the
successive epoch in one of the two channels must be at least 80% that of the
detection epoch. A channel detection has to satisfy three conditions: the rela-
tive amplitude is greater than or equal to 3, the average duration of
half-waves is between 25 and 150 msec, and the coefficient of variation of
the half-wave duration is less than 0.6. Therefore, detections will be triggered
by a sudden increase in frequency or by rhythmic activity of large
amplitude. [10]
A sixth step is used for rejection of artifacts. EMG activity, when broken
down into half-waves, typically causes more than 100 half-wave segments
in an epoch; rejection of an epoch containing more than 100 segments
eliminates this type of false detection. Also, an epoch containing large
amplitude technical artifacts is rejected if the maximal allowable amplitude is
detected over 30 sampled data points in a given epoch. The epoch prior to
the epoch in question is also rejected. [9]
This algorithm detects the rhythmic or paroxysmal part of the electrographic
seizure but not necessarily the onset. Systems with large, rewritable buffers
overcome this problem because computerized detection of the event in ques-
tion can include the previous 2 minutes of recording. [10]
B. ValidationGotman studied 5303 hours of continuous EEG recordings obtained from 49
patients. These comprised 241 recordings from 44 patients using scalp and
sphenoidal electrodes and 52 recordings from 5 patients using intracerebral
electrodes. In this sample, 244 seizures were recorded of which 59 were
detected clinically alone, 86 were detected both clinically and by the detection
algorithm, and 99 seizures were detected by the algorithm alone. [12]
This finding suggests that a combination of automated detection and
clinical observation produces the best outcome in terms of seizure
detection.
IV. ConclusionAutomated spike and seizure detection algorithms are clinically reliable
methods of screening for epileptiform and electrographic seizure activity, and
thereby enhance the usefulness of ambulatory EEG monitoring. These algo-
rithms are robust, and when used in conjunction with review of clinically
apparent events they increase the possibility of capturing an abnormality that
could alter the patient’s treatment.
References1. Bridgers S. L., Ebersole J. S. Cassette electroencephalography. In: The Treatment of
Epilepsy: Principles and Practices, E. Wyllie, ed. Philadelphia: Lea & Febiger, 1993;
278–284.
2. Liporace J., Tatum W., Morris G. L., French J. Clinical utility of sleep-deprived
versus computer-assisted ambulatory 16-channel EEG in epilepsy patients: A
multi-center study. Epilepsy Res. 1998; 32:357–362.
3. Morris G. L., Galezowska J., Leroy R., North R. The results of computer-assisted
ambulatory 16-channel EEG. Electroenceph. Clin. Neurophysiol. 1994;
91(3):229–231.
4. Waterhouse E. New horizons in ambulatory electroencephalography. IEEE Eng.
Med. Biol. 2003; May/June:74–80.
5. Ebersole J. S., Leroy R. F. An evaluation of ambulatory, cassette EEG monitoring:
II. Detection of interictal abnormalities. Neurology 1983; 33:8–18.
6. Gotman J., Gloor P. Automatic recognition and quantification of interictal epilep-
tic activity in the human scalp EEG. Electroenceph. Clin. Neurophysiol. 1976;
41:513–529.
7. Gotman J., Gloor P., Schaul N. Comparison of traditional reading of the EEG and
automatic recognition of interictal epileptic activity. Electroenceph. Clin. Neuro-
physiol. 1978; 44:48–60.
8. Schachter S. C., Ito M., Wannamaker B. B. et al. Incidence of spikes and paroxys-
mal rhythmic events in overnight ambulatory computer-assisted EEGs of normal
subjects: A multi-center study. J. Clin. Neurophys. 1998; 15:251–255.
9. Gotman J. Automatic recognition of epileptic seizures in the EEG. Electroenceph.
Clin. Neurophysiol. 1982; 54:530–540.
16 Automated Spike and Seizure Detection Algorithms
10. Gotman J., Burgess R. C., Darcey T. M., Harner R. N., Ives J. R., Lesser R. P.,
Pign J. P. M., Velis D. Computer applications. In: Surgical Treatment of
the Epilepsies, Engel, J. Jr., ed. New York: Raven Press, Ltd. 1993;
429–443.
11. Prior P. F., Virden R. S. M., Maynard D. E. An EEG device for monitoring seizure
discharges. Epilepsia 1973; 14:367–372.
12. Gotman J. Automatic seizure detection: improvements and evaluation. Electroen-
ceph. Clin. Neurophysiol. 1990; 76:317–324.

C H A P T E R 3
The Clinical Use of Ambulatory EEGF R A N K W . D R I S L A N E
I. Purposes of EEG Monitoring Electroencephalogram (EEG) monitoring of patients with seizures or
seizure-like symptoms can serve several purposes. [1–3] This chapter focuses
on event (such as seizure) monitoring, particularly in the ambulatory
setting.
A. Diagnosis of EpilepsyThe most basic and probably the most common use of EEG monitoring is to
determine whether a patient with paroxysmal clinical disturbances is having
epileptic seizures. Monitoring can help both in identification of interictal
epileptiform discharges and in recording clinical seizures or seizure-like
events. It can help identify whether an individual episode in question is
epileptic or nonepileptic in origin.
Logically, it is probably impossible to exclude an epileptic basis for a given
event. Some seizures are not well recorded at the surface EEG leads.
Nevertheless, maintenance of a normal EEG background (even amid
extensive movement and other artifact) suggests strongly that the event is
not epileptic. Even if epileptiform discharges are not seen during some true
epileptic seizures, there is usually a substantial alteration in the EEG with
seizures such as rhythmic slowing, background suppression, or some other
change.
17 Copyright 2005, Elsevier Inc. (USA)All rights reserved.
Atlas of Ambulatory EEG

Some paroxysmal clinical episodes are associated with clear electrographic
seizures, helping to make the diagnosis. The absence of epileptiform EEG
abnormalities at the time of paroxysmal behavioral disturbances increases the
likelihood that the events are not epileptic, but rather manifestations of other
illnesses. Two other groups of illnesses produce symptoms similar to those of
seizures. There are events of other physiologic bases such as cardiac arrhyth-
mias causing syncope, episodes caused by cerebrovascular disease, movement
disorders, and unusual manifestations of sleep disorders. There are also events
of psychiatric origin. Taken together, all of these events are generally referred
to as “nonepileptic seizures.” All of these can produce bizarre and unusual
movements and behavior with some resemblance to epileptic seizures.
For some events, review of a video recording alone is persuasive for a psy-
chogenic origin of spells. Nevertheless, even very experienced epileptologists
will see bizarre behavior that appears to be psychogenic but, by EEG, actually
has an epileptic basis.
The events of psychiatric origin are often referred to as psychogenic
nonepileptic seizures (PNES), or pseudo-seizures or nonepileptic events.
(Although used often, the word seizure in this context is likely to promote
confusion.) EEG monitoring, especially with simultaneous video recording, is
particularly valuable in the evaluation of possible PNES. Although not always
successful, it is usually the best way to determine the nature of these events.
Epileptic seizures and PNES differ in several respects. [4–6] PNES tend to be
of longer duration and may peak in frequency early in a monitoring session,
whereas epileptic seizures tend to occur later, as medication is reduced. Med-
ication withdrawal does not appear to influence the occurrence of nonepilep-
tic events. Whereas PNES tend to occur in the daytime and not during sleep,
epileptic seizures are common in sleep. The presence of observers and family
members may prompt the occurrence of nonepileptic events and facilitate
their recording. Many other clinical features help to distinguish epileptic from
psychogenic events. [5, 6] An accurate diagnosis of PNES can be just as
helpful as a diagnosis of epilepsy, at least for avoiding anticonvulsant toxicity.
18 The Clinical Use of Ambulatory EEG
Ambulatory EEG has been very effective at separating seizures from PNES in
children, especially when the events in question are stereotyped and reliably
discerned by observers such as parents. In these cases, video recording is often
unnecessary. [7] Still, events need to occur with a reasonable frequency (such
as three times per week) for monitoring to be successful.
As with any other test the value and, in this case, specificity of monitoring
depend on the appropriateness of the events being monitored. [8] Monitor-
ing to confirm a clinical suspicion of epilepsy or analyze clinically diagnosed
epilepsy has a far greater yield than monitoring for vague or poorly charac-
terized symptoms. In almost all cases, however, the yield is far greater than
with routine EEG recordings. Still, events can be missed, and if the events in
question do not occur during the session, monitoring may yield no useful
results.
B. Determining Seizure Types and Epilepsy Syndromes Even if it is clear on clinical grounds that the symptoms of interest are actually
epileptic seizures, it is important to determine the type or types of seizures a
patient has. Characterization of ictal and interictal abnormalities can help to
determine seizure types and epilepsy syndromes, in conjunction with other
clinical features and family history. Even with an accurate diagnosis of
epilepsy, it is often appropriate to determine whether new, additional, or
different behavioral episodes are seizures or not—there could be both seizures
and PNES. This may become pertinent when a patient’s seizures are poorly
controlled; it may be asked whether the original diagnosis is correct.
The EEG recorded at the time of an event can help in seizure and epilepsy
classification. It is commonly difficult to determine clinically whether a
patient has a primary generalized or focal (localization-related) epilepsy.
The recording of generalized spike-wave discharges or focal abnormalities
obtained interictally or, better, during seizures, can help to make this distinc-
tion. For example, a young adult may have staring spells that are clearly
epileptic in origin, but the treatment and prognosis may differ depending on

The Clinical Use of Ambulatory EEG 19
whether the spells are primary generalized “absence” seizures or focal-onset
complex partial seizures.
C. LocalizationOne of the most common reasons for EEG monitoring is to localize seizure
onset in the evaluation of a patient with refractory epilepsy who is consider-
ing surgery after medications have failed to control the seizures. Documenta-
tion of seizures and the localization of their onset are crucial in the
evaluation of patients considered for epilepsy surgery. It must be certain that
the operative target is responsible for the seizures actually troubling the
patient rather than for electrographic seizures that may not have a clinical
correlate.
This information must be used in concert with neuroimaging findings such
as those on MRI scans (especially with gadolinium enhancement and on fluid
attenuated inversion recovery sequences; FLAIR); by evidence of neuronal
damage or dysfunction on magnetic resonance spectroscopy (MRS); foci seen
with single photon emission computerized tomography (SPECT) scans, espe-
cially those done at the time of seizures (“ictal SPECT”); and results from
positron emission tomography (PET) scans, which show areas of abnormal
metabolism interictally in patients with seizure foci. The ictal EEG remains
the cornerstone of localization in most epilepsy surgical centers. [9] Plans for
surgery are more secure when at least several seizures have been recorded and
there is reliable determination of a (preferably single, isolated) seizure focus.
A complete review of the utility of ictal EEG monitoring in surgical planning
is beyond the scope of this chapter.
D. Examination for Subclinical Seizures Some seizures recorded during prolonged EEG monitoring may be asympto-
matic or “subclinical.” Many such seizures can occur during sleep and are not
noted by patients or observers. Some patients whose seizures are thought to
be under good control on medication actually have frequent subclinical
seizures. It is unclear that these seizures are actually subclinical (i.e., such
electrographic seizures may have some immediate or even long-term clinical
consequence), but this is still controversial. Some neurologists feel it is
important to look for brief subclinical seizures when tapering or changing
anticonvulsants to see if the situation is becoming worse before longer and
potentially harmful seizures are evident clinically.
E. Monitoring for Seizures in the Postictal PeriodFollowing seizures or status epilepticus (SE), especially when mental status is
still impaired, many patients to actually have seizures or SE that is not
evident clinically. Several groups have found that about 10% of patients who
were thought to have had seizures or SE treated successfully were still in non-
convulsive status epilepticus (NCSE). [10] Even among comatose patients
with no clinical seizures at all, 8% were in NCSE in one study. [11] SE in the
ICU is usually not suspected [12]; this is often a serious condition that can be
treated successfully—but not if it remains undiagnosed. [13]
F. Assessment of Seizure FrequencyA somewhat less common use of EEG monitoring is quantitation of seizure
frequency when the clinical history is not sufficient (including when individ-
ual episodes are not clearly epileptic). This may be particularly helpful when
the patient is unable to provide an adequate report or when those reports are
unreliable. Occasionally, this quantitation can help in deciding whether to
increase or decrease the dosages of medication treatment. Nevertheless, it is
difficult to depend on the data from a few days’ recording to assess the
impact of different medications on longer term seizure control. Absence
seizures in adolescence may be among the few seizures for which neurologists
will want to increase anticonvulsant treatment for very frequent subclinical
seizures, usually with the thought that the patient may still suffer true clinical
deficits of which he is not aware or that there may be deleterious cognitive
effects of having many seizures.
G. Other UsesEEG monitoring acquires much more data than routine EEGs. It can be
better in detecting interictal abnormalities, particularly in patients who have
normal baseline EEGs or who have findings of questionable significance
such as various sharp transients. Cardiac arrhythmias may also be found.
Sleep disorders may be identified, particularly when eye movement,
electromyography (EMG), and respiratory function are monitored in
addition to the EEG recording of sleep states. Determination of the
precipitants for seizures can also be detailed through monitoring, e.g.,in
catamenial and reflex-related seizure disorders.
II. Event MonitoringEEG monitoring can record interictal epileptiform discharges and other phys-
iologic variables such as cardiac rate and rhythm, respiratory function in
sleep testing, partial pressure of oxygen, EMG, and movement-related activity.
Monitoring also includes prolonged recording of the EEG, even at times
when the patient has no symptoms. It can include algorithm-based recording
of EEG features of interest such as spikes and electrographic seizures (see
Chapter 2). Automatic seizure detection programs are useful, especially for
seizures that occur in certain situations such as during sleep—when neither
the patient nor observers are able to identify them. Nevertheless, it is the
monitoring of individual episodes or paroxysmal events of abnormal clinical
behavior that usually bring the patient in for medical attention and are of
greatest interest.
Seizures are paroxysmal electroclinical events. This leads to two problems in
EEG monitoring. First, the events are not present all of the time. Indeed, they
may occur for just a minute or less in a 24-hour period, and the rest of a
day’s recording may yield little diagnostic information. Consequently, one
must know exactly when the event occurred, or monitor the entire day’s EEG
and then search through and analyze very large quantities of data, most of
20 The Clinical Use of Ambulatory EEG
which is of little interest. Recording may be continuous, but it is necessary to
have some event markers to determine which epochs are of clinical interest.
Focusing on the symptoms that constitute the chief complaint is a more
effective way to evaluate a patient’s symptoms.
Second, the precise correlation of the clinical disturbance and the recorded
EEG abnormalities are of interest to both the patient and the neurologist.
There must be a connection between the electrographic abnormality and the
symptoms that trouble the patient. Some EEG abnormalities may not disturb
the patient at all while others may explain the chief complaint. The goal of
event recording is to record the seizures that trouble a patient more than
interictal abnormalities or subclinical seizures alone.
For demonstration of the epileptic nature of individual spells and for local-
ization it is desirable to record more than one event. Just as patients may have
more than one type of seizure, some may have both epileptic seizures and
nonepileptic events within the same day. It must be clear that the symptom of
interest has been recorded.
Event-triggered systems often include video recording, particularly in the
inpatient setting and when EEG findings may be absent or difficult to inter-
pret, e.g., with some seizures of frontal origin. Video monitoring can show
behavioral manifestations strongly suggestive of seizures or of nonepileptic
events, even when the EEG is inconclusive. Notation of the event’s timing is
important in determining which portion of a video recording to review.
The best recording of symptoms comes from the detailed report of a patient
who is able to describe which symptoms are most troublesome and whether
an individual event includes those symptoms. This is often effected through
use of a pushbutton event marker denoting the time of the event or marking
the EEG itself. This should be accompanied by a description of the symptoms
in a log or by audio recording.
Many patients have seizures that interfere with their ability to record the
event. For example, patients who have partial seizures that undergo rapid
The Clinical Use of Ambulatory EEG 21
generalization may lose consciousness or progress into a confusional state,
which renders them unable to activate the system or describe their symptoms
at the time. For many seizures involving limbic structures, there is amnesia
for the event. In these cases notation of the event by an observer, often using
the same pushbutton event marker, is essential. Certainly, children and
patients with mental retardation or other neurological deficits hindering their
own participation will need assistance from observers, both in intensive inpa-
tient monitoring units and during ambulatory recording.
Many event-centered monitoring technologies depend heavily on observers
such as family members, friends, or clinical personnel. An advantage of
family observers is that they are often very familiar with the typical spells of
interest and can describe whether individual spells are those of concern or
whether the events are different.
Observers must watch the patient carefully for staring spells, interruption of
speech, change in level of consciousness, or any altered behavior. Because the
beginnings of many seizures are subtle, observers must be attentive to the
patient at all times, a requirement that is not satisfied easily. Frequent interac-
tion with the patient can help to ascertain continued consciousness, attentive-
ness, and normal speech and behavior. Particularly with such interaction,
observers may help to record seizures that would not otherwise be apparent
to observers or to patients themselves. Seizures manifested by subjective sen-
sations alone (without obvious alteration in alertness or behavior) remain
unnoticed by observers unless the patient reports them.
For subclinical or electrographic seizures and for nocturnal recording, tech-
niques other than pushbutton activations are required. These may include
automated seizure detection programs. When events are recorded by patients
or observers voluntarily and also by automatic computer detection algo-
rithms, it becomes clear that the two methods are not equivalent. Some
events labeled seizures by the electroencephalographer, after reviewing a
change in the EEG along with suggestive video observations, may not be
detected by a given computer algorithm. Correspondingly, some automated
detection programs record presumed electrographic seizures that are
clearly artifactual or definitely not felt to be epileptic when reviewed by the
electroencephalographer.
There are disadvantages to focusing on events and event recordings. It may
fail when the patient is unable to record symptoms, when symptoms or signs
of seizures are not apparent to observers, when observers are inattentive,
and when seizures are truly subclinical to both patients and observers. These
events are unlikely to be recorded. Many truly epileptic seizures occur during
sleep. Observers may notice seizures in sleep, but this depends on awake,
attentive observers.
Symptomatic events appear to occur more frequently in patients with
psychogenic seizures than in patients with seizures of epileptic origin. [4] In
this sense, patients with PNES are particularly cooperative with monitoring. In
this setting, event recording can also be aided by suggestion or reproduction of
common precipitants. [14] Video recording of particularly bizarre and
physiologically unlikely behavior, without EEG abnormalities or alterations in
the EEG baseline, can be very helpful in suggesting the diagnosis of PNES.
III. Ambulatory EEG MonitoringInpatient monitoring often entails a long hospitalization and is resource-
intense in terms of staffing, hospital facilities, and maintenance of a monitor-
ing unit. Ambulatory monitoring has been developed over the past 20 years
and is now comparably reliable to monitoring done in the hospital. [8, 15]
Inpatient monitoring is more expensive, but it is not always better. In many
cases, ambulatory outpatient EEG monitoring may be preferable, especially
when it does not require anticonvulsant reduction. Ambulatory monitoring
allows patients more mobility and the possibility of remaining in their
natural environments and maintaining their usual activity level. It is more
desirable to know the frequency of seizures in the patient’s natural setting
than in the hospital. Ambulatory monitoring is particularly suitable for
patients whose events are more likely to occur in a familiar setting. Specific
environmental stimuli may precipitate a patient’s seizures, and they may be
more readily available at home. Seizures related to sleep (e.g., nocturnal
seizures) may be particularly dependent on the usual, home environment.
Many patients have a marked reduction in seizure frequency upon admission
to a hospital, where it can take weeks for seizures to occur, even though they
were happening daily at home. [16] This may result from more reliable med-
ication administration in hospital or from the security or lack of the usual
environmental precipitants. In most cases, ambulatory monitoring also
requires observers who are usually family members.
When seizures are frequent and there is no need to withdraw anticonvulsants,
ambulatory monitoring can even be of sufficient quality to serve surgical can-
didates. These are usually patients with temporal lobe seizures. One report of
six patients demonstrated that ambulatory EEG seizure monitoring could be
safe, convenient, and sufficiently effective to plan surgery for patients with
refractory temporal lobe epilepsy, with surgical results similar to those for
patients who had inpatient monitoring. [17] Patients had similar baseline
seizure frequency, numbers of seizures recorded, and time required to record
three seizures. They had no significant complications. It is not clear that such
monitoring would be sufficient for patients with extratemporal foci with
refractory seizures.
Use of video recording can limit ambulatory monitoring. Video recording
of clinical events is frequently crucial, particularly in the determination of
epilepsy versus psychogenic events. It necessitates keeping the patient in view
of the camera, usually limiting freedom of movement. It is important to syn-
chronize the video and EEG recordings so that they can be analyzed simulta-
neously. Outpatient video and EEG monitoring requires the patient or family
to be comfortable enough with the technology to operate the equipment and
be responsible for expensive monitoring equipment. Fortunately, such equip-
ment has become much more simplified in its operations and even familiar
to many non-medical people accustomed to consumer electronics. Increas-
22 The Clinical Use of Ambulatory EEG
ingly, video recording can be synchronized with ambulatory EEG at home,
but the quality is not always as good as in inpatient units. The cost savings of
ambulatory monitoring must, of course, be balanced by a concern for patient
safety (and equipment damage) if there are vigorous or violent convulsions
in a less well-controlled setting.
Anticonvulsant medication reduction is used often to elicit events of clinical
interest, with the potential risk of precipitating excessive seizures or even
status epilepticus (SE). Therefore, the need to reduce anticonvulsant dosages
necessitates hospital admission. Medication withdrawal must be performed
carefully in patients with worrisome seizures. Even a minimal diminution of
anticonvulsants can precipitate dangerous seizures or SE. One study indicated
that 3% of patients with complex partial seizures monitored in epilepsy units
went on to have SE despite close observation, and another 8% had clusters of
at least three seizures in four hours. [18] Such clusters may be a precursor to
SE, so detecting frequent seizures is usually considered important clinically.
Also, seizure clusters and SE are not usually the seizures one wishes to record.
They may not be as reliable in determining a patient’s usual seizure type,
localization, or frequency. Complications of medication withdrawal occasion-
ally include behavioral abnormalities, as well, especially upon carbamazepine
withdrawal. [19]
An advantage of inpatient monitoring is the ready availability of clinical staff
to assure patient safety, arrange for clinical intervention when necessary, and
arrange for additional observation beyond the video. Medications can be
administered quickly when necessary, decreasing the risk of anticonvulsant
withdrawal-induced seizures or SE. Inpatient monitoring affords readily avail-
able EEG technologists to be sure that the recording system is functioning
properly throughout the day and to intervene quickly to assure this, e.g.,
when electrodes become dislodged during epileptic seizures or other events
with vigorous movement. Technical problems are frequent and need to be
addressed. On-site help can prevent prolonged recordings dominated by arti-
fact. Also, results are usually analyzed more rapidly than with ambulatory
monitoring.

The Clinical Use of Ambulatory EEG 23
Arranging neuroimaging at an ictal or peri-ictal time (such as with ictal
SPECT) requires keeping the patient under close observation, usually in a
hospital setting. Finally, invasive monitoring cannot be performed on an out-
patient basis.
There are also intermediate possibilities. Brief monitoring episodes can be
planned in the monitoring unit for patients with frequent daily events,
whether seizure, syncope, or other paroxysmal disturbances. Patients whose
episodes are precipitated easily by some stimulus may also be suitable for
brief monitoring. In general, events occurring less often than daily have a rel-
atively small likelihood of being captured and categorized in a few days’ mon-
itoring. Ambulatory recording can be arranged for hospitalized patients who
are not necessarily in the epilepsy monitoring unit, e.g., on medical and sur-
gical floors. [20] Monitoring occurs in our clinical research center, connected
by cable to the lab, and in the intensive care units to rule out subclinical
seizure activity after SE, usually without video.
IV. Practical and TechnicalConsiderationsA baseline EEG should be done before telemetry. It is important to know
whether there are background abnormalities or focal or epileptiform features
in order to read the studies accurately. This EEG can help sort out the pres-
ence or absence of artifacts in the recordings. This is of particular concern
when patients are ambulatory and causing movement artifacts that would not
normally arise in an EEG laboratory.
Most current ambulatory EEG systems are very similar to those used for
inpatient units. Ambulatory monitoring was facilitated markedly by the
development of lightweight preamplifiers wrapped near the electrodes on the
patient’s head that allow amplification without the long wires or cables
needed for standard EEGs. [15] These preamplifiers lessen movement artifact.
Bipolar recording technique allows for a lower signal amplitude suitable for
the preamplifiers.
For seizure onset localization, 16 or more EEG channels are appropriate.
Most montages include 18 channels—16 EEG, plus electrocardiogram (ECG),
eye movement monitor, or pulse oximeter. Most montages incorporate stan-
dard anteroposterior bipolar chains; many use basal electrodes. Montage
design depends, in part, on the type of seizure anticipated. One common
montage consists of anteroposterior chains; another includes coronal and
temporal chains with sphenoidal or additional temporal electrodes incorpo-
rated in the coronal chain. When seizures of frontal or generalized origin are
suspected, coverage may include more frontal, midline sagittal, and parasagit-
tal leads. Equipment utilizing 32 channels affords greater flexibility in plan-
ning which data to acquire.
An important component of most ambulatory EEG systems is a device that
allows patients or observers to indicate when symptoms or events are occur-
ring. This can take the form of a pushbutton, which the patient can activate at
the onset of typical symptoms. This device is often attached to a waist-worn
recorder, which acquires EEG data using a continuous loop design. When the
pushbutton is activated, the EEG that was recorded continuously in the prior
two minutes is saved (not erased), as is the recording for the next several
minutes. Thus, although the system is activated after the onset of symptoms,
the EEG can be reviewed from before the time of symptom onset. The
description of symptoms can be written on a log sheet for later review.
A portable computer that can perform online analysis is used in ambulatory
EEG telemetry for automated detection algorithms. It can be brought home
by the patient and kept in close proximity. When the waist-worn recorder is
plugged into the computer, data can be analyzed online and the recorder trig-
gered to save EEG segments. For example, each time a suspected electro-
graphic seizure detection occurs, EEG starting two minutes before the
detection can be saved; similarly, a brief EEG segment can be saved surround-
ing each interictal epileptiform discharge (spike or sharp wave) detection.
The portable computer can also be programmed to record routine samples
throughout the session to provide a general assessment of EEG background
and sleep-wake cycling. When the patient is truly ambulatory and not near
the computer, the waist-worn recorder can function independently to record
pushbutton activations alone.
Extra basal cranial leads are used often, especially in the search for interictal
discharges and seizures of temporal lobe origin. Nasopharyngeal electrodes
are too irritating for long-term use. Sphenoidal electrodes are commonly
used, particularly when there is concern for a mesial or anterior temporal
origin of anticipated seizures. Leaving solid needles in place is not appropri-
ate for long-term monitoring, but flexible stainless steel wires function well
and remain safe for up to two weeks. [21] Additional electrode placement,
such as in the T1 and T2 positions, can be helpful and appears superior to
nasopharyngeal recording.
An ambulatory EEG setup in the EEG laboratory takes about two hours.
Electrodes must be attached even more securely to the patient’s scalp, with
sufficient protection by head wrapping to prevent dislodgement during the
more vigorous activities of ambulatory outpatient life. The technologist veri-
fies the integrity of the setup (calibration, electrodes, preamp function, and
montage selection) and confirms impedances below 3 kW. The baseline
recording assures that all components (including event markers and patient-
triggered recordings) are functioning properly. The patient is then asked to
close her eyes, blink, and so on, to verify electrode position and function. If
artifacts occur, the patient can be asked to reproduce the apparent cause by
swallowing, chewing, etc. For the monitoring to be useful, sharp features
must be clearly differentiable from movement or other artifacts.
Patients and observers are given a detailed equipment instruction guide, a log
sheet on which to record the time and description of each event, and 24-hour
telephone assistance numbers. Outpatients typically remain on long-term
monitoring from one to seven days, with an average of 2.5 days for our lab,
whereas inpatients may be monitored for as long as several weeks but average
24 The Clinical Use of Ambulatory EEG
five days. All data are transferred from the home computer and waist-worn
recorder into the lab computer daily. Batteries are replaced every 48 hours.
Skilled and experienced EEG technologists are necessary for successful ambu-
latory event monitoring. Such telemetry requires more technical expertise
than routine EEG. In the ambulatory setting and with prolonged recording,
problems arise with patients’ behavior and equipment function that are gen-
erally not seen in routine EEG recording. Intense, time-consuming effort is
required to produce reliable and meaningful recordings. Thus, EEG monitor-
ing is more expensive than routine laboratory recording. Still, as noted by
Gumnit:
Even the finest equipment cannot make up for deficiencies in quality of
the technical and professional personnel. Unless carried out with
consistently high technical standards and provided with interpretations
that are clinically reliable. . . . [intensive neurologic monitoring] . . . is
simply an expensive waste of time.” [2]
Studies should be interpreted by experienced (preferably board-certified)
electroencephalographers, and supervision of epilepsy monitoring requires
still more intensive training and experience. Reports from monitoring ses-
sions must distinguish clearly what the patient’s symptoms were during the
events, what was seen by observers and on video monitoring, and what the
EEG recording showed at the same time. With the increased potential for
artifacts, the variability of clinical seizure manifestations, and the importance
of rendering an accurate diagnosis in the case of seizures and in nonepileptic
events, a conservative interpretation of results is appropriate.
References1. Engel J., Burchfiel J., Ebersole J., Gates J., Gotman J., Homan R., Ives J., King D.,
Lieb J., Sato S., Wilkus R. Long-term monitoring for epilepsy. Report of an IFCN
committee. Electroenceph. Clin. Neurophysiol. 1993; 87:437–458.

The Clinical Use of Ambulatory EEG 25
2. Gumnit R. J. Intensive neurodiagnostic monitoring: Summary and recommenda-
tions. In: Advances in Neurology, Gumnit R. J., ed. New York: Raven Press, 1886;
46:291–302.
3. Mattson R. Intensive neurodiagnostic monitoring: strategy for optimal use.
In: Advances in Neurology, Gumnit R. J., ed. New York: Raven Press, 1986;
46:281–290.
4. Pierelli, F., Chatrian G. E., Erdly W. W., Swanson P. D. Long-term EEG-video-
audio monitoring: detection of partial epileptic seizures and psychogenic episodes
by 24-hour EEG record review. Epilepsia 1989; 30:513–523.
5. Lesser R. P. Psychogenic seizures. Neurology 1996; 46:1499–1507.
6. Reuber M., Pukrop R., Bauer J., Helmstaedter C., Tessendorf N., Elger C. E.
Outcome in psychogenic nonepileptic seizures: 1 to 10-year follow-up in 164
patients. Ann. Neurol. 2003; 53:305–311.
7. Olson D. M. Success of ambulatory EEG in children. J. Clin. Neurophysiol. 2001;
18:158–161.
8. Ebersole J. S., Leroy R. F. Evaluation of ambulatory cassette EEG monitoring: III.
Diagnostic accuracy compared to intensive inpatient EEG monitoring. Neurology
1983; 33:853–860.
9. Schomer D. L., Ives J. R., Schachter S. C. The role of ambulatory EEG in the eval-
uation of patients for epilepsy surgery. J. Clin. Neurophysiol. 1999;
16:116–129.
10. DeLorenzo R. J., Waterhouse E. J., Towne A. R., Boggs J. G., Ko D., DeLorenzo G.
A., Brown A., Garnett L. Persistent nonconvulsive status epilepticus after the
control of convulsive status epilepticus. Epilepsia 1998; 39:833–840.
11. Towne A. R., Pellock J. M., Ko D., DeLorenzo, R. J. Determinants of mortality in
status epilepticus. Epilepsia 1994; 35:27–34.
12. Drislane F. W., Schomer D. L. Clinical implications of generalized electrographic
status epilepticus. Epilepsy Res. 1994; 19:111–121.
13. So E. L., Ruggles K. H., Ahmann P. A., Trudeau S. K., Weatherford K. J., Trenerry
M. R. Clinical significance and outcome of subclinical status epilepticus in adults.
J. Epilepsy 1995; 8:11–15.
14. Bazil C. W., Kothari M., Luciano D., Moroney J., Song S., Vasquez B., Weinreb H.
J., Devinsky O. Provocation of nonepileptic seizures by suggestion in a general
seizure population. Epilepsia 1994; 35:768–770.
15. Ives J. R., Thompson C. J., Gloor P. Seizure monitoring: a new tool in electroen-
cephalography. Electroenceph. Clin. Neurophysiol. 1976; 41:422–427.
16. Riley T. L., Porter R. J., White B. G., Penry J. K. The hospital experience and
seizure control. Neurology 1981; 31:912–915.
17. Chang B. S., Ives J. R., Schomer D. L., Drislane F. W. Outpatient EEG monitoring
in the presurgical evaluation of patients with refractory temporal lobe epilepsy.
J. Clin. Neurophysiol. 2002; 19:152–156.
18. Rose A. B., McCabe P. H., Gilliam F. G., Smith B. J., Boggs J. G., Ficker D. M.,
Moore J. L., Passaro E. A., Bazil C. W. Occurrence of seizure clusters and status
epilepticus during inpatient video-EEG monitoring. Neurology 2003;
60:975–978.
19. Malow B. A., Blaxton T. A., Shertz B., Theodore W. H. Carbamazepine withdrawal:
Effects of taper rate on seizure frequency. Neurology 1993; 43:2280–2284.
20. Shihabuddin B., Abou-Khalil B., Fakhoury T. The value of combined ambulatory
cassette-EEG and video monitoring in the differential diagnosis of intractable
seizures. Clin. Neurophysiol. 1999; 110:1452–1457.
21. Ives J. R., Gloor P. Update: chronic sphenoidal electrodes. Electroenceph. Clin.
Neurophysiol. 1978; 44:789–790.


T E C H N I C A L A S P E C T S
28
T E C H N I C A L 1
A Typical Screen or Printed Pageof Ambulatory EEG RecordingThis page demonstrates the typical set of labels, annotations, and data that
accompany a single screen or printed page of ambulatory EEG recording.
Specifics vary depending on the recording equipment vendor and display
software.


30
T E C H N I C A L 2
Left Temporal Seizure: No Filter UsedThis excerpt, which represents the beginning of a left temporally
predominant seizure, is shown with no filtering. The upper bandwidth of
this system is approximately 100 Hz based on the 200-Hz sampling frequency
of the data acquisition.
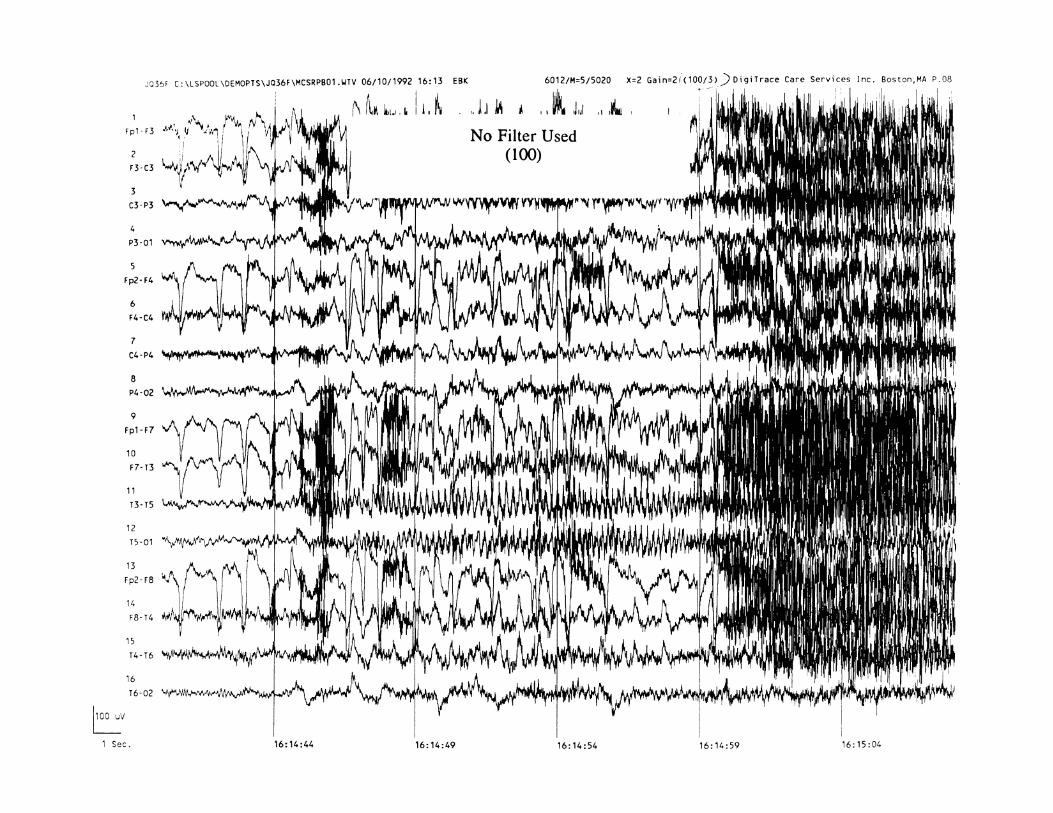
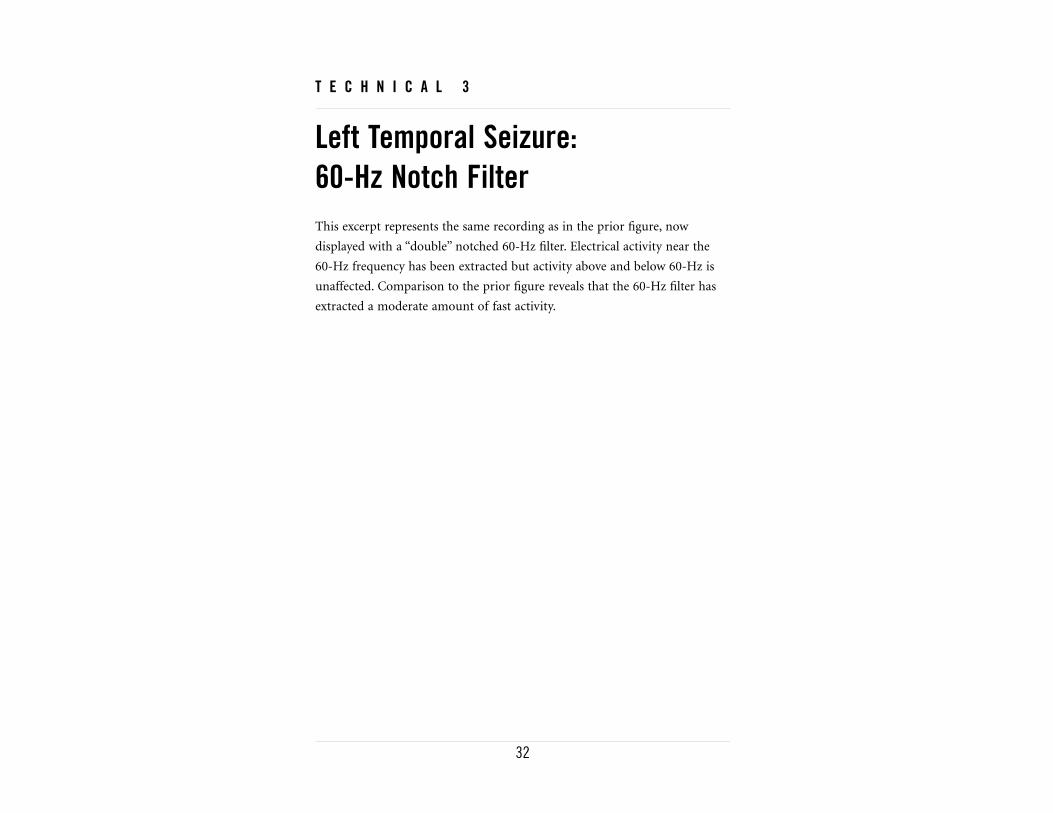
32
T E C H N I C A L 3
Left Temporal Seizure: 60-Hz Notch FilterThis excerpt represents the same recording as in the prior figure, now
displayed with a “double” notched 60-Hz filter. Electrical activity near the
60-Hz frequency has been extracted but activity above and below 60-Hz is
unaffected. Comparison to the prior figure reveals that the 60-Hz filter has
extracted a moderate amount of fast activity.
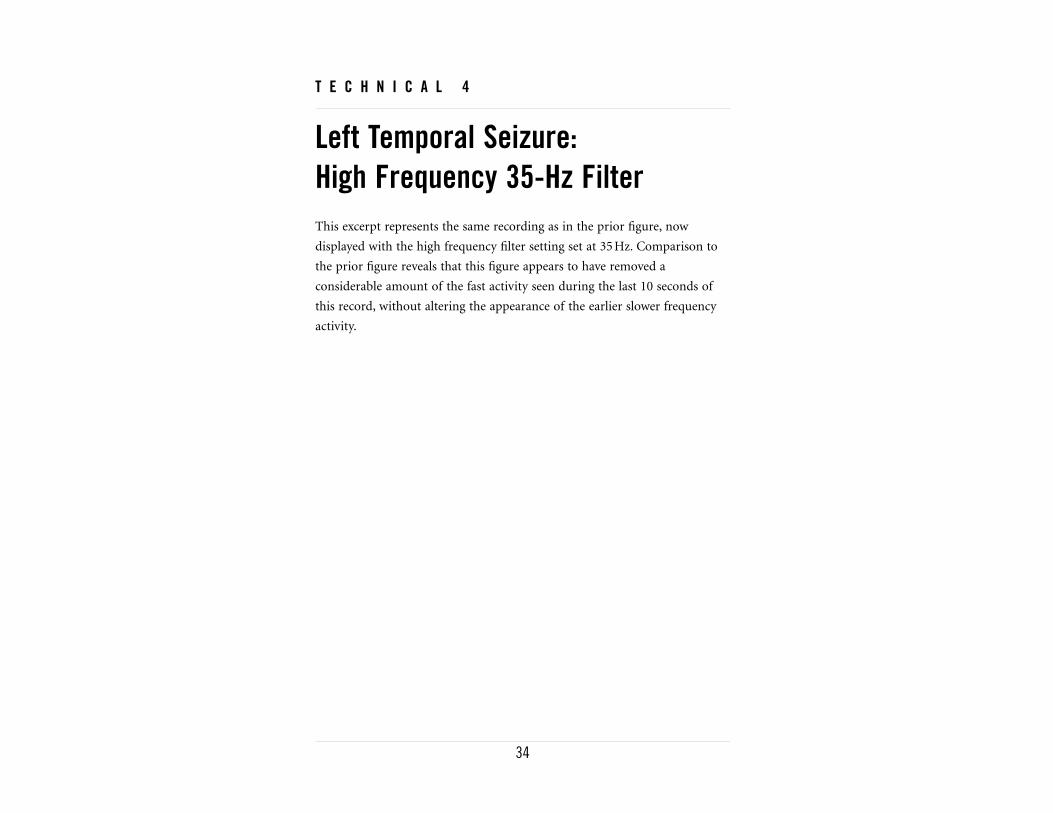
34
T E C H N I C A L 4
Left Temporal Seizure: High Frequency 35-Hz FilterThis excerpt represents the same recording as in the prior figure, now
displayed with the high frequency filter setting set at 35 Hz. Comparison to
the prior figure reveals that this figure appears to have removed a
considerable amount of the fast activity seen during the last 10 seconds of
this record, without altering the appearance of the earlier slower frequency
activity.

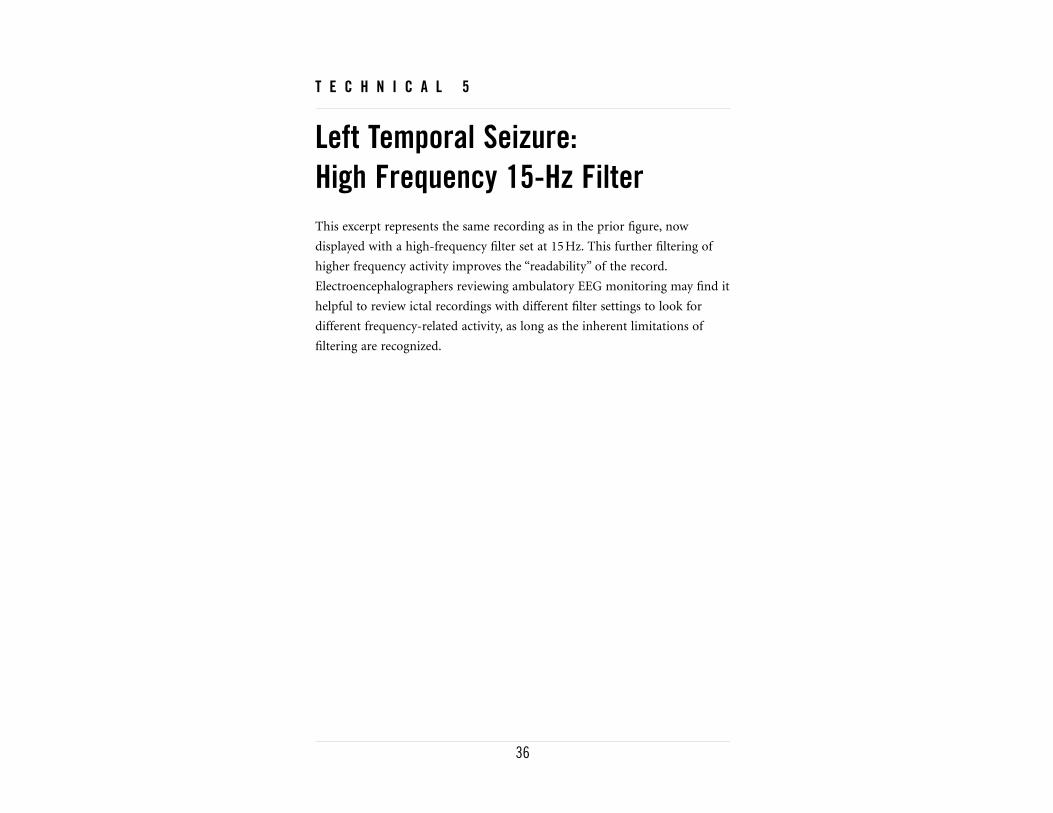
36
T E C H N I C A L 5
Left Temporal Seizure: High Frequency 15-Hz FilterThis excerpt represents the same recording as in the prior figure, now
displayed with a high-frequency filter set at 15 Hz. This further filtering of
higher frequency activity improves the “readability” of the record.
Electroencephalographers reviewing ambulatory EEG monitoring may find it
helpful to review ictal recordings with different filter settings to look for
different frequency-related activity, as long as the inherent limitations of
filtering are recognized.

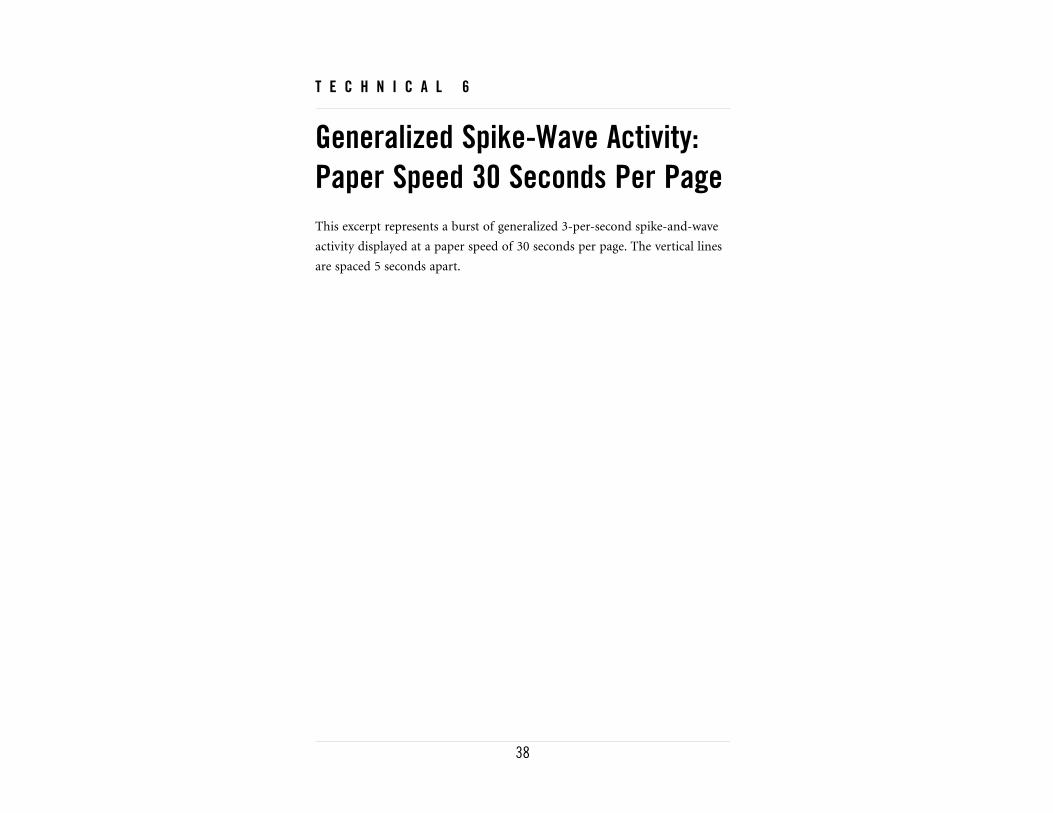
38
T E C H N I C A L 6
Generalized Spike-Wave Activity:Paper Speed 30 Seconds Per PageThis excerpt represents a burst of generalized 3-per-second spike-and-wave
activity displayed at a paper speed of 30 seconds per page. The vertical lines
are spaced 5 seconds apart.
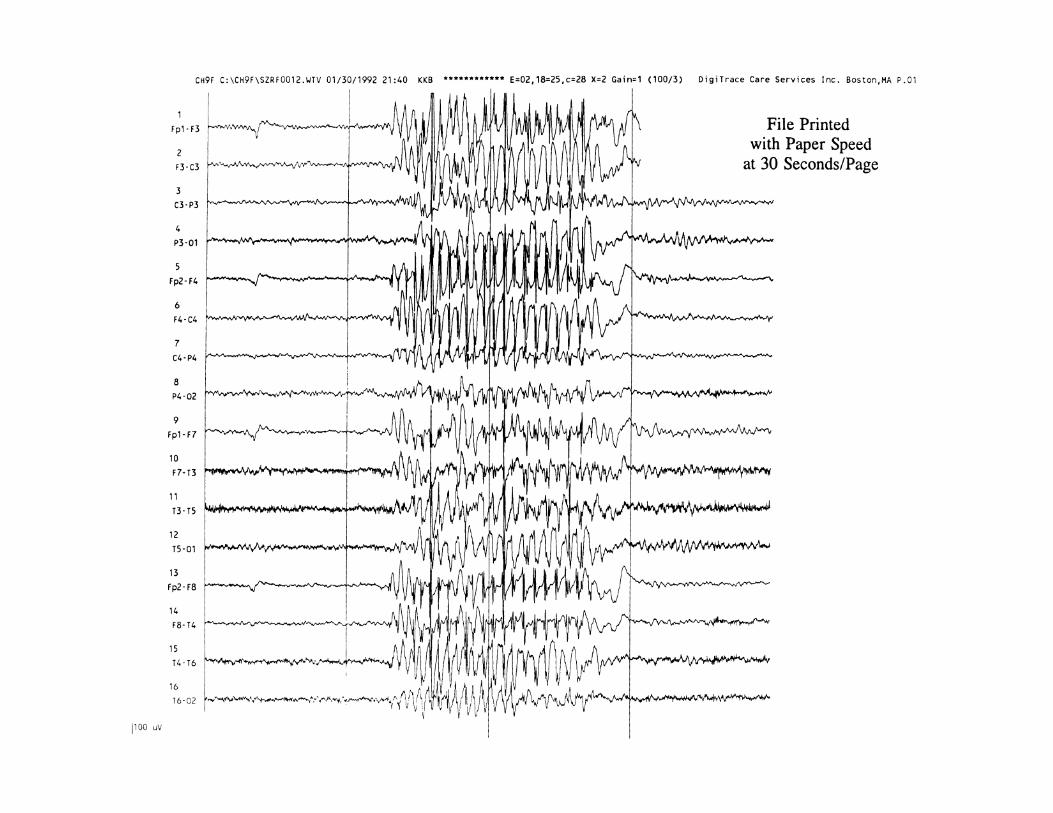

40
T E C H N I C A L 7
Generalized Spike-Wave Activity:Paper Speed 15 Seconds Per PageThis excerpt represents the same recording as in the prior figure, now
displayed with a paper speed of 15 seconds per page. The vertical lines are
spaced 5 seconds apart.
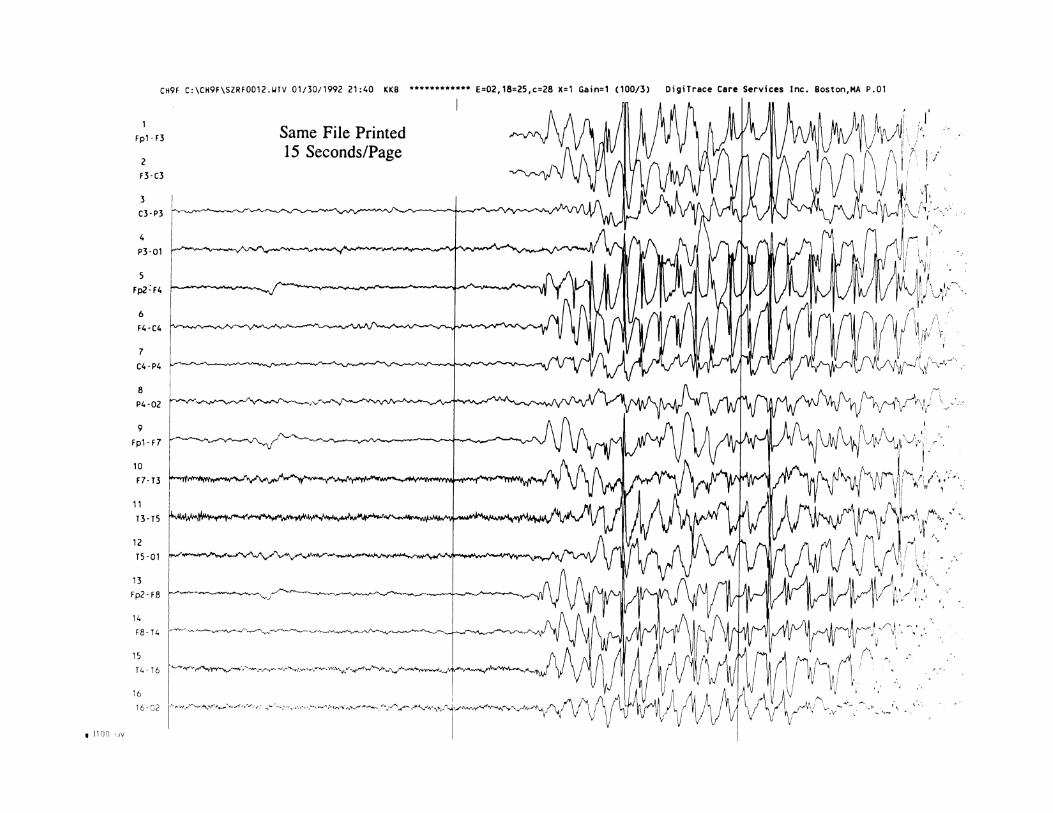

42
T E C H N I C A L 8
Generalized Spike-Wave Activity:Gain = 2This excerpt represents the same recording as in the prior figure, now
displayed with a gain of 2. The scale in the lower left corner indicates the
height of 100 microvolt activity.


44
T E C H N I C A L 9
Generalized Spike-Wave Activity:Gain = 1This excerpt represents the same recording as in the prior figure, now
displayed with a gain of 1. Comparison to the prior figure reveals that the
height of 100 microvolt activity is half that seen in the prior figure,
according to the scale in the lower left corner.


N O R M A L S L E E P M O R P H O L O G I E S
48
N O R M A L S L E E P 1
Sleep SpindlesThe electroencephalographer reviewing ambulatory EEG recordings must
become familiar with standard sleep morphologies and their appearance on
ambulatory EEG. In this excerpt, a symmetric sleep spindle is seen at
22:02:54.


50
N O R M A L S L E E P 2
K-Complexes and Sleep SpindlesRecorded by Spike DetectionAlgorithmSpike detection algorithms, which are often programmed to capture files
during the nighttime hours, can be triggered by normal sleep morphologies,
including the K-complexes and sleep spindles seen here.


52
N O R M A L S L E E P 3
Rapid Eye Movement of SleepRapid eye movements during sleep, such as the horizontal movements seen
at 18:48:23 and 18:48:30 in this excerpt, can lead to artifact on ambulatory
EEG recordings that might mimic frontal or anterior temporal cerebral
potentials.
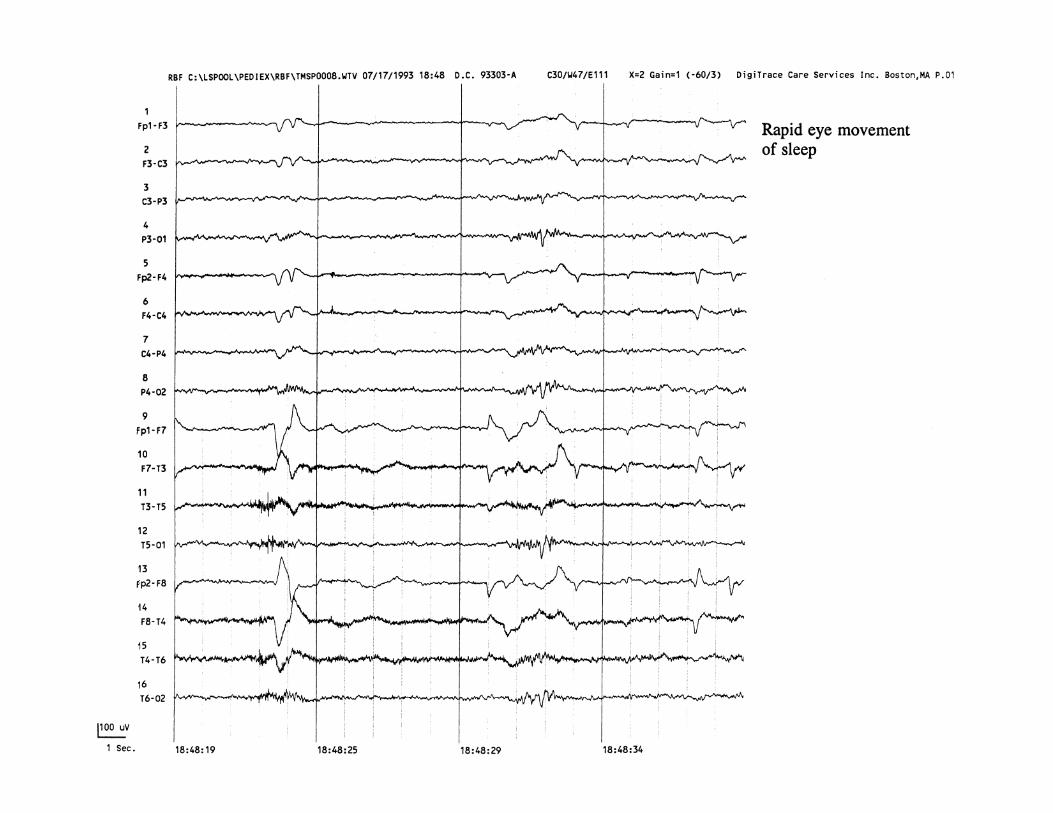


A M B U L A T O R Y A R T I F A C T S

56
A R T I F A C T S 1
Horizontal Eye Movement and Blink ArtifactsTwo types of eye movement artifact are seen. Channel 8 is designated as an
eye monitor channel and records from electrodes placed over the right and
left lateral epicanthal sites. A horizontal eye movement at about 16:49:56 is
seen in both channel 4 (T1–T2) and in channel 8 (eye monitor). Blink
artifacts, noted repeatedly from 16:49:57 to 16:50:04, are well-seen in the
frontal channels but not in channel 8.


58
A R T I F A C T S 2
Eye-Blink ArtifactRepetitive eye blinking is seen best in the frontal channels throughout this
excerpt.
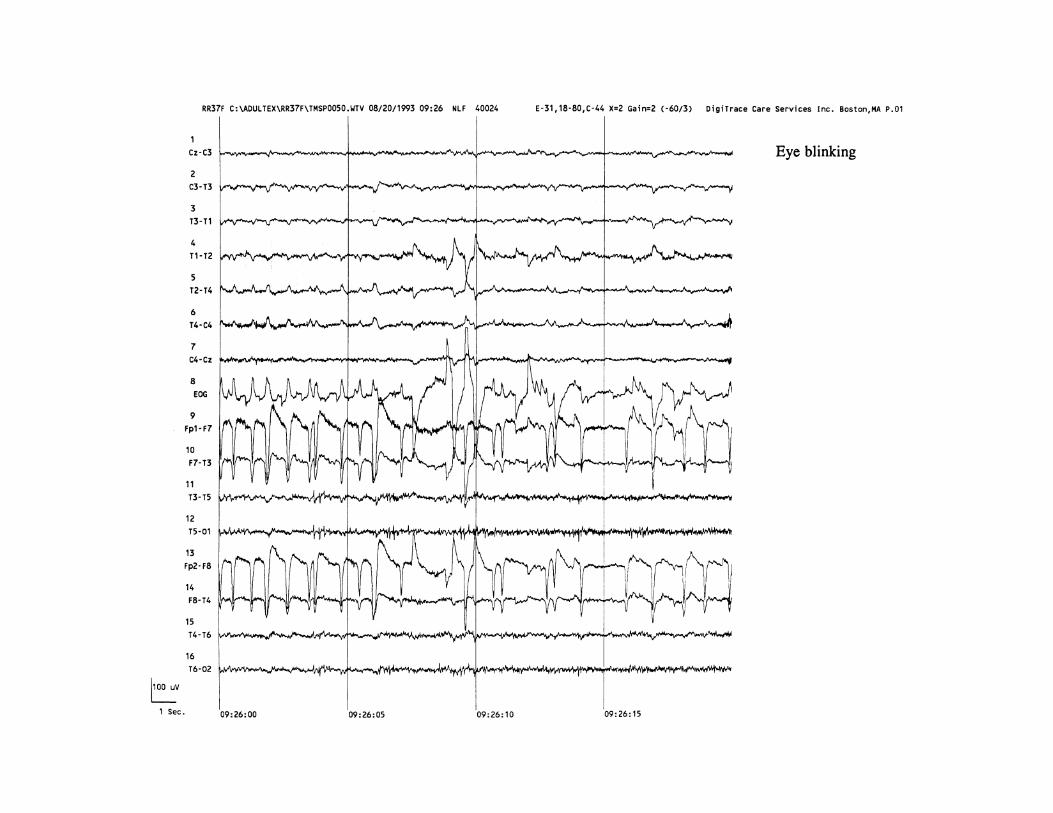

60
A R T I F A C T S 3
Eye Flutter Artifact Recorded bySeizure Detection AlgorithmRhythmic eye flutter can occur at quite high frequencies, in this case 5–8 Hz,
and trigger automated seizure detection algorithms. Here, the algorithm
captured an episode of eye flutter beginning at 19:27:02. In the absence of
video, eye flutter artifact can be distinguished from ictal events in a number
of electrographic ways, including the lack of evolution in frequency or
amplitude over time.
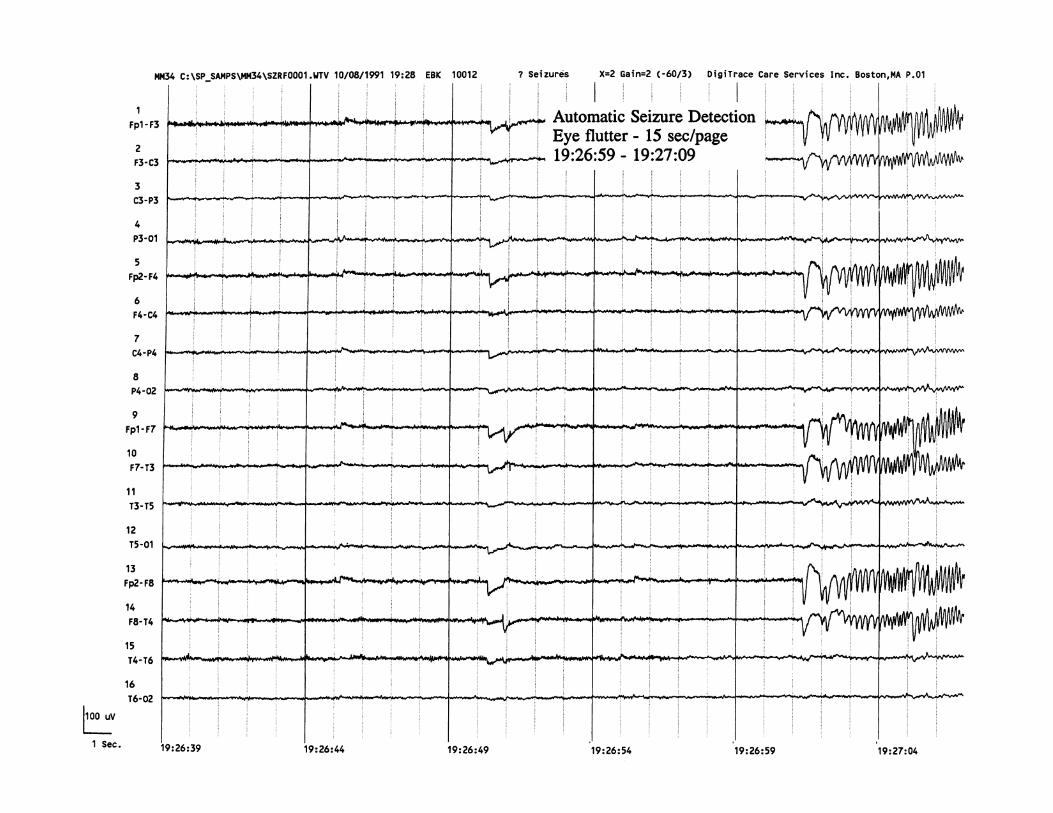
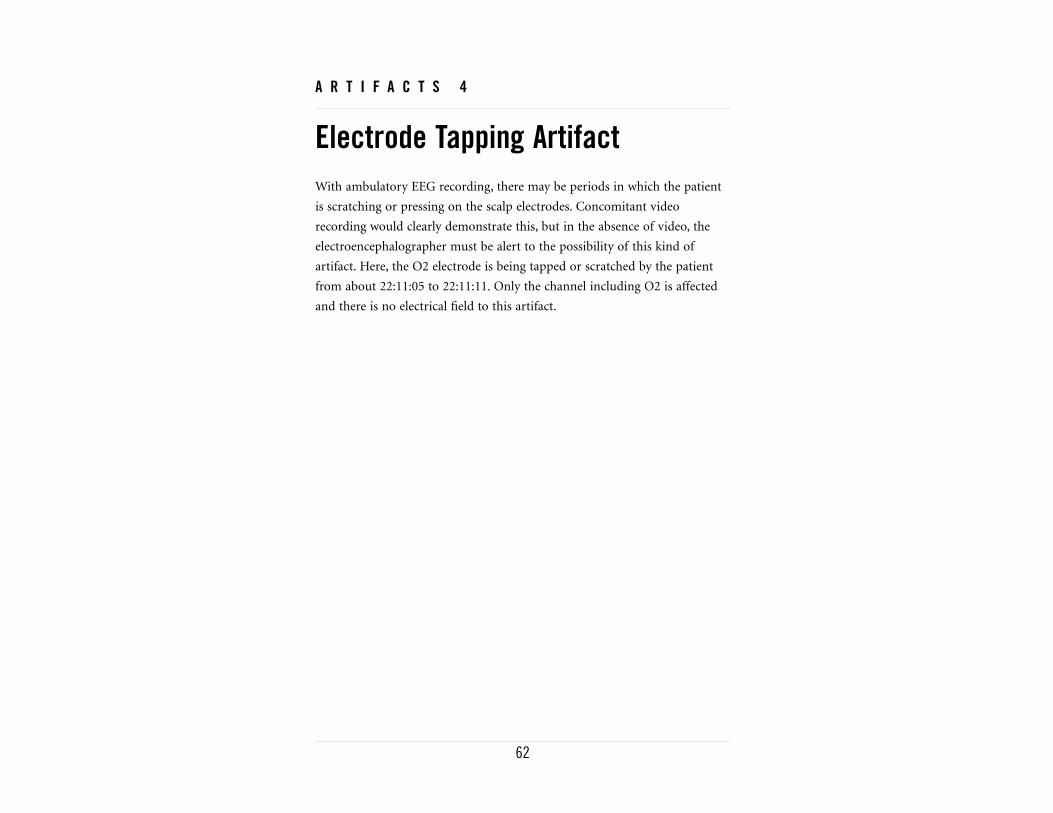
62
A R T I F A C T S 4
Electrode Tapping ArtifactWith ambulatory EEG recording, there may be periods in which the patient
is scratching or pressing on the scalp electrodes. Concomitant video
recording would clearly demonstrate this, but in the absence of video, the
electroencephalographer must be alert to the possibility of this kind of
artifact. Here, the O2 electrode is being tapped or scratched by the patient
from about 22:11:05 to 22:11:11. Only the channel including O2 is affected
and there is no electrical field to this artifact.


64
A R T I F A C T S 5
Jaw-Clenching ArtifactPeriods of jaw clenching and biting during ambulatory EEG recording can
be associated with artifact. This activity is often most prominent over the
temporal regions, presumably due to temporalis or masseter muscle
contraction. In the absence of video recording, it is useful to ask patients to
refrain from chewing gum and to record the timing of meals. Here, such
artifact is seen from 11:44:10 through the end of the excerpt and appears
most prominently over the right temporal region.


66
A R T I F A C T S 6
Chewing ArtifactChewing artifact can often have rhythmic features and at times may
resemble ictal activity. Here, artifact begins at 21:59:35 and is characterized
by the rhythmic appearance of muscle artifact centered mostly over the
temporal regions bilaterally.

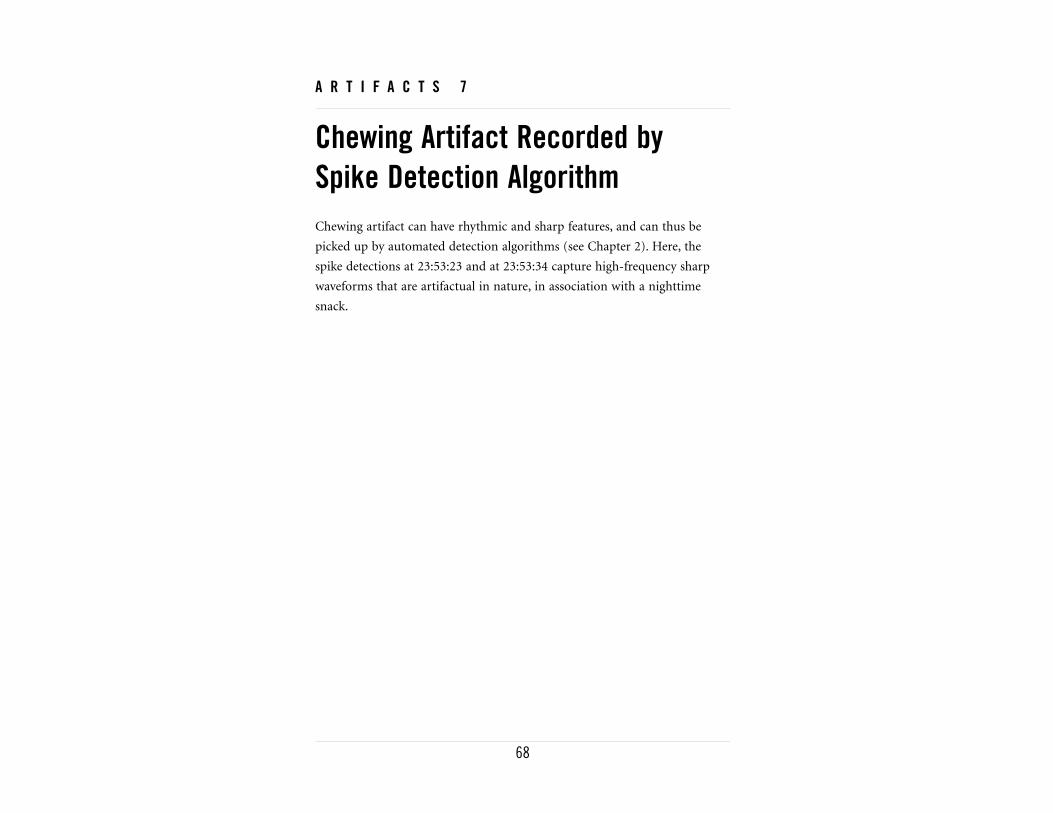
68
A R T I F A C T S 7
Chewing Artifact Recorded bySpike Detection AlgorithmChewing artifact can have rhythmic and sharp features, and can thus be
picked up by automated detection algorithms (see Chapter 2). Here, the
spike detections at 23:53:23 and at 23:53:34 capture high-frequency sharp
waveforms that are artifactual in nature, in association with a nighttime
snack.


70
A R T I F A C T S 8
Dry Electrode ArtifactOne disadvantage of ambulatory EEG monitoring is the inability of
technologists to check on recording quality frequently in real time and to
respond with appropriate technical adjustments as needed throughout the
day, as would typically occur in an inpatient monitoring unit. Here, a dry
electrode at F8 causes an artifact seen throughout this excerpt.


72
A R T I F A C T S 9
Forehead Rubbing ArtifactAs with many other patient movement artifacts, rhythmic rubbing artifact
can be a potentially confusing finding on ambulatory EEG monitoring,
particularly in the absence of concomitant video recording. Here, rhythmic
rubbing of the forehead produces an artifact in the anterior channels,
extending from the beginning of this excerpt through 20:50:16.
Differentiation of such artifact from an ictal event, based on the lack of
evolution of the artifact in frequency or amplitude, is critical.
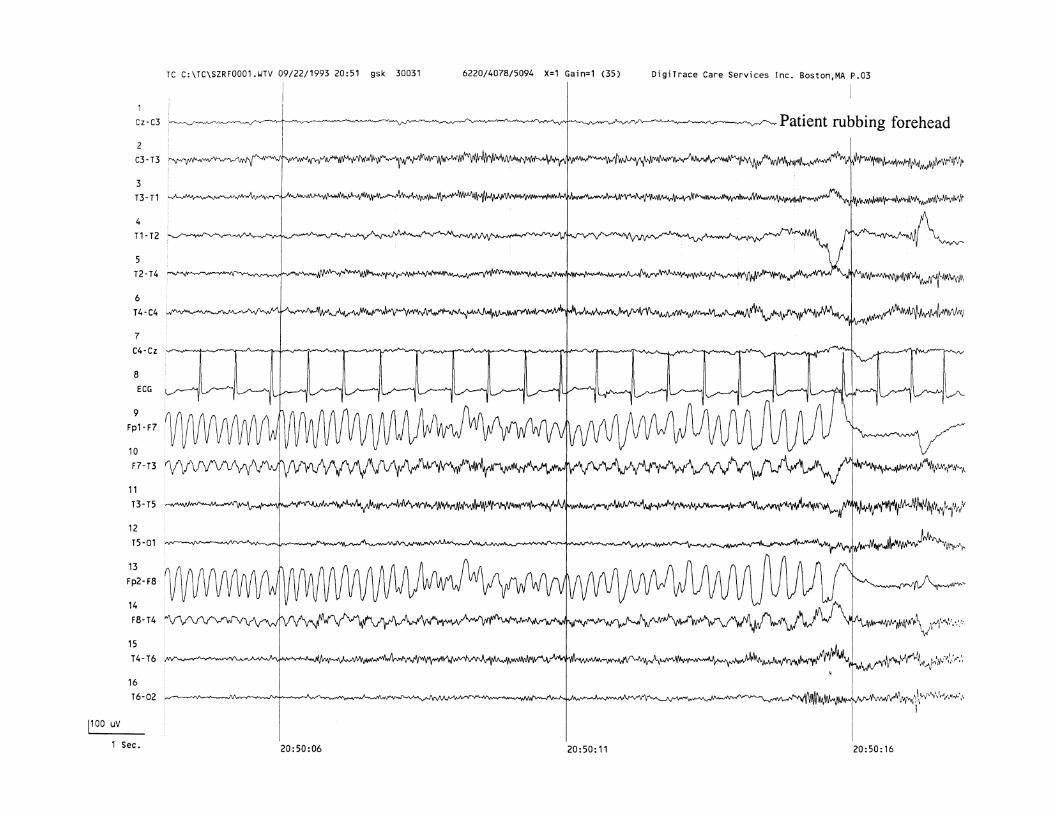

74
A R T I F A C T S 1 0
Pulse ArtifactPulse artifact is caused by the rhythmic movement of scalp electrodes,
usually over the temporal regions, by the pulsations of blood through vessels
close to the skin, such as the superficial temporal artery. It is to be
distinguished from the more common electrocardiographic (EKG) artifact in
that pulse artifact is typically not as sharply contoured, resembles a slow
wave, and follows the QRS complex rather than being simultaneous to it.
Here, pulse artifact is seen in channels 9 and 10 over the left temporal region
throughout this entire excerpt.
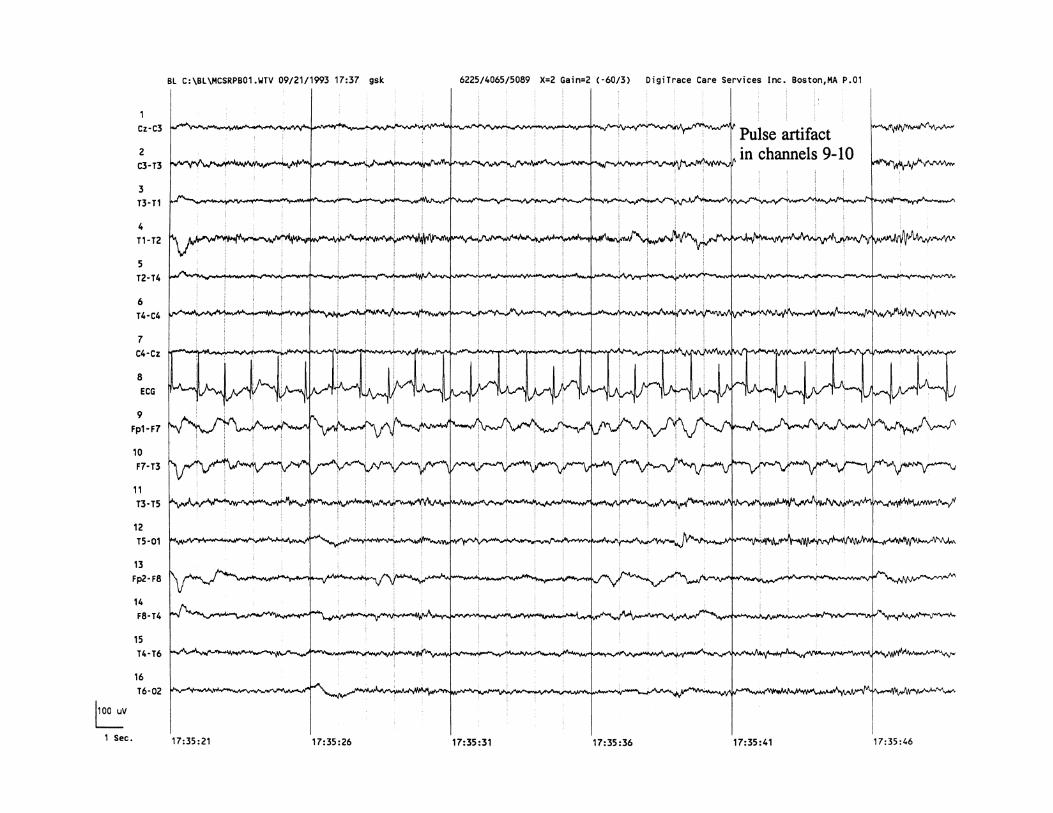


A B N O R M A L E P I L E P T I F O R M A C T I V I T Y

78
E P I L E P T I F O R M 1
Focal Mesial Temporal Spikes Recorded by SpikeDetection AlgorithmSix separate files captured by the spike detection algorithm demonstrate
focal spikes with phase reversal at the right sphenoidal electrode (Sp2). With
scalp electrodes only, the epileptiform discharges would have been far less
obvious (see channels 13 and 14).

80
E P I L E P T I F O R M 2
Focal Anterior Temporal Spikes Recorded by SpikeDetection AlgorithmMultiple spikes are captured in these files, phase-reversing at the T1 and F7
electrodes. All of these epileptiform discharges were seen during sleep and
had not been present on a routine EEG recording.

82
E P I L E P T I F O R M 3
Bifrontal Spike-Wave Complexes Recorded by SpikeDetection AlgorithmIn this excerpt, frequent bifrontal spike-wave discharges are captured by the
spike detection algorithm, with several files recorded here within just a few
minutes’ time.


84
E P I L E P T I F O R M 4
Rolandic SpikesIn this excerpt, several independent bilateral centrotemporal (Rolandic)
spikes can be seen phase-reversing at the C3 and C4 electrodes. In the same
channels, a sleep spindle is seen beginning at 04:25:08.

86
E P I L E P T I F O R M 5
3-Per-Second Spike-and-WaveActivity Recorded by SpikeDetection AlgorithmThe third and fourth files on this page demonstrate generalized spike-and-
slow-wave activity recurring at about a 3-per-second frequency.

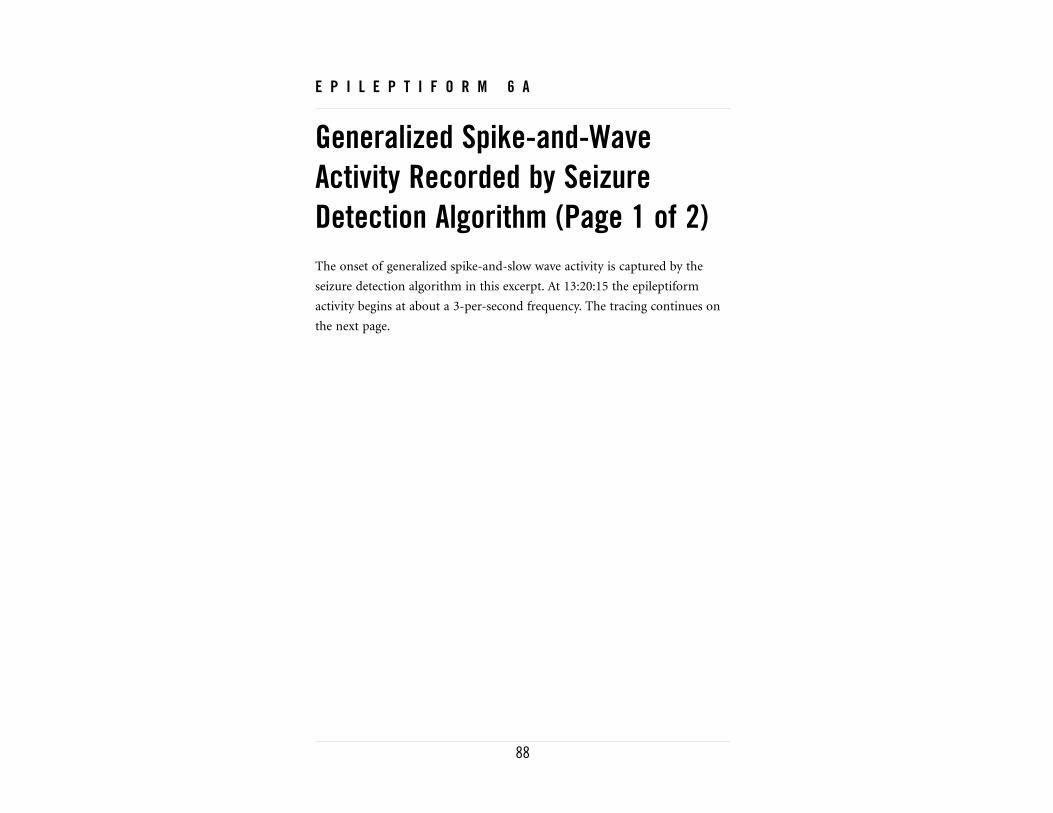
88
E P I L E P T I F O R M 6 A
Generalized Spike-and-WaveActivity Recorded by SeizureDetection Algorithm (Page 1 of 2)The onset of generalized spike-and-slow wave activity is captured by the
seizure detection algorithm in this excerpt. At 13:20:15 the epileptiform
activity begins at about a 3-per-second frequency. The tracing continues on
the next page.


90
E P I L E P T I F O R M 6 B
Generalized Spike-and-WaveActivity Recorded by SeizureDetection Algorithm (Page 2 of 2)Generalized epileptiform activity continues in this excerpt, with a gradual
diminution of activity over 2 seconds (13:20:27 to 13:20:29) before some
background disorganization and slowing are seen postictally. The total dura-
tion of the epileptiform activity is about 15 seconds.


92
E P I L E P T I F O R M 7
Brief Generalized Spike-and-WaveActivity Recorded by SeizureDetection AlgorithmAn 8-second period of epileptiform activity was captured by the seizure
detection algorithm. At onset (21:39:46), the activity appears frontocentral in
localization but quickly spreads over 1 to 2 seconds to become more general-
ized in distribution. The 2.5- to 3-per-second activity, which includes some
polyspike discharges, terminates fairly abruptly at 21:39:54.
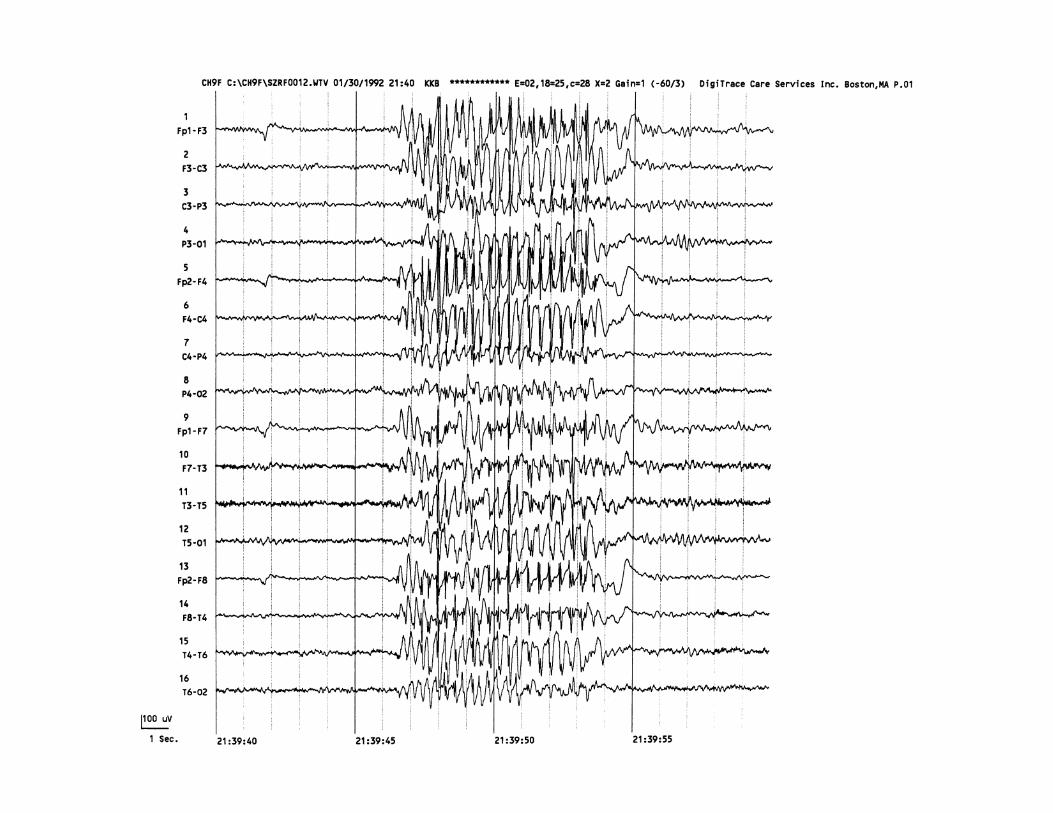

94
E P I L E P T I F O R M 8 A
Left Frontotemporal SeizureRecorded by Pushbutton Activation(Page 1 of 2)This seizure was recorded after the patient activated the waist-worn event
button to indicate the occurrence of typical symptoms. The onset of this
seizure is at about 8:49:22, with low-voltage fast activity seen broadly across
the left frontotemporal region (in channels 2–4 and 9–11). The tracing con-
tinues on the next page.


96
E P I L E P T I F O R M 8 B
Left Frontotemporal SeizureRecorded by Pushbutton Activation(Page 2 of 2)The focal epileptiform activity that began on the previous page evolves here
to include rhythmic higher voltage sharp activity initially occurring at a
3-per-second frequency, tapering down to 1 per second, and eventually ter-
minating at about 08:49:51. The artifact created by the pushbutton activation
is present at 08:49:42.
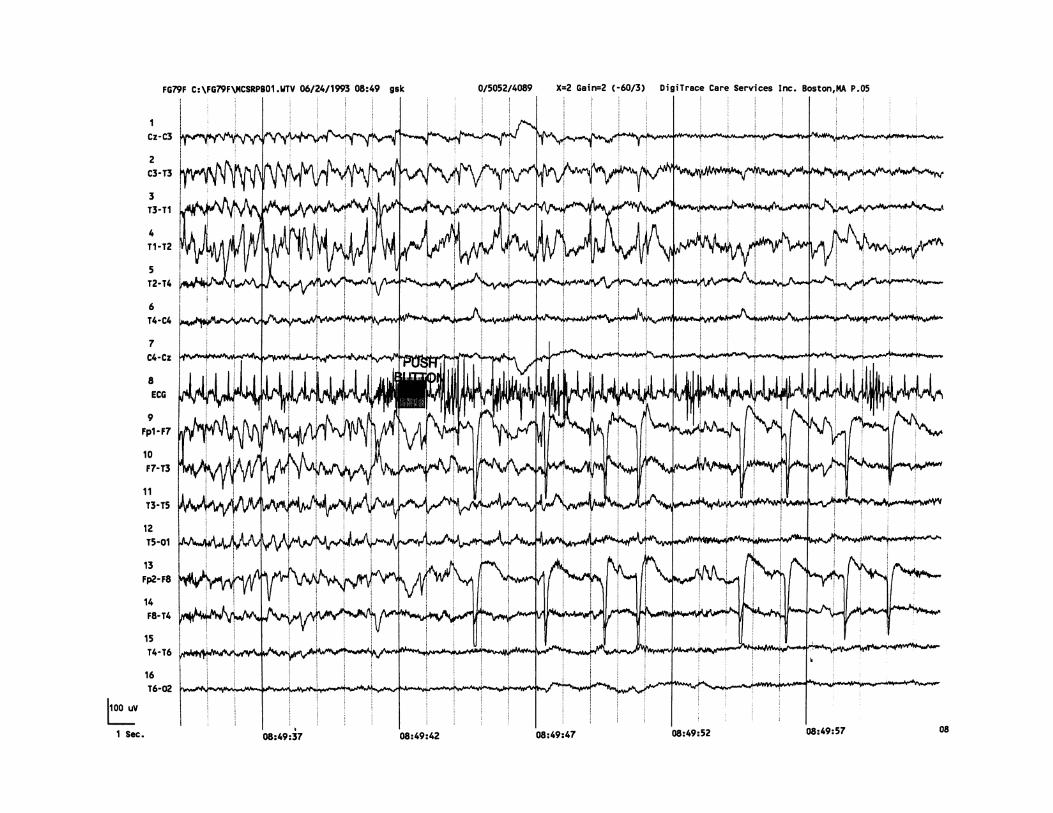
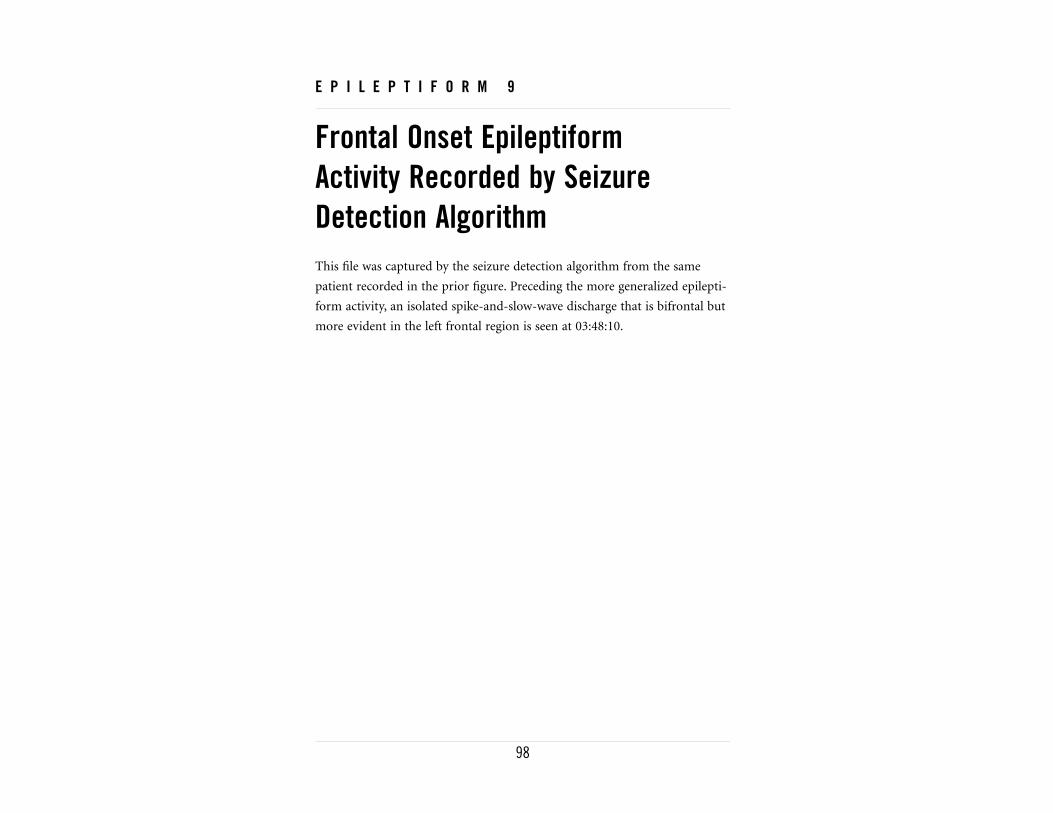
98
E P I L E P T I F O R M 9
Frontal Onset Epileptiform Activity Recorded by SeizureDetection AlgorithmThis file was captured by the seizure detection algorithm from the same
patient recorded in the prior figure. Preceding the more generalized epilepti-
form activity, an isolated spike-and-slow-wave discharge that is bifrontal but
more evident in the left frontal region is seen at 03:48:10.


100
E P I L E P T I F O R M 1 0 A
Right Mesial Temporal SeizureRecorded by Pushbutton Activation(Page 1 of 2)A clinically symptomatic event prompted the pushbutton activation at
17:30:16 on this two-page excerpt. About 6 seconds prior, rhythmic theta-
frequency activity begins in the right temporal region, phase-reversing at the
right sphenoidal electrode (Sp2). This activity evolves over the next 5 to 10
seconds and becomes obscured by muscle artifact. The tracing continues on
the next page.
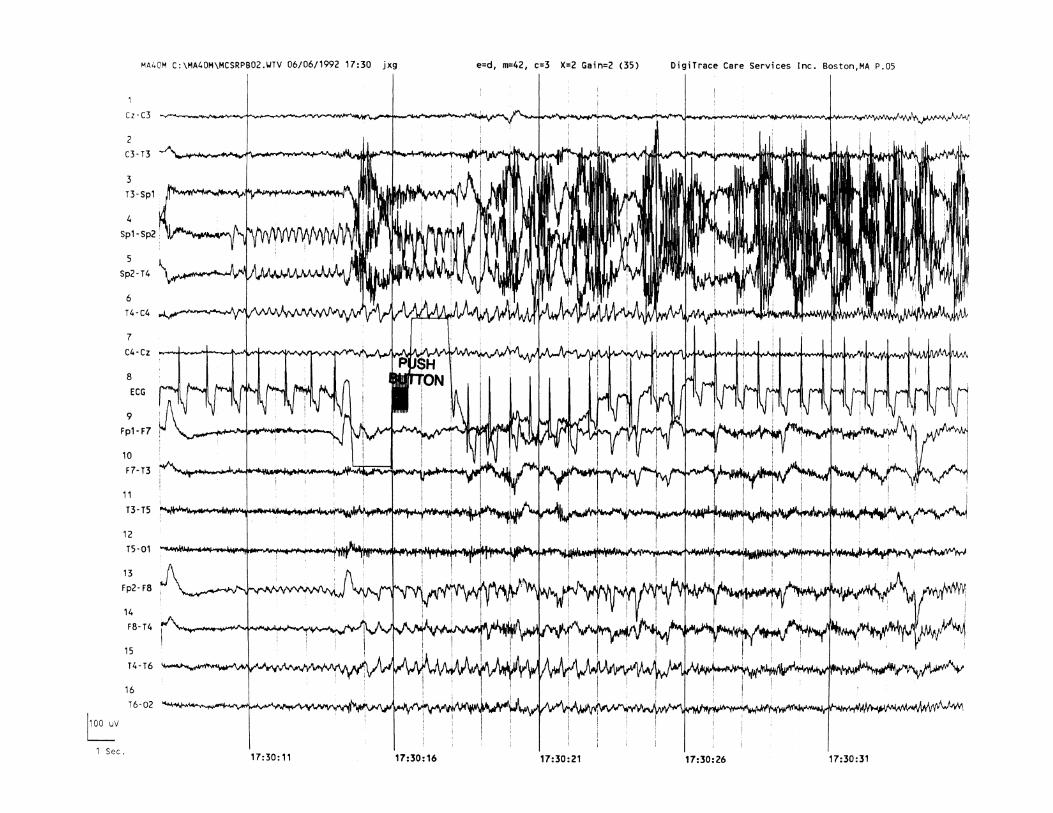

102
E P I L E P T I F O R M 1 0 B
Right Mesial Temporal SeizureRecorded by Pushbutton Activation(Page 2 of 2)As the seizure beginning on the previous page progresses further, spread of
the epileptiform activity to the left temporal and central regions becomes
apparent by 17:30:37.
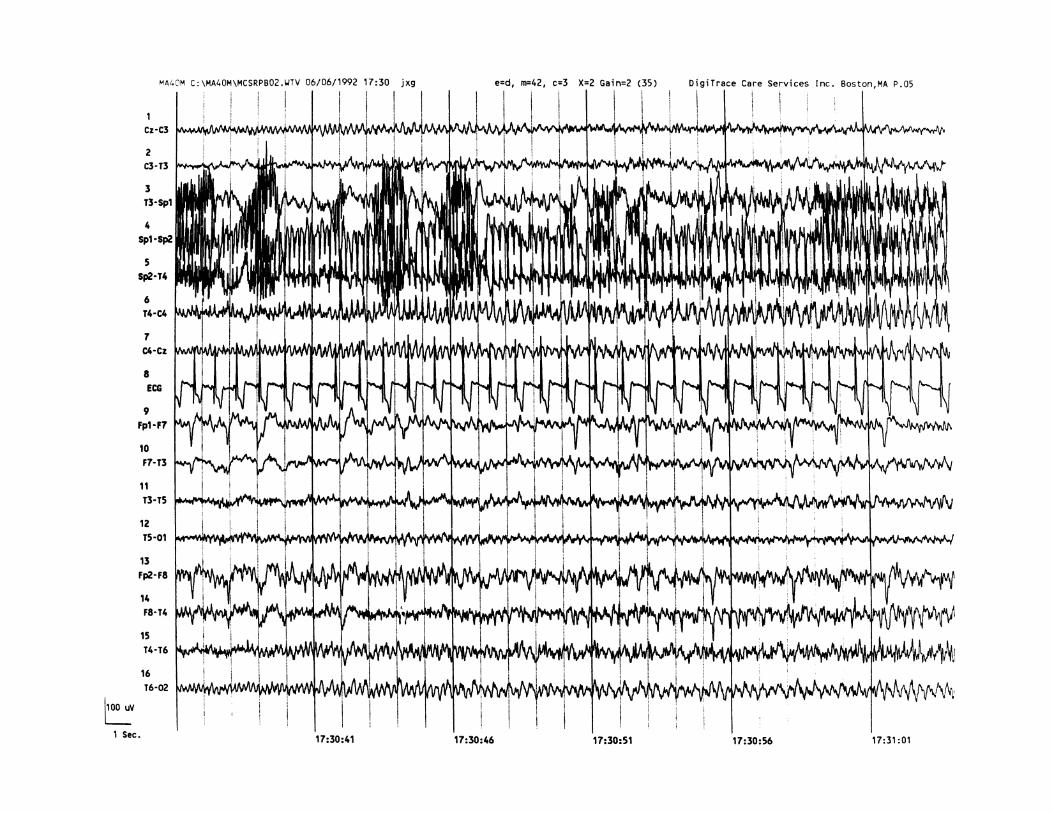

104
E P I L E P T I F O R M 1 1
Frontal Seizure Recorded byPushbutton ActivationThe pushbutton activation is noted at 19:51:41. About 2 seconds prior,
rhythmic delta-frequency activity in bilateral frontal regions is seen, with a
progression to sharp-and-slow-wave complexes with 2- to 2.5-per-second
frequency over both frontocentral regions. Courtesy Edward H. Kovnar, MD.
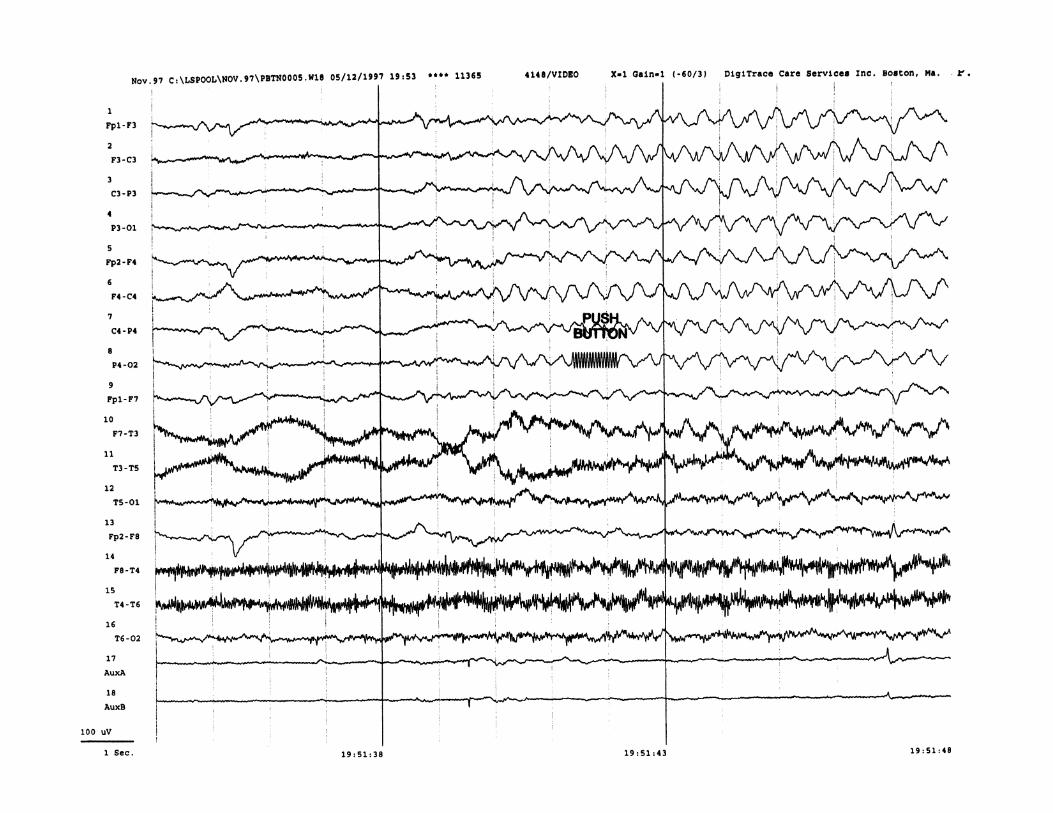


jaw-clenching, 64–65
pulse, 74–75
Auditory analysis, and continuous EEG, 5
B
Background electroencephalography rhythms, from
routine EEG, 4
Bifrontal spike-wave complexes, by spike detection
algorithm, 82–83
C
Cardiac arrhythmias, 20
Catamenial seizure disorders, 20
Chewing artifact
monitoring example, 66–67
by spike detection algorithm, 68–69
Computers
in EEG monitoring, 23–24
in event type ambulatory cassette recording,
6
Continuous ambulatory electroencephalography
cassette recording, 5–6
D
Dry electrode artifact, 70–71
107
E
ECG, see Electrocardiogram (ECG) monitoring
EEG, see Ambulatory electroencephalography (EEG)
overview
Electrocardiogram (ECG) monitoring, 5
Electrodes, and EEG monitoring, 24
Electrode tapping artifact, 62–63
Electrographic seizures, event monitoring, 21
Electromyography (EMG) monitoring
and seizure detection algorithms, 15
and spike detection algorithms, 13
EMG, see Electromyography (EMG) monitoring
Epileptic seizures, see also Seizures
EEG monitoring, 17–18
frequency assessment, 19
seizure localization, 19
seizure types, 18–19
syndromes, 18–19
Epileptiform activity, from routine EEG, 4
Event monitoring, via EEG, 20–21
Event type ambulatory electroencephalography cassette
recording, 6–7
Eye-blink artifact
basic, 56–57
repetitive, 58–59
Index
A
Ambulatory electroencephalography (EEG) overview
clinical applications, 7–8
continuous recording type, 5–6
EEG history, 3
epilepsy diagnosis, 17–19
events, 20–21
event type recording, 6–7
left temporal seizure examples, 30–37
long-term type, 4
miscellaneous uses, 20
practical and technical considerations,
23–24
typical screen, 28–29
Anticonvulsant medication, and ambulatory
monitoring, 22
Artifacts
blink, 56–59
chewing, 66–69
dry electrode, 70–71
electrode tapping, 62–63
eye flutter, 60–61
eye movement, 56–57
forehead rubbing, 72–73
horizontal eye movement, 56–57
Eye flutter artifact, 60–61
Eye movement artifact, 56–57
F
Filtering techniques
in event type ambulatory cassette recording,
6–7
left temporal seizure, 32–37
FLAIR, see Fluid attenuated inversion recovery
sequences (FLAIR)
Fluid attenuated inversion recovery sequences (FLAIR),
19
Focal anterior temporal spikes, 80–81
Focal mesial temporal spikes, 78–79
Forehead rubbing artifact, 72–73
Frontal onset epileptiform activity, 98–99
Frontal seizure, by pushbutton activation, 104–105
G
Gotman/Gloor spike detection algorithm, 12
Gotman seizure detection algorithm, 14
H
Horizontal eye movement artifact, 56–57
I
Ictal single photon emission computerized tomography
(Ictal SPECT)
with EEG for seizures, 19
inpatient monitoring, 23
Ink-jet electroencephalography machine, 5
Inpatient monitoring, 21–22
J
Jaw-clenching artifact, 64–65
108 Index
Pushbutton activation
frontal seizure, 104–105
left frontotemporal seizure, 94–97
right mesial temporal seizure, 100–103
R
Rapid eye movement, during sleep, 52–53
Reflex-related seizure disorders, 20
Right mesial temporal seizure, by pushbutton activation,
100–103
Rolandic spikes, 84–85
S
SE, see Status epilepticus (SE)
Seizure detection algorithms
for brief generalized spike-and-wave activity, 92–93
characteristics, 14–15
detection overview, 14
for eye flutter artifact, 60–61
for frontal onset epileptiform activity, 98–99
for generalized spike-and-wave activity, 88–91
overview, 11–12
Seizures, see also Epileptic seizures
catamenial disorders, 20
electrographic seizures, 21
event monitoring, 20–21
frontal, 104–105
left frontotemporal, 94–97
left temporal, 30–37
onset localization, 19, 23
psychogenic nonepileptic, 18
reflex-related seizure disorders, 20
right mesial temporal, 100–103
subclinical, 19, 21
temporal, 30–37, 94–97, 100–103
K
K-Complexes, by spike detection algorithm, 50–51
L
Left frontotemporal seizure, by pushbutton activation,
94–97
Left temporal seizure
high frequency 15-Hz filter, 36–37
high frequency 35-Hz filter, 34–35
no filter, 30–31
60-Hz notch filter, 32–33
Long-term ambulatory EEG monitoring (LTAM), 4
LTAM, see Long-term ambulatory EEG monitoring
(LTAM)
M
Magnetic resonance imaging (MRI), 19
Magnetic resonance spectroscopy (MRS), 19
MRI, see Magnetic resonance imaging (MRI)
MRS, see Magnetic resonance spectroscopy (MRS)
N
NCSE, see Nonconvulsive status epilepticus (NCSE)
Nonconvulsive status epilepticus (NCSE), 19
P
Pattern recognition, in spike detection algorithms,
12
Peri-ictal behavior, and EEG, 4
PET, see Positron emission tomography (PET)
PNES, see Psychogenic nonepileptic seizures (PNES)
Positron emission tomography (PET), 19
Postictal period, seizure monitoring, 19
Psychogenic nonepileptic seizures (PNES), 18
Pulse artifact, 74–75

Index 109
Single photon emission computerized tomography
(SPECT), 19
Sleep
disorders, 20
montages, 7
rapid eye movement recordings, 52–53
Sleep spindles
by spike detection algorithm, 50–51
symmetric, 48–49
SPECT, see Single photon emission computerized
tomography (SPECT)
Spike detection algorithm
for bifrontal spike-wave complexes, 82–83
characteristics, 12–13
for chewing artifact, 68–69
detection overview, 12
for focal anterior temporal spikes, 80–81
for focal mesial temporal spikes, 78–79
for K-complexes, 50–51
overview, 11–12
T
Telemetry, 23
Temporal seizure
left, 30–37
left frontotemporal, 94–97
right mesial, 100–103
Temporal spikes
focal anterior, 80–81
focal mesial, 78–79
Time-scribe digital clock, in event type ambulatory
cassette recording, 7
V
Validation
seizure detection algorithms, 15
spike detection algorithms,
13–14
Video recording
and ambulatory monitoring, 22
in event monitoring, 20
for sleep spindles, 50–51
for 3-per-second spike-and-wave activity, 86–87
validation, 13–14
Spike-and-wave activity
by seizure detection algorithm, 88–93
by spike detection algorithm, 86–87
Spike-wave complexes
bifrontal, 82–83
continuous EEG monitoring, 5
15 seconds per page monitoring, 40–41
gain = 1, 44–45
gain = 2, 42–43
30 seconds per page monitoring, 38–39
Status epilepticus (SE)
and anticonvulsant medication reduction, 22
seizure monitoring, 19
Subclinical seizures
EEG monitoring, 19
event monitoring, 21
Symptomatic events, 20–21