Sperm quality in marine teleosts: applications to broodstock ...

10/3/2008
1
Atlantic Cod Genomics andAtlantic Cod Genomics andBroodstockBroodstock DevelopmentDevelopment
in Canadain Canada
Presented by: Ed TrippelPresented by: Ed TrippelProject CoProject Co--LeadLead
St. Andrews Biological StationSt. Andrews Biological StationFisheries and Oceans CanadaFisheries and Oceans Canada
Why farm cod?Decline in wild cod populations resulted in fisheries closures throughout
Atlantic Canada
To supply stability to established salmon aquaculture industry (speciesdiversification)
The Atlantic Cod Genomicsand Broodstock
Development Project
www.codgene.ca

10/3/2008
2
Breeding Program
Family production in NL,NB and NH
3 Industry partners NB,NH and NL
Cod aquacultureexpertise
Commercial traitevaluation
Large Scale Genomics
Identify & evaluate ESTs, SNPs,microsatellite markers
Cod genetic map Expression profiling (Cod microarray)Quantitative loci identification Candidate gene identification
Genetic Evaluation
Breeding values Total Merit Index (TMI)Marker Assisted
Selection
BROODSTOCK
improvedperformance
Develop a set of fundamental genomics tools Apply within selective breeding programs Supply the developing cod aquaculture industry in
Canada with improved broodstock
The Atlantic Cod Genomicsand Broodstock
Development Project
WildBroodstock
Family crosses
Group 1 families50 crosses
Reared separately totagging
Group 2 familiesAll pooled
Spawning
TRAIT ANALYSISGrowth
Age of sexualmaturation
SurvivalIncidence of deformities
Disease resistanceStress tolerance
Cortisol responseAcute and chronicthermal tolerance
Product quality andyield
Sea cage siteYear 1: Sea cage rearing
Year 2: Preliminary EvaluationYear 3: Harvest Evaluation
& Broodstock Selection
FAMILYDATABASE
StandardProtocol
Development
Microsat genotypingand relatedness
Cod Selective Breeding andTrait Analysis
Cod Selective Breeding andTrait Analysis
www.codgene.ca

10/3/2008
3
LocationsLocations
Breeding Program Sites
NL
NBNB
NH
Project Team
PROJECT
MANAGEMENTDavidson, Kocher, Gjoen, Danzmann
NB: WereNL: Rise, M.
GENOME ATLANTIC
Armstrong, King,
Deveaux
Marker development&
expression profiling
Bowman
Genetic evaluation
& MASGE3LS
Culver
Cod Health& physiology
Johnson Gamperl
GE3LS TEAM
Broodstockdevelopment NB
Trippel
Supporting Research and Technical
ScientificManagementTeamTHE ATLANTICGENOMECENTREPLATFORM (TAGC)
DNA sequencing, library construction, bioinformatics pipeline, etc.
Genomics NL
Rise, M.L.
PROJECT
MANAGEMENT
SCIENTIFIC ADVISORY BOARD
NL: Rise, M.
Armstrong, King,
DeveauxBowman, Trippel
Bowman Robinson
GE3LS
Culver
Cod Health& physiology
Johnson
GE3LS TEAM
Trippel
Supporting Research and Technical
PROJECT LEADERS
Project & Research ElementLeaders
DNA sequencing, library construction, bioinformatics pipeline,etc.
Broodstockdevelopment NL& Physiology
Rise, M.L.
PROJECT MANAGERS
THE ATLANTIC GENOME CENTRE (TAGC)SCIENTIFIC MANAGEMENT TEAM
STEERING COMMITTE
Bowman, Trippel, Robertson, Armstrong/King,
Industry Reps: Walsh, Powell

10/3/2008
4
Acute and Chronic Thermal ToleranceAcute and Chronic Thermal Tolerance
Up to ~2°C difference, 18% variation due to family Expression evaluation of several immune genes
Thermal Biology of Haemoglobin VariantsThermal Biology of Haemoglobin Variants
Sea cage performance ongoing Hb typing not related to thermal or hypoxia tolerance or
stress response (temperature challenge)
Variability in Cortisol Stress ResponseVariability in Cortisol Stress Response
‘High’ and ‘low’ responders Considerable variation between families
Generating Cod FamiliesGenerating Cod Families
Two geographic regions (NB/NH, NL) Significant phenotypic and genetic variation detected in early
rearing traits (e.g., high heritabilities for juvenile weight)
www.codgene.ca
Expressed sequence tags(160,000)
SNP identificationwithin EST clusters(3072 SNP markers)
Cod chipmicroarray
20,000 elements
QTL analysis
Genotyping (1056 fish)Illumina platform
Genetic map(1cM target)
Comparativegenomics
with fish/othervertebrates
Expression profilingGenes involved inimmune function &
stress response
Annotation of genesCodgene database
Gene and Genome AnalysisGene and Genome Analysis
4. Matching regions of the geneticmap with physical traits of interest
3. Building and using a codmicroarray to determine how cod
respond to stress and disease
1. DNA Sequencing
2. Marker identification andbuilding a genetic map for cod

10/3/2008
5
cDNA Library ConstructioncDNA Library Construction
21 normalized libraries, 19 SSH libraries 14 tissues 4 treatments & 4 developmental stages
DNA SequencingDNA Sequencing
>125,000 clones processed >150,000 sequences submitted to GenBank
Marker IdentificationMarker Identification
>200 microsatellite markers tested >4,000 high quality/frequent SNPs
Microarray DevelopmentMicroarray Development
Contributing clones to Norwegian cDNA microarray CGP microarray construction underway www.codgene.ca
GE3LS (Genomics Ethics Environment Economics Law Society)GE3LS (Genomics Ethics Environment Economics Law Society)
researching intellectual property protection status of selected broodstock under CA environmental law public benefit sharing and improved methods of consultation workshops related to these and other topics
CollaborationsCollaborations
15 national and four international agreements including genomics, disease resistance, reproductive biology >15,000 surplus cod provided for external collaborations >200,000 surplus cod provided to industry
www.codgene.ca

10/3/2008
6
Broodstock Acquisition andSpawning
Broodstock Acquisition andSpawning
H21 H30
H31 H32 H28
H29
H23
H26 H27
H24
Male
bro
od
sto
ck
Female broodstock
Berg and Henryon Design Partial Factorial
Dams and Sires Full siblings Half siblings
www.codgene.ca
Year 1Year 1
Year 2 and Year 3Year 2 and Year 3
Early Rearing and Taggingof Families
Early Rearing and Taggingof Families
www.codgene.ca

10/3/2008
7
197 total crosses (2005/2006)
102 crosses evaluated in Group 1 orincluded in Group 2
Group 1 NB/NHo Cape Sable, 4X (n = 39 families)o New Hampshire Coast, 5Y (n = 10
families)o 15,622 progeny assessed at tagging
Group 1 NLo Petit Forte, 3Ps (n = 14 families)o 8,862 progeny assessed at tagging
Group 2 NB/NHo 54CS + 20 NH; 42 shared between
Groups 1 & 2o Reared communallyo n ~ 41,532 stocked into a single sea cage
24,484 progeny assessed Source: http://www.mar.dfo-mpo.gc.ca/
www.codgene.ca
Summary of YC1 CrossesSummary of YC1 Crosses
YC1 PreliminaryYC1 PreliminaryHeritability EstimatesHeritability Estimates
YC1 PreliminaryYC1 PreliminaryHeritability EstimatesHeritability Estimates
n = >20,000 progeny included in the analysis0.29 (± 0.27) and 0.52 (± 0.26) for body weight (Gjerde et al. 2004)n = 6,112 Atlantic cod (~200 dpf); two regions off Norway
Initial results demonstrate the possibility for improvement of importantInitial results demonstrate the possibility for improvement of importantcommercial production traits.commercial production traits.
NB NH NL
Weight (g) 0.445 (0.005) 0.541 (0.009) 0.450 (0.006)
Length (cm) 0.531 (0.004) 0.449 (0.010) 0.558 (0.004)
h2 = VA/VP
Heritabilities (standard errors) for Atlantic cod juveniles at PIT taggingHeritabilities (standard errors) for Atlantic cod juveniles at PIT tagging

10/3/2008
8
232 total crosses (2006/2007)
77 crosses evaluated in Group 1
Group 1 and Group 2 NB/NH (n =155 crosses)o 5Z/4X, GB/CS (n = 38 crosses)o 5Y, NH (n = 8 crosses)o 15,545 progeny assessed at tagging
Group 1 NL (n = 72 crosses)o 3L, Bay Bulls (n = 31)o 7,581 progeny assessed at tagging
23,126 progeny assessed
Summary of YC2 CrossesSummary of YC2 Crosses
Source: http://www.mar.dfo-mpo.gc.ca/
www.codgene.ca
www.codgene.ca
YC Hatchery Stock nFish nFam nSires nDams nGroups
1
1
1
2
2
2
OSC
SABS
SABS
OSC
SABS
SABS
NL
NB
NH
NL
NB
NH
8862
12355
3295
7580
12770
2775
22
39
10
31
38
8
12
25
6
21
22
4
8
22
6
24
23
6
4
8
2
14
8
3
47637 148 90 89 39
Analysis of Tagging Data
YC1
YC2
10/3/2008
9
Year 1Year 1
Year 2 and Year 3Year 2 and Year 3
Broodstock Acquisition andSpawning
Broodstock Acquisition andSpawning
www.codgene.ca
PIT Tagged cod transported from the hatchery tothree sea cages 9998 tagged NBNH progeny into 2 sea cages in NB 3062 tagged NL progeny into 1 sea cage in NL
YC1
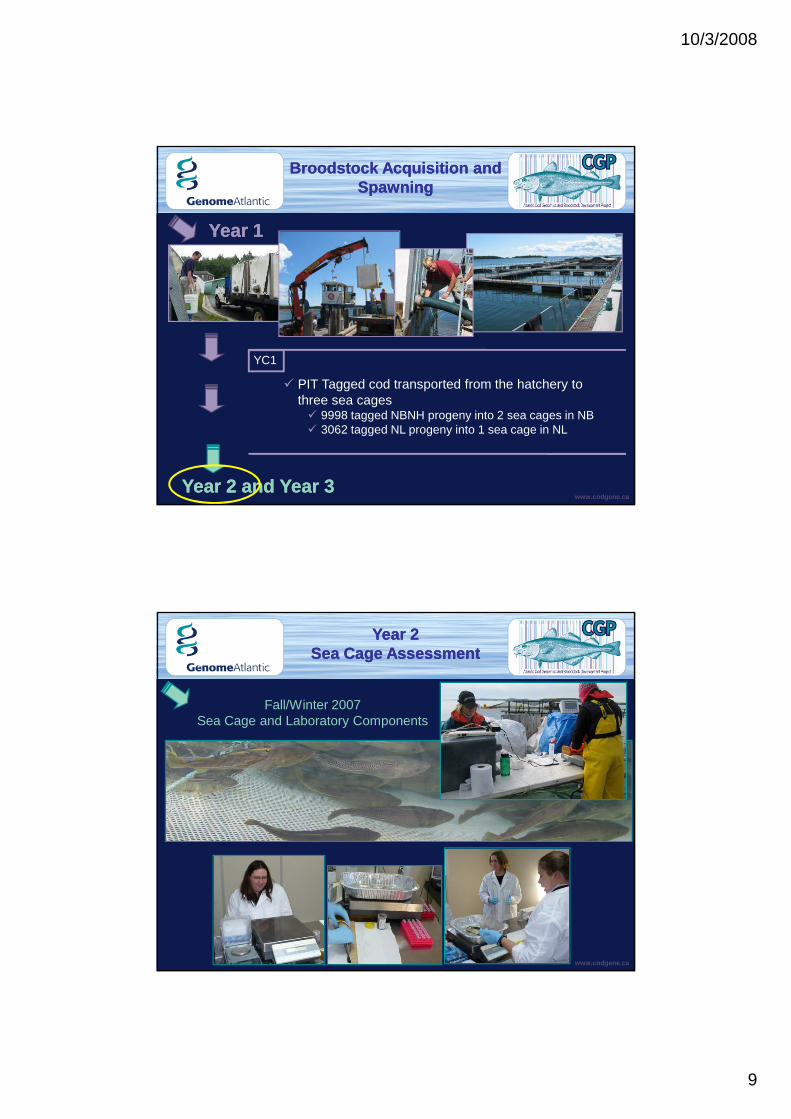
Year 2Sea Cage Assessment
Year 2Sea Cage Assessment
www.codgene.ca
Fall/Winter 2007Sea Cage and Laboratory Components

10/3/2008
10
Body Weight Length Condition Factor Deformities Carcass Weight (Carcass Index – CSI) Liver Weight (HSI) Gonad Weight (GSI) Gender (F/M) Maturation (five levels)
n = 7909, 1571
n = 1259, 579
Year 2Sea Cage Assessment
Year 2Sea Cage Assessment
www.codgene.ca
Trait/FamilySummary Statistics
Trait/FamilySummary Statistics
www.codgene.ca
Highly significantbetween family variationfor all traits measured
Traits P-values Mean Min-Max
NL (n = 14)
Mean Min-Max
NBNH (n = 49)
Wt <0.0001 194-482 g 417-886 g
Lgt <0.0001 25.0-33.1 30.2-37.8
CF <0.0001 1.09-1.39 1.39-1.80
Carcass <0.0001 208-393 722-311
Liver <0.0001 21.3-52.9 113.2-29.9
Gonad <0.0001 1.9-10.0 4.3-29.7
Maturity <0.0001 2.3-3.4 2.0-3.7
NL NBNH
CSI 79.3-84.3 79.0-84.8
HSI 7.6-11.5 8.8-15.7
GSI 0.6-2.5 1.0-4.8
*age not accounted for betweengeographic locations or sites within
NB locations*
10/3/2008
11
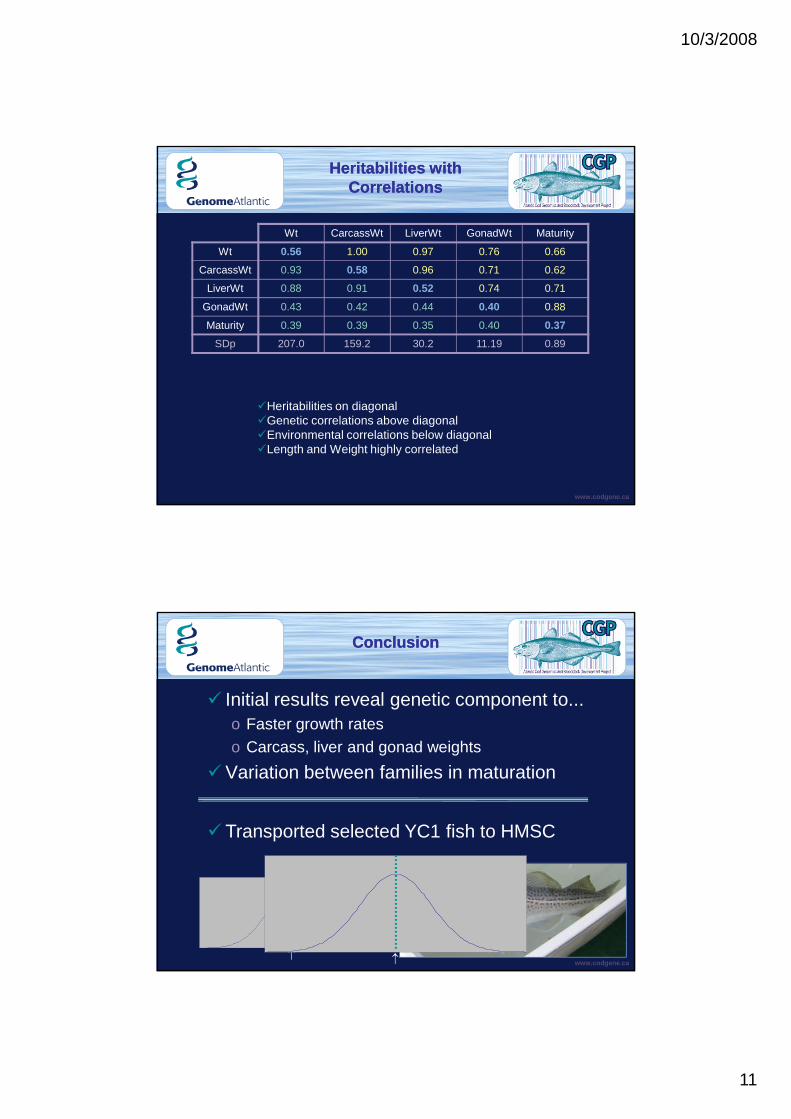
Heritabilities on diagonalGenetic correlations above diagonalEnvironmental correlations below diagonalLength and Weight highly correlated
Wt CarcassWt LiverWt GonadWt Maturity
Wt 0.56 1.00 0.97 0.76 0.66
CarcassWt 0.93 0.58 0.96 0.71 0.62
LiverWt 0.88 0.91 0.52 0.74 0.71
GonadWt 0.43 0.42 0.44 0.40 0.88
Maturity 0.39 0.39 0.35 0.40 0.37
SDp 207.0 159.2 30.2 11.19 0.89
www.codgene.ca
Heritabilities withCorrelations
Heritabilities withCorrelations
Initial results reveal genetic component to...
o Faster growth rates
o Carcass, liver and gonad weights
Variation between families in maturation
ConclusionConclusion
www.codgene.ca
Transported selected YC1 fish to HMSC

10/3/2008
12
Genetic InformationQTL markers
Phenotypic informationEconomic value of traits
Index of total geneticmerit(TMI)
Selection ofelite
broodstock
Identification ofIdentification ofElite BroodstockElite Broodstock
Physical traits are ranked based on economic or other criteria.
Individuals are assigned a merit score based on their ranking.
If genetic markers can be associated with important traits they can be used toidentify individuals carrying that trait – particular benefit for traits that cannot bemeasured in live fish.
418 total crosses (2007/2008)
181 crosses evaluated in Group 1 or includedin Group 2
Group 1 and Group 2 NB/NH (n = 137crosses)o 50 families Group 1, 105 families Group 2
F1, F1.5, F2 progenyo 5Z, Georges Bank (2006 and 2007 wild
caught; YC2 parents 2006 wild caught)o 4X, Cape Sable (2006 wild caught; YC2
parents 2006 wild caught)o 4X, F1/YC0, Bay of Fundyo 5Y, F1 2003 Broodstock Yearo 5Y, F1 2004 Broodstock Yearo 5Y, F1 2005 Broodstock Yearo 5Y, NH 2008 wild caught (milt Group 2 only)
Group 1 NL (n = 79 crosses)o 3L, Smith Sound & YC2 parents from Bay
Bulls (n = 44)
Summary of YC3 CrossesSummary of YC3 Crosses
Source: http://www.mar.dfo-mpo.gc.ca/
www.codgene.caIN PROGRESS

10/3/2008
13
www.codgene.ca
The Atlantic Cod Genomicsand Broodstock
Development Project