Atlanta Economic Indicators - NAYLOR Building Products 2.00 2.50 3.00 3.50 4.00 4.50 5.00 5.50 N o v...
14
Atlanta Housing Economic Trends November 2010 Note: This information is deemed accurate but not guaranteed. It is intended for the personal use of HBA members only.
Transcript of Atlanta Economic Indicators - NAYLOR Building Products 2.00 2.50 3.00 3.50 4.00 4.50 5.00 5.50 N o v...

Atlanta Housing Economic Trends
November 2010
Note: This information is deemed accurate but not guaranteed. It is intended for the personal use of HBA members only.
Market Update With Smart Numbers Steve Palm
There were 3,598 closings for all single family in October. This is 27% below October 2009 and the 4th consecutive year-to-year monthly double digitpercentage decline. The last time there was an October with less closings was 1998.
There were 3,038 closings in October 2010 for single family detached. This is a decline of 25.9% from October 2009 and the 41st year-to-year monthly decline out of the past 51 reporting periods. Of the 41 periods that experienced a year-to-year percentage decline, 27 of them were a double digit percentage decline. There were 560 closings for single family attached in October 2010. This is a 32.5% decline from October 2009 and is the largest year-to-year percentage monthly decline since November 2008.
When 2010 is over there is a very good chance that closings for all single family will be below 1999. Homes going under contract are down over 20% in September & October 2010 versus 2009, so closings in November & December will be down from 2009 as well. 2009 was our recession housing bottom, until 2010. Our first housing stimulus ended October 2009, so closings for all single family in November 2009 were up 49.3% over November 2008. Year to date closings for 2010 are 2,400 behind 2009, so it is pretty much assured 2010 is our new bottom.
The weaker market is showing up in the closed prices. The average sale price for all single family in October was $182,312. This is 5.3% below October 2009 and the last time there was an average October closed price that was lower was 1999. The average closed price for single family detached in October was $192,591. This is 3.5% below October 2009 and after 8 consecutive year-to-year monthly percentage increases in average price there now have been 2 consecutive declines. The average closed price for single family attached in October was $126,553. This is an extremely large 19.3% decline from October 2009. The last time there was an average monthly closed price lower than October’s was February 1999.
Foreclosures and short sales are currently at record levels. These distressed sales are putting tremendous downward pressure on home prices. There were 1,606 withdrawn listings for all single family in October 2010. This is 161 less withdrawn listings than October 2009, but 1,741 less than October 2007. There were 4,890 expired listings for all single family in October 2010. This is 81 more expired listings than October 2009, but 2,744 less than 2008. October 2008.
There are 44,840 listings on the market for all single family at the end of October. The October inventory high was 2007 with an ending inventory of 70,716. We are closing in on October 2004’s ending inventory of 41,508. With low demand and depressed prices I expect that inventory levels remain low and even drop the next two months.
It is obvious that our economy is much weaker than we are led to believe. We have historic low interest rates for mortgages and home prices have reset back 10+ years in some areas, but demand is not there to take advantage of the great buys. There are so many unknowns with our economy, i.e. increasing taxes; health care costs; energy prices; education; etc., that many consumers and businesses will wait before making any large financial decisions. 2010 will be our 4th straight down year for housing. Please enjoy the holidays and let’s hope for a 2011 turn around.
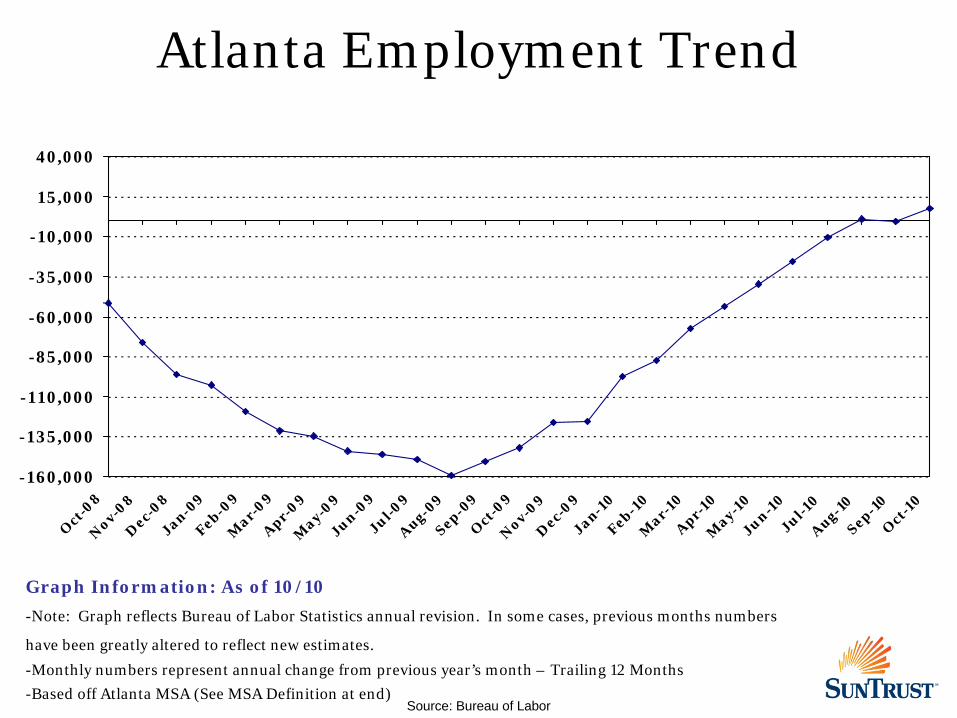
Atlanta Employment Trend
-160,000
-135,000
-110,000
-85,000
-60,000
-35,000
-10,000
15,000
40,000
Oct
-08
Nov-0
8D
ec-08
Jan-09
Feb-09
Mar-
09Apr-
09M
ay-09
Jun-09
Jul-09
Aug-09
Sep-09
Oct
-09
Nov-0
9D
ec-09
Jan-10
Feb-10
Mar-
10Apr-
10M
ay-10
Jun-10
Jul-10
Aug-10
Sep-10
Oct
-10
Graph Information: As of 10/10
-Note: Graph reflects Bureau of Labor Statistics annual revision. In some cases, previous months numbers
have been greatly altered to reflect new estimates.
-Monthly numbers represent annual change from previous year’s month – Trailing 12 Months
-Based off Atlanta MSA (See MSA Definition at end)Source: Bureau of Labor
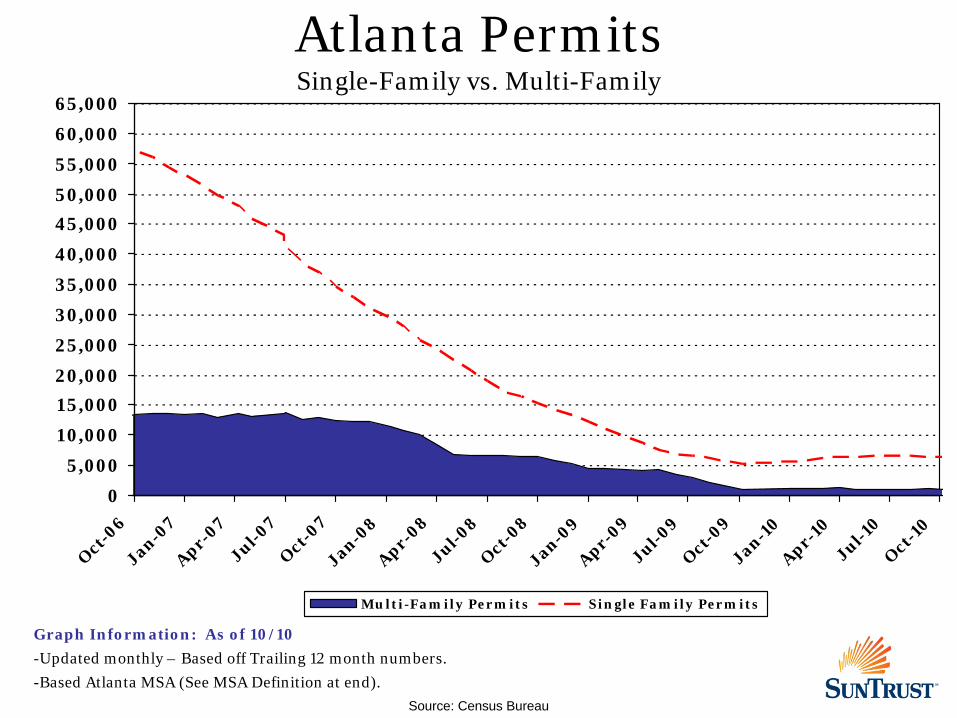
Atlanta Permits Single-Family vs. Multi-Family
Graph Information: As of 10/10
-Updated monthly – Based off Trailing 12 month numbers.
-Based Atlanta MSA (See MSA Definition at end).
Source: Census Bureau
0
5,000
10,000
15,000
20,000
25,000
30,000
35,000
40,000
45,000
50,000
55,000
60,000
65,000
Oct
-06
Jan-07
Apr-07
Jul-07
Oct
-07
Jan-08
Apr-08
Jul-08
Oct
-08
Jan-09
Apr-09
Jul-09
Oct
-09
Jan-10
Apr-10
Jul-10
Oct-1
0
Multi-Family Permits Single Family Permits
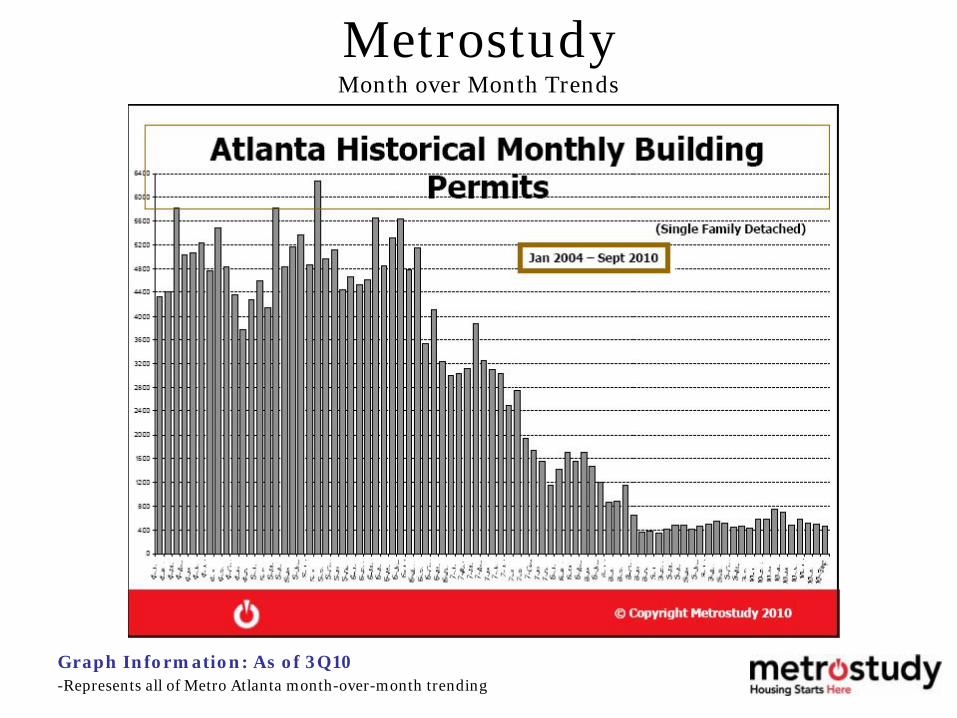
Metrostudy Month over Month Trends
Graph Information: As of 3Q10-Represents all of Metro Atlanta month-over-month trending
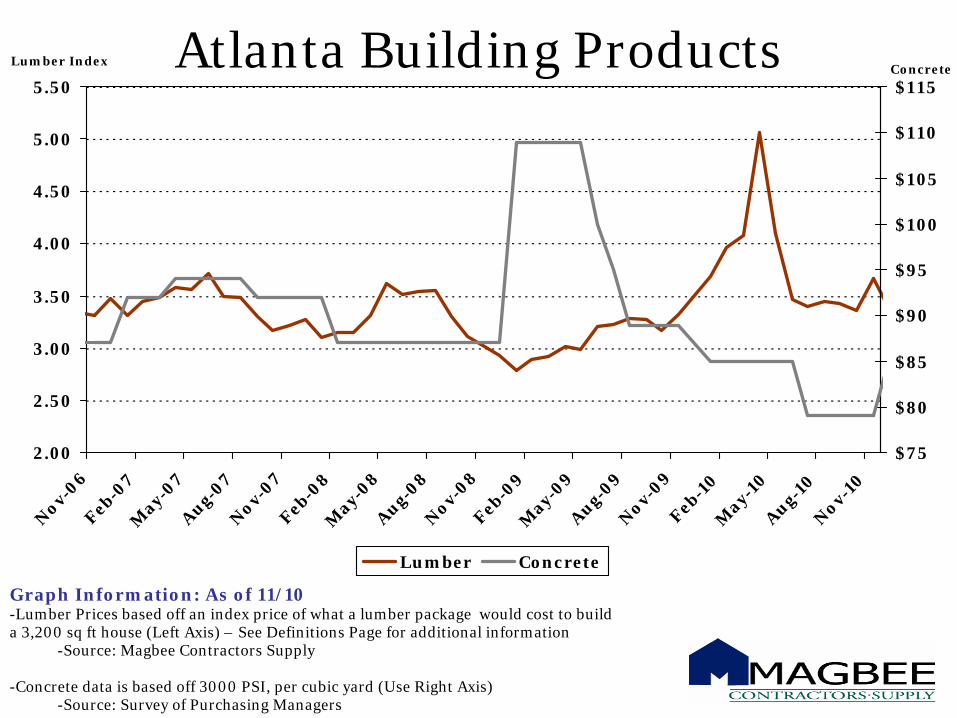
Atlanta Building Products
2.00
2.50
3.00
3.50
4.00
4.50
5.00
5.50
Nov-0
6Feb-0
7M
ay-07
Aug-07
Nov-0
7Feb-0
8M
ay-08
Aug-08
Nov-0
8Feb-0
9M
ay-09
Aug-09
Nov-0
9Feb-1
0M
ay-10
Aug-10
Nov-1
0
$75
$80
$85
$90
$95
$100
$105
$110
$115
Lumber Concrete
Graph Information: As of 11/10-Lumber Prices based off an index price of what a lumber package would cost to build a 3,200 sq ft house (Left Axis) – See Definitions Page for additional information
-Source: Magbee Contractors Supply
-Concrete data is based off 3000 PSI, per cubic yard (Use Right Axis)-Source: Survey of Purchasing Managers
Lumber IndexConcrete
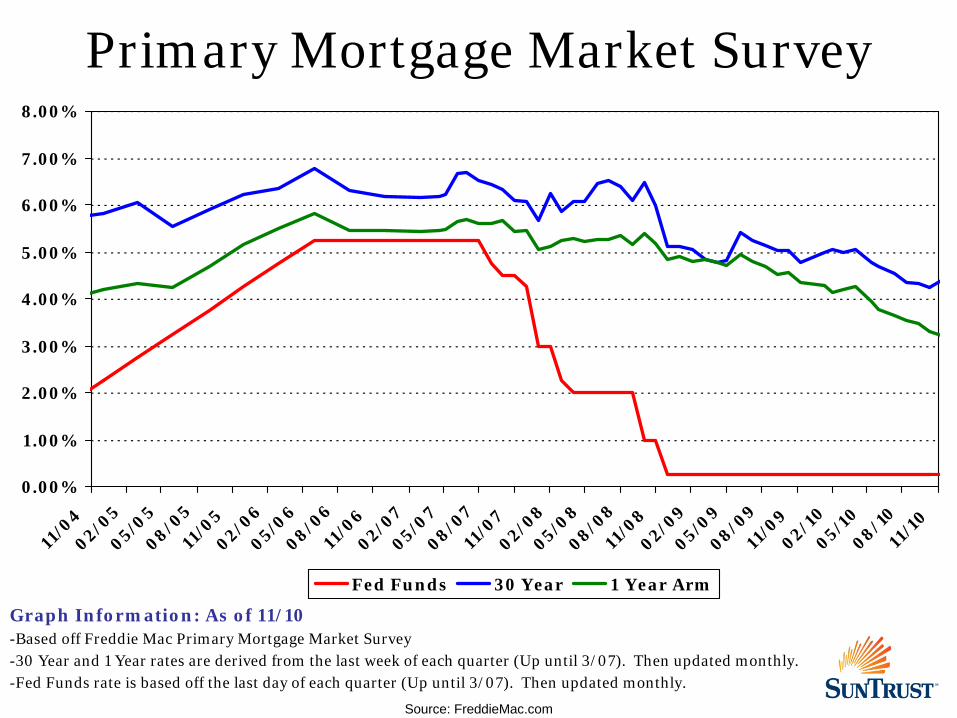
Primary Mortgage Market Survey
Graph Information: As of 11/10-Based off Freddie Mac Primary Mortgage Market Survey-30 Year and 1 Year rates are derived from the last week of each quarter (Up until 3/07). Then updated monthly.-Fed Funds rate is based off the last day of each quarter (Up until 3/07). Then updated monthly.
Source: FreddieMac.com
0.00%
1.00%
2.00%
3.00%
4.00%
5.00%
6.00%
7.00%
8.00%
11/0
402/0
505/0
508/0
511
/05
02/06
05/06
08/06
11/0
602/0
705/0
708/0
711
/07
02/08
05/08
08/08
11/0
802/0
905/0
908/0
911
/09
02/10
05/10
08/10
11/1
0
Fed Funds 30 Year 1 Year Arm
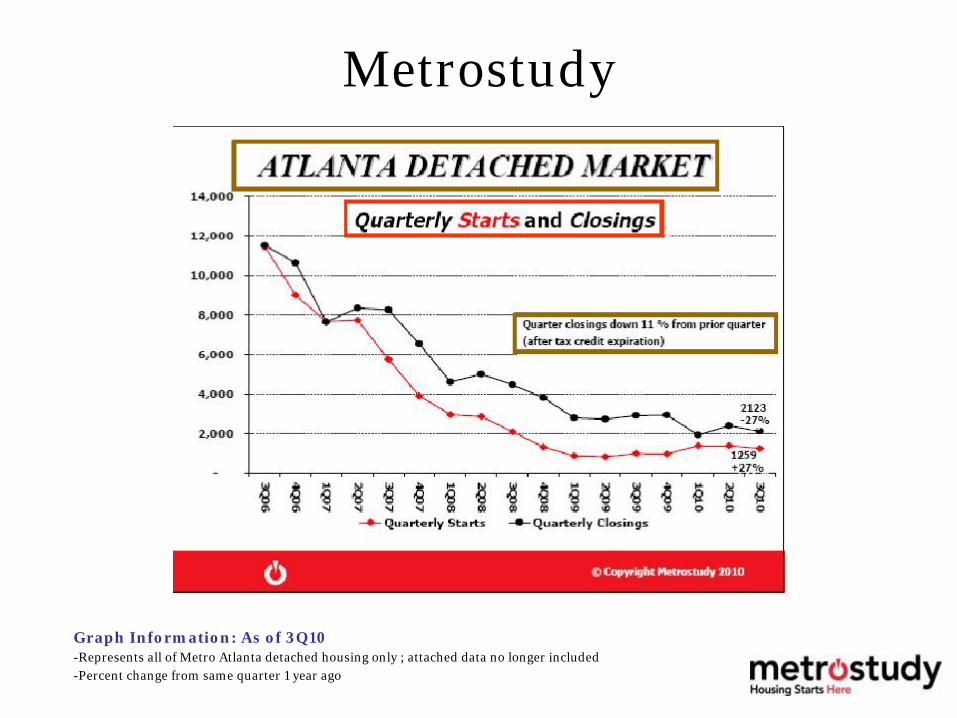
Metrostudy
Graph Information: As of 3Q10-Represents all of Metro Atlanta detached housing only ; attached data no longer included -Percent change from same quarter 1 year ago
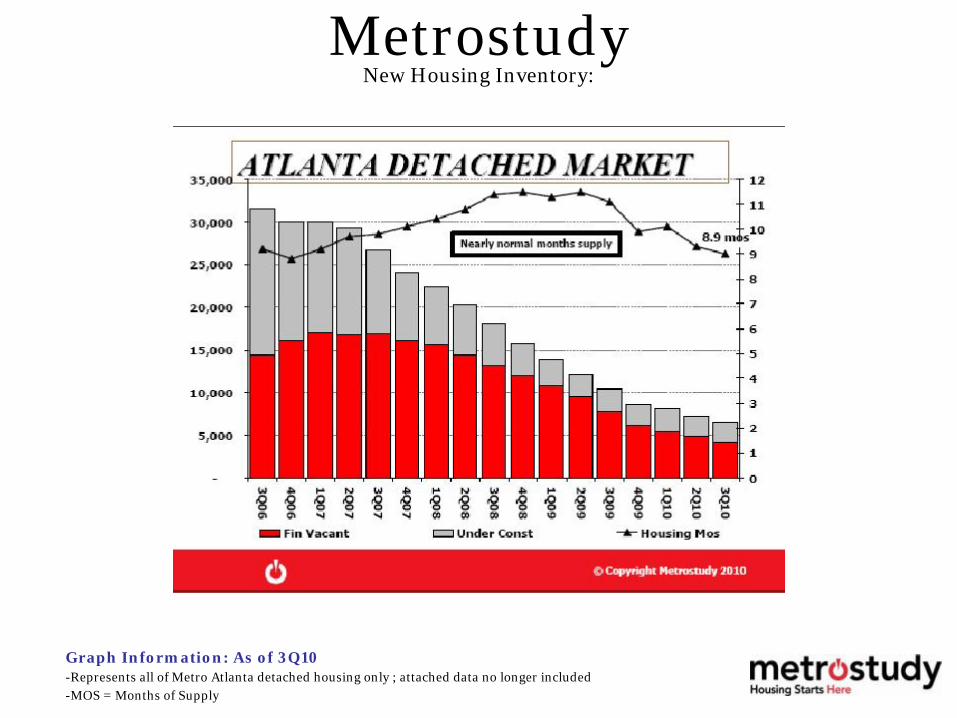
Metrostudy New Housing Inventory:
Graph Information: As of 3Q10-Represents all of Metro Atlanta detached housing only ; attached data no longer included -MOS = Months of Supply
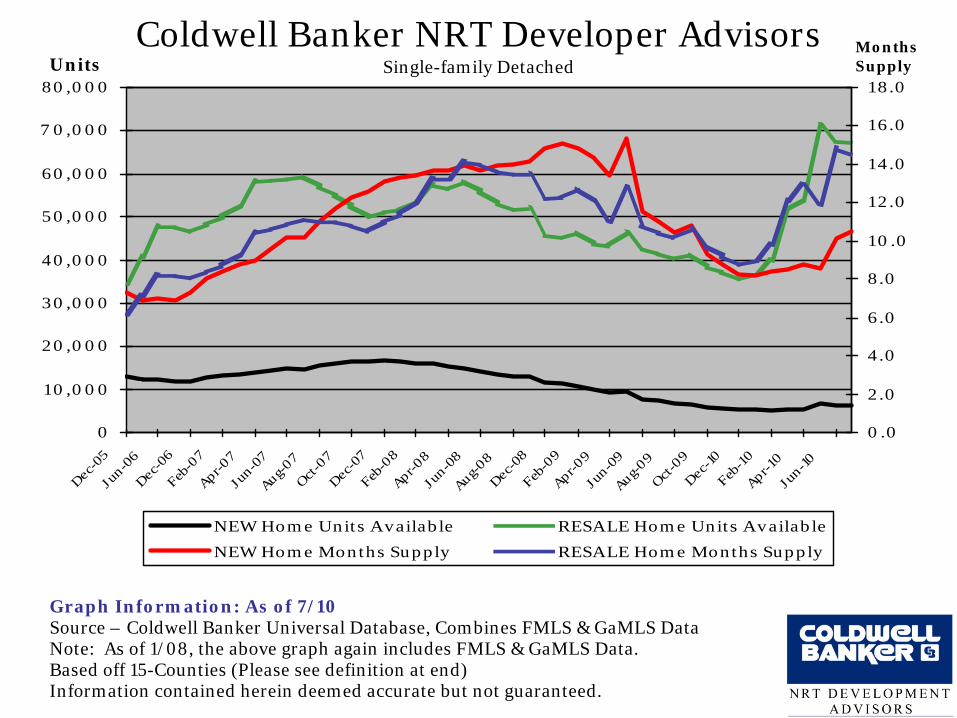
Coldwell Banker NRT Developer Advisors Single-family Detached
0
10,000
20,000
30,000
40,000
50,000
60,000
7 0,000
80,000
Dec-0
5Ju
n-06
Dec-0
6Feb
-07
Apr-07
Jun-0
7Aug-
07Oct
-07
Dec-0
7Feb
-08
Apr-08
Jun-0
8Aug-
08Dec
-08
Feb-0
9Apr-0
9Ju
n-09
Aug-09
Oct-0
9Dec
-10Feb
-10
Apr-10
Jun-10
0.0
2.0
4.0
6.0
8.0
10.0
12.0
14.0
16.0
18.0
NEW Home Units Available RESALE Home Units Available
NEW Home Months Supply RESALE Home Months Supply
UnitsMonths Supply
Graph Information: As of 7/10Source – Coldwell Banker Universal Database, Combines FMLS & GaMLS DataNote: As of 1/08, the above graph again includes FMLS & GaMLS Data. Based off 15-Counties (Please see definition at end)Information contained herein deemed accurate but not guaranteed.
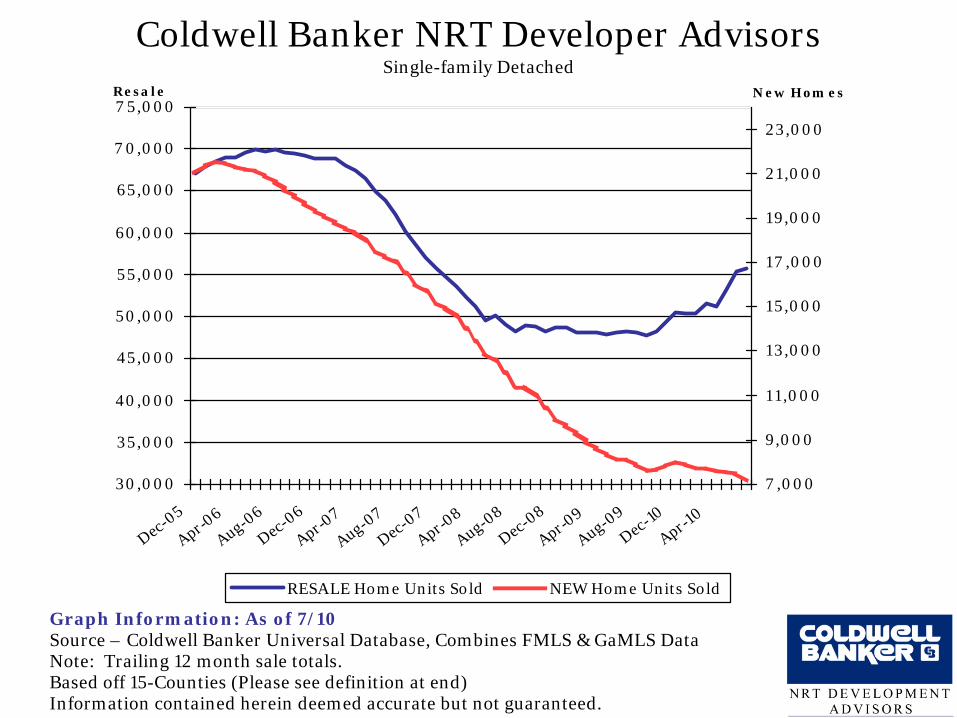
Coldwell Banker NRT Developer Advisors Single-family Detached
30,000
35,000
40,000
45,000
50,000
55,000
60,000
65,000
7 0,000
7 5,000
Dec-05
Apr-06
Aug-06
Dec-06
Apr-07
Aug-07
Dec-07
Apr-08
Aug-08
Dec-08
Apr-09
Aug-09
Dec-10
Apr-10
Resa le
7 ,000
9,000
11,000
13,000
15,000
17 ,000
19,000
21,000
23,000
New Hom es
RESALE Home Units Sold NEW Home Units Sold
Graph Information: As of 7/10Source – Coldwell Banker Universal Database, Combines FMLS & GaMLS DataNote: Trailing 12 month sale totals. Based off 15-Counties (Please see definition at end)Information contained herein deemed accurate but not guaranteed.
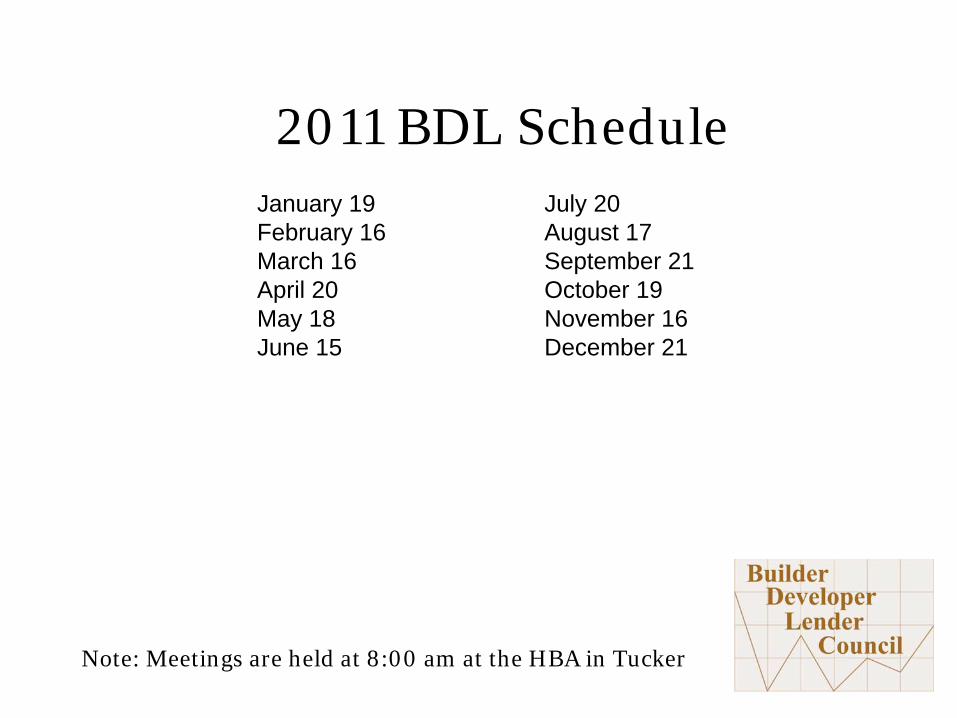
Note: Meetings are held at 8:00 am at the HBA in Tucker
2011 BDL ScheduleJanuary 19February 16March 16April 20May 18June 15
July 20August 17September 21October 19November 16December 21

Thanks to Our Sources…
www.Metrostudy.comEugene James
Director, Atlanta [email protected]
404.370.9001 x111
www.SunTrust.comCourtney Bayer
Commercial Real [email protected]
770-442-2214
www.Atlantahomebuilders.comDavid Ellis
www.Freddiemac.comwww.Condostore.com
www.Coldwellbankerbds.com
Robert Romano
Executive Vice President
404.705.1755
Note: This information is deemed accurate but not guaranteed. It is intended for the personal use of HBA members only.
John HuntP.O. Box 636
Marietta, GA 30061Office 770-424-5128Cell 678-770-4902

Definitions
Metrostudy currently gathers data from 22 Metro Atlanta Counties shown to the right:
Atlanta MSA as defined by the 2000 Census (Updated Dec 2006): Barrow, Bartow, Butts, Carroll, Cherokee, Clayton, Cobb, Coweta, Dawson, DeKalb, Douglas, Fayette, Forsyth, Fulton, Gwinnett, Haralson, Heard, Henry, Jasper, Lamar, Meriwether, Newton, Paulding, Pickens, Pike, Rockdale, Spalding & Walton Counties
Coldwell Banker 15-County Area includes: Fulton, Cobb, Cherokee, Forsyth, Gwinnett, Hall, Dekalb, Rockdale, Newton, Clayton, Henry, Fayette, Coweta, Douglas and Paulding counties.
Lumber Information:-Index price is calculated from the sum of the following materials: Plate Stock, Stud Material, Floor Joist, Risers, Bands, Floor Deck, Roof Deck, Wall Brace, Ceiling Joist, Rafters and Miscellaneous Materials. -Based off the amount of material it would take to build a 3,200 square foot house in Atlanta at the current time. Purpose was to show consistency by using the same amount of material over a period of time.