ATIP for Target Shareholders - Hedge Fund Solutions Square to Target... · ATIP for Target...
164
A TIP for Target Shareholders Pershing Square Capital Management, L.P. October 29, 2008
-
Upload
truongthien -
Category
Documents
-
view
223 -
download
5
Transcript of ATIP for Target Shareholders - Hedge Fund Solutions Square to Target... · ATIP for Target...

A TIP for Target Shareholders
Pershing Square Capital Management, L.P.
October 29, 2008
DisclaimerThe information contained in this presentation (the “Information”) is based on publicly available information about Target Corporation (“Target”). None of Pershing Square Capital Management, L.P., its affiliates and any of their respective officers, directors and employees (collectively, “Pershing”), nor any representative of Pershing, has independently verified any of the Information. Pershing recognizes that there may be confidential or otherwise non-public information in Target’s possession that could lead others to disagree with Pershing’s conclusions. The sole purpose of presenting the Information is to inform analysts and shareholders about the transaction described in this presentation (the “Transaction”). This presentation does not constitute an offer or a solicitation of any kind.
Neither Pershing nor any of its representatives makes any representation or warranty, express or implied, as to the accuracy or completeness of the Information or any other written or oral communication made in connection with this presentation or the Transaction. The Information includes certain forward-looking statements, estimates and projections with respect to the anticipated future financial, operating and stock market performance of Target in the absence of the Transaction and the two public companies that may result if the Transaction is completed. Such statements, estimates and projections may prove to be substantially inaccurate, reflect significant assumptions and judgments that may prove to be substantially inaccurate, and are subject to significant uncertainties and contingencies beyond Pershing’s control, including those described under the caption “Risk Factors” in Target’s filings with the Securities and Exchange Commission as well as general economic, credit, capital and stock market conditions, competitive pressures, geopolitical conditions, inflation, interest rate fluctuations, regulatory and tax matters and other factors.
Pershing and its representatives expressly disclaim any and all liability relating to or resulting from the use of the Information or any errors therein or omissions therefrom, including under applicable securities laws. The Information does not purport to include all information that may be material with respect to the Transaction or Target. Thus, shareholders and others should conduct their own independent investigation and analysis of Target, the Transaction and the Information.
The Information is not intended to provide the basis for fully evaluating, and should not be considered a recommendation with respect to, the Transaction, Target, the securities of Target or any other matter. Except where otherwise indicated, the Information speaks as of the date hereof. Neither Pershing nor any of its representatives undertakes any obligation to correct, update or revise the Information or to otherwise provide any additional materials.
The preparation and distribution of this presentation should not be taken as any form of commitment on the part of Pershing to take any action in connection with the Transaction.
Pershing is in the business of buying and selling securities. It has, and may in the future, buy, sell or change the form of its position in Target for any or no reason.
IRS Circular 230 Disclosure: To ensure compliance with requirements imposed by the IRS, we inform you that (i) any discussion of U.S. tax matters contained in this communication (including any attachments) is not intended or written to be used, and cannot be used, for the purpose of avoiding penalties under the Internal Revenue Code; (ii) any such discussion of tax matters is written in connection with the promotion or marketing of the matters addressed; and (iii) you should seek advice from an independent advisor.
1

Pershing’s Investment in Target
2
Pershing initiated its investment in Target (“Company”) in April 2007
We currently have beneficial ownership of slightly less than 10% of the Company
Since May 2008, we have been discussing a potential Transaction with Target management
Pershing has improved its initial Transaction to address issues raised by the Company. Today, we are presenting this revised Transaction to the Company, its shareholders, and members of the investment community

3
Pershing’s Relationship with Target
Since our first meeting with management in the summer of 2007, Pershing has enjoyed a very constructive relationship with Target
We view Target’s management as the best in the Retail Industry
We appreciate management’s willingness to listen to and evaluate ideas proposed by shareholders
Our goal is to work with management and other shareholders to find the best strategic and value-maximizing outcome for the Company, its employees, and its shareholders

Why Are We Going Public?
4
Given the materiality of the Transaction, Pershing thought it would be beneficial to share the idea publicly with Target stakeholders and the investment community
The Transaction is important enough to warrant “testing” with shareholders
We think the insights gained by sharing the Transaction publiclywill be of tremendous benefit to Target as well as other stakeholders
Target is currently evaluating the Transaction
By going public with our presentation in advance of Target’s decision regarding the Transaction, shareholders and the investment community can provide their input on the Transaction’s merits
5
Significant Preparation and Analysis
To assist in preparing this presentation, Pershing retained UBS Investment Bank (“UBS”) and Sullivan & Cromwell LLP (“S&C”) as financial and legal advisors
Pershing and its advisors’ analyses are based on publicly available information
UBS has provided financial advisory services
S&C has provided legal, structural, and tax advisory services
Note: All financials in this presentation are based on Calendar Year

6
Agenda
Objectives
The Transaction
Transaction Rationale
Valuation
Appendix
■ Detailed Valuation Analysis
■ Credit Rating Analysis
■ Structural and Legal Considerations

Objectives

8
Target: Retail and Real Estate Operations
Real Estate OperationsRetail Operations■ Iconic U.S. retail brand
■ Best-in-class operator with distinctive merchandising strategy
■ 1,685 stores in 48 states
■ Best management team in the retail industry
■ Attractive growth profile, driven by mid-to-high single-digit square footage growth and market share gains
■ Recently sold an undivided interest in credit card receivables
■ High-quality owned real estate in attractive suburban and urban locations
■ Significant value embedded in real estate, not accounted for in public market valuation
■ Owns ~95% of its retail buildings and ~85% of the land under its retail locations
■ Owns ~84% of its distribution centers (“DCs”) and ~81% of the land under its DCs
■ Facilities Management Services comprising hundreds of employees responsible for property maintenance

34% 34%
58% 63%
68%
87% 87% 92% 95%
0
10
20
30
40
50
60
70
80
90
100
% U
nits
Ow
ned
(Bui
ldin
gs)1
Significant Real Estate Ownership
Target owns the highest percentage of its real estate compared to other big box retailers
% DCs owned(3): 84% ND 2% 84% 76% 55% 89% 54% ND85% 79% ND ND 55% ND 35% ND 27%% owned units/land(2):
“ND” represents Not Disclosed(1) Represents % owned stores (includes owned stores on leased land)(2) Represents % owned stores on owned land only(3) Represents % owned DCs (includes owned DCs on leased land) 9

$ in billions 2008EExisting Retail EBITDA $6.3Less: Additional Rent (2.5)Equals: PF Retail EBITDA $3.8
Implied EV of '08E EBITDAPro Forma Target Corp 7.0x $26.9
What if Target Were to Rent its Real Estate?
Target Real Estate Co Pro Forma Target Corp
Target’s resulting EBITDA after rent expense would be $3.8bn
10
(1) Implied cap rate of 8.5% on 35mm square feet of distribution facilities, valued at $50 per square foot (2) Assumes for illustrative purposes that the remaining 53% interest in credit card receivables is sold to an Investment Partner for $4.4bn and that Target retains $150mm of credit card income
Assuming that Target were to rent all of its owned store locations at an estimated market rent of 4.25% of store sales (or approximately $13/sq. ft.) and its owned distribution facilities at $4.25/sq. ft., Target would pay an additional rent of $2.5bn in 2008
(1)
(2)
$ in billions 2008ETarget Retail Sales $64.9Implied Retail Rent as % of Sales 4.25%Percentage of Owned Real Estate 85%
Retail Rental Income $2.4Dist. Facilities Rental Income 0.2Real Estate 4-Wall EBITDA $2.5

$39 Billion of Real Estate Replacement Value
11
Assuming that on average, a new store costs $26mm to zone, develop and build or approximately $197/sq. ft. (1) and that each Distribution Facility costs $70mm or approximately $50/sq. ft. (1), the replacement cost of Target’s owned real estate (excluding the value of its buildings on ground leased land and its existing leases) is approximately $39bn
(1) Based on average store size of 132k square feet, and DCs & WHs size of 1.4mm square feet(2) Analysis excludes the value of owned buildings on third-party ground leased land; assumes cost of a Target store of $26mm ($13mm building and $13mm land) and cost of distribution facility and warehouse of $70mm ($50mm building and $20mm land)(3) Assumes 1,438 stores, and 25 distribution facilities and warehouses on owned land in 2008E
Replacement Value of Owned Land and Buildings (2), (3)
2008E Retail Real Estate:2008E Estimated Owned Value / Total Value
Total Sq. Ft. (mm) % Owned Sq. Ft. (mm) Sq. Ft. ($bn)222 85% 189 $197 $37.4
2008E DCs and WHs:2008E Estimated Owned Value / Total Value
Total Sq. Ft. (mm) % Owned Sq. Ft. (mm) Sq. Ft. ($bn)44 81% 35 $50 $1.8
Total Real Estate Replacement Value ($bn) $39.1Implied Cap Rate @ $2.5bn of Estimated Market Rent 6.4%

Market Assigns Little Value to Target’s Real Estate
12
(1) Based on 2008 Q2 company filings and a 20-day trading average stock price as of 10/24/08(2) Assumes for illustrative purposes that the remaining 53% interest in credit card receivables is sold to an Investment Partner for $4.4bn and that Target retains $150mm of credit card income
Assuming Target were to rent its owned real estate and using a 7.0x ’08E EBITDA multiple on the pro forma retail business, the 20-day trading average stock price of $40 implies only $13bn of value for Target’s owned real estate, a significant discount to book and replacement value
$ in billions
Current TGT Enterprise Value @ $40/Share $48.3 (1)
Less : PF Target Corp (26.9) (2)
Less : Credit Card Receivables (8.0) Equals : Implied Real Estate Value $13.4
Gross Book Value of Land and Buildings $25.2 (1)
Discount to Gross Book Value 47%
Replacement Value of Owned Real Estate $39.1Discount to Replacement Value 66%

13
Objectives
Retain complete control of its buildings and its brand
Retain 100% flexibility with respect to its construction, remodeling, and relocation plans
Improve the Company’s free cash flow and access to capital
Increase the Company’s ROIC and lower its cost of capital
Maintain an investment grade credit rating
Increase the Company’s EPS growth rate
Minimize tax leakage and friction costs
In considering alternatives for the Company, Pershing Square’s objective was to eliminate the stock market’s ascribed discount to the intrinsic value of Target’s real estate and allow the Company to:
Value destruction due to tax leakage, both at the corporate and shareholder levels
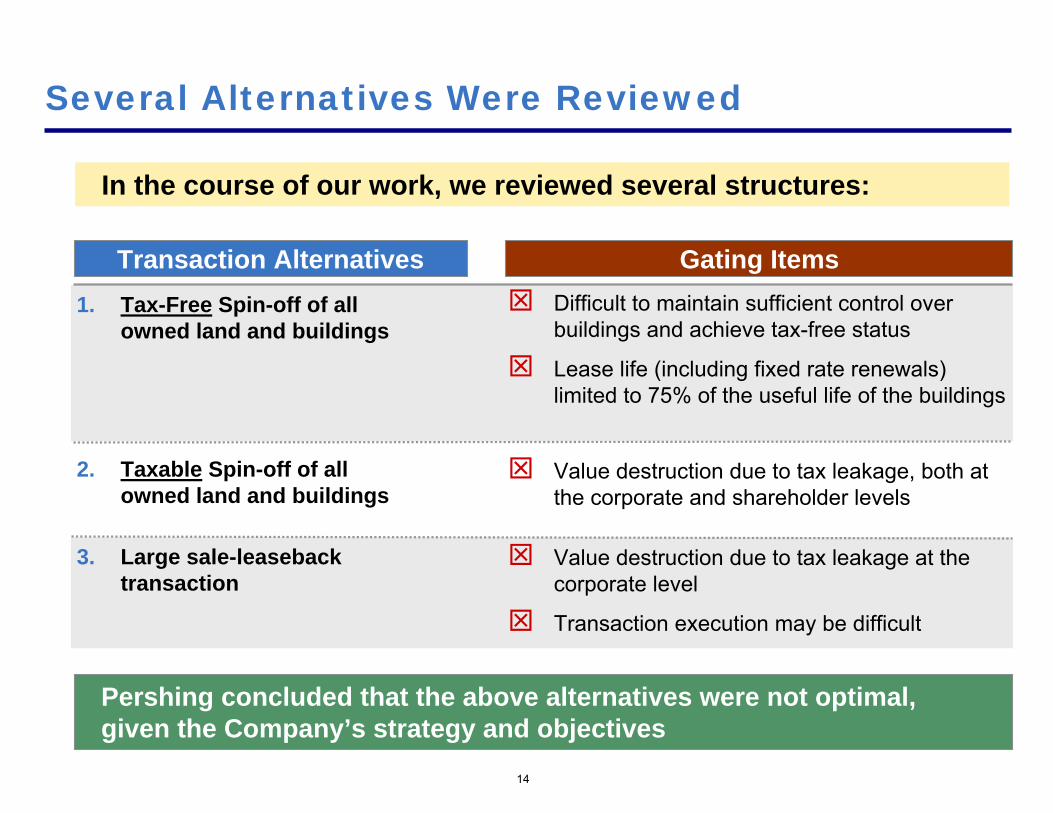
In the course of our work, we reviewed several structures:
14
Several Alternatives Were Reviewed
Transaction Alternatives
2. Taxable Spin-off of all owned land and buildings
3. Large sale-leaseback transaction
1. Tax-Free Spin-off of all owned land and buildings
Value destruction due to tax leakage at the corporate level
Transaction execution may be difficult
Difficult to maintain sufficient control over buildings and achieve tax-free status
Lease life (including fixed rate renewals) limited to 75% of the useful life of the buildings
Gating Items
Pershing concluded that the above alternatives were not optimal,given the Company’s strategy and objectives

Pershing has identified a Transaction which will achieve all of the stated objectives
The Transaction is consistent with the way Target owns some of its real estate today
The Transaction will create tremendous shareholder value
15

The Transaction

The Transaction
Tax-free spin of Target Inflation Protected REIT (or “TIP REIT”) as Groundlessor and Facility Manager
Pre–SpinTARGET
Shareholders
TARGET
New Target Corp owns its buildings on 75-year ground leases
Outsources Facilities Management Services
Continues to maintain properties
Leases back land to Target Corp through a Master Lease for a 75-year term
Elects REIT status at the time of spin-off
Becomes Target Corp’s outsourced facilities management provider
Becomes Target’s exclusive land developer for the first two years
After two years, becomes Target Corp’s Preferred Vendor for land procurement
Post–SpinTARGET
Shareholders
Ground Leases
LandFacilities
Mgmt.Services
Target Inflation Protected REIT
ExistingRetail
Business
OwnedBuildings 1
TARGET Corp
(1) Includes third-party ground leases
17

Solving a Retailer’s Real Estate Dilemma
TIP REIT
Question: How can a Retailer unlock the value of its real estate without losing control of its buildings?
Answer: Tax-free spin-off of an active business that ground leases the land back to the Retailer
Retailer retains ownership of its buildings and 100% control with respect to its construction, remodeling, and relocation plans
Retailer becomes a 75-year ground lessee for its owned properties on attractive terms with no financial covenants
Retailer gets an unlevered business partner (a land-only REIT) that can more efficiently finance future land development
18
Land under Stores and DCs
Facilities Mgmt.Services

Unlocking Immense Real Estate Value
$40/Share (1) Inflation Protected Treasury Securities (TIPS) (3)
Large Cap REITs (1)
Target’s Market Valuation (1)
2009E EV / EBITDA
Inflation Protected Securities / REIT Market Valuations
2009E EV / EBITDA
6.0x 33.3x15.7xRecent “Big Box” Ground
Lease (2)
17.0x
REITs, private market ground leases, and inflation-protected securities all trade at much higher valuation multiples than Target’s multiple, at only 6.0x ‘09E EV/EBITDA, based on a 20-day trading average stock price of $40
The Transaction creates immense and instant value because 22% of Target’s current EBITDA will be valued at a significantly higher multiple than where Target trades today
19
(1) Based on a 20-day trading average as of 10/24/08(2) Based on mid-point precedent cap rate of 5.9%(3) Based on current 20-year TIP yield of 3.0%

Execution is Not Impacted by the Current Markets
Given the global credit markets today, the only strategic transactions that can take place are those that do not require access to capital:
Spin-offs
Stock-for-stock mergers / acquisitions
Acquisitions by cash-rich acquirors
The Transaction is structured as a spin-off where each current shareholder will receive pro rata shares in TIP REIT
No equity or debt capital is required to spin off TIP REIT
Target does not need access to the capital markets to consummate this Transaction
20

Transaction Plan: How Would it Happen?
Step 1: The existing company (“Target Corp”) forms a new subsidiary (“TIP REIT”) and transfers to it the Facilities Management Services business, the owned land under the stores, and the owned land under the distribution facilities
Transaction DescriptionAsset Contribution
75-year
Master LeaseTarget Corp
LandFacilities
ManagementServices
TIP REIT
Target Corp
TIP REITLandFacilities
ManagementServices
Land LeaseStep 2: TIP REIT leases the land back to Target Corp through a Master Lease for a 75-year term
1
2
21

Transaction Plan (cont’d)Transaction DescriptionSpin-off and REIT Election
E&P Purge
Step 3: Target Corp spins off TIP REIT to its shareholders pro rata and tax-free
Step 4: TIP REIT elects REIT status effective immediately
Simultaneously, TIP REIT drops the Facilities Management Services business into a new corporation, a taxable REIT subsidiary (TRS)
Step 5: TIP REIT pays a taxable dividend (at the 15% dividend tax rate to non-corporate taxpayers) to shareholders equal to its allocated portion of Target’s $16bn of retained Earnings and Profits (“E&P”), estimated to be $8bn based on the implied mid-point valuation of TIP REIT/Target Corp
20% of the dividend ($1.6bn) may be paid in cash with the remaining paid in TIP REIT common stock
This cash dividend can be deferred until the end of the calendar year in which the REIT election occurs
3
4
TargetCorp
Land
TIP REIT
Shareholders
Tax-FreeSpin-off
Facilities Mgmt Services
(TRS)
5
Shareholders
Land
TargetCorpTIP REIT
75-year Lease
$8bn Taxable Dividend
(E&P Purge)
Facilities Mgmt Services
(TRS)
22

Illustrative Master Lease Term Sheet
Lessee
Lessor
Leased Property
Term
Rate
Financial Covenants
Maintenance of Buildings
Lease Structure
The lease is intended to be treated as a lease for tax purposes; lessor will be treated as the ownerNote: The lease is assumed to be treated as an operating lease for accounting purposes
Target Corp
TIP REIT
Land in fee under stores and distribution centers
75-year term
None
Flat dollar amounts per year with annual increasesFor this Transaction we have assumed annual increases based on CPI increases
Target Corp will have the right to re-model or tear down and rebuild stores as it sees fit
Preferred Vendor
Agreement
For the first 2 years post-Transaction, TIP REIT will be Target Corp’s exclusive land developerThereafter, TIP REIT will become Target Corp’s preferred vendor for future land procurement / development needs
23
Sublease Target Corp may sublease one or more sites but no sublease would release Target Corp from its obligations under the lease

Ongoing Relationships
TIP REIT will provide Facilities Management Services to Target Corp under a long-term agreement
Arm’s-length termsTIP REIT expected to continue to perform Facilities Management Services for third parties after the spin-off
Target Corp agrees to use TIP REIT as its land procurement developer for the first two years after the spin-off on agreed-upon terms
Creates a contractual 2-year development pipeline for TIP REIT and a funding sourcefor Target Corp
Afterwards, Target Corp will grant TIP REIT preferred vendor status for Target Corp’s land procurement needs on market terms for future Target stores
Under this Preferred Vendor Agreement, it is anticipated that TIP REIT will be Target Corp’s land procurement developer in the future
After the spin-off, TIP REIT and Target Corp may also share overlapping board members The number of overlapping board members would comprise a minority of each boardThere may be restrictions on the duration of the overlap
Post separation, Target Corp and TIP REIT will continue to be closely aligned, but on an arm’s-length basis
24

25
Transaction Assumptions
Lease Terms’09E rent/square foot on land for stores — $7/sq. ft.; equals to 7% of $100/sq. ft.’09E rent/square foot on land for distribution centers and warehouses — $1.25/sq. ft.Rental rate grows based on CPI (assumes CPI = 2.5%)
Credit Card Business
(Both Transaction and Standalone)
Target sells 53% remaining interest of credit card portfolio$4.4bn of proceeds used to pay down debt (including all securitized debt)Elimination of $3.6bn JPMorgan financing
Target retains $150mm of pre-tax earnings stream from its credit card business in partnershiptransaction
Capital Structure
After reducing $4.4bn of debt from the sale of the remaining 53% interest of CC business (and accordingly eliminating the JPMorgan credit card liability), we have assumed all existing debt stays at Target CorpFlexibility to re-allocate debt between Target Corp and TIP REIT
Capital Expenditures
Target Corp funds all maintenance capex as well as all building developmentTIP REIT funds all new Target store land procurement, development and improvement costs ($100/sq. ft.)
Facilities Management
Services
Assumes $125mm of ’09E internal Facilities Management Services expense at Target CorpAssumes TIP REIT receives $144mm in revenues from Target Corp and third parties, expenses $125mm of costs and earns $19mm in EBIT, implying a 13% EBIT margin in 2009E
Dividends 100% of AFFO distributed at TIP REITResults in total dividends to shareholders of $1.86/share in PF2009E vs. current $0.60/share
The following transaction assumptions were used for an illustrative 01/01/09 transaction:
TIP REIT G&A Assumes $20mm of G&A allocated to TIP REIT and incremental $15mm of standalone costs in ’08E

2009E 2009E 2009E 2009E
Target Corp TIP REIT "Combined" Target Standalone
($mm, except per share)
EBITDA $5,172 $1,427 $6,599 (1) $6,614
D&A 1,884 56 1,940 1,940
EBIT 3,288 1,372 4,659 4,674
Taxes 1,004 7 1,011 1,528
EPS $2.23 $1.79 (2) $4.02 $3.40
Selected 2009E Income Statement Data
26
22% of total EBITDA to TIP REIT
Minimal D&A at TIP REIT and no maintenance capex
TIP REIT pays almost no taxes
18% EPS accretion from tax efficiencies and improved free cash flow
Based on the assumptions provided, the Transaction would result in $1.4bn EBITDA in 2009E to TIP REIT
(1) Includes incremental $15mm of standalone costs at TIP REIT(2) Normalized to exclude $112mm (approximately $0.16/share) of incremental interest expense due to CY2009 cash E&P distribution

27
2009E Detailed Income Statement Data
The table below sets forth the Income Statements for the two entities2009E 2009E Intercompany 2009E
($mm) Target Corp TIP REIT Adjustments "Combined"
P&L Data:Retail Revenue $68,249 – – $68,249Rental Revenue – 1,444 (1,444) – Facilities Management Revenue 1 – 144 (144) – Total Revenue $68,249 $1,587 ($1,587) $68,249
COGS (47,777) – – (47,777)Gross Margin 20,472 1,587 (1,587) 20,472 Gross Margin (%) 30.0% 100.0% 30.0%
Less: Existing Rent Expense (173) – – (173)Less: Incremental Ground Lease Expense payable to TIP REIT 2 (1,444) – 1,444 – Less: SG&A (excluding rent expense) (13,814) (20) – (13,834)Less: Incremental Standalone Cost 3 – (15) – (15)Less: Facilities Management Expense 1 (19) (125) 144 – Plus: Credit Card EBITDA 4 150 – – 150Equals: EBITDA $5,172 $1,427 – $6,599 % of Total 78.4% 21.6% 100.0%
Less: Depreciation and Amortization (1,884) (56) – (1,940)Equals: EBIT $3,288 $1,372 – $4,659 % of Total 70.6% 29.4% 100.0%
(1) Reflects payment to TIP REIT of $144mm less assumed expense of $125mm(2) Assumes rent of $7.00/sq. ft. on store land and $1.25/sq. ft. on DCs and WHs land for CY 2009E(3) Incremental standalone cost of TIP REIT(4) Assumes the sale of the remaining 53% interest on credit card receivables on 01/01/09, with Target retaining $150mm of credit card EBITDA

$3.92
$2.68
$1.86
$0
$1
$2
$3
$4
$5
$6
Target Target "Combined"
Mai
nten
ance
FC
F/Sh
are
TIP REIT
Target Corp
$4.54
Target Standalone
16%
2009E Maintenance Free Cash Flows
28
The Transaction achieves significant cash flow savings given the tax-efficient structure for owning land
2009E Maintenance Free Cash Flow per Share (1)
(1) Includes cost of store remodeling; normalized to exclude $112mm (approximately $0.16/share) of incremental interest expense due to CY2009 cash E&P distribution

2009E 2009E 2009E 2009E($mm, except per share data) Target Corp 1 TIP REIT "Combined" Standalone 1
Cash Flow Data:EBITDA $5,172 $1,427 $6,599 $6,614Less: Maintenance Capex (1,714) – (1,714) (1,714)Less: Interest Expense 2 (673) (76) (748) (694)Less: Taxes 3 (1,004) (7) (1,011) (1,528)Plus: Change in Net Working Capital 79 – 79 79Plus: Other 73 – 73 73Equals: Maintenance Free Cash Flow $1,933 $1,344 $3,278 $2,830Weighted Average Shares Outstanding 722 722 721Maintenance FCF/Share $2.68 $1.86 $4.54 $3.92
Maintenance FCF/share accretion ($)
Maintenance FCF/share accretion (%)
(1) Assumes sale of remaining 53% interest on credit card receivables for $4.4bn on 01/01/09 with Target retaining $150mm of credit card EBITDA(2) Assumes interest rate on debt of 6.2% at Target Corp and 7.0% at TIP REIT; normalized to exclude $112mm of incremental interest expense due to CY2009 cash E&P distribution(3) Assumes tax rate of 38% for Target Corp and TIP REIT Facilities Management Services business
29
Detailed 2009E Maintenance Free Cash Flows
The Transaction achieves significant cash flow savings given the tax-efficient structure for owning land
$0.62
16%
$0
$20
$40
$60
$80
Target (20-Day Avg. Price) ¹ Target REIT Spin-Off ² 12-Month Price Target ²
$/Sh
are
TIP REIT
Target CorpTarget
Standalone
74%
$40
$70
$38
$32 $42
$42
$83
TIP REIT
Target Corp
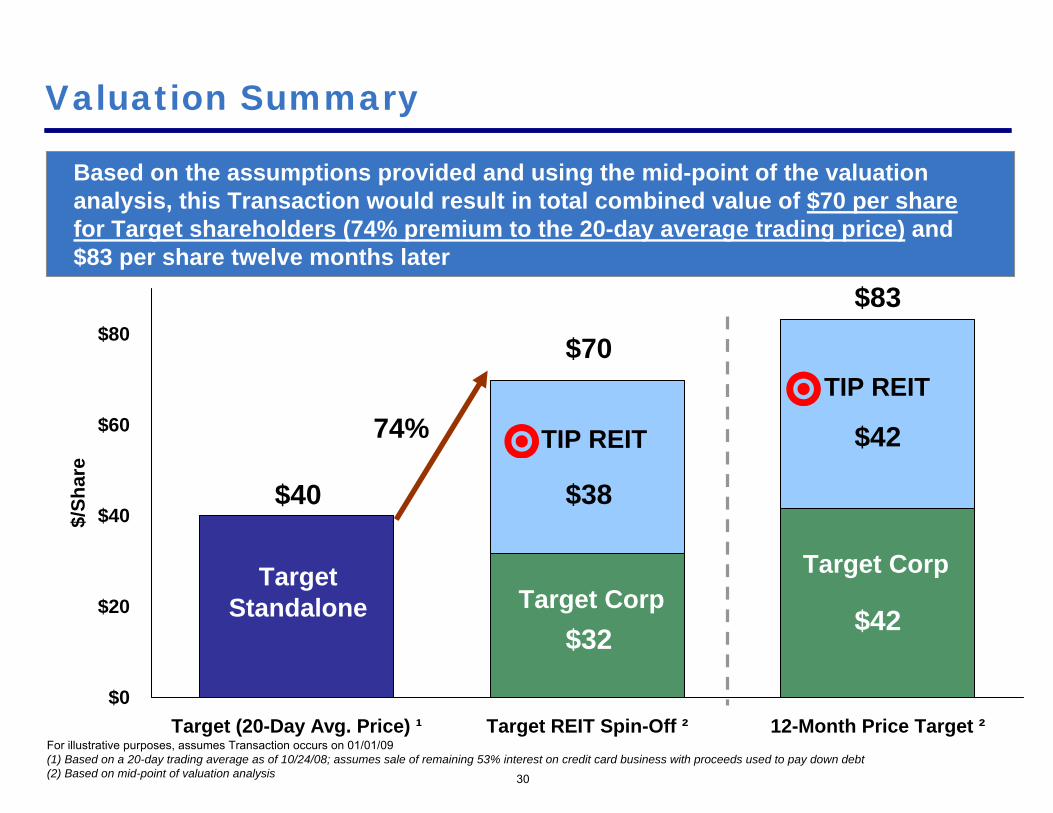
Valuation Summary
30
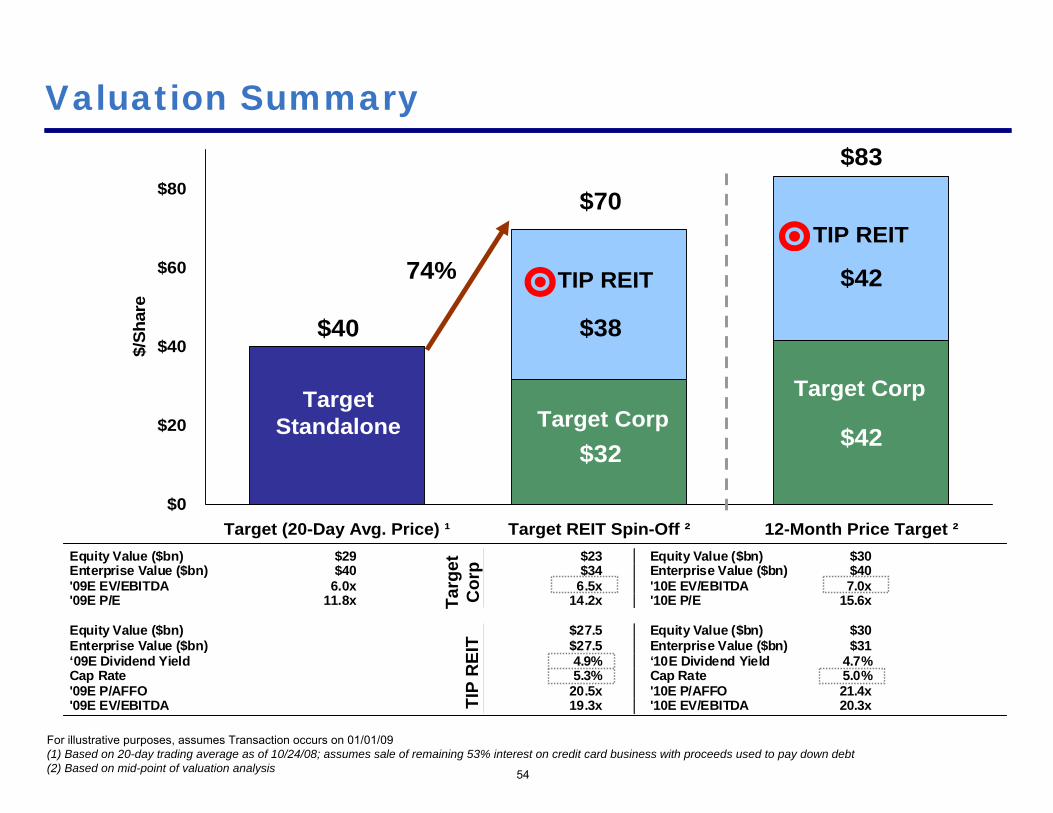
Based on the assumptions provided and using the mid-point of the valuation analysis, this Transaction would result in total combined value of $70 per share for Target shareholders (74% premium to the 20-day average trading price) and $83 per share twelve months later
For illustrative purposes, assumes Transaction occurs on 01/01/09(1) Based on a 20-day trading average as of 10/24/08; assumes sale of remaining 53% interest on credit card business with proceeds used to pay down debt (2) Based on mid-point of valuation analysis

Even ignoring valuation benefits, there are important strategic reasons to consummate the Transaction…
31

Transaction Rationale
33
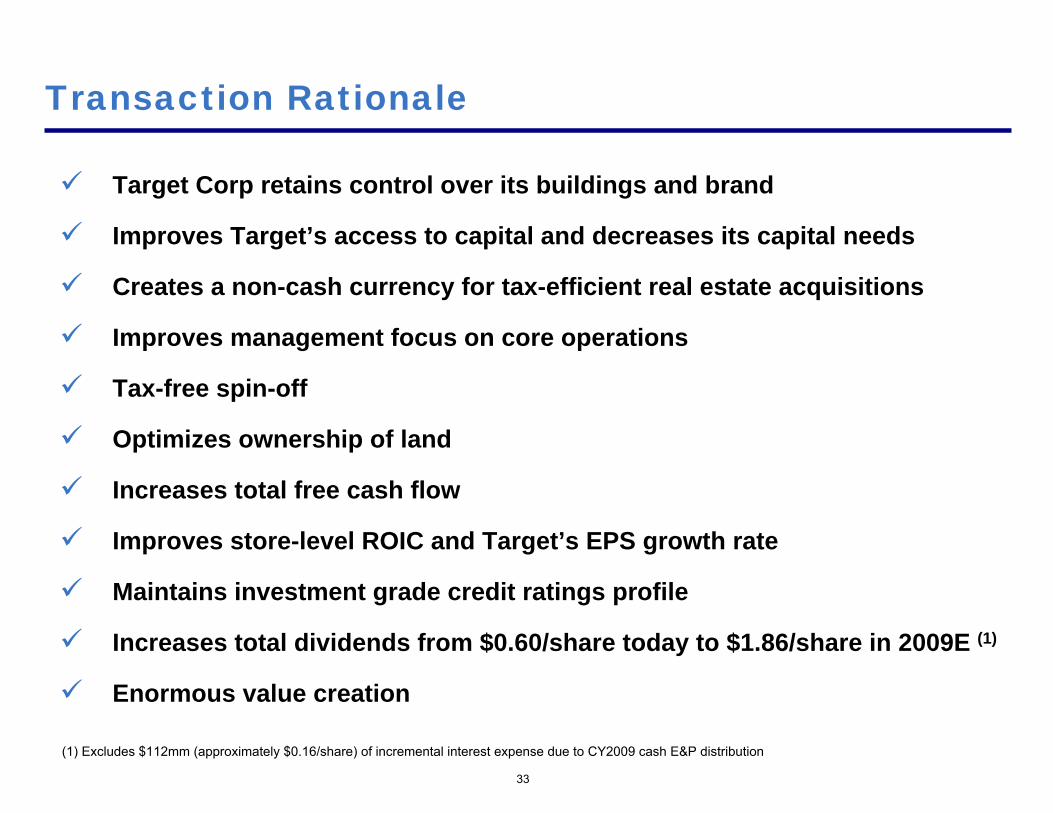
Transaction Rationale
Target Corp retains control over its buildings and brand
Improves Target’s access to capital and decreases its capital needs
Creates a non-cash currency for tax-efficient real estate acquisitions
Improves management focus on core operations
Tax-free spin-off
Optimizes ownership of land
Increases total free cash flow
Improves store-level ROIC and Target’s EPS growth rate
Maintains investment grade credit ratings profile
Increases total dividends from $0.60/share today to $1.86/share in 2009E (1)
Enormous value creation
(1) Excludes $112mm (approximately $0.16/share) of incremental interest expense due to CY2009 cash E&P distribution

34
Retains Control Over its Buildings and Brand
Target Corp maintains control over its real estate construction, remodeling, and relocation efforts
All economic benefits of construction / remodeling of stores stay with Target Corp
Ground lease provides Target Corp with a high degree of control and flexibility
75-year lease term with the ability to relocate and subleaseLease term flexibility on a store-by-store basis
Contingent rent eliminates GAAP straight-line rent leveling requirements
Unique landlord / tenant relationship benefits both TIP REIT and Target CorpTIP REIT and Target Corp have a mutual vested interest in maintaining the strong viability of the Target brand and retail business
Flexible lease structure will allow Target Corp to retain control of its brand and stores

Improves Overall Access to Capital
Simple, predictable businessHigh margins and strong cash flowsUnlevered balance sheet75-year leaseNo transaction incomeInflation-protected income streamTremendous securityNo maintenance capital requirementsNo currency or commodity riskHigh-quality, in-demand tenantDiversified real estate geography
35
Today, only the most stable and unlevered businesses can freely access the debt and equity capital markets. TIP REIT will be one of the most stable companies in the world today
TIP REIT
TIP REIT will have better and cheaper access to the capital markets than any retailer. As such, Target will have a stable strategic and financial partner to fund future growth

Decreases Target Corp’s Capital Needs
Today, on average, it costs Target approximately $100/sq. ft. toprocure and develop land for its stores. In 2009, this is expected to amount to roughly 50% of growth capital or $1.1bn
Outsourcing these capital requirements to TIP REIT would increase Target Corp’s cash flows and decrease its need for growth capital
36(1) Depreciable asset
LandCost of raw landPermits / ZoningProfessional fees (title search,legal, engineering, appraisal, etc…)Surveying and environmental assessmentsReal estate taxes
Land ImprovementsLand excavation (fill, grading)DrainageDemolition costs of existing propertiesSewage systems (1)
Parking lots (1)
Lights (1)
Fencing (1)
Sidewalks (1)
Landscaping (1)

2009E 2009E 2009E 2009E($mm, except per share data) Target Corp (1) TIP REIT "Combined" Standalone (1)
Maintenance Free Cash Flow $1,933 $1,344 $3,278 $2,830
Less: New Building Development/Other Capex (1,112) – (1,112) (1,112)
Less: New Land Development Capex – (1,079) (1,079) (1,079)
Equals: Free Cash Flow after Total Capex $821 $266 $1,087 $639
(1) Assumes sale of remaining 53% interest on credit card receivables for $4.4bn on 01/01/09 with Target retaining $150mm of credit card EBITDA in '09E
37
Decreases Target Corp’s Capital Needs (cont’d)
The Transaction enables Target Corp to generate more free cash flow after growth capex than Target today. As such, Target Corp will not need to access the capital markets because TIP REIT will providefuture growth capital and taxes will be reduced
Target Corp would have approximately $200mm of
incremental FCF after growth capex versus Target Standalone
as a result of not funding new land development and reduced taxes

Creates Currency for Tax Efficient Acquisitions
An UPREIT owns some or all of its assets through an Operating Partnership (“OP”) and can make acquisitions by exchanging OP units for real property
OP units are convertible, on a one-for-one basis, into TIP REIT shares
Utilization of an UPREIT structure would provide TIP REIT with an attractive acquisition currency that allows selling landowners to access liquidity, diversification, and yield without triggering tax
38
Creates Currency for Tax Efficient Acquisitions
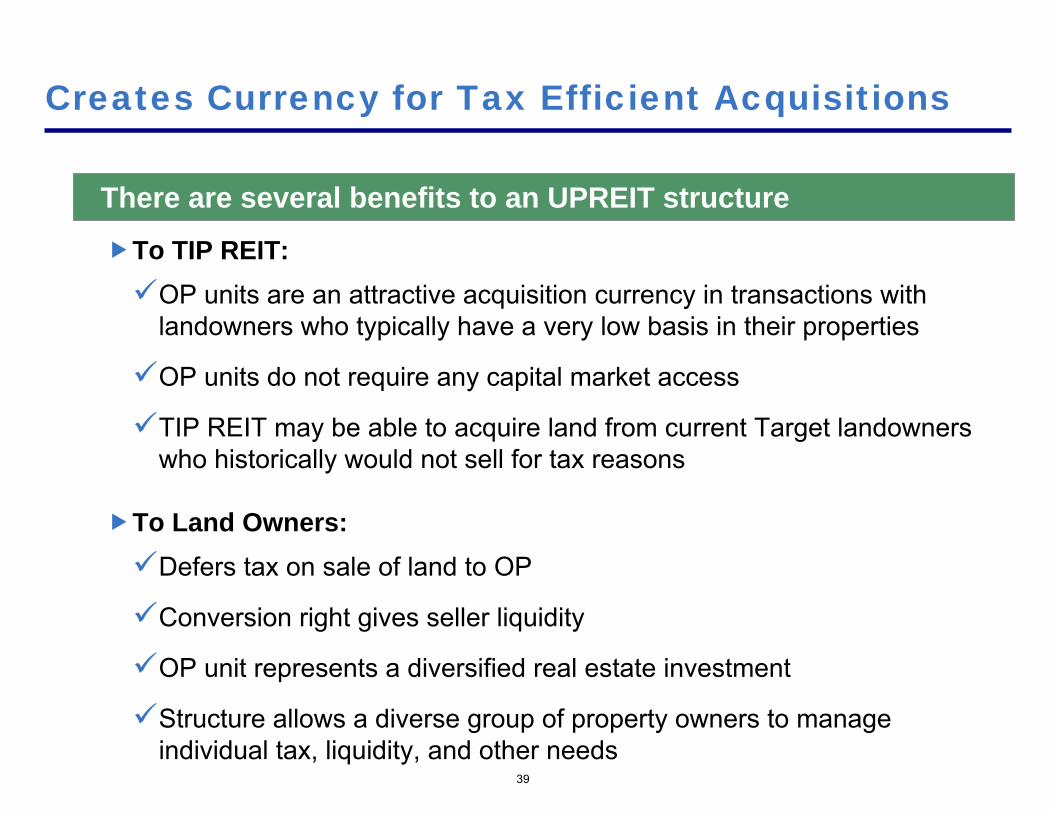
To TIP REIT:OP units are an attractive acquisition currency in transactions with landowners who typically have a very low basis in their properties
OP units do not require any capital market access
TIP REIT may be able to acquire land from current Target landowners who historically would not sell for tax reasons
To Land Owners:Defers tax on sale of land to OP
Conversion right gives seller liquidity
OP unit represents a diversified real estate investment
Structure allows a diverse group of property owners to manage individual tax, liquidity, and other needs
39
There are several benefits to an UPREIT structure

40
Improves Management Focus
Target’s core competency is retailing (i.e. merchandising, branding, marketing, and designing a unique shopping experience)
Management will increase focus on Target’s core competencies and outsource certain other functions:
Facilities management (lawn care, parking lot maintenance, etc.)
Land development, planning, and zoning
Environmental planning
Target Corp can better focus on retailing while TIP REIT can focus on facilities management and land acquisitions
Management will be able to focus on retail operations
41
Tax-free Spin-off
ApplicationRequirements
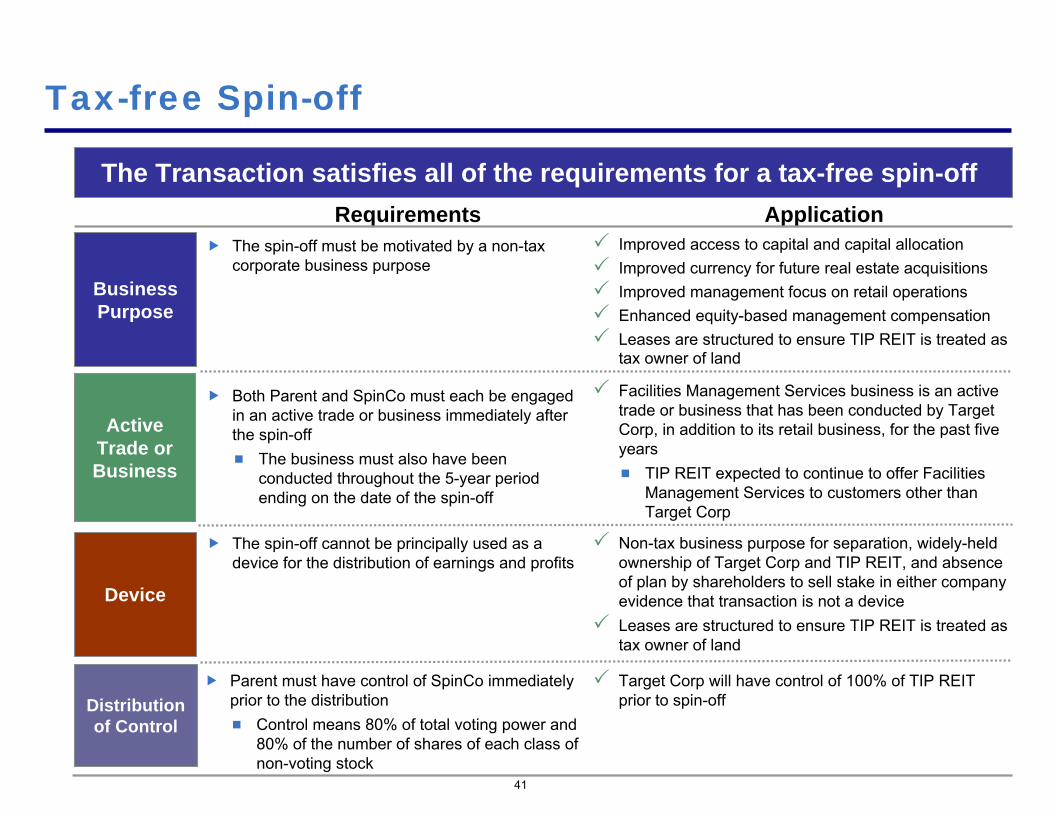
Parent must have control of SpinCo immediately prior to the distribution
Control means 80% of total voting power and 80% of the number of shares of each class of non-voting stock
Business Purpose
Active Trade or Business
Both Parent and SpinCo must each be engaged in an active trade or business immediately after the spin-off
The business must also have been conducted throughout the 5-year period ending on the date of the spin-off
Device
The spin-off cannot be principally used as a device for the distribution of earnings and profits
Distribution of Control
The spin-off must be motivated by a non-tax corporate business purpose
Non-tax business purpose for separation, widely-held ownership of Target Corp and TIP REIT, and absence of plan by shareholders to sell stake in either company evidence that transaction is not a deviceLeases are structured to ensure TIP REIT is treated as tax owner of land
Target Corp will have control of 100% of TIP REIT prior to spin-off
Improved access to capital and capital allocationImproved currency for future real estate acquisitionsImproved management focus on retail operationsEnhanced equity-based management compensationLeases are structured to ensure TIP REIT is treated as tax owner of land
Facilities Management Services business is an active trade or business that has been conducted by Target Corp, in addition to its retail business, for the past five years
TIP REIT expected to continue to offer Facilities Management Services to customers other than Target Corp
The Transaction satisfies all of the requirements for a tax-free spin-off

Optimizes Land Ownership: Depreciation Considerations
Raw land (and the majority of the capitalized costs associated with land procurement / development) cannot be depreciated
Unlike buildings, which are depreciable and remain at Target Corp, land development has minimal offsetting tax deductibility
However, ground rent is tax deductible
As such, long-term ground leases are a more tax-efficient way for a tax-paying entity to control real estate than outright land ownership
Unless it is in the business of land speculation, there is no distinct strategic advantage for a retailer to own land versus a very long-term, covenant-free ground lease
On the other hand, a REIT should own land since (1) it is not a tax-paying entity and does not get any benefits from depreciation and (2) it is in the business of owning real estate
42

Optimizes Land Ownership: REIT Conversion
ApplicationREIT Requirements
Ownership
Asset Test
At least 75% of assets must be comprised of real estate, cash or cash items and Government securitiesREIT can conduct non-real estate related activities through a taxable REIT subsidiary (TRS). TRS shares could be up to 25% of the gross asset value of all the REIT’s assets
Income Test
At least 75% of REIT’s gross income must consist of rents, gain from disposition of real property and income from other REITsRents from related parties are disqualified under the income test (parties are related if there is a 10% or greater ownership by vote or value of the tenant by the REIT)At least 95% of gross income must consist of (i) income that satisfies the 75% income test and (ii) dividends and interest from any source
Distribution Requirements
In the year of election, REIT must distribute C-Corp earnings and profits by end of taxable yearAt least 90% of REIT taxable income must be distributed annually (undistributed income would remain subject to corporate-level tax)
REIT must have 100 or more shareholders Five or fewer individual shareholders may hold no more than 50%
Land satisfies the asset testThe Facilities Management Services business will be placed in a TRS and its income will be taxed at the corporate levelThe value of TIP REIT’s TRS shares will be less than 25% of the total value of TIP REIT
Rental income from leases will satisfy the 75% income test; rental income and dividends will satisfy the 95% income testNew 9.9% TIP REIT ownership restriction will ensure that rents from Target Corp are not related-party rents
TIP REIT will make a taxable distribution of stock and cash by December 31 of year of spin-off to purge retained Earnings and ProfitsTIP REIT will distribute ≥ 100% of its REIT taxable income
TIP REIT will be widely held by the publicRestrictions will be placed on the ownership of TIP REIT shares to ensure no single shareholder may own > 9.9% of its shares
The Transaction satisfies all the requirements of a REIT conversion, thus optimizing the ownership of land for Target shareholders
43

Differential2009E Maintenance FCF/Share 1 $2.68 $1.86 $4.54 $3.92 $0.62
2009E EPS 1 $2.23 $1.79 $4.02 $3.40 $0.62
44
Increases Total FCF via REIT Conversion
Most D&A remains at tax-paying entity (Target Corp)
Ground lease expense at Target Corp is tax deductible
REIT does not pay taxes
TARGET Standalone
TARGETCorp
TIPREIT 2
Using Target’s ’09 P/E multiple of 11.8x (based on $40/share), the incremental earnings accretion from this Transaction creates $7 per share of value ignoring other valuation benefits
(1) Assumes sale of remaining 53% interest on credit card business is sold in both Standalone and Transaction scenarios(2) Normalized to exclude $112mm (approximately $0.16/share) of incremental interest expense due to CY2009 cash E&P distribution
The Transaction allows for greater free cash flow generation forTarget’s shareholders than the Standalone company provides
TARGET“Combined”

45
Improves Store-level ROIC at Target Corp
Assuming the average store real estate costs $26mm, of which $13mm is allocated to the land and $13mm to the building, store-level return on investment increases from 23.0% to 39.8%
(1) Assumes $0.9mm of ground lease rent expense, based on $7/sq. ft. lease cost and 131k of store square footage, on average
Owned Store Level Operating Data and Assumptions ($mm)
Standalone 2007A
Pro Forma 2007A
Retail Sales per Avg. Store $40 $40
Estimated Four-Wall Operating Costs 34 35 Ground Lease Expense per Avg. Store -- 1(1)
Estimated Four-Wall EBIT per Avg. Store $6 $5 Margin (%) 15.0% 13.0%
New Land Capex $13 -- New Building Capex 13 13 Total Investment $26 $13 Estimated Returns on Investment (%) 23.0% 39.8%
Earnings per Share ($)'09-'13CAGR
2008 2009 2010 2011 2012 2013 (%)
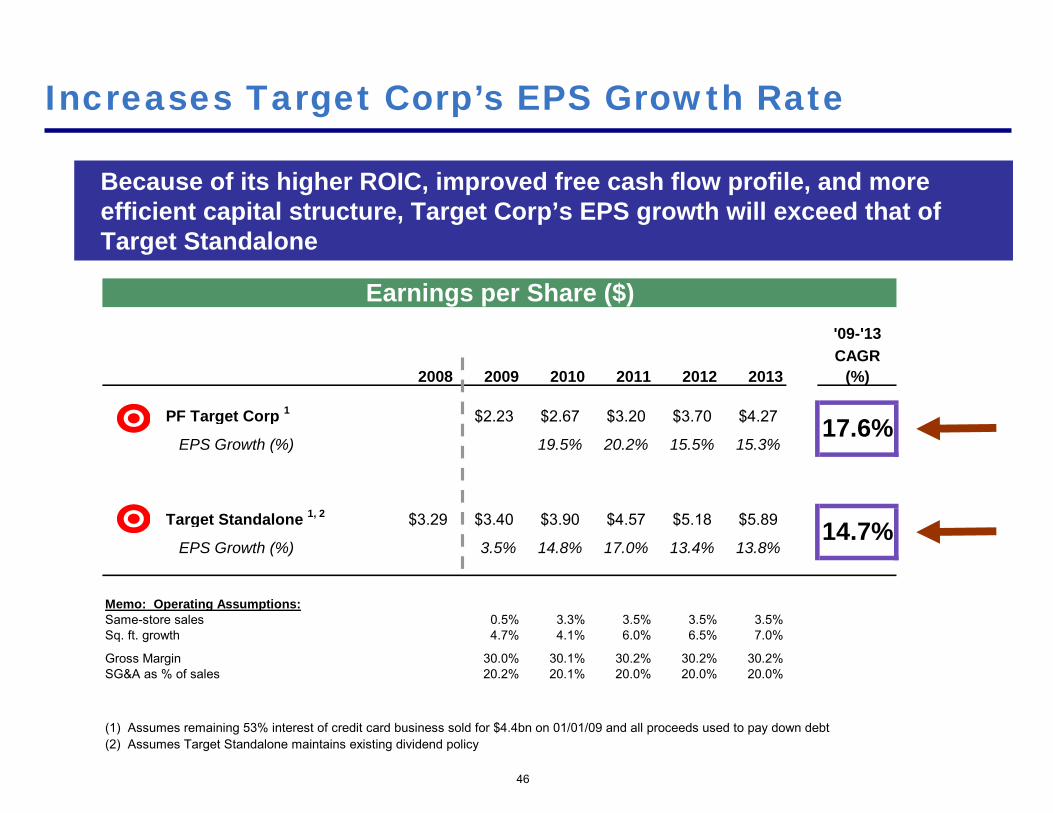
PF Target Corp 1 $2.23 $2.67 $3.20 $3.70 $4.27
EPS Growth (%) 19.5% 20.2% 15.5% 15.3%
Target Standalone 1, 2 $3.29 $3.40 $3.90 $4.57 $5.18 $5.89
EPS Growth (%) 3.5% 14.8% 17.0% 13.4% 13.8%
Memo: Operating Assumptions:Same-store sales 0.5% 3.3% 3.5% 3.5% 3.5%Sq. ft. growth 4.7% 4.1% 6.0% 6.5% 7.0%
Gross Margin 30.0% 30.1% 30.2% 30.2% 30.2%SG&A as % of sales 20.2% 20.1% 20.0% 20.0% 20.0%
(1) Assumes remaining 53% interest of credit card business sold for $4.4bn on 01/01/09 and all proceeds used to pay down debt(2) Assumes Target Standalone maintains existing dividend policy
17.6%
14.7%
46
Increases Target Corp’s EPS Growth Rate
Because of its higher ROIC, improved free cash flow profile, and more efficient capital structure, Target Corp’s EPS growth will exceed that of Target Standalone

8.0%8.0%9.0%9.0%
10.0%10.0%11.0%
12.0%12.0%12.0%12.9%13.0%
13.5%14.0%14.0%
14.5%14.7%(1),(2),(3)
15.0%16.0%
17.6%(1),(2),(3)
0
3
6
9
12
15
18
21
WholeFoods
Kohl's CVS Lowe's Staples Walgreens TJX Costco Safeway HomeDepot
Best Buy Wal-Mart Sears BJ's Kroger JCPenney
Average(4) = 11.9%
47
Long-term EPS Growth (%)
Pro forma for the Transaction, Target Corp’s long-term EPS growth rate would be at the top of its peer group
Corp Standalone
Increases Target Corp’s EPS Growth Rate (cont’d)
SUPERVALU Macy’s
(1) Represents 2009–2013 EPS CAGR(2) Assumes additional future share buyback at a constant forward P/E of 16.0x(3) Assumes sale of credit card business for $4.4bn on 1/1/09 and uses proceeds to pay down debt(4) Excludes TargetSource: FactSet and Company filings for Retailers, excluding Target

Target Corp Target Combined"De-consolidated View" "Consolidated View"
PF 2008E Credit Metrics:Lease Adj. Debt/EBITDAR 3.6x 2.4xDebt/EBITDA 2.3x 2.3xEBITDAR/(Interest + Rent) 3.2x 7.3xEBITDA/(Interest) 9.7x 8.8x
Expected Rating Mid - High BBB/Baa A- / A3
48
Maintains Investment Grade Credit Ratings
To be conservative, we have assumed that the agencies will take a “De-consolidated View” and Target will maintain solid investment grade ratings in the Mid - High BBB/Baa category (versus A+/A2 rating today)
Post-transaction, we believe Target Corp will be rated investment grade, either in the Mid - High BBB or Low A categories, depending on whether the rating agencies take a “De-consolidated” or “Consolidated” view. A “Consolidated”view would assess the credit profile of the Target system, effectively cancelling TIP REIT’s rent payments, leading to a higher rating. This is similar to how the agencies rate Coca Cola and its bottlers

"Combined"Consol. Rating
Target TIP Intercompany Angencies($mm) Corp REIT Adjustments ViewBalance Sheet Data:8/2/08 Debt $19,655 – – $19,655Less: Debt Paydown with H2 '08 Cash Flow 1 (200) – – (200)Less: Debt Paydown from Excess Cash – – – 0CY2008E Debt 19,455 – – $19,455Less: Debt Paydown from Credit Card Proceeds (4,400) – – (4,400)Less: Elimination of JPMorgan Financing (3,600) – – (3,600)Plus: Debt Issued for E&P Distribution at TIP REIT 2 – 1,600 – 1,600Plus: Debt Issued to Fund Land Development at TIP REIT 3 – 1,322 – 1,322Less: Debt Paydown – – – PF2008E Ending Debt $11,455 $2,922 – $14,377Plus: Lease Adjusted Debt (8x 2008E Total Lease Expense) 12,309 – (10,956) 1,353PF2008E Lease Adj. Total Debt $23,764 $2,922 ($10,956) $15,730
PF 2008E Credit Metrics:Debt / EBITDA 2.3x 2.2x – 2.3xLease Adj. Total Debt / EBITDAR 3.6x 2.2x – 2.4xEBITDAR / (Interest+Rent) 3.2x 6.6x – 7.3x
(1) Assumes remaining 53% interest of credit card business sold for $4.4bn on 01/01/09 and all proceeds used to pay down debt(2) $1.6bn of debt issued to fund E&P dividend, which must be paid by December 31 of the year REIT status is elected(3) Assumes that 1st year land acquisitions financed solely with debt
Pro Forma 2008E Balance Sheets
The table below sets forth the Balance Sheets for the two entities
49

Target Corp: Deleveraging to an “A” Ratings Profile after 2 Years
TIP REIT will be required to fund land capex for the first two years after the spin-off. Thereafter, TIP REIT will be Target Corp’s land developer through its Preferred Vendor Agreement. As such, Target Corp will generate significant free cash flow and will likely deleverage to an A-/A3 ratings profile after two years
Despite temporarily having a lower credit rating than today, (1) Target Corp will not need access to capital because it will be significantly free cash flow positive after growth capex and (2) it will be able to deleverage back to an “A”category credit rating in a short time frame
50
PF 2008E 2009E 2010E 2011E
($bn, except where noted)End of Year Debt Balance 11.5 10.8 9.6 8.3
Lease Adj. Debt 12.3 12.9 13.8 15.0
End of Year Adj. Debt Balance 23.8 23.8 23.4 23.3
EBITDAR 6.5 6.8 7.5 8.4
Target Corp Adj. Debt/EBITDAR 3.6x 3.5x 3.1x 2.8x
Expected Ratings Profile Mid - High BBB/Baa Mid - High BBB/Baa High BBB/Baa A- / A3

Target Corp: Bondholders’ Perspective
51
The Transaction allows for meaningful debt paydown by 2011E of $7.8bn. Of this amount, $4.4bn comes from selling the remaining 53% interest in credit card receivables and $3.2bn from free cash flow after operating and investing activities
Target Corp Balance Sheet Data
($bn) Debt Cash Comments
August 2, 2008 Debt $16.1 $1.5 Debt excludes JP Morgan GAAP liability of $3.6bn
Less: Credit Card Proceeds (4.4) Sale of 53% interest of credit card receivables for $4.4bn
Less: Debt Paydown from H2 '08E (0.2) Assumes $1bn of stock buyback
CY2008E Debt 11.5 0.5 (1)
Less: Debt Paydown in '09E (0.6) 0.7 (1) 78% of Free Cash Flow generated
Less: Debt Paydown in '10E (1.2) 0.7 (1) 96% of Free Cash Flow generated
Less: Debt Paydown in '11E (1.3) 0.8 (1) 95% of Free Cash Flow generated
CY2011E Debt $8.3 $0.8 (1)
(1) Assumes a minimum cash balance of 1% of sales

What’s Better: Debt or a TIP REIT Master Lease?
52
Debt TIP REIT Master Lease
Liquidity Risk Yes None
Financial Covenants Many covenants None
Holders Unrelated investors Strategic partner /“Friendly landlord”
Market access? Currently difficult to access Spin-off will obviaterequiring access
Duration 30 year maximum 75 years
Target’s cost 7.3% for 10-year bond 7%(20-day average cost) (Rent / cost sq. ft.)
TIP REIT’s Master Lease is much more attractive than long-term debt

Strong Similarities with a Credit Card Partnership
Credit Card Partnership
TIP REITSpin-off
Control
Taxable Gains
Use of Proceeds
Improved AccessTo Capital
Capital Allocation
Target can control its credit card business without the need to own receivables
Target can control its buildings and retailing strategy without the need to own land
Receivables ownership is transferred to a party with a lower cost of capital
Land (and land improvements) ownership is transferred to a party with a lower cost of capital
Primarily to return capital to shareholders (via buyback)
Return capital to shareholders (via spin-off of TIP REIT)
Minimal NoneCredit Card Partner funds future receivables growth
TIP REIT funds future land procurement and development
ROIC CC ROIC improves significantly Store-level ROIC nearly doubles
53
$0
$20
$40
$60
$80
Target (20-Day Avg. Price) ¹ Target REIT Spin-Off ² 12-Month Price Target ²
$/Sh
are
TIP REIT
Target CorpTarget
Standalone
74%
$40
$70
$38
$32 $42
$42
$83
TIP REIT
Target Corp
Valuation Summary
54
For illustrative purposes, assumes Transaction occurs on 01/01/09(1) Based on 20-day trading average as of 10/24/08; assumes sale of remaining 53% interest on credit card business with proceeds used to pay down debt (2) Based on mid-point of valuation analysis
Equity Value ($bn) $29 $23 Equity Value ($bn) $30Enterprise Value ($bn) $40 $34 Enterprise Value ($bn) $40 '09E EV/EBITDA 6.0x 6.5x '10E EV/EBITDA 7.0x '09E P/E 11.8x 14.2x '10E P/E 15.6x Equity Value ($bn) $27.5 Equity Value ($bn) $30 Enterprise Value ($bn) $27.5 Enterprise Value ($bn) $31 ‘09E Dividend Yield 4.9% ‘10E Dividend Yield 4.7% Cap Rate 5.3% Cap Rate 5.0% '09E P/AFFO 20.5x '10E P/AFFO 21.4x '09E EV/EBITDA 19.3x '10E EV/EBITDA 20.3x
Targ
etC
orp
TIP
REI
T

$40/share $7/share$17/share
$70/share
0
20
40
60
80
100
Target StandaloneValue/Share (Assuming
20-Day Avg. PriceMultiples)
Incremental EarningsGeneration
TIP REIT MultipleExpansion
Target Corp MultipleExpansion
Pro Forma Value/Share
$5/share
(1) Normalized to exclude $112mm of incremental interest expense due to CY2009 cash E&P distributions(2) Implied P/E multiple of 21.3x based on the mid-point of today’s estimated market value of $27.5bn, implying a 20.5x 2009E AFFO multiple, 4.9% dividend yield and 5.3% cap rate
Sources of Value
The main sources of value creation are incremental earnings generation via the REIT structure and multiple expansion at TIP REIT and Target Corp
55
$/Sha
re
MultipleIncremental EPS Generation Multiple Expansion Valuation Expansion
"Target Combined" 2009E EPS $4.02 Target Corp 2009E EPS $2.23 $2.23Target Standalone 2009E EPS $3.40 Implied P/E Multiple 14.2x 2.4xDifference $0.62 Target Corp ($/share) $32 $5
Target Current EPS Multiple 11.8x TIP REIT 2009E EPS (1) $1.79 $1.79Implied P/E Multiple (2) 21.3x 9.6x
Value Creation from Incremental EPS ($/share) $7 TIP REIT ($/share) $38 $17

$109
$97
$83
$70
$50
$60
$70
$80
$90
$100
$110
Today 1 Year 2 Year 3 Year
$/S
hare
Hypothetical Value Creation over Time (1)
The implied hypothetical future value per share post-transaction for Target shareholders is $109 in three years
56
Post-TransactionHypothetical Valuation
(1) Future values post 1-year are based on constant multiples(2) Excludes one-time dividend from E&P distribution
TRANSACTIONTarget Corp - Hypothetical Value/Share $32 $42 $50 $58TIP REIT - Hypothetical Value/Share $38 $40 $43 $45TIP REIT - Cumulative Dividend (2) $0 $2 $4 $6Total Hypothetical Value/Share ($) $70 $83 $97 $109
Valuation: Potential Questions and Answers
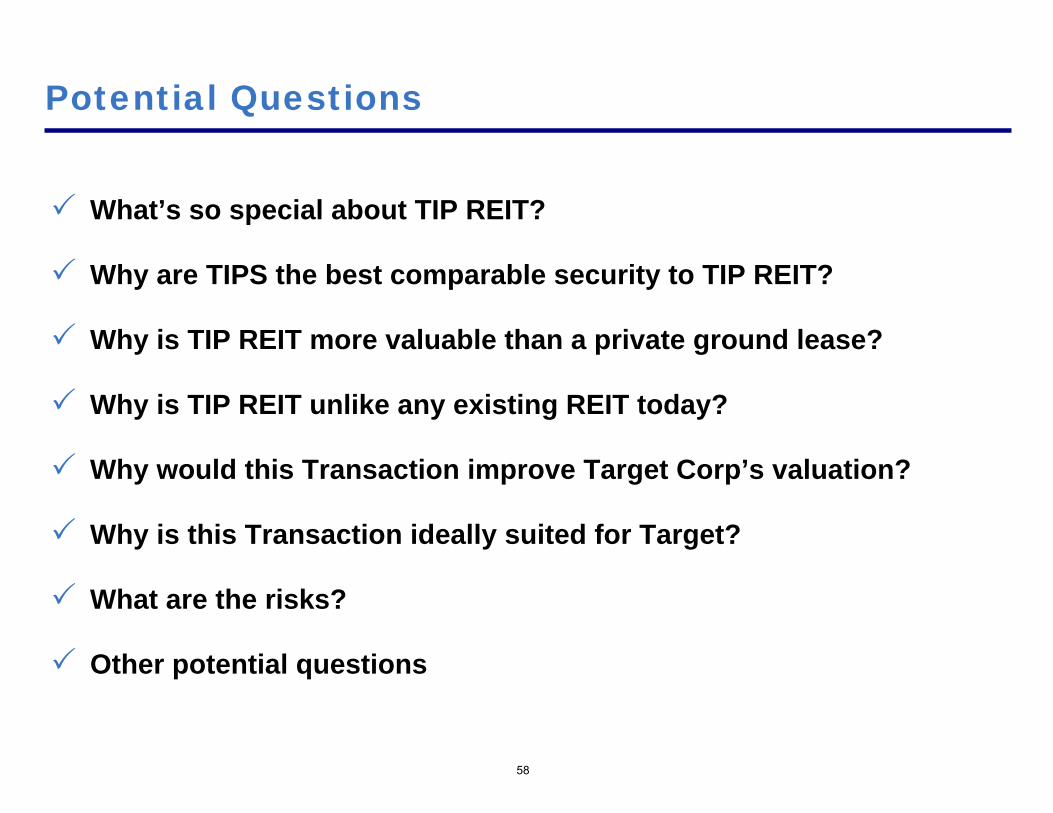
Potential Questions
What’s so special about TIP REIT?
Why are TIPS the best comparable security to TIP REIT?
Why is TIP REIT more valuable than a private ground lease?
Why is TIP REIT unlike any existing REIT today?
Why would this Transaction improve Target Corp’s valuation?
Why is this Transaction ideally suited for Target?
What are the risks?
Other potential questions
58

What’s So Special About TIP REIT?

60
TIP REIT Investment Highlights
“Land-only” structure is extremely secure■ $39bn of “Lease Security”, including $20bn of unencumbered buildings
Long-term lease provides bond-like stability and inflation-protection■ 75-year, inflation-protected “Master Lease” with Target Corp
Significant growth opportunity■ Formal arrangement with Target Corp provides long-term growth pipeline
High quality locations and superb tenant profile
De minimis maintenance capex allows for strong FCF generation
Tremendous size and scale – a “must-own” REIT

Ground leases are the most secure form of real estate investmentIn the event of a default on a ground lease, the building and improvements revert to the landowner
As such, in the event of tenant default, a landowner can re-lease the land and the building at significantly lower rent than market and still maintain its current lease payments
61
“Land-only” Structure is Tremendously Secure
TIP REIT’s land-only leases are the most secure form of real estate investment
Because it will lose its building in the event of default, a tenant is highly motivated to make its ground lease payments. The unencumbered building acts as collateral, making the ground lease extremely secure
Ground lessor leases land at
$7 / sq. ft.
Ground lessor re-leases land AND buildingat $13/sq. ft.
$7 sq. ft.Rent
$13 sq. ft.Rent
Event of default
Today
Illustrative Example: Significant cushion for rents to fall in the event of default

62
$39 Billion of “Lease Security”
Although the buildings are not pledged as security, they will revert to the landowner upon a ground lease default. As such, illustratively, we define TIP REIT’s “Lease Security” as the value of the land and unencumbered buildings. Based on replacement cost, this “Lease Security” is valued at $39bn
Total “Lease Security”: $39bn Unencumbered “Collateral”: $20bn (3)
(1) Analysis excludes the value of owned buildings on third-party ground leased land; assumes cost of a Target store of $26mm ($13mm building and $13mm land) and cost of DC and WH of $70mm ($50mm building and $20mm land)(2) Assumes 1,438 stores, and 25 DCs and WHs on owned land in 2008E(3) Although the buildings are not pledged as security, the effective result is that they act like “collateral” in the event of tenant default
Replacement Value of Owned Land and Buildings (1), (2) Value of Buildings Only (on the Owned Land) (1)
2008E Retail Real Estate: Retail Buildings - 1,438 Stores in '08E:
2008E Estimated Owned Value / Total Value Estimated Replacement Cost per Square Foot $99Total Sq. Ft. (mm) % Owned Sq. Ft. (mm) Sq. Ft. ($bn) 2008E Owned Square Feet (mm) 189
222 85% 189 $197 37.4 Value of Owned Store Buildings ($bn) $18.7
2008E DCs and WHs: DC and WH Buildings - 25 DCs and WHs in '08E:
2008E Estimated Owned Value / Total Value Estimated Replacement Cost per Square Foot $36Total Sq. Ft. (mm) % Owned Sq. Ft. (mm) Sq. Ft. ($bn) 2008E Owned Square Feet (mm) 35
44 81% 35 $50 1.8 Value of Owned DC and WH Buildings ($bn) $1.3
Total Real Estate Replacement Value ($bn) $39.1 Total Value of Buildings on Owned Land ($bn) $19.9

63
Unencumbered Assets Provide Significant Coverage
Based on our illustrative definition of “Lease Security,” if TIP REIT trades at a dividend yield of 4.9%, its “Lease Security” would still be worth 142% of the enterprise value of TIP REIT. No other REIT in the world today has this level of asset coverage in the event of a tenant default
(1) Based on the implied mid-point of valuation
$ in billions
"Lease Security"Value of Land and Unencumbered Buildings $39.1
TIP REIT Enterprise Value at 4.9% Dividend Yield $27.5 (1)
Illustrative Asset Coverage"Lease Security" / EV 142%

64
Benefits of a Master Lease
Under a master lease, all of the sites will be subject to a single lease agreement
The master lease provides for an aggregate amount due for all of the sites
Under the master lease, a failure to pay full rent due on a single site will cause all of the leases covered by the master lease to be in default
TIP REIT’s rights under the master lease require Target Corp to satisfy its lease obligations under all events
As the tenant, Target Corp must continue making lease payments to maintain ownership of all buildings and other improvements
A Master Lease has a number of structural advantages that will enhance the stability and security of TIP REIT

65
Long-term Lease Provides Bond-like Stability
Given its long-term lease arrangement and its land-only structure, TIP REIT’s risk profile will be similar to that of a long-term, senior secured, highly-rated, and inflation-protected bond
75-year Master Lease
Long-term lease
100% occupancy
Highly rated, high-quality tenant in Target
Inflation protection
Extremely low probability of lease default
Land-only REIT structure
$39bn of “lease security” or 142% asset coverage at a 4.9% dividend yieldEffectively “over collateralized” by $20bn of buildings
Highly-rated
Senior Secured
Inflation-protected
Bond
TIP REITRisk profile:
Long-term

TIP REIT’s Preferred Vendor Agreement with Target Corp will provide it with a strong pipeline of land development opportunities
Target Corp believes that in the U.S. alone it can double its store count to more than 3,000 stores
Significant square footage growth at TIP REIT will translate into strong NOI growth
2009E – 2013E retail square footage CAGR of 6.8%
2009E – 2013E top-line CAGR of 9.3%
2009E – 2013E NOI CAGR of 9.3%
66
Significant Growth Opportunity
In addition to its incredibly stable and secure cash flows, TIP REIT has strong growth prospects, given its initial 2-year exclusive right as Target Corp’s land developer and its formal Preferred Vendor Agreement with Target Corp thereafter

67
High Quality Locations and Superb Tenant
TIP REIT’s high quality locations and strong tenant profile will support its premium valuation
Attractive urban / suburban locations with strong demographicsGeographically diversified portfolio of approximately 1,438 stores (1) in 48 statesMultiple opportunities for alternative use of land sitesAbility to attract shadow development, enhancing value of ground leases as sites evolve into in-fill locations
Strong tenant in Target CorpLeading brand, market share winner and “in demand” tenantInvestment grade tenant with strong financial outlookStrong focus on maintaining and improving buildings100% occupancy for 75 yearsLow store churn rate
(1) Represents 2008E Target Corp stores on TIP REIT land

(1) Represents non-financial companies in the S&P 500 with market caps greater than $20bn(2) Based on 2009E dividends
Rank Company Market Cap.
($mm) 55 Home Depot 31,439
56 Devon Energy 30,851
57 Lockheed Martin 30,382
58 Union Pacific 29,674
59 Colgate-Palmolive 28,291
60 American Express 27,898
61 UnitedHealth Group 27,896
62 TIP REIT 27,500
63 Burlington Northern Santa Fe 27,386
64 Southern Co. 26,656
65 E.I. DuPont de Nemours & Co. 26,466
Rank Company Dividend Yield (%) 1 Pfizer 7.72 Verizon Communications 7.3 3 Dow Chemical 7.0 4 Bristol-Myers Squibb 7.0 5 General Electric 7.0 6 Altria Group 6.7 7 AT&T 6.5 8 Carnival 6.0 9 Eli Lilly 5.9 10 E.I. DuPont de Nemours 5.6 11 Merck 5.6 12 Philip Morris International 5.3 13 Caterpillar 5.0 14 TIP REIT (2) 4.9 15 Home Depot 4.9 16 Southern Co. 4.9
68
Large Market Cap — Must Own Yield Stock
TIP REIT will be the 62nd largest company in the S&P 500
Given its market cap, TIP REIT will be owned by S&P 500 index funds, large cap funds, real estate index funds, yield-oriented investors, and investors seeking inflation-protected assets
S&P 100 Non-Financials Ranked by Dividend Yield (1)S&P 500 Ranked by Market Cap

Why are Treasury Inflation Protected Securities (“TIPS”) the Best Comparable Security to TIP REIT?
70
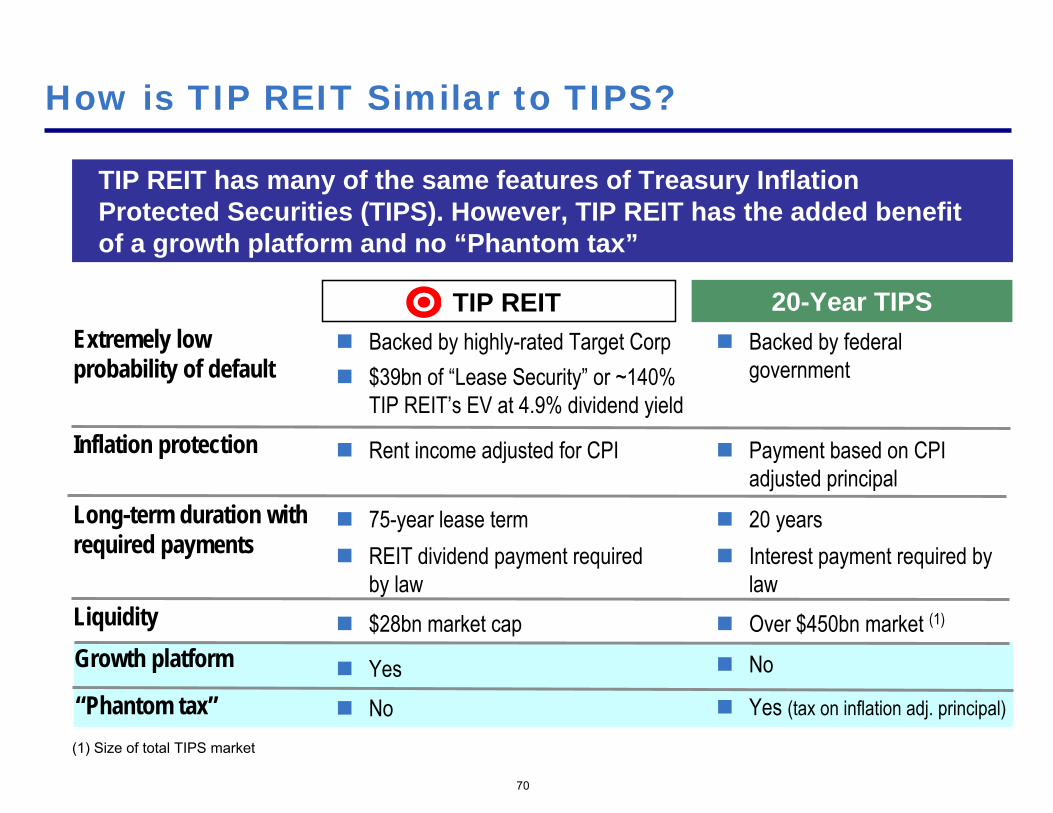
How is TIP REIT Similar to TIPS?
TIP REIT has many of the same features of Treasury Inflation Protected Securities (TIPS). However, TIP REIT has the added benefit of a growth platform and no “Phantom tax”
20-Year TIPSTIP REITExtremely low probability of default
Backed by highly-rated Target Corp$39bn of “Lease Security” or ~140% TIP REIT’s EV at 4.9% dividend yield
Backed by federal government
Inflation protection Payment based on CPI adjusted principal
Rent income adjusted for CPI
Long-term duration with required payments
75-year lease termREIT dividend payment required by law
20 yearsInterest payment required by law
Liquidity $28bn market cap Over $450bn market (1)
Growth platform
“Phantom tax”Yes No
No Yes (tax on inflation adj. principal)
(1) Size of total TIPS market

71
TIP REIT Can Be Valued As Two Entities
TIP REIT stock can be valued as two entities: (1) an Inflation-Protected Secured Bond that is nearly identical to TIPS and (2) a Land Developer with a stable growth platform
TIP REITTIP-like Security Land Developer
Cash flows generated as the Preferred Land Developer of new Target stores
Exclusive right to be Target’s land developer for the first two years post Transaction
Preferred Land Developer after two years
Attractive 6% – 8% square footage growth for the foreseeable future
Provide Facilities Management services as part of land developer platform
Cash flows from the rental income generated by the existing, “static” ground lease portfolio
Nearly identical to TIPS, given stability, security and the long-term, inflation-adjusted nature of the Master Lease
Inflation-linked rents based on the same CPI measure as used for TIPS
Semi-annual dividend payments on the same date as TIPS interest payments
Highly liquid

72
TIP REIT: (1) Valuing the TIP-like Security
TIP REIT: TIP-like Security
The TIP-like Security should trade at a small spread to TIPS of 165 – 215 bps
Rate / Yield Spread to TIPS
165 bps — 215 bps
3.0%
165 bps — 215 bps
4.65% — 5.15%
20-year TIP Yield Today
Current TGT Unsecured CDS @ 190bps ± 25 bps 1.65% — 2.15%
—
The current TIPS yield of 3.0% implies an expected 20-year inflation rate of only 1.4%. If the expected 20-year inflation rate increased to 2.0% and the 20-year Treasury rate remained constant, then the 20-year TIPS would yield 2.4% and TIP REIT would yield 4.05% – 4.55%. The higher the inflation rate, the more valuable TIP REIT will be

TIP REIT: (1) Valuing the TIP-like Security (cont’d)
Importantly, we believe our TIPS-based valuation analysis conservatively measures TIP REIT’s credit risk
73
In the preceding analysis, we use Target’s unsecured CDS spreads as the measure of credit risk under the TIP REIT Master Lease.
We believe this is conservative because while TIP REIT has Target’s (unsecured) credit, it also has $20bn of unencumbered buildings that would revert to TIP REIT in the event of tenant default.
We estimate that Target’s ground lease credit risk should be materially lower than Target’s unsecured CDS spread
74
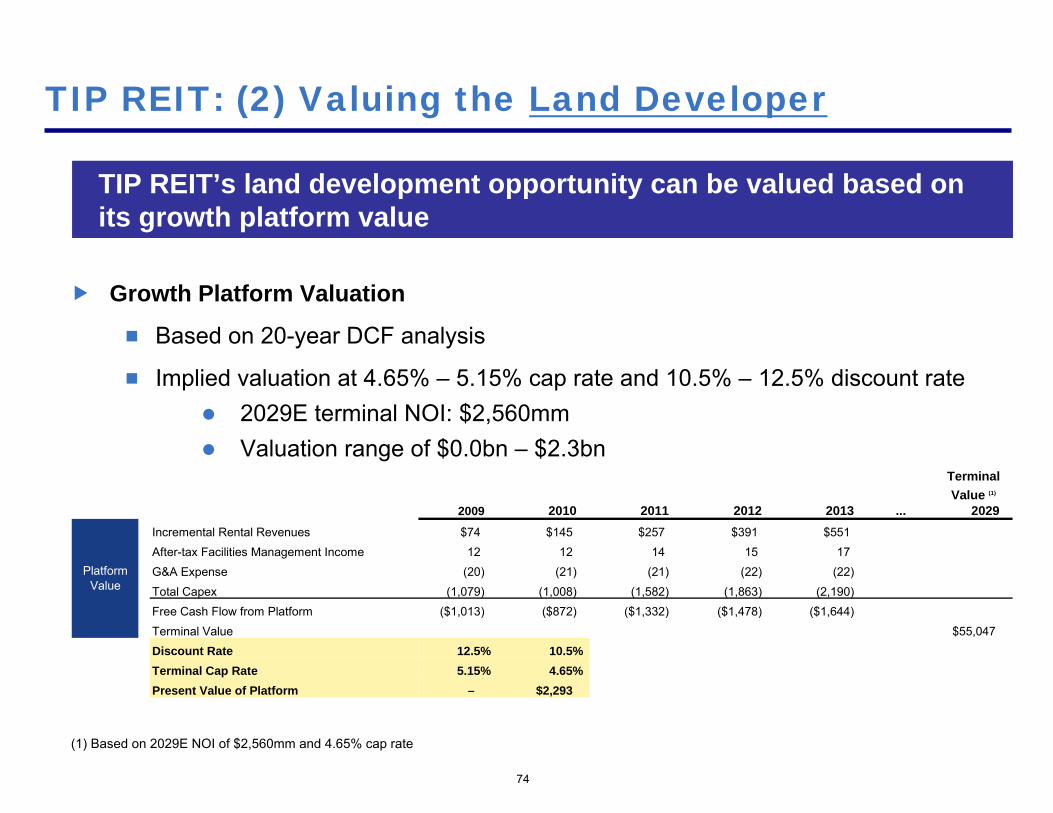
TIP REIT: (2) Valuing the Land Developer
TIP REIT’s land development opportunity can be valued based on its growth platform value
Growth Platform Valuation
Based on 20-year DCF analysis
Implied valuation at 4.65% – 5.15% cap rate and 10.5% – 12.5% discount rate2029E terminal NOI: $2,560mmValuation range of $0.0bn – $2.3bn
(1) Based on 2029E NOI of $2,560mm and 4.65% cap rate
TerminalValue (1)
2009 2010 2011 2012 2013 ... 2029Incremental Rental Revenues $74 $145 $257 $391 $551After-tax Facilities Management Income 12 12 14 15 17G&A Expense (20) (21) (21) (22) (22)Total Capex (1,079) (1,008) (1,582) (1,863) (2,190)Free Cash Flow from Platform ($1,013) ($872) ($1,332) ($1,478) ($1,644)Terminal Value $55,047Discount Rate 12.5% 10.5%Terminal Cap Rate 5.15% 4.65%Present Value of Platform – $2,293
Platform Value

75
Valuation: TIP REIT in Total
TIP-like Security
Land Developer
Equity Value (1) Implied Cap Rate (2)
Total TIP REIT
$38/share 4.9%
(1) At mid-point valuation(2) Implied yield calculated based on NOI / Implied value
$2/share
$40/share 5.1%
Based on “TIPS”-based valuation of TIP REIT, the implied TIP REIT valuation is $29bn, or $40/share today
Valuation
2008E Existing dividends: $1,354mm
Dividend yield: 4.65% – 5.15%
Valuation: $26bn – $29bn
2029E NOI: $2,560mm
Terminal cap rate: 4.65% – 5.15%
Discount rate on 20-yr DCF: 10.5% – 12.5%
Valuation: $0.0bn – $2.3bn
2009E NOI of $1,462mm
Valuation: $26bn – $31bn or $36/share – $44/share
TIP REIT
Target Corp
$70
$38
$32
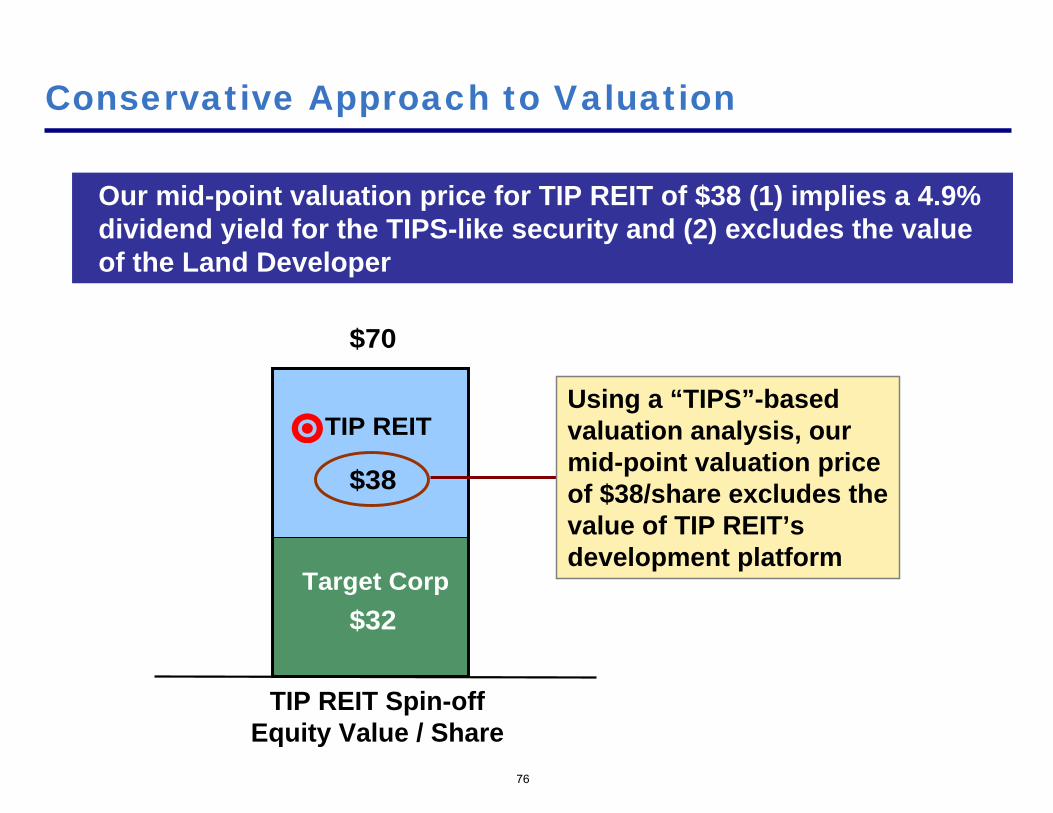
Conservative Approach to Valuation
Our mid-point valuation price for TIP REIT of $38 (1) implies a 4.9% dividend yield for the TIPS-like security and (2) excludes the value of the Land Developer
TIP REIT Spin-offEquity Value / Share
76
Using a “TIPS”-based valuation analysis, our mid-point valuation price of $38/share excludes the value of TIP REIT’s development platform

TIP REIT Presents an Attractive Arbitrage
Long: TIP REIT @ $38 (mid-point of valuation analysis) –implies a ~490 bps dividend yield
Short: TIPS @ 300 bps yield
= Spread: 190 bps
Value: (1) Keep the 190 bps spread (nearly risk-free, given the security offered by $20bn of unencumbered buildings), or hedge Target unsecured risk with CDS
(2) Get the Land Developer for free, worth $2/share
77

How is this Trade Possible?
78
This arbitrage trade is feasible for several reasons:
The TIPS market is highly liquid
TIP REIT would be a highly liquid security with an initial market capitalization of approximately $28 billion
TIPS trade, even in the current low liquidity environment, approximately $1 – $2 billion per day
Normal volume is typically $3 – $5 billion or more per day
TIPS are readily borrowable and easily shortable
TIP REIT would pay semi-annual dividends on the exact same day that TIPS pay interest payments (Jan 15th and July 15th )

High Demand for Inflation-Protected Securities
79
Pensions, endowments, retirement funds
Income-oriented institutional funds
Retail / individual investorsTIP REIT solves the “phantom tax” problem for individual investors
Depository institutions
Arbitrage / hedge funds
Insurance companies
Strong international demand generated by recent European pension reforms requiring returns linked to inflation
There is a strong demand for liquid, inflation-protected, income-oriented securities that offer higher yields than TIPS

Why is TIP REIT More Valuable than a Private Ground Lease?

Building Lot Total LeaseSize Size Lease Term with
Transaction Tenant Location (Sq. Ft.) (Acres) Cap Rate Term Options OptionsFor Sale Lowe's Princeton, WV 116,000 14.16 6.61% 20 Years 6, Five-Year 50 YearsFor Sale Kohl's Selinsgrove, PA 68,416 4.47 6.25% 20 Years 8, Five-Year 60 YearsFor Sale Lowe's Derby, CT 152,890 13.10 5.50% 20 Years 8, Five-Year 60 YearsFor Sale Lowe's Eugene, OR 137,933 12.30 6.25% 20 Years na naFor Sale Wal-Mart Albuquerque, NM 40,000 5.15 5.50% 20 Years 15, Five-Year 95 YearsFor Sale Kohl's Fort Gratiot, MI 89,008 14.75 5.75% 20 Years 4, Five-Year 40 YearsSold Target Fairlawn, OH 99,402 5.28 6.00% 20 Years 6, Five-Year 50 YearsSold - March 27, 2008 Lowe's Whitehall, PA 166,609 14.24 6.05% 20 Years na naSold - March 23, 2008 Home Depot Austell, GA 130,948 14.46 5.75% 20 Years na naSold - October 2007 Kohl's Reno, NV 94,213 9.09 6.10% na na naSold - September 2007 Lowe's Escondido, CA 178,712 11.27 6.00% 20 Years 6, Five-Year 50 YearsSold - July 2007 Lowe's Sayre, PA 111,371 12.50 6.25% 20 Years 8, Five-Year 60 Years
Mean 6.00%Median 6.03%High 6.61%Low 5.50%
81
Ground Leases Typically Trade from 5.50% to 6.25%
Precedent private ground lease transactions support cap rates ofapproximately 5.50% – 6.25% for a typical ground lease with no development pipeline
Source: LoopNet and other public filings

Why is TIP REIT Better than a Private Ground Lease?
82
TIP REIT offers better value to investors than a typical privateground lease
TIP REIT has several qualities which make it more attractive than a private ground lease
Large cap, liquid public ownership
75-year Master Lease term (longer than most private ground leases)
1,438 retail properties (1) in 48 states
Inflation-protected rental stream with annual adjustments
Best-in-class retail tenant
Geographic diversity
Unlike a static ground lease, TIP REIT also has growth, given its dependable new store growth pipeline
Given the above factors, TIP REIT will trade at a lower cap rate than an individual private ground lease
(1) Represents 2008E Target Corp stores on TIP REIT land

Why is TIP REIT Unlike Any Existing REIT Today?
84
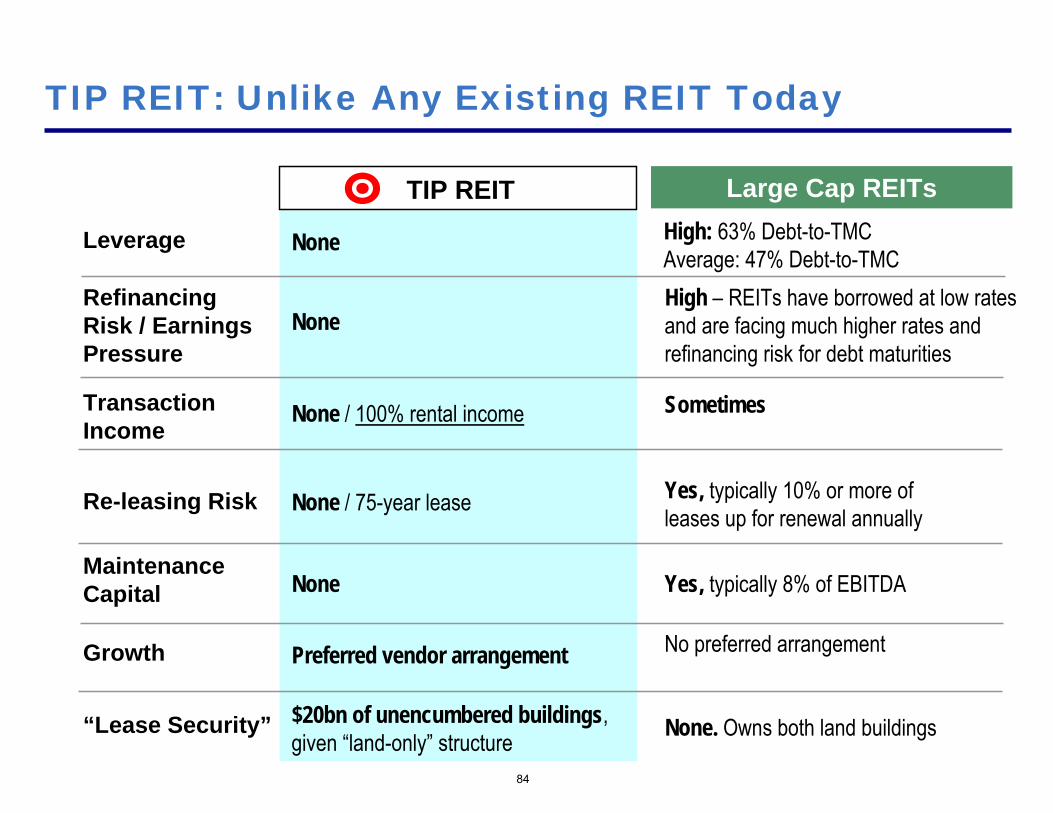
Leverage None High: 63% Debt-to-TMCAverage: 47% Debt-to-TMC
TIP REIT Large Cap REITs
NoneHigh – REITs have borrowed at low rates and are facing much higher rates and refinancing risk for debt maturities
None / 100% rental income Sometimes
None / 75-year lease Yes, typically 10% or more of leases up for renewal annually
Re-leasing Risk
None Yes, typically 8% of EBITDAMaintenanceCapital
Preferred vendor arrangement No preferred arrangementGrowth
$20bn of unencumbered buildings, given “land-only” structure None. Owns both land buildings“Lease Security”
TransactionIncome
RefinancingRisk / EarningsPressure
TIP REIT: Unlike Any Existing REIT Today

(1) By equity market value(2) Source: Wall Street research; 2008E maintenance Capex / EBITDA
85
TIP REIT: No Maintenance Capital Requirements
TIP REIT’s “land-only” structure maximizes cash flow. Unlike large cap real estate companies that spend on average 8% of EBITDA to maintain depreciable properties, TIP REIT requires virtually no maintenance capital
Given TIP REIT’s de minimis maintenance capital requirements, TIP REIT’s free cash flow should be compared to a real estate investment trust’s AFFO, not the “FFO” metric
10 Largest REITs (1) Maint. Capex / EBITDA (2)
1 TIP REIT 0.0%2 Simon Property Group 8.7%3 Public Storage 5.5%4 Vornado Realty Trust 13.4%6 Boston Properties 11.8%5 Equity Residential 6.9%7 HCP, Inc. 6.9%8 Kimco Realty Corporation 6.7%9 ProLogis 8.5%
10 AvalonBay Communities 5.7%Average (Excluding TIP REIT) 8.2%

86
TIP REIT: Tremendous Size and Scale
TIP REIT owns land under 225mm square feet of buildings (1), including 35mm sq. ft. of distribution facilities. TIP REIT would have a larger equity market capitalization than any real estate company in the U.S. today
Given its size and scale, TIP REIT will be a “must own” stock for any real estate equity investor
(1) Represents 2008E Target Corp stores, distribution facilities and warehouses on TIP REIT land (2) By equity market value; based on a 20-day trading average as of 10/24/08(3) Based on company filings as of Q2 2008A
Equity Total OwnedMarket GLA (3)
10 Largest REITs (2) Value ($mm) (mm)1 TIP REIT (1) 27,500 2252 Simon Property Group 20,836 1603 Public Storage 13,891 1254 Vornado Realty Trust 13,023 816 Boston Properties 10,679 415 Equity Residential 10,479 na 7 HCP, Inc. 8,450 na 8 Kimco Realty Corporation 7,451 749 ProLogis 7,170 487
10 AvalonBay Communities 6,106 na
87
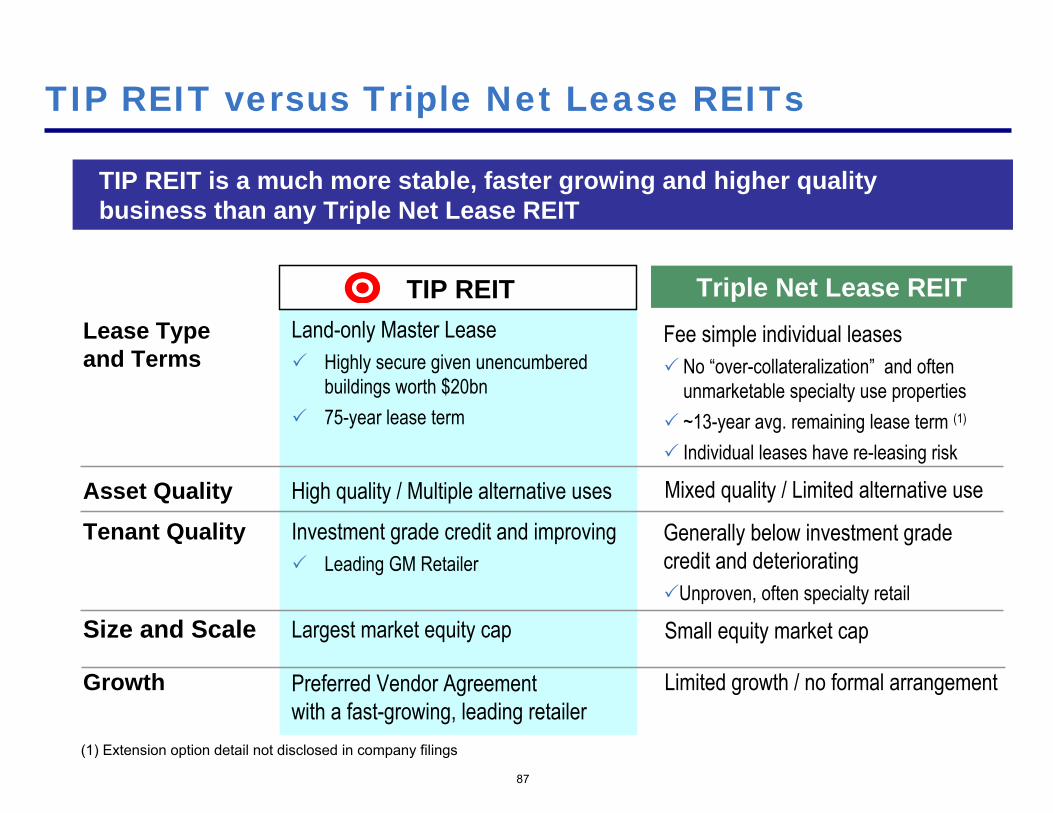
TIP REIT versus Triple Net Lease REITs
TIP REIT is a much more stable, faster growing and higher quality business than any Triple Net Lease REIT
Lease Typeand Terms
Land-only Master LeaseHighly secure given unencumbered buildings worth $20bn75-year lease term
Fee simple individual leasesNo “over-collateralization” and often unmarketable specialty use properties~13-year avg. remaining lease term (1)
Individual leases have re-leasing risk
TIP REIT Triple Net Lease REIT
Asset Quality High quality / Multiple alternative uses Mixed quality / Limited alternative use
Tenant Quality Generally below investment grade credit and deteriorating
Unproven, often specialty retail
Size and Scale Largest market equity cap Small equity market cap
Investment grade credit and improvingLeading GM Retailer
Growth Preferred Vendor Agreement with a fast-growing, leading retailer
Limited growth / no formal arrangement
(1) Extension option detail not disclosed in company filings
Leases:
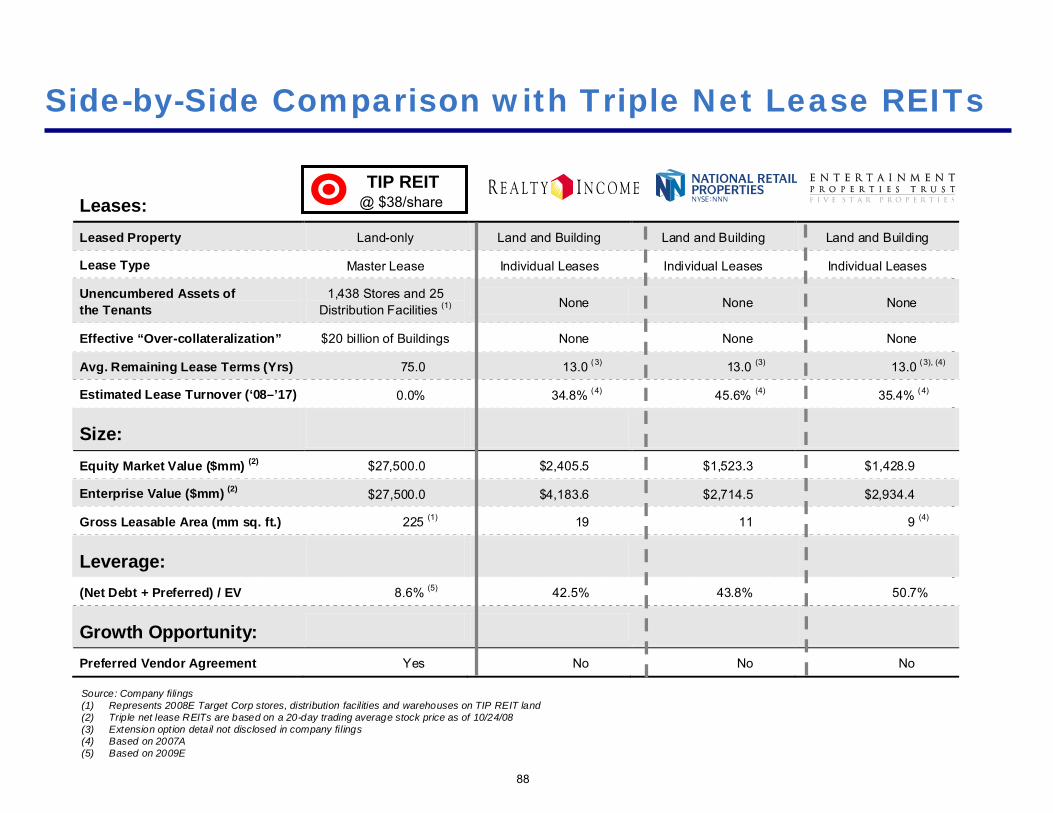
Leased Property Land-only Land and Building Land and Building Land and Building
Lease Type Master Lease Individual Leases Individual Leases Individual Leases
Unencumbered Assets of the Tenants
1,438 Stores and 25 Distribution Facilities (1) None None None
Effective “Over-collateralization” $20 billion of Buildings None None None
Avg. Remaining Lease Terms (Yrs) 75.0 13.0 (3) 13.0 (3) 13.0 (3), (4)
Estimated Lease Turnover (‘08–’17) 0.0% 34.8% (4) 45.6% (4) 35.4% (4)
Size:
Equity Market Value ($mm) (2) $27,500.0 $2,405.5 $1,523.3 $1,428.9
Enterprise Value ($mm) (2) $27,500.0 $4,183.6 $2,714.5 $2,934.4
Gross Leasable Area (mm sq. ft.) 225 (1) 19 11 9 (4)
Leverage:
(Net Debt + Preferred) / EV 8.6% (5) 42.5% 43.8% 50.7%
Growth Opportunity:
Preferred Vendor Agreement Yes No No No Source: Company filings (1) Represents 2008E Target Corp stores, distribution facilities and warehouses on TIP REIT land (2) Triple net lease REITs are based on a 20-day trading average stock price as of 10/24/08 (3) Extension option detail not disclosed in company filings (4) Based on 2007A (5) Based on 2009E
Side-by-Side Comparison with Triple Net Lease REITs
88
TIP REIT@ $38/share

Five Leading Tenants: (23% of Revenues) (1) Five Leading Tenants: (32% of Gross Assets) (1) Buffets
♦ Filed for bankruptcy in January 2008 ♦ Buffets restaurants have limited
alternative use
The Pantry ♦ Convenience store operator with
bankruptcy concerns ♦ Junk credit with bonds Caa1 rated by
Moody’s trading at 14.5% Kerasotes ShowPlace Theatres
♦ Mid-west movie theatre chain ♦ Junk credit rated B1 / B- ♦ Real estate has poor alternative use
Circle K (Susser Holdings) ♦ Struggling owner of convenience stores ♦ Susser is B+ rated by S&P with a negative
outlook ♦ Senior Unsecured Debt is B3 rated by
Moody’s
The Pantry ♦ Convenience store operator with
bankruptcy concerns ♦ Junk credit with bonds Caa1 rated by
Moody’s trading at 14.5%
Kerasotes ShowPlace Theatres ♦ Mid-west movie theatre chain ♦ Junk credit rated B1 / B- ♦ Real estate has poor alternative use
La Petite Academy ♦ Child care/learning center operator ♦ Operate 570+ education centers in 36
states
Mister Car Wash ♦ Conveyor car wash chain started in
Houston, TX ♦ Portfolio of 60 car washes, 24 lube shop,
and 3 convenience stores Children’s World
♦ Child care/learning center operator ♦ Mostly operating in the Mid-west
Road Ranger ♦ Private Mid-west convenience store
operator ♦ Portfolio of 73 locations in seven states
Triple Net Lease REIT Tenants: A Closer Look
89
Leading tenants for triple net lease REITs are predominantly junk credits with some in bankruptcy; real estate has limited alternative uses
Movie theatre REIT with AMC Entertainment representing over 50% of gross leasable area
AMC has ~6.4x rent adjusted leverage and its bonds trade at a 14.1% yield
The movie theatre industry is highly competitive, very consumer sensitive and suffering secular pressures from at-home-entertainment
Movie theatres have limited alternative uses
(1) Source: Wall Street research

'09E Dividend Yield 4.9%Cap Rate 5.3%
19.3x15.7x
12.7x
6.0x
TIP REIT Large Cap REITAverage
Triple Net LeaseREIT Average
TargetStandalone
2009
E E
BIT
DA
(x)
REIT Multiples
90
TIP REIT will trade at a significant premium to any REIT because of its stability, security, and certain growth
2009E EV/EBITDA
Note: Target Standalone, Large Cap REITs, and Triple Net Lease REITs stock prices based on 20-day trading average as of 10/24/08
TIP REIT’s only commonality with other REITs is its Tax-Exempt structure
91

Why Would this Transaction Improve Target Corp’s Valuation?

93
Improves Store-level ROIC at Target Corp
Assuming the average store real estate costs $26mm, of which $13mm is allocated to the land and $13mm to the building, we believe store level return on investment would increase from 23.0% to 39.8%
(1) Assumes $0.9mm of ground lease rent expense, based on $7/sq. ft. lease cost and 131k of store square footage, on average
Owned Store Level Operating Data and Assumptions ($mm)
Standalone 2007A
Pro Forma 2007A
Retail Sales per Avg. Store $40 $40
Estimated Four-Wall Operating Costs 34 35 Ground Lease Expense per Avg. Store -- 1(1)
Estimated Four-Wall EBIT per Avg. Store $6 $5 Margin (%) 15.0% 13.0%
New Land Capex $13 -- New Building Capex 13 13 Total Investment $26 $13 Estimated Returns on Investment (%) 23.0% 39.8%

Earnings per Share ($)'09-'13CAGR
2008 2009 2010 2011 2012 2013 (%)
PF Target Corp 1 $2.23 $2.67 $3.20 $3.70 $4.27
EPS Growth (%) 19.5% 20.2% 15.5% 15.3%
Target Standalone 1, 2 $3.29 $3.40 $3.90 $4.57 $5.18 $5.89
EPS Growth (%) 3.5% 14.8% 17.0% 13.4% 13.8%
Memo: Operating Assumptions:Same-store sales 0.5% 3.3% 3.5% 3.5% 3.5%Sq. ft. growth 4.7% 4.1% 6.0% 6.5% 7.0%
Gross Margin 30.0% 30.1% 30.2% 30.2% 30.2%SG&A as % of sales 20.2% 20.1% 20.0% 20.0% 20.0%
(1) Assumes remaining 53% interest of credit card business sold for $4.4bn on 01/01/09 and all proceeds used to pay down debt(2) Assumes Target Standalone maintains existing dividend policy
17.6%
14.7%
94
Increases Target Corp’s EPS Growth Rate
Because of its higher ROIC, improved free cash flow profile, and more efficient capital structure, Target Corp’s EPS growth will exceed that of Target Standalone

8.0%8.0%9.0%9.0%
10.0%10.0%11.0%
12.0%12.0%12.0%12.9%13.0%
13.5%14.0%14.0%
14.5%14.7%(1),(2),(3)
15.0%16.0%
17.6%(1),(2),(3)
0
3
6
9
12
15
18
21
WholeFoods
Kohl's CVS Lowe's Staples Walgreens TJX Costco Safeway HomeDepot
Best Buy Wal-Mart Sears BJ's Kroger JCPenney
Average(4) = 11.9%
95
Long-term EPS Growth (%)
Pro forma for the Transaction, Target Corp’s long-term EPS growth rate would be at the top of its peer group
Corp Standalone
Increases Target Corp’s EPS Growth Rate (cont’d)
SUPERVALU Macy’s
(1) Represents 2009–2013 EPS CAGR(2) Assumes additional future share buyback at a constant forward P/E of 16.0x(3) Assumes sale of credit card business for $4.4bn on 1/1/09 and uses proceeds to pay down debt(4) Excludes TargetSource: FactSet and Company filings for Retailers, excluding Target

Multiple Expansion at Target Corp
Target Corp will trade at a higher multiple than current Target Standalone due to a powerful combination of improved ROIC and EPS growth
ROIC and EPS Growth – key value drivers with a direct impact on multiples
Improving both metrics concurrently is a powerful value creatingcombination which should lead to multiple expansion
More efficient cash generation results in higher ROIC at virtually same level of risk, resulting in substantial economic value added
Increased returns and more efficient cash flow generation allow for additional share buybacks that foster EPS growth
“Growth does indeed drive multiples, but only when combined with a healthy return on invested capital.” (Tim Koller et. al, McKinsey & Co.)
96

Why is this Transaction Ideally Suited for Target?

“Land-only” REIT Spin-off is Value Maximizing for Retailers Meeting Certain Criteria
Retailer Criteria:
High Land Ownership
Strong Square FootageGrowth Opportunity in the U.S.
Retailers that own most of their land and buildings are ideally suited for a “Land-only” REIT spin-off
To create the most value from a “Land-only” REIT spin-off, a retailer must meet certain criteria including very high land ownership, predominantly U.S.-based real estate and retail sales, strong square footage growth in the U.S., and low valuation multiples. Target meets ALL of these criteria
98
Predominantly U.S. Real Estate and U.S. Retail Sales
Low EV / EBITDA Multiple Relative to REITs
Commentary: Application to Target:Target owns more of its store land and buildings than any other big box retailer in the U.S.
Retailers with strong growth opportunities in the U.S. can provide a dependable development pipeline for the “Land-only”REIT, enhancing the REIT’s value
Target is one of the fastest growing U.S. big box retailers in the country with mid-to-high single digit expected sq. ft. long-term growth for the foreseeable future
International real estate is not well suited for a tax-free REIT spin-off, given regulatory issues and tax complications
Target’s real estate is exclusively based in the U.S. Target’s EBITDA is generated exclusively from U.S.-based sales
Retailers trading at low EV / EBITDA multiples can release the greatest value from the “Land-only” REIT spin-off
Target trades at 6.0x ’09E EBITDA versus large cap REITs at 15.7x EBITDA and TIP REIT at 19.3x EBITDA
Strong, Stable Retail Operations with Attractive Credit Profile
Retailers with strong and stable operations will be a high-quality tenant
Target is a market share winner with leading retail operations, stable FCF and strong management

High Quality, Stable Tenant
Target is ideally suited as a tenant for TIP REIT because of its high business quality and stable operations, even during a recession
High Business QualityBest management team in the retail industry
Leading brand and strong marketing capabilities
Best-in-class merchandisers
Quality suburban and urban in-fill locations
Solid infrastructure, leading-edge retailing systems
~10% EBITDAR margins
Stable Cash Flows Even TodayDiscount retailer with prices within approximately 1% – 3% of Wal-Mart on comparable goods
Beneficiary of trade down
Nearly 40% of sales are consumables / non-discretionary
Less fashion risk than a department store
Less cyclicality than a home improvement retailer
Higher margins than grocery stores and warehouse clubs
99

Target: Beneficiary of Trade Down
Consider the $1,235 patent-leather satchel with golden hardware designed by Anya Hindmarch. Mary Hall, a marketing manager at I.B.M. in Redondo Beach, Calif., heard its siren call. Then she went to Target to purchase a similarly shiny purse, made out of polyvinyl chloride, by the same designer. Price: $49.99. “In the current economy, I thought I would reform,” Ms. Hall said. Welcome to “recession chic” and its personification, the “recessionista,” the new name for the style maven on a budget.
New York Times, 10/24/2008
Indeed, many diehard Nordstrom fans came prepared to open up their purses for $545 Moschino shoes and $1,495 Valentino handbags. Kim Calloway, a 38-year-old senior accountant, arrived at 7:50 a.m. and walked out with $1,200 worth of jeans, cosmetics and skin care products, noting that she hasn't cut back on her spending. "I probably should, but I probably won't," she said. Others, warier about the economy, came more for the spectacle. Charlene Stone, 49, of Wexford, an affluent suburb, didn't buy anything but enjoyed looking. Lately, she has been shopping more at discounter Target for her daughter's clothes. "I'm about the bargains," she said.
Wall Street Journal, 10/25/2008
100

101
What if TGT’s Valuation Normalizes to Historical Levels?
Last 5 year average
@ $40 (1) TIP REIT@ 38/share
Large Cap REITs (1)
Target’s EV / Forward EBITDA Multiple REIT Forward EV / EBITDA Multiple
8.2x 6.0x 19.3x 15.7x
When reviewing Target’s historical EV / EBITDA multiples, on average, Target has not been afforded the valuation levels of a typical Large Cap REIT or the expected valuation multiple of TIP REIT
Even if Target’s valuation multiples normalized over the next 12 – 18 months to historical levels, Target’s Standalone valuation multiples would never reach the expected EV/EBITDA multiples of TIP REIT
TIP REIT does not pay taxes and has no maintenance capital requirements
Importantly, with 22% of Target’s existing EBITDA representing the ground lease rents available to TIP REIT, the separation of TIP REIT would allow for significant shareholder value creation for Target shareholders
(1) Based on a 20-day trading average as of 10/24/08

What are the Risks?

Potential Concerns: Credit Ratings
Concern Mitigating Factor
Long-termCredit Rating
Target Corp’s rating could be temporarily lowered to a mid-to-high BBB category
First two years of land development capital will be contractually funded by TIP REIT. Thereafter, TIP REIT will be the preferred land developer
The Transaction’s tax efficiencies improve free cash flow at Target Corp (ground lease is expensed while land is not depreciable)
As such, Target Corp will not need access to long-term capital because it will generate $2bn of FCF after all capex in the first two years alone
Cash flow will be primarily used to de-lever to an “A” category rating after two years
103
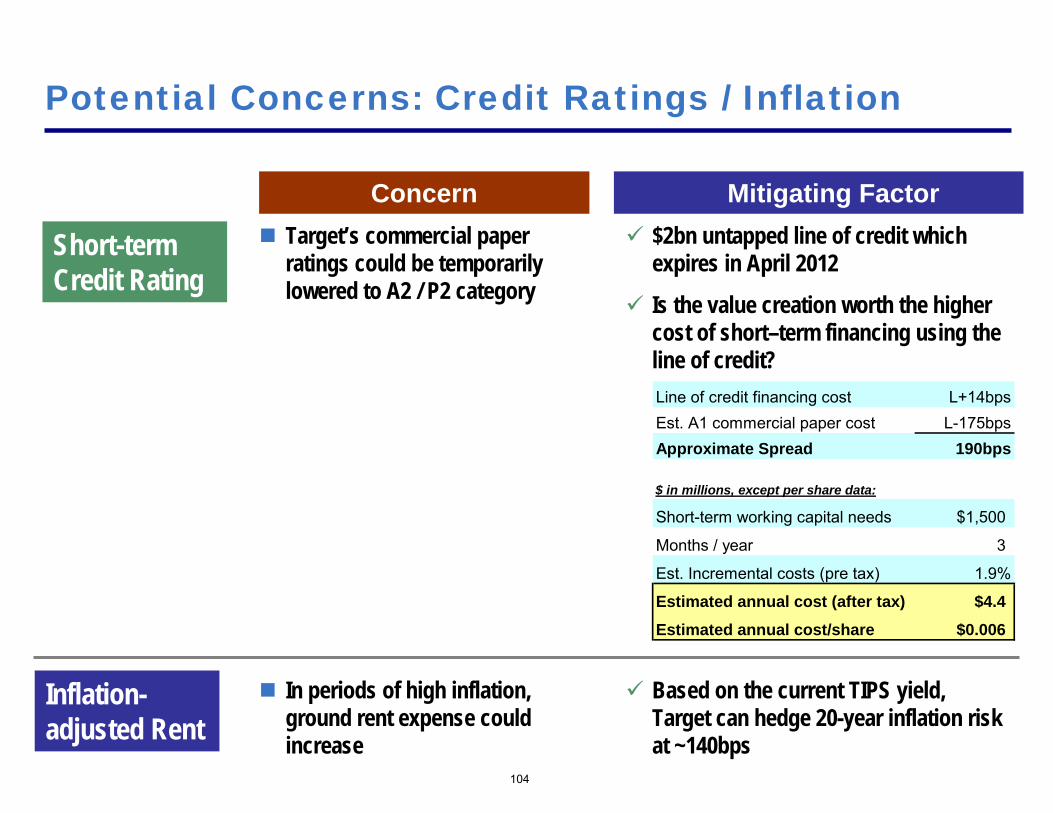
Potential Concerns: Credit Ratings / Inflation
Concern Mitigating Factor
Short-term Credit Rating
Target’s commercial paper ratings could be temporarily lowered to A2 / P2 category
Based on the current TIPS yield, Target can hedge 20-year inflation risk at ~140bps
104
Inflation-adjusted Rent
In periods of high inflation, ground rent expense could increase
$2bn untapped line of credit which expires in April 2012
Is the value creation worth the higher cost of short–term financing using the line of credit?Line of credit financing cost L+14bpsEst. A1 commercial paper cost L-175bpsApproximate Spread 190bps
$ in millions, except per share data:
Short-term working capital needs $1,500
Months / year 3
Est. Incremental costs (pre tax) 1.9%
Estimated annual cost (after tax) $4.4
Estimated annual cost/share $0.006

105
Pros and Cons of this Transaction
Instantly and meaningfully accretive on all key measures (EPS, FCF/share)
Improves ROIC and EPS growth at Target Corp
Reduces taxes by ~$520mm in ’09E
More than triples dividends: $0.60/share today to $1.86/share in ’09E
Improves capital access and decreases the need for growth capital at Target Corp
Increases the stock price from $40/share to $70/share today
⌧ Temporarily lowers Target Corp’s ratings from A+ / A2 to Mid - HighBBB/Baa
Mitigating Factors:
Target Corp remains investment grade
Target Corp can pay down debt and regain an “A” category credit rating profile in two years
Pros Cons
We believe the Pros of doing this Transaction far outweigh the Cons of having a temporarily lower rating. Post-Transaction, the Company will have improved access to capital and lower capital needs. As such, credit ratings will be less material to Target Corp going forward

Another way to pose the question:
Would you pursue this Transaction if it were a Strategic Acquisition?
106
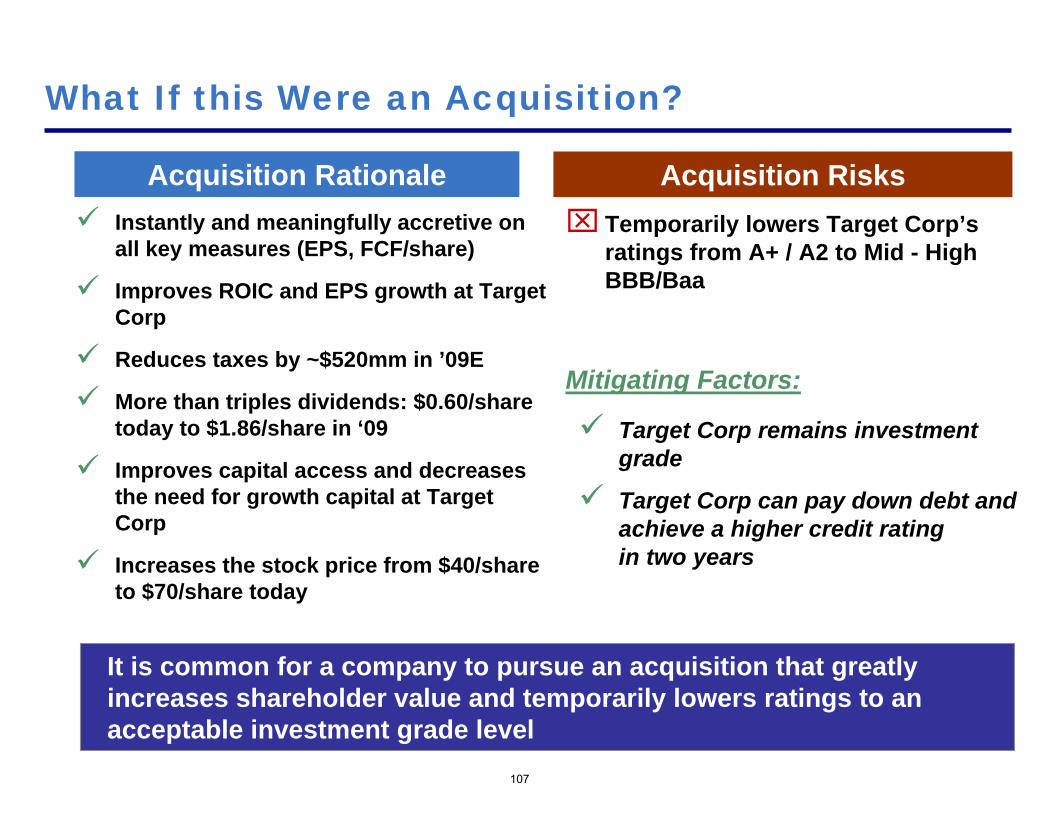
107
What If this Were an Acquisition?
⌧ Temporarily lowers Target Corp’s ratings from A+ / A2 to Mid - HighBBB/Baa
Mitigating Factors:
Target Corp remains investment grade
Target Corp can pay down debt and achieve a higher credit rating in two years
Acquisition Rationale Acquisition Risks
It is common for a company to pursue an acquisition that greatlyincreases shareholder value and temporarily lowers ratings to anacceptable investment grade level
Instantly and meaningfully accretive on all key measures (EPS, FCF/share)
Improves ROIC and EPS growth at Target Corp
Reduces taxes by ~$520mm in ’09E
More than triples dividends: $0.60/share today to $1.86/share in ‘09
Improves capital access and decreases the need for growth capital at Target Corp
Increases the stock price from $40/share to $70/share today
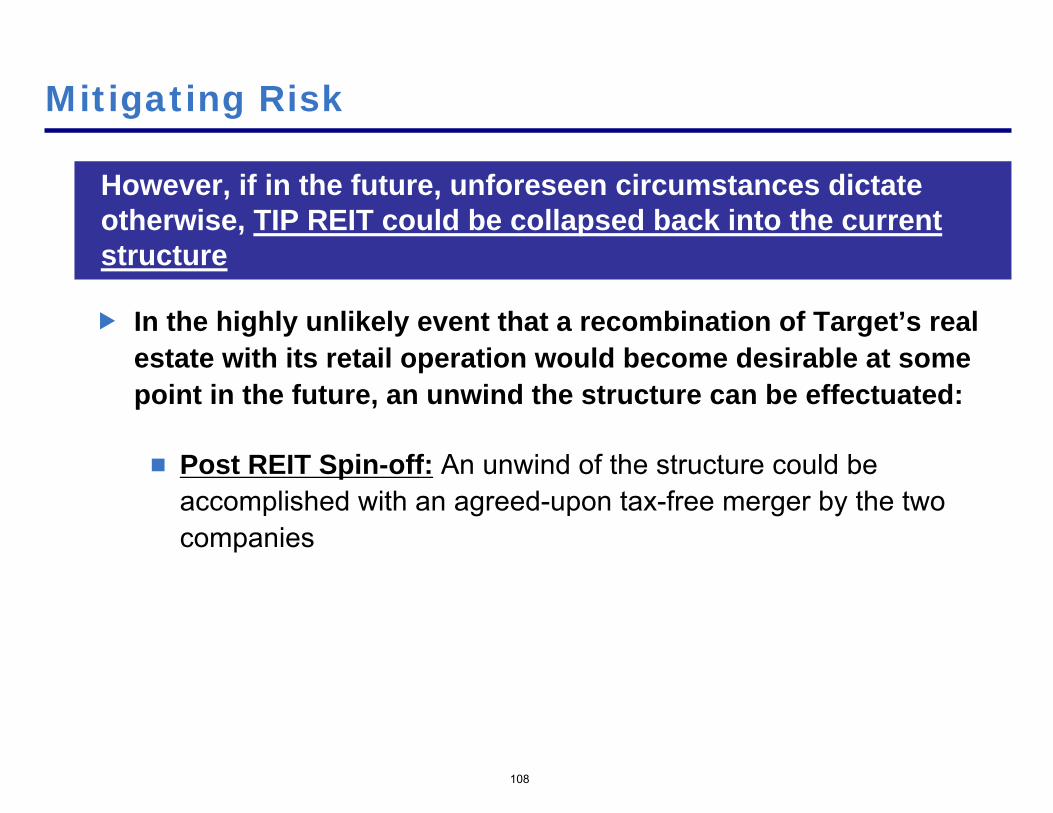
108
Mitigating Risk
In the highly unlikely event that a recombination of Target’s real estate with its retail operation would become desirable at some point in the future, an unwind the structure can be effectuated:
Post REIT Spin-off: An unwind of the structure could be accomplished with an agreed-upon tax-free merger by the two companies
However, if in the future, unforeseen circumstances dictate otherwise, TIP REIT could be collapsed back into the current structure

Other Potential Questions

What is the Governance Structure of TIP REIT?
110
TIP REIT would be incorporated where most REITs are incorporated: Maryland
Jurisdiction: We believe Maryland is the most favorable jurisdiction for TIP REIT
Ownership Restrictions: The certificate of incorporation of TIP REIT would include a customary 9.9% actual and constructive ownershiplimit and other provisions customary for REITs to assure compliance with REIT ownership and related-party rent rules
Other Governance Provisions: Similar to Target Corp’s existing governance rules except as the Board may otherwise determine in connection with the Transaction

Will Consents Be Needed?
Minnesota Corporate Statute Requiring Shareholder Vote for Transfer of All or Substantially All Assets
The Transaction meets Minnesota’s safe harbor for not being a transfer of “all or substantially all assets” and therefore does not trigger shareholder vote
Bond Indenture Covenants
Covenant restricting transfer of assets substantially as an entirety:The Transaction – which only involves Target’s land – is not a transfer of assets “substantially as an entirety” and therefore does not breach this covenant
Covenant restricting sale (or transfer) and leaseback of an “Operating Property” with an entity other than a restricted subsidiary:
The transfer/leaseback is with an entity that at the time of the transfer/leaseback is a restricted subsidiary and it is therefore exempt from this covenant (the subsequent spin off is permitted since the indenture does not include any dividend stopper)In addition, none of the land parcels being transferred is an Operating Property subject to this covenant since none has a net book value greater than 0.35% of Consolidated Net Tangible AssetsAlso, if the Board designates subsidiaries currently holding land to be unrestricted subsidiaries as permitted by the indenture, the covenant will not apply to a transfer / leaseback by those subsidiaries
No other indenture issues identified111
No Shareholder or Bondholder consents are needed

Q & A
Appendix

Detailed Valuation Analysis

$0
$20
$40
$60
$80
Target (20-Day Avg. Price) ¹ Target REIT Spin-Off ² 12-Month Price Target ²
$/Sh
are
TIP REIT
Target CorpTarget
Standalone
74%
$40
$70
$38
$32 $42
$42
$83
TIP REIT
Target Corp
Valuation Summary
115
For illustrative purposes, assumes Transaction occurs on 01/01/09(1) Based on 20-day trading average as of 10/24/08; assumes sale of remaining 53% interest on credit card business with proceeds used to pay down debt (2) Based on mid-point of valuation analysis
Equity Value ($bn) $29 $23 Equity Value ($bn) $30Enterprise Value ($bn) $40 $34 Enterprise Value ($bn) $40 '09E EV/EBITDA 6.0x 6.5x '10E EV/EBITDA 7.0x '09E P/E 11.8x 14.2x '10E P/E 15.6x Equity Value ($bn) $27.5 Equity Value ($bn) $30 Enterprise Value ($bn) $27.5 Enterprise Value ($bn) $31 ‘09E Dividend Yield 4.9% ‘10E Dividend Yield 4.7% Cap Rate 5.3% Cap Rate 5.0% '09E P/AFFO 20.5x '10E P/AFFO 21.4x '09E EV/EBITDA 19.3x '10E EV/EBITDA 20.3x
Targ
etC
orp
TIP
REI
T

Valuation Analysis – TIP REIT

TIP REIT Summary of Valuation Analysis: Today
117
Various methodologies imply a TIP REIT reference range of $25 – $30bn, or $35 – $42/share today
Valuation Range($25bn – $30bn)
Net Asset – 4.65% – 5.15% Dividend Yield on Existing Ground LeaseValue – Dividend Yield Based on Sum of CDS Spread and TIPS Yield(TIPS) – CY2008 Existing Dividends: $1,354mm
– 20-year DCF Analysis of Platform– 10.50% – 12.50% Discount Rate on Platform
Net Asset – 5.50% – 6.25% Cap Rate on Existing Ground LeaseValue – Cap Rate Range Based on Precedent Transactions
(Precedents) – CY2009 Existing NOI: $1,354mm– 20-year DCF Analysis of Platform– 10.50% – 12.50% Discount Rate on Platform
Discounted – 8.0% – 10.0% WACCCash Flow – 4.65% – 5.15% Terminal Cap Rate
Equity Value ($bn)Implied Multiples: ($mm) $25.0 $27.5 $30.0 CY2009 AFFO 1,344 18.6x 20.5x 22.3x CY2009 EBITDA 1,427 17.5x 19.3x 21.0x CY2009 Div. Yield 1,344 5.4% 4.9% 4.5% Cap Rate 1,462 5.8% 5.3% 4.9%
21.7
27.8
31.4
25.8
33.6
26.3
15.0 20.0 25.0 30.0 35.0 40.0
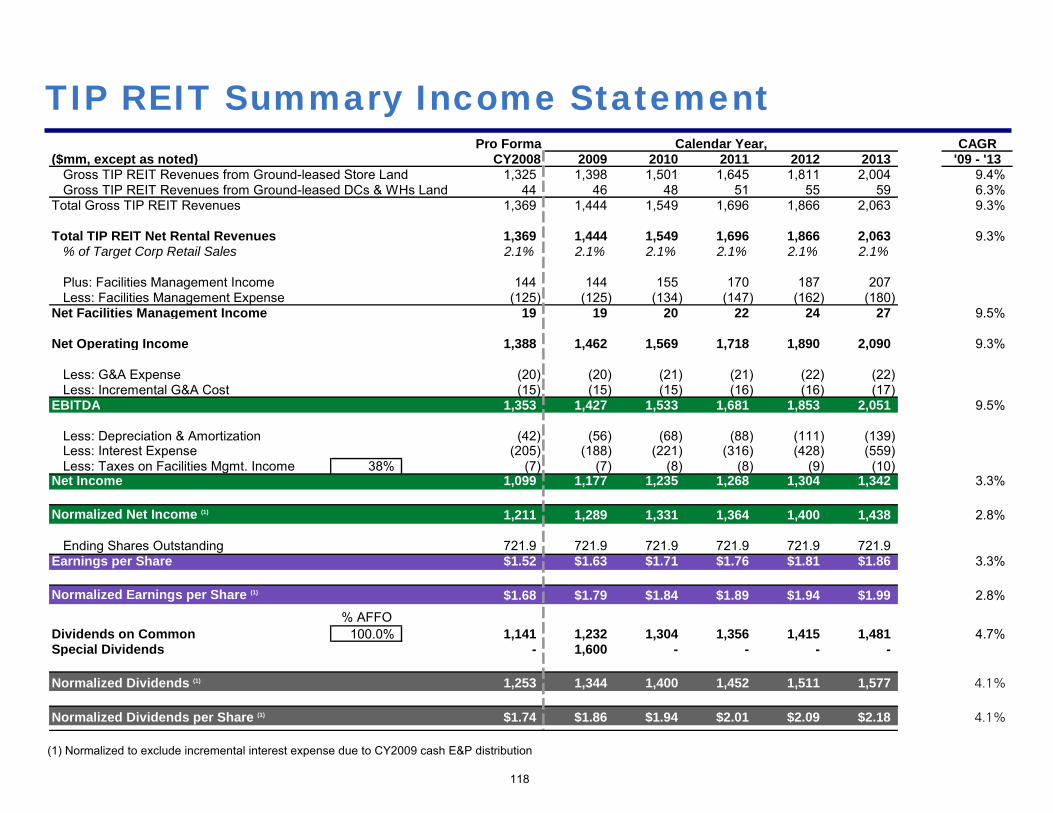
118
TIP REIT Summary Income Statement
(1) Normalized to exclude incremental interest expense due to CY2009 cash E&P distribution
Pro Forma Calendar Year, CAGR($mm, except as noted) CY2008 2009 2010 2011 2012 2013 '09 - '13
Gross TIP REIT Revenues from Ground-leased Store Land 1,325 1,398 1,501 1,645 1,811 2,004 9.4%Gross TIP REIT Revenues from Ground-leased DCs & WHs Land 44 46 48 51 55 59 6.3%
Total Gross TIP REIT Revenues 1,369 1,444 1,549 1,696 1,866 2,063 9.3%
Total TIP REIT Net Rental Revenues 1,369 1,444 1,549 1,696 1,866 2,063 9.3%% of Target Corp Retail Sales 2.1% 2.1% 2.1% 2.1% 2.1% 2.1%
Plus: Facilities Management Income 144 144 155 170 187 207 Less: Facilities Management Expense (125) (125) (134) (147) (162) (180)
Net Facilities Management Income 19 19 20 22 24 27 9.5%
Net Operating Income 1,388 1,462 1,569 1,718 1,890 2,090 9.3%
Less: G&A Expense (20) (20) (21) (21) (22) (22) Less: Incremental G&A Cost (15) (15) (15) (16) (16) (17)
EBITDA 1,353 1,427 1,533 1,681 1,853 2,051 9.5%
Less: Depreciation & Amortization (42) (56) (68) (88) (111) (139) Less: Interest Expense (205) (188) (221) (316) (428) (559) Less: Taxes on Facilities Mgmt. Income 38% (7) (7) (8) (8) (9) (10)
Net Income 1,099 1,177 1,235 1,268 1,304 1,342 3.3%
Normalized Net Income (1) 1,211 1,289 1,331 1,364 1,400 1,438 2.8%
Ending Shares Outstanding 721.9 721.9 721.9 721.9 721.9 721.9 Earnings per Share $1.52 $1.63 $1.71 $1.76 $1.81 $1.86 3.3%
Normalized Earnings per Share (1) $1.68 $1.79 $1.84 $1.89 $1.94 $1.99 2.8%% AFFO
Dividends on Common 100.0% 1,141 1,232 1,304 1,356 1,415 1,481 4.7%Special Dividends - 1,600 - - - -
Normalized Dividends (1) 1,253 1,344 1,400 1,452 1,511 1,577 4.1%
Normalized Dividends per Share (1) $1.74 $1.86 $1.94 $2.01 $2.09 $2.18 4.1%

119
TIP REIT Summary Balance Sheet/CF Statement
Calendar Year,($mm, except as noted) 2009 2010 2011 2012 2013EBITDA 1,427 1,533 1,681 1,853 2,051 Less: Interest Expense (188) (221) (316) (428) (559) Less: Taxes on Facilities Mgmt. Income (7) (8) (8) (9) (10) Less: Development Capex (1,079) (1,008) (1,582) (1,863) (2,190) Total Free Cash Flow 154 295 (226) (447) (709)
Total Cash 3 3 3 3 3 Total Debt 2,682 3,690 5,272 7,135 9,325
Total Debt / EBITDA 1.9x 2.4x 3.1x 3.9x 4.5x
EBITDA / Interest Expense 7.6x 6.9x 5.3x 4.3x 3.7x
Total Debt / Total Real Estate Value 11.1% 14.2% 18.6% 22.9% 27.0%
Ending Shares Outstanding 722 722 722 722 722

120
TIP REIT Valuation Matrix
Set forth below is a valuation matrix that demonstrates TIP REIT’s trading multiples at various values within the reference range
Value per Share($mm) $34.50 $36.50 $38.09 $40.50 $42.50
Shares O/S
EQUITY VALUE 721.9 24,907 26,351 27,500 29,238 30,682
Multiples of: Metrics
CY 2009 FFO (1) 1,344 18.5x 19.6x 20.5x 21.7x 22.8x
CY 2010 FFO (1) 1,400 17.8x 18.8x 19.6x 20.9x 21.9x
CY 2011 FFO (1) 1,452 17.1x 18.1x 18.9x 20.1x 21.1x
CY 2009 AFFO (1) 1,344 18.5x 19.6x 20.5x 21.7x 22.8x
CY 2010 AFFO (1) 1,400 17.8x 18.8x 19.6x 20.9x 21.9x
CY 2011 AFFO (1) 1,452 17.1x 18.1x 18.9x 20.1x 21.1x
Dividend Yield Assuming Payout Ratio of:
80% of CY 2009 AFFO 1,076 4.3% 4.1% 3.9% 3.7% 3.5%
90% of CY 2009 AFFO 1,210 4.9% 4.6% 4.4% 4.1% 3.9%
100% of CY 2009 AFFO 1,344 5.4% 5.1% 4.9% 4.6% 4.4%
Implied Value: Implied Value of Land / Blended Sq. Ft. 225 $111 $117 $122 $130 $137
(1) Normalized to exclude incremental interest expense due to CY2009 cash E&P distributions

121
TIP REIT NAV (TIPS) Analysis
Existing Lease Valuation
Inflation-indexed rent growth allows for a “TIPS-like” risk/return
Dividend yield range based on theoretical analysis:TIPS yield of 3.00% + Target unsecured CDS of 1.65% – 2.15% = Total yield of 4.65% – 5.15%
Implied valuation at 4.65% – 5.15% dividend yield range2008E dividend: $1,354mmValuation range of $26bn – $29bn
Platform Valuation
Based on 20-year DCF analysis
Implied valuation at 4.65% – 5.15% cap rate and 10.5% – 12.5% discount rate2029E terminal NOI: $2,560mmValuation range of $0.0bn – $2.3bn
The implied TIP REIT valuation range on TIPS-based NAV analysis is $26 –$31bn, or $36 – $44/share today

122
TIP REIT NAV (TIPS) Analysis (cont’d)
The implied TIP REIT valuation range on TIPS-based NAV analysis is $26 –$31bn, or $36 – $44/share today
($mm, except per share data) 2008
Rental Revenues - Store Land $1,325Rental Revenues - DCs & WHs Land 44Incremental Standalone Costs (15)Rental Revenues from Existing Ground Lease $1,354Dividend Yield 5.15% 4.65%
+ Present Value of Existing Ground Lease $26,300 $29,128TerminalValue (1)
2009 2010 2011 2012 2013 ... 2029Incremental Rental Revenues $74 $145 $257 $391 $551After-tax Facilities Management Income 12 12 14 15 17G&A Expense (20) (21) (21) (22) (22)Total Capex (1,079) (1,008) (1,582) (1,863) (2,190)Free Cash Flow from Platform ($1,013) ($872) ($1,332) ($1,478) ($1,644)Terminal Value $55,047Discount Rate 12.5% 10.5%Terminal Cap Rate 5.15% 4.65%Present Value of Platform – $2,293
––Existing Ground Lease $26,300 $29,128Platform Value – 2,293Implied Enterprise Value $26,300 $31,421Net Debt – – Implied Equity Value $26,300 $31,421Value per Share $36 $44
(1) Based on 2029E NOI of $2,560mm and 4.65% cap rate
Existing Ground Lease
Platform Value
Total TIP REIT Value

123
TIP REIT NAV (Ground Lease Precedents) Analysis
Existing Lease Valuation
Cap rate range based on ground lease precedents: 5.50% – 6.25%
Implied valuation at 5.50% – 6.25% cap rate range2009E NOI: $1,354mmValuation range of $22bn – $25bn
Platform Valuation
Based on 20-year DCF analysis
Implied valuation at 5.50% – 6.25% cap rate and 10.5% – 12.5% discount rate2029E terminal NOI: $2,560mmValuation range of $0.0bn – $1.1bn
The implied TIP REIT valuation range on Ground Lease Precedents-based NAV analysis is $22 – $26bn, or $30 – $36/share today

124
TIP REIT NAV (Ground Lease Precedents) Analysis (cont’d)
($mm, except per share data) 2009
Rental Revenues - Store Land $1,325Rental Revenues - DCs & WHs Land 44Incremental Standalone Costs (15)Rental Revenues from Existing Ground Lease $1,354Cap Rate 6.25% 5.50%
+ Present Value of Existing Ground Lease $21,671 $24,626TerminalValue (1)
2009 2010 2011 2012 2013 ... 2029Incremental Rental Revenues $74 $145 $257 $391 $551After-tax Facilities Management Income 12 12 14 15 17G&A Expense (20) (21) (21) (22) (22)Total Capex (1,079) (1,008) (1,582) (1,863) (2,190)Free Cash Flow from Platform ($1,013) ($872) ($1,332) ($1,478) ($1,644)Terminal Value $46,540Discount Rate 12.5% 10.5%Terminal Cap Rate 6.25% 5.50%Present Value of Platform – $1,138
––Existing Ground Lease $21,671 $24,626Platform Value – 1,138Implied Enterprise Value $21,671 $25,764Net Debt – – Implied Equity Value $21,671 $25,764Value per Share $30 $36
(1) Based on 2029E NOI of $2,560mm and 5.50% cap rate
Existing Ground Lease
Platform Value
Total TIP REIT Value
The implied TIP REIT valuation range on Ground Lease Precedents-based NAV analysis is $22 – $26bn, or $30 – $36/share today
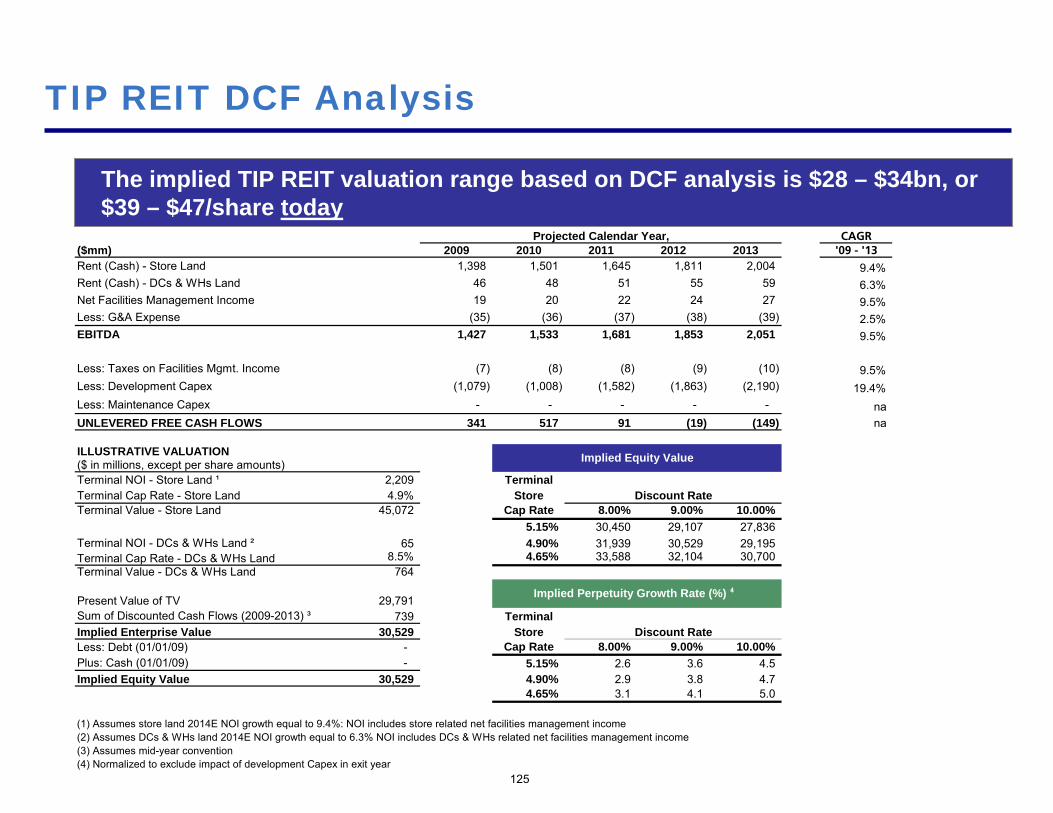
125
TIP REIT DCF Analysis
The implied TIP REIT valuation range based on DCF analysis is $28 – $34bn, or $39 – $47/share today
Projected Calendar Year, CAGR($mm) 2009 2010 2011 2012 2013 '09 - '13Rent (Cash) - Store Land 1,398 1,501 1,645 1,811 2,004 9.4%Rent (Cash) - DCs & WHs Land 46 48 51 55 59 6.3%Net Facilities Management Income 19 20 22 24 27 9.5%Less: G&A Expense (35) (36) (37) (38) (39) 2.5%EBITDA 1,427 1,533 1,681 1,853 2,051 9.5%
Less: Taxes on Facilities Mgmt. Income (7) (8) (8) (9) (10) 9.5%Less: Development Capex (1,079) (1,008) (1,582) (1,863) (2,190) 19.4%Less: Maintenance Capex - - - - - na UNLEVERED FREE CASH FLOWS 341 517 91 (19) (149) na
ILLUSTRATIVE VALUATION($ in millions, except per share amounts)Terminal NOI - Store Land ¹ 2,209 TerminalTerminal Cap Rate - Store Land 4.9% Store Discount RateTerminal Value - Store Land 45,072 Cap Rate 8.00% 9.00% 10.00%
5.15% 30,450 29,107 27,836 Terminal NOI - DCs & WHs Land ² 65 4.90% 31,939 30,529 29,195 Terminal Cap Rate - DCs & WHs Land 8.5% 4.65% 33,588 32,104 30,700 Terminal Value - DCs & WHs Land 764
Present Value of TV 29,791 Sum of Discounted Cash Flows (2009-2013) ³ 739 TerminalImplied Enterprise Value 30,529 Store Discount RateLess: Debt (01/01/09) - Cap Rate 8.00% 9.00% 10.00%Plus: Cash (01/01/09) - 5.15% 2.6 3.6 4.5 Implied Equity Value 30,529 4.90% 2.9 3.8 4.7
4.65% 3.1 4.1 5.0
(1) Assumes store land 2014E NOI growth equal to 9.4%: NOI includes store related net facilities management income(2) Assumes DCs & WHs land 2014E NOI growth equal to 6.3% NOI includes DCs & WHs related net facilities management income(3) Assumes mid-year convention(4) Normalized to exclude impact of development Capex in exit year
Implied Equity Value
Implied Perpetuity Growth Rate (%) ⁴

TIP REIT Valuation—12-Month Price Target
126
Various methodologies imply a TIP REIT reference range of $27.5 – $32.5bn, or $38 – $45/share 12 months from today
Valuation Range($27.5bn – $32.5bn)
Net Asset – 4.65% – 5.15% Dividend Yield on Existing Ground LeaseValue – Dividend Yield Based on Sum of CDS Spread and TIPS Yield(TIPS) – CY2009 Existing Dividends: $1,429mm
– 20-year DCF Analysis of Platform– 10.50% – 12.50% Discount Rate on Platform– Includes normalized dividends of $1,344mm in CY2009
Net Asset – 5.50% – 6.25% Cap Rate on Existing Ground LeaseValue – Cap Rate Range Based on Precedent Transactions
(Precedents) – CY2010 Existing NOI: $1,464mm– 20-year DCF Analysis of Platform– 10.50% – 12.50% Discount Rate on Platform– Includes normalized dividends of $1,344mm in CY2009
Discounted – 8.0% – 10.0% WACCCash Flow – 4.65% – 5.15% Terminal Cap Rate
– Includes normalized dividends of $1,344mm in CY2009
Equity Value ($bn)Implied Multiples: ($mm) $27.5 $30.0 $32.5 CY2010 AFFO 1,400 19.6x 21.4x 23.2x CY2010 EBITDA 1,533 18.6x 20.3x 21.9x CY2010 Div. Yield 1,400 5.1% 4.7% 4.3% Cap Rate 1,569 5.5% 5.0% 4.7%
23.7
31.2
33.3
28.0
37.4
28.0
17.5 22.5 27.5 32.5 37.5 42.5

Valuation Analysis – Target Corp

Trading Data – – 5.5–7.5x EBITDARetailers 1 – CY2009 EBITDA: $5,172mm
(EV/EBITDA) – Current Multiple is 6.0x
Trading Data – – 11.0–14.5x EPSRetailers 1 – CY2009 EPS: $2.23
(P/E) – Current Multiple is 11.8x
Trading Data – – 5 Year P/E of 15.9x and 5 Year EV/EBITDA of 8.2xTarget 5 Year Historical – CY2009 EPS: $2.23 and CY2009 EBITDA: $5,172mm
(P/E and EV/EBITDA) – Current P/E is 11.8x and current EV/EBITDA is 6.0x
Discounted – 9.0–11.0% WACCCash Flow – 6.0–7.0x Terminal EBITDA Multiple
($bn)
Equity Value 20.3 22.8 25.3Enterprise Value 31.3 33.8 36.3Share Price ($/Share) $28 $32 $35
'09 P/E 12.6x 14.2x 15.7x'10 P/E 10.6x 11.8x 13.1x
'09 PEG 0.7x 0.8x 0.9x'10 PEG 0.6x 0.7x 0.7x
'09 EV/EBITDA 6.0x 6.5x 7.0x(1) Based on 20-day average as of October 24, 2008 '10 EV/EBITDA 5.4x 5.9x 6.3x
17.7
25.6
26.4
27.8
23.4
31.5
35.4
17.5
15.0 25.0 35.0
Target Corp Summary Valuation Analysis: Today
Valuation Range($20.3bn–$25.3bn)
Equity Value ($bn)
128
The implied valuation range for Target Corp based on several methodologies outlined below is $20.3 – $25.3bn, or $28 – $35/share today

129
Target Corp Summary Income Statement
Projected Calendar Year, CAGR($mm) PF2008 2009E 2010E 2011E 2012E 2013E '09-'13Retail Sales 64,892 68,249 73,356 80,479 88,710 98,241 9.5%
Retail Sales Growth(%) 5.6% 5.2% 7.5% 9.7% 10.2% 10.7%
COGS (45,459) (47,777) (51,279) (56,177) (61,919) (68,563)Gross Margin (%) 29.9% 30.0% 30.1% 30.2% 30.2% 30.2%
SG&A (13,038) (13,814) (14,740) (16,093) (17,739) (19,646)SG&A as % of Sales 20.1% 20.2% 20.1% 20.0% 20.0% 20.0%
Retail EBITDAR 6,395 6,657 7,337 8,208 9,051 10,033Retail EBITDAR Margin (%) 9.9% 9.8% 10.0% 10.2% 10.2% 10.2%
Credit EBITDAR 143 150 161 177 195 216Incremental Facility Management Services Expense (19) (19) (20) (22) (24) (27) EBITDAR 6,519 6,789 7,478 8,363 9,221 10,222 10.8%
EBITDAR Margin (%) 10.0% 9.9% 10.2% 10.4% 10.4% 10.4%
Current Rent Expense 169 173 178 182 187 191Additional Rent Expense 1,369 1,444 1,549 1,696 1,866 2,063Pro Forma EBITDA 4,980 5,172 5,751 6,485 7,169 7,968 11.4%
EBITDA Margin (%) 7.7% 7.6% 7.8% 8.1% 8.1% 8.1%
Depreciation & Amortization 1,765 1,884 2,017 2,199 2,410 2,654Net Interest (Income) / Expense 515 673 611 531 509 623Income Tax Provision 1,037 1,004 1,199 1,441 1,632 1,802Net Income 1,663 1,611 1,924 2,312 2,618 2,890 15.7%
Net Income Margin (%) 2.6% 2.4% 2.6% 2.9% 3.0% 2.9%
Weighted Average Shares Outstanding 766 722 722 722 707 677Earnings per Share ($) $2.17 $2.23 $2.67 $3.20 $3.70 $4.27 17.6%

130
Target Corp Summary Balance Sheet/CF Statement
Significant Free Cash Flow generation allows Target Corp to de-leverage to 2.8x Lease Adj. Debt/EBITDAR
Projected Calendar Year,($mm) PF2008 2009E 2010E 2011E 2012E 2013EEBITDA 4,980 5,172 5,751 6,485 7,169 7,968Less: Interest Expense (515) (673) (611) (531) (509) (623)Less: Taxes (1,037) (1,004) (1,199) (1,441) (1,632) (1,802)Plus: Decrease in Net Working Capital 79 79 120 167 193 224Plus: Other 73 73 73 73 73 73Less: Maintenance Capex (1,714) (1,714) (1,827) (1,785) (1,968) (2,179)Maintenance Free Cash Flow 1,866 1,933 2,307 2,967 3,327 3,662Less: Growth Capex (1,112) (1,112) (1,023) (1,615) (1,902) (2,237)Total Free Cash Flow 754 821 1,284 1,352 1,424 1,425
Total Cash 500 682 734 805 887 982Total Debt 11,455 10,817 9,584 8,303 8,938 10,078
Lease Adj. Debt/EBITDAR 3.6x 3.5x 3.1x 2.8x 2.8x 2.8xDebt/EBITDA 2.3x 2.1x 1.7x 1.3x 1.2x 1.3xEBITDAR/(Interest+Rent) 3.2x 3.0x 3.2x 3.5x 3.6x 3.6xEBITDA/Interest 9.7x 7.7x 9.4x 12.2x 14.1x 12.8x
Ending Shares Outstanding 722 722 722 722 693 662Weighted Average Shares Outstanding 766 722 722 722 707 677

Value per ShareValuation Range ($mm) $28.00 $30.00 $31.58 $33.00 $35.00
Shares O/S
EQUITY VALUE 721.9 20,214 21,658 22,800 23,824 25,268
Net Debt (1/1/09) 10,955 10,955 10,955 10,955 10,955
ENTERPRISE VALUE 31,169 32,613 33,755 34,779 36,223
Multiples of: Metrics
CY 2008 EBITDA 4,980 6.3x 6.5x 6.8x 7.0x 7.3x
CY 2009 EBITDA 5,172 6.0x 6.3x 6.5x 6.7x 7.0x
CY 2010 EBITDA 5,751 5.4x 5.7x 5.9x 6.0x 6.3x
CY 2008 Earnings $2.17 12.9x 13.8x 14.5x 15.2x 16.1x
CY 2009 Earnings $2.23 12.5x 13.4x 14.2x 14.8x 15.7x
CY 2010 Earnings $2.67 10.5x 11.3x 11.8x 12.4x 13.1x
CY 2009 PEG 17.6% 0.7x 0.8x 0.8x 0.8x 0.9x
CY 2010 PEG 17.6% 0.6x 0.6x 0.7x 0.7x 0.7x
131
Target Corp Valuation Matrix
Set forth below is a valuation matrix that demonstrates Target Corp’s trading multiples at various stock prices

Trading Data For Other Retailers (1)
132
(1) As of October 24, 2008(2) Assumes 20-day average stock price, except for Target Corp (3) Assumes sale of credit card business for $4.4bn on 1/1/09 and uses proceeds to pay down debt(4) Implied multiples from midpoint of Target Corp valuation ($20.3bn–$25.3bn)(5) Represents 2009–2013 EPS CAGR(6) Excludes Target
EV/CY08E EV/CY09E EV/CY10E P/E Ratio PEG Ratio
Company name
Stock Price(2)
($)
% of 52wk High
Equity Value ($mm)
EV ($mm)
Sales(x)
EBITDA (x)
Sales (x)
EBITDA (x)
Sales(x)
EBITDA (x)
CY09E (x)
CY10E (x)
CY09E (x)
CY10E (x)
IBES LTG (%)
Total Debt/CY08E
EBITDA (x)
Adj. Debt/CY08E EBITDAR (x)
Target Standalone(3) 39.98 – 28,863 39,818 0.61 6.3 0.58 6.0 0.54 5.5 11.8 10.2 0.8 0.7 14.7(5) 1.8 2.0 Target Corp(4) 31.58 – 22,800 33,755 0.52 6.8 0.49 6.5 0.46 5.9 14.2 11.8 0.8 0.7 17.6(5) 2.3 3.6
Discounters Wal-Mart 54.91 86.0 216,168 255,900 0.63 8.4 0.58 7.8 0.55 7.4 14.4 13.0 1.3 1.2 11.0 1.5 1.8 Mean/Median 0.63 8.4 0.58 7.8 0.55 7.4 14.4 13.0 1.3 1.2 11.0 1.5 1.8 Supermarkets Kroger 26.08 84.2 17,196 24,618 0.32 6.2 0.30 5.8 0.28 5.6 12.3 11.2 1.4 1.2 9.0 1.9 2.8 Safeway 22.39 62.2 9,617 15,105 0.34 4.9 0.33 4.8 0.32 4.7 9.3 8.8 0.8 0.7 12.0 1.9 2.7 SUPERVALU 18.32 42.3 3,879 12,755 0.28 4.8 0.28 4.8 0.28 4.7 6.5 6.1 0.8 0.8 8.0 3.4 4.0 Whole Foods 15.67 30.7 2,198 3,013 0.37 5.8 0.34 5.2 0.31 4.9 14.1 11.2 0.9 0.7 16.0 1.6 3.4 Mean 0.33 5.4 0.31 5.2 0.30 5.0 10.6 9.3 1.0 0.9 11.3 2.2 3.2 Median 0.33 5.4 0.32 5.0 0.30 4.8 10.8 10.0 0.8 0.7 10.5 1.9 3.1 Department Stores Macy's 12.31 36.5 5,176 14,260 0.57 5.0 0.58 5.3 0.58 5.3 9.8 9.1 1.2 1.1 8.0 3.7 4.0 Kohl's 35.31 60.8 10,769 12,545 0.75 5.8 0.72 5.7 0.69 5.4 11.3 10.3 0.8 0.7 15.0 1.0 2.1 Sears 70.38 50.5 8,897 11,581 0.24 6.4 0.25 7.2 0.25 7.3 32.4 43.9 3.2 4.4 10.0 2.1 4.0 JCPenney 25.45 44.3 5,652 7,249 0.38 3.9 0.39 4.1 0.37 3.9 8.8 7.4 1.0 0.8 9.0 2.0 2.8 Mean 0.48 5.3 0.49 5.6 0.47 5.5 15.6 17.7 1.5 1.8 10.5 2.2 3.2 Median 0.47 5.4 0.48 5.5 0.48 5.4 10.5 9.7 1.1 1.0 9.5 2.1 3.4 Other Large Cap Retailers CVS 30.13 68.0 43,682 52,640 0.61 7.2 0.57 6.4 0.52 5.7 10.6 9.4 0.7 0.7 14.5 1.3 2.5 Home Depot 21.59 67.8 36,678 47,282 0.65 6.5 0.66 6.7 0.64 6.0 13.2 11.1 1.1 0.9 12.0 1.6 2.3 Lowe's 19.85 69.7 29,089 33,699 0.69 6.1 0.68 6.1 0.64 5.5 13.6 11.5 1.0 0.9 14.0 1.0 1.4 Walgreens 25.63 63.4 25,369 26,346 0.43 6.0 0.40 5.5 0.37 5.0 10.6 9.5 0.8 0.7 13.5 0.3 2.4 Costco 57.95 77.0 25,310 24,463 0.33 9.2 0.30 8.4 0.28 8.0 17.8 15.9 1.4 1.2 12.9 0.9 1.3 Staples 18.08 68.0 12,936 17,200 0.72 8.2 0.61 7.1 0.58 6.5 11.5 9.7 0.8 0.7 14.0 2.1 3.5 Best Buy 28.42 52.7 11,718 14,589 0.32 5.1 0.29 4.8 0.26 4.5 9.0 8.0 0.8 0.7 12.0 0.9 2.4 TJX 27.43 73.1 11,686 12,023 0.61 6.1 0.59 5.9 0.55 5.5 11.5 10.2 0.9 0.8 13.0 0.4 2.8 BJ's 35.16 79.4 2,108 1,994 0.20 6.2 0.18 6.0 0.17 5.7 15.4 13.9 1.5 1.4 10.0 0.0 2.5 Mean 0.51 6.7 0.47 6.3 0.45 5.8 12.6 11.0 1.0 0.9 12.9 1.0 2.3 Median 0.61 6.2 0.57 6.1 0.52 5.7 11.5 10.2 0.9 0.8 13.0 0.9 2.4
Mean(6) 0.47 6.2 0.45 6.0 0.42 5.6 12.9 12.2 1.1 1.1 11.9 1.5 2.7 Median(6) 0.41 6.1 0.39 5.9 0.37 5.5 11.5 10.2 0.9 0.8 12.0 1.5 2.6 High(6) 0.75 9.2 0.72 8.4 0.69 8.0 32.4 43.9 3.2 4.4 16.0 3.7 4.0 Low(6) 0.20 3.9 0.18 4.1 0.17 3.9 6.5 6.1 0.7 0.7 8.0 0.0 1.3

133
Implied Valuation Based on Other Retailers
The implied Target Corp valuation range based on other publicly traded retailers is $18 – $28bn, or $24 – $39/share today
2009E 2009EMultiple Metric ($mm) Multiple Range Implied Value ($bn)
EV/EBITDA 5,172 5.5x – 7.5x 17.5 – 27.8
P/E $2.23 11.0x – 14.5x 17.7 – 23.4
Implied Reference Range

32.4
17.815.4 14.4 13.2 12.3 11.5 10.6 9.8 9.3 9.0 8.8
6.5
11.8(3) 11.5 11.314.2(2)
13.610.6
14.1
0
5
10
15
20
25
30
35
Sears Costco BJ's Wal-Mart WholeFoods
Lowe's HomeDepot
Kroger Staples TJX Kohl's CVS Walgreens Macy's Safeway Best Buy JCPenney
Average(4) = 12.9
8.4 7.87.2 7.1 6.7 6.4 6.1 6.0 5.9 5.5 5.3 5.2 4.8 4.8 4.8
4.1
6.0(3) 5.8 5.76.5(2)
0
4
8
12
Costco Wal-Mart Sears Staples HomeDepot
CVS Lowe's BJ's TJX Kroger Kohl's Walgreens Macy's WholeFoods
Best Buy Safeway
Average(4) = 6.0
134
Target Corp Comparable Companies-Trading Multiples(1)
2009E EV/EBITDA Multiples (x)
2009E P/E Multiples (x)
(1) As of October 24, 2008(2) Implied multiple from midpoint of Target Corp valuation ($20.3bn–$25.3bn)(3) Represents fiscal year ending January(4) Excludes Target
Standalone
Target is currently trading near the midpoint of its peer group
Corp
StandaloneCorp
SUPERVALU
SUPERVALU
JCPenney

Projected Calendar Year,($mm) 2009E 2010E 2011E 2012E 2013EEBITDA 1 5,172 5,751 6,485 7,169 7,968 Less: Depreciation and Amortization (1,884) (2,017) (2,199) (2,410) (2,654) EBIT 3,288 3,735 4,285 4,759 5,314 Less: Taxes @ 38% (1,262) (1,434) (1,645) (1,827) (2,041) After-Tax EBIT 2,025 2,301 2,640 2,931 3,274 Plus: Depreciation and Amortization 1,884 2,017 2,199 2,410 2,654 Less: Net Capital Expenditures (2,826) (2,850) (3,400) (3,870) (4,416) Plus: Decrease in Working Capital 79 120 167 193 224 UNLEVERED FREE CASH FLOWS 1,162 1,588 1,606 1,665 1,736
ILLUSTRATIVE VALUATION($ in millions, except per share amounts)Terminal EBITDA 2 8,824 Terminal Discount RateTerminal EV/EBITDA Multiple 6.5x Multiple 9.00% 10.00% 11.00% Terminal Value 57,357 6.0x 29,668 27,993 26,404 Present Value of TV 3 35,614 6.5x 32,536 30,732 29,022 Sum of Discounted Cash Flows (2009-2013) 3 6,073 7.0x 35,403 33,472 31,641 Implied Enterprise Value 41,687 Less: Debt (1/1/09) 4 (11,455) Plus: Cash (1/1/09) 4 500 Implied Equity Value 30,732 Terminal Discount Rate
Multiple 9.00% 10.00% 11.00%6.0x 2.4 3.3 4.2 6.5x 2.9 3.8 4.7
Notes: 7.0x 3.3 4.2 5.1 1 Assumes sale of remaining 53% interest on credit card receivables for $4.4bn; ongoing royalty stream of $150mm2 Assumes 2014E EBITDA growth equal to 2013E growth3 Assumes mid-year convention4 Assumes $4.4bn of proceeds from sale of remaining 53% interest on credit card receivables used to pay down debt 5 Assumes capital expenditures equal to depreciation and amortization in perpetuity
Implied Equity Value
Implied Perpetuity Growth Rate (%) 5
135
Target Corp Discounted Cash Flow Analysis
The implied Target Corp valuation range based on DCF analysis is $26 – $35bn, or $37 – $49/share today
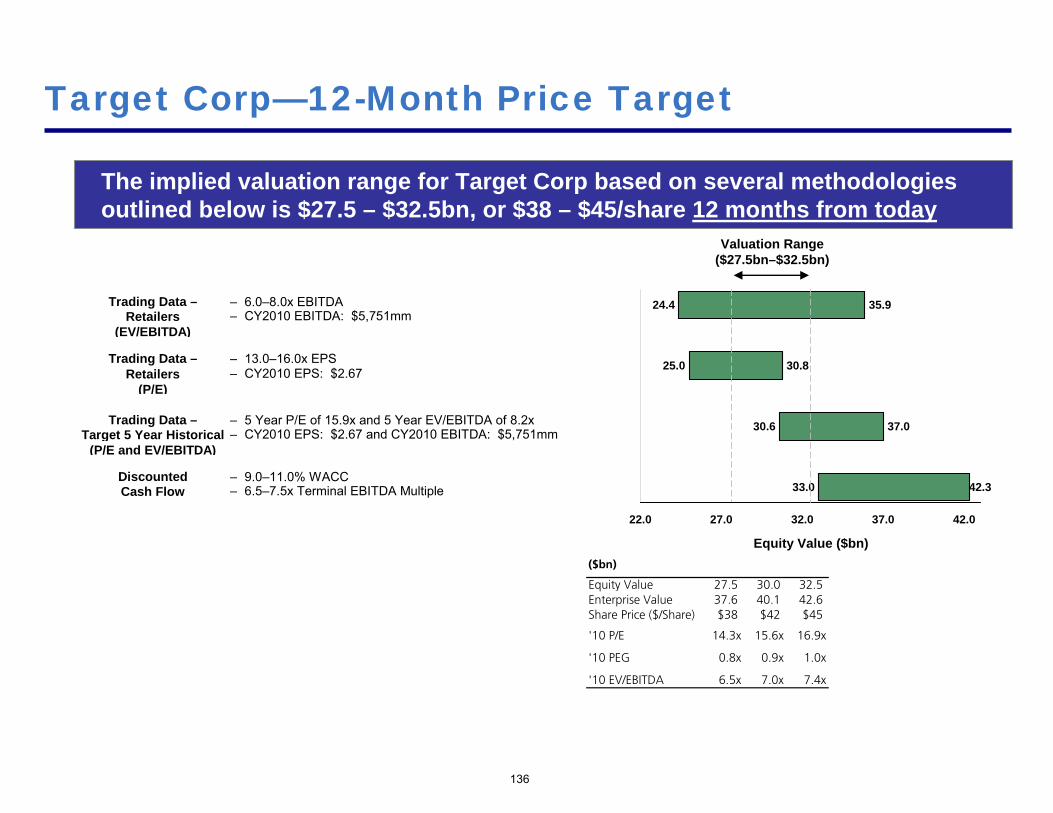
Trading Data – – 6.0–8.0x EBITDARetailers – CY2010 EBITDA: $5,751mm
(EV/EBITDA) – Current Multiple is 6.0x
Trading Data – – 13.0–16.0x EPSRetailers – CY2010 EPS: $2.67
(P/E) – Current Multiple is 11.8x
Trading Data – – 5 Year P/E of 15.9x and 5 Year EV/EBITDA of 8.2xTarget 5 Year Historical – CY2010 EPS: $2.67 and CY2010 EBITDA: $5,751mm
(P/E and EV/EBITDA) – Current P/E is 11.8x and current EV/EBITDA is 6.0x
Discounted – 9.0–11.0% WACCCash Flow – 6.5–7.5x Terminal EBITDA Multiple
($bn)
Equity Value 27.5 30.0 32.5Enterprise Value 37.6 40.1 42.6Share Price ($/Share) $38 $42 $45
'10 P/E 14.3x 15.6x 16.9x
'10 PEG 0.8x 0.9x 1.0x
'10 EV/EBITDA 6.5x 7.0x 7.4x
25.0
30.6
33.0
35.9
30.8
37.0
42.3
24.4
22.0 27.0 32.0 37.0 42.0
Target Corp—12-Month Price Target
Valuation Range($27.5bn–$32.5bn)
Equity Value ($bn)
136
The implied valuation range for Target Corp based on several methodologies outlined below is $27.5 – $32.5bn, or $38 – $45/share 12 months from today

Credit Rating Analysis

138
Maintains Investment Grade Credit Rating
Target Corp and TIP REIT will have integrated, mutually dependent business modelsVast majority of TIP REIT revenues will be based on Target Corp land leases for many yearsLease arrangements and large size of land portfolio lead to high correlation of credit quality between TIP REIT and Target Corp TIP REIT will also provide facility management services to Target Corp
Target Corp and TIP REIT will be separate legal entities with common public ownership at the onset; shareholder base expected to diverge over time due to differing business profiles of the two entities
Based on this structure, we believe that the Rating Agencies will adopt one of either two possible analytical approaches for their analysis of Target Corp and TIP REIT:
a ‘Consolidated’ analysis of the combined group/system, or
a ‘De-consolidated’ analysis of the two separate entities on a standalone basis, but with some linkageA ‘Consolidated’ approach is supported by the integrated, economically inter-twined business relationship between Target Corp as lessor and TIP REIT as landownerA ‘De-consolidated’ approach is supported by the fact that the companies will be separate legal entities with no common ownership, except for shareholders initiallyAgencies may not unanimously take the same analytical approach when assessing Target Corp and TIP REIT profile
Leading to potential for one or more agency taking a ‘consolidated’ approach and another taking a ‘de-consolidated’ approach
We believe the Rating Agencies will adopt one of two possible analytical approaches when assessing the credit profiles of the ‘new’ Target Corp and TIP REIT – ‘Consolidated’ vs. ‘De-consolidated’

139
Maintains Investment Grade Credit Rating (cont’d)
Regardless of the analytical approach adopted by the Agencies, we believe that Target Corp will maintain Investment Grade credit ratings
Under a ‘Consolidated’ methodology, Agencies are expected:
To review metrics of the consolidated group where lease payments between Target Corp and TIP REIT are expected to ‘cancel out’
To assign the consolidated group’s rating to both Target Corp and TIP REIT
Under a ‘De-consolidated’ methodology, Agencies are expected:
To review Target Corp and TIP REIT independently
To assign independent ratings to both Target Corp and TIP REIT, although we anticipate that there will be some ratings linkage between the two
Regardless of the analytical approach, we believe:Target Corp will maintain solid Investment Grade credit ratings
Between Mid-High BBB/Baa to A-/A3TIP REIT will achieve Investment Grade credit ratings
Under any scenario, we anticipate that Target Corp will generate significant free cash flows with ability to deleverage to credit metrics supportive of stronger Investment Grade ratings over the near to intermediate term

Structural and Legal Considerations

Land Development / Procurement
Immediately after spin-off, TIP REIT enters into a two-year exclusive agreement to develop land for Target Corp
Afterwards, Target Corp will have a Preferred Vendor Agreement with TIP REIT
It is anticipated that TIP REIT will act as the land procurement developer for Target Corp
Target Corp will notify TIP REIT when it identifies a place to build a store and will inquire about TIP REIT’s interest in providing land procurement development services for the specified area (assembling, clearing and entitling one or more parcels of land)
If TIP REIT expresses interest, the parties will discuss terms over a standard period (e.g. 10+ days); upon reaching terms, TIP REIT will commence land procurement development services
If TIP REIT decides not to pursue the opportunity offered by Target Corp, or the parties do not agree upon terms within the specified standard period, Target Corp may secure the services of another party or undertake the land procurement development services on its own
Set forth below is an illustrative example of how Target Corp and TIP REIT can work together on future land procurement
141

Land Development / Procurement (cont’d)
Target Corp will have the right to purchase land for the store directly, but in that case Target Corp must notify TIP REIT to determine whether TIP REIT wishes to purchase the land from Target Corp and lease it back to Target Corp
If TIP REIT expresses interest and agrees on market terms within the specified standard period, TIP REIT will purchase the land from Target Corp, clear and entitle it and lease it back to Target Corp on the agreed terms
Target Corp will be under no obligation to accept any terms if it determines in good faith that doing so would not be in the best interest of Target Corp and its shareholders
The agreement will contain customary confidentiality and standstill provisions that will prevent TIP REIT from misusing the information that Target Corp is looking to build a particular site
After the fifth anniversary of the spin-off, either TIP REIT or Target Corp may terminate the Preferred Vendor Agreement
Store development: Target Corp will retain its store development function and will be solely responsible for developing its owned stores
142
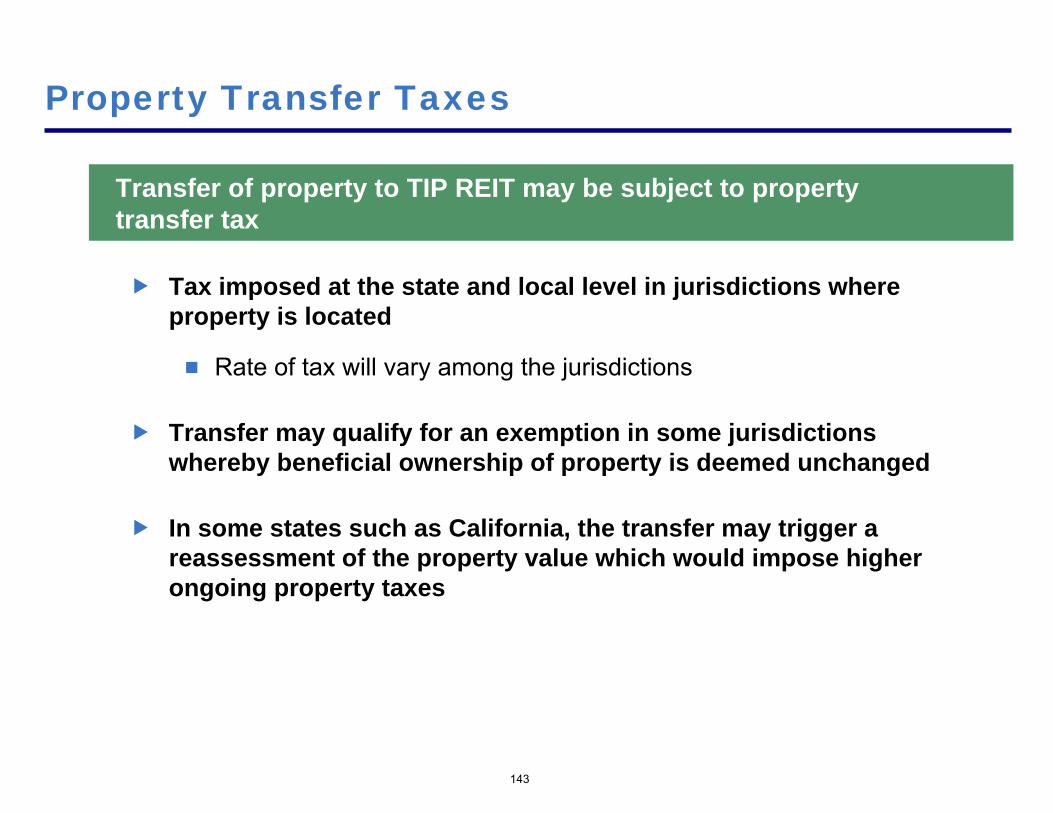
143
Property Transfer Taxes
Transfer of property to TIP REIT may be subject to property transfer tax
Tax imposed at the state and local level in jurisdictions where property is located
Rate of tax will vary among the jurisdictions
Transfer may qualify for an exemption in some jurisdictions whereby beneficial ownership of property is deemed unchanged
In some states such as California, the transfer may trigger a reassessment of the property value which would impose higher ongoing property taxes

Supporting Data

145
Store–level ROICP&L Data: ($mm)
Standalone 2007A
Pro Forma 2007A
Retail Sales $61,471 $61,471 Retail Gross Margin 19,576 19,576 Retail EBIT $4,213 $4,213 Plus: Advertising (50% of Consolidated) 598 598 Plus: Buying Group Expense and Occupancy Expense 1,321 1,321 Less: Incremental Ground Lease Rent (Stores) -- (1,235) (1) Less: Incremental Ground Lease Rent (DCs & WHs) -- (46) (2) Plus: Estimated Corporate G&A 615 615 % of Revenues 1.0% 1.0% Plus: Estimated Distribution Center Costs 2,459 2,505 % of Revenues 4.0% 4.1% Estimated Four-Wall Retail EBIT $9,040 $7,970
Store Level Operating Data and Assumptions: ($mm)
Standalone 2007A
Pro Forma 2007A
Retail Sales per Avg. Store $39.9 $39.9 Memo: Avg. # of Stores 1,540 1,540 Estimated Four-Wall Operating Costs per Avg. Store $33.9 $34.7 Ground Lease Expense per Avg. Store -- 1 Estimated Four-Wall EBIT per Avg. Store $6.0 $5.2 Margin 15.0% 13.0% New Land Capex $13 -- New Building Capex 13 13 Total Investment $26 $13 Est. Pre-Tax Unlevered Returns on Investment 23.0% 39.8%
(1) Assumes $1.2bn of ground lease rent expense from stores, based on $7/sq. ft. lease cost, 131k of square footage per store and 1,350 stores, on average; implying a cap rate of 7.0%(2) Assumes $46mm of ground lease rent expense from DCs & WHs, based on $1.25/sq. ft. lease cost, 1.4mm of square footage per DC & WH and 26 DCs & WHs, on average
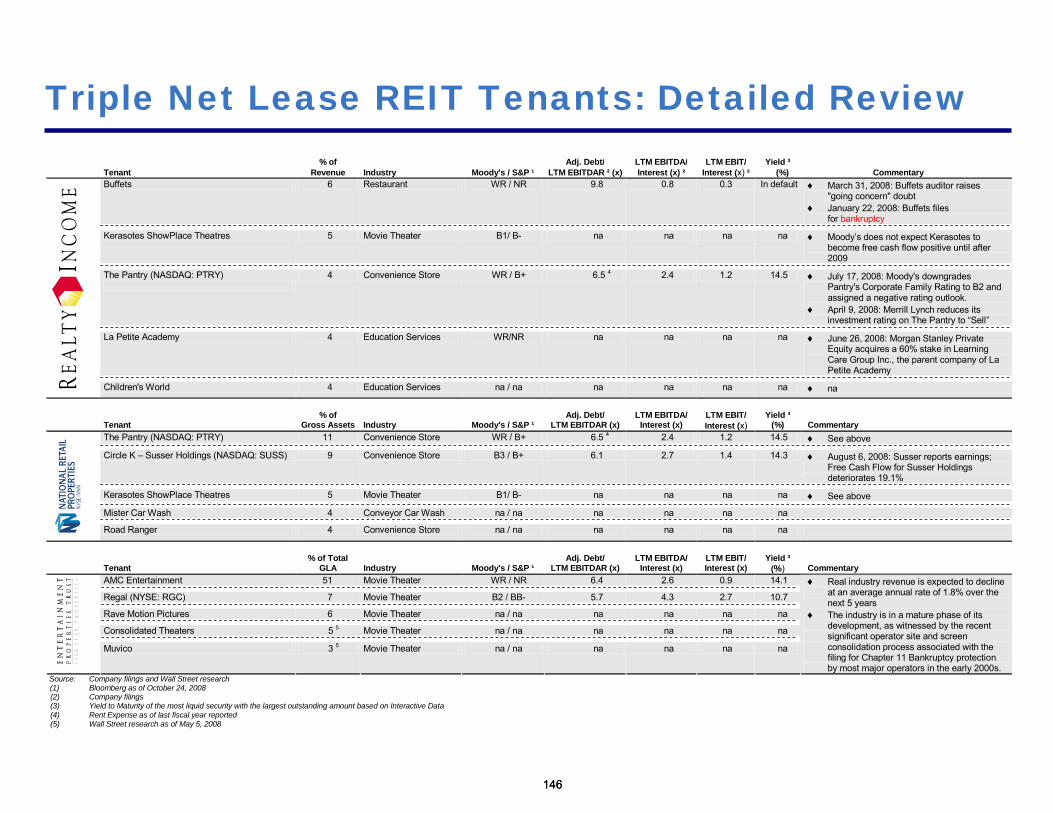
Triple Net Lease REIT Tenants: Detailed Review
146
% of Adj. Debt/ LTM EBITDA/ LTM EBIT/ Yield ³ Tenant Revenue Industry Moody's / S&P ¹ LTM EBITDAR ² (x) Interest (x) ² Interest (x) ² (%) Commentary
Buffets 6 Restaurant WR / NR 9.8 0.8 0.3 In default ♦ March 31, 2008: Buffets auditor raises "going concern" doubt
♦ January 22, 2008: Buffets files for bankruptcy
Kerasotes ShowPlace Theatres 5 Movie Theater B1/ B- na na na na ♦ Moody’s does not expect Kerasotes to become free cash flow positive until after 2009
The Pantry (NASDAQ: PTRY)
4 Convenience Store WR / B+ 6.5 4 2.4 1.2 14.5 ♦ July 17, 2008: Moody's downgrades Pantry's Corporate Family Rating to B2 and assigned a negative rating outlook.
♦ April 9, 2008: Merrill Lynch reduces its investment rating on The Pantry to “Sell”
La Petite Academy 4 Education Services WR/NR na na na na ♦ June 26, 2008: Morgan Stanley Private Equity acquires a 60% stake in Learning Care Group Inc., the parent company of La Petite Academy
Children's World 4 Education Services na / na na na na na ♦ na
% of Adj. Debt/ LTM EBITDA/ LTM EBIT/ Yield ³ Tenant Gross Assets Industry Moody's / S&P ¹ LTM EBITDAR (x) Interest (x) Interest (x) (%) Commentary
The Pantry (NASDAQ: PTRY) 11 Convenience Store WR / B+ 6.5 4 2.4 1.2 14.5 ♦ See above
Circle K – Susser Holdings (NASDAQ: SUSS) 9 Convenience Store B3 / B+ 6.1 2.7 1.4 14.3 ♦ August 6, 2008: Susser reports earnings; Free Cash Flow for Susser Holdings deteriorates 19.1%
Kerasotes ShowPlace Theatres 5 Movie Theater B1/ B- na na na na ♦ See above
Mister Car Wash 4 Conveyor Car Wash na / na na na na na
Road Ranger 4 Convenience Store na / na na na na na
% of Total Adj. Debt/ LTM EBITDA/ LTM EBIT/ Yield ³ Tenant GLA Industry Moody's / S&P ¹ LTM EBITDAR (x) Interest (x) Interest (x) (%) Commentary
AMC Entertainment 51 Movie Theater WR / NR 6.4 2.6 0.9 14.1
Regal (NYSE: RGC) 7 Movie Theater B2 / BB- 5.7 4.3 2.7 10.7
Rave Motion Pictures 6 Movie Theater na / na na na na na
Consolidated Theaters 5 5 Movie Theater na / na na na na na
Muvico 3 5 Movie Theater na / na na na na na
♦ Real industry revenue is expected to decline at an average annual rate of 1.8% over the next 5 years
♦ The industry is in a mature phase of its development, as witnessed by the recent significant operator site and screen consolidation process associated with the filing for Chapter 11 Bankruptcy protection by most major operators in the early 2000s.
Source: Company filings and Wall Street research (1) Bloomberg as of October 24, 2008 (2) Company filings (3) Yield to Maturity of the most liquid security with the largest outstanding amount based on Interactive Data (4) Rent Expense as of last fiscal year reported (5) Wall Street research as of May 5, 2008
146

Model – Standalone

148
Standalone Model – Income StatementStatus Status
Quo Quo Credit Card Pro Forma Calendar Year, CAGR($mm) CY2007 CY2008 Adj. CY2008 2009 2010 2011 2012 2013 '09 - '13Retail Sales 61,471 64,892 64,892 68,249 73,356 80,479 88,710 98,241 9.5%
Base Sales Growth (%) 5.2% 7.5% 9.7% 10.2% 10.7%Credit Revenue 1,896 2,078 (1,936) 143 150 161 177 195 216 9.5%
Credit Sales Growth 5.2% 7.5% 9.7% 10.2% 10.7%Total Revenue 63,367 66,970 65,034 68,399 73,517 80,655 88,905 98,457 9.5%
Total Revenue Growth 5.2% 7.5% 9.7% 10.2% 10.7%
COGS 42,929 45,459 45,459 47,777 51,279 56,177 61,919 68,563% of Retail Sales 69.8% 70.1% 70.1% 70.0% 69.9% 69.8% 69.8% 69.8%
SG&A (excluding D&A and Rent Expense) 12,392 13,058 13,058 13,834 14,761 16,115 17,761 19,668% of Retail Sales 20.2% 20.1% 20.1% 20.3% 20.1% 20.0% 20.0% 20.0%
Credit Expenses 950 1,460 (1,460) - - - - - - % of Credit Revenue 50.1% 70.2% 0.0% 0.0% 0.0% 0.0% 0.0% 0.0%
Retail EBITDAR 6,150 6,375 6,375 6,637 7,316 8,187 9,029 10,011 10.8%Retail EBITDAR Margin (%) 10.0% 9.8% 9.8% 9.7% 10.0% 10.2% 10.2% 10.2%
Credit EBITDAR 946 619 (476) 143 150 161 177 195 216 9.5%Credit EBITDAR Margin (%) 49.9% 29.8% 100.0% 100.0% 100.0% 100.0% 100.0% 100.0%
EBITDAR 7,096 6,993 6,517 6,787 7,478 8,364 9,224 10,227 10.8%EBITDAR Margin (%) 11.2% 10.4% 10.0% 9.9% 10.2% 10.4% 10.4% 10.4%
Rent Expense 165 169 169 173 178 182 187 191EBITDA 6,931 6,824 6,348 6,614 7,300 8,182 9,038 10,036 11.0%
EBITDA Margin (%) 10.9% 10.2% 9.8% 9.7% 9.9% 10.1% 10.2% 10.2%
Depreciation & Amortization 1,659 1,807 1,807 1,940 2,085 2,288 2,522 2,793% of Retail Sales 2.7% 2.8% 2.8% 2.8% 2.8% 2.8% 2.8% 2.8%
Operating Income 5,272 5,017 4,541 4,674 5,215 5,894 6,516 7,243 11.6%
Net Interest (Income) / Expense 647 995 555 694 722 798 897 1,003Income Tax Provision 1,776 1,483 1,469 1,528 1,725 1,957 2,158 2,396
Tax Rate (%) 38% 37% 37% 38% 38% 38% 38% 38%Net Income 2,849 2,539 2,517 2,452 2,767 3,139 3,461 3,844 11.9%
Net Income Margin (%) 4.5% 3.8% 3.9% 3.6% 3.8% 3.9% 3.9% 3.9%
Current Diluted Shares Outstanding 882.6 819.0 819.0 721.9 720.4 697.3 677.3 659.1Shares Repurchase (63.7) (97) (97.0) (1.6) (23.1) (20.0) (18.2) (14.0)Share Repurchase from Options 0.0 0.0 0.0 0.0 0.0 0.0 0.0 0.0
Total Shares Outstanding 819.0 721.9 721.9 720.4 697.3 677.3 659.1 645.2Weighted Average Shares Outstanding 850.8 765.9 765.9 721.1 708.8 687.3 668.2 652.2
Earnings per Share ($) $3.33 $3.32 $3.29 $3.40 $3.90 $4.57 $5.18 $5.89 6.71 14.7%

149
Standalone Model – Balance Sheet
Status Status
Quo Quo Pro Forma Calendar Year,
($mm) CY2007 CY2008 Adj. CY2008 2009 2010 2011 2012 2013
Cash & Equivalents 2,450 500 0 500 607 653 716 790 874
Trade Receivables 8,054 8,383 (8,383) - - - - - -
Other Current Assets 8,402 9,232 9,232 9,710 10,436 11,450 12,621 13,977
Property, Plant & Equipment, gross 31,982 35,734 35,734 39,639 43,497 48,479 54,212 60,817
Accumulated Depreciation (7,887) (9,350) (9,350) (11,290) (13,375) (15,663) (18,185) (20,977)
Property, Plant & Equipment, net 24,095 26,384 26,384 28,348 30,122 32,816 36,027 39,840
Other Non-Current Assets 1,559 1,368 1,368 1,368 1,368 1,368 1,368 1,368
Total Assets 44,560 45,867 37,484 40,033 42,579 46,350 50,805 56,059
Debt 17,090 19,455 (8,000) 11,455 11,455 12,455 13,955 15,705 17,455
Other Current Liabilities 9,818 10,757 10,757 11,313 12,160 13,340 14,705 16,285
Other Non-Current Liabilities 2,345 2,392 2,392 2,392 2,392 2,392 2,392 2,392
Total Liabilities 29,253 32,604 24,604 25,160 27,007 29,687 32,802 36,132
Total Equity 15,307 13,264 (383) 12,880 14,873 15,572 16,663 18,004 19,927
Total Equity & Liabilities 44,560 45,867 37,484 40,033 42,579 46,350 50,805 56,059
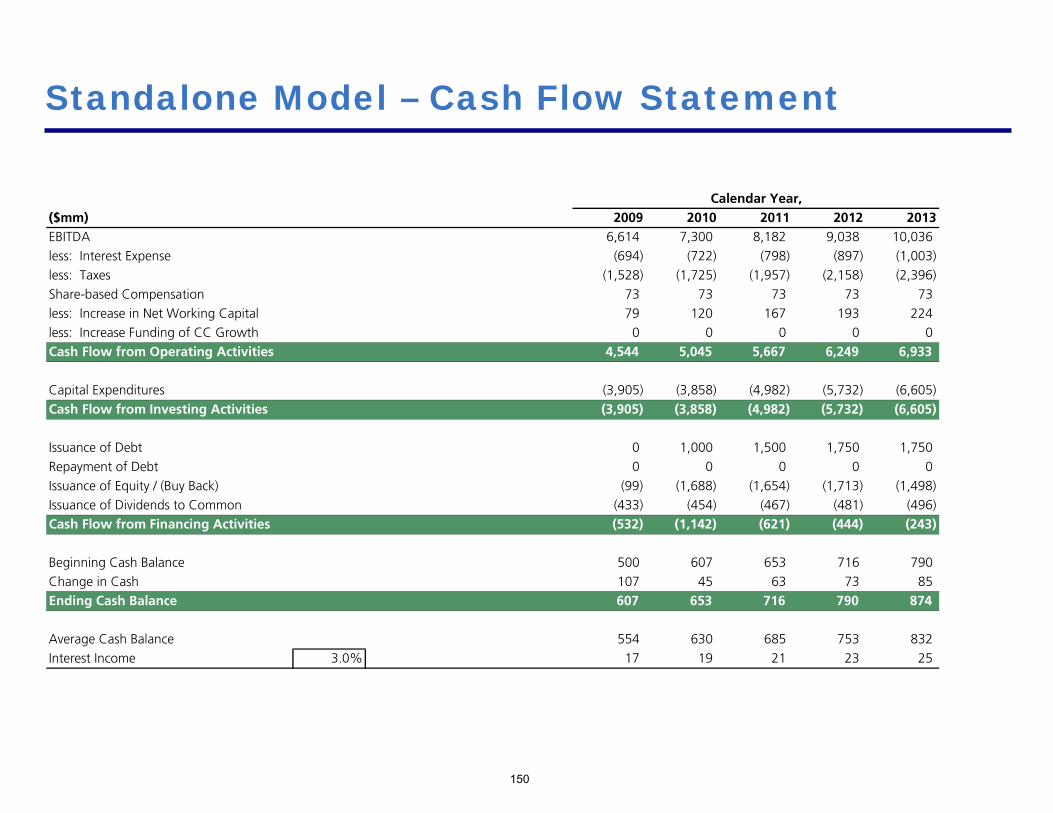
150
Standalone Model – Cash Flow Statement
Calendar Year,($mm) 2009 2010 2011 2012 2013EBITDA 6,614 7,300 8,182 9,038 10,036
less: Interest Expense (694) (722) (798) (897) (1,003)
less: Taxes (1,528) (1,725) (1,957) (2,158) (2,396)
Share-based Compensation 73 73 73 73 73
less: Increase in Net Working Capital 79 120 167 193 224
less: Increase Funding of CC Growth 0 0 0 0 0
Cash Flow from Operating Activities 4,544 5,045 5,667 6,249 6,933
Capital Expenditures (3,905) (3,858) (4,982) (5,732) (6,605)
Cash Flow from Investing Activities (3,905) (3,858) (4,982) (5,732) (6,605)
Issuance of Debt 0 1,000 1,500 1,750 1,750
Repayment of Debt 0 0 0 0 0
Issuance of Equity / (Buy Back) (99) (1,688) (1,654) (1,713) (1,498)
Issuance of Dividends to Common (433) (454) (467) (481) (496)
Cash Flow from Financing Activities (532) (1,142) (621) (444) (243)
Beginning Cash Balance 500 607 653 716 790
Change in Cash 107 45 63 73 85
Ending Cash Balance 607 653 716 790 874
Average Cash Balance 554 630 685 753 832
Interest Income 3.0% 17 19 21 23 25

151
Standalone Model – Build-ups and Credit Metrics
StatusQuo Pro Forma Calendar Year,
Sales Buildup CY2007 CY2008 2009 2010 2011 2012 2013Square Feet (mm) 208 222 232 241 256 273 292
$ / Sq. Ft. 296 293 294 304 314 325 337
Retail Sales 61,471 64,892 68,249 73,356 80,479 88,710 98,241
Implied Retail Sales Growth (%) 5.6% 5.2% 7.5% 9.7% 10.2% 10.7%
Sq. Footage Growth (%) 6.6% 4.7% 4.1% 6.0% 6.5% 7.0%
SSS Growth (%) (0.9%) 0.5% 3.3% 3.5% 3.5% 3.5%
CapEx Buildup 2007 2008 2009 2010 2011 2012 2013Total System CapEx 4,369 4,112 3,905 3,858 4,982 5,732 6,605
CapEx as % of Retail Sales 7.1% 6.3% 5.7% 5.3% 6.2% 6.5% 6.7%
Status StatusQuo Quo Pro Forma
Credit Metrics CY2007 CY2008 CY2008Lease Adjusted Debt 8 x 1,320 1,353 1,353 1,387 1,421 1,457 1,493 1,531
Actual Debt 17,090 19,455 11,455 11,455 12,455 13,955 15,705 17,455
Total Lease Adjusted Debt 18,410 20,808 12,808 12,842 13,876 15,412 17,198 18,986
Total Lease Adjusted Debt/EBITDAR 2.6 x 3.0 x 2.0 x 1.9 x 1.9 x 1.8 x 1.9 x 1.9 x
Total Debt / EBITDA 2.5 x 2.9 x 1.8 x 1.7 x 1.7 x 1.7 x 1.7 x 1.7 x
EBITDAR / (Interest + Rent) 8.7 x 6.0 x 9.0 x 7.8 x 8.3 x 8.5 x 8.5 x 8.6 x
EBITDA / Interest 10.7 x 6.9 x 11.4 x 9.5 x 10.1 x 10.3 x 10.1 x 10.0 x

Model – TIP REIT

153
TIP REIT Model – Income StatementPro Forma Calendar Year, CAGR
($mm, except as noted) CY2008 2009 2010 2011 2012 2013 '09 - '13Gross TIP REIT Revenues from Ground-leased Store Land 1,325 1,398 1,501 1,645 1,811 2,004 9.4%Gross TIP REIT Revenues from Ground-leased DCs & WHs Land 44 46 48 51 55 59 6.3%
Total Gross TIP REIT Revenues 1,369 1,444 1,549 1,696 1,866 2,063 9.3%
Total TIP REIT Net Rental Revenues 1,369 1,444 1,549 1,696 1,866 2,063 9.3%% of Target Corp Retail Sales 2.1% 2.1% 2.1% 2.1% 2.1% 2.1%
Plus: Facilities Management Income 144 144 155 170 187 207 Less: Facilities Management Expense (125) (125) (134) (147) (162) (180)
Net Facilities Management Income 19 19 20 22 24 27 9.5%
Net Operating Income 1,388 1,462 1,569 1,718 1,890 2,090 9.3%
Less: G&A Expense (20) (20) (21) (21) (22) (22) Less: Incremental G&A Cost (15) (15) (15) (16) (16) (17)
EBITDA 1,353 1,427 1,533 1,681 1,853 2,051 9.5%
Less: Depreciation & Amortization (42) (56) (68) (88) (111) (139) Less: Interest Expense (205) (188) (221) (316) (428) (559) Less: Taxes on Facilities Mgmt. Income 38% (7) (7) (8) (8) (9) (10)
Net Income 1,099 1,177 1,235 1,268 1,304 1,342 3.3%
Normalized Net Income (1) 1,211 1,289 1,331 1,364 1,400 1,438 2.8%
Ending Shares Outstanding 721.9 721.9 721.9 721.9 721.9 721.9 Earnings per Share $1.52 $1.63 $1.71 $1.76 $1.81 $1.86 3.3%
Normalized Earnings per Share (1) $1.68 $1.79 $1.84 $1.89 $1.94 $1.99 2.8%% AFFO
Dividends on Common 100.0% 1,141 1,232 1,304 1,356 1,415 1,481 4.7%Special Dividends - 1,600 - - - -
Normalized Dividends (1) 1,253 1,344 1,400 1,452 1,511 1,577 4.1%
Normalized Dividends per Share (1) $1.74 $1.86 $1.94 $2.01 $2.09 $2.18 4.1%
(1) Normalized to exclude incremental interest expense due to CY2009 cash E&P distribution

154
TIP REIT Model – Balance Sheet
Pro Forma Calendar Year, CAGR($mm, except as noted) CY2008 2009 2010 2011 2012 2013 '09 - '13Real Estate:
Gross Existing Properties - Land & Improvements 12,228 12,228 12,228 12,228 12,228 12,228 Maintenance Capex - - - - - Development Properties - Land & Improvements 1,079 2,087 3,669 5,532 7,722 Accumulated Depreciation (846) (901) (970) (1,058) (1,169) (1,308)
Net Real Estate Asset 11,382 12,405 13,345 14,839 16,590 18,641
Cash - 3 3 3 3 3
Total Assets 11,382 12,408 13,348 14,842 16,593 18,644 10.7%
Debt:Revolver - 3 3 3 3 3 New Debt - 2,679 3,687 5,269 7,132 9,322
Total Debt - 2,682 3,690 5,272 7,135 9,325
Common Equity 11,382 11,382 11,382 11,382 11,382 11,382 Retained Earnings (Deficit) (1,656) (1,724) (1,812) (1,924) (2,063) Total Equity 11,382 9,727 9,658 9,570 9,459 9,320
Total Liabilities & Equity 11,382 12,408 13,348 14,842 16,593 18,644 10.7%

155
TIP REIT Model – Cash Flow Statement
Calendar Year, CAGR($mm, except as noted) 2009 2010 2011 2012 2013 '09 - '13Cash Flow from Operating Activities:
EBITDA 1,353 1,427 1,533 1,681 1,853 2,051 Less: Interest Expense (205) (188) (221) (316) (428) (559) Less: Taxes on Facilities Mgmt. Income (7) (7) (8) (8) (9) (10)
Net Cash Flow from Operating Activities 1,141 1,232 1,304 1,356 1,415 1,481 4.7%
Cash Flow from Investing Activities:Development Capex (1,079) (1,008) (1,582) (1,863) (2,190) Maintenance Capex - - - - -
Net Cash Flow from Investing Activities (1,079) (1,008) (1,582) (1,863) (2,190) 19.4%
Cash Flow from Financing Activities:Debt Financing:Increase (Decrease) in Revolver 3 - - - - Increase (Decrease) in New Debt 2,679 1,008 1,582 1,863 2,190 Equity Financing:Increase (Decrease) in Common Equity - - - - - Dividends on Common (1,141) (1,232) (1,304) (1,356) (1,415) (1,481) Special Dividends (1,600) - - - -
Net Cash Flow from Financing Activities (151) (295) 226 447 709
Beginning Cash Balance - 3 3 3 3 Net Change in Cash 3 - - - - Ending Cash Balance - 3 3 3 3 3

156
TIP REIT Model – Rent Build-upPro Forma Calendar Year, CAGR
Assumptions ($mm, except as noted): CY2008 2009 2010 2011 2012 2013 '09 - '13Total Combined Stores - Sq. Ft. Count
Owned Stores 1,438 189 200 209 224 240 259 Combined (Ground-leased) Stores 172 23 23 23 23 23 23 Third-party Leased Stores 73 10 10 10 10 10 10
Total Combined Stores Square Footage 222 232 241 256 273 292 5.9%Total Combined Stores Square Footage Growth 4.7% 4.1% 6.0% 6.5% 7.0%
TIP REIT Stores - Sq. Ft. CountOwned Stores 1,438 Yes 189 200 209 224 240 259
Total TIP REIT Stores Square Footage 189 200 209 224 240 259 6.8%Total TIP REIT Stores Square Footage Growth 5.4% 4.8% 6.9% 7.4% 7.9%
Total Combined DCs & WHs - Sq. Ft. CountOwned DCs & WHs 25 35 37 37 39 41 43 Combined (Ground-leased) DCs & WHs 1 1 1 1 1 1 1 Third-party Leased DCs & WHs 5 7 7 7 7 7 7
Total Combined DCs & WHs Square Footage 44 45 46 47 49 51 3.1%Total DCs & WHs Sq. Ft. vs. Total Combined Stores Sq. Ft. 19.7% 19.5% 19.0% 18.5% 18.0% 17.5%
TIP REIT DCs & WHs - Sq. Ft. CountOwned DCs & WHs 25 Yes 35 37 37 39 41 43
Total TIP REIT DCs & WHs Square Footage 35 37 37 39 41 43 3.7%Total TIP REIT DCs & WHs Square Footage Growth 4.4% 1.8% 3.9% 4.4% 4.9%
Rent / Square Foot - Store Land $7.00 $7.00 $7.18 $7.35 $7.54 $7.73CPI Growth 2.5% 2.5% 2.5% 2.5% 2.5%
Average Growth 2.5% 2.5% 2.5% 2.5% 2.5%
TIP REIT Revenues from Ground-leased Land 1,325 1,398 1,501 1,645 1,811 2,004 9.4%
Rent / Square Foot - DCs & WHs Land $1.25 $1.25 $1.28 $1.31 $1.35 $1.38CPI Growth 2.5% 2.5% 2.5% 2.5% 2.5%
Average Growth 2.5% 2.5% 2.5% 2.5% 2.5%
TIP REIT Revenues from Ground-leased DCs & WHs 44 46 48 51 55 59 6.3%
Total TIP REIT Gross Revenues 1,369 1,444 1,549 1,696 1,866 2,063 9.3%

157
TIP REIT Model – FFO & AFFO Reconciliations, Credit Statistics and Implied Metrics
(1) Normalized to exclude incremental interest expense due to CY2009 cash E&P distribution
Pro Forma Calendar Year, CAGRFFO & AFFO Reconciliations: CY2008 2009 2010 2011 2012 2013 '09 - '13Net Income 1,099 1,177 1,235 1,268 1,304 1,342
Plus: Depreciation & Amortization 42 56 68 88 111 139 Funds from Operations 1,141 1,232 1,304 1,356 1,415 1,481 4.7%
Ending Shares Outstanding 721.9 721.9 721.9 721.9 721.9 721.9 FFO / Share $1.58 $1.71 $1.81 $1.88 $1.96 $2.05 4.7%
Less: Maintenance Capex - - - - - - Adjusted Funds from Operations 1,141 1,232 1,304 1,356 1,415 1,481 4.7%
Normalized AFFO (1) 1,253 1,344 1,400 1,452 1,511 1,577 4.1%
Credit Statistics:Coverage:
EBITDA / Interest Expense 7.6x 6.9x 5.3x 4.3x 3.7x(EBITDA - Maintenance Capex) / Interest Expense 7.6x 6.9x 5.3x 4.3x 3.7x
Leverage:Total Debt / EBITDA 1.9x 2.4x 3.1x 3.9x 4.5x
Capitalization:Total Debt / Total Real Estate Value 11.1% 14.2% 18.6% 22.9% 27.0%(NOI capped at 6.0% and 8.5% for store land and DCs & WHs land, respectively)
Implied Metrics:Incremental Stores Square Footage 10 10 14 17 19
SuperTarget Stores 50.0% 5 5 7 8 10 Implied New Combined SuperTarget Stores 0.177 Sq. Ft. / SuperTarget 29 27 41 47 54
% of Total New Stores Built 41.4% 41.5% 41.4% 41.2% 41.2%Combined Total Number of SuperTarget Stores 239 268 295 336 383 437
General Merchandise Stores 50.0% 5 5 7 8 10 Implied New Combined GM Stores 0.124 Sq. Ft. / GM 41 38 58 67 77
% of Total New Stores Built 58.6% 58.5% 58.6% 58.8% 58.8%Combined Total Number of General Merchandise Stores 1,444 1,485 1,523 1,581 1,648 1,725 Total Implied New Stores 70 65 99 114 131 Cumulative Combined Total Implied Stores 1,683 1,753 1,818 1,917 2,031 2,162
Incremental DCs & WHs Square Footage 2 1 1 2 2 Implied Combined New DCs & WHs 1.408 1 0 1 1 1
Total Implied New DCs & WHs 1 0 1 1 1Cumulative Combined Total Implied DCs & WHs 31 32 33 34 35 36

158
TIP REIT Model – Capex Schedule
Calendar Year, CAGR($mm, except as noted) 2009 2010 2011 2012 2013 '09 - '13Total Combined Expenditures 3,905 3,858 4,982 5,732 6,605
Maintenance / Retail Capital Expenditures 1,714 1,827 1,785 1,968 2,179 6.2%Target Corp - Store Buildings 1,714 1,827 1,785 1,968 2,179 TIP REIT - - - - -
Development Capital Expenditures 2,191 2,031 3,198 3,765 4,426 19.2%Target Corp Building - Store and DCs & WHs 71.4% 1,112 1,023 1,615 1,902 2,237 TIP REIT Land - Store and DCs & WHs 28.6% 1,079 1,008 1,582 1,863 2,190 Target Corp - Other 0.0% - - - - -
TIP REIT Land - Store 1,056 999 1,560 1,836 2,158 Store Land Cost per Square Foot $102.50 $105.06 $107.69 $110.38 $113.14
TIP REIT Land - DCs & WHs 22 10 22 26 31 DCs & WHs Land Cost per Square Foot $14.00 $14.35 $14.71 $15.08 $15.45 $15.84
TIP REIT Land - Store Yes 1,056 999 1,560 1,836 2,158 TIP REIT Land - DCs & WHs Yes 22 10 22 26 31
Total Development Capex 1,079 1,008 1,582 1,863 2,190 19.4%
Development Financing Sources:Debt Financing 100% 1,079 1,008 1,582 1,863 2,190 Equity Financing 0% - - - - -

Model – Target Corp

160
Target Corp Model – Income StatementStatus
Quo REIT Credit Card Pro Forma Calendar Year, CAGR($mm) CY2008 Adj. Adj. CY2008 2009 2010 2011 2012 2013 '09 - '13Retail Sales 64,892 64,892 68,249 73,356 80,479 88,710 98,241 9.5%
Base Sales Growth (%) 5.2% 7.5% 9.7% 10.2% 10.7%Credit Revenue 2,078 (1,936) 143 150 161 177 195 216 9.5%
Credit Sales Growth na 5.2% 7.5% 9.7% 10.2% 10.7%Total Revenue 66,970 65,034 68,399 73,517 80,655 88,905 98,457 9.5%
Total Revenue Growth 5.2% 7.5% 9.7% 10.2% 10.7%
COGS 45,459 45,459 47,777 51,279 56,177 61,919 68,563% of Retail Sales 70.1% 70.1% 70.0% 69.9% 69.8% 69.8% 69.8%
SG&A (excluding D&A and Rent Expense) 13,058 (20) 13,038 13,814 14,740 16,093 17,739 19,646% of Retail Sales 20.1% 20.1% 20.2% 20.1% 20.0% 20.0% 20.0%
Credit Expenses 1,460 (1,460) - - - - - - % of Credit Revenue 70.2% 0.0% 0.0% 0.0% 0.0% 0.0% 0.0%
Retail EBITDAR 6,375 6,395 6,657 7,337 8,208 9,051 10,033 10.8%Retail EBITDAR Margin (%) 9.8% 9.9% 9.8% 10.0% 10.2% 10.2% 10.2%
Credit EBITDAR 619 (476) 143 150 161 177 195 216 9.5%Credit EBITDAR Margin (%) 29.8% na na na na na na
EBITDAR (Pre-spin) 6,993 6,537 6,807 7,498 8,385 9,246 10,249 10.8%EBITDAR Margin (%) 10.4% 10.1% 10.0% 10.2% 10.4% 10.4% 10.4%
Current Embedded Facility Management Costs (125) (125) (125) (134) (147) (162) (180)External Facility Mgmt. Payments to TIP REIT 144 144 144 155 170 187 207
Current Rent Expense 169 169 173 178 182 187 191Additional Rent Expense 1,369 1,444 1,549 1,696 1,866 2,063Pro Forma EBITDA (Post-spin) 6,824 4,980 5,172 5,751 6,485 7,169 7,968 11.4%
EBITDA Margin (%) 10.2% 7.7% 7.6% 7.8% 8.0% 8.1% 8.1%
Depreciation & Amortization 1,807 (42) 1,765 1,884 2,017 2,199 2,410 2,654% of Retail Sales 2.7% 2.7% 2.7% 2.7% 2.7% 2.7%
Operating Income 5,017 3,215 3,288 3,735 4,285 4,759 5,314 12.8%
Net Interest (Income) / Expense 995 515 673 611 531 509 623Income Tax Provision 1,483 1,037 1,004 1,199 1,441 1,632 1,802
Tax Rate (%) 37% 38% 38% 38% 38% 38% 38%Net Income 2,539 1,663 1,611 1,924 2,312 2,618 2,890 15.7%
Net Income Margin (%) 3.8% 2.6% 2.4% 2.6% 2.9% 2.9% 2.9%
Current Diluted Shares Outstanding 819.0 721.9 721.9 721.9 721.9 693.0Shares Repurchase (97.0) 0.0 0.0 0.0 (29.0) (31.4)
Total Shares Outstanding 721.9 721.9 721.9 721.9 693.0 661.6Weighted Average Shares Outstanding 765.9 721.9 721.9 721.9 707.5 677.3
Earnings per Share ($) $2.17 $2.23 $2.67 $3.20 $3.70 $4.27 4.92 17.6%

161
Target Corp Model – Balance Sheet
Status
Quo REIT Credit Card Pro Forma Calendar Year,
($mm) CY2008 Adj. Adj. CY2008 2009 2010 2011 2012 2013
Cash & Equivalents 500 0 500 682 734 805 887 982
Trade Receivables 8,383 (8,383) - - - - - -
Other Current Assets 9,232 9,232 9,710 10,436 11,450 12,621 13,977
Property, Plant & Equipment, gross 35,734 (12,228) 23,506 26,332 29,182 32,582 36,452 40,868
Accumulated Depreciation (9,350) 846 (8,505) (10,389) (12,406) (14,605) (17,015) (19,669)
Property, Plant & Equipment, net 26,384 (11,382) 15,001 15,943 16,776 17,977 19,437 21,199
Other Non-Current Assets 1,368 1,368 1,368 1,368 1,368 1,368 1,368
Total Assets 45,867 26,101 27,703 29,314 31,599 34,312 37,526
Debt 19,455 0 (8,000) 11,455 10,817 9,584 8,303 8,938 10,078
Other Current Liabilities 10,757 10,757 11,313 12,160 13,340 14,705 16,285
Other Non-Current Liabilities 2,392 2,392 2,392 2,392 2,392 2,392 2,392
Total Liabilities 32,604 24,604 24,522 24,135 24,035 26,035 28,755
Total Equity 13,264 (11,382) (383) 1,498 3,182 5,179 7,564 8,278 8,771
Total Equity & Liabilities 45,867 26,101 27,703 29,314 31,599 34,312 37,526

162
Target Corp Model – Cash Flow Statement
Calendar Year,($mm) 2009 2010 2011 2012 2013EBITDA 4,980 5,172 5,751 6,485 7,169 7,968
less: Interest Expense (515) (673) (611) (531) (509) (623)
less: Taxes (1,037) (1,004) (1,199) (1,441) (1,632) (1,802)
Share-based Compensation 73 73 73 73 73 73
less: Increase in Net Working Capital 79 120 167 193 224
less: Increase Funding of CC Growth 0 0 0 0 0 0
Cash Flow from Operating Activities 3,501 3,647 4,134 4,752 5,294 5,841
Capital Expenditures (2,826) (2,850) (3,400) (3,870) (4,416)
Cash Flow from Investing Activities (2,826) (2,850) (3,400) (3,870) (4,416)
Issuance of Debt 0 0 0 1,977 2,470
Repayment of Debt (638) (1,233) (1,281) (1,342) (1,330)
Issuance of Equity / (Buy Back) 0 0 0 (1,977) (2,470)
Issuance of Dividends to Common 0 0 0 0 0 0
Cash Flow from Financing Activities (638) (1,233) (1,281) (1,342) (1,330)
Beginning Cash Balance 500 682 734 805 887
Change in Cash 182 51 71 82 95
Ending Cash Balance 682 734 805 887 982
Average Cash Balance 591 708 769 846 935
Interest Income 3.0% 18 21 23 25 28

163
Target Corp Model – Build-ups and Credit MetricsPro Forma Calendar Year,
Sales Buildup CY2008 2009 2010 2011 2012 2013Square Feet (mm) 222 232 241 256 273 292$ / Sq. Ft. 293 294 304 314 325 337Retail Sales 64,892 68,249 73,356 80,479 88,710 98,241
Implied Retail Sales Growth (%) 5.2% 7.5% 9.7% 10.2% 10.7%Sq. Footage Growth (%) 4.7% 4.1% 6.0% 6.5% 7.0%SSS Growth (%) 0.5% 3.3% 3.5% 3.5% 3.5%
CapEx Buildup 2008 2009 2010 2011 2012 2013Total System CapEx 4,112 3,905 3,858 4,982 5,732 6,605
CapEx as % of Retail Sales 6.3% 5.7% 5.3% 6.2% 6.5% 6.7%
Maintenance/Retail CapEx 1,514 1,627 1,785 1,968 2,179Additional Cap Ex 200 200TOTAL Maintenance/Retail CapEx % of total 35.0% 1,439 1,714 1,827 1,785 1,968 2,179 – Target Corp 1,714 1,827 1,785 1,968 2,179 – TIP REIT (Existing DC & WH) 0 0 0 0 0
Development CapEx % of total 65.0% 2,191 2,031 3,198 3,765 4,426
Buildings (Tgt Corp) % of Development 50% 1,112 1,023 1,615 1,902 2,237 Land % of Development 50% 1,079 1,008 1,582 1,863 2,190 – Target Corp 0 0 0 0 0 – TIP REIT 1,079 1,008 1,582 1,863 2,190 Other (Target Corp) % of Development 0% 0 0 0 0 0
Facilities Management Business ($mm)Total Current Costs 125 125 134 147 162 180Growth % 0.0% 7.5% 9.7% 10.2% 10.7%
Markup to TIP REIT 15% 15% 15% 15% 15% 15%Facilities Management Revenue to TIP REIT 144 144 155 170 187 207
Credit MetricsLease Adjusted Debt 8 x 1,353 12,309 12,935 13,811 15,024 16,421 18,033Actual Debt 19,455 11,455 10,817 9,584 8,303 8,938 10,078Total Lease Adjusted Debt 20,808 23,764 23,752 23,394 23,327 25,359 28,111
Total Lease Adjusted Debt/EBITDAR 3.0 x 3.6 x 3.5 x 3.1 x 2.8 x 2.8 x 2.8 xTotal Debt / EBITDA 2.9 x 2.3 x 2.1 x 1.7 x 1.3 x 1.2 x 1.3 x
EBITDAR / (Interest + Rent) 6.0 x 3.2 x 3.0 x 3.2 x 3.5 x 3.6 x 3.6 xEBITDA / Interest 6.9 x 9.7 x 7.7 x 9.4 x 12.2 x 14.1 x 12.8 x