Athabasca COMP 410 Chap 9 summary
11
Chap 9 2 types of planning: 1 during entire process and 1 right after spec WF End of analysis WF is the earliest point at which accurate cost/time estimation can be made Sometimes you need to come up w this info for a bid (literally only 1-2 hour meeting to prep) Two types of cost: o Internal: cost to the developers to make (salaries, support, hardware, software + overhead costs such as utilities and upper management) o External: cost the client will pay (usually internal cost + profit, but this can change depending on if they’re desperate for work, if it’s a bid, etc) Time duration hard bc human factor, 28 to 1 diff. Also can’t guarantee absence of resignations. Product metrics Size: LOC and thousand delivered source instructions (KDSI). FP also used o LOC probs: Code lines are small part of product. Requs, analysis, design , implementation and testing cant rly be measured by LOC LOC changes depending on programming language
-
Upload
emilie-corcoran -
Category
Documents
-
view
18 -
download
0
description
Summary of chapter 9 notes for Athabasca COMP 410 online course.
Transcript of Athabasca COMP 410 Chap 9 summary

Chap 9
2 types of planning: 1 during entire process and 1 right after spec WF End of analysis WF is the earliest point at which accurate cost/time estimation can be made Sometimes you need to come up w this info for a bid (literally only 1-2 hour meeting to prep)
Two types of cost:
o Internal: cost to the developers to make (salaries, support, hardware, software + overhead costs such as utilities and upper management)
o External: cost the client will pay (usually internal cost + profit, but this can change depending on if they’re desperate for work, if it’s a bid, etc)
Time duration hard bc human factor, 28 to 1 diff. Also can’t guarantee absence of resignations.
Product metrics
Size: LOC and thousand delivered source instructions (KDSI). FP also usedo LOC probs:
Code lines are small part of product. Requs, analysis, design , implementation and testing cant rly be measured by LOC
LOC changes depending on programming language How to count lines? Do comments and deffs count? Count reused stuff? Higher
lines of code != better product. Not all of it is delivered… some of it are tools Cant be counted until after the product is created: so can’t use as an estimation
metric. Also unreliable cost estimate. o Cost estimations: FFP metric is for med-scale (files, flows, processes).
Size, S=Fi+Fl+Pr Cost, C=dxS
Productivity/efficiency, d, is a constant that varies. Determined by least-squares to fit to previous data in the organization.
Can be determined before project is coded Function points (METRIC FOR SIZE), FP=(4xinput)+(5xoutput)+(4xinquiries)
+(10xmaster files)+(7xinterfaces)
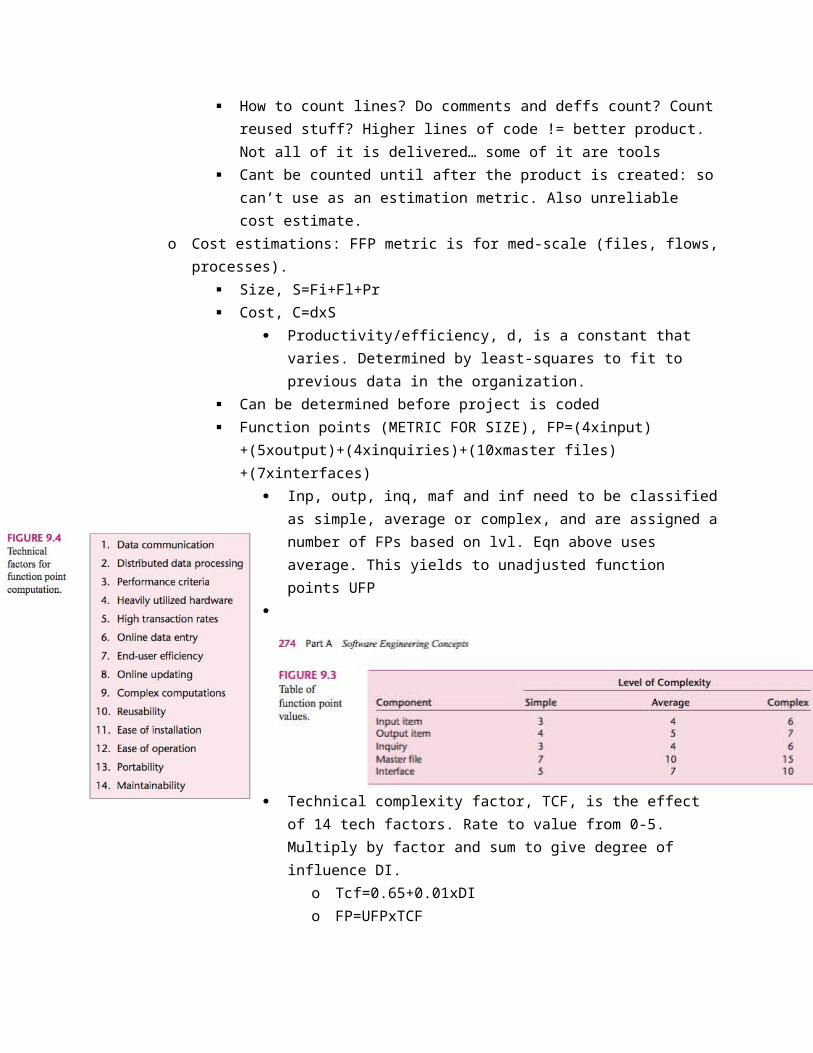
Inp, outp, inq, maf and inf need to be classified as simple, average or complex, and are assigned a number of FPs based on lvl. Eqn above uses average. This yields to unadjusted function points UFP
Technical complexity factor, TCF, is the effect of 14 tech factors. Rate to value from 0-5. Multiply by factor and sum to give degree of influence DI.
o Tcf=0.65+0.01xDIo FP=UFPxTCF
Better bc only had around 200% errors instead of 800% for KDSI. o BOTH DON’T MEASURE COST OF MAINTENANCE.
Techniques for cost estimation
Includes personnel skill lvl and familiarity w area, complexity, size, hardware, availability of CASE tools. Deadline effect: time constraints increase person-month effect. Shorter the deadline = the greater the cost.
o Expert judgment by analogy: number of experts consulted. They compare w their previous similar products. Note similarities/diffs, an example below:
-15% time/effort bc they assume organization is familiar with the type of product to be developed.
+ time and effort by 25% bc sftwr is more complex. +time by 15% and +effort by 20% because language they will be using is new to
the team. Gives a total of +25% time and +30% effort for this project. If prev project took
12 months and 100 person-months, target project will take 15 months and 130 person-months.
Two other experts do the same. Reconcile results via dephi technique: distribute results to all experts and let them make second estimate. No meetings.
Issue is how do you get these percentages? They are all guesses. Experts can be biased.
o Bottom-up approach Break into smaller components. Estimate for cost separately. This makes it quicker

More detailed Weakness: product is much more than a sum of its components
o Algorithmic cost estimation models Use FP or FFP metric as input to determine product cost. Superior to expert opinion bc not biased. However estimates are only as good as
underlying assumptions. o COCOMO: series of 3 models. 2 stages: rough estimation of dev
effort. Based on lenfth of prod in KDSI and dev mode (lvl of difficulty: organic, semidetached, embedded stand for easy, medium and complex). Compute nominal effort
o Nominal effort = 3.2X(KDSI)^b person-months (for organic mode)
o b= 1.05 (organic), b=1.12 (semidetached), b=1.20 (embedded)
o Multiply nominal effort by 15 sftwr dev effort multipliers:o
o Around 68% of the time, values are accurate within 20%. o Most important input = LOC. Issue bc if we incorrectly estimate
this, all other estimations will be incorrect. o COCOMO II incorporates client-server/obj-oriented aspects.
More complex Consists of 3 models: application composition model
(based on object points, and when we have minimal info on project), early design model (FP), post-architecture model (when you have max info, using KDSI). Output of all 3 = range of the estimates.
If effort estimate is E, then ranges are: App composition model range = (0.5*E,2E)

Post-arch range = (0.8*E,1.25E) lass Effort = a x (size)^b. a,b are constants. Instead of
sticking to the 3 values from COCOMO I, it ranges between 1.01-1.26.
There are now 17 multipliers instead of 15.
Tracking duration/cost estimates
Deviating from initial plan marks possible issues: either size was underestimated, or team was overestimated. Deviations could be caused by poor predicting metrics.
Need to track throughout to take action in order to minimize effects.
Components of sftwr project management plan
Work to be done Resources to do it Money to pay for it Rayleigh distribution gives Rc, Resrouce Consumption:
o where k is constant of time at which consumption peaks
o o Project function: work that continues through project and doesn’t relate to specific QF
of software dev. Ie. Project management and quality control. o Activity: major unit of work with beginning and end dates. Is compromised by a set of
tasks (the smallest unit).o Milestone: date on which work is due
Needs to be reviewed by team members/client/management and is considered completed once passed.
Becomes baseline and needs to be formerly changed if neededo Work package: work product + staff requ + duration+resources+etc
Sfwr project management plan framework- according to IEEE
Planned by many individuals

To be used for all types of software, supports proj improvement Framework:


Planning testing
Need to include resources for testing, and must plan for what kind of testing is to be done Keep a detailed list of faults Black box testing: at end of analysis WF
Planning o-o projects
Easier because classes are independent. Better cost/duration estimates easier and more accurate COCOMO II is an example Reuse fucks everything up: making reusable parts can take up to 3X longer, but reduces time
when actually reused.

Training requirements
Most ppl think you have to train ppl after the product is dev’d: wrong. In-house training is easiest and least distruptive
Docu stds
Standards needed for doc
CASE TOOLS: excel, word, scheduling tool, etc
Quiz 1