
ATCA monitoring of Sgr A* at 3 millimeter Juan Li Shanghai Astronomical Observatory 2009/10/22...
13
ATCA monitoring of Sgr A* at 3 millimeter Juan Li Shanghai Astronomical Observatory 2009/10/22 Collaborators: Z.Q. Shen (Shao.), A. Miyazaki (NAOJ), L. Huang (USTC), R. J. Sault (Univ. Melbourne), M. Miyoshi (NAOJ), M. Tsuboi & T. Tsutsumi (NAOJ)
-
Upload
georgia-chambers -
Category
Documents
-
view
217 -
download
0
Transcript of ATCA monitoring of Sgr A* at 3 millimeter Juan Li Shanghai Astronomical Observatory 2009/10/22...

ATCA monitoring of Sgr A* at 3 millimeter
Juan Li
Shanghai Astronomical Observatory
2009/10/22
Collaborators: Z.Q. Shen (Shao.), A. Miyazaki (NAOJ), L. Huang (USTC), R. J. Sault (Univ. Melbourne), M. Miyoshi (NAOJ),
M. Tsuboi & T. Tsutsumi (NAOJ)
Outline
• Introduction: IDV of of Sgr A* at mm wavelengths
• Observations: monitoring of Sgr A* with the ATCA
• Results: Two IDV (IntraDay Variability) events detected
• Discussion: two possible scenarios– Expanding plasmon model
– Orbiting hot spot model
• Summary
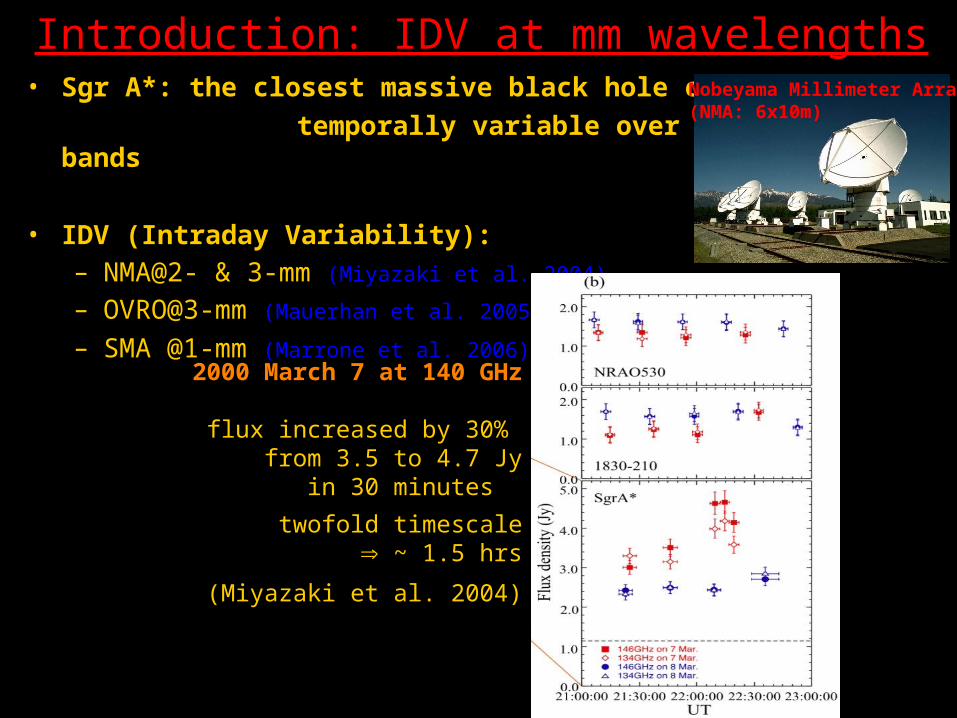
Introduction: IDV at mm wavelengths• Sgr A*: the closest massive black hole candidate
temporally variable over all the EM bands
• IDV (Intraday Variability):– NMA@2- & 3-mm (Miyazaki et al. 2004)
– OVRO@3-mm (Mauerhan et al. 2005)
– SMA @1-mm (Marrone et al. 2006) …
2000 March 7 at 140 GHz
flux increased by 30% from 3.5 to 4.7 Jy
in 30 minutes
twofold timescale ~ 1.5 hrs
(Miyazaki et al. 2004)
Nobeyama Millimeter Array(NMA: 6x10m)
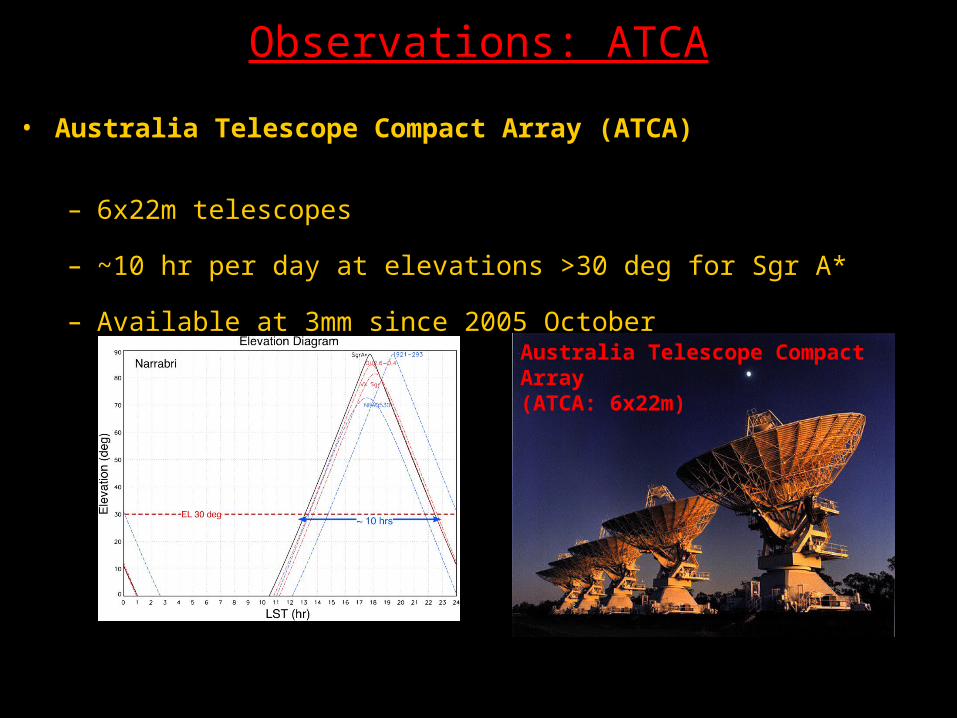
Observations: ATCA
• Australia Telescope Compact Array (ATCA)
– 6x22m telescopes
– ~10 hr per day at elevations >30 deg for Sgr A*
– Available at 3mm since 2005 October
Australia Telescope Compact Array (ATCA: 6x22m)
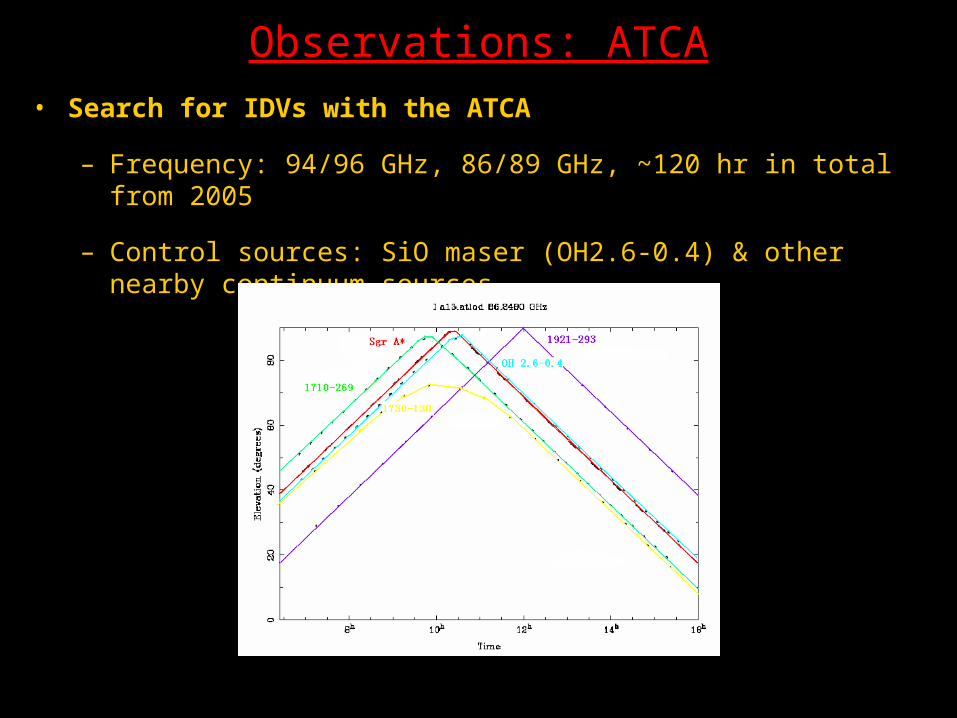
Observations: ATCA• Search for IDVs with the ATCA
– Frequency: 94/96 GHz, 86/89 GHz, ~120 hr in total from 2005
– Control sources: SiO maser (OH2.6-0.4) & other nearby continuum sources
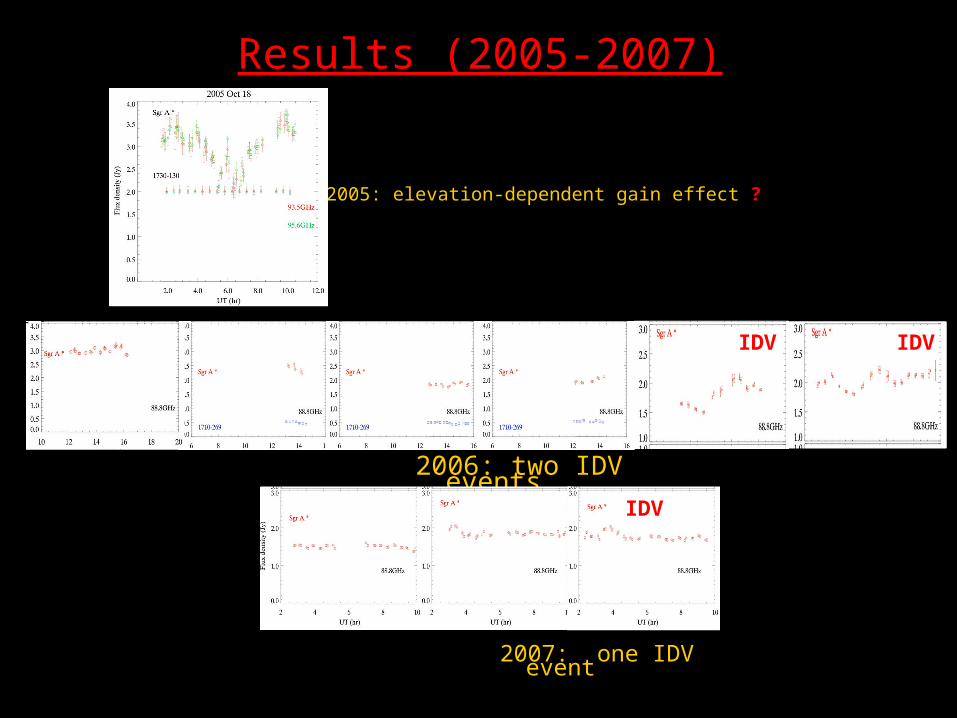
Results (2005-2007)
2005: elevation-dependent gain effect ?
2006: two IDV events
2007: one IDV event
IDVIDV
IDV
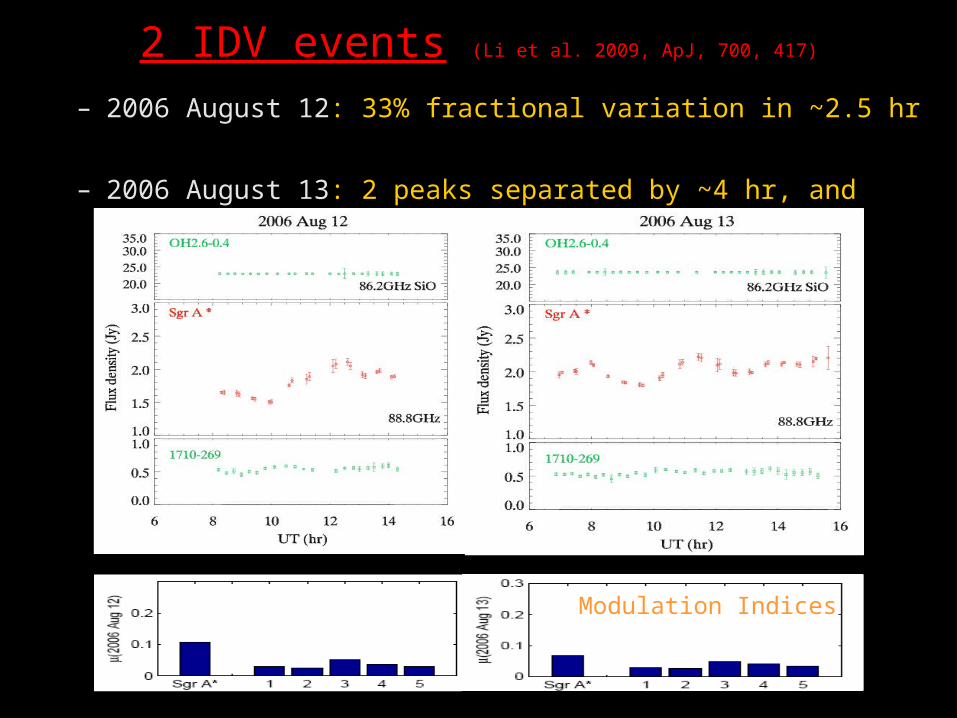
2 IDV events (Li et al. 2009, ApJ, 700, 417)
– 2006 August 12: 33% fractional variation in ~2.5 hr
– 2006 August 13: 2 peaks separated by ~4 hr, and maximum variation of 22% within ~2 hr
Modulation Indices
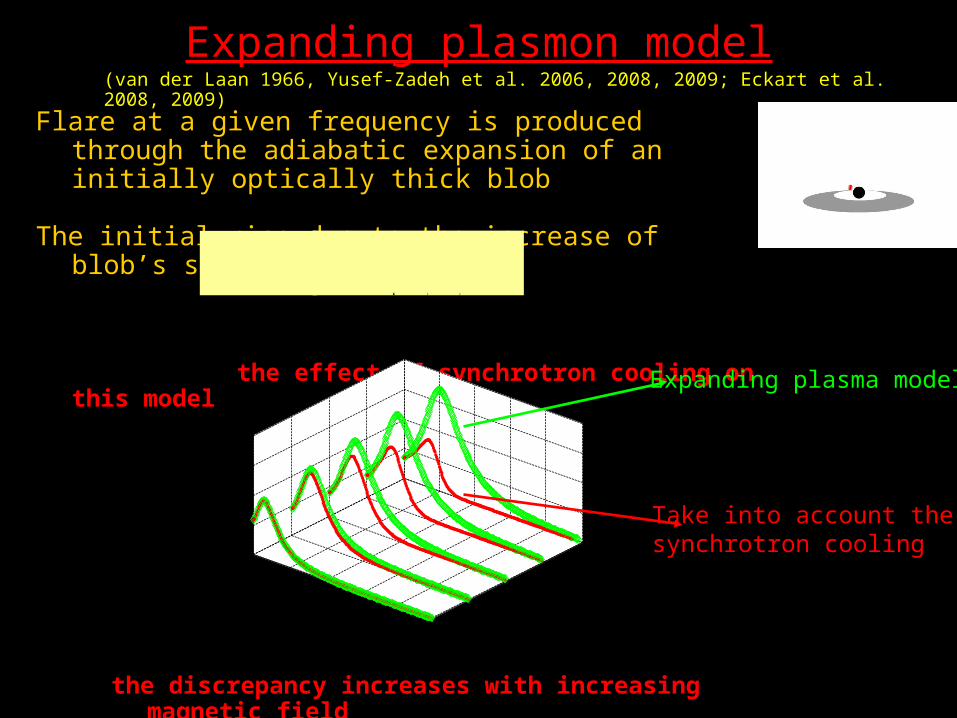
Expanding plasmon model
Flare at a given frequency is produced through the adiabatic expansion of an initially optically thick blob
The initial rise due to the increase of blob’s surface area
the effect of synchrotron cooling on this model
(van der Laan 1966, Yusef-Zadeh et al. 2006, 2008, 2009; Eckart et al. 2008, 2009)
the discrepancy increases with increasing magnetic field
Take into account the synchrotron cooling
Expanding plasma model
12
34
56 10
20
30
40
500
0.5
1
1.5
2
B (Gauss)R/R
0
S (
Jy)
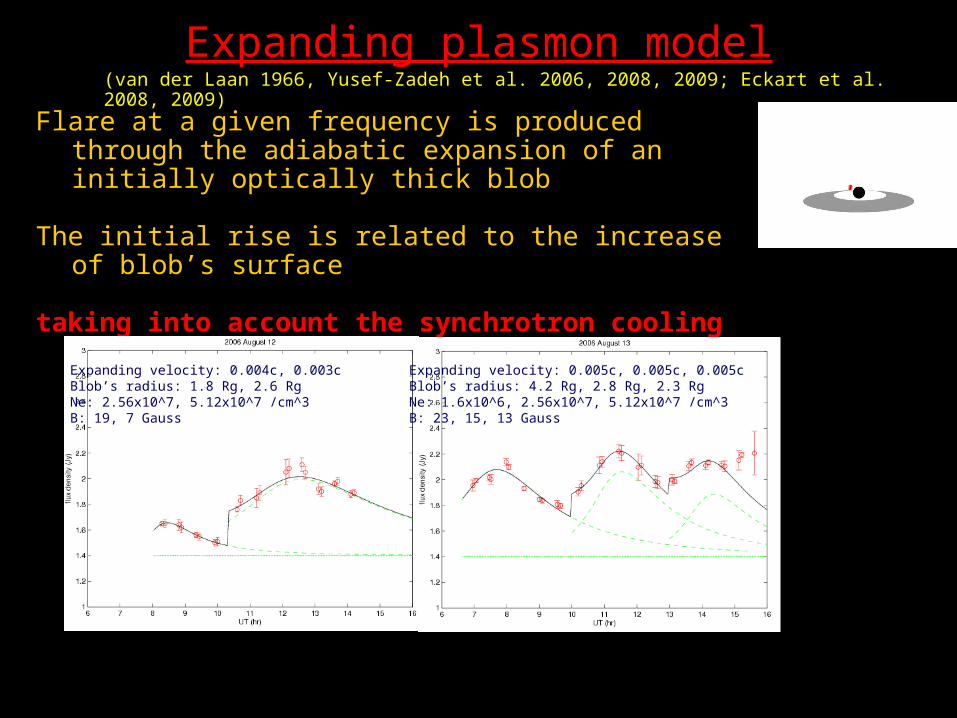
Expanding plasmon model
Flare at a given frequency is produced through the adiabatic expansion of an initially optically thick blob
The initial rise is related to the increase of blob’s surface
taking into account the synchrotron cooling
particle energy spectral index =2.2; quiescent flux density=1.4 Jy
Expanding velocity: 0.004c, 0.003cBlob’s radius: 1.8 Rg, 2.6 RgNe: 2.56x10^7, 5.12x10^7 /cm^3B: 19, 7 Gauss
Expanding velocity: 0.005c, 0.005c, 0.005cBlob’s radius: 4.2 Rg, 2.8 Rg, 2.3 Rg Ne: 1.6x10^6, 2.56x10^7, 5.12x10^7 /cm^3B: 23, 15, 13 Gauss
(van der Laan 1966, Yusef-Zadeh et al. 2006, 2008, 2009; Eckart et al. 2008, 2009)
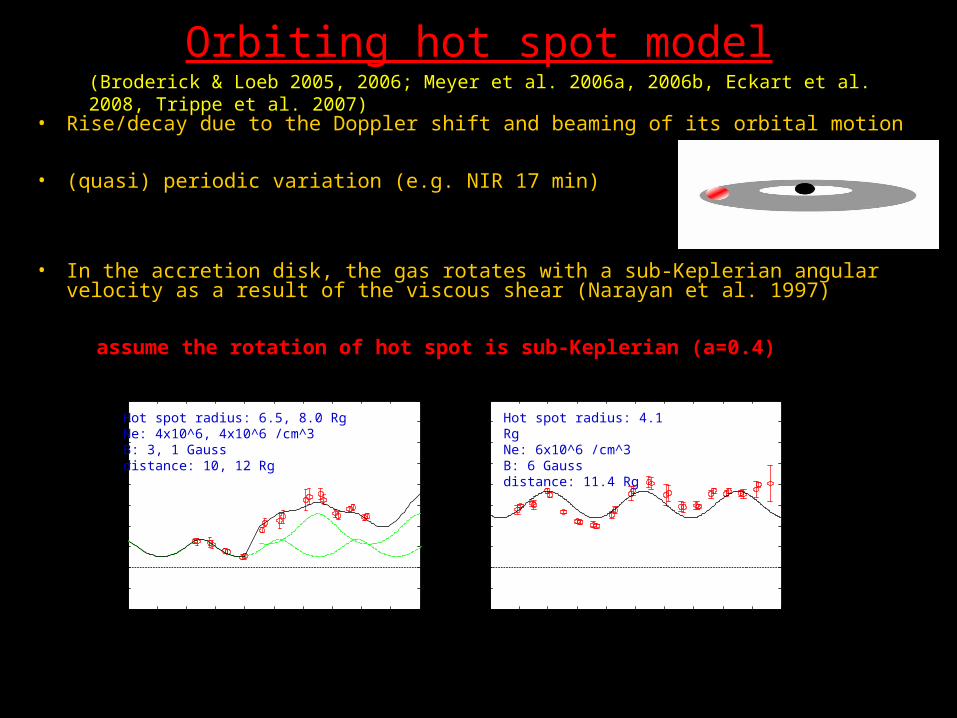
Orbiting hot spot model
• Rise/decay due to the Doppler shift and beaming of its orbital motion
• (quasi) periodic variation (e.g. NIR 17 min)
• In the accretion disk, the gas rotates with a sub-Keplerian angular velocity as a result of the viscous shear (Narayan et al. 1997)
assume the rotation of hot spot is sub-Keplerian (a=0.4)
(Broderick & Loeb 2005, 2006; Meyer et al. 2006a, 2006b, Eckart et al. 2008, Trippe et al. 2007)
6 7 8 9 10 11 12 13 14 15 161
1.2
1.4
1.6
1.8
2
2.2
2.4
2.6
2.8
32006 August 13
UT (hr)
flux d
ensity (
Jy)
Hot spot radius: 4.1 Rg Ne: 6x10^6 /cm^3B: 6 Gaussdistance: 11.4 Rg
6 7 8 9 10 11 12 13 14 15 161
1.2
1.4
1.6
1.8
2
2.2
2.4
2.6
2.8
32006 August 12
UT (hr)
flux d
ensity (
Jy)
Hot spot radius: 6.5, 8.0 Rg Ne: 4x10^6, 4x10^6 /cm^3B: 3, 1 Gaussdistance: 10, 12 Rg

Which model is better?
• Both models seem to be able to fit the IDV data
• The fitting parameters are consistent with other work
• Hot spot model is successful in explaining the quasi-periodical variation with a symmetric profile
• Expanding model can explain the time lag (~20 min) between the flare peaks observed at 13 and 7 mm
require multi-frequency monitoring
Yusef-Zadeh et al. 2006

Simultaneous Observations(preliminary results)
2008 Oct 3: quasi-simultaneous observation of Sgr A* at 3- and 7-mm
DCF: 3-mm leading 7-mm emission by 1 +/- 0.5 hr (consistent with Yusef-Zadeh et al. 2009: ~1hr)
can be fitted simultaneously with expanding plasmon model
Require more observations!
Expanding velocity: 0.011c, 0.008cBlob’s radius: 6 Rg, 2 Rg Ne: 4x10^5, 1.024x10^7 /cm^3B: 46, 15 Gauss
-6 -4 -2 0 2 4 6-2.5
-2
-1.5
-1
-0.5
0
0.5
1
1.5
2
Lag (hrs), from 3- to 7-mm
Cros
s-corr
elatio
n
2008 Oct 3

Summary
• We have performed monitoring observations of of Sgr A* at 3-mm with the ATCA since 2005
• Sgr A* is quite active, clearly showing IDVs
• Both the expanding plasmon model and the orbiting hot spot model can reasonably fit the IDV light curves
• Future simultaneous multi-frequency monitoring is needed to discriminate between two flare emission models


