at the IEA · TJ and m3 Supply Balance Trade Origin/ ... can be withdrawn ... Storage capacity 2013...
26
© OECD/IEA 2014 Natural gas statistics at the IEA
-
Upload
vuongnguyet -
Category
Documents
-
view
216 -
download
0
Transcript of at the IEA · TJ and m3 Supply Balance Trade Origin/ ... can be withdrawn ... Storage capacity 2013...
© OECD/IEA 2014
Natural gas statistics at the IEA
© OECD/IEA 2014
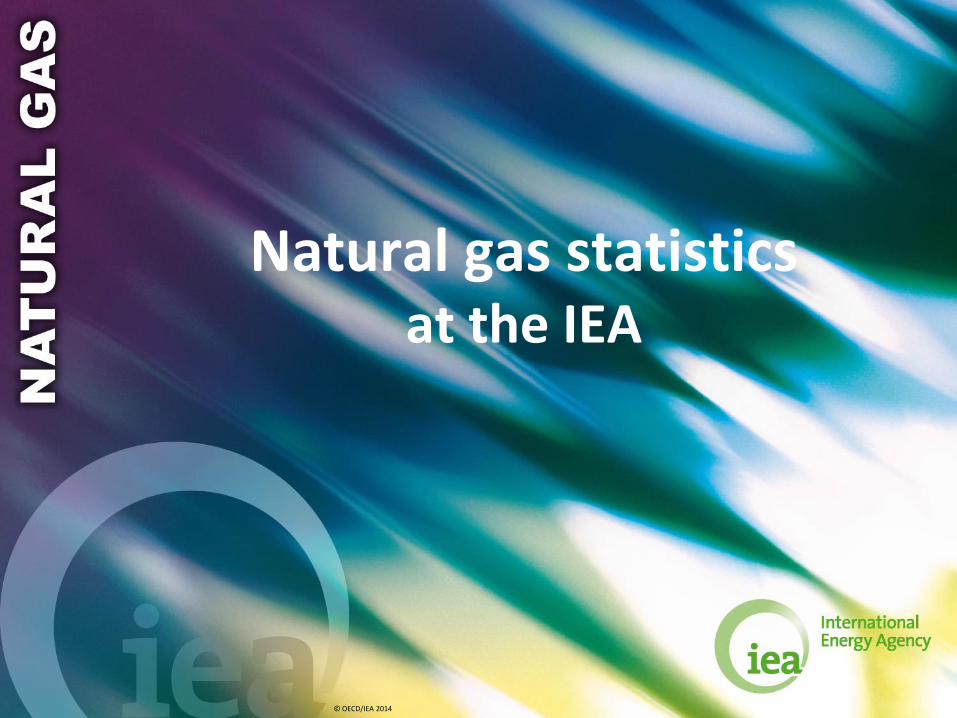
JODI Gas
Annual Gas Statistics
Monthly Gas Statistics Trade
Entry/Exit
Data in 2 units:
TJ and m3
Supply
Balance
Trade
Origin/
Destination
Supply
Balance
Data in 2 units
TJ and m3
Transformation
Energy
Final Consumption
The IEA Natural Gas Data System Timeliness
Year-1
Month-2
Detail
Monthly Gas
Annual Gas
Month-1
Trade
Entry/Exit Data in 2 units:
TJ and m3
Supply
Balance
JODI Gas
Month-1 Gas Trade flows map

© OECD/IEA 2014
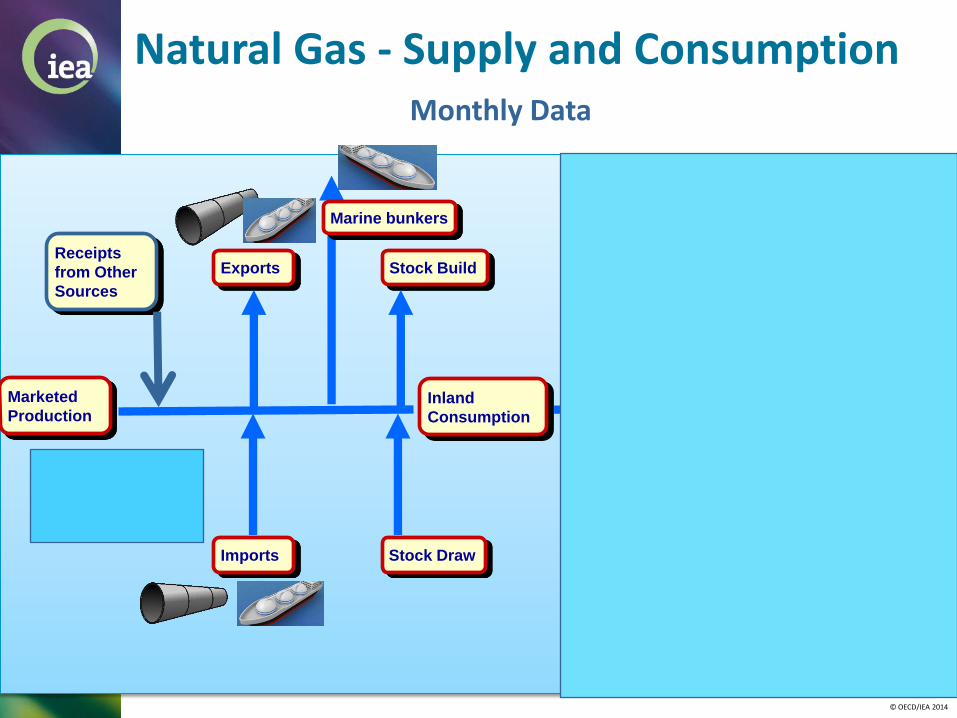
Natural Gas - Supply and Consumption
Marketed
Production
Imports
Exports Stock Build
Inland
Consumption
Transport
Transformation
Industry Residential
Commercial
Agriculture
Stock Draw
Distribution
Losses
Energy
Associated
Non-associated
Colliery
Receipts
from Other
Sources
Marine bunkers
© OECD/IEA 2014
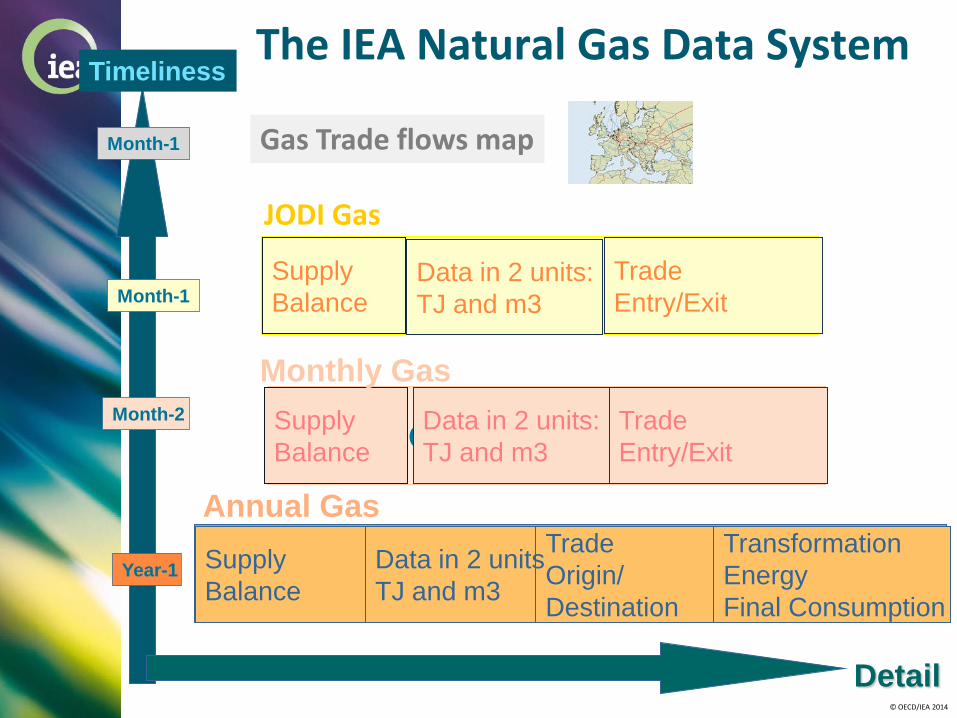
Imports and Exports
Country of ultimate origin and destination
Transit trade not included
More than 80 import origins and export destinations
Pipeline and LNG trade
© OECD/IEA 2014
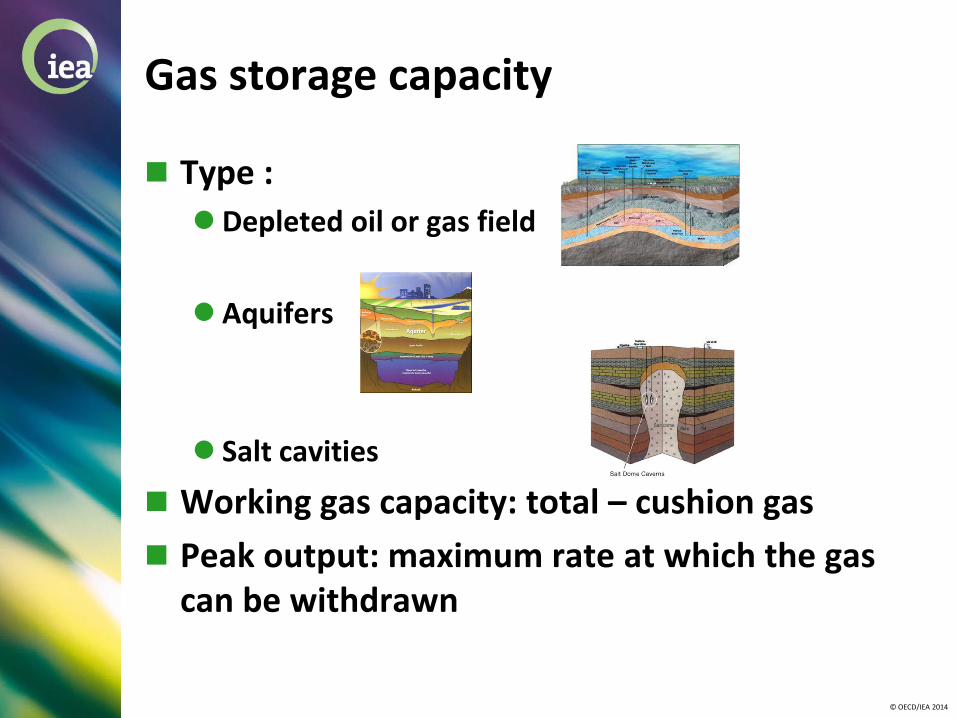
Gas storage capacity
Type :
Depleted oil or gas field
Aquifers
Salt cavities
Working gas capacity: total – cushion gas
Peak output: maximum rate at which the gas can be withdrawn
© OECD/IEA 2014
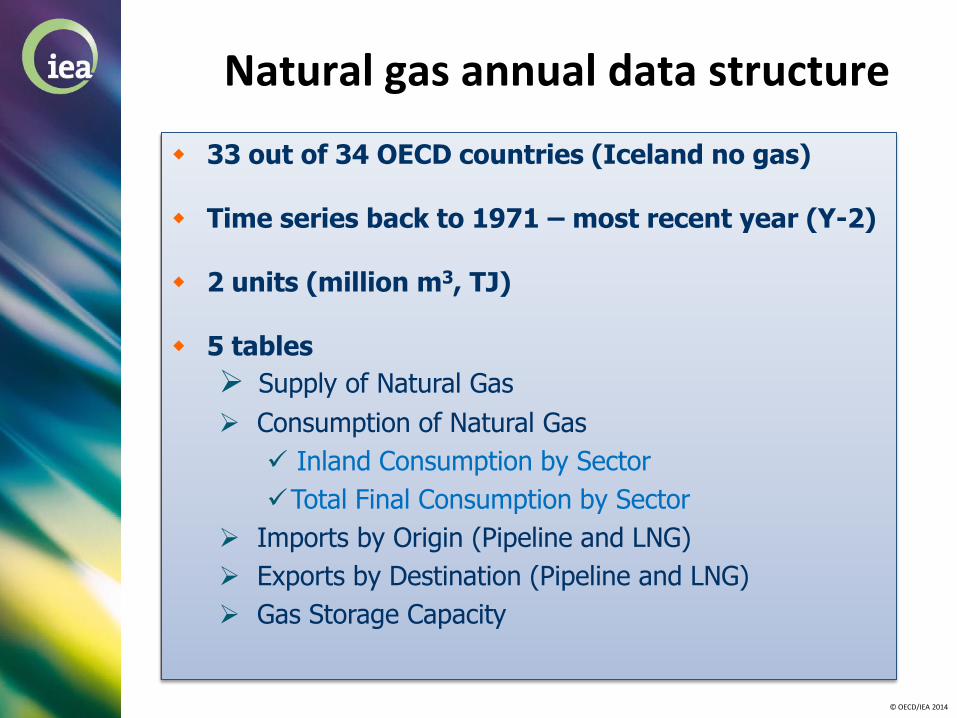
33 out of 34 OECD countries (Iceland no gas)
Time series back to 1971 – most recent year (Y-2)
2 units (million m3, TJ)
5 tables
Supply of Natural Gas
Consumption of Natural Gas
Inland Consumption by Sector
Total Final Consumption by Sector
Imports by Origin (Pipeline and LNG)
Exports by Destination (Pipeline and LNG)
Gas Storage Capacity
Natural gas annual data structure
© OECD/IEA 2014
The monthly gas data > MOS > JODI gas > Gas trade flows
© OECD/IEA 2014
Natural Gas - Supply and Consumption
Marketed
Production
Imports
Exports Stock Build
Inland
Consumption
Transport
Transformation
Industry Residential
Commercial
Agriculture
Stock Draw
Distribution
Losses
Energy
Associated
Non-associated
Colliery
Receipts
from Other
Sources
Marine bunkers
Monthly Data
© OECD/IEA 2014
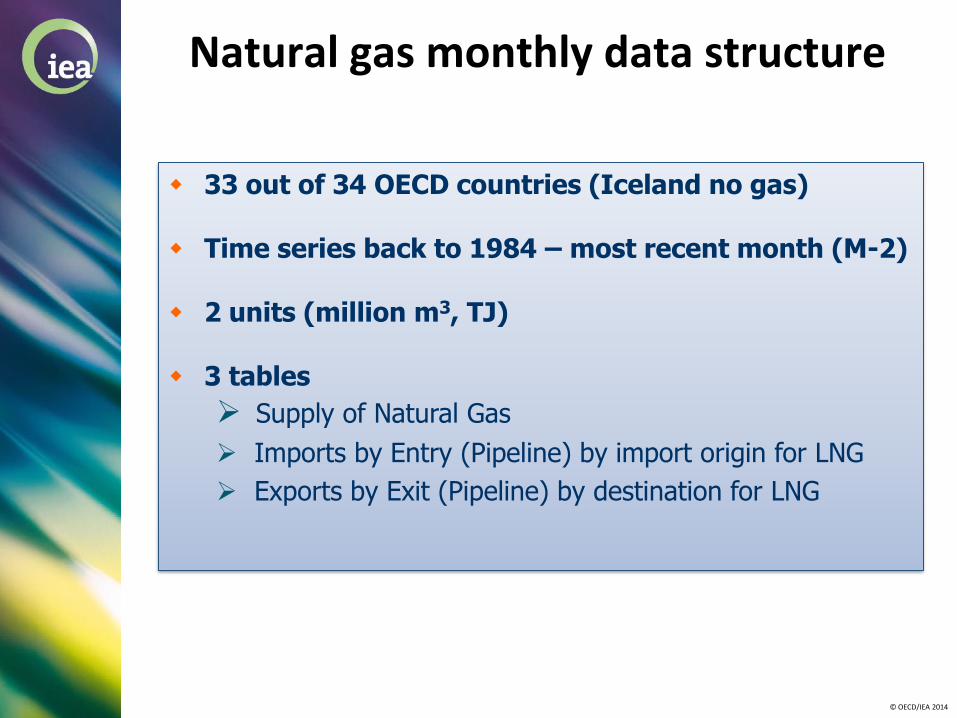
33 out of 34 OECD countries (Iceland no gas)
Time series back to 1984 – most recent month (M-2)
2 units (million m3, TJ)
3 tables
Supply of Natural Gas
Imports by Entry (Pipeline) by import origin for LNG
Exports by Exit (Pipeline) by destination for LNG
Natural gas monthly data structure
© OECD/IEA 2014
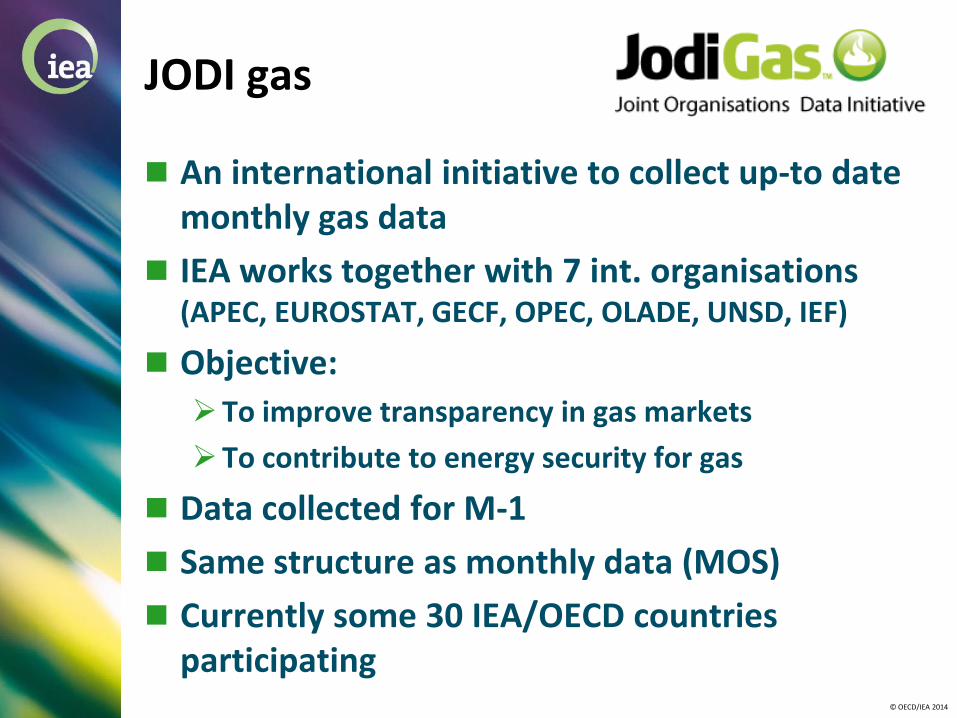
JODI gas
An international initiative to collect up-to date monthly gas data
IEA works together with 7 int. organisations (APEC, EUROSTAT, GECF, OPEC, OLADE, UNSD, IEF)
Objective:
To improve transparency in gas markets
To contribute to energy security for gas
Data collected for M-1
Same structure as monthly data (MOS)
Currently some 30 IEA/OECD countries participating
© OECD/IEA 2014
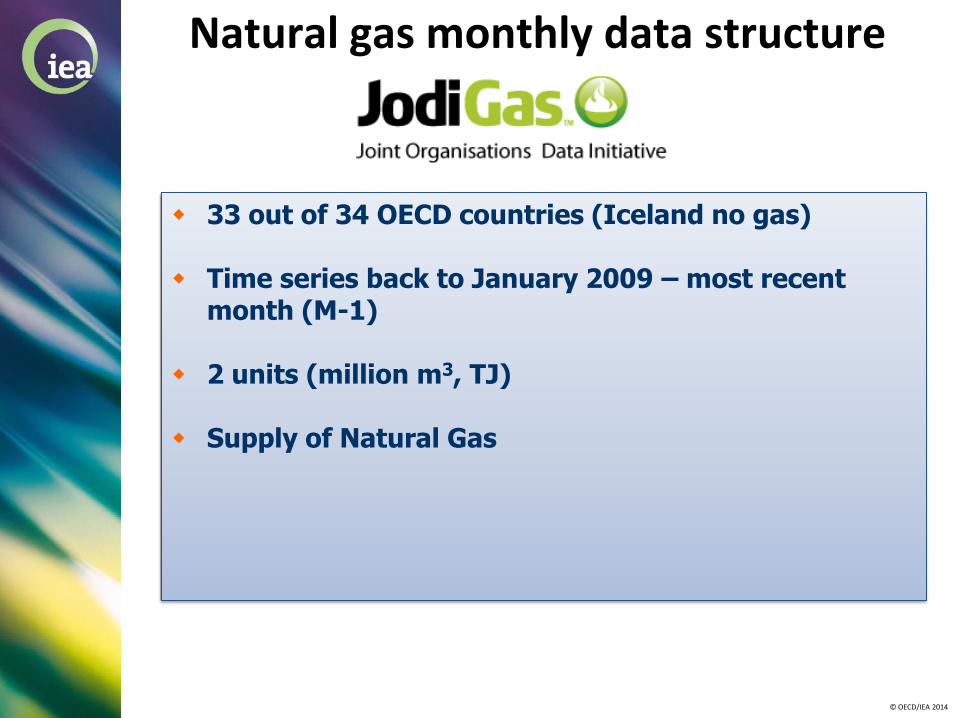
33 out of 34 OECD countries (Iceland no gas)
Time series back to January 2009 – most recent month (M-1)
2 units (million m3, TJ)
Supply of Natural Gas
Natural gas monthly data structure

© OECD/IEA 2014
Trade
Growing trade both pipeline and LNG
increasing difficulties with liberalised market
transit trade is often reported as import / export
exchange contracts (swaps)
Hubs – multitude of gas arrivals
Spot sales - origin not always known
Units
measurement in million cubic metres under Standard conditions - often reported under Normal conditions
data in TJ often reported as Net rather than Gross
Some specific problems regarding gas reporting

© OECD/IEA 2014
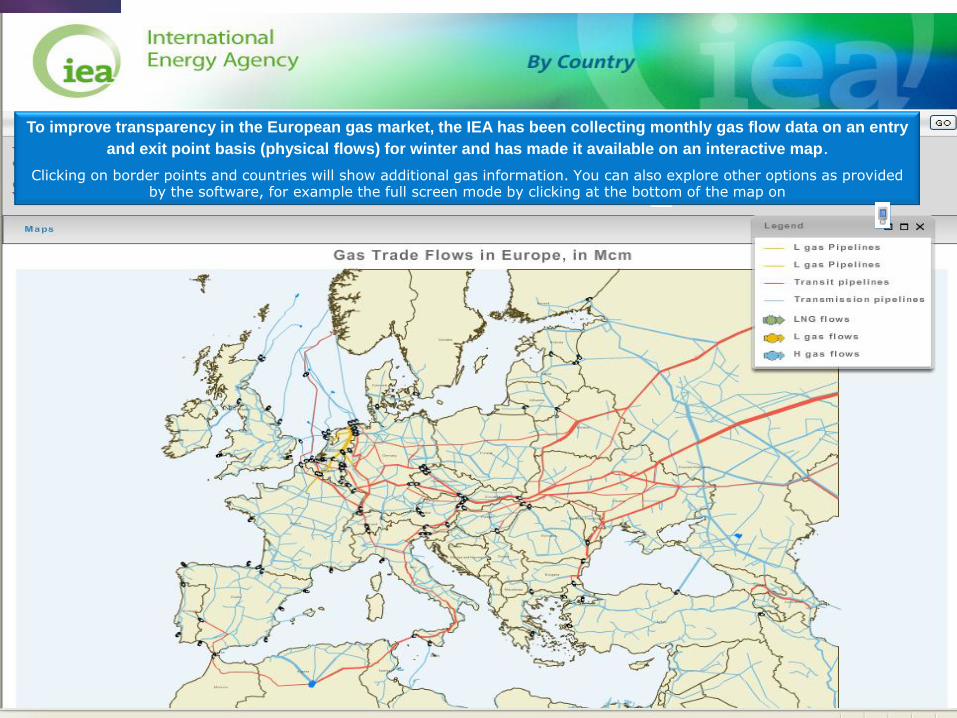
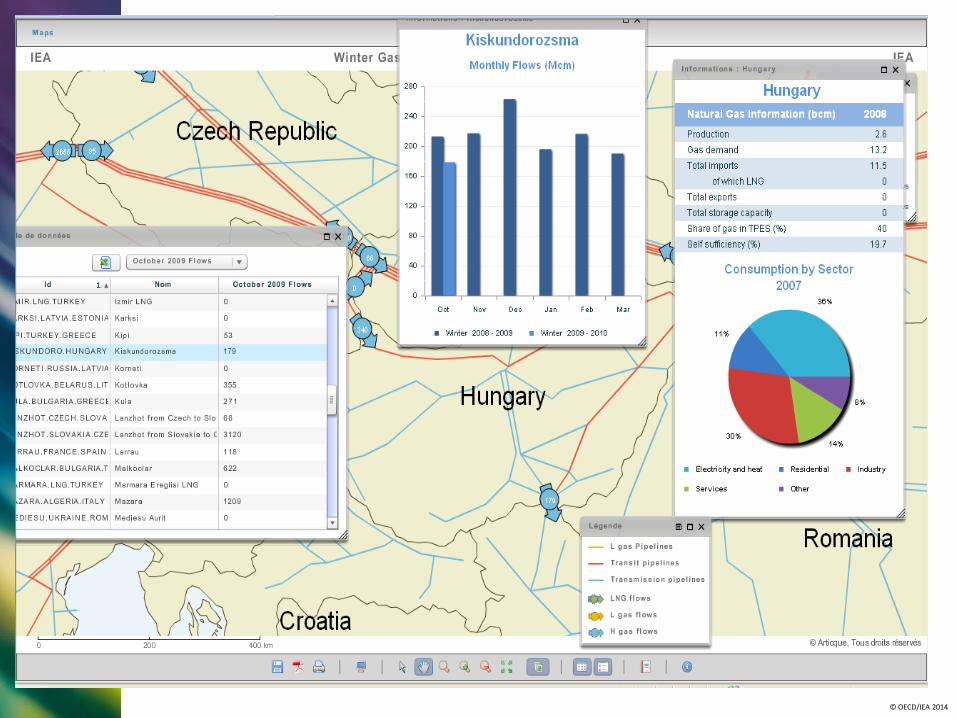
Gas trade flows map
To improve information on gas flows in Europe
Changed definitions of reporting to be more in line with reality
Entry and Exit point
All cross border points
Data on an M-1 basis
Data shown on a map
© OECD/IEA 2014
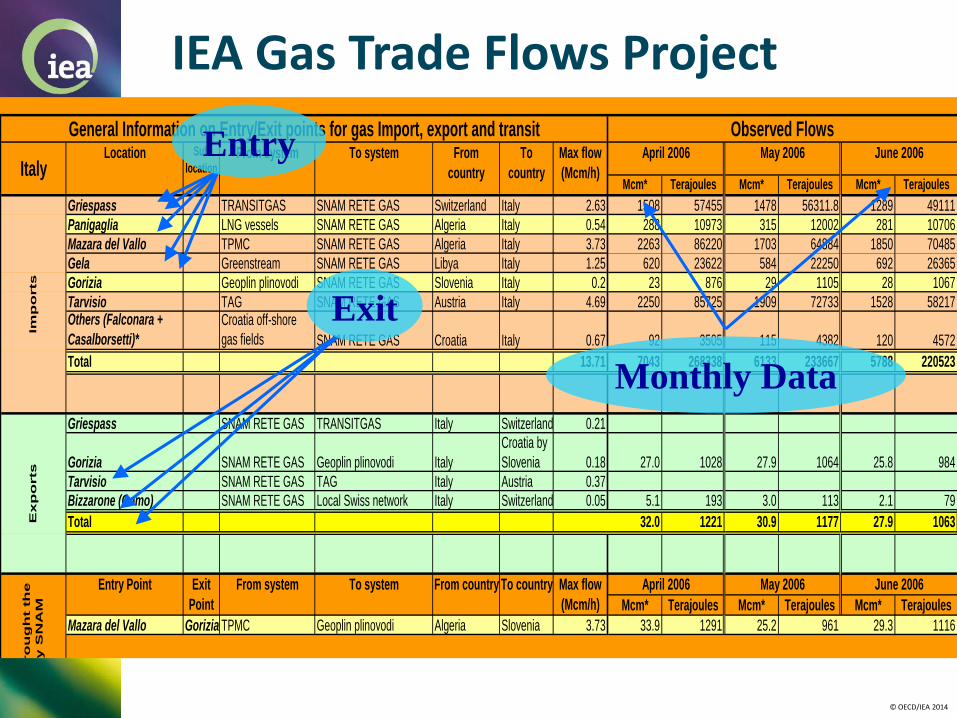
Mcm* Terajoules Mcm* Terajoules Mcm* Terajoules
Griespass TRANSITGAS SNAM RETE GAS Switzerland Italy 2.63 1508 57455 1478 56311.8 1289 49111
Panigaglia LNG vessels SNAM RETE GAS Algeria Italy 0.54 288 10973 315 12002 281 10706
Mazara del Vallo TPMC SNAM RETE GAS Algeria Italy 3.73 2263 86220 1703 64884 1850 70485
Gela Greenstream SNAM RETE GAS Libya Italy 1.25 620 23622 584 22250 692 26365
Gorizia Geoplin plinovodi SNAM RETE GAS Slovenia Italy 0.2 23 876 29 1105 28 1067
Tarvisio TAG SNAM RETE GAS Austria Italy 4.69 2250 85725 1909 72733 1528 58217Others (Falconara +
Casalborsetti)*
Croatia off-shore
gas fields SNAM RETE GAS Croatia Italy 0.67 92 3505 115 4382 120 4572
Total 13.71 7043 268338 6133 233667 5788 220523
Griespass SNAM RETE GAS TRANSITGAS Italy Switzerland 0.21
Gorizia SNAM RETE GAS Geoplin plinovodi Italy
Croatia by
Slovenia 0.18 27.0 1028 27.9 1064 25.8 984
Tarvisio SNAM RETE GAS TAG Italy Austria 0.37
Bizzarone (Como) SNAM RETE GAS Local Swiss network Italy Switzerland 0.05 5.1 193 3.0 113 2.1 79
Total 32.0 1221 30.9 1177 27.9 1063
Mcm* Terajoules Mcm* Terajoules Mcm* Terajoules
Mazara del Vallo Gorizia TPMC Geoplin plinovodi Algeria Slovenia 3.73 33.9 1291 25.2 961 29.3 1116
Observed FlowsApril 2006 May 2006
April 2006 May 2006
June 2006
General Information on Entry/Exit points for gas Import, export and transitTo
country
Max flow
(Mcm/h)ItalyLocation Sub
location
Imp
orts
Ex
po
rts
From system To system From
country
Entry Point Exit
Point
To country Max flow
(Mcm/h)
TR
AN
SIT
th
ro
ug
ht t
he
Co
un
try
by
SN
AM
From system To system From country June 2006
Entry
Exit
IEA Gas Trade Flows Project
Monthly Data
© OECD/IEA 2014
Monthly Gas Data - GTF
3. The Monthly Gas Trade Flows To improve transparency in the European gas market, the IEA has been collecting monthly gas flow data on an entry
and exit point basis (physical flows) for winter and has made it available on an interactive map.
Clicking on border points and countries will show additional gas information. You can also explore other options as provided by the software, for example the full screen mode by clicking at the bottom of the map on

© OECD/IEA 2014
© OECD/IEA 2014
© OECD/IEA 2014
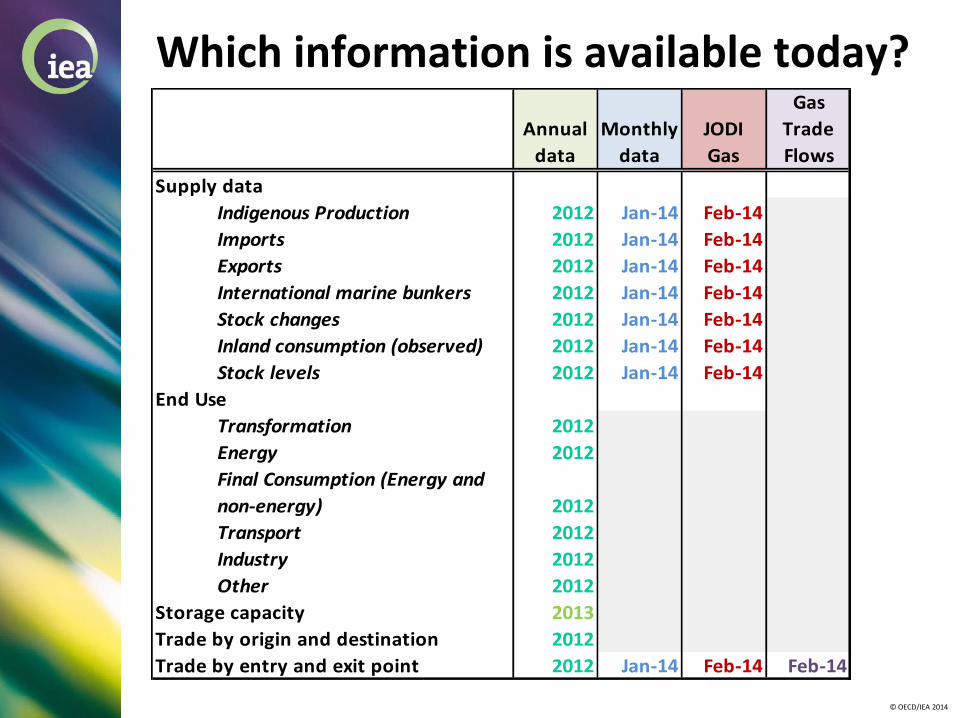
Which information is available today?
Annual
data
Monthly
data
JODI
Gas
Gas
Trade
Flows
Supply data
Indigenous Production 2012 Jan-14 Feb-14
Imports 2012 Jan-14 Feb-14
Exports 2012 Jan-14 Feb-14
International marine bunkers 2012 Jan-14 Feb-14
Stock changes 2012 Jan-14 Feb-14
Inland consumption (observed) 2012 Jan-14 Feb-14
Stock levels 2012 Jan-14 Feb-14
End Use
Transformation 2012
Energy 2012
Final Consumption (Energy and
non-energy) 2012
Transport 2012
Industry 2012
Other 2012
Storage capacity 2013
Trade by origin and destination 2012
Trade by entry and exit point 2012 Jan-14 Feb-14 Feb-14
© OECD/IEA 2014
IEA – Natural gas publications
© OECD/IEA 2014
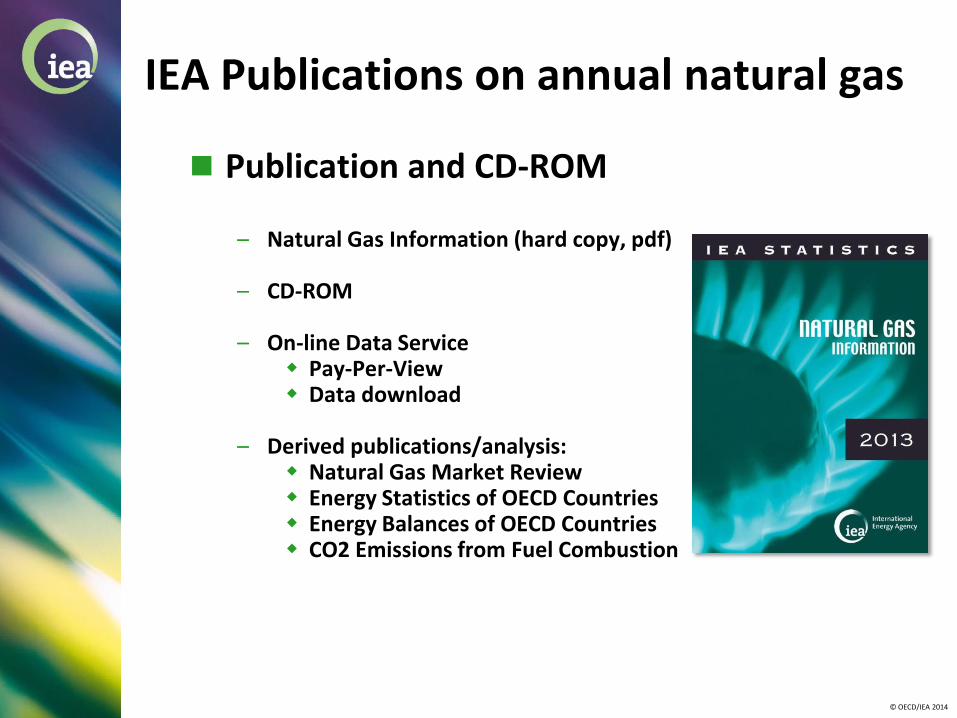
IEA Publications on annual natural gas
Publication and CD-ROM – Natural Gas Information (hard copy, pdf)
– CD-ROM
– On-line Data Service
Pay-Per-View Data download
– Derived publications/analysis:
Natural Gas Market Review Energy Statistics of OECD Countries Energy Balances of OECD Countries CO2 Emissions from Fuel Combustion
© OECD/IEA 2014
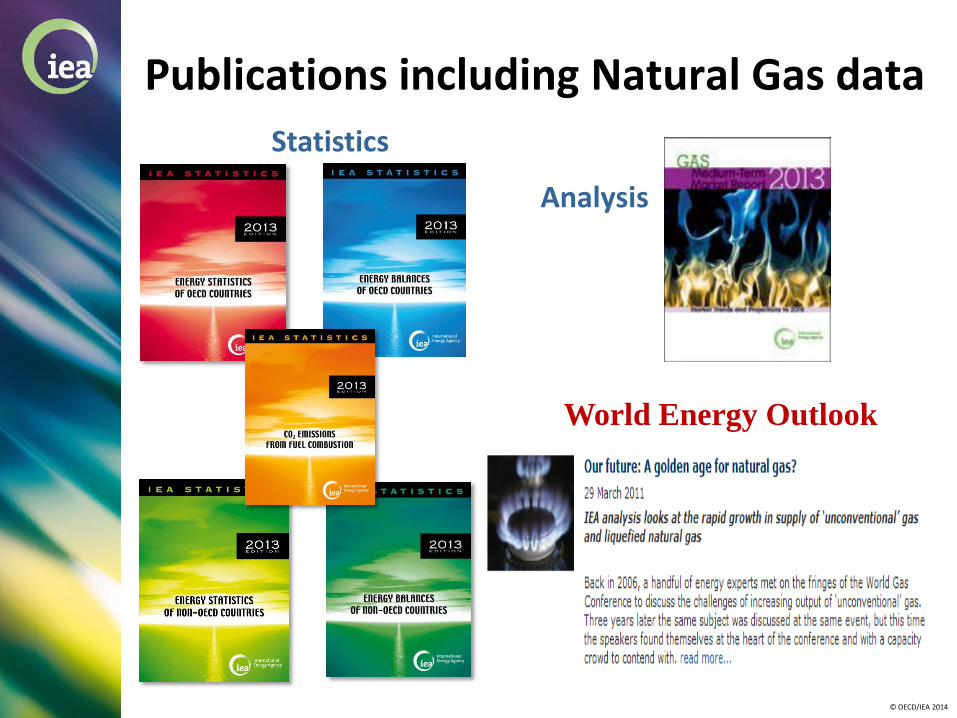
Publications including Natural Gas data
Statistics
Analysis
World Energy Outlook
© OECD/IEA 2014
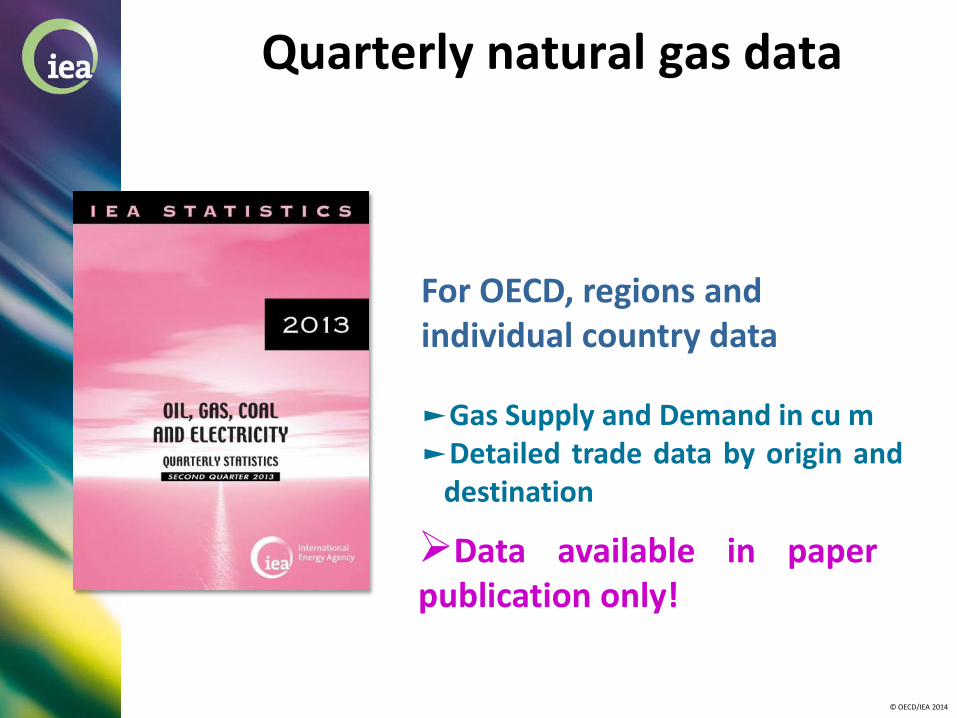
Quarterly natural gas data
For OECD, regions and individual country data ►Gas Supply and Demand in cu m ►Detailed trade data by origin and
destination
Data available in paper publication only!
© OECD/IEA 2014
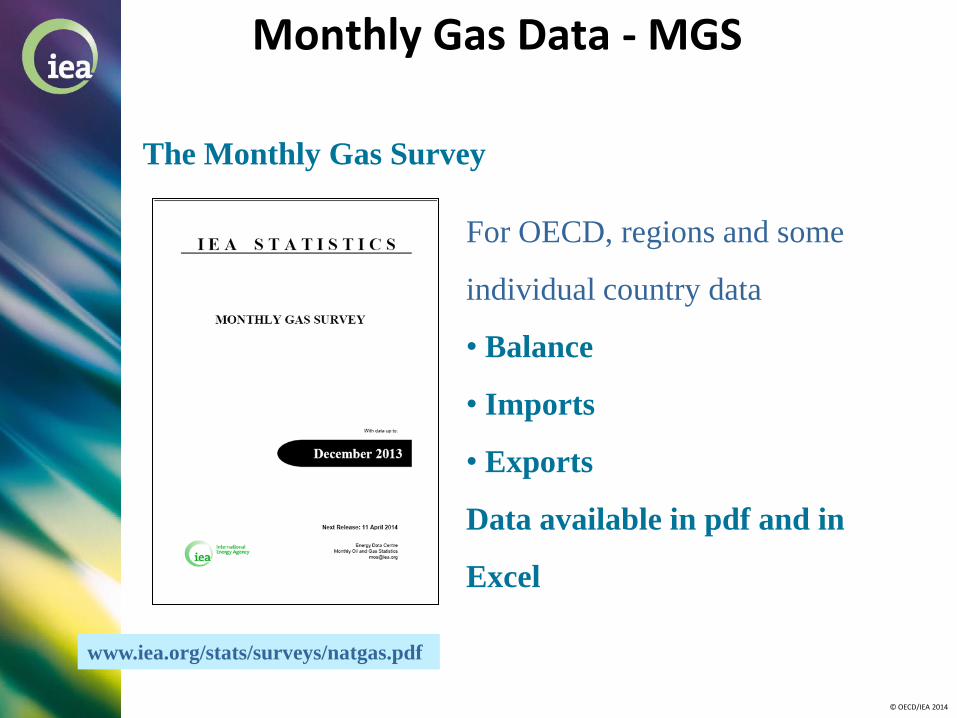
Monthly Gas Data - MGS
The Monthly Gas Survey
For OECD, regions and some
individual country data
• Balance
• Imports
• Exports
Data available in pdf and in
Excel
www.iea.org/stats/surveys/natgas.pdf

© OECD/IEA 2014
The Monthly Gas Data Service:
supply balances from Jan 1984
production, trade, stock changes and levels where available, gross inland deliveries, own use and losses,
highly detailed trade data,
LNG trade detail from January 2002.
Data in cu m and TJ
Monthly Gas Data- MGDS
An electronic data service

© OECD/IEA 2014
Free on the iea website:
http://www.iea.org/gtf/index.asp

© OECD/IEA 2014
Thank You !