At the crossroads - Mirae Asset
61
Analysts who prepared this report are registered as research analysts in Indonesia but not in any other jurisdiction. PLEASE SEE ANALYST CERTIFICATIONS AND IMPORTANT DISCLOSURES & DISCLAIMERS IN APPENDIX 1 AT THE END OF REPORT. Plantation At the crossroads Initiate coverage on the planation sector with a neutral stance Palm oil is one of vegetable oil which is consumed by people around the world. US Department of Agriculture (USDA) estimates 75% of palm oil is used for food and 25% for non-food purposes, such as biofuel. However, we expect clouded financial performance outlook of palm oil companies in the near horizon given lingering challenges. Our key concerns are: La Nina may potentially place negative impact on palm oil production while prolonged low commodity prices (in particular, crude oil) could keep palm oil less attractive. We initiate coverage on the plantation sector with a neutral call. We forecast global palm oil price to reach USD636/ton and USD674/ton in 2016F and 2017F, respectively. Our global palm oil projection is based on Brent crude oil price of USD45/barrel and USD47/barrel in 2016F and 2017F, respectively. Indonesia has a competitive advantage vs. Malaysia in terms of CPO supply Global palm oil production has been dominated by Indonesia and Malaysia which accounted for 85.4% of total global production (2015). Indonesia and Malaysia’s crude palm oil (CPO) production stood at 33.0mn tons and 20.5mn tons, respectively. We believe that Indonesia can maintain its position as the top-producer over the longer term on the back of improving oil palm yield and also larger oil palm plantation area compared to Malaysia. We predict that Indonesia’s palm oil production will reach 34.3mn tons and 35.7mn tons in 2016F and 2017F, respectively. We underscore that Indonesian palm production grew 6.8% CAGR from 2011 to 2015. Global palm oil consumption drivers are Indonesia and India We predict that global palm oil consumption will reach 63.3mn tons and 66.5mn tons in 2016F and 2017F, respectively, in-line with increasing population. Furthermore, we consider the key countries behind the robust global palm oil consumption to be Indonesia and India. Meanwhile, our key concern is that China’s palm oil consumption growth will decelerate, as the country’s vegetable oil consumption is shifting to rape and soybean oil. We predict that Indonesia’s palm oil consumption will reach 9.3mn tons and 10.0mn tons in 2016F and 2017F, respectively. We are less convinced that India would be independent from palm oil imports (chiefly due to the unfavorable geographic limitations) despite Indian government’s efforts to promote oil palm cultivation. Our top picks are LSIP and SSMS Within our plantation coverage, our top picks are: London Sumatra Indonesia (LSIP/ Buy) for its healthy balance sheet and Sawit Sumbermas Sarana (SSMS/ buy) for its high CPO yield. Meanwhile, we rate Sampoerna Agro (SGRO) a Hold due to its high interest expense burden and also call Astra Agro Lestrari (AALI) a Hold due to its old-age oil palm profile and diversification to the downstream business (which is expected to dilute its profitability margins). Risks to our call are 1) global CPO supply/demand imbalance, 2) volatility in global crude oil prices, 3) unpredictable regulation risks, 4) unexpected weather changes, and 5) weak infrastructure situations. Palm oil companies covered in this report Company name Ticker Rating TP (IDR) ROE (%) P/E (x) P/B (x) 2016F 2017F 2016F 2017F 2016F 2017F Astra Agro Lestari AALI HOLD 15,850 2.9 3.3 78.5 66.7 2.3 2.2 PP London Sumatra LSIP BUY 2,040 7.3 7.4 19.0 18.1 1.4 1.3 Sampoerna Agro SGRO HOLD 1,875 6.0 6.0 18.3 17.5 1.1 1.0 Sawit Sumbermas Sarana SSMS BUY 2,150 17.0 16.8 26.5 23.4 4.5 3.9 Source: Daewoo Securities Research Neutral (Initiate) Initiation August 30, 2016 PT Daewoo Securities Indonesia Agriculture Andy Wibowo Gunawan +62-21-515-1140 [email protected]
Transcript of At the crossroads - Mirae Asset

Analysts who prepared this report are registered as research analysts in Indonesia but not in any other jurisdiction. PLEASE SEE
ANALYST CERTIFICATIONS AND IMPORTANT DISCLOSURES & DISCLAIMERS IN APPENDIX 1 AT THE END OF REPORT.
Plantation At the crossroads
Initiate coverage on the planation sector with a neutral stance
Palm oil is one of vegetable oil which is consumed by people around the world. US
Department of Agriculture (USDA) estimates 75% of palm oil is used for food and 25%
for non-food purposes, such as biofuel. However, we expect clouded financial
performance outlook of palm oil companies in the near horizon given lingering
challenges. Our key concerns are: La Nina may potentially place negative impact on palm
oil production while prolonged low commodity prices (in particular, crude oil) could keep
palm oil less attractive. We initiate coverage on the plantation sector with a neutral call.
We forecast global palm oil price to reach USD636/ton and USD674/ton in 2016F and
2017F, respectively. Our global palm oil projection is based on Brent crude oil price of
USD45/barrel and USD47/barrel in 2016F and 2017F, respectively.
Indonesia has a competitive advantage vs. Malaysia in terms of CPO supply
Global palm oil production has been dominated by Indonesia and Malaysia which
accounted for 85.4% of total global production (2015). Indonesia and Malaysia’s crude
palm oil (CPO) production stood at 33.0mn tons and 20.5mn tons, respectively. We
believe that Indonesia can maintain its position as the top-producer over the longer term
on the back of improving oil palm yield and also larger oil palm plantation area compared
to Malaysia. We predict that Indonesia’s palm oil production will reach 34.3mn tons and
35.7mn tons in 2016F and 2017F, respectively. We underscore that Indonesian palm
production grew 6.8% CAGR from 2011 to 2015.
Global palm oil consumption drivers are Indonesia and India
We predict that global palm oil consumption will reach 63.3mn tons and 66.5mn tons in
2016F and 2017F, respectively, in-line with increasing population. Furthermore, we
consider the key countries behind the robust global palm oil consumption to be
Indonesia and India. Meanwhile, our key concern is that China’s palm oil consumption
growth will decelerate, as the country’s vegetable oil consumption is shifting to rape and
soybean oil. We predict that Indonesia’s palm oil consumption will reach 9.3mn tons and
10.0mn tons in 2016F and 2017F, respectively. We are less convinced that India would
be independent from palm oil imports (chiefly due to the unfavorable geographic
limitations) despite Indian government’s efforts to promote oil palm cultivation.
Our top picks are LSIP and SSMS
Within our plantation coverage, our top picks are: London Sumatra Indonesia (LSIP/ Buy)
for its healthy balance sheet and Sawit Sumbermas Sarana (SSMS/ buy) for its high CPO
yield. Meanwhile, we rate Sampoerna Agro (SGRO) a Hold due to its high interest
expense burden and also call Astra Agro Lestrari (AALI) a Hold due to its old-age oil palm
profile and diversification to the downstream business (which is expected to dilute its
profitability margins). Risks to our call are 1) global CPO supply/demand imbalance, 2)
volatility in global crude oil prices, 3) unpredictable regulation risks, 4) unexpected
weather changes, and 5) weak infrastructure situations.
Palm oil companies covered in this report
Company name Ticker Rating TP
(IDR)
ROE (%) P/E (x) P/B (x)
2016F 2017F 2016F 2017F 2016F 2017F
Astra Agro Lestari AALI HOLD 15,850 2.9 3.3 78.5 66.7 2.3 2.2
PP London Sumatra LSIP BUY 2,040 7.3 7.4 19.0 18.1 1.4 1.3
Sampoerna Agro SGRO HOLD 1,875 6.0 6.0 18.3 17.5 1.1 1.0
Sawit Sumbermas Sarana SSMS BUY 2,150 17.0 16.8 26.5 23.4 4.5 3.9
Source: Daewoo Securities Research
Neutral (Initiate)
Initiation
August 30, 2016
PT Daewoo Securities Indonesia
Agriculture
Andy Wibowo Gunawan
+62-21-515-1140

Plantation
2
August 30, 2016
Daewoo Securities Indonesia Research
Palm oil at glance
Palm oil is an important, yet versatile vegetable oil which is used by raw materials for both food
and non-food industries. US Department of Agriculture (USDA) estimates that 75% of palm oil is
used for food, and the remaining 25% for non-food. Palm oil can be extracted from both the fruit
(mesocarp) and the seed (kernel). Crude palm oil (CPO) is extracted from the mesocarp and is
mainly used for cooking purposes, while palm kernel oil is extracted from the kernel and is mainly
used in non-edible products such as detergents, cosmetics and plastics.
Quick facts about palm oil:
1. Palm oil trees can grow up to 20 meters tall with an average life of 25 years.
2. Palm oil tress grow across or 10 degrees north or south of the equator.
3. The tree starts to bear fresh fruit bunches (FFB) after three years.
4. Palm oil can be harvested every 12 months of the year.
Figure 1. Cross section of an oil palm fruit Figure 2. Palm oil usage
Source: Centre for International Forestry Research, Daewoo Securities Research
Source: USDA, Daewoo Securities Research
Figure 3. Fresh fruit bunch picture Figure 4. Palm oil tree
Source: greenstokmedia.com, Daewoo Securities Research
Source: tdg24.com, Daewoo Securities Research
A young palm tree produces about 30 leaves a year. Established palms over 10 years produce
about 20 leaves a year. The flowers are produced in dense clusters and each individual flower is
small, with three sepals and three petals. The palm fruit takes five to six months to mature from
pollination to maturity. It is reddish, about the size of a large plum, and grows in large bunches.
Each fruit is covered up with an oily, fleshy outer layer (the pericarp), with a single seed (the palm
kernel), which is also rich in oil. When ripe, each fruit bunch weighs between 5–30kg depending on
the age.
75
25
Food
Non-food
(%)

Plantation
3
August 30, 2016
Daewoo Securities Indonesia Research
Oil palms generally begin to produce fruits three years after being planted in the fields with
commercial harvest able to be commenced six months later. However, the yield of an oil palm is
relatively low at this stage. As the oil palm continues to mature, its yield increases and it reaches
peak production during ages from 7 to 13 years old. Yield starts to gradually decrease after 14
years. The typical commercial lifespan of an oil palm is approximately 25 years.
Fully mature oil palms produce 18 to 30 metric tons of FFB per hectare. The yield depends on a
variety of factors, including age, seed quality, soil and climatic conditions, quality of plantation
management and the timely harvesting and processing of FFB. The ripeness of FFB harvested is
critical in maximizing the quality and quantity of palm oil extracted. Harvested fruits must be
processed within 24 hours to minimize the build-up of free fatty acids (FFA).
Figure 5. Palm oil yield & age profile Figure 6. CPO usage based on FFA
Source: Palmoilworld, Daewoo Securities Research
Source: Nippon-cnpc, Daewoo Securities Research
Milling of FFB takes place within 24 hours from the harvesting of FFB. They are initially transferred
to the palm oil mills for sterilization by applying high-pressure steam, whereupon the palm fruits
are enzyme-deactivated and separated from the palm bunches.
After steaming, the palm fruitlets are crushed in a pressing machine to obtain CPO and palm kernel.
Waste and water is then cleared and separated from the CPO by means of a centrifuge. The
cleared crude palm oil emerging from the centrifuge is then sent for refining while the palm kernel
nut is sent for crushing. The empty fruit bunches and liquid waste arising from the processing are
recycled as fertilizer in the plantations.
Figure 7. Palm oil supply chain
Source: Alibaba, Daewoo Securities Research
Palm oil mill
High FFA CPO
(FFA: 20% - 30% )
CPO
(FFA: <5% )Palm acid oil (PAO)
(FFA: >30% )
Non Food Food Non Food

Plantation
4
August 30, 2016
Daewoo Securities Indonesia Research
Indonesia to maintain its position as the top producer
Global palm oil production had been dominated by Indonesia and Malaysia which accounted to
85.4% of global total production by 2015. Last year, Indonesia and Malaysia produced 33.0mn tons
and 20.5mn tons respectively. Rewinding back to 1980, Indonesia palm oil production represented
a mere 14.3% of total global production (702,000 tons), while Malaysia dominated up to 51.9% of
total global production (2.5mn tons). 26 years later, Indonesia overtook the first place as the top
global palm oil producer. The mainly reason was dramatically increased area under plantation.
In terms of amount, Indonesia’s palm oil production jumped more than double to 33.0mn tons in
2015, compared to a decade ago which stood at 13.6mn tons. Meanwhile, Malaysia palm oil
production increased to 20.5mn tons in 2015, from 15.2mn tons in 2005. This was mainly because
Indonesia has larger plantation area compared to Malaysia. All in all, Indonesia is expected to
produce more than 40.0mn tons of palm oil by 2020 without any expansion plans, according to
Indonesia Sustainable Palm Oil (ISPO). Furthermore, smallholders palm oil plantation in Indonesia is
known to own an average farm size of 4.0~ 6.0 ha which would equate to an aggregate total of
1.0mn ha~ 1.5mn ha across the nation.
Figure 8. Indonesia & Malaysia palm oil production trends Figure 9. Indonesia the first rank as producer since 2006
Source: Bloomberg, Daewoo Securities Research
Source: Bloomberg, Daewoo Securities Research
Indonesia oil palm yield improved, despite lower than Malaysia
By 2015, Indonesia oil palm yield had increased to 3.7ton/ha – an improvement by 0.6ton/ha
compared to 1979. However this improvement fell slightly below Malaysian oil palm yield which
stood at 3.8ton/ha, last year. We ascribe the more sophisticated cultivation technique to be one of
the reasons why Malaysian oil palm yield was higher than Indonesia. Meanwhile, younger palm oil
age in Indonesia is another reason why Indonesian oil palm yield was lower, in our view. We
consider Malaysia’s early palm oil cultivation (vs. Indonesia) to be a key advantage of its stellar yield.
Figure 10. Malaysia has higher palm oil yield Figure 11. However Indonesia palm oil yield improved
Source: USDA, MPOB, Daewoo Securities Research
Source: USDA, Utrecht University, Daewoo Securities Research
-
5,000
10,000
15,000
20,000
25,000
30,000
35,000
('000 tons) Indonesia Malaysia
-
20.0
40.0
60.0
80.0
100.0
120.0
(%) Indonesia Malaysia Others
3.7
3.8
3.6
3.7
3.7
3.8
3.8
3.9
3.9
Indonesia Malaysia
(ton/ha)
3.1
3.6
3.5 3.5
3.7
2.8
2.9
3
3.1
3.2
3.3
3.4
3.5
3.6
3.7
3.8
1979 1989 1999 2005 2015
(ton/ha)
Plantation
5
August 30, 2016
Daewoo Securities Indonesia Research
Indonesia has larger oil palm plantation area than Malaysia
Malaysia’s oil palm planted area reached 5.6mn ha, an increase of 4.6% YoY. This was mainly due to
the increase in new planted areas especially in Sarawak, which recorded an increase of 13.9% YoY.
Sabah is still the largest palm oil planted area, with 1.5mn ha, or 27.0% of total palm oil planted
area in Malaysia. In the meanwhile, Indonesia’s palm oil planted area stood at 10.8mn ha which is
almost double compared to Malaysia’s planted area (5.6mn ha).
During 1978~ 2003, Indonesia’s oil palm land area under palm oil production was boosted by
4.6mn ha. However, we underscore that the new oil palm plantation area was recently added.
2.6mn ha worth of new plantation land was added recently from 1997~ 2003. Unfortunately, the
pace of addition was much lower compared to Malaysia which jumped from 600,000 ha in 1975 to
4.2mn ha in 2006.
Figure 12. Higher planted area palm oil in Indonesia Figure 13. Malaysia planted area slightly increased by 2015
Source: USDA, Daewoo Securities Research
Source: MPOB, Daewoo Securities Research
Indonesian farmers prefer oil palm plantation over others
Not only was Indonesia’s oil palm plantation dominated by large-scale conglomerates, small
holders also favored oil palm plantation. 28.3% of Indonesia plantation was dominated by palm oil,
followed by coconut (22.3%), rubber (19.0%), cocoa (10.2%), and coffee (7.4%) in 2014.
Furthermore, Indonesia’s palm oil plantation area which was operated by small holders doubled to
2.5mn ha in 2006 from1.2mn ha in 2000. The plantation area grew to 4.5mn ha in 2014. This
increase in the plantation area was triggered by the commodity boom which lasted for several
years.
Additionally, small holders sell their palm oil to nearby large-scale plantation companies in the form
of bunches (also called FFB). FFBs are sold through an auction scheme, where the benchmark price
changes daily in respective areas. The benchmark price also factors in the global oil palm price
movement.
Figure 14. Palm oil dominated in smallholders plantation Figure 15. Indonesia smallholders palm oil area trends
Source: BPS, Daewoo Securities Research
Source: BPS, Daewoo Securities Research
10,325 10,640 10,800
8,115 8,540
8,965
-
2,000
4,000
6,000
8,000
10,000
12,000
2013 2014 2015
('000 ha) Planted Area Harvested Area
5,230
5,329
5,643
5,000
5,100
5,200
5,300
5,400
5,500
5,600
5,700
2013 2014 2015
('000 ha)
19.0
22.3
28.3
7.4
10.2
12.8
Rubber
Coconut
Palm Oil
Coffee
Cocoa
Others
-
500
1,000
1,500
2,000
2,500
3,000
3,500
4,000
4,500
5,000
('000 ha)

Plantation
6
August 30, 2016
Daewoo Securities Indonesia Research
Cooperation with external parties to secure FFB stocks
Occasionally, palm oil companies experience supply shortage in FFBs. Thus, palm oil companies
must secure FFBs from third parties to keep the mills running. However, purchase from third
parties is unsustainable and thus cannot be a long-term resolution. Hence, palm oil companies
additionally secure their long-term FFB supplies through cooperation with local farmers who reside
around the plantation area. This cooperation is called plasma scheme. The following is an example
of a plasma cooperation scheme:
1. Bank will assess the capability of farmers (plasma)
2. Both parties will sign a MoU and explain the rights and obligations
3. After the signing of MoU, palm oil companies will provide debt facilities to finance the
plasma plantation
4. Plasma farmers will receive the funds from palm oil companies (nucleus)
5. Plasma farmers will pay installment to nucleus by selling their FFB to nucleus
Figure 16. Plasma plantation schemes flow
Source: Agrindo Group, Daewoo Securities Research
Figure 17. Plasma plantation work periods
Source: Agrindo Group, Daewoo Securities Research
BANK
Nucleus
(Palm Oil
Company)
Cooperative
Farmers
(Plasma)
Memorandum of
Understanding
1
2
3
4
5
Development Stage Mature Plantation Stage
Tolerance period Return period
0 – 5 year 6 – 13 year

Plantation
7
August 30, 2016
Daewoo Securities Indonesia Research
A stepping stone to securing new land bank
On May 20, 2011, Indonesian government released presidential instruction No.10/2011 on “The
postponement of issuance of new licenses and improving governance of primary resources natural
forest and peatland”. The presidential instruction had effectively imposed a 2-year moratorium on
new forest concession licenses. President Jokowi will also issue a moratorium policy for peatland
through instructional president, but it has yet to be declared. This new policy will place negative
implications on palm oil companies as it would be tougher to acquire new land-bank. That being
said, the new policy should act as a key obstacle for expansion of palm oil companies.
According to the Ministry of Agriculture, most of Indonesia peatland are located in Sumatra Island
which contributed to 43.2% of total peatland, followed by Kalimantan and Papua islands which
contributed 32.1% and 24.8%, respectively in 2011. In Indonesia, peatland is categorized into four
tiers based on the thickness of peatland soil. Tiers 1 is the lowest level which has 50 – 100cm of
thickness, whereas tiers 2, 3, and 4 have 101 – 200cm, 201 – 400cm and >400cm thickness,
respectively.
Figure 18. Sumatra peat-land spots Figure 19. Kalimantan peat-land spots
Source: Wetlands International, Daewoo Securities Research
Source: Wetland International, Daewoo Securities Research
Table 1. Indonesia pet-land area with its thickness (‘000 hectare)
Region Thickness Large (%) of total
D1 D2 D3 D4
Sumatra 1,767.3 1,707.8 1,243.0 1,718.6 6,436.6 43.2
Kalimantan 1,048.6 1,389.8 1,072.8 1,266.8 4,778.0 32.1
Papua 2,425.5 817.7 447.7 - 3,690.9 24.8
Total 5,241.4 3,915.3 2,763.5 2,985.4 14,905.6 100.0
Source: Indonesia Agriculture Ministry, Daewoo Securities Research

Plantation
8
August 30, 2016
Daewoo Securities Indonesia Research
After dry El Nino, will La Nina occur?
Last year, it was a dry season for Indonesia where palm oil production dropped more than 5% YoY
compared to previous periods. We ascribe this dryness to the El Nino phenomenon. El Nino is a
band of warm ocean water that develops in the central and east-central equatorial pacific. El Nino
is accompanied by high air pressure in the western pacific and low air pressure in the eastern
pacific. There have been approximately 30 El Nino events since 1900, with the 1982-83, 1997-98,
and 2014-16 events which were among the strongest in history.
Figure 20. Southern oscillation index trend
Source: NOAA, Daewoo Securities Research
However, some meteorologists elsewhere (i.e., Australia, USA & Indonesia) predict that the
chances of La Nina in 2016 has increased. According to Australian Bureau Meteorology (BOM),
climate models are indicating 50% possibility of the wet weather event emerging this year (La Nina
is the opposite of the dry El Nino).
We predict that it could further disrupt supply of palm oil this year, as we think La Nina could
cause logistic problems during harvesting seasons. Generally, as the plantation area’s earth is soft
nature, this acts as challenge for farmers to transport FFB down to the main road. Given Indonesia
and Malaysia are the largest palm oil producers, we believe the supply disruptions should drive
global palm oil prices higher.
Figure 21. Rainfall probability distribution Figure 22. Character rainfall probability distribution
Source: BMKG, Daewoo Securities Research
Source: BMKG, Daewoo Securities Research
-6.0
-4.0
-2.0
0.0
2.0
4.0
6.0
Jan-
90
Aug
-90
Mar
-91
Oct
-91
May
-92
Dec
-92
Jul-9
3
Feb-
94
Sep
-94
Apr
-95
Nov
-95
Jun-
96
Jan-
97
Aug
-97
Mar
-98
Oct
-98
May
-99
Dec
-99
Jul-0
0
Feb-
01
Sep
-01
Apr
-02
Nov
-02
Jun-
03
Jan-
04
Aug
-04
Mar
-05
Oct
-05
May
-06
Dec
-06
Jul-0
7
Feb-
08
Sep
-08
Apr
-09
Nov
-09
Jun-
10
Jan-
11
Aug
-11
Mar
-12
Oct
-12
May
-13
Dec
-13
Jul-1
4
Feb-
15
Sep
-15

Plantation
9
August 30, 2016
Daewoo Securities Indonesia Research
Palm oil dominated vegetable oils consumption around the world
Edible vegetable oils are some of the most crucial cooking oil ingredients in the world and the
world vegetable oil consumption increased continuously to 173.3mn tons in 2015, or 4.5% CAGR
2011-2015 which was in-line with the global population growth (0.7% CAGR 2011~ 2015). By 2015,
palm oil still dominated as the key vegetable oil consumption which accounted for 35.0% of total
global vegetable oil consumption, followed by soybean, canola, sunflower, and others which
represented 27.0%, 15.6%, 8.8% and 13.6%, respectively.
Figure 23. Global vegetables oil consumption Figure 24. Palm oil was the largest vegetables oil consumption
Source: Statista, Daewoo Securities Research
Source: Statista, Daewoo Securities Research
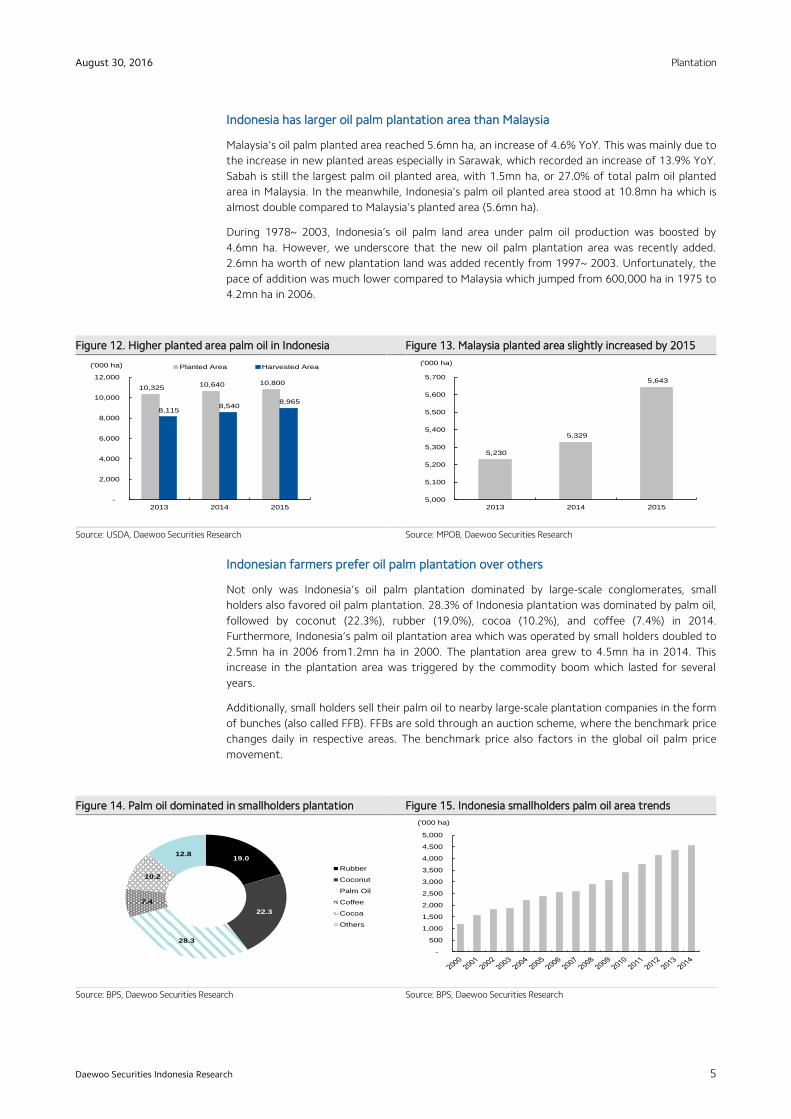
Global palm oil consumption will be driven by India & Indonesia
Overall, global palm oil consumption increased to 60.3mn tons, or up 5.2% CAGR during 2011 –
2015. This growth was triggered by higher consumption of palm oil in India, Indonesia, and
Eurozone which reached 10.1mn, 8.6mn, and 6.6mn tons, respectively. By contrast, Malaysia and
China palm oil consumption decreased by 5.1% and 1.8% CAGR during 2011 – 2015, respectively
to 3.4mn and 5.8mn tons. Malaysia and China palm oil consumption accounted for 5.6% and 9.5%
of total global consumption in 2015 (vs. 8.4% and 12.5% of total global consumption in 2011). In
addition, the decline in China’s palm oil consumption was largely due to higher soybean import,
which amounted to 81.7mn tons (+14.5% YoY) in 2015 compared to its previous year.
We believe that global palm oil consumption growth will be driven by India and Indonesia on the
back of robust population growth and rising biodiesel consumption in Indonesia. Therefore, we are
optimistic that global consumption of palm oil will reach 63.3mn tons and 66.5mn tons in 2016F
and 2017F, respectively. Meanwhile, our main concern is the potential sharp decline in China’s palm
oil consumption on the back of shifting to rape and soybean oil consumption.
Figure 25. Global palm oil consumption still grow Figure 26. Global portfolio consumption palm oil by 2015
Source: Bloomberg, Daewoo Securities Research
Source: Bloomberg, Daewoo Securities Research
35.0
27.0
15.6
8.8
13.6
Palm Oil
Soybean
Canola
Sunflower
Others
(%)
145.3
151.8
157.7
166.3
173.3
130.0
135.0
140.0
145.0
150.0
155.0
160.0
165.0
170.0
175.0
180.0
2011 2012 2013 2014 2015
(mn tons)
-
50.0
100.0
150.0
200.0
250.0
India Indonesia China Eurozone Malaysia Others
2011 2012 2013 2014 2015(%)
49,343
54,125 57,044 57,393
60,324
-
10,000
20,000
30,000
40,000
50,000
60,000
70,000
2011 2012 2013 2014 2015
('000 tonnes)
Plantation
10
August 30, 2016
Daewoo Securities Indonesia Research
Figure 27. China palm oil consumption decreased Figure 28. The lowest level inventory since 2012
Source: Bloomberg, Daewoo Securities Research
Source: Bloomberg, Daewoo Securities Research
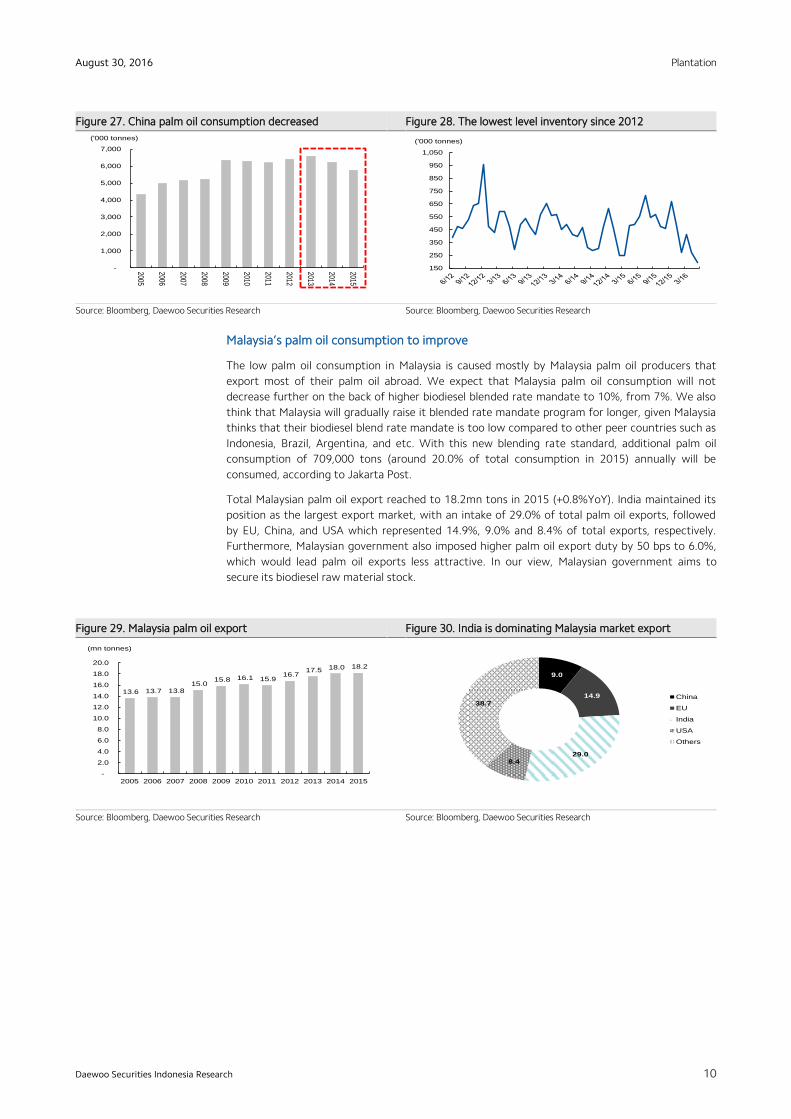
Malaysia’s palm oil consumption to improve
The low palm oil consumption in Malaysia is caused mostly by Malaysia palm oil producers that
export most of their palm oil abroad. We expect that Malaysia palm oil consumption will not
decrease further on the back of higher biodiesel blended rate mandate to 10%, from 7%. We also
think that Malaysia will gradually raise it blended rate mandate program for longer, given Malaysia
thinks that their biodiesel blend rate mandate is too low compared to other peer countries such as
Indonesia, Brazil, Argentina, and etc. With this new blending rate standard, additional palm oil
consumption of 709,000 tons (around 20.0% of total consumption in 2015) annually will be
consumed, according to Jakarta Post.
Total Malaysian palm oil export reached to 18.2mn tons in 2015 (+0.8%YoY). India maintained its
position as the largest export market, with an intake of 29.0% of total palm oil exports, followed
by EU, China, and USA which represented 14.9%, 9.0% and 8.4% of total exports, respectively.
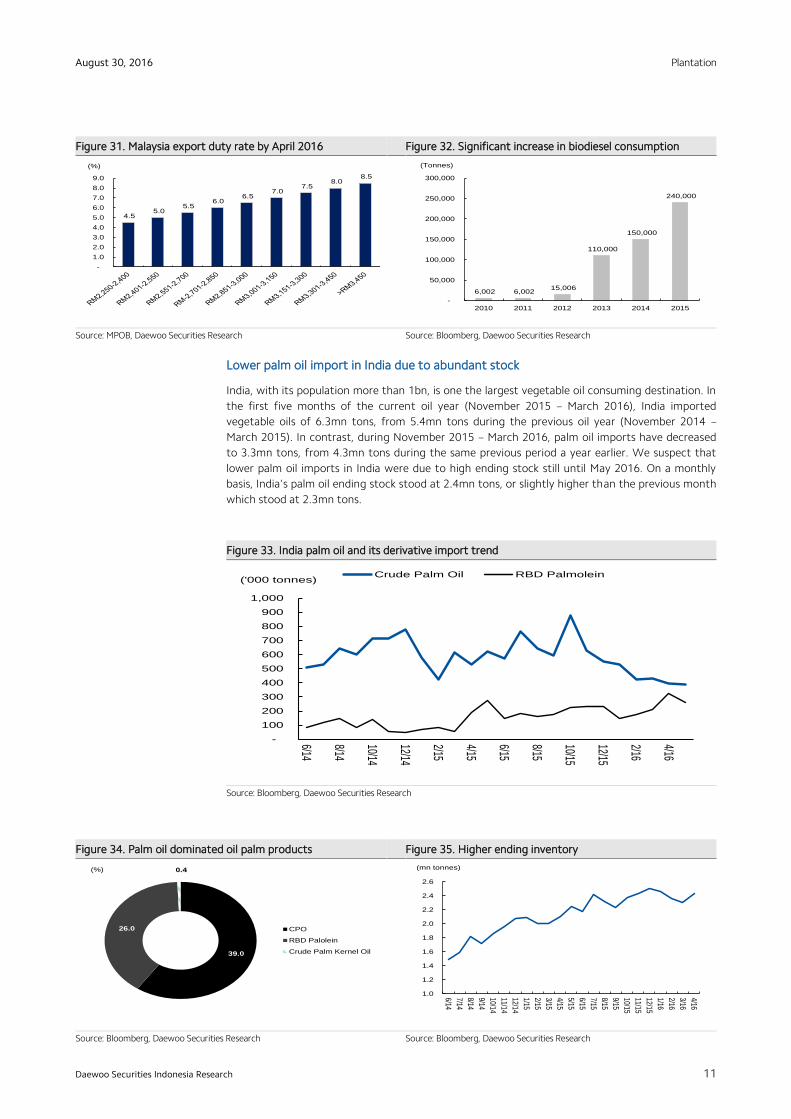
Furthermore, Malaysian government also imposed higher palm oil export duty by 50 bps to 6.0%,
which would lead palm oil exports less attractive. In our view, Malaysian government aims to
secure its biodiesel raw material stock.
Figure 29. Malaysia palm oil export Figure 30. India is dominating Malaysia market export
Source: Bloomberg, Daewoo Securities Research
Source: Bloomberg, Daewoo Securities Research
13.6 13.7 13.8 15.0
15.8 16.1 15.9 16.7
17.5 18.0 18.2
-
2.0
4.0
6.0
8.0
10.0
12.0
14.0
16.0
18.0
20.0
2005 2006 2007 2008 2009 2010 2011 2012 2013 2014 2015
(mn tonnes)
9.0
14.9
29.0 8.4
38.7 China
EU
India
USA
Others
150
250
350
450
550
650
750
850
950
1,050
('000 tonnes)
-
1,000
2,000
3,000
4,000
5,000
6,000
7,000
2005
2006
2007
2008
2009
2010
2011
2012
2013
2014
2015
('000 tonnes)
Plantation
11
August 30, 2016
Daewoo Securities Indonesia Research
Figure 31. Malaysia export duty rate by April 2016 Figure 32. Significant increase in biodiesel consumption
Source: MPOB, Daewoo Securities Research
Source: Bloomberg, Daewoo Securities Research
Lower palm oil import in India due to abundant stock
India, with its population more than 1bn, is one the largest vegetable oil consuming destination. In
the first five months of the current oil year (November 2015 – March 2016), India imported
vegetable oils of 6.3mn tons, from 5.4mn tons during the previous oil year (November 2014 –
March 2015). In contrast, during November 2015 – March 2016, palm oil imports have decreased
to 3.3mn tons, from 4.3mn tons during the same previous period a year earlier. We suspect that
lower palm oil imports in India were due to high ending stock still until May 2016. On a monthly
basis, India’s palm oil ending stock stood at 2.4mn tons, or slightly higher than the previous month
which stood at 2.3mn tons.
Figure 33. India palm oil and its derivative import trend
Source: Bloomberg, Daewoo Securities Research
Figure 34. Palm oil dominated oil palm products Figure 35. Higher ending inventory
Source: Bloomberg, Daewoo Securities Research
Source: Bloomberg, Daewoo Securities Research
-
100
200
300
400
500
600
700
800
900
1,000
6/14
8/14
10/14
12/14
2/15
4/15
6/15
8/15
10/15
12/15
2/16
4/16
('000 tonnes)Crude Palm Oil RBD Palmolein
39.0
26.0
0.4
CPO
RBD Palolein
Crude Palm Kernel Oil
(%)
1.0
1.2
1.4
1.6
1.8
2.0
2.2
2.4
2.6
6/14
7/14
8/14
9/14
10/14
11/14
12/14
1/15
2/15
3/15
4/15
5/15
6/15
7/15
8/15
9/15
10/15
11/15
12/15
1/16
2/16
3/16
4/16
(mn tonnes)
4.5 5.0
5.5 6.0
6.5 7.0
7.5 8.0
8.5
-
1.0
2.0
3.0
4.0
5.0
6.0
7.0
8.0
9.0
(%)
6,002 6,002 15,006
110,000
150,000
240,000
-
50,000
100,000
150,000
200,000
250,000
300,000
2010 2011 2012 2013 2014 2015
(Tonnes)

Plantation
12
August 30, 2016
Daewoo Securities Indonesia Research
Can India break free from palm oil imports?
On the other hand, in order to bolster its edible oil security, India is aggressively pushing for oil
palm cultivation in the country despite its well documented deleterious socio-economy and
ecological impact. Furthermore, India’s edible oil import bill (around USD10bn in 2015) often
remains a focus for business and policy debates and once again policy makers have taken up the
gauntlet to make India self-sufficient in its edible oil requirements. On August 18, 2015, Prime
Minister Modi’s plan to commit USD1.5bn over three years pushed palm oil cultivation higher in
India. This stated target is to take India’s production of palm oil to 8mn tons. We are however less
optimistic that the target will be achieved in the longer term due to structural problems which has
been faced by India, while we believe that India is still a net importer of palm oil products.
Our first argument why India would be hard for India to meet its target in palm oil cultivation is
the unfavorable geographic location. As mentioned above, the ideal locations for oil palm trees are
within ten degrees latitude north and south equator. However, India’s geographic location is not
near the equatorial zone. The geographic location is also related with a climate of a country, while
major India’s climate is four-seasons which definitely it is not appropriate for palm oil tree
cultivation. In addition, long gestation period for palm oil is also our concern because farmers
would have to wait for four years for the trees in India to start yielding FFB.
Figure 36. India geography above equatorial zone
Source: Google maps, Daewoo Securities Research
Table 2. Oil palm plantation area in India (hectares)
State Potential Area Covered Area
Andaman & Nicobar - 1,593
Andhra Pradesh 400,000 96,563
Assam - 10
Chhattisgarh 40,000 -
Goa 2,000 874
Gujarat 90,000 2,175
Karnataka 250,000 18,906
Kerala 6,500 5,501
Maharashtra - 1,000
Mizoram 61,000 7,881
Orissa 25,000 3,775
Tamil Nadu 162,000 16,394
Tripura - 530
West Bengal - -
Total 1,036,500 155,202
Source: Chadha committee, Daewoo Securities Research

Plantation
13
August 30, 2016
Daewoo Securities Indonesia Research
How about Indonesia palm oil consumption?
Indonesia palm oil consumption jumped fourfold over the last two decades to 8.6mn tons in 2015.
This amazing growth was chiefly driven by increased population which reached 256mn people in
2015, from 198mn people in 1995. More than 50% of palm oil was used for cooking oil and
remaining was used for the margarine, and biodiesel. We believe that Indonesia’s palm oil
consumption will reach 9.3mn tons and 10.0mn tons in 2016F and 2017F, respectively on the back
of steady population growth and higher biodiesel consumption.
Figure 37. Indonesia palm oil consumption in-line with population
Source: Bloomberg, Daewoo Securities Research
Palm oil is one of the biofuel alternatives for Indonesia
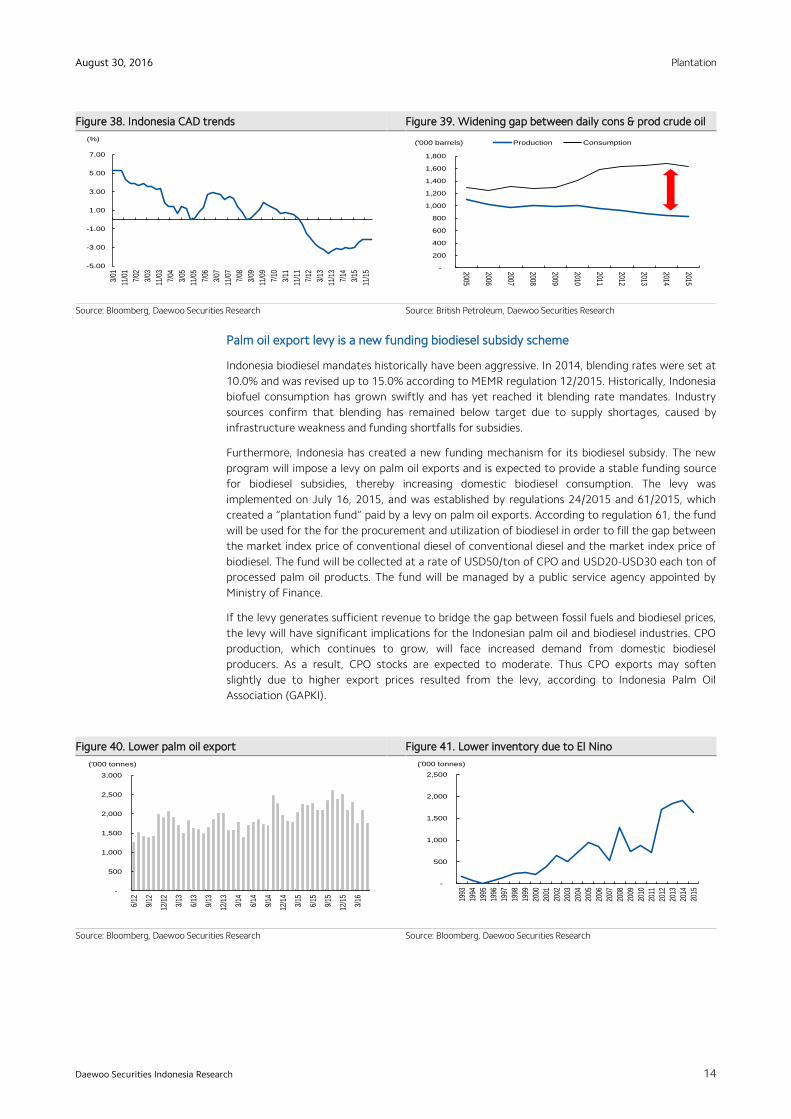
Since 1Q12 Indonesia’s current account deficit (CAD) to GDP crossed the negative territory
beginning with -0.51% and gradually fell deeper to -3.62% in 3Q13. Since the trough, Indonesia’s
CAD to GDP has gradually improved to -2.12% by 1Q16. Our assessment is that the current
account deficit was mainly driven by higher crude oil import stemming from increased car sales
which led to higher gasoline consumption. Indonesia’s daily crude oil consumption increased to
1.6mn barrels/day in 2015 from 1.3mn barrels/day in 2005. Meanwhile, daily production of crude
oil decreased to 825,000barrels/day in 2015, from 1.1mn barrels/day in a decade earlier. Because
of this structural problem, Indonesian government began to promote biodiesel as one of the fuel
alternatives which is mainly taken from palm oil. Indonesia’s biofuel policy is governed by a number
of regulations and decrees. Government regulation 1/2006 was an important first step for the
development of biofuels in Indonesia. In 2008, Indonesian government created a biofuel blending
rate mandate through Ministry of Energy & Mineral (MEMR) regulation 32. The blending rate
mandate regulation has been revised several times, most recently through MEMR regulation 12,
released in March 2015. Additionally, biofuel is energy made from living matter, usually plants.
Bioethanol, biogas and biodiesel are types of biofuels.
Biodiesel is used in standard diesel engine and is thus distinct from the vegetable and waste oils
converted for diesel engines. Biodiesel can be used alone, or blended with petro diesel in any
proportions. Biodiesel blends also can be used as heating oil. Blends of biodiesel and conventional
hydrocarbon-based diesel are products most commonly distributed for use in the retail diesel fuel
marketplace. Much of the world uses a system known as the “B” factor to state the amount of
biodiesel in any fuel mix. A 100% biodiesel is referred to as B100, A 20% of biodiesel and 80%
petro-diesel is labeled B20, and so on. A 55% of biodiesel can be used from palm oil and remaining
be used from other vegetable oils such as soybean, rapeseed, and etc.
50
100
150
200
250
1,000
2,000
3,000
4,000
5,000
6,000
7,000
8,000
9,000
10,000
11,000
1995
1996
1997
1998
1999
2000
2001
2002
2003
2004
2005
2006
2007
2008
2009
2010
2011
2012
2013
2014
2015
(mn people)('000 tonnes)
Indonesia CPO Consumption Population
Plantation
14
August 30, 2016
Daewoo Securities Indonesia Research
Figure 38. Indonesia CAD trends Figure 39. Widening gap between daily cons & prod crude oil
Source: Bloomberg, Daewoo Securities Research
Source: British Petroleum, Daewoo Securities Research
Palm oil export levy is a new funding biodiesel subsidy scheme
Indonesia biodiesel mandates historically have been aggressive. In 2014, blending rates were set at
10.0% and was revised up to 15.0% according to MEMR regulation 12/2015. Historically, Indonesia
biofuel consumption has grown swiftly and has yet reached it blending rate mandates. Industry
sources confirm that blending has remained below target due to supply shortages, caused by
infrastructure weakness and funding shortfalls for subsidies.
Furthermore, Indonesia has created a new funding mechanism for its biodiesel subsidy. The new
program will impose a levy on palm oil exports and is expected to provide a stable funding source
for biodiesel subsidies, thereby increasing domestic biodiesel consumption. The levy was
implemented on July 16, 2015, and was established by regulations 24/2015 and 61/2015, which
created a “plantation fund” paid by a levy on palm oil exports. According to regulation 61, the fund
will be used for the for the procurement and utilization of biodiesel in order to fill the gap between
the market index price of conventional diesel of conventional diesel and the market index price of
biodiesel. The fund will be collected at a rate of USD50/ton of CPO and USD20-USD30 each ton of
processed palm oil products. The fund will be managed by a public service agency appointed by
Ministry of Finance.
If the levy generates sufficient revenue to bridge the gap between fossil fuels and biodiesel prices,
the levy will have significant implications for the Indonesian palm oil and biodiesel industries. CPO
production, which continues to grow, will face increased demand from domestic biodiesel
producers. As a result, CPO stocks are expected to moderate. Thus CPO exports may soften
slightly due to higher export prices resulted from the levy, according to Indonesia Palm Oil
Association (GAPKI).
Figure 40. Lower palm oil export Figure 41. Lower inventory due to El Nino
Source: Bloomberg, Daewoo Securities Research
Source: Bloomberg, Daewoo Securities Research
-
200
400
600
800
1,000
1,200
1,400
1,600
1,800
2005
2006
2007
2008
2009
2010
2011
2012
2013
2014
2015
('000 barrels) Production Consumption
-5.00
-3.00
-1.00
1.00
3.00
5.00
7.00
3/01
11/0
1
7/02
3/03
11/0
3
7/04
3/05
11/0
5
7/06
3/07
11/0
7
7/08
3/09
11/0
9
7/10
3/11
11/1
1
7/12
3/13
11/1
3
7/14
3/15
11/1
5
(%)
-
500
1,000
1,500
2,000
2,500
3,000
6/12
9/12
12/1
2
3/13
6/13
9/13
12/1
3
3/14
6/14
9/14
12/1
4
3/15
6/15
9/15
12/1
5
3/16
('000 tonnes)
-
500
1,000
1,500
2,000
2,500
1993
1994
1995
1996
1997
1998
1999
2000
2001
2002
2003
2004
2005
2006
2007
2008
2009
2010
2011
2012
2013
2014
2015
('000 tonnes)

Plantation
15
August 30, 2016
Daewoo Securities Indonesia Research
Changing in the reference rate of biodiesel
Indonesian biodiesel producers incurred heavy losses following the 2014 drop in crude oil prices.
This led to the abandonment of previous subsidy programs in February 2015 and the enactment of
a new biofuels price index formula in March 2015 through MEMR regulation 726/2015. Previously,
Indonesia’s biodiesel reference price was based on the Mean of Platts Singapore (MOPS) price.
According to MEMR 726, the MOPS price has been replaced by the current market price of CPO.
The new price formula covers biodiesel production costs and a 3% of margin. The government
expects the new biofuels price index formula to more accurately reflect market dynamics. Post
notes that revisions to the reference price have been ongoing throughout 2015, and as a result,
biofuel subsidies have not been provided for most of the calendar year. The reference price
formula is critical in determining the size of the payment subsidy to bridge the gap between
biodiesel and diesel, and therefore it is critical to meeting the new mandates. With this
implementation of the palm oil levy in July, the Indonesian Biofuel Producers Association expects
that the subsidy will be fully implemented in September at a 15% blended rate.
Figure 42. Crude oil price trend
Source: Bloomberg, Daewoo Securities Research
Indonesia biodiesel consumption outlook
The new biofuels mandatory program is expected to increase domestic biodiesel consumption. If
Indonesia continues on track with its blending mandate, it can consume 2.7bn liters in 2016F
(2015: 1.45bn liters), according to USDA. Under the new regulation, targeted blending rate for the
transportation and industrial sectors was lifted from 10% to 15% as of April 2015. However, some
concerns have been raised by industry associations and state electricity operator (PLN) regarding
the 25% targeted blending rate for electricity, noting that the mandated blend rate exceeds the
capacity of their generators.
Figure 43. Indonesia biodiesel consumption trend Figure 44. Biodiesel mandatory target history
Source: USDA, Daewoo Securities Research
Source: USDA, Daewoo Securities Research
220 258
670
1,048
1,600
-
200
400
600
800
1,000
1,200
1,400
1,600
1,800
2010 2011 2012 2013 2014
(mn liters)
1,076 1,297
1,641
2,017
4,000
-
500
1,000
1,500
2,000
2,500
3,000
3,500
4,000
4,500
2010 2011 2012 2013 2014
(mn liters)
-
20.0
40.0
60.0
80.0
100.0
120.0
11/1
0
3/11
7/11
11/1
1
3/12
7/12
11/1
2
3/13
7/13
11/1
3
3/14
7/14
11/1
4
3/15
7/15
11/1
5
3/16
(USD/barrel) WTI Brent

Plantation
16
August 30, 2016
Daewoo Securities Indonesia Research
Global palm oil prices outlook?
Global palm oil consumption is expected to increase and we expect supply disruption on the back
of La Nina. At the same time, we believe that global palm oil price movement shows positive
correlation with global crude oil price. We suspect that biofuel production has created a new
linkage between crude oil and palm oil. As a natural resource that is not renewable, market has
been concerned about the declining crude oil reserves; given crude oil is one of human needs which
cannot be discharged in our daily lives. Thus, during the search for new energy alternatives that
can be renewable, it turns out that palm oil can be used as an alternative to cater energy needs in
the future. We predict that global palm oil will reach USD636/ton and USD674/ton in 2016F and
2017F, respectively. Our global palm oil prediction is based on crude oil (Brent crude) price outlook
of USD45.0/barrel and USD47.0/barrel in 2016F and 2017F, respectively.
A 2016 survey of the academic literature finds that “most major oil price dating back to 1973 was
largely explained by shifts in the demand for crude oil”. As the global economy expands, so does
demand for crude oil. On supply side, crude oil is dependent on geological discovery, the legal and
tax framework for oil extraction, the cost of extraction, the availability and cost of technology for
extraction, and the political situation in oil-producing countries.
Figure 45. Strong correlation between palm oil price and Brent crude oil
Source: Bloomberg, Daewoo Securities Research
Figure 46. Vegetables oil price trend
Source: MPOB, Daewoo Securities Research
-
200.0
400.0
600.0
800.0
1,000.0
1,200.0
1,400.0
1,600.0
1,800.0
1/06
7/06
1/07
7/07
1/08
7/08
1/09
7/09
1/10
7/10
1/11
7/11
1/12
7/12
1/13
7/13
1/14
7/14
1/15
7/15
1/16
(USD/ton) Palm Oil Soybean Rapessed Oil
-20.0
-15.0
-10.0
-5.0
0.0
5.0
10.0
15.0
20.0
25.0
30.0
12/1
0
4/11
8/11
12/1
1
4/12
8/12
12/1
2
4/13
8/13
12/1
3
4/14
8/14
12/1
4
4/15
8/15
12/1
5
4/16
(%) CPO Brent

Plantation
17
August 30, 2016
Daewoo Securities Indonesia Research
Astra Agro Lestari (AALI IJ)
The old dinosaur
Initiate coverage on AALI with a Hold rating
We initiate coverage on Astra Agro Lestari (AALI) with a Hold rating and target price of
IDR15,850. AALI is the largest oil palm plantation area under our plantation coverage,
however, we believe that AALI will find it challenging to organically grow due to its old age
oil palm profile and its diversification to downstream business which offers lower gross
margin compared to upstream palm oil business (AALI’s gross margin for downstream: 4%
vs upstream: 23%). AALI has secured IDR4.8tr funds through the recent rights issue, which
will be used to reduce its USD debt exposures. While we are less optimistic that the
proceeds from the new shares issuance will boost AALI’s net profit margin going forward,
we believe reduced leverage should act as a positive impact on its share price.
Old plantation profile, a drag on productivity
A large portion of AALI’s plantation profile is old aged which represents 59.1% of the total
planted area. Our view is that this will squeeze FFB yield over the longer horizon. AALI’s
average plantation age stood at 14.7 years in 2015 (vs. 14.2 years in 2011). We suspect this
old age profile will rise further as moratorium in new oil palm plantation will act as a key
hurdle for the company to acquire new land bank. We forecast that AALI’s FFB yield will
reach 21.7 ton/ha and 21.5 ton/ha in 2016F and 2017F, respectively. As a consequence, FFB
harvest from external parties (plasma & smallholders) will dominate AALI’s FFB harvest, in
our view. We are factoring in external parties’ FFB harvest to reach 4.20mn tons and
4.84mn tons in 2016F and 2017F. FFB harvest from external parties will weaken AALI’s CPO
and palm kernel extraction, given nucleus plantation is more efficient.
Improving in solvability could not help a much boost profitability margin
As a large portion of its proceeds from the recent rights issue will be used to pay off its
existing USD denominated debt, we believe AALI’s balance sheet will turn healthier. We are
modeling AALI’s net debt-to-equity ratio to reach 0.3x throughout 2016F and 2017F, down
from 0.6x in 2015. However, we are concern that AALI’s profitability margin will remain
challenged on the back of its focus on downstream business. Overall, we predict that AALI
gross, operating and net profit margin will reach 19.8%, 10.4% and 4.1%, from 23.6%,
14.2%, and 4.7% in 2015.
Valuations and target price at IDR15,850
We derive our target price of IDR15,850 on AALI using our DCF approach, assuming WACC
of 10.2% and terminal growth of 5.0% and PE target. In addition, we factored in the right
issue impact to deriving our valuation. Risks to our call are 1) sudden price spike/plunge in
global palm oil prices, 2) unexpected weather changes, 3) crude oil price fluctuations, and 4)
regulation risks.
FY (Dec.) 12/13 12/14 12/15 12/16F 12/17F
Revenue (IDRbn) 12,675.0 16,305.8 13,059.2 11,246.8 14,401.7
Gross profit (IDRbn) 4,081.9 4,951.8 3,082.1 2,227.7 2,731.5
Operating profit (IDRbn) 3,004.5 3,722.4 1,853.2 1,169.4 1,376.3
NP (IDRbn) 1,801.4 2,503.7 619.1 461.3 542.9
EPS (IDR) 935.9 1,300.8 321.7 202.8 238.7
BPS (IDR) 5,334.8 6,150.3 6,078.2 7,028.0 7,176.8
P/E (x) 25.6 17.8 47.0 78.5 66.7
ROE (%) 17.5 21.2 5.3 2.9 3.3
ROA (%) 12.0 13.5 2.9 2.0 2.2
Note: NP refers to net profit attributable to controlling interests
Source: Company data, Daewoo Securities Indonesia Research estimates
Agriculture
(Initiate) Hold
Target Price (12M, IDR) 15,850
Share Price (8/29/16, IDR) 15,925
Expected Return -0.5%
OP (16F, IDRbn) 1,169
Consensus OP (16F, IDRbn) 2,249
EPS Growth (16F, %) -37.0
Market EPS Growth (16F, %) 122.2
P/E (16F, x) 78.5
Market P/E (16F, x) 19.6
JCI (8/29/2016) 5,370.8
Market Cap (IDRbn) 30,650.7
Shares Outstanding (mn) 1,924.7
Free Float (%) 20.3
Foreign Ownership (%) 4.6
Beta (5Y) 1.0
52-Week Low (IDR) 13,126
52-Week High (IDR) 21,058
(%) 1M 6M 12M
Absolute 9.8 12.5 -7.5
Relative 6.9 0.0 -28.3

Plantation
18
August 30, 2016
Daewoo Securities Indonesia Research
Old age plantation profile dominates
As the one of the key crude palm oil (CPO) producers in Indonesia, AALI’s oil palm plantation is
spreading across Indonesia in Sumatera, Kalimantan, and Sulawesi regions. We note that AALI is
the only CPO operator with our CPO universe which has oil palm plantation exposure in Sulawesi.
AALI’s total mature oil palm area (nucleus and plasma) reached 258,536 ha in 2015, from 217,343
ha in 2011.
However, AALI’s immature plantation area decreased by 10,037 ha to 39,326 ha in 2015, from
49,363 ha in 2011. This reduction was largely due to the government’s moratorium policy of
opening new oil palm plantation implemented several years ago. In our opinion, AALI will find it
hard to organically grow as the government plans to extend its oil palm plantation moratorium. A
large portion of AALI’s plantation profile is old aged which represents 59.1% of the total planted
area. However, we note that AALI’s old aged plantation portfolio showed improvement (from 65%
(2012) to 59.1% (2015)) which was largely due to the replanting program which had been
implemented several years ago. Based on our discussion with AALI, the company is not expecting
to add new land banks (due to moratorium issue).
Figure 47. Old age profile dominated oil palm plantation Figure 48. Immature area down to 39,325ha in 2015
Source: Company data, Daewoo Securities Research
Source: Company data, Daewoo Securities Research
Old age plantation profile = lower FFB yield
The combination of old aged plantation profile and government’s moratorium on new palm
plantation, AALI’s average plantation age increased to 14.7 years in 2015 from 14.2 years in 2011.
We are concerned that AALI’s average age will rise further going forward and reach 14.8 years and
15.0 years in 2016F and 2017F, respectively. We also note that AALI’s FFB yield decreased further
to 21.7tons/ha in 2015, from 23.5tons/ha in 2012. Thus, we think that AALI’s FFB yield will only
reach 21.7ton/ha and 21.5ton/ha in 2016F and 2017F, respectively.
Figure 49. Average age stood at 14.7 years in 2015 Figure 50. FFB yield only reached 21.7 ton/ha in 2015
Source: Company data, Daewoo Securities Research
Source: Company data, Daewoo Securities Research
37.4 35.0 37.2 39.2 40.9
62.6 65.0 62.8 60.8 59.1
0.0
20.0
40.0
60.0
80.0
100.0
120.0
2011 2012 2013 2014 2015
(%)
Productive Old Age
49,363
38,564
33,891
42,662 39,326
-
10,000
20,000
30,000
40,000
50,000
60,000
2011 2012 2013 2014 2015
(ha)
14.2 14.2
13.8
14.2
14.7
13.2
13.4
13.6
13.8
14.0
14.2
14.4
14.6
14.8
2011 2012 2013 2014 2015
(Years)
22.1
23.5
20.7
22.0
21.7
19.0
19.5
20.0
20.5
21.0
21.5
22.0
22.5
23.0
23.5
24.0
2011 2012 2013 2014 2015
(ton/ha)

Plantation
19
August 30, 2016
Daewoo Securities Indonesia Research
Both CPO and palm kernel extraction rates will decline further
In 2011, AALI’s CPO extraction rate stood at 22.6% while palm kernel extraction rate stood at
4.6%. By 2015, AALI’s CPO extraction rate decreased further and reached 21.6%, falling below its
5-year average at 22.1%. Furthermore, AALI’s palm kernel extraction rate had improved to 4.9%,
and gradually slipped to 4.6% in 2015. Looking forward, we predict that AALI’s CPO extraction rate
will reach 21.5% and 21.4% in 2016F and 2017F, respectively, on the back of larger contribution of
external party harvest. We underscore that CPO and palm kernel extraction rates of external
parties (plasma & smallholder plantation) generally have lower efficiencies compared to nucleus
plantation due to the fact that nucleus plantation has better cultivation management than
external parties. We also forecast AALI’s palm kernel extraction rate to reach 4.5% and 4.4% in
2016F and 2017F.
Figure 51. CPO extraction rate below 5-years average Figure 52. Palm kernel extraction rate down significantly
Source: Company data, Daewoo Securities Research
Source: Company data, Daewoo Securities Research
Lower CPO production outlook in 2016F
We predict that AALI’s FFB harvest to reach 7.82mn tons and 8.39mn tons in 2016F and 2017F,
respectively. Furthermore, FFB harvest will be dominated by external parties which are expected to
reach 4.20mn tons and 4.83mn tons in 2016F and 2017F. At the same time, FFB harvest from
nucleus plantation is expected to fall to 3.61mn tons and 3.56mn tons in 2016F and 2017F on the
back of old aged plantation profile. Overall, we predict that AALI’s CPO production to reach
1.68mn tons and 1.79mn tons in 2016F and 2017F, respectively.
Figure 53. External parties will dominate FFB harvest Figure 54. Lower CPO production outlook in 2016F
Source: Company data, Daewoo Securities Research
Source: Company data, Daewoo Securities Research
22.6
22.322.3
21.9
21.6
21.0
21.2
21.4
21.6
21.8
22.0
22.2
22.4
22.6
22.8
2011 2012 2013 2014 2015
(%)
5-years average4.8
4.9
4.8
4.7
4.6
4.5
4.5
4.6
4.6
4.7
4.7
4.8
4.8
4.9
4.9
5.0
2011 2012 2013 2014 2015
(%)
-
1,000.0
2,000.0
3,000.0
4,000.0
5,000.0
6,000.0
2013 2014 2015 2016F 2017F
('000 tonnes) Nucleus External Parties
1,400.0
1,450.0
1,500.0
1,550.0
1,600.0
1,650.0
1,700.0
1,750.0
1,800.0
1,850.0
2013 2014 2015 2016F 2017F
('000 tonnes)

Plantation
20
August 30, 2016
Daewoo Securities Indonesia Research
Sales and net profit to contract in 2016F
We predict that AALI’s CPO sales volume to increase to 1.26mn tons and 1.44mn tons in 2016F
and 2017F, respectively (vs. 1.04mn tons in 2015). Meanwhile, we are less optimistic that AALI’s
revenue growth will expand due to moderate outlook in global palm oil prices. Therefore, we
predict that AALI’s revenue will only reach IDR11.3tr and IDR14.4tr in 2016F and 2017F,
respectively (-13.9% YoY and +28.1% YoY). On the bottom-line, we estimate AALI’s net profit to
reach IDR461.3bn and IDR542.9bn in 2016F and 2017F, respectively (-25.5% YoY and +17.7% YoY).
Figure 55. Higher CPO sales volume outlook Figure 56. Negative growth revenue in 2016F
Source: Company data, Daewoo Securities Research
Source: Company data, Daewoo Securities Research
Diversification to downstream will hamper AALI’s profitability over the long-term
In January 2015, the company had acquired a 50.0% in KL-Kepong Plantation Holdings Sdn, Bhd
which focuses more on downstream palm oil business. This refinery is located in Dumai, Riau
province. Yet, we are pessimistic that AALI’s profitability will improve over the long-term, given
CPO downstream business only offers thin gross margin at 4.0% compared to the upstream
business which yields 23.6%. We predict AALI’s gross, operating and net profit margins will decline
to 19.8%, 10.4% and 4.1% in 2016F.
Figure 57. Downstream business has lower gross margin Figure 58. Profitability margin
Source: Company data, Daewoo Securities Research
Source: Company data, Daewoo Securities Research
-
200.0
400.0
600.0
800.0
1,000.0
1,200.0
1,400.0
1,600.0
1,800.0
2013 2014 2015 2016F 2017F
('000 tonnes)
0.0
5.0
10.0
15.0
20.0
25.0
30.0
35.0
2013 2014 2015 2016F 2017F
(%)Gross Operating Net Profit
23.6
4.0
-
5.0
10.0
15.0
20.0
25.0
Upstream Downstream
(%)
-100.0
-80.0
-60.0
-40.0
-20.0
0.0
20.0
40.0
60.0
2013 2014 2015 2016F 2017F
(%)Revenue Net profit

Plantation
21
August 30, 2016
Daewoo Securities Indonesia Research
Figure 59. Lower net debt equity after right issue Figure 60. Improves in interest coverage ratio
Source: Company data, Daewoo Securities Research
Source: Company data, Daewoo Securities Research
Figure 61. ROE stand at single digit Figure 62. ROA will improve after 2016F
Source: Company data, Daewoo Securities Research
Source: Company data, Daewoo Securities Research
Figure 63. Current ratio will at 1.0x in 2016F & 2017F Figure 64. Lower capex going forward
Source: Company data, Daewoo Securities Research
Source: Bloomberg, Daewoo Securities Research
12.0
13.5
2.92.0 2.2
0.0
2.0
4.0
6.0
8.0
10.0
12.0
14.0
16.0
2013 2014 2015 2016F 2017F
(%)
17.5
21.2
5.3
2.9 3.3
0.0
5.0
10.0
15.0
20.0
25.0
2013 2014 2015 2016F 2017F
(%)
0.5
0.6
0.8
1.0 1.0
0.0
0.2
0.4
0.6
0.8
1.0
1.2
2013 2014 2015 2016F 2017F
(x)
0.2
0.3
0.6
0.30.3
0.0
0.1
0.2
0.3
0.4
0.5
0.6
0.7
2013 2014 2015 2016F 2017F
(x)
41.538.7
14.8
22.124.1
0.0
5.0
10.0
15.0
20.0
25.0
30.0
35.0
40.0
45.0
2013 2014 2015 2016F 2017F
(x)
2,861.5
3,278.2
2,586.3
915.4
682.1
-
500.0
1,000.0
1,500.0
2,000.0
2,500.0
3,000.0
3,500.0
2013 2014 2015 2016F 2017F
(IDR bn)

Plantation
22
August 30, 2016
Daewoo Securities Indonesia Research
Valuation
We use DCF approach to derive AALI’s 12-months forward target price at IDR13,350 with WACC
of 10.2% and terminal growth of 5.0%. Our target price reflects 78.2x and 66.4x P/E in 2016F and
2017F. We also use discounted to equity value by 60.0% with the assumption that AALI’s oil palm
productive profile only remains 40.0% of the total planted area.
Table 3. DCF valuation assumption
WACC (%)
Equity portion of capital 75.1
Ke 12
Debt portion of capital 24.9
Kd 4.7
Average WACC 10.2
Terminal value
Perpetual growth rate 5.0
Wacc-g 5.2
NPV 8,732.3
PV of TV 72,230.6
Net debt -5,024.9
Equity value 75,938.0
Equity value 30,375.2
Shares Outstanding (bn shares) 2.275
DCF Weighted 40.0%
PE Weighted 60.0%
DCF Target Price 13,352
PE Target Price 2,506
Blended Target Price 15,858
Source: Daewoo Securities Research
Figure 65. PE band
Source: Bloomberg, Daewoo Securities Research
0
5
10
15
20
25
30
35
9/11
12/1
1
3/12
6/12
9/12
12/1
2
3/13
6/13
9/13
12/1
3
3/14
6/14
9/14
12/1
4
3/15
6/15
9/15
12/1
5
3/16
6/16
(x)

Plantation
23
August 30, 2016
Daewoo Securities Indonesia Research
AALI at a glance
Company profile
AALI is a subsidiary of PT Astra International Tbk which was established in 1980, engages in the
agribusiness, specifically in the management of oil palm plantation and the production of palm oil.
The company manages oil palm plantation with locations spread over Sumatra, Kalimantan, and
Sulawesi, producing to meet the demands of both the domestic and export markets.
In 1997, the company became public by listing its shares on the Indonesia Stock Exchange.
Currently, public ownership of the shares reached 20.3% (out of 1.57bn shares in circulation) at
the end of 2015. In addition to strengthening its position at the upstream sector by managing an
area more than 200,000 hectare comprising nucleus and plasma plantation, the company has also
been strengthening its palm oil downstream business. Owning a palm oil refinery, PT Tanjung
Sarana Lestari in the Mamuju Utara regency, West Sulawesi and 50% shares in PT Kreasijaya
Adhikarya in Dumai, Riau Province, has significantly strengthened the company competitiveness
advantages in palm oil business chain.
Figure 66. AALI brief history
Source: Company data, Daewoo Securities Research
Figure 67. AALI’s ownership structure before right issue
Source: Company data, Daewoo Securities Research
Established in
1988, namely PT
Suryaraya
Cakrawala
Changed its
name to PT Astra
Agro Niaga in
1989
Merge between
PT Astra Agro
Niaga and
Suryaraya
Bahtera and
changed to PT
Astra Agro Lestari
in 1997
Go public in 1997

Plantation
24
August 30, 2016
Daewoo Securities Indonesia Research
Management
AALI is managed by an experienced management team. The profiles of the management team are
presented below as we cited from AALI’s annual report:
Prijono Sugiarto (President Commissioner)
An Indonesian citizen, he has been appointed as president commissioner of the company
since 2010. Currently, he is also PT Astra International Tbk (ASII) president director since
March 2010, president commissioner of PT United Tractors Tbk (UNTR), PT Astra Honda
Motor and PT Menara Astra. Previously, he was a director of ASII (2001 – 2010) and sales
engineering manager of Daimier-Benz Indonesia. He holds a diploma degree in
mechanical engineering from the University of A. Sc. Konstanz, German in 1984 and also
diploma degree in business administration from the University of A. Sc. Bochum, German
in 1986.
Chiew Sin Cheok (Vice President Commissioner)
A Malaysian citizen, he has been the vice president commissioner of the company since
2007. He is also commissioner of ASII and PT Astra Otoparts Tbk (AUTO), a member of
the advisory committee of PT Tunas Ridean Tbk (TURI) and alternate director of Cycle &
Carriage Bintang. He is on the Board of Governors of the Keswick Foundation, a
charitable body in Hong Kong. He graduated from the London School of Economics and
Political Science with a bachelor science degree and obtained a Master of Management
Scinece degree from the Imperial College of Science & Technology, London.
Johannes Loman (Commissioner)
An Indonesian citizen, he is appointed as a Commissioner of the Company in 14 April
2015. He is also a Commissioner of PT Musashi Auto Parts Indonesia, PT Showa Indonesia
Manufacturing since 2009 and PT Federal International Finance since 2007. In addition,
he also serves as President Commissioner of PT Suryaraya Rubberindo Industries, Vice
President Commissioner PT Astra Otopart Tbk, Executive Vice President Director in PT
Astra Honda Motor and Director in PT Astra International Tbk. He joined Astra in 1984
and previously held the position of CEO Honda Sales Operation, CEO Daihatsu Sales
Operation, Marketing Director of PT Astra Daihatsu Motor and PT Astra Honda Motor.
He graduated from the Parahyangan Catholic University in 1984.
Anugerah Pekerti (Independent Commissioner)
An Indonesian citizen, he has been an Independent Commissioner of the Company since
April 2011. Currently he serves as Independent Commissioner of UNTR and PT Samudera
Indonesia Tbk (SMDR), member of the Advisory Board of the National Human Rights
Commission and advisor to the Indonesian Physics Olympic Team. He was a lecturer at
the PPM Management Institute from 1968 and its President Director in 1988-1998. Since
1998 he has been actively involved in the implementation of good corporate governance
in various companies and non-profit organizations. He graduated from the Universitas
Indonesia in 1967, majoring in Psychology and acquired his Doctor of Philosophy degree
in Business Administration from the University of Southern California, USA in 1985.
Soemadi Djoko Moerdjono Brotodiningrat (Independent Commissioner)
Indonesian citizen, he was appointed as the Independent Commissioner of the Company
in April 2015. Currently, Soemadi is entrusted to head Indonesian Delegation to the EFTA
Indonesia Comprehensive Economic Partnership Agreement negotiation. He also serves
as Advisor on International Affairs to the Defense Minister and is a member of the Asia-
Europe Foundation Board of Governors and a lecturer at the Foreign Affairs Ministry’s
Center for Education and Training. Soemadi graduated from Department of International
Relations, Faculty of Social & Political Sciences, Gadjah Mada University in Yogyakarta in
1965 and from the Institut International d’Administration Publique–Section Diplomatique,
Paris in 1969.
Plantation
25
August 30, 2016
Daewoo Securities Indonesia Research
Widya Wiryawan (President Director)
An Indonesian citizen, he has been the Company President Director since May 2007.
Currently he also serves as a Director of ASII since May 2008. He joined Astra Group in PT
ASII in 1994. Previously, he served as Finance Director of PT Federal International Finance
(1997 - 2000), Finance Director of AUTO (2000-2005) and appointed as Vice President
Director of PT AUTO in 2006. He graduated from Bogor Institute of Agriculture and
holds a Master of Business Administration from the University of Sydney, Australia.
Rudy (Independent Director)
An Indonesian citizen, he has been the Company Director since April 2013 and he was
appointed as the Company Independent Director since 14 April 2015. Previously he
served as a Finance Director of PT Asuransi Astra Buana (2009 – 2013) and Chief
Corporate Planning and Strategy of PT Astra International Tbk (2007 - 2009). He joined
Astra Group in 2000 and started his career in PT Charoen Pokphand Indonesia Tbk, Inti
Salim Corpora and PT Trimegah Securities. He graduated from University of Trisakti
majoring in Economic and holds a Master of Applied Finance from the University of
Melbourne, Australia.
Bambang Palgoenadi (Director)
An Indonesian citizen, he has been the Company Director since May 2000. He served as
the project leader in implementation of the plantation information system of the Astra
Agro Lestari Group (1995-1996) and served as the Company Deputy Director for
Production (1996 - 1998). He joined the Company in 1981. He completed his education
at the Bogor Institute of Agriculture in 1981, majoring in Agricultural Technology.
Juddy Arianto (Director)
An Indonesian citizen, he has been the Company Director since May 2007. He was
President Director of PT Menara Terus Makmur (2005 - 2007), he served as Director of
Federal Nittan Industries (2001-2004), previously appointed as Division Head of Bearing
Production of PT SKF Indonesia (1984-2000). He joined Astra Group in 1983. He
graduated from Universitas of Indonesia, majoring in Metallurgy.
Joko Supriyono (Director)
An Indonesian citizen, he has been a Company Director since May 2007. At the Company,
he was Deputy Director of Plantations and Mills Operation (2005 - 2007), he served as
Area Director (2002 - 2005), Division Head of Human Resources (2000 - 2002) and as
Personnel Department Head (1999 - 2000) after previously serving as Training &
Recruitment Department Head (1996 - 1997). He joined the Company in 1995 as
Training Department staff. He was an Instructor of Quality Management Consultant of
PT Wahana Kendali Mutu (1994 - 1995) and was Head of Afdeling at PT Perkebunan
Nusantara II, Medan (1986 - 1993). He graduated from Gadjah Mada University,
Yogyakarta majoring in Agriculture.
Jamal Abdul Nasser (Director)
An Indonesian citizen, he has been the Company Director since April 2011. Previously he
served as the Company Director of PT Denso Indonesia from 2008, after serving as the
Director of PT Kayaba Indonesia and PT Toyoda Gosei Safety System Indonesia. He joined
Astra Group in 1985 and started his career in PT SKF Indonesia, PT Federal Adiwira Serasi
and PT Adiwira Presisi Industri. He had served as Division Head of PT Astra Otoparts Tbk
in 2003 and was appointed as Deputy Chief Operation Officer in 2007. He graduated
from Bogor Institute of Agriculture in 1982, majoring in Agricultural Mechanization.

Plantation
26
August 30, 2016
Daewoo Securities Indonesia Research
Profit & Loss
Balance sheet
Year end Dec 31 (IDRbn) 2015 2016E 2017E 2018E
Year end Dec 31 (IDRbn) 2015 2016E 2017E 2018E
Revenue 13,059.2 11,246.8 14,401.7 16,371.1
Current assets
Cost of goods sold -9,977.1 -9,019.0 -11,670.2 -13,037.1
Cash & equivalents 294.4 275.1 185.6 184.3
Gross profit 3,082.1 2,227.7 2,731.5 3,334.0
Short-term financial asset - - - -
SG&A -1,228.9 -1,058.4 -1,355.3 -1,540.6
Account receivable 88.0 75.8 97.1 110.3
EBIT (Adj.) 1,853.2 1,169.4 1,376.3 1,793.4
Inventory 1,691.6 1,529.1 1,978.6 2,210.4
EBIT 1,853.2 1,169.4 1,376.3 1,793.4
Other current assets 740.1 572.4 689.9 898.5
Net interest income (loss) -97.7 -24.8 -27.1 -35.4
Non-current assets
Income (loss) from associcates 0.0 0.0 0.0 0.0
Net fixed assets 9,361.7 11,097.0 10,994.3 11,092.7
Others -579.9 -268.8 -318.4 -345.9
Investment 109.2 109.2 109.2 109.2
Recurring profit 1,175.5 875.8 1,030.8 1,412.1
Other long-term assets 9,227.3 9,423.5 10,260.2 11,217.7
Income tax -479.8 -357.5 -420.7 -576.4 Total assets 21,512.4 23,082.1 24,314.9 25,823.2
Net profit 619.1 461.3 542.9 743.7 Current liabilities
Net profit (Controlling Interest) 695.7 518.3 610.0 835.7 Account payable 733.5 663.1 858.0 958.5
Short-term debt 700.0 200.0 300.0 700.0
Growth & margins 2015 2016E 2017E 2018E Other current liabilities 2,088.6 1,538.4 1,704.7 1,948.7
Revenue growth -19.9 -13.9 28.1 13.7 Non-current liabilities
Gross profit growth -37.8 -27.7 22.6 22.1 Long-term debt 5,708.0 4,200.0 4,500.0 4,700.0
EBIT growth -50.2 -36.9 17.7 30.3 Other long-term liabilities 583.5 494.3 627.5 727.8
Net profit growth -75.3 -25.5 17.7 37.0 Total liabilities 9,813.6 7,095.8 7,990.3 9,035.0
EPS growth -75.3 -37.0 17.7 37.0 Controlling interests 11,284.8 15,572.3 15,910.6 16,374.2
Gross margin 23.6 19.8 19.0 20.4 Non-controlling Interest 414.0 414.0 414.0 414.0
EBIT margin 14.2 10.4 9.6 11.0 Shareholder's equity 11,698.8 15,986.3 16,324.6 16,788.1
Net profit margin 4.7 4.1 3.8 4.5 BVPS (IDR) 6,078.2 7,028.0 7,176.8 7,380.6
Cash Flow (Summarized)
Ratio analysis
Year end Dec 31 (IDRbn) 2015 2016E 2017E 2018E
Year end Dec 31 2015 2016E 2017E 2018E
Cash flow from operations
ROE (%) 5.3 2.9 3.3 4.4
Net profit 619.1 461.3 542.9 743.7
ROA (%) 2.9 2.0 2.2 2.9
Depr. & amortization 885.1 -1,250.2 814.7 847.3
Inventory days 17.0 17.0 17.0 17.0
Others -398.3 42.4 48.8 -64.7
Receivables days 2.5 2.5 2.5 2.5
Change in working capital -643.4 104.2 -275.8 -144.5
Payable days 26.8 26.8 26.8 26.8
Cash flow from investing
Net debt/equity (x) 0.6 0.3 0.3 0.4
Capital expenditure -2,189.5 -915.4 -682.1 -904.8
Interest cover (x) 14.8 22.1 24.1 28.0
Others -1,239.2 234.1 -866.8 -998.3
Cash flow from financing
Dividends -743.3 -173.8 -204.5 -280.2
Increase in equity -4.1 4,000.0 0.0 0.0
Increase in debt 3,305.9 -2,432.8 400.0 700.0
Others 90.9 -89.2 133.2 100.2
Beginning cash 611.2 294.4 275.1 185.6
Ending cash 294.4 275.1 185.6 184.3
Source: Company data, Daewoo Securities Research

Plantation
27
August 30, 2016
Daewoo Securities Indonesia Research
PP London Sumatra Indonesia (LSIP IJ)
Prime time to bear fruit
Initiate coverage on LSIP with a Buy rating
We initiate coverage on LSIP with a Buy rating and a target price of IDR2,040. PP London
Sumatra Indonesia (LSIP) is the plantation arm of Indofood Group (Indofood Sukses
Makmur; INDF) - or grandchild company of the Salim Group - focusing on the upstream palm
oil businesses. Salim Group is one of the largest conglomerates in Indonesia. We favor LSIP
due to its above industry average CPO extraction and also prime age oil palm plantation
profile. Furthermore, LSIP boasts a healthy balance sheet with zero interest bearing debt.
LSIP is our top pick among the plantation coverage.
LSIP has more than 30 plantation areas which are spread across Indonesia. LSIP has
diversified plantation areas including oil palm, rubber, cocoa and tea plantations. Meanwhile,
LSIP has 11 palm oil mills, which are located in North and South Sumatra provinces and also
in East Kalimantan province.
Stable CPO extraction rate outlook
LSIP’s CPO extraction rate reached 22.9% which stands above our CPO universe average of
22.3% as of 2015. We predict that LSIP’s CPO extraction will stabilize at 22.9% in 2016F
and 2017F, respectively. In addition, we believe that the company’s FFB nucleus will reach
1.47mn tons and 1.49mn tons in 2016F and 2017F, respectively on the back of its oil palm
plantation reaching the prime age category. We underscore that LSIP’s oil palm plantation
prime age will reach 59,778 ha.
Solid balance sheet with zero interest bearing debt
We predict that LSIP will have net cash position in its net gearing ratio over the long term
(i.e., zero interest bearing debt). That being said, we believe its liquid balance sheet is a key
advantage for the company. Although LSIP’s current ratio is expected to slip to 2.0x and
1.9x in 2016F and 2017F, respectively, we argue that it would remain far above 1.0x. We
also predict that LSIP’s ROA will remain stable at 6.3% in 2016F and 2017F, respectively.
LSIP is our pop pick among the CPO space
We value LSIP using the P/E multiple approach which is derived from our target P/E at 25.0x,
implying +2 standard deviation over the 5-year average. Our 12MF price target of IDR2,040
is undemanding due to its prime age oil palm plantation profile and net cash position. Our
target price embeds 25.0x 2016F P/E and 23.9x 2017F P/E. Risks to our call are 1) Sudden
price spike/plunge in global palm oil prices, 2) unexpected weather changes, 3) crude oil
price fluctuations, and 4) regulation risks.
FY (Dec.) 12/13 12/14 12/15 12/16F 12/17F
Revenue (IDRbn) 4,133.7 4,726.5 4,189.6 4,124.4 4,613.1
Gross profit (IDRbn) 1,253.5 1,636.4 1,115.8 1,087.5 1,179.6
Operating profit (IDRbn) 818.2 1,191.8 764.4 699.5 745.6
NP (IDRbn) 769.5 916.7 623.3 556.2 583.6
EPS (IDR) 112.8 134.4 91.4 81.5 85.5
BPS (IDR) 969.4 1,058.0 1,075.5 1,110.9 1,154.7
P/E (x) 17.1 14.1 14.4 19.0 18.1
ROE (%) 11.6 12.7 8.5 7.3 7.4
ROA (%) 9.6 10.6 7.0 6.3 6.3
Note: NP refers to net profit attributable to controlling interests
Source: Company data, Daewoo Securities Indonesia Research estimates
Agriculture
(Initiate) Buy
Target Price (12M, IDR) 2,040
Share Price (8/29/16, IDR) 1,545
Expected Return 32.0%
OP (16F, IDRbn) 699.5
Consensus OP (16F, IDRbn) 698.1
EPS Growth (16F, %) -10.8
Market EPS Growth (16F, %) -12.9
P/E (16F, x) 19.0
Market P/E (16F, x) 19.5
JCI (8/29/2016) 5,370.8
Market Cap (IDRbn) 10,541.3
Shares Outstanding (mn) 6,822.9
Free Float (%) 40.4
Foreign Ownership (%) 7.9
Beta (5Y) 0.6
52-Week Low (IDR) 1,015
52-Week High (IDR) 1,840
(%) 1M 6M 12M
Absolute 10.0 8.0 44.4
Relative 7.0 -4.5 23.6

Plantation
28
August 30, 2016
Daewoo Securities Indonesia Research
Above average CPO extraction rate
LSIP’s CPO extraction rate stood at 22.9% as of 2015, which was slightly higher than our coverage
CPO universe (22.3%; excluding LSIP, average extraction rate: 22.1%). In our view, LSIP’s good
quality seed is one of the key reasons why LSIP’s extraction rate is higher compared to its peers.
Nonetheless, AALI and SGRO’s extraction rate was below average, which stood at 21.6% and
21.0%, respectively. Meanwhile, the highest extraction rate was SSMS which stood at 23.7%. We
believe that LSIP’s current extraction rate will remain steady at 22.9% in 2016F and 2017F,
respectively.
LSIP is one of the few CPO manufacturers in Indonesia that operates oil palm seed cultivation,
namely SumBio. Sumbio is also sold to external parties. During 2015, LSIP’s R&D facility in oil palm
seeds continued to establish its reputation as premium oil palm seeds producing 15.3mn seeds
(+12.5% YoY) in 2015 SumBio R&D facility is located in North Sumatera.
Figure 68. CPO extraction rate in 2015 Figure 69. LSIP’s seeds production trends
Source: Company data, Daewoo Securities Research
Source: Company data, Daewoo Securities Research
FFB and CPO production trends
In 2011, LSIP’s FFB nucleus production stood at 1.29mn tons. In the following year (2012), the
company’s FFB nucleus production increased marginally to reach 1.31mn tons. By 2013, LSIP’s FFB
nucleus production shrank to 1.25mn tons – which was the lowest level in 5-years. This low FFB
production was chiefly due to the unfavorable weather conditions, FFB logistic problems, and
social issues in some areas. This led the company’s total CPO production to slip to 396,500 tons in
2013. By 2015, LSIP was able to demonstrate a solid recovery. Despite the El Nino effect, LSIP’s
FFB nucleus production came in at 1.39mn tons (+4.1% YoY) in 2015. The robust nucleus
production performance is clear evidence that LSIP was able to well-manage its plantation area.
We forecast that LSIP’s FFB nucleus production to reach 1.47mn tons and 1.49mn tons in 2016F
and 2017F, respectively.
Figure 70. FFB nucleus production Figure 71. CPO production
Source: Company data, Daewoo Securities Research
Source: Company data, Daewoo Securities Research
21.6
22.9
21.0
23.7
19.5
20.0
20.5
21.0
21.5
22.0
22.5
23.0
23.5
24.0
AALI LSIP SGRO SSMS
(%)
26.4 27.4
24.1
13.8 15.3
-
5.0
10.0
15.0
20.0
25.0
30.0
2011 2012 2013 2014 2015
(mn seeds)
1,150.0
1,200.0
1,250.0
1,300.0
1,350.0
1,400.0
1,450.0
2011 2012 2013 2014 2015
('000 tonnes)
340.0
360.0
380.0
400.0
420.0
440.0
460.0
480.0
500.0
2011 2012 2013 2014 2015
('000 tonnes)

Plantation
29
August 30, 2016
Daewoo Securities Indonesia Research
LSIP’s oil palm plantation is in its prime category
One of LSIP’s key advantage is that most of its oil palm plantation profile (59,778ha) falls within 7~
20 years – which is considered prime age profile. In addition, its young (4~ 6 years) oil palm
plantation area stood at 13,883ha. LSIP has more than 30 plantation areas spread across Indonesia
including oil palm, rubber, cocoa and tea plantation. Meanwhile, LSIP has 11 palm oil mills, which
are located in North and South Sumatra province and in East Kalimantan province as of 2015.
Figure 72. Oil palm plantation profile Figure 73. Plantation area distribution
Source: Company data, Daewoo Securities Research
Source: Company data, Daewoo Securities Research
Figure 74. Oil palm planted area Figure 75. Rubber planted area
Source: Company data, Daewoo Securities Research
Source: Company data, Daewoo Securities Research
4,995
59,778
13,883
-
10,000
20,000
30,000
40,000
50,000
60,000
70,000
4 - 6 years 7 - 20 years >20 years
(hectare)
-
10,000
20,000
30,000
40,000
50,000
60,000
70,000
80,000
90,000
2011 2012 2013 2014 2015
(hectare) Mature Immature
-
2,000
4,000
6,000
8,000
10,000
12,000
14,000
16,000
2011 2012 2013 2014 2015
(hectare) Mature Immature

Plantation
30
August 30, 2016
Daewoo Securities Indonesia Research
Palm oil still the backbone of LSIP’s revenue
The largest contributor to LSIP’s revenue is palm products, comprising 90.3% as of 2015. What’s
notable is that palm-related revenue contribution grew significantly which accounted for 80.5% in
2011. We highlight that its rubber segment contribution decreased from 12.7% of total revenue in
2011 to 5.9% in 2015. We ascribe the prolonged price deterioration of rubber to be the main
reason for the contribution squeeze. According to the management’s guidance, LSIP will continue
to focus on palm oil as the outlook for palm oil is relatively benign compared to rubber. That being
said, we predict rubber contribution to the company’s revenue to decline further.
Figure 76. Revenue portfolio in 2011 Figure 77. Revenue portfolio in 2015
Source: Company data, Daewoo Securities Research
Source: Company data, Daewoo Securities Research
Healthy balance sheet with zero debt
LSIP cash to total assets reached 8.3% in 2015 (vs. SGRO 10.4%, SSMS 7.5% and AALI 1.4% of
total asset). Since 2010, LSIP maintained its net cash position until 2015. We believe that LSIP will
be able to maintain its net cash status over the long-term due to its solid capital structure. We also
highlight that LSIP is the only palm oil company under our coverage which do not have interest
bearing liabilities.
Figure 78. Average cash to total asset at 6.9%
Source: Companies data, Daewoo Securities Research
80.5
12.7
5.8 0.9
Palm product
Rubber
Seeds
Others
90.3
5.9 2.31.5
Palm product
Rubber
Seeds
Others
1.4
8.3
10.4
7.5
0.0
2.0
4.0
6.0
8.0
10.0
12.0
AALI LSIP SGRO SSMS
(%)
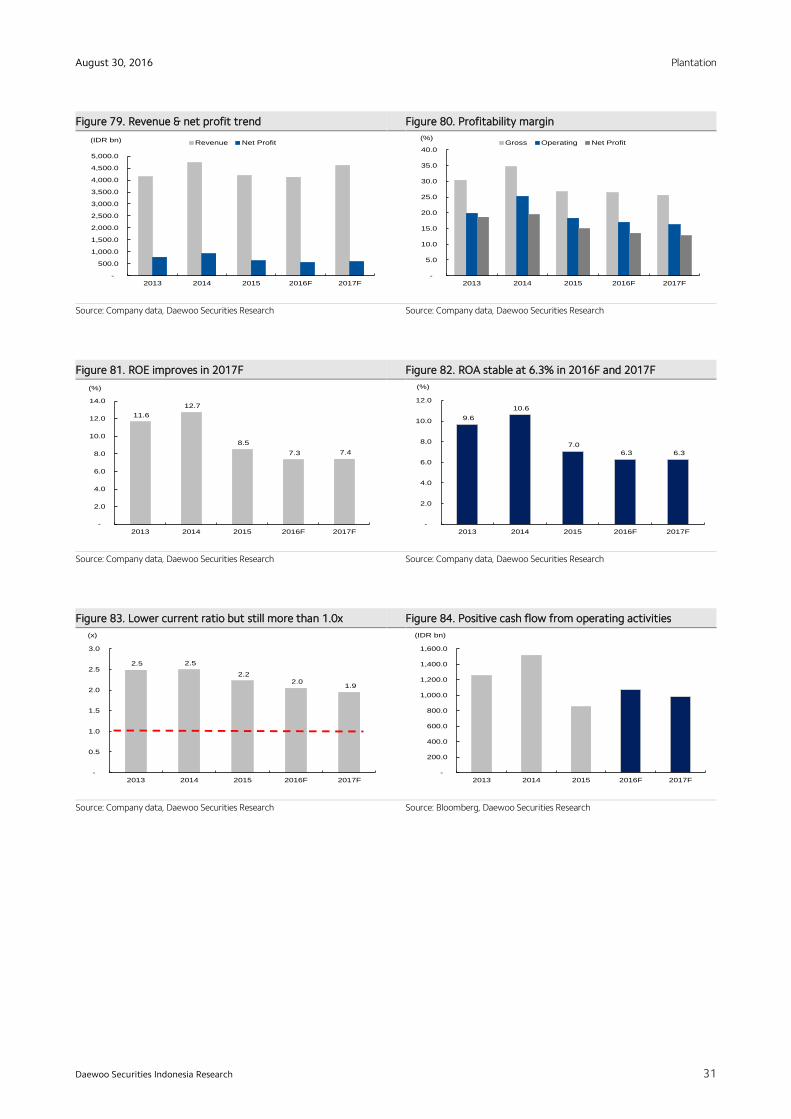
Plantation
31
August 30, 2016
Daewoo Securities Indonesia Research
Figure 79. Revenue & net profit trend Figure 80. Profitability margin
Source: Company data, Daewoo Securities Research
Source: Company data, Daewoo Securities Research
Figure 81. ROE improves in 2017F Figure 82. ROA stable at 6.3% in 2016F and 2017F
Source: Company data, Daewoo Securities Research
Source: Company data, Daewoo Securities Research
Figure 83. Lower current ratio but still more than 1.0x Figure 84. Positive cash flow from operating activities
Source: Company data, Daewoo Securities Research
Source: Bloomberg, Daewoo Securities Research
-
500.0
1,000.0
1,500.0
2,000.0
2,500.0
3,000.0
3,500.0
4,000.0
4,500.0
5,000.0
2013 2014 2015 2016F 2017F
(IDR bn) Revenue Net Profit
-
5.0
10.0
15.0
20.0
25.0
30.0
35.0
40.0
2013 2014 2015 2016F 2017F
(%)Gross Operating Net Profit
11.6
12.7
8.5
7.3 7.4
-
2.0
4.0
6.0
8.0
10.0
12.0
14.0
2013 2014 2015 2016F 2017F
(%)
9.6
10.6
7.0
6.3 6.3
-
2.0
4.0
6.0
8.0
10.0
12.0
2013 2014 2015 2016F 2017F
(%)
2.5 2.5
2.2 2.0
1.9
-
0.5
1.0
1.5
2.0
2.5
3.0
2013 2014 2015 2016F 2017F
(x)
-
200.0
400.0
600.0
800.0
1,000.0
1,200.0
1,400.0
1,600.0
2013 2014 2015 2016F 2017F
(IDR bn)

Plantation
32
August 30, 2016
Daewoo Securities Indonesia Research
Valuation
We use P/E valuation approach to derive LSIP’s target P/E of 25.0x implying +2 standard deviation
of its 5-year average P/E and present a target price of IDR2,040. Our P/E valuation approach is
justified by its prime age oil palm plantation profile and net cash position. Our target price is
reflects 25.0x 2016F P/E and 23.9x 2017F P/E.
Key risks to our investment thesis are unexpected changes in weather conditions where
transportation disruption may lead the company to be unable to deliver its FFB to the mills.
Furthermore, regulation risks both central and local government related to acquiring new land-
bank could also act as hurdles. Volatility in global palm oil price and global palm oil supply-demand
imbalance is also considered key risks.
Figure 85. PE band
Source: Bloomberg, Daewoo Securities Research
Figure 86. PBV band
Source: Bloomberg, Daewoo Securities Research
8
10
12
14
16
18
20
9/11
12/1
1
3/12
6/12
9/12
12/1
2
3/13
6/13
9/13
12/1
3
3/14
6/14
9/14
12/1
4
3/15
6/15
9/15
12/1
5
3/16
6/16
(x)
0
0.5
1
1.5
2
2.5
3
3.5
9/11
12/1
1
3/12
6/12
9/12
12/1
2
3/13
6/13
9/13
12/1
3
3/14
6/14
9/14
12/1
4
3/15
6/15
9/15
12/1
5
3/16
6/16
(x)

Plantation
33
August 30, 2016
Daewoo Securities Indonesia Research
LSIP at a glance
Company profile
The origin of LSIP, dates back to over more than a century ago in 1906, when the London-based
Harrisons & Crosfield Plc, a general trading and plantation management services firm, was
established near the city of Medan in North Sumatra, over the years, LSIP has evolved and grown
to become one of the world’s renowned plantation companies.
LSIP became publicly owned company since 1996 and included as part of Indofood Group in 2007
when IndoAgri, a subsidiary of PT Indofood Sukses Makmur Tbk (INDF IJ) in agribusiness, became
LSIP’s majority shareholders through its subsidiary in Indonesia, PT Salim Ivomas Pratama Tbk
(SIMP IJ). From the acquisition, LSIP becomes part of the synergy with other companies in
Indofood Group.
LSIP manages over 114,000 hectares of nucleus plantation estates in Sumatra, Java, Kalimantan,
and Sulawesi. LSIP also manages oil palm plantations under the plasma program. The palm oil mills
facilities in Sumatra and Kalimantan have a combined FFB processing capacity of 2.4mn tons per
annum. LSIP also operates several rubber processing facilities, a cocoa factory and tea factory.
Figure 87. LSIP brief history
Source: Company data, Daewoo Securities Research
Figure 88. LSIP’s ownership structure
Source: Company data, Daewoo Securities Research
Established in
1906 as a
general trading
and plantation
service
management firm
Developed oil
palm plantation in
1980
Go public in 1996
Included part of
Indofood Group
in 2007
IndoAgri
PT Salim Ivomas Pratama Tbk (SIMP)
London Sumatera Tbk (LSIP)
73.5%
59.5%
Public
40.4%

Plantation
34
August 30, 2016
Daewoo Securities Indonesia Research
Management
LSIP is managed by a qualified and experienced management team. The profiles of the
management team are presented below as cited by the company:
Paulus Moleonoto (President Commissioner)
Mr. Paulus Moleonoto was appointed as the President Commissioner of Lonsum based on
the resolution of AGM in 2015. Prior appointed as President Commissioner, he was first
appointed as a Director of Lonsum based on the resolution of the EGM in 2007 and re-
elected as Director of Lonsum based on the resolution of the AGM in 2010, and 2013,
and also as Vice President Director I based on the resolution of AGM in 2014. He is
concurrently a Director of PT Indofood Sukses Makmur Tbk, Executive Director and Head
of Finance & Corporate Services of Indofood Agri Resources Ltd., Vice President Director
of PT Salim Ivomas Pratama Tbk, and Commissioner of PT Indofood CBP Sukses Makmur
Tbk. He began his career in 1984 with Drs. Hans Kartikahadi & Co., a public accounting
firm in Jakarta. Mr. Paulus Moleonoto is a registered accountant in Indonesia. Before
joining the Plantations Division of the Indofood Group as Chief Financial Officer, he held
various management positions in the Salim Plantations Group. He has a Bachelor of
Accountancy degree from the University of Tarumanegara, and a Bachelor’s degree in
Management and a Master of Science degree in Administration & Business Policy from
the University of Indonesia. In 2015, he participated in training programs, workshops and
seminars, including “Indonesia Economic Outlook 2016” on 4 December 2015. He has no
affiliation with the members of the BOC, BOD of the Company, but he has affiliation with
the Company’s shareholders.
Axton Salim (Commissioner)
Mr. Axton Salim was first appointed as Commissioner of Lonsum based on the resolution
of the AGM in 2009 and re-elected in 2010 and 2013. He is concurrently Director of PT
Indofood Sukses Makmur Tbk, Director of PT Indofood CBP Sukses Makmur Tbk, where
he heads the Dairy Division and oversees the Beverages Division; Director of Pacsari Pte.
Ltd. and PT Indofood Asahi Sukses Beverage; Non-Executive Director of Indofood Agri
Resources Ltd. and Gallant Venture Ltd.; Vice President Director I of PT Indolakto; and
Commissioner of PT Salim Ivomas Pratama Tbk and PT Nestlé Indofood Citarasa
Indonesia. He also serves as Global Co-chair of Scaling Up Nutrition (SUN) Business
Network Advisory Group. Mr. Axton Salim has a Bachelor of Science in Business
Administration from the University of Colorado, USA. In 2015, he participated in training
programs, workshops and seminars, including “Indonesia Economic Outlook 2016” on 4
December 2015. He has no affiliation with the members of the BOC, BOD of the
Company, but he has affiliation with the Company’s shareholders.
Hendra Widjaja (Commissioner)
Mr. Hendra Widjaja was appointed as a Commissioner of Lonsum based on the resolution
of the AGM in 2009 and re-elected in 2010 and 2013. He concurrently serves as Director
of PT Indofood CBP Sukses Makmur Tbk, Director IV of PT Indolakto, Non-Executive
Director of China Minzhong Food Corporation Limited, and Commissioner of PT Salim
Ivomas Pratama Tbk. He was previously Director and Chief Financial Officer of PT
Indomarco Adi Prima. Mr. Hendra Widjaja has a Bachelor’s degree in Management and
Finance from the Catholic University of Atma Jaya in Jakarta. In 2015, he participated in
training programs, workshops and seminars, including “Indonesia Economic Outlook
2016” on 4 December 2015.
Plantation
35
August 30, 2016
Daewoo Securities Indonesia Research
Werianty Setiawan (Commissioner)
Ms. Werianty Setiawan was first appointed as a Commissioner of Lonsum based on the
resolution of the AGM in 2010 and was re-elected in 2013. She concurrently serves as a
Director of PT Indofood Sukses Makmur Tbk, Director of PT Indofood CBP Sukses
Makmur Tbk and Commissioner of PT Indofood Fritolay Makmur, PT Surya Rengo
Containers, PT Nestlé Indofood Citarasa Indonesia, PT Indolakto, and PT Inti Abadi
Kemasindo. Prior to joining Indofood she was Vice President, Treasury Marketing of
Chase Manhattan Bank N.A., Jakarta; Finance Director of SCTV; Managing Director of
various securities companies, including PT Natura Pacific Sekuritas, PT Danpac Sekuritas
and PT Victoria Kapitalindo International Sekuritas; and Commissioner of PT Jakarta
Setiabudi Internasional Tbk. Ms. Werianty Setiawan has a Bachelor of Science in
Accounting from San Francisco State University, California, USA. In 2015, she
participated in training programs, workshops and seminars, including “Indonesia
Economic Outlook 2016” on 4 December 2015.
Edy Sugito (Independent Commissioner)
Mr. Edy Sugito was appointed as Independent Commissioner of Lonsum based on the
resolution of the AGM in 2012 and was re-elected as Commissioner of Lonsum based on
the resolution of the AGM in 2013. Mr. Edy Sugito was awarded Bachelor of Accountancy
degree from Trisakti University, Jakarta. In 2015, he participated in training programs,
workshops and seminars, including A New Era of Transparency and Indonesian Tax
Amnesty on June 11, 2015.
Monang Silalahi (Independent Commissioner)
Mr. Monang Silalahi was appointed as Independent Commissioner of Lonsum based on
the resolution of the AGM in 2013. He concurrently serves as Director of PT Danpac
Sekuritas since 2003. Previously, he served as Director and Senior Management at PT
Victoria Kapitalindo International, PT Danasupra Erapacific, PT Natura Pacific and PT
Putra Swareka Perdana. He holds a Bachelor degree in Agriculture from Universitas
Sumatera Utara, Medan. In 2015, he participated in training programs, workshops and
seminars, including “Indonesia Economic Outlook 2016” on 4 December 2015. He has no
affiliation with the members of the Board of Commissioners or the Board of Directors
and shareholders of the Company.

Plantation
36
August 30, 2016
Daewoo Securities Indonesia Research
Benny Tjoeng (President Director)
Mr. Benny Tjoeng was appointed as the President Director of Lonsum based on the
resolution of the AGM in 2009 and was re-elected as President Director of Lonsum based
on the resolution of the AGM in 2010 and 2013. He oversees day to day operation of the
Company in North Sumatra area, East Kalimantan area, and other commodities. He
currently a President Director of several Company’s subsidiaries. He started his career
with SGV Prasetio Utomo Co as a Senior Auditor during 1984-1989 prior to joining PT
United Tractors Tbk as the Head of Accounting Department in 1990 and Head of
Accounting & Budgeting Division of PT Astra International Tbk in 1993. He subsequently
became Director of PT Astra Grafia Tbk in 1996, Director of PT Astro Agro Lestari Tbk
and held various Commissioner positions in several subsidiaries of PT Astra Agro Lestari
Tbk. He was later appointed as Vice President Director at that company from 2000 to
2006. His last position before joining Lonsum was President Director at PT Astra Sedaya
Finance from 2006 to 2008. Mr. Benny Tjoeng holds a Diploma Degree in Accountancy
from Jayabaya Accounting Academy an a Bachelor Degree from the University of
Indonesia, majoring in Financial Management. In 2015, he participated in training
programs, workshops and seminars, including “Indonesia Economic Outlook 2016” on 4
December 2015. He has no affiliation with the members of the Board of Commissioners
or the Board of Directors and shareholders of the Company.
Tan Agustinus Dermawan (Vice President Director)
Mr. Tan Agustinus Dermawan was first appointed as a Vice President Director I of
Lonsum based on the resolution of the AGM in 2015. Mr. Tan Agustinus Dermawan
oversees financial function of the Company. Mr. Tan Agustinus Dermawan is currently a
Director of PT Salim Ivomas Pratama Tbk and as a Director of several Company’s
subsidiaries. He previously worked as a Senior Auditor Accounting Firm Drs. Hans
Kartikahadi & Co. – Registered Public Accountant, Funding Supervisor at Sadang Mas
Group, Funding Manager and Assistant Vice President - Funding and Chief Operating
Officer (COO) of Sumatra Region at Salim Plantations Group). He was awarded a
Bachelor of Accountancy degree from the University of Tarumanegara Jakarta. During
2015, he participated in training programs, workshops and seminars, including “Indonesia
Economic Outlook 2016” on 4 December 2015. He has no affiliation with the members of
the BOC, BOD of the Company, but he has affiliation with the Company’s shareholders.
Tio Eddy Hariyanto (Vice President Director 2)
Mr. Tio Eddy Hariyanto was appointed as Vice President Director II of Lonsum based on
the resolution of the AGM in 2012 and was re-elected as Vice President Director II of
Lonsum based on the resolution of the AGM in 2013. Mr. Tio Eddy Hariyanto was
educated at Universitas Kristen Indonesia in major of Civil Engineering. In 2015, he
participated in training programs, workshops and seminars, including “Indonesia
Economic Outlook 2016” on 4 December 2015.
Mark Julian (Director)
Mr. Mark Julian Wakeford was first appointed as a Director of Lonsum based on the
resolution of the EGM in 2007 and was re-elected as a Director of Lonsum based on the
resolution of the AGM in 2010 and 2013. Mr. Mark Julian Wakeford trained and qualified
as a Chartered Accountant in London, England and attended the Senior Executive
Program at the London Business School.
Joefly Joesef Bahroeny (Director)
Mr. Joefly Joesoef Bahroeny was appointed as Director of Lonsum based on the
resolution of the EGM in 2007 and was re-elected as Director of Lonsum based on the
resolution of the AGM in 2010 and 2013, previously served as a Commissioner of Lonsum
based on the resolution of the EGM in 2004. Mr. Joefly Joesoef Bahroeny has graduated
from the University of New South Wales, Sydney, and has a Magister Management in
Agrobusiness from the University of North Sumatera, Medan.

Plantation
37
August 30, 2016
Daewoo Securities Indonesia Research
Profit & Loss
Balance sheet
Year end Dec 31 (IDR bn) 2015 2016E 2017E 2018E Year end Dec 31 (IDR bn) 2015 2016E 2017E 2018E
Revenue 4,189.6 4,124.4 4,613.1 5,187.5 Current assets
Cost of goods sold -3,073.8 -3,036.9 -3,433.5 -3,827.5 Cash & equivalents 737.1 923.1 956.3 980.1
Gross profit 1,115.8 1,087.5 1,179.6 1,360.0 Short-term financial asset - - - -
SG&A -351.5 -388.0 -434.0 -488.0 Account receivable 112.3 73.8 82.6 92.8
EBIT (Adj.) 764.4 699.5 745.6 871.9 Inventory 398.4 373.8 422.6 471.1
EBIT 764.4 699.5 745.6 871.9 Other current assets 1,042.2 928.1 1,046.5 1,168.8
Net interest income (loss) 52.9 80.6 76.9 76.4 Non-current assets
Income (loss) from associcates 0.0 0.0 0.0 0.0 Net fixed assets 3,428.0 3,591.3 3,782.2 4,006.5
Others 10.6 -58.7 -65.6 -73.8 Investment 806.5 806.5 806.5 806.5
Recurring profit 827.9 721.4 756.9 874.6 Other long-term assets 3,345.7 3,062.0 3,230.1 3,436.3
Income tax -185.6 -165.2 -173.3 -200.3 Total assets 8,848.8 8,863.4 9,316.4 9,834.3
Net profit 623.3 556.2 583.6 674.3 Current liabilities
Net profit (Controlling Interest) 623.3 556.2 583.6 674.3 Account payable 309.2 436.4 493.4 550.0
Short-term debt - - - -
Growth & margins 2015 2016E 2017E 2018E Other current liabilities 262.0 250.4 277.7 313.4
Revenue growth -11.4 -1.6 11.8 12.5 Non-current liabilities
Gross profit growth -31.8 -2.5 8.5 15.3 Long-term debt - - - -
EBIT growth -35.9 -8.5 6.6 16.9 Other long-term liabilities 939.7 596.8 666.9 750.2
Net profit growth -32.0 -10.8 4.9 15.5 Total liabilities 1,510.8 1,283.6 1,438.0 1,613.6
EPS growth -32.0 -10.8 4.9 15.5 Controlling interests 7,331.0 7,576.4 7,873.3 8,216.4
Gross margin 26.6 26.4 25.6 26.2 Non-controlling Interest 6.9 3.4 5.2 4.3
EBIT margin 18.2 17.0 16.2 16.8 Shareholder's equity 7,338.0 7,579.8 7,878.5 8,220.7
Net profit margin 14.9 13.5 12.7 13.0 BVPS (IDR) 1,075.5 1,110.9 1,154.7 1,204.9
Cash Flow Ratio analysis
Year end Dec 31 (IDRbn) 2015 2016E 2017E 2018E Year end Dec 31 2015 2016E 2017E 2018E
Cash flow from operations ROE (%) 8.5 7.3 7.4 8.2
Net profit 623.3 556.2 583.6 674.3 ROA (%) 7.0 6.3 6.3 6.9
Depr. & amortization 321.8 345.2 369.7 397.3 Inventory days 47.3 44.9 44.9 44.9
Others -20.7 -23.7 24.0 30.9 Receivables days 9.8 6.5 6.5 6.5
Change in working capital -180.6 190.3 -0.6 -2.2 Payable days 36.7 52.5 52.5 52.5
Cash flow from investing Net debt/equity (x) N.A N.A N.A N.A
Capital expenditure -514.3 -506.3 -566.3 -636.8 Interest cover (x) N.A N.A N.A N.A
Others -596.1 281.6 -162.4 -190.9
Cash flow from financing
Dividends -361.5 -273.2 -286.7 -331.3
Increase in equity 21.3 -41.2 1.7 -0.9
Increase in debt 0.0 0.0 0.0 0.0
Others 87.4 -342.9 70.1 83.3
Beginning cash 1,356.5 737.1 923.1 956.3
Ending cash 737.1 923.1 956.3 980.1
Source: Company data, Daewoo Securities Research

Plantation
38
August 30, 2016
Daewoo Securities Indonesia Research
Sampoerna Agro (SGRO IJ)
Challenges in the short term
Initiate coverage on SGRO with a Hold rating
We initiate coverage on Sampoerna Agro (SGRO) with a Hold recommendation and target
price of IDR1,875. SGRO is the CPO arm of Sampoerna family through Sampoerna Agri
Resources Pte Ltd. Sampoerna group is one of the largest conglomerate groups in Indonesia.
We believe SGRO has ample room to grow over the long-term on the back of stable CPO
extraction rate and its prime age plantation profile. However, we are concerned with its
high financial expenses burden, which should act as a key drag on earnings. Our earnings
projections over the next two years stand at IDR204.9bn (2016F) and IDR213.5bn (2017F)
from IDR247.6bn in 2015.
Higher nucleus FFB production lead higher CPO extraction rate
In 2007, SGRO’s FFB production was largely from plasma plantation which accounted for
64.0% of the total FFB production. The company realized that plasma plantation was
inefficient (i.e., low extraction and yield), thus, the company steered its strategy and
increased its nucleus FFB production through massive new planting. By 2014, SGRO’s FFB
production from nucleus plantation represented 52.0% of total FFB production. We credit
the company’s efforts and project higher FFB production contribution from nucleus, going
forward. All in all, we forecast SGRO’s CPO extraction rate to improve from 21.2% in 2015
to 22.1% in 2016F and 2017F, respectively,
Bleak outlook in the short-term, but rosy long-term outlook
Although SGRO’s top-line is expected to improve on the back of higher ASP, we are
concerned with the potential squeeze to its bottom-line due to high interest expenses. We
predict that SGRO’s revenue will reach IDR3.1tr and IDR3.4tr (+4.7% and +9.3% YoY) in
2016F and 2017F. However we expect SGRO’s net profit to fall to IDR204.9bn and
IDR213.5bn in 2016F and 2017F, respectively, from IDR247.6bn in 2015. Thus, SGRO’s net
profit margins are expected decline to 6.5% and 6.2% in 2016F and 2017F, respectively.
Lower ROE and has a downside potential
We use the P/E valuation methodology to derive our 12MF target price of SGRO given most
of SGRO’s plantation falls into the prime age category. We set our P/E target at 17.3x and
reflecting its mean 5-years average P/E. Furthermore, we project SGRO’s ROE will slip to
6.0% in 2016F and 2017F, respectively, from 7.2% in 2015.
FY (Dec.) 12/13 12/14 12/15 12/16F 12/17F
Revenue (IDRbn) 2,560.7 3,242.4 2,999.4 3,139.7 3,432.8
Gross profit (IDRbn) 498.1 868.6 833.6 872.5 962.6
Operating profit (IDRbn) 200.7 542.2 467.2 495.7 550.6
NP (IDRbn) 119.1 340.3 247.6 204.9 213.5
EPS (IDR) 63.0 180.1 131.0 108.4 113.0
BPS (IDR) 1,427.9 1,596.5 1,807.8 1,793.6 1,897.6
P/E (x) 31.7 11.7 13.0 18.3 17.5
ROE (%) 4.4 11.3 7.2 6.0 6.0
ROA (%) 2.6 6.2 3.4 2.5 2.6
Note: NP refers to net profit attributable to controlling interests
Source: Company data, Daewoo Securities Indonesia Research estimates
Agriculture
(Initiate) HOLD
Target Price (12M, IDR) 1,875
Share Price (8/29/16, IDR) 1,980
Expected Return -5.3%
OP (16F, IDRbn) 495.7
Consensus OP (16F, IDRbn) 507.1
EPS Growth (16F, %) -17.2
Market EPS Growth (16F, %) 4.4
P/E (16F, x) 18.3
Market P/E (16F, x) 14.5
JCI (8/29/2016) 5,370.8
Market Cap (IDRbn) 3,742.2
Shares Outstanding (mn) 1,890.0
Free Float (%) 27.2
Foreign Ownership (%) 76.2
Beta (5Y) 0.4
52-Week Low (IDR) 1,010
52-Week High (IDR) 2,030
(%) 1M 6M 12M
Absolute -0.5 8.8 41.4
Relative -3.5 -3.8 20.6
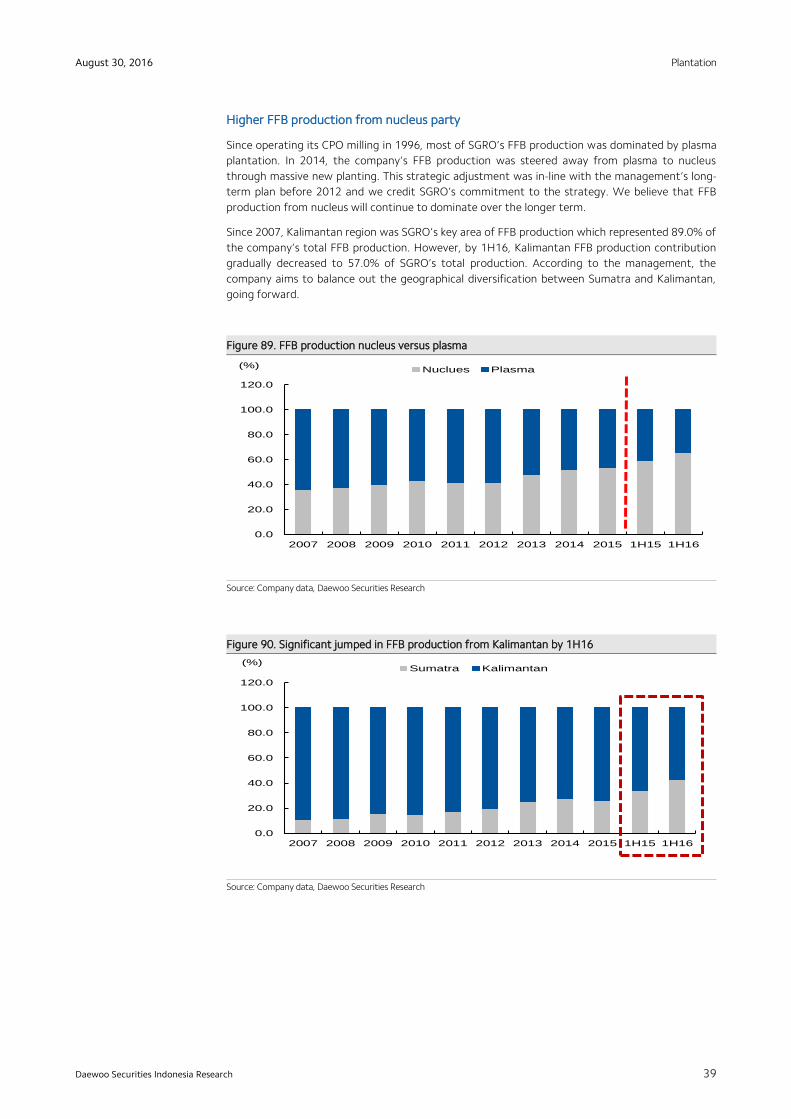
Plantation
39
August 30, 2016
Daewoo Securities Indonesia Research
Higher FFB production from nucleus party
Since operating its CPO milling in 1996, most of SGRO’s FFB production was dominated by plasma
plantation. In 2014, the company’s FFB production was steered away from plasma to nucleus
through massive new planting. This strategic adjustment was in-line with the management’s long-
term plan before 2012 and we credit SGRO’s commitment to the strategy. We believe that FFB
production from nucleus will continue to dominate over the longer term.
Since 2007, Kalimantan region was SGRO’s key area of FFB production which represented 89.0% of
the company’s total FFB production. However, by 1H16, Kalimantan FFB production contribution
gradually decreased to 57.0% of SGRO’s total production. According to the management, the
company aims to balance out the geographical diversification between Sumatra and Kalimantan,
going forward.
Figure 89. FFB production nucleus versus plasma
Source: Company data, Daewoo Securities Research
Figure 90. Significant jumped in FFB production from Kalimantan by 1H16
Source: Company data, Daewoo Securities Research
0.0
20.0
40.0
60.0
80.0
100.0
120.0
2007 2008 2009 2010 2011 2012 2013 2014 2015 1H15 1H16
(%)Nuclues Plasma
0.0
20.0
40.0
60.0
80.0
100.0
120.0
2007 2008 2009 2010 2011 2012 2013 2014 2015 1H15 1H16
(%)Sumatra Kalimantan

Plantation
40
August 30, 2016
Daewoo Securities Indonesia Research
Improvement in its CPO extraction rate
As a result of increased nucleus FFB production, SGRO’s CPO extraction rate improved to 22.1% in
1H16 (vs. 21.8% in 1H15). We also believe that SGRO’s CPO extraction rate will remain high at
22.1% in 2016F and 2017F, respectively compared to its previous year at 21.2%. Furthermore, we
also predict that SGRO’s palm kernel extraction rate will reach 6.0% in 2016F and 2017F,
respectively.
Figure 91. CPO extraction rate history Figure 92. Lower CPO production from February…
Source: Company data, Daewoo Securities Research
Source: Company data, Daewoo Securities Research
Plantation Profile
SGRO also produces sago and rubber commodities which are located in Sumatra, Kalimantan, and
Papua. For rubber, SGRO has 6,000ha of planted area and 100,000ha land banks. Meanwhile, SGRO
has 11,000ha of planted area and 85,000 ha land banks for sago production, respectively.
For oil palm, SGRO has 136,731ha (inclusive of nucleus & plasma) as of 1H16. Total planted nucleus
area stood at 83,438ha, representing 61.0% of total planted area. Based on the age profile
category, SGRO’s prime age plantation amounted to 41,460ha. Thus, we believe that SGRO has
ample room to grow over the long-term.
Figure 93. SGRO operational area Figure 94. Plantation area profile
Source: Company data, Daewoo Securities Research
Source: Company data, Daewoo Securities Research
20.7
21.7
21.2
21.8
22.1
20.0
20.5
21.0
21.5
22.0
22.5
2013 2014 2015 1H15 1H16
(%)
1,000
6,000
11,000
16,000
21,000
26,000
31,000
36,000
41,000
46,000
51,000
1/15
2/15
3/15
4/15
5/15
6/15
7/15
8/15
9/15
10/1
5
11/1
5
12/1
5
1/16
2/16
3/16
4/16
5/16
6/16
('000 tonnes)CPO Palm Kernel
17,815 18,959
32,531
14,133
5,326 4,858
8,929
34,180
-
10,000
20,000
30,000
40,000
50,000
60,000
Immature Young Prime Old
(hectare) Nucleus Plasma

Plantation
41
August 30, 2016
Daewoo Securities Indonesia Research
Diversification is yet to bear fruit
SGRO claimed that they are a diversified plantation company in Indonesia that has seed, rubber,
and also sago businesses. However, our judgement is that this diversification is yet to bear fruit
given the segments have low contribution to SGRO’s total revenue. By 1H16, SGRO main revenue
contributor was palm oil products such as palm oil and palm kernel which accounted for 80.0% and
11.0%, respectively. Meanwhile, the others only represented less than 10.0% to SGRO’s total
revenue.
Figure 95. Revenue from sago starch less significant to the total revenue
Source: Company data, Daewoo Securities Research
Low earnings visibility on higher interest expenses
We predict that SGRO’s revenue will reach IDR3.1tr and IDR3.4tr, growing 4.7% and 9.3% YoY in
2016F and 2017F, respectively. However, we predict that SGRO’s net profit will shrink to
IDR204.9bn and IDR213.5bn in 2016F and 2017F, respectively, from IDR247.6bn in 2015. We
forecast the company’s net profit margin to decline to 6.5% and 6.2% in 2016F and 2017F,
respectively. Our expectation for lower net profit margin is mainly due to higher interest expense
outlook.
Figure 96. SGRO’s monthly ASP Figure 97. Revenue and net profit outlook
Source: Company data, Daewoo Securities Research
Source: Company data, Daewoo Securities Research
4,000
4,500
5,000
5,500
6,000
6,500
7,000
7,500
8,000
8,500
(IDR/kg)
0.0
500.0
1,000.0
1,500.0
2,000.0
2,500.0
3,000.0
3,500.0
4,000.0
2013 2014 2015 2016F 2017F
(IDR bn)Revenue Net Profit

Plantation
42
August 30, 2016
Daewoo Securities Indonesia Research
Figure 98. Profitability margin Figure 99. ROA reach 2.5% and 2.6% in 2016F & 2017F
Source: Company data, Daewoo Securities Research
Source: Company data, Daewoo Securities Research
Figure 100. ROE stable at 6.0% in 2016F & 2017F Figure 101. Stable net debt to equity in 2016F & 2017F
Source: Company data, Daewoo Securities Research
Source: Company data, Daewoo Securities Research
Figure 102. Lower interest coverage Figure 103. Lower capex going forward
Source: Company data, Daewoo Securities Research
Source: Bloomberg, Daewoo Securities Research
0.0
5.0
10.0
15.0
20.0
25.0
30.0
2013 2014 2015 2016F 2017F
(%)Gross Operating Net Profit
2.6
6.2
3.4
2.5 2.6
0.0
1.0
2.0
3.0
4.0
5.0
6.0
7.0
2013 2014 2015 2016F 2017F
(%)
4.4
11.3
7.2
6.0 6.0
0.0
2.0
4.0
6.0
8.0
10.0
12.0
2013 2014 2015 2016F 2017F
(%)
0.40.5
0.6
1.01.0
0.0
0.2
0.4
0.6
0.8
1.0
1.2
2013 2014 2015 2016F 2017F
(x)
3.1
8.3
3.5
2.9 2.7
0.0
1.0
2.0
3.0
4.0
5.0
6.0
7.0
8.0
9.0
2013 2014 2015 2016F 2017F
(x)
0.0
200.0
400.0
600.0
800.0
1,000.0
1,200.0
2013 2014 2015 2016F 2017F
(IDR bn)

Plantation
43
August 30, 2016
Daewoo Securities Indonesia Research
Valuation
We use the P/E valuation methodology to derive SGRO’s 12MF target price given most of SGRO’s
plantation falls into the prime age category. We set our P/E target at 17.3x and reflecting its mean
5-years average P/E. Furthermore, we project SGRO’s ROE will slip to 6.0% in 2016F and 2017F,
respectively, from 7.2% in 2015.
Key risks to our investment thesis are drop in both CPO and palm kernel extraction rate from
plasma plantation. Furthermore, regulation risks both central and local government related to
acquisition of new land banks could act as hurdles. Volatility in global palm oil price and global palm
oil supply-demand imbalance is also considered key risks.
Figure 104. PE band
Source: Bloomberg, Daewoo Securities Research
Figure 105. PBV band
Source: Bloomberg, Daewoo Securities Research
0
5
10
15
20
25
30
9/11
12/1
1
3/12
6/12
9/12
12/1
2
3/13
6/13
9/13
12/1
3
3/14
6/14
9/14
12/1
4
3/15
6/15
9/15
12/1
5
3/16
6/16
(x)
0
0.5
1
1.5
2
2.5
3
9/11
12/1
1
3/12
6/12
9/12
12/1
2
3/13
6/13
9/13
12/1
3
3/14
6/14
9/14
12/1
4
3/15
6/15
9/15
12/1
5
3/16
6/16
(x)

Plantation
44
August 30, 2016
Daewoo Securities Indonesia Research
SGRO at a glance
Company profile
SGRO and subsidiaries is a plantation company that strives to become an integrated and diversified
plantation with sustainable long-term interests. Together with its 31 subsidiaries, the company
engages in the production of oil palm products, superior oil pam seeds (DxP Sriwijaya seeds), and
non-palm products that include sago (Prima Starch) and rubber products. Among the company’s
key products, crude palm oil and palm kernel made up the biggest share of total consolidated
revenue for the company, at 95% of total.
For SGRO, sustainability is articulated through green initiatives, including adhering to the highest
criteria for sustainable palm oil development and other environmentally-friendly benchmarks. At
the moment, SGRO has obtained various certifications in palm oil sector such as the Roundtable on
Sustainable Palm Oil (RSPO) and International Sustainability & Carbon Certification (ISCC)
certificates. SGRO has also complied with the local best practices under the Indonesian Sustainable
Palm Oil (ISPO) certification.
Fundamentally, the company has grown substantially within the last several years. For instance, at
the time of SGRO initial public offering (IPO) in 2007, the company had managed palm oil crop
with nucleus plantation size of 35,000 hectares. By end of 2015, SGRO palm oil plantation has
more than doubled, comprising over 80,000 hectares of nucleus plantation.
Figure 106. SGRO brief history
Source: Company data, Daewoo Securities Research
Figure 107. SGRO’s ownership structure
Source: Company data, Daewoo Securities Research
Establishment of
PT Aek Tarum,
the first company
within
Sampoerna
Group in 1976
First operation
CPO mill in 1996
Acquired PT
Sungai Rangit
Go public in 2007

Plantation
45
August 30, 2016
Daewoo Securities Indonesia Research
Management
SGRO is managed by a qualified and experienced management team. The profiles of the
management team are presented below as cited by the company:
Michael Sampoerna (President Commissioner)
An Indonesian citizen born on August 23, 1978, 37 years old, domiciled in Jakarta,
Indonesia. Mr. Sampoerna studied in London School of Economics, United Kingdom. Prior
to joining the Company, he served as the President Director of PT HM Sampoerna Tbk
from 2001 to 2005. He has served as the President Commissioner of the Company since
2007. He was reappointed as President Commissioner based on Deed No. 71, dated June
18, 2012, drawn by Mala Mukti, SH, LL. M. Currently, he also serves as the President
Commissioner, Commissioner and Director in a number of companies within Sampoerna
Strategic Group such as Samko Timber Ltd. and PT Sampoerna Strategic.
Hendra Prasetya (Commissioner)
An Indonesian citizen born on April 8, 1950, 65 years old, domiciled in Jakarta, Indonesia.
Mr. Prasetya received his Bachelor degree majoring in Civil Engineering in 1978 from
Petra Christian University, Surabaya. He has served as a Commissioner since 2012 based
on Deed No. 73 dated October 18, 2012, drawn by Mala Mukti, SH, LL. M. Currently, he
also serves as a Director at several companies within Sampoerna Strategic Group, one of
which is PT Sampoerna Bio Energi. Prior to joining the Company, he worked at PT HM
Sampoerna Tbk from 1980 to 2005 with last position as a Director.
Phang Cheow Hock (Independent Commissioner)
A Singaporean citizen born on September 1, 1932, 83 years old, domiciled in Singapore.
Mr. Phang received his Bachelor degree in 1950 from University of Cambridge, Australia.
He has served as an Independent Commissioner since 2007. He was reappointed as
Independent Commissioner based on Deed No. 71 dated June 18, 2012, drawn by Mala
Mukti, SH, LL. M. He has also served as an Independent Commissioner at PT HM
Sampoerna Tbk since 2001 up to present.
RB Permana Agung Dradjattun (Independent Commissioner)
An Indonesian citizen born on October 27, 1952, 63 years old, domiciled in Jakarta,
Indonesia. Mr. Dradjattun received his Doctor of Philosophy (Ph.D) in Public Policy from
University of Notre Dame, United States, in 1989. He has served as an Independent
Commissioner since 2013. He was appointed as Independent Commissioner based on
Deed No. 77 dated June 18, 2013, drawn by Mala Mukti, SH, LL. M. He has more than 24
years of professional life in the Directorate General of Customs and Excise, having last
position as the Director General of Customs and Excise.

Plantation
46
August 30, 2016
Daewoo Securities Indonesia Research
Ekadharmajanto Kasih (President Director)
An Indonesian citizen born on March 19, 1951, 64 years old, domiciled in Jakarta,
Indonesia. Mr. Kasih received his Bachelor degree majoring in Economics from University
of Indonesia in 1975. He has served as the President Director of the Company since 2008.
He was reappointed as President Director based on Deed No. 71 dated June 18, 2012,
drawn by Mala Mukti, SH, LL. M. Currently, he also serves as Non-Executive Director of
Samko Timber Ltd. Previously, he worked as a Commissioner at PT Sampoerna Agro Tbk
from 2007 to 2008. Since 1990, he has been working at PT HM Sampoerna Tbk and held
various positions included Commissioner, Chief Financial Officer, Director and Financial
Controller.
Marc Stephan Louis Loutte (Vice President Director)
A Belgian citizen born on December 14, 1965, 50 years old, domiciled in Jakarta,
Indonesia. Mr. Louette received his Master degree in Bio Agricultural Science from K.U.
Leuven, Belgium, in 1988, as well as Master of Business Administration from IMI, Belgium,
in 2004. He has served as the Vice President Director since 2012 based on Deed No. 71
dated June 18, 2012, drawn by Mala Mukti, SH, LL. M. Prior to joining PT Sampoerna
Agro Tbk, more than 23 years of his professional life was spent in multinational
companies, namely Asian Agri Group as the Managing Director and Socfin Group as the
Director of Plantation.
Budi Setiawan Halim (Finance Director)
An Indonesian citizen, born on January 19, 1971, 44 years old, domiciled in Jakarta,
Indonesia. Mr. Halim received his Bachelor degree majoring in Accounting from
Tarumanagara University in 1995. He has served as the Finance Director since 2012.
Hero Djajakusumah (Human Resources Director)
An Indonesian citizen born on March 31, 1966, 49 years old, domiciled in Jakarta,
Indonesia. Mr. Djajakusumah received his Master of Business Administration degree from
Western Michigan University, United States, in 1993. He has served as Human Resources
Director since 2011.
Dwi Asmono (Research & Development Director)
An Indonesian citizen born on April 6, 1965, 50 years old, domiciled in Jakarta, Indonesia.
Mr. Asmono received his Doctor of Philosophy (Ph.D) on Plant Breeding and Genetics
from Iowa State University, United States, in 1998. He has served as the Research and
Development Director since 2007.
Lim King Hui (Commercial Director)
An Indonesian citizen born on January 8, 1964, 51 years old, domiciled in Jakarta,
Indonesia. Mr. Lim received his Bachelor of Science degree in Finance and Management
Information Systems from State University of New York, United States, in 1989. He has
served as the Commercial Director since 2012.

Plantation
47
August 30, 2016
Daewoo Securities Indonesia Research
Profit & Loss
Balance sheet
Year end Dec 31 (IDR bn) 2015 2016E 2017E 2018E Year end Dec 31 (IDR bn) 2015 2016E 2017E 2018E
Revenue 2,999.4 3,139.7 3,432.8 3,808.8 Current assets
Cost of goods sold -2,165.9 -2,267.3 -2,470.3 -2,689.8 Cash & equivalents 759.6 652.2 431.3 464.5
Gross profit 833.6 872.5 962.6 1,119.1 Short-term financial asset 0.0 0.0 0.0 0.0
SG&A -366.4 -376.8 -411.9 -457.1 Account receivable 314.7 375.1 410.1 455.0
EBIT (Adj.) 467.2 495.7 550.6 662.0 Inventory 469.4 881.7 960.7 1,046.0
EBIT 467.2 495.7 550.6 662.0 Other current assets 62.3 213.6 233.5 259.1
Net interest income (loss) -112.4 -161.0 -191.2 -187.4 Non-current assets
Income (loss) from associcates 0.0 0.0 0.0 0.0 Net fixed assets 1,909.3 2,130.6 2,416.6 2,733.6
Others 41.4 -62.8 -68.7 -152.4 Investment 0.0 0.0 0.0 0.0
Recurring profit 396.2 271.8 290.8 322.2 Other long-term assets 3,779.3 3,879.1 3,771.8 3,579.7
Income tax -140.3 -62.5 -72.7 -80.6 Total assets 7,294.7 8,132.3 8,224.0 8,537.9
Net profit 247.6 204.9 213.5 236.6 Current liabilities
Net profit (Controlling Interest) 255.9 209.3 218.1 241.7 Account payable 404.8 317.0 345.3 376.0
Short-term debt 475.9 654.0 789.0 1,000.0
Growth & margins 2015 2016E 2017E 2018E Other current liabilities 383.8 140.0 156.5 173.3
Revenue growth -7.5 4.7 9.3 11.0 Non-current liabilities
Gross profit growth -4.0 4.7 10.3 16.3 Long-term debt 2,122.8 3,490.4 3,191.8 3,011.4
EBIT growth -13.8 6.1 11.1 20.2 Other long-term liabilities 490.5 140.9 154.9 171.9
Net profit growth -27.3 -17.2 4.2 10.8 Total liabilities
EPS growth -27.3 -17.2 4.2 10.8 Controlling interests 3,117.9 3,372.0 3,567.7 3,784.6
Gross margin 27.8 27.8 28.0 29.4 Non-controlling Interest 298.9 18.0 18.7 20.7
EBIT margin 15.6 15.8 16.0 17.4 Shareholder's equity 3,416.8 3,390.0 3,586.4 3,805.3
Net profit margin 8.3 6.5 6.2 6.2 BVPS (IDR) 1,807.8 1,793.6 1,897.6 2,013.4
Cash Flow Ratio analysis
Year end Dec 31 (IDR bn) 2015 2016E 2017E 2018E Year end Dec 31 2015 2016E 2017E 2018E
Cash flow from operations ROE (%) 7.2 6.0 6.0 6.2
Net profit 247.6 204.9 213.5 236.6 ROA (%) 3.4 2.5 2.6 2.8
Depr. & amortization 224.0 -294.3 148.4 155.2 Inventory days 79.1 141.9 141.9 141.9
Others -31.8 -220.6 -3.4 -8.8 Receivables days 38.3 43.6 43.6 43.6
Change in working capital -206.1 -560.5 -85.6 -99.6 Payable days 68.2 51.0 51.0 51.0
Cash flow from investing Net debt/equity (x) 0.6 1.0 1.0 0.9
Capital expenditure -411.7 -892.6 -373.3 -410.9 Interest cover (x) 3.5 2.9 2.7 3.3
Others -818.6 865.9 46.2 130.8
Cash flow from financing
Dividends -68.0 -17.1 -17.8 -19.7
Increase in equity 194.6 -214.7 0.8 2.0
Increase in debt 1,082.8 1,371.2 -163.6 30.6
Others 326.9 -349.6 14.0 16.9
Beginning cash 194.6 759.6 652.2 431.3
Ending cash 759.6 652.2 431.3 464.5
Source: Company data, Daewoo Securities Research

Plantation
48
August 30, 2016
Daewoo Securities Indonesia Research
Sawit Sumbermas Sarana (SSMS IJ)
Young and energetic
Initiate coverage on SSMS with a Buy rating
We initiate coverage on Sawit Sumbermas Sarana (SSMS) with Buy recommendation and
present a target price of IDR2,150/share. SSMS is the CPO unit of PT Citra Borneo Indah. All
its oil palm plantation area are located in South Kalimantan, which we consider to be a key
advantage for the company as Kalimantan has stable weather conditions compared to
Sumatra. SSMS has the highest CPO yield within our CPO universe. This competitive
advantage will lead SSMS’ profitability margin on track to continued expansion. Given SSMS
has young oil palm age at 7.5 years as of 1H16, we are optimistic that SSMS has ample
potential to grow over the longer term.
The highest CPO yield among peers
We like the company’s fundamental as it boasts the highest CPO yield (5.4 tons/ha) among
our CPO universe (average at 4.0 tons/ha) as of 1H16. With good cultivation management
through using high-yielding 2nd generation seeds from major providers, such as London
Sumatera (LSIP/ Buy), Socfin, Damimas, and Topas AsianAgri, we believe that SSMS’ CPO
yield will remain on a stable trajectory, going forward. We notice that SSMS’ CPO extraction
jumped by 200bps to 23.8% in 1H16, from 21.8% in 2013. With abundant production
capacity and good infrastructures (e.g., short distance between oil palm plantation areas to
mill), we forecast SSMS’ CPO extraction will remain stable at 23.0%, going forward.
Double-digit profitability margins despite lower revenue in 2016F
Even though we predict that SSMS’ revenue will decline to IDR2.30tr in 2016F, from
IDR2.37tr in 2015, we believe SSMS is able to deliver double-digit profitability margin in the
mid-term supported by its high CPO yield. We underscore that SSMS is relatively efficient
compared to other CPO companies under our coverage. Our lower revenue projection
factors in lower sales volume which is expected to decline to 259,400 tons in 2016F, from
301,200 tons in 2015.
Upside potential more than 20.0%, compare to current price
We use the P/E valuation methodology to derive our 12MF target price of IDR2,150/share,
implying an upside of 30.7%. Supported by its young oil palm age profile (at 7.5 years), we
believe SSMS has huge leg room to fill, going forward. Our key investment risks are 1)
sudden price spike/plunge in global palm oil prices, 2) crude oil price fluctuations, and 3)
infrastructure disruptions.
FY (Dec.) 12/13 12/14 12/15 12/16F 12/17F
Revenue (IDRbn) 1,962.4 2,616.4 2,371.9 2,301.5 2,850.8
Gross profit (IDRbn) 1,013.0 1,319.6 1,247.9 1,380.7 1,591.4
Operating profit (IDRbn) 889.2 991.5 880.0 992.0 1,118.4
NP (IDRbn) 576.8 736.3 559.0 591.8 669.1
EPS (IDR) 60.6 77.3 58.7 62.1 70.2
BPS (IDR) 238.6 287.7 318.5 365.0 417.7
P/E (x) 13.5 21.5 33.2 26.5 23.4
ROE (%) 25.4 26.9 18.4 17.0 16.8
ROA (%) 15.6 10.9 8.0 7.7 7.9
Note: NP refers to net profit attributable to controlling interests
Source: Company data, Daewoo Securities Indonesia Research estimates
Agriculture
(Initiate) Buy
Target Price (12M, IDR) 2,150
Share Price (8/29/16, IDR) 1,645
Expected Return 30.7%
OP (16F, IDRbn) 992.0
Consensus OP (16F, IDRbn) 997.0
EPS Growth (16F, %) 5.9
Market EPS Growth (16F, %) 12.1
P/E (16F, x) 26.5
Market P/E (16F, x) 24.9
JCI (8/29/2016) 5,370.8
Market Cap (IDRbn) 15,668.6
Shares Outstanding (mn) 9,525.0
Free Float (%) 26.7
Foreign Ownership (%) 1.2
Beta (5Y) 0.9
52-Week Low (IDR) 1,520
52-Week High (IDR) 2,075
(%) 1M 6M 12M
Absolute -1.8 -16.9 2.2
Relative -4.8 -29.5 -18.6

Plantation
49
August 30, 2016
Daewoo Securities Indonesia Research
Young and energetic
43.0% of SSMS’ total planted area is prime-age oil palm which means that theoretical FFB
yield at peak could reach until 32.0tons/ha. Furthermore, 28.0% of total planted area is
categorized as young trees (maximum FFB yield could at 28.0tons/ha) and 29.0% of total
planted area which falls into the immature category. The oil palm demographic shows SSMS’
average tree age of 7.5 years, which we believe should award the company with stable
longer term growth outlook.
Figure 108. Average age at 7.5 years Figure 109. SSMS’ theoretical FFB yield
Source: Company data, Daewoo Securities Research
Source: Company data, Daewoo Securities Research
The highest CPO yield among others
Even though SSMS’ FFB yield (21.5tons/ha) falls below AALI (21.7tons/ha), its FFB yield
remains above our CPO universe average which stands at 17.6tons/ha. Surprisingly, SSMS’
CPO yield is the highest (5.4tons/ha) among peers, followed by LSIP, AALI and SGRO that
reach 4.1, 3.5, and 3.0 tons/ha, respectively. A good cultivation through high-yielding 2nd
generation seeds from major providers, such as London Sumatra (LSIP/ Buy), Socfin,
Damimas, and Topas AsianAgri is the key reason behind SSMS’ high CPO yield, in our view.
Figure 110. Higher than average Figure 111. The highest CPO yield among peers
Source: Company data, Daewoo Securities Research
Source: Company data, Daewoo Securities Research
21.7
17.8
9.3
21.5
0.0
5.0
10.0
15.0
20.0
25.0
AALI LSIP SGRO SSMS
(tonnes/ha)
Average 17.6 tonnes/ha
3.5
4.1
3.0
5.4
0.0
1.0
2.0
3.0
4.0
5.0
6.0
AALI LSIP SGRO SSMS
(tonnes/ha)
Average 4.0tonnes/ha
43.0
28.0
29.0
Prime
Young
Immature
(%)
Average Age at 7.5 years
0.0
5.0
10.0
15.0
20.0
25.0
30.0
35.0
1 2 3 4 5 6 7 8 9 10 11 12 13 14 15 16 17 18 19 20 21 22 23 24 25 26
(tonnes/ha)
High growth phase
Prime ageDecline phase

Plantation
50
August 30, 2016
Daewoo Securities Indonesia Research
Table 4. SSMS’ land area
Subsidiary Area (ha) Infrastructure (ha) Total (ha)
Planted Unplanted
Sawit Sumbermas Sarana 20,124 14 2,611 22,749
Mitra Mendawai Sejati 8,389 50 1,909 10,348
Kalimantan Sawit Abadi 5,982 929 361 7,272
Sawit Multi Utama 15,571 1,014 863 17,448
Tanjung Sawit Abadi 10,833 2,544 1,532 14,909
Menteng Kencan Mas 7,258 7,674 5,868 20,800
Mirza Pratama Putra 2,782 1,764 1,879 6,425
Source: Company data, Daewoo Securities Research
Lower FFB production due to El Nino effects
Since going public in 2013, SSMS underwent massive expansion through organic and
inorganic growth. Therefore, the company’s immature planted area jumped to 20,141
hectares in 1h16, from 678 hectares in 2013. Furthermore, young oil palm plantation area
increased to 20,082 hectares in 1H16, from 14,611 hectares in 2013. We underscore that
the company’s prime-age oil palm area almost doubled to 30,717 hectares in 1H16, from
17,951 hectares in 2013.
Unfortunately, SSMS’ nucleus FFB production came down to 499,893 tons in 1H16 (-22.9%
YoY). This lower production was mainly due to El Nino which occurred last year. Going
forward, SSMS predicts that FFB production will decline 10.0% - 12.0% YoY, compared to a
year earlier. Using conservative assumptions, we predict that SSMS’ FFB nucleus production
will be reduced to 942,951 tons and 1.05mn tons in 2016F and 2017F, respectively.
Figure 112. Massive growth Figure 113. Nucleus FFB production trends
Source: Company data, Daewoo Securities Research
Source: Company data, Daewoo Securities Research
0
5,000
10,000
15,000
20,000
25,000
30,000
35,000
2013 2014 2015 1H15 1H16
(hectares)Immature Young Prime
711.1
808.3
1,094.5
648.3
499.9
0.0
200.0
400.0
600.0
800.0
1,000.0
1,200.0
2013 2014 2015 1H15 1H16
('000 tonnes)

Plantation
51
August 30, 2016
Daewoo Securities Indonesia Research
Higher production capacity despite palm oil production fell in 1H16
SSMS has six palm oil mills which are located in Sulung, Natai Raya, Suayap, Selangkun,
Malata, and Nanga Kiu. The aggregated capacity of the six mills are 375 tons/hour as of
1H16 (vs. 315 tons/hour as of 1H15), which represents a utilization rate of 52%. While the
utilization rate seems relatively low, SSMS cited that the company aims to prepare for the
peak harvesting season.
We notice that SSMS’ CPO extraction jumped by 200bps to 23.8% in 1H16, from 21.8% in
2013. With abundant production capacity and good infrastructures (e.g., short distance
between oil palm plantation areas to mill), we forecast SSMS’ CPO extraction will remain
stable at 23.0%, going forward. Furthermore, one of the benefits of high production
capacity is that it tends to reduce FFA of palm oil, award the company to be labeled
premium quality (<5% of FFA). We note that SSMS’ products are priced slightly higher
compared to its peers (which has higher FFA).
Figure 114. Production capacity per hour trends Figure 115. Lower palm oil prod. was due to lower FFB prod.
Source: Company data, Daewoo Securities Research
Source: Company data, Daewoo Securities Research
Figure 116. CPO extraction rate jumped more than 200bps until 1H16
Source: Company data, Daewoo Securities Research
255 255
375
315
375
0
50
100
150
200
250
300
350
400
2013 2014 2015 1H15 1H16
(tonnes/hour)
0.0
50.0
100.0
150.0
200.0
250.0
300.0
350.0
2013 2014 2015 1H15 1H16
('000 tonnes)CPO PK CPKO
21.8
23.523.7 23.7
23.8
20.5
21.0
21.5
22.0
22.5
23.0
23.5
24.0
2013 2014 2015 1H15 1H16
(%)
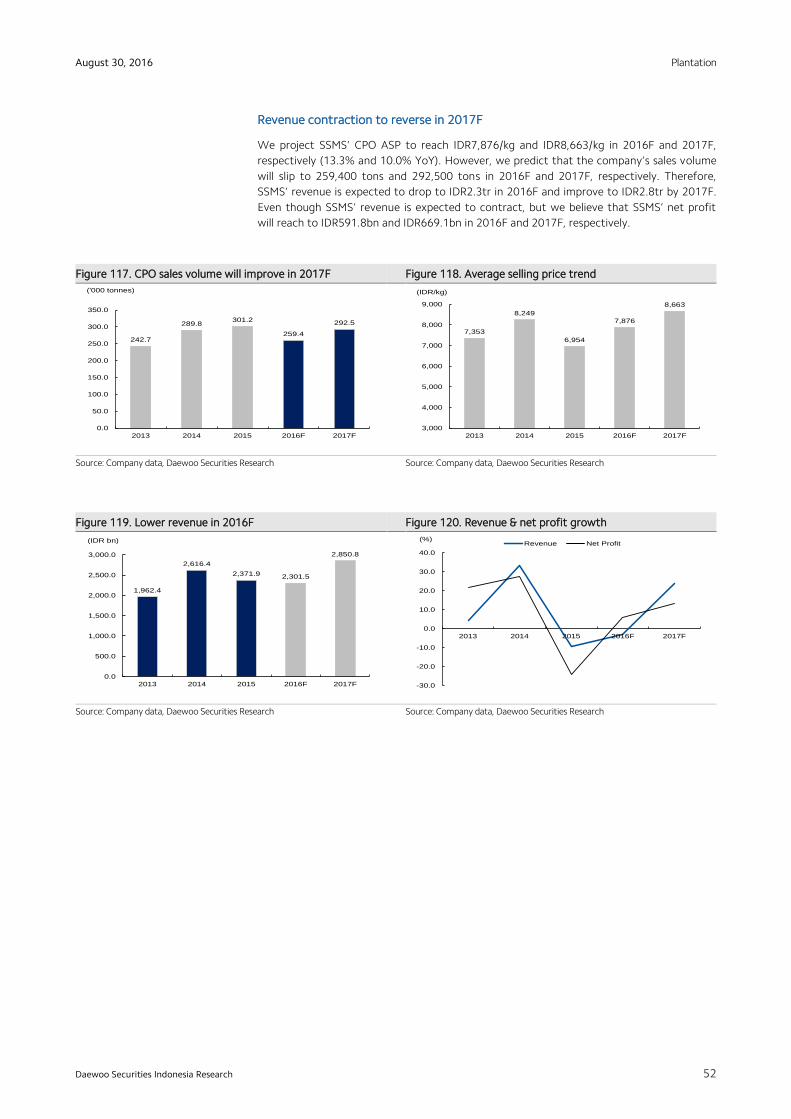
Plantation
52
August 30, 2016
Daewoo Securities Indonesia Research
Revenue contraction to reverse in 2017F
We project SSMS’ CPO ASP to reach IDR7,876/kg and IDR8,663/kg in 2016F and 2017F,
respectively (13.3% and 10.0% YoY). However, we predict that the company’s sales volume
will slip to 259,400 tons and 292,500 tons in 2016F and 2017F, respectively. Therefore,
SSMS’ revenue is expected to drop to IDR2.3tr in 2016F and improve to IDR2.8tr by 2017F.
Even though SSMS’ revenue is expected to contract, but we believe that SSMS’ net profit
will reach to IDR591.8bn and IDR669.1bn in 2016F and 2017F, respectively.
Figure 117. CPO sales volume will improve in 2017F Figure 118. Average selling price trend
Source: Company data, Daewoo Securities Research
Source: Company data, Daewoo Securities Research
Figure 119. Lower revenue in 2016F Figure 120. Revenue & net profit growth
Source: Company data, Daewoo Securities Research
Source: Company data, Daewoo Securities Research
242.7
289.8301.2
259.4
292.5
0.0
50.0
100.0
150.0
200.0
250.0
300.0
350.0
2013 2014 2015 2016F 2017F
('000 tonnes)
7,353
8,249
6,954
7,876
8,663
3,000
4,000
5,000
6,000
7,000
8,000
9,000
2013 2014 2015 2016F 2017F
(IDR/kg)
1,962.4
2,616.4
2,371.9 2,301.5
2,850.8
0.0
500.0
1,000.0
1,500.0
2,000.0
2,500.0
3,000.0
2013 2014 2015 2016F 2017F
(IDR bn)
-30.0
-20.0
-10.0
0.0
10.0
20.0
30.0
40.0
2013 2014 2015 2016F 2017F
(%)Revenue Net Profit

Plantation
53
August 30, 2016
Daewoo Securities Indonesia Research
Figure 121. Operating profit improves Figure 122. Higher net profit in 2016F and 2017F
Source: Company data, Daewoo Securities Research
Source: Company data, Daewoo Securities Research
Figure 123. Profitability margin Figure 124. Lower capex in 2016F
Source: Company data, Daewoo Securities Research
Source: Bloomberg, Daewoo Securities Research
Figure 125. Improves in net debt to equity Figure 126. Lower interest coverage ratio
Source: Company data, Daewoo Securities Research
Source: Company data, Daewoo Securities Research
0.0
200.0
400.0
600.0
800.0
1,000.0
1,200.0
2013 2014 2015 2016F 2017F
(IDR bn)
0.0
100.0
200.0
300.0
400.0
500.0
600.0
700.0
800.0
2013 2014 2015 2016F 2017F
(IDR bn)
0.0
10.0
20.0
30.0
40.0
50.0
60.0
70.0
2013 2014 2015 2016F 2017F
(%)Gross Operating Net Profit
0.1
0.5
0.9
0.8 0.8
0.0
0.1
0.2
0.3
0.4
0.5
0.6
0.7
0.8
0.9
1.0
2013 2014 2015 2016F 2017F
(x)
7.2
4.9
4.3
3.3 3.3
0.0
1.0
2.0
3.0
4.0
5.0
6.0
7.0
8.0
2013 2014 2015 2016F 2017F
(x)
0.0
200.0
400.0
600.0
800.0
1,000.0
1,200.0
2013 2014 2015 2016F 2017F
(IDR bn)

Plantation
54
August 30, 2016
Daewoo Securities Indonesia Research
Valuation
We use P/E valuation approach to derive SSMS’ 12MF target price as most of SSMS’
plantation falls into the prime age category with average plantation age profile at 7.5 years.
We set our P/E target at 34.2x which was derived by applying +2 standard deviation of the
5-year average P/E.
Key risks to our investment thesis are infrastructure disruptions that could weaken its
logistics. Furthermore, regulation risks both central and local government related to
acquiring new land-bank could also act as hurdles. Volatility in global palm oil price and
global palm oil supply-demand imbalance is also considered key risks.
Figure 127. PE band
Source: Bloomberg, Daewoo Securities Research
Figure 128. PBV band
Source: Bloomberg, Daewoo Securities Research
20
25
30
35
40
45
12/15 1/16 2/16 3/16 4/16 5/16 6/16
(x)
2
3
4
5
6
7
8
12/13
2/14
4/14
6/14
8/14
10/14
12/14
2/15
4/15
6/15
8/15
10/15
12/15
2/16
4/16
6/16
(x)

Plantation
55
August 30, 2016
Daewoo Securities Indonesia Research
SSMS at a glance
Company profile
SSMS was established at Pangkalan Bun, Central Kalimantan, on 22 November, 1995, with
an aim to grow the business and a commitment to become world class manufacturer. The
company has carried out an Initial Public Offering (IPO) on December 12, 2013 and listed its
shares on the Indonesian Stock Exchange (IDX).
In carrying out its integrated business activities, the company manages eleven palm oil
plantations, four mills, and a palm kernel processing plant. Through the implementation of
plantation management which is based on the best business practices, the company is
committed to boosting sustainable business growth, and further maintaining environmental
sustainability and community development. Supported by competent human resources,
effective business processes, and innovation excellence, the company is optimistic in
realizing its vision to become a world-class plantation company while creating added value
for shareholders.
Figure 129. SSMS brief history
Source: Company data, Daewoo Securities Research
Figure 130. SSMS’ ownership structure
Source: Company data, Daewoo Securities Research
Established in
1995
Go public in 2013
Acquiring 26,400
ha of oil palm
plantation on
February 2015
Acquiring 5,857
ha of oil palm
plantation on
November 2015

Plantation
56
August 30, 2016
Daewoo Securities Indonesia Research
Management
SSMS is managed by a qualified and experienced management team. The profiles of the
management team are presented below as cited by the company:
Bungaran Saragih (President Commissioner)
Bungaran Saragih is an Indonesian citizen. He was born in Siantar on 1945 (70
years). He serves as the President Commissioner of the Company since August
2013 and at the same time also serves as President Commissioner of PT Citra
Borneo Indah, Commissioner of PT Rea Kaltim Plantations, and Chairman of the
Board of Trustees at The Borneo Orangutan Survival Foundation (BOSF).
Previously, he also served as Minister of Agriculture in the Ministry of Agriculture
of the Republic of Indonesia (‘Gotong Royong’ Cabinet for the period of 2001 -
2004), Minister of Agriculture and Forestry in the Ministry of Agriculture and
Forestry of the Republic of Indonesia (‘Persatuan’ Cabinet for the period of 2000 -
2001), Director of Development Studies Center, Bogor Agricultural University
(1992 - 2000), Lecturer and Researcher at the same University (1968-2015). He
received a Doctor of Philosophy in Economics from the North Carolina State
University, Raleigh, USA in 1980.
Marzuki Usman (Independent Commissioner)
Marzuki Usman is an Indonesian citizen who was born in Mersam, Jambi, on 1943
(72 years). He served as a Commissioner/Independent Commissioner at the
Company since August 2013 and at the same time also serves as a Commissioner
of PT Cipaganti Group, President Commissioner of PT Restoration Habitat
Orangutan Indonesia (RHOI), the Board of Commissioners of PT AIA Financial,
Chairman of the Advisory Board of Mazars Asia Pacific,Commissioner of PT Cahaya
Pelangi Persada, President Commissioner of PT Nusantara Plantation VI (Persero),
Commissioner of PT Alam Sutera, Advisor to the PT Moores Rowland Indonesia
Advisory, Chairman’s Advisor and member of the Duke University Islamic Studies
Centre up to now. He used to hold several important positions namely,
Commissioner of the Futures Exchange (2001-2006), Minister of Forestry in the
Ministry of Forestry of the Republic of Indonesia (March 2001-Aug 2001), Head of
the Representative Faction in the Parlement (MPR) (1999-2002), State Minister of
Investment/Chairman of the Investment Coordinating Board (BKPM) (May -
October 1999), Minister of Tourism, Arts and Cultureof the Republic of Indonesia
(1998-1999). He got his Master of Arts of Economy from Duke University Durham,
North Carolina, USA, in 1975.

Plantation
57
August 30, 2016
Daewoo Securities Indonesia Research
Rimbun Situmorang (President Director)
Rimbun Situmorang is an Indonesian citizen and was born in Banaera on 1967 (48
years). He serves as Chief Director since August 2013 and currently also serves as
Director of PT CBI (2011 - present), Chief of Commissioner of PT KSA (2011 -
present) and PT SMU (2009 - present). Previously, he had active career as Director
of PT ASP (2009 - 2011), Commissioner of PT SMU (2009 - 2011), Director of PT
TSA (2009 - 2011), Director of PT SML (2005-2007), Director of PT SMU (2005 -
2007), Director of PT CBI (2005 - 2007), Director of PT KSA (2000 - 2007), Director
of the Company (2005 - 2007), Director of PT TSA (2005-2007), Director of PT
MMS (2005-2007), Commissioner of PT CBI (2000 - 2003), Marketing Manager at
PT Mendawai Putri(1997 - 1999), Head of Commerce of PT Barito Putra Nirvana
(1994-1997), Forestry & Shipping Staff at PT Rimba Karya Borneo (1992 - 1994).
He received degree in Mechanical Engineering from the Institute of Technology
Tumpal Dorianus Pardede in 1989.
Harry M. Nadir (Non-affiliated Director)
Harry M. Nadir is an Indonesian citizen and was born in Jakarta on 1960 (55 years).
He serves as Non-Affiliated Director since August 2013. Previously, he served as
Director (CFO) of PT Bakrie Sumatera Plantations (2001 - 2012).
Vallauthan Subraminam (Director)
Vallauthan Subraminam is a Malaysian citizen and was born in Johor, Malaysia on
1954 (61 years). He serves as Director at the Company since August 2013.
Previously, he served as Regional Head of PT CBI (2007-2012).
Ramzy Sastra (Director)
Ramzi Sastra is an Indonesian citizen. He was born in Pematang Siantar on 1971
(44 years). He serves as Director of the Company since August 2013. Concurrently,
he serves as Director of PT Kalimantan Sawit Abadi and Commissioner of PT
Tanjung Sawit Abadi since December 2013 until now and also serves as Director of
PT Citra Borneo Utama since March 2013 until now.

Plantation
58
August 30, 2016
Daewoo Securities Indonesia Research
Profit & Loss
Balance sheet
Year end Dec 31 (IDRbn) 2015 2016E 2017E 2018E Year end Dec 31 (IDRbn) 2015 2016E 2017E 2018E
Revenue 2,371.9 2,301.5 2,850.8 3,465.8 Current assets
Cost of goods sold -1,124.0 -920.7 -1,259.4 -1,639.9 Cash & equivalents 521.8 747.9 485.8 220.4
Gross profit 1,247.9 1,380.7 1,591.4 1,825.9 Short-term financial asset 0.0 0.0 0.0 0.0
SG&A -367.9 -388.7 -473.0 -537.6 Account receivable 822.7 798.3 988.8 1,202.1
EBIT (Adj.) 880.0 992.0 1,118.4 1,288.3 Inventory 164.2 -134.5 -184.0 -239.5
EBIT 880.0 992.0 1,118.4 1,288.3 Other current assets 224.3 223.9 229.9 239.8
Net interest income (loss) -110.1 -213.1 -238.4 -183.7 Non-current assets
Income (loss) from associcates 0.0 0.0 0.0 0.0 Net fixed assets 2,298.9 3,104.4 3,891.7 4,841.6
Others 5.5 5.3 6.6 8.0 Investment 0.0 0.0 0.0 0.0
Recurring profit 775.4 784.2 886.6 1,112.7 Other long-term assets 2,942.0 2,907.9 3,104.0 3,025.8
Income tax -188.3 -190.4 -215.3 -270.2 Total assets 6,973.9 7,647.8 8,516.2 9,290.2
Net profit 559.0 591.8 669.1 839.7 Current liabilities
Net profit (Controlling Interest) 559.0 591.8 669.1 839.7 Account payable 47.5 38.9 53.2 69.3
Short-term debt 16.6 18.2 19.0 18.5
Growth & margins 2015 2016E 2017E 2018E Other current liabilities 1,238.6 1,200.6 1,405.7 1,586.6
Revenue growth -9.3 -3.0 23.9 21.6 Non-current liabilities
Gross profit growth -5.4 10.6 15.3 14.7 Long-term debt 2,538.6 2,789.2 2,908.7 2,833.0
EBIT growth -11.2 12.7 12.7 15.2 Other long-term liabilities 98.6 95.8 118.4 144.0
Net profit growth -24.1 5.9 13.1 25.5 Total liabilities 3,939.8 4,142.7 4,505.1 4,651.5
EPS growth -24.1 5.9 13.1 25.5 Controlling interests 3,034.1 3,447.7 3,945.3 4,577.3
Gross margin 52.6 60.0 55.8 52.7 Non-controlling Interest 0.0 28.7 32.9 30.7
EBIT margin 37.1 43.1 39.2 37.2 Shareholder's equity 3,034.1 3,476.4 3,978.2 4,608.0
Net profit margin 23.6 25.7 BVPS (IDR) 318.5 365.0 417.7 483.8
Cash Flow Ratio analysis
Year end Dec 31 (IDRbn) 2015 2016E 2017E 2018E Year end Dec 31 2015 2016E 2017E 2018E
Cash flow from operations ROE (%) 18.4 17.0 16.8 18.2
Net profit 559.0 591.8 669.1 839.7 ROA (%) 8.0 7.7 7.9 9.0
Depr. & amortization 222.5 92.3 302.1 351.0 Inventory days 53.3 -53.3 -53.3 -53.3
Others 327.1 -94.7 169.7 189.5 Receivables days 126.6 126.6 126.6 126.6
Change in working capital -630.5 314.5 -126.7 -141.6 Payable days 15.4 15.4 15.4 15.4
Cash flow from investing Net debt/equity (x) 0.9 0.8 0.8 0.7
Capital expenditure -1,214.3 -855.5 -1,097.7 -1,162.7 Interest cover (x) 4.3 3.3 3.3 4.4
Others -226.2 -72.7 -196.2 -78.5
Cash flow from financing
Dividends 0.0 -148.0 -167.3 -209.9
Increase in equity -49.5 0.0 0.0 0.0
Increase in debt 1,317.3 309.2 149.6 -94.8
Others -256.9 89.1 35.2 42.1
Beginning cash 473.3 521.8 747.9 485.8
Ending cash 521.8 747.9 485.8 220.4
Source: Company data, Daewoo Securities Research

Plantation
59
August 30, 2016
Daewoo Securities Indonesia Research
Key Investment Risks
Global CPO supply-demand imbalance: We are concerned that global CPO supply-demand
imbalance could hamper global CPO price, placing negative impact on the financial
performance of CPO manufacturers.
Volatility in global crude oil price: We believe that global crude oil price - mainly Brent crude
oil – shows strong correlation with the global CPO price as biofuel production created a new
linkage between crude oil and palm oil. During times when global crude oil is low-priced,
biodiesel is less attractive to consume as an alternative.
Regulatory risks: Regulatory risks are unpredictable because regulators such as the central
government and local government are less communicative with the market. Furthermore, in
the short-term, our key concerns lie on the extension of the moratorium for oil palm
plantation which will act as key hurdles for CPO companies to acquire new land banks.
Weather and geographic risk: Weather for CPO business is one of the main risks and is
directly related to the production side. Extreme weather conditions such as El Nino and La
Nina could drive CPO production lower for palm oil companies.
Weak infrastructure: Infrastructure is one of critical factors in oil palm plantation. Bad
infrastructure such as bad roads could lead higher cost for CPO players.
Plantation
60
August 30, 2016
Daewoo Securities Indonesia Research
APPENDIX 1
Important Disclosures & Disclaimers
Stock Ratings Industry Ratings
Buy Relative performance of 20% or greater Overweight Fundamentals are favorable or improving
Trading Buy Relative performance of 10% or greater, but with volatility Neutral Fundamentals are steady without any material changes
Hold Relative performance of -10% and 10% Underweight Fundamentals are unfavorable or worsening
Sell Relative performance of -10%
* Ratings and Target Price History (Share price (----), Target price (----), Not covered (■), Buy (▲), Trading Buy (■), Hold (●), Sell (◆))
* Our investment rating is a guide to the relative return of the stock versus the market over the next 12 months.
* Although it is not part of the official ratings at Daewoo Securities, we may call a trading opportunity in case there is a technical or short-term material
development.
* The target price was determined by the research analyst through valuation methods discussed in this report, in part based on the analyst’s estimate of
future earnings.
The achievement of the target price may be impeded by risks related to the subject securities and companies, as well as general market and economic
conditions.
Analyst Certification
The research analysts who prepared this report (the “Analysts”) are registered with the Indonesian jurisdiction and are subject to Indonesian securities
regulations. They are neither registered as research analysts in any other jurisdiction nor subject to the laws and regulations thereof. Opinions expressed in
this publication about the subject securities and companies accurately reflect the personal views of the Analysts primarily responsible for this report. Except
as otherwise specified herein, the Analysts have not received any compensation or any other benefits from the subject companies in the past 12 months and
have not been promised the same in connection with this report. No part of the compensation of the Analysts was, is, or will be directly or indirectly related
to the specific recommendations or views contained in this report but, like all employees of PT Daewoo Securities Indonesia, the Analysts receive
compensation that is impacted by overall firm profitability, which includes revenues from, among other business units, the institutional equities, investment
banking, proprietary trading and private client division. At the time of publication of this report, the Analysts do not know or have reason to know of any
actual, material conflict of interest of the Analyst or PT Daewoo Securities Indonesia except as otherwise stated herein.
Disclaimers
This report is published by PT Daewoo Securities Indonesia (“Daewoo”), a broker-dealer registered in the Republic of Indonesia and a member of the
Indonesia Exchange. Information and opinions contained herein have been compiled from sources believed to be reliable and in good faith, but such
information has not been independently verified and Daewoo makes no guarantee, representation or warranty, express or implied, as to the fairness,
accuracy, completeness or correctness of the information and opinions contained herein or of any translation into English from the Bahasa Indonesia. If this
report is an English translation of a report prepared in the Indonesian language, the original Indonesian language report may have been made available to
investors in advance of this report. Daewoo, its affiliates and their directors, officers, employees and agents do not accept any liability for any loss arising
from the use hereof. This report is for general information purposes only and it is not and should not be construed as an offer or a solicitation of an offer to
effect transactions in any securities or other financial instruments. The intended recipients of this report are sophisticated institutional investors who have
substantial knowledge of the local business environment, its common practices, laws and accounting principles and no person whose receipt or use of this
report would violate any laws and regulations or subject Daewoo and its affiliates to registration or licensing requirements in any jurisdiction should receive
or make any use hereof. Information and opinions contained herein are subject to change without notice and no part of this document may be copied or
reproduced in any manner or form or redistributed or published, in whole or in part, without the prior written consent of Daewoo. Daewoo, its affiliates and
their directors, officers, employees and agents may have long or short positions in any of the subject securities at any time and may make a purchase or sale,
or offer to make a purchase or sale, of any such securities or other financial instruments from time to time in the open market or otherwise, in each case
either as principals or agents. Daewoo and its affiliates may have had, or may be expecting to enter into, business relationships with the subject companies to
provide investment banking, market-making or other financial services as are permitted under applicable laws and regulations. The price and value of the
investments referred to in this report and the income from them may go down as well as up, and investors may realize losses on any investments. Past
performance is not a guide to future performance. Future returns are not guaranteed, and a loss of original capital may occur.
Disclosures
As of the publication date, PT Daewoo Securities Indonesia, and/or its affiliates do not have any special interest with the subject company and do not own
1% or more of the subject company's shares outstanding.

Plantation
61
August 30, 2016
Daewoo Securities Indonesia Research
Distribution
United Kingdom: This report is being distributed by Daewoo Securities (Europe) Ltd. in the United Kingdom only to (i) investment professionals falling within
Article 19(5) of the Financial Services and Markets Act 2000 (Financial Promotion) Order 2005 (the “Order”), and (ii) high net worth companies and other
persons to whom it may lawfully be communicated, falling within Article 49(2)(A) to (E) of the Order (all such persons together being referred to as “Relevant
Persons”). This report is directed only at Relevant Persons. Any person who is not a Relevant Person should not act or rely on this report or any of its
contents.
United States: This report is distributed in the U.S. by Daewoo Securities (America) Inc., a member of FINRA/SIPC, and is only intended for major institutional
investors as defined in Rule 15a-6(b)(4) under the U.S. Securities Exchange Act of 1934. All U.S. persons that receive this document by their acceptance
thereof represent and warrant that they are a major institutional investor and have not received this report under any express or implied understanding that
they will direct commission income to Daewoo or its affiliates. Any U.S. recipient of this document wishing to effect a transaction in any securities discussed
herein should contact and place orders with Daewoo Securities (America) Inc., which accepts responsibility for the contents of this report in the U.S. The
securities described in this report may not have been registered under the U.S. Securities Act of 1933, as amended, and, in such case, may not be offered or
sold in the U.S. or to U.S. persons absent registration or an applicable exemption from the registration requirements.
Hong Kong: This document has been approved for distribution in Hong Kong by Daewoo Securities (Hong Kong) Ltd., which is regulated by the Hong Kong
Securities and Futures Commission. The contents of this report have not been reviewed by any regulatory authority in Hong Kong. This report is for
distribution only to professional investors within the meaning of Part I of Schedule 1 to the Securities and Futures Ordinance of Hong Kong (Cap. 571, Laws
of Hong Kong) and any rules made thereunder and may not be redistributed in whole or in part in Hong Kong to any person.
All Other Jurisdictions: Customers in all other countries who wish to effect a transaction in any securities referenced in this report should contact Daewoo or
its affiliates only if distribution to or use by such customer of this report would not violate applicable laws and regulations and not subject Daewoo and its
affiliates to any registration or licensing requirement within such jurisdiction.
Daewoo Securities International Network
PT. Daewoo Securities Indonesia Daewoo Securities Co. Ltd. (Seoul) Daewoo Securities (Hong Kong) Ltd.
Equity Tower 50th Floor
Jl.Jend Sudirman, SCBD Lot 9
Jakarta 12190
Head Office
14, Eunhaeng-ro, Yeongdeungpo-gu
Seoul 150-973
Korea
Suites 2005-2012
Two International Finance Centre
8 Finance Street, Central
Hong Kong
Tel: 62-21-515-1140 Tel: 82-2-768-3026 Tel: 85-2-2514-1304
Daewoo Securities (America) Inc. Daewoo Securities (Europe) Ltd. Daewoo Securities (Singapore) Pte. Ltd.
320 Park Avenue, 31st Floor.
New York, NY 10022
United States
41st Floor, Tower 42
25 Old Broad Street
London EC2N 1HQ
United Kingdom
Six Battery Road #11-01
Singapore, 049909
Tel: 1-212-407-1000 Tel: 44-20-7982-8000 Tel: 65-6671-9845
Tokyo Representative Office Beijing Representative Office Shanghai Representative Office
7F, Yusen Building, 2-3-2
Marunouchi, Chiyoda-ku
Tokyo 100-0005
Japan
2401A, 24th Floor. East Tower
Twin Tower, B-12 Jianguomenwai Avenue
Chaoyang District, Beijing 100022
China
Room 38T31, 38F SWFC
100 Century Avenue, Pudong New Area,
Shanghai, 200120
China
Tel: 81-3- 3211-5511 Tel: 86-10-6567-9699 Tel: 86-21-5013-6392
Ho Chi Minh Representative Office Daewoo Investment Advisory (Beijing) Co., Ltd Daewoo Securities (Mongolia) LLC
Suites 901B. Centec Tower
72-74 Nguyen Thi Minh Khai St, Ward 6
District 3, HCMC
2401B,24th Floor. East Tower
Twin Tower, B-12 Jianguomenwai Avenue
Chaoyang District, Beijing 100022
China
#406, Blue Sky Tower, Peace Avenue 17
1 Khoroo, Sukhbaatar District
Ulaanbaatar 14240
Mongolia
Tel: 84-8-3910-6000 Tel: 86-10-6567-9699 Tel: 976-7011-0807