AT 39.3/113 Mm performance of the ATCA antennas I: effects ... · Mm performance of the ATCA...
28
AT 39.3/113 Mm performance of the ATCA antennas I: effects of tilts & displacements in the optics . Ravi Subrahmanyan April 2002 I have computed the drop in antenna gain, distortions in beam patterns, aperture phase distributions, and s hifts in antenna pointing, due to displacements and tilts in the feed and sub-reflector. Geometric optics approximation was used. The purpose of the exercise was to work towards understanding the beam distortions and aperture phase errors we may expect due to optics misalignments, derive tolerances for the alignment of the optics components and examine the possibility of compensating for optics misalignments. An evaluation of the effects of gravity induced deformations in the main reflector will be the topic of the next report. ATCA antenna performance with aligned optics : The ATCA antennas have shaped Cassegrain optics, the main reflector (MR) and sub- reflector (SR) are shaped surfaces whose profiles deviate, respectively, from parabolic and hyperbolic forms. The ideal optics alignment is shown in Fig. 1. Figure 1: Ideal optics alignment. All dimensions in mm. The feed phase center is located 1509 mm above the vertex of the MR, and the vertex of the SR is located 6430 mm above the MR vertex. For this optics arrangement, radiation
-
Upload
truongtuyen -
Category
Documents
-
view
215 -
download
0
Transcript of AT 39.3/113 Mm performance of the ATCA antennas I: effects ... · Mm performance of the ATCA...
AT 39.3/113
Mm performance of the ATCA antennas I: effects of tilts & displacements in the optics.
Ravi Subrahmanyan
April 2002
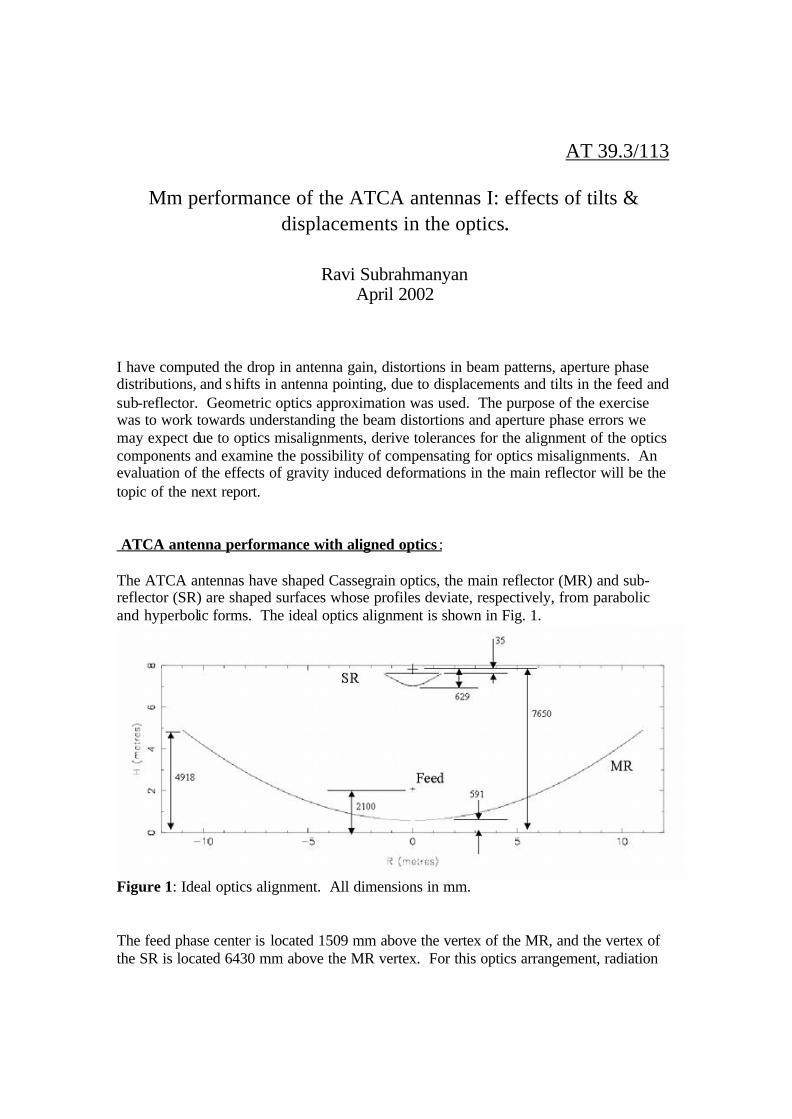
I have computed the drop in antenna gain, distortions in beam patterns, aperture phase distributions, and shifts in antenna pointing, due to displacements and tilts in the feed and sub-reflector. Geometric optics approximation was used. The purpose of the exercise was to work towards understanding the beam distortions and aperture phase errors we may expect due to optics misalignments, derive tolerances for the alignment of the optics components and examine the possibility of compensating for optics misalignments. An evaluation of the effects of gravity induced deformations in the main reflector will be the topic of the next report. ATCA antenna performance with aligned optics : The ATCA antennas have shaped Cassegrain optics, the main reflector (MR) and sub-reflector (SR) are shaped surfaces whose profiles deviate, respectively, from parabolic and hyperbolic forms. The ideal optics alignment is shown in Fig. 1.
Figure 1: Ideal optics alignment. All dimensions in mm.
The feed phase center is located 1509 mm above the vertex of the MR, and the vertex of the SR is located 6430 mm above the MR vertex. For this optics arrangement, radiation
2
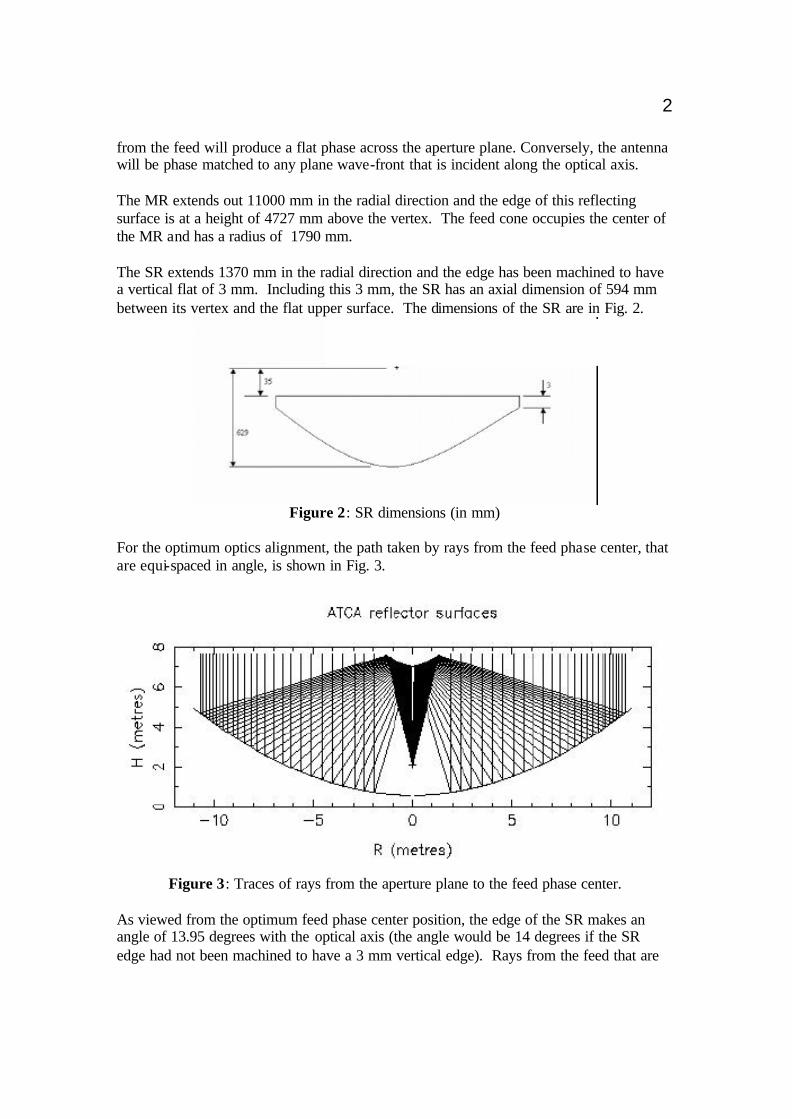
from the feed will produce a flat phase across the aperture plane. Conversely, the antenna will be phase matched to any plane wave-front that is incident along the optical axis. The MR extends out 11000 mm in the radial direction and the edge of this reflecting surface is at a height of 4727 mm above the vertex. The feed cone occupies the center of the MR and has a radius of 1790 mm. The SR extends 1370 mm in the radial direction and the edge has been machined to have a vertical flat of 3 mm. Including this 3 mm, the SR has an axial dimension of 594 mm between its vertex and the flat upper surface. The dimensions of the SR are in Fig. 2.
Figure 2: SR dimensions (in mm)
For the optimum optics alignment, the path taken by rays from the feed phase center, that are equi-spaced in angle, is shown in Fig. 3.
Figure 3: Traces of rays from the aperture plane to the feed phase center.
As viewed from the optimum feed phase center position, the edge of the SR makes an angle of 13.95 degrees with the optical axis (the angle would be 14 degrees if the SR edge had not been machined to have a 3 mm vertical edge). Rays from the feed that are
3
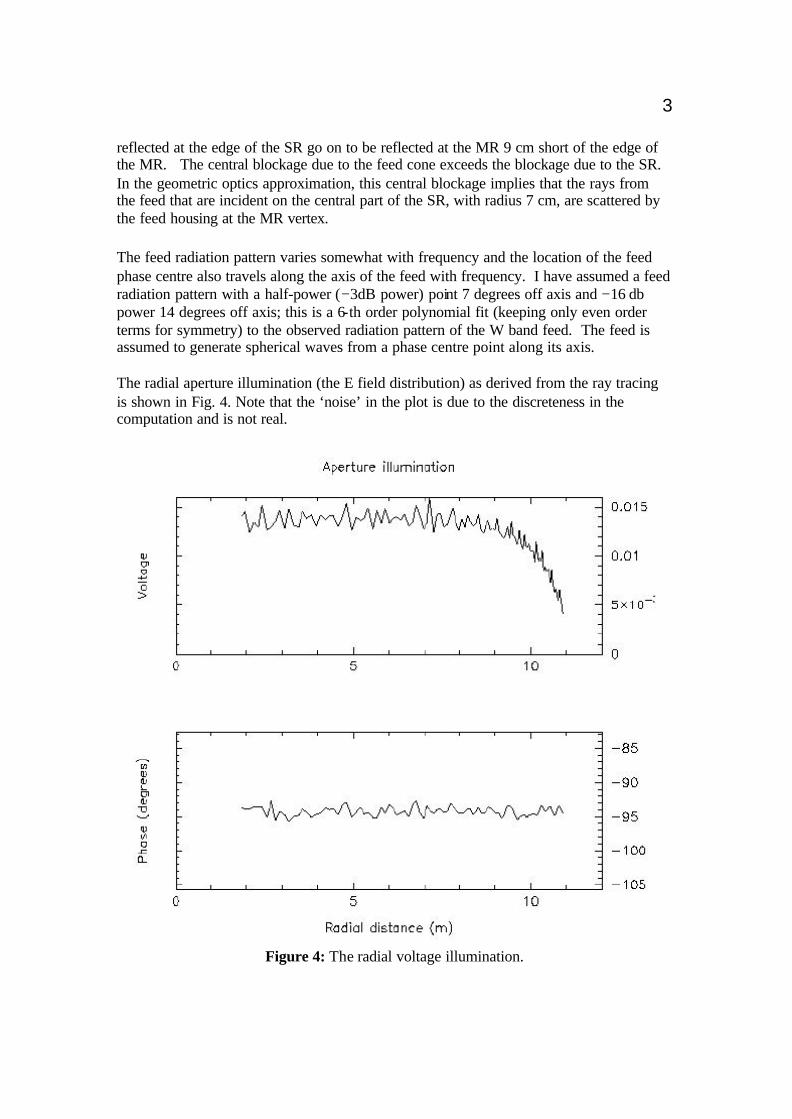
reflected at the edge of the SR go on to be reflected at the MR 9 cm short of the edge of the MR. The central blockage due to the feed cone exceeds the blockage due to the SR. In the geometric optics approximation, this central blockage implies that the rays from the feed that are incident on the central part of the SR, with radius 7 cm, are scattered by the feed housing at the MR vertex. The feed radiation pattern varies somewhat with frequency and the location of the feed phase centre also travels along the axis of the feed with frequency. I have assumed a feed radiation pattern with a half-power (−3dB power) point 7 degrees off axis and −16 db power 14 degrees off axis; this is a 6-th order polynomial fit (keeping only even order terms for symmetry) to the observed radiation pattern of the W band feed. The feed is assumed to generate spherical waves from a phase centre point along its axis. The radial aperture illumination (the E field distribution) as derived from the ray tracing is shown in Fig. 4. Note that the ‘noise’ in the plot is due to the discreteness in the computation and is not real.
Figure 4: The radial voltage illumination.
4
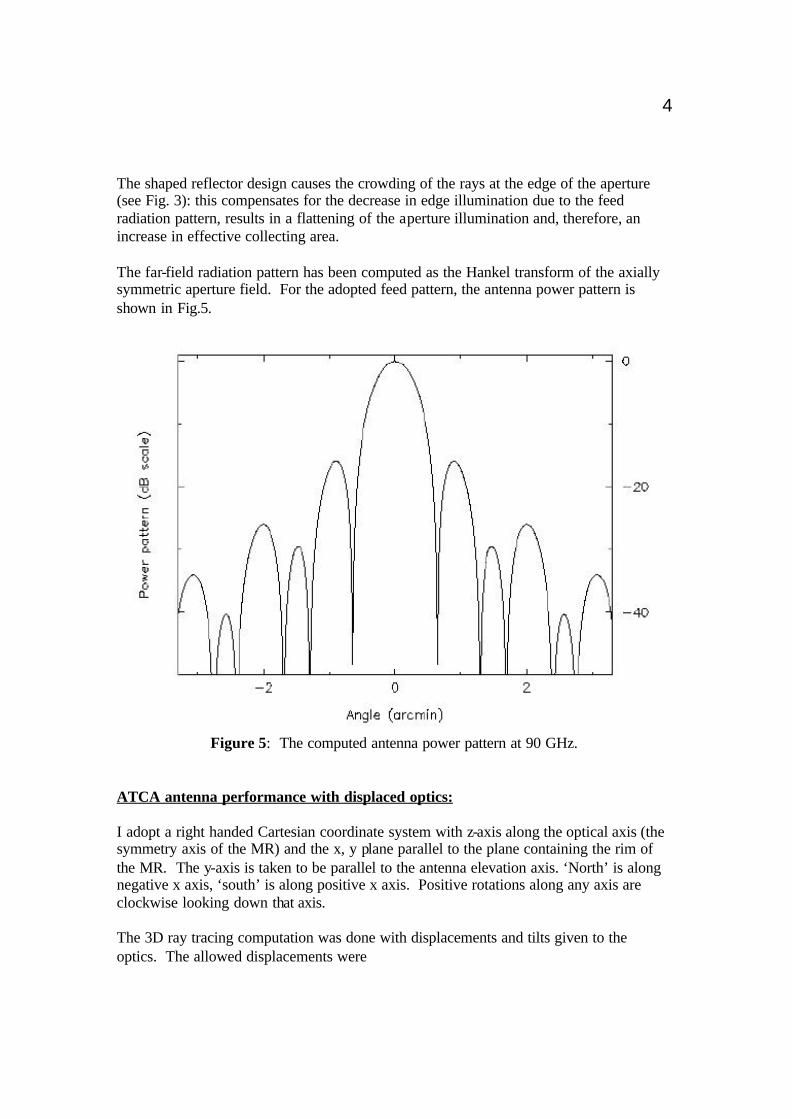
The shaped reflector design causes the crowding of the rays at the edge of the aperture (see Fig. 3): this compensates for the decrease in edge illumination due to the feed radiation pattern, results in a flattening of the aperture illumination and, therefore, an increase in effective collecting area. The far-field radiation pattern has been computed as the Hankel transform of the axially symmetric aperture field. For the adopted feed pattern, the antenna power pattern is shown in Fig.5.
Figure 5: The computed antenna power pattern at 90 GHz.
ATCA antenna performance with displaced optics: I adopt a right handed Cartesian coordinate system with z-axis along the optical axis (the symmetry axis of the MR) and the x, y plane parallel to the plane containing the rim of the MR. The y-axis is taken to be parallel to the antenna elevation axis. ‘North’ is along negative x axis, ‘south’ is along positive x axis. Positive rotations along any axis are clockwise looking down that axis. The 3D ray tracing computation was done with displacements and tilts given to the optics. The allowed displacements were

5
1. axial z-axis displacement of the SR 2. x, y displacements of the SR in a plane perpendicular to the optical axis. 3. a tilt of the SR about the y-axis. 4. axial z-axis offset to the feed phase center position 5. x, y displacements of this feed phase center in the perpendicular plane. 6. a tilt of the feed axis w.r.t. the optical axis and about the y axis 7. an additional rotation of the tilted feed about the z-axis.
These displacements and rotations make it possible to assess the consequence of most misalignments. I’ve looked at the relative antenna gain, pointing offsets (for off axis displacements and tilts), aperture phase errors and beam pa tterns for several cases. Antenna gain: The fall in antenna power gain with axial offset in feed phase center, at 90 GHz, is shown in Fig. 6. An axial offset of 24 mm will result in a 10% loss of gain; keeping the offset within ±8 mm will keep the gain loss within 1%.
0.2
0.3
0.4
0.5
0.6
0.7
0.8
0.9
1
-100 -90 -80 -70 -60 -50 -40 -30 -20 -10 0 10 20 30 40 50 60 70 80 90 100
Offset in feed phase centre (mm)
An
ten
na
po
wer
gai
n
Figure 6: Antenna power gain versus axial offset in feed phase center.
The feed phase center in the wide band compact corrugated horn travels along the feed axis with frequency; at higher frequencies the phase center is closer to the throat and at lower frequencies it is nearer the feed face. Based on the EM analysis of the K-band feed horn, we have predictions for the phase centre position at spot frequencies in K band (at18-25horn.01 file produced by G. James 1995/04/13). I've plotted these in the following graph (Fig. 7) and fitted a polynomial to the four points. The curve for the AT horns appears to be somewhat steeper than the curve marked 15 deg. in the feed
6
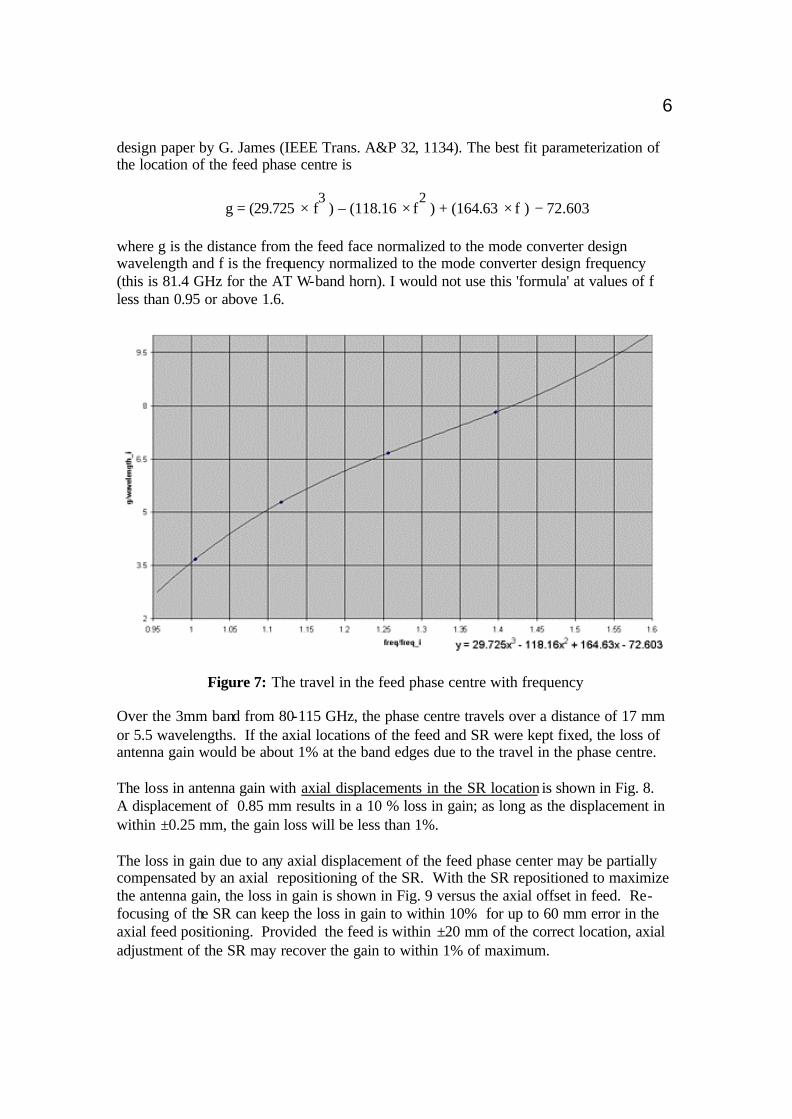
design paper by G. James (IEEE Trans. A&P 32, 1134). The best fit parameterization of the location of the feed phase centre is
g = (29.725 × f3 ) – (118.16 × f
2 ) + (164.63 × f ) − 72.603
where g is the distance from the feed face normalized to the mode converter design wavelength and f is the frequency normalized to the mode converter design frequency (this is 81.4 GHz for the AT W-band horn). I would not use this 'formula' at values of f less than 0.95 or above 1.6.
Figure 7: The travel in the feed phase centre with frequency Over the 3mm band from 80-115 GHz, the phase centre travels over a distance of 17 mm or 5.5 wavelengths. If the axial locations of the feed and SR were kept fixed, the loss of antenna gain would be about 1% at the band edges due to the travel in the phase centre. The loss in antenna gain with axial displacements in the SR location is shown in Fig. 8. A displacement of 0.85 mm results in a 10 % loss in gain; as long as the displacement in within ±0.25 mm, the gain loss will be less than 1%. The loss in gain due to any axial displacement of the feed phase center may be partially compensated by an axial repositioning of the SR. With the SR repositioned to maximize the antenna gain, the loss in gain is shown in Fig. 9 versus the axial offset in feed. Re-focusing of the SR can keep the loss in gain to within 10% for up to 60 mm error in the axial feed positioning. Provided the feed is within ±20 mm of the correct location, axial adjustment of the SR may recover the gain to within 1% of maximum.

7
0
0.2
0.4
0.6
0.8
1
-6 -5 -4 -3 -2 -1 0 1 2 3 4 5 6
SR axial offset (mm)
An
ten
na
po
wer
gai
n
Figure 8: Antenna power gain versus axial offset in SR position.
0.8
0.825
0.85
0.875
0.9
0.925
0.95
0.975
1
-90 -80 -70 -60 -50 -40 -30 -20 -10 0 10 20 30 40 50 60 70 80 90
Axial offset to feed phase centre (mm)
Ant
enna
pow
er g
ain
Figure 9: Loss in antenna gain versus offset in feed phase center. The SR has been offset to maximize the gain for each offset position of the feed.

8
The relationship between the axial offset of the feed and the axial offset required to be made to the SR for optimum focus (maximum gain) is linear: for an offset δz of the feed, the required SR displacement is (δz/30.6). The drop in antenna gain, at 90 GHz, due to a lateral offset in the feed is shown in Fig.10. The loss is closely proportional to the square of the displacement. A 10 mm feed positioning error results in a 5% loss of antenna gain; if the positioning error is kept within 5 mm, the loss in gain will be within 1%. The analysis in this report has assumed that the wave-front from the horn is spherical, at least within ±14 degrees of the optical axis. Antenna range measurements of the 90 GHz feed radiation pattern show that the phase is flat to within ±5 degrees over angles ±12 degrees of the optical axis, there is a deviation of about 15 degrees phase over angles offset 12-14 degrees from the optical axis. The measurements justify the assumption of a fixed phase center for the horn (at a fixed frequency in the W band).
0.75
0.8
0.85
0.9
0.95
1
0 4 8 12 16 20
Feed offset perpendicular to the optical axis (in mm)
An
ten
na
Po
wer
gai
n
Figure 10: The loss of antenna gain due to lateral displacements in the feed position.
Because the feed radiates spherical waves, a tilt in the feed axis does not result in phase gradients across the aperture of the main reflector. A tilt in the feed causes a change in gain due to the asymmetry in the amplitude distribution across the aperture. Another curious, although insignificant, point is that when the feed is tilted off axis, the peak moves off the central blockage. Therefore, when compared to the antenna gain when the optics are perfectly aligned, the antenna gain is greater by about 2% for a 1 degree tilt in the feed axis. For larger tilts of the feed axis there is a gain loss: the loss is about 2% for a 3 degree tilt and about 10% for a 5 degree tilt.
9
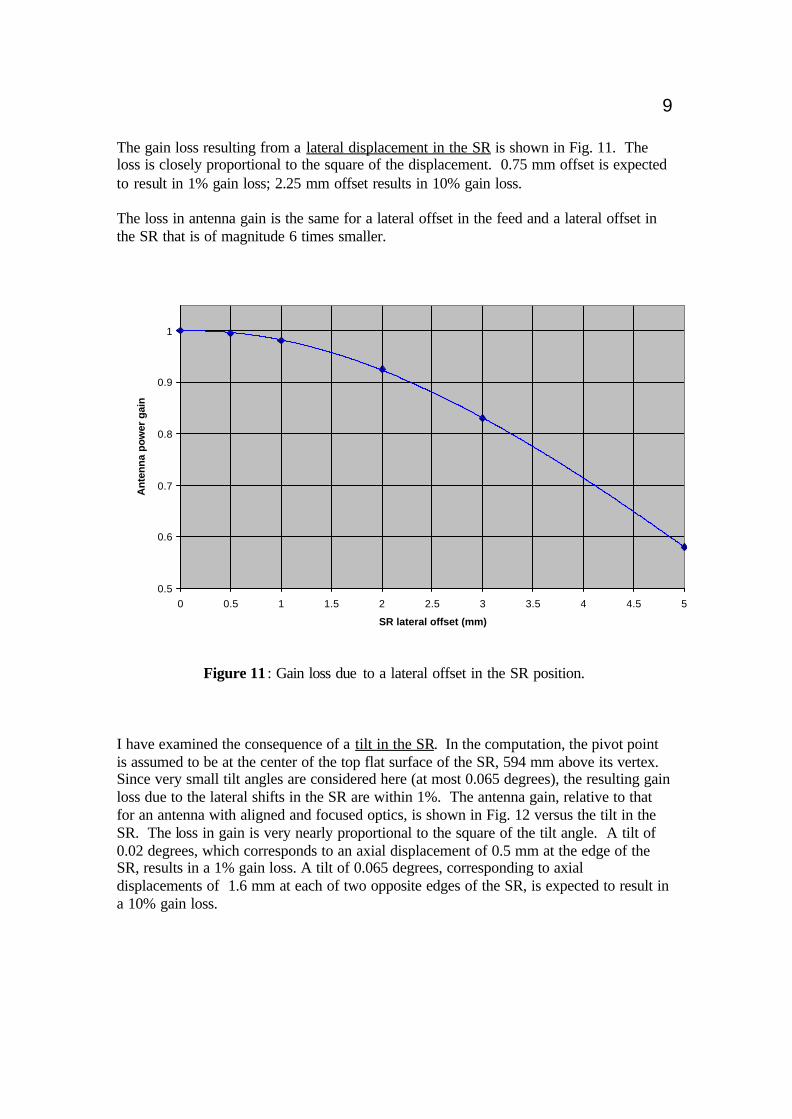
The gain loss resulting from a lateral displacement in the SR is shown in Fig. 11. The loss is closely proportional to the square of the displacement. 0.75 mm offset is expected to result in 1% gain loss; 2.25 mm offset results in 10% gain loss. The loss in antenna gain is the same for a lateral offset in the feed and a lateral offset in the SR that is of magnitude 6 times smaller.
0.5
0.6
0.7
0.8
0.9
1
0 0.5 1 1.5 2 2.5 3 3.5 4 4.5 5
SR lateral offset (mm)
Ant
enna
pow
er g
ain
Figure 11 : Gain loss due to a lateral offset in the SR position.
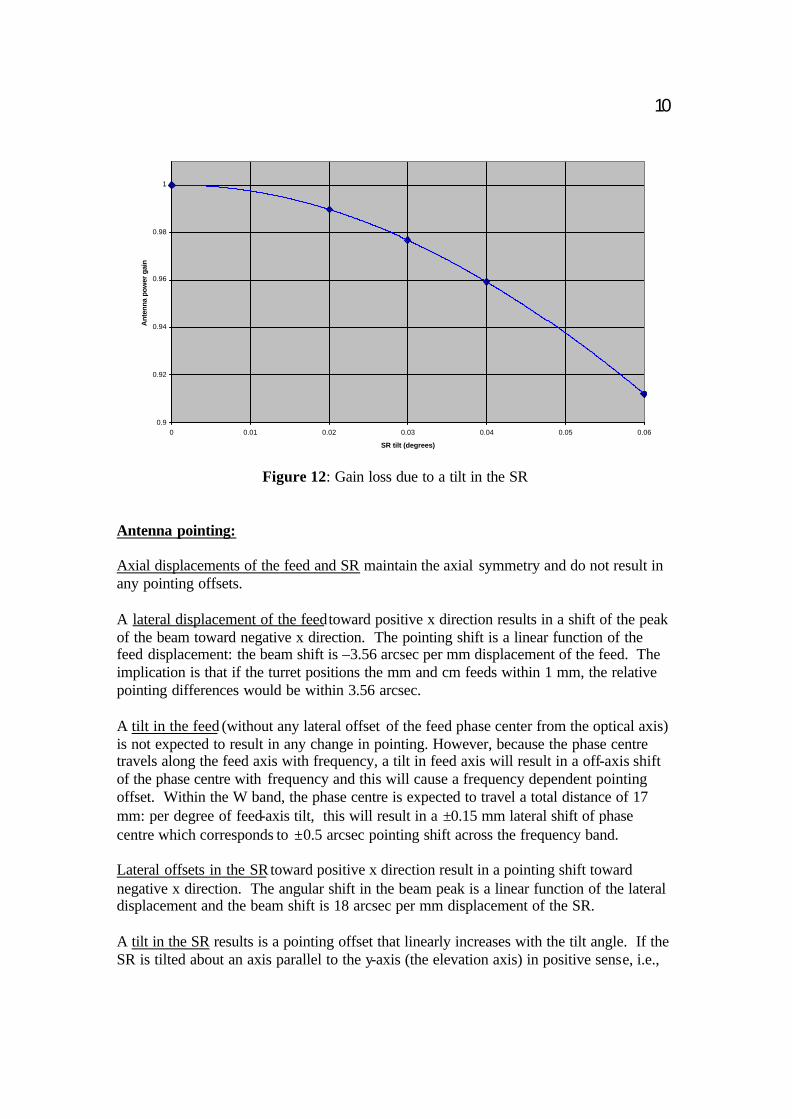
I have examined the consequence of a tilt in the SR. In the computation, the pivot point is assumed to be at the center of the top flat surface of the SR, 594 mm above its vertex. Since very small tilt angles are considered here (at most 0.065 degrees), the resulting gain loss due to the lateral shifts in the SR are within 1%. The antenna gain, relative to that for an antenna with aligned and focused optics, is shown in Fig. 12 versus the tilt in the SR. The loss in gain is very nearly proportional to the square of the tilt angle. A tilt of 0.02 degrees, which corresponds to an axial displacement of 0.5 mm at the edge of the SR, results in a 1% gain loss. A tilt of 0.065 degrees, corresponding to axial displacements of 1.6 mm at each of two opposite edges of the SR, is expected to result in a 10% gain loss.
10
0.9
0.92
0.94
0.96
0.98
1
0 0.01 0.02 0.03 0.04 0.05 0.06
SR tilt (degrees)
Ant
enna
pow
er g
ain
Figure 12: Gain loss due to a tilt in the SR
Antenna pointing: Axial displacements of the feed and SR maintain the axial symmetry and do not result in any pointing offsets. A lateral displacement of the feed toward positive x direction results in a shift of the peak of the beam toward negative x direction. The pointing shift is a linear function of the feed displacement: the beam shift is –3.56 arcsec per mm displacement of the feed. The implication is that if the turret positions the mm and cm feeds within 1 mm, the relative pointing differences would be within 3.56 arcsec. A tilt in the feed (without any lateral offset of the feed phase center from the optical axis) is not expected to result in any change in pointing. However, because the phase centre travels along the feed axis with frequency, a tilt in feed axis will result in a off-axis shift of the phase centre with frequency and this will cause a frequency dependent pointing offset. Within the W band, the phase centre is expected to travel a total distance of 17 mm: per degree of feed-axis tilt, this will result in a ±0.15 mm lateral shift of phase centre which corresponds to ±0.5 arcsec pointing shift across the frequency band. Lateral offsets in the SR toward positive x direction result in a pointing shift toward negative x direction. The angular shift in the beam peak is a linear function of the lateral displacement and the beam shift is 18 arcsec per mm displacement of the SR. A tilt in the SR results is a pointing offset that linearly increases with the tilt angle. If the SR is tilted about an axis parallel to the y-axis (the elevation axis) in positive sense, i.e.,

11
the lower edge of the SR at positive x is displaced closer to the MR and the upper edge of the SR at negative x is displaced away from the MR, the peak of the beam shifts to higher elevation. The pointing offset is –6.18 arcmin per degree tilt; in more useful units, the pointing offset is –15.4 arcsec for ±1 mm axial offsets at opposite edges of the SR. Aperture illumination & Far-field beam pattern: Displacements in the antenna optics result in changes in the amplitude and phase of the aperture illumination. For small displacements, the change in aperture amplitude distribution will be small. A reason for this is that the relative displacements in the feed and reflector components are tiny in comparison with the dimensions of the reflecting surfaces. The dominant cause for loss in antenna gain, as well as distortions to the antenna far-field beam pattern, is the deviation in the aperture phase distribution from constant phase. When large aperture antennas, like the 22-m ATCA antennas, are used for interferometer imaging at mm wavelengths, mosaicing techniques become important because of the small field of view of the large antennas. If misalignments in the antenna optics result in aperture phase errors, this introduces an additional calibration requirement which, if neglected, could limit the dynamic range via phase errors. This is true even if all antennas have identical optics deformations (due to gravity induced deformations, for example). Calibration may require a mosaic-mode observation of the calibrator, or a model for the aperture phase distortions. Quantifying the aperture phase error is necessary to evaluate the dynamic range limitations. Phase gradients across the aperture give a shift of the beam pattern and is simply a pointing shift. This may be taken out in the pointing model. There might be residual second order errors if, for example, the pointing model does not accurately represent the functional form of the elevation dependent pointing error that is caused by gravity deformations of the optics. It is the deviations in the aperture phase from a linear gradient that result in a loss of antenna gain. Axial displacements in the optics, that result in radial phase functions that have rotational symmetry, show up as a lack of depth in the nulls of the beam pattern and in the side-lobe pattern. Off-axis displacements, that result in more complex phase functions, usually result in an imbalance in the side-lobes: the side-lobe on one side may be enhanced and this is usually referred to as a ‘coma lobe’. I have computed the aperture field distribution, and the far field radiation pattern, for different optics displacements. For axial displacements of the feed and/or the SR, the aperture field and radiation patterns have rotational symmetry and may be represented by radial profile plots. In Fig. 13, I show the phase of the aperture field as a function of radial distance from the optical axis, for axial offsets in the feed phase centre. For the AT W-band feed, where the phase centre travel may be over ±10 mm across the band, the aperture phase error may be ±10 degrees at the band edges.

12
-80
-60
-40
-20
0
20
40
60
80
0 2 4 6 8 10 12
Radial distance (m)
Ap
ertu
re p
has
e d
istr
ibu
tio
n (
deg
rees
)
0
24
12
36
-12
-24
-36
Figure 13: Radial phase of the aperture field due to an axial feed offset (mm)
The corresponding beam patterns are shown in Fig. 14. The beam patterns are the same for equal positive and negative offsets. It may be seen that the antenna gain along the bore-sight is reduced, and the nulls are filled in, when the antenna is defocused. The first side-lobes are not significantly enhanced.
0
200
400
600
800
1000
1200
1400
-1.5 -1 -0.5 0 0.5 1 1.5
Offset (arcmin)
Bea
m p
atte
rn (
far
fiel
d a
mp
litu
de)
0
12
24
36
Figure 14: Changes in the antenna radiation pattern due to an axial feed offset (mm)

13
The radial aperture phase patterns, in the case where the SR is axially displaced, is shown in Fig. 15. The functional form is not the same as that for axial feed offsets. The corresponding beam patterns for different axial SR displacements is in Fig. 16. The patterns are the same for positive and negative offsets.
-60
-40
-20
0
20
40
60
0 2 4 6 8 10 12
Radial distance (m)
Ap
ertu
re p
has
e d
istr
ibu
tio
n (
deg
rees
)
0
-1.2
-0.8
-0.4
0.4
0.8
1.2
Figure 15: Radial phase of the aperture field due to an axial SR offset (mm)
0
200
400
600
800
1000
1200
1400
-1.5 -1 -0.5 0 0.5 1 1.5
Offset (arcmin)
Bea
m p
atte
rn (
far
fiel
d a
mp
litu
de)
0
0.4
0.8
1.2
14
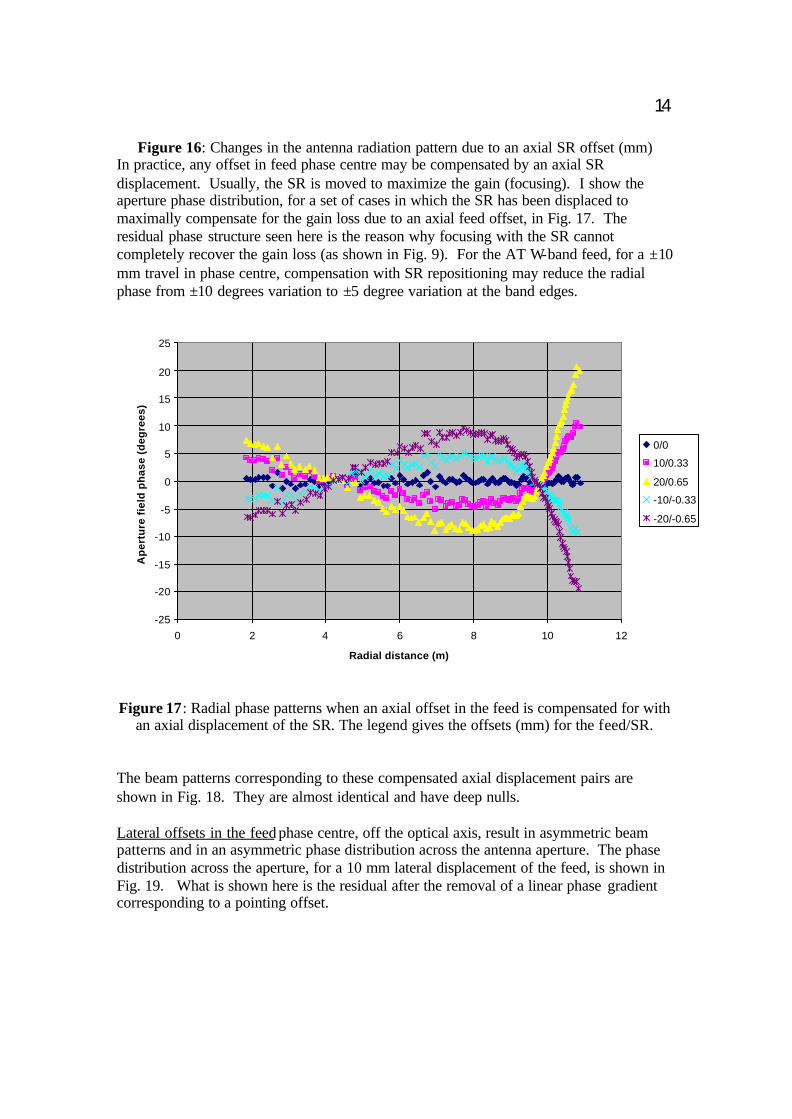
Figure 16: Changes in the antenna radiation pattern due to an axial SR offset (mm) In practice, any offset in feed phase centre may be compensated by an axial SR displacement. Usually, the SR is moved to maximize the gain (focusing). I show the aperture phase distribution, for a set of cases in which the SR has been displaced to maximally compensate for the gain loss due to an axial feed offset, in Fig. 17. The residual phase structure seen here is the reason why focusing with the SR cannot completely recover the gain loss (as shown in Fig. 9). For the AT W-band feed, for a ±10 mm travel in phase centre, compensation with SR repositioning may reduce the radial phase from ±10 degrees variation to ±5 degree variation at the band edges.
-25
-20
-15
-10
-5
0
5
10
15
20
25
0 2 4 6 8 10 12
Radial distance (m)
Ap
ertu
re f
ield
ph
ase
(deg
rees
)
0/0
10/0.33
20/0.65
-10/-0.33
-20/-0.65
Figure 17: Radial phase patterns when an axial offset in the feed is compensated for with
an axial displacement of the SR. The legend gives the offsets (mm) for the feed/SR. The beam patterns corresponding to these compensated axial displacement pairs are shown in Fig. 18. They are almost identical and have deep nulls. Lateral offsets in the feed phase centre, off the optical axis, result in asymmetric beam patterns and in an asymmetric phase distribution across the antenna aperture. The phase distribution across the aperture, for a 10 mm lateral displacement of the feed, is shown in Fig. 19. What is shown here is the residual after the removal of a linear phase gradient corresponding to a pointing offset.

15
0
200
400
600
800
1000
1200
1400
-1.5 -1 -0.5 0 0.5 1 1.5
Offset (arcmin)
Bea
m p
atte
rn (
far
fiel
d a
mp
litu
de)
0/0
10/0.33
20/0.65
-10/-0.33
-20/-0.65
Figure 18: Antenna radiation patterns when an axial offset in the feed is compensated for with an axial displacement of the SR. The legend gives the offsets (mm) for the feed/SR.
Figure 19 : The aperture phase distribution when the feed phase centre is offset 10 mm off the optical axis. A linear phase gradient has been subtracted before making this plot. The contours are in 5 degree intervals and the wedge is marked in degrees of phase.

16
Plots of slices across the 2D aperture phase distribution, for feed offsets of 0, 5, 10 & 20 mm off the optical axis, are shown in Fig. 20. In may be noted that a 5 mm offset results in ±10 degree phase errors peak-to-peak. The phase errors scale roughly linearly with the magnitude of the offset.
-60.00
-40.00
-20.00
0.00
20.00
40.00
60.00
-12.00 -10.00 -8.00 -6.00 -4.00 -2.00 0.00 2.00 4.00 6.00 8.00 10.00 12.00
Offset (m)
Ap
ertu
re p
has
e (d
egre
es)
0.00
5.00
10.00
20.00
Figure 20: Aperture phase for different offsets (in mm) in feed off axis. These patterns
are slices along the direction of the offset in the feed. The far field radiation pattern, for a 10 mm lateral offset in the feed, is shown in Fig. 21. The sidelobes are asymmetric and significantly larger on one side; the large first sidelobe is what is referred to as a ‘coma’ lobe. The feed has been offset toward positive x. To clarify: when the feed is offset to the south, the peak of the beam moves to north and the coma lobe appears to the north of the beam peak. The main lobe is also slightly asymmetric. Slices across the 2D beam patterns, for different lateral displacements of the feed, are shown in Fig. 22. The slices have been made in the plane containing the optical axis and the displaced feed. It may be noted that with increasing offsets in the feed location, the sidelobes become more skewed and the coma lobe increases in amplitude relative to the beam maximum.

17
Figure 21: Beam pattern (far field amplitude) when the feed is offset 10 mm off axis.
Contours are at 4% of the beam maximum.
0
2
4
6
8
10
12
14
16
-3 -2 -1 0 1 2 3
Offset (arcmin)
Bea
m p
atte
rn (f
ar fi
eld
ampl
itude
)
0
5
1 0
2 0
Figure 22: Antenna radiation patterns for different lateral offsets (in mm) of the feed
position. The plots for successive offsets are displaced vertically by 2 units for clarity. These patterns are slices along the direction of the offset in the feed.
18
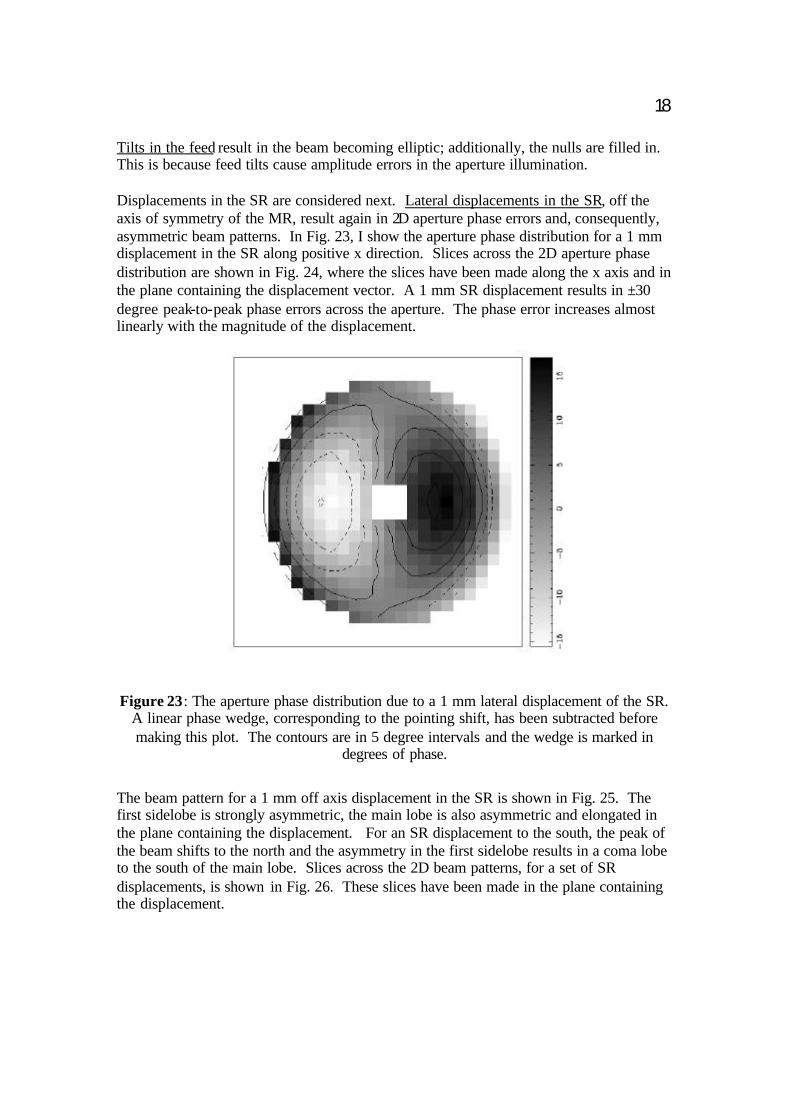
Tilts in the feed result in the beam becoming elliptic; additionally, the nulls are filled in. This is because feed tilts cause amplitude errors in the aperture illumination. Displacements in the SR are considered next. Lateral displacements in the SR, off the axis of symmetry of the MR, result again in 2D aperture phase errors and, consequently, asymmetric beam patterns. In Fig. 23, I show the aperture phase distribution for a 1 mm displacement in the SR along positive x direction. Slices across the 2D aperture phase distribution are shown in Fig. 24, where the slices have been made along the x axis and in the plane containing the displacement vector. A 1 mm SR displacement results in ±30 degree peak-to-peak phase errors across the aperture. The phase error increases almost linearly with the magnitude of the displacement.
Figure 23: The aperture phase distribution due to a 1 mm lateral displacement of the SR.
A linear phase wedge, corresponding to the pointing shift, has been subtracted before making this plot. The contours are in 5 degree intervals and the wedge is marked in
degrees of phase.
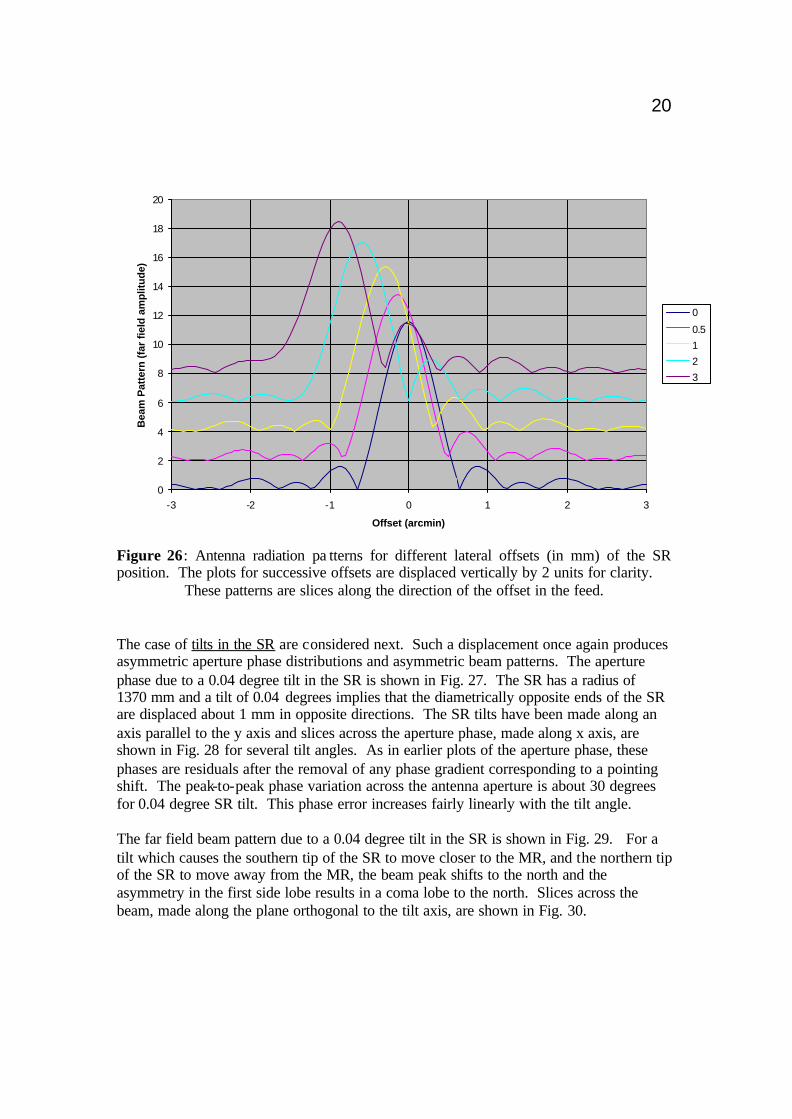
The beam pattern for a 1 mm off axis displacement in the SR is shown in Fig. 25. The first sidelobe is strongly asymmetric, the main lobe is also asymmetric and elongated in the plane containing the displacement. For an SR displacement to the south, the peak of the beam shifts to the north and the asymmetry in the first sidelobe results in a coma lobe to the south of the main lobe. Slices across the 2D beam patterns, for a set of SR displacements, is shown in Fig. 26. These slices have been made in the plane containing the displacement.

19
-60
-40
-20
0
20
40
60
-12.00 -9.00 -6.00 -3.00 0.00 3.00 6.00 9.00 12.00
Offset (m)
Ap
ertu
re p
has
e (d
egre
es)
0
0.5
1
2
3
Figure 24: Slices across the aperture phase distributions for different SR displacements
off axis (in mm). These patterns are along the direct ion of the displacement.
Figure 25: The beam pattern (far field amplitude) for the case when the SR is displaced 1
mm perpendicular to the optical axis. Contours are at 4% of the beam peak.
20
0
2
4
6
8
10
12
14
16
18
20
-3 -2 -1 0 1 2 3
Offset (arcmin)
Bea
m P
atte
rn (
far
field
am
plitu
de)
0
0.5
1
2
3
Figure 26: Antenna radiation pa tterns for different lateral offsets (in mm) of the SR position. The plots for successive offsets are displaced vertically by 2 units for clarity.
These patterns are slices along the direction of the offset in the feed.
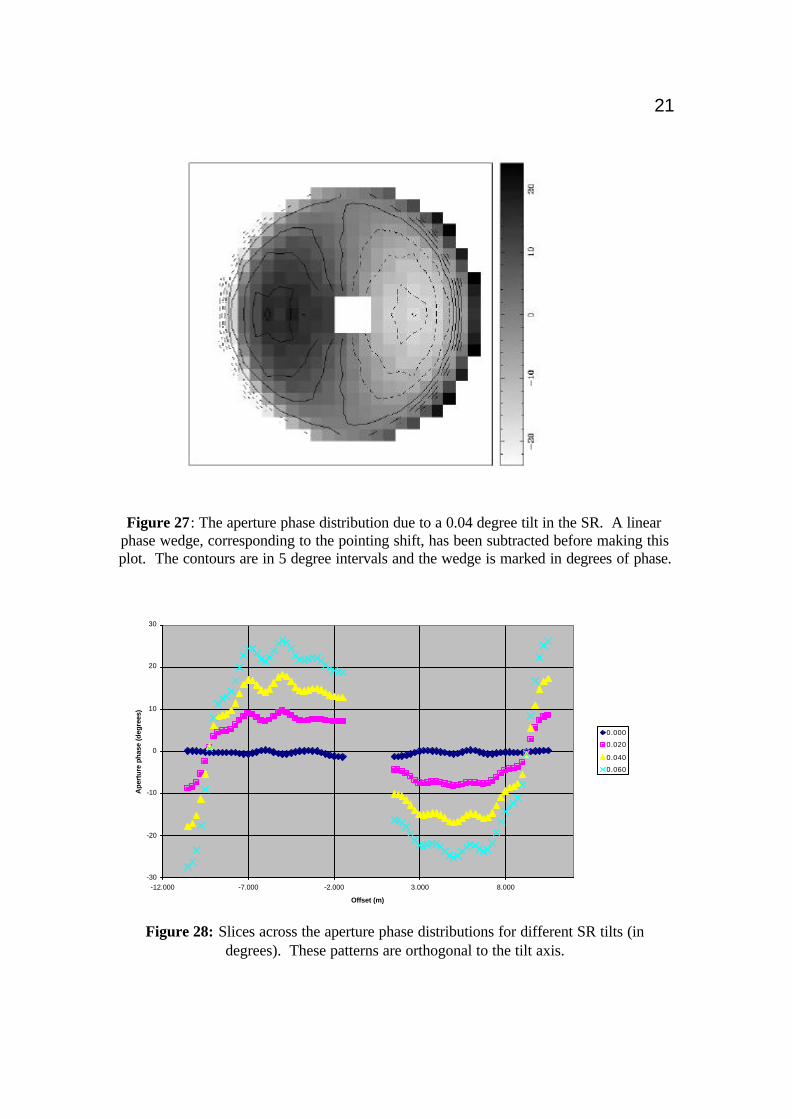
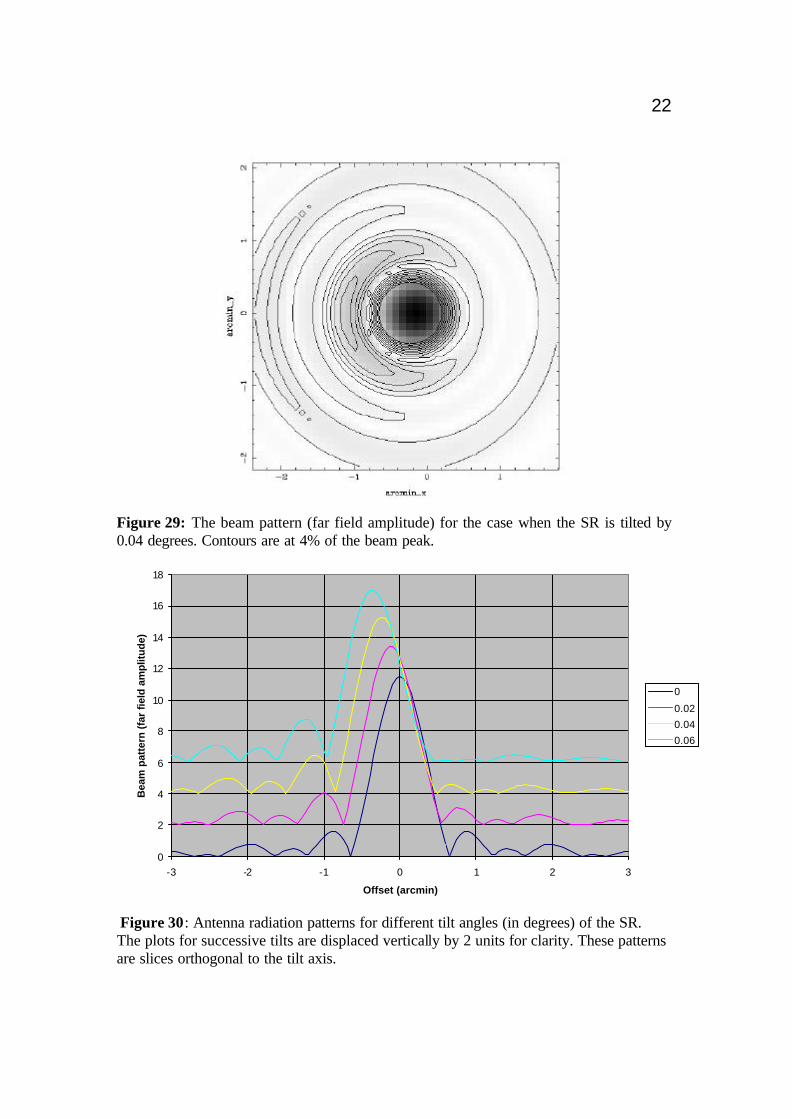
The case of tilts in the SR are considered next. Such a displacement once again produces asymmetric aperture phase distributions and asymmetric beam patterns. The aperture phase due to a 0.04 degree tilt in the SR is shown in Fig. 27. The SR has a radius of 1370 mm and a tilt of 0.04 degrees implies that the diametrically opposite ends of the SR are displaced about 1 mm in opposite directions. The SR tilts have been made along an axis parallel to the y axis and slices across the aperture phase, made along x axis, are shown in Fig. 28 for several tilt angles. As in earlier plots of the aperture phase, these phases are residuals after the removal of any phase gradient corresponding to a pointing shift. The peak-to-peak phase variation across the antenna aperture is about 30 degrees for 0.04 degree SR tilt. This phase error increases fairly linearly with the tilt angle. The far field beam pattern due to a 0.04 degree tilt in the SR is shown in Fig. 29. For a tilt which causes the southern tip of the SR to move closer to the MR, and the northern tip of the SR to move away from the MR, the beam peak shifts to the north and the asymmetry in the first side lobe results in a coma lobe to the north. Slices across the beam, made along the plane orthogonal to the tilt axis, are shown in Fig. 30.
21
Figure 27: The aperture phase distribution due to a 0.04 degree tilt in the SR. A linear
phase wedge, corresponding to the pointing shift, has been subtracted before making this plot. The contours are in 5 degree intervals and the wedge is marked in degrees of phase.
-30
-20
-10
0
10
20
30
-12.000 -7.000 -2.000 3.000 8.000
Offset (m)
Ape
rtur
e ph
ase
(deg
rees
)
0.000
0.020
0.040
0.060
Figure 28: Slices across the aperture phase distributions for different SR tilts (in
degrees). These patterns are orthogonal to the tilt axis.
22
Figure 29: The beam pattern (far field amplitude) for the case when the SR is tilted by 0.04 degrees. Contours are at 4% of the beam peak.
0
2
4
6
8
10
12
14
16
18
-3 -2 -1 0 1 2 3
Offset (arcmin)
Bea
m p
atte
rn (
far
field
am
plitu
de)
0
0.02
0.04
0.06
Figure 30: Antenna radiation patterns for different tilt angles (in degrees) of the SR. The plots for successive tilts are displaced vertically by 2 units for clarity. These patterns are slices orthogonal to the tilt axis.
23
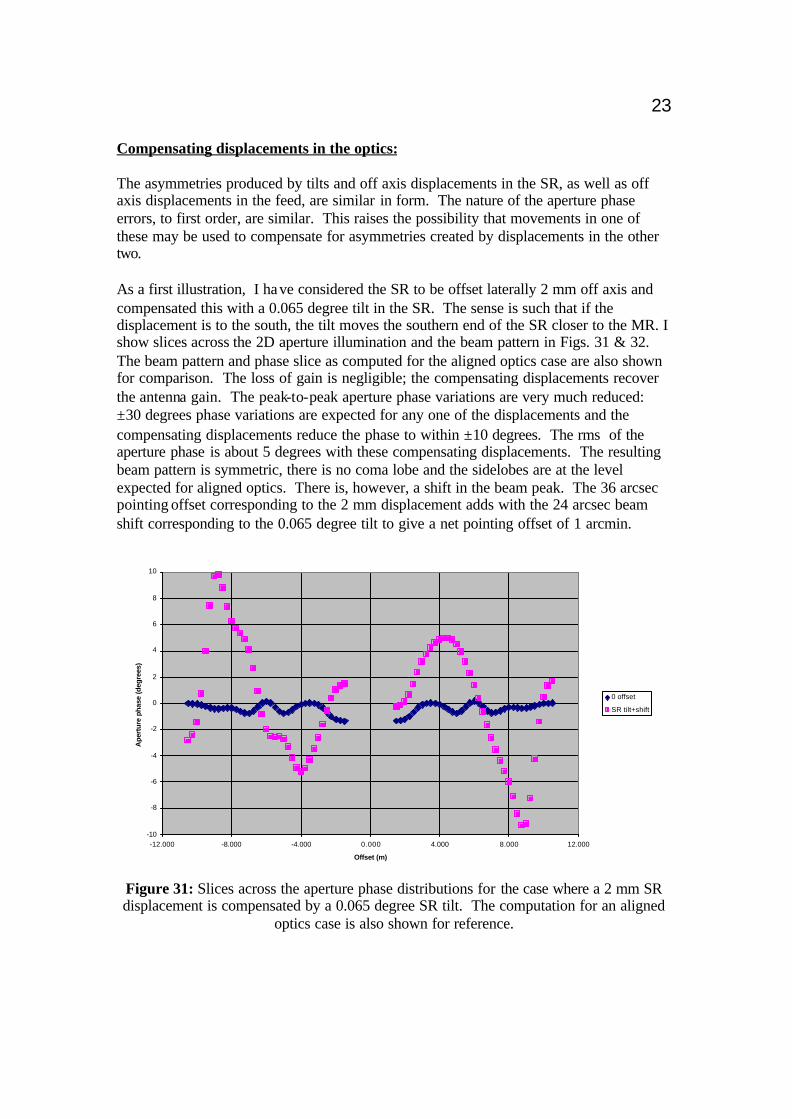
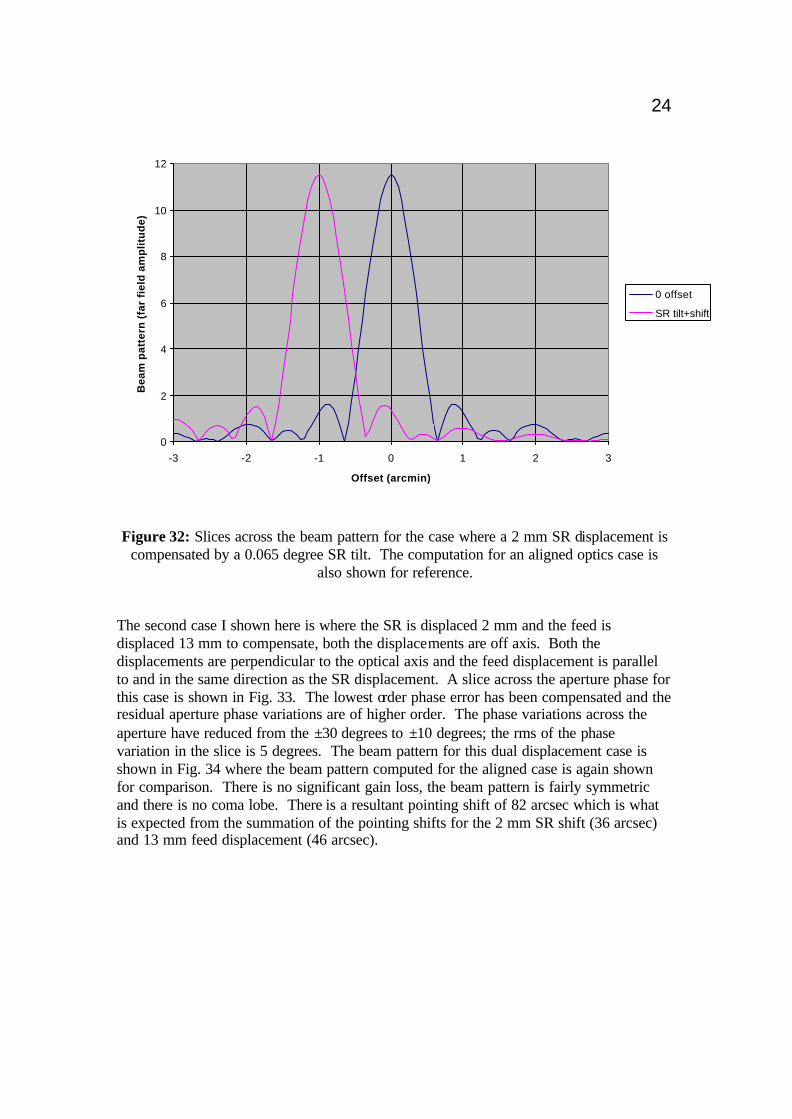
Compensating displacements in the optics: The asymmetries produced by tilts and off axis displacements in the SR, as well as off axis displacements in the feed, are similar in form. The nature of the aperture phase errors, to first order, are similar. This raises the possibility that movements in one of these may be used to compensate for asymmetries created by displacements in the other two. As a first illustration, I have considered the SR to be offset laterally 2 mm off axis and compensated this with a 0.065 degree tilt in the SR. The sense is such that if the displacement is to the south, the tilt moves the southern end of the SR closer to the MR. I show slices across the 2D aperture illumination and the beam pattern in Figs. 31 & 32. The beam pattern and phase slice as computed for the aligned optics case are also shown for comparison. The loss of gain is negligible; the compensating displacements recover the antenna gain. The peak-to-peak aperture phase variations are very much reduced: ±30 degrees phase variations are expected for any one of the displacements and the compensating displacements reduce the phase to within ±10 degrees. The rms of the aperture phase is about 5 degrees with these compensating displacements. The resulting beam pattern is symmetric, there is no coma lobe and the sidelobes are at the level expected for aligned optics. There is, however, a shift in the beam peak. The 36 arcsec pointing offset corresponding to the 2 mm displacement adds with the 24 arcsec beam shift corresponding to the 0.065 degree tilt to give a net pointing offset of 1 arcmin.
-10
-8
-6
-4
-2
0
2
4
6
8
10
-12.000 -8.000 -4.000 0.000 4.000 8.000 12.000
Offset (m)
Ape
rtur
e ph
ase
(deg
rees
)
0 offset
SR tilt+shift
Figure 31: Slices across the aperture phase distributions for the case where a 2 mm SR displacement is compensated by a 0.065 degree SR tilt. The computation for an aligned
optics case is also shown for reference.
24
0
2
4
6
8
10
12
-3 -2 -1 0 1 2 3
Offset (arcmin)
Bea
m p
atte
rn (
far
fiel
d a
mp
litu
de)
0 offset
SR tilt+shift
Figure 32: Slices across the beam pattern for the case where a 2 mm SR displacement is
compensated by a 0.065 degree SR tilt. The computation for an aligned optics case is also shown for reference.
The second case I shown here is where the SR is displaced 2 mm and the feed is displaced 13 mm to compensate, both the displacements are off axis. Both the displacements are perpendicular to the optical axis and the feed displacement is parallel to and in the same direction as the SR displacement. A slice across the aperture phase for this case is shown in Fig. 33. The lowest order phase error has been compensated and the residual aperture phase variations are of higher order. The phase variations across the aperture have reduced from the ±30 degrees to ±10 degrees; the rms of the phase variation in the slice is 5 degrees. The beam pattern for this dual displacement case is shown in Fig. 34 where the beam pattern computed for the aligned case is again shown for comparison. There is no significant gain loss, the beam pattern is fairly symmetric and there is no coma lobe. There is a resultant pointing shift of 82 arcsec which is what is expected from the summation of the pointing shifts for the 2 mm SR shift (36 arcsec) and 13 mm feed displacement (46 arcsec).

25
-10
-8
-6
-4
-2
0
2
4
6
8
10
-12 -8 -4 0 4 8 12
Offset (m)
Ap
ertu
re p
has
e (d
egre
es)
0 offset
Offset Feed + SR
Figure 33: Slices across the aperture phase distributions for the case where a 2 mm SR displacement off axis is compensated by a 13 mm feed displacement. The computation
for an aligned optics case is also shown for reference.
0
2
4
6
8
10
12
-3 -2 -1 0 1 2 3
Offset (arcmin)
Bea
m p
atte
rn (
far
field
am
plitu
de)
0 offset Offset Feed + SR
Figure 34: Slices across the beam pattern for the case where a 2 mm SR displacement is
compensated by a13 mm feed offset, both offsets are off axis The computation for an aligned optics case is also shown for reference.
26
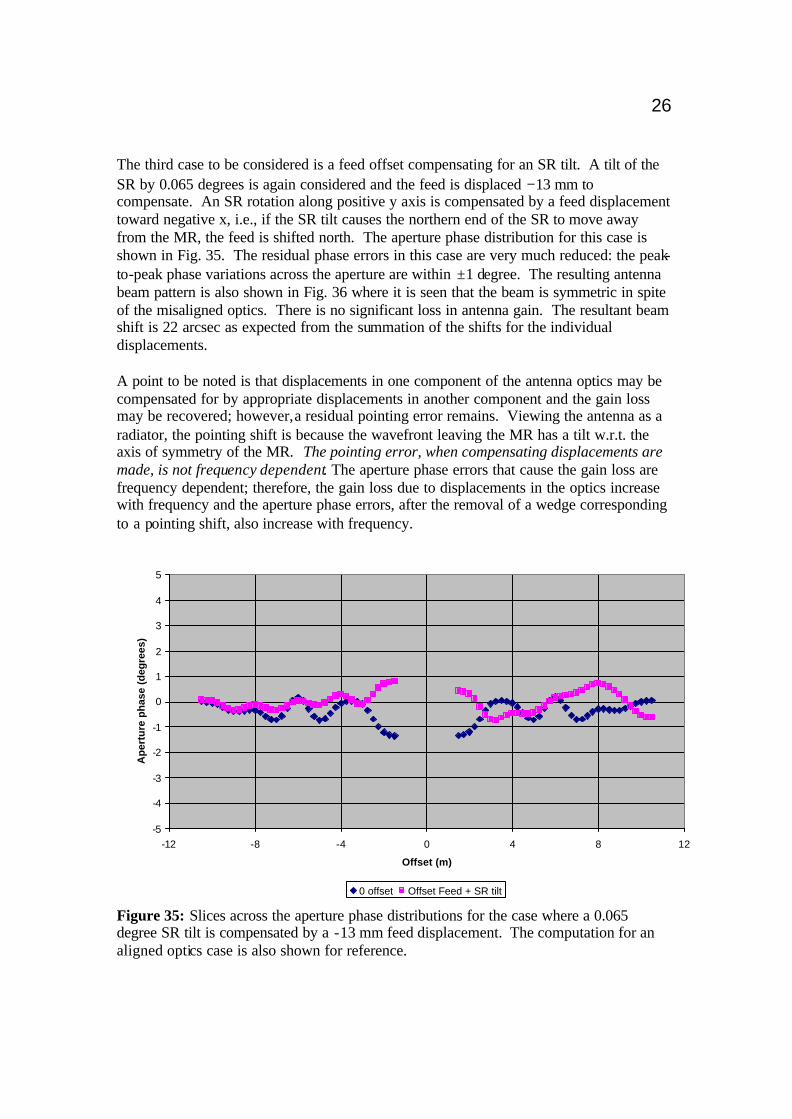
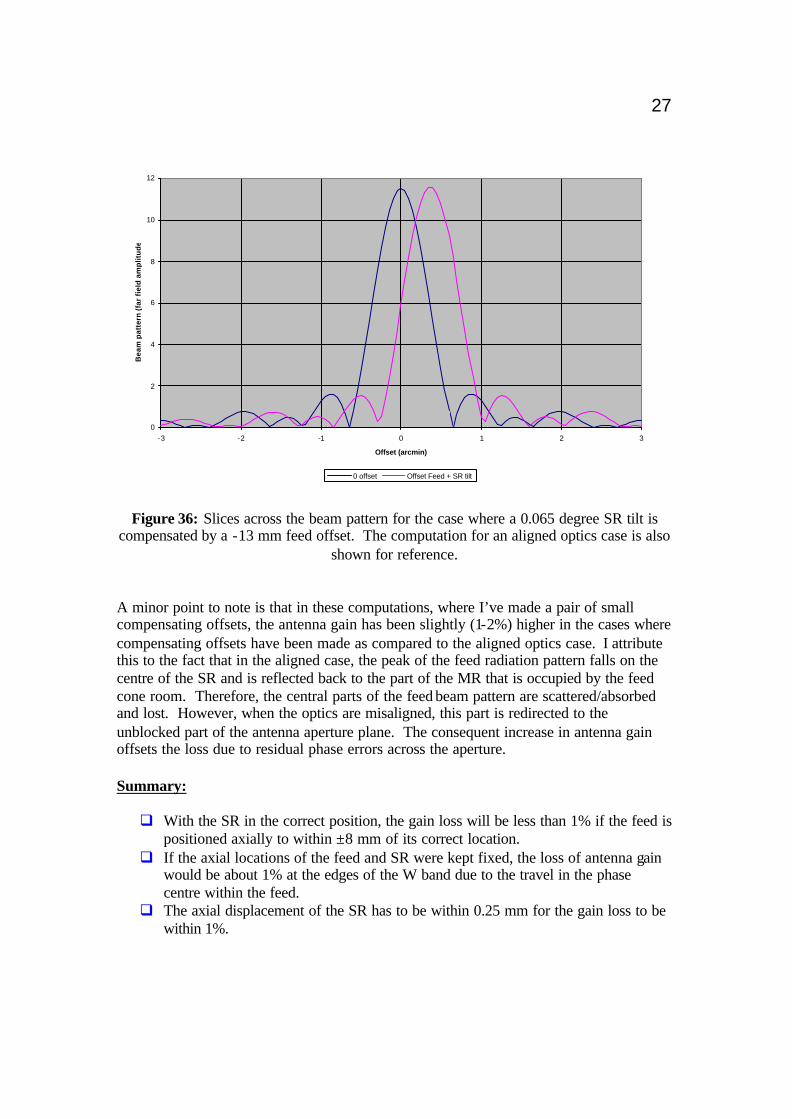
The third case to be considered is a feed offset compensating for an SR tilt. A tilt of the SR by 0.065 degrees is again considered and the feed is displaced −13 mm to compensate. An SR rotation along positive y axis is compensated by a feed displacement toward negative x, i.e., if the SR tilt causes the northern end of the SR to move away from the MR, the feed is shifted north. The aperture phase distribution for this case is shown in Fig. 35. The residual phase errors in this case are very much reduced: the peak-to-peak phase variations across the aperture are within ±1 degree. The resulting antenna beam pattern is also shown in Fig. 36 where it is seen that the beam is symmetric in spite of the misaligned optics. There is no significant loss in antenna gain. The resultant beam shift is 22 arcsec as expected from the summation of the shifts for the individual displacements. A point to be noted is that displacements in one component of the antenna optics may be compensated for by appropriate displacements in another component and the gain loss may be recovered; however, a residual pointing error remains. Viewing the antenna as a radiator, the pointing shift is because the wavefront leaving the MR has a tilt w.r.t. the axis of symmetry of the MR. The pointing error, when compensating displacements are made, is not frequency dependent. The aperture phase errors that cause the gain loss are frequency dependent; therefore, the gain loss due to displacements in the optics increase with frequency and the aperture phase errors, after the removal of a wedge corresponding to a pointing shift, also increase with frequency.
-5
-4
-3
-2
-1
0
1
2
3
4
5
-12 -8 -4 0 4 8 12
Offset (m)
Ap
ertu
re p
has
e (d
egre
es)
0 offset Offset Feed + SR tilt
Figure 35: Slices across the aperture phase distributions for the case where a 0.065 degree SR tilt is compensated by a -13 mm feed displacement. The computation for an aligned optics case is also shown for reference.
27
0
2
4
6
8
10
12
-3 -2 -1 0 1 2 3
Offset (arcmin)
Bea
m p
atte
rn (
far
fiel
d a
mp
litu
de)
0 offset Offset Feed + SR tilt
Figure 36: Slices across the beam pattern for the case where a 0.065 degree SR tilt is compensated by a -13 mm feed offset. The computation for an aligned optics case is also
shown for reference. A minor point to note is that in these computations, where I’ve made a pair of small compensating offsets, the antenna gain has been slightly (1-2%) higher in the cases where compensating offsets have been made as compared to the aligned optics case. I attribute this to the fact that in the aligned case, the peak of the feed radiation pattern falls on the centre of the SR and is reflected back to the part of the MR that is occupied by the feed cone room. Therefore, the central parts of the feed beam pattern are scattered/absorbed and lost. However, when the optics are misaligned, this part is redirected to the unblocked part of the antenna aperture plane. The consequent increase in antenna gain offsets the loss due to residual phase errors across the aperture. Summary: q With the SR in the correct position, the gain loss will be less than 1% if the feed is
positioned axially to within ±8 mm of its correct location. q If the axial locations of the feed and SR were kept fixed, the loss of antenna gain
would be about 1% at the edges of the W band due to the travel in the phase centre within the feed.
q The axial displacement of the SR has to be within 0.25 mm for the gain loss to be within 1%.
28
q Provided the feed is within ±20 mm of the correct location, axial adjustment of the SR may recover the gain to within 1% of maximum. For an offset δz of the feed, the required SR displacement is (δz/30.6).
q The feed needs to be located within 5 mm of the optical axis to keep the gain loss within 1%.
q I would keep the feed axis aligned to within about 2 degrees of the optical axis to maintain beam symmetry.
q A displacement of the SR by 0.75 mm off the optical axis is expected to result in 1% gain loss.
q A tilt in the SR by 0.02 degrees, which corresponds to axial displacements of 0.5 mm at opposite edges of the SR, results in a 1% gain loss.
q If the turret positions the mm and cm feeds within 1 mm, the relative pointing
differences would be within 3.56 arcsec. q The beam shift is 18 arcsec per mm off-axis displacement of the SR. q The pointing offset is 6.18 arcmin per degree of tilt in the SR; in more useful
units, the pointing offset is 15.4 arcsec for ±1 mm axial offsets at opposite edges of the SR.
ð If misalignments in the antenna optics result in aperture phase errors, this
introduces an additional calibration requirement which, if neglected, could limit the dynamic range in mosaic imaging. The aperture phase errors are probably of greater concern than the antenna gain loss.
q A 5 mm offset in the feed, off the optical axis, results in ±10 degree phase errors across the antenna aperture.
q A 1 mm SR displacement off the optical axis results in 30 degree peak-to-peak phase errors across the aperture. The phase error increases almost linearly with the magnitude of the displacement.
q The peak-to-peak phase variation across the antenna aperture is about 30 degrees for a 0.04 degree SR tilt. This phase error increases fairly linearly with the tilt angle.
ð To first order, the aperture phase errors due to (i) off axis displacements in the
feed, (ii) off axis displacements in the SR and (iii) tilts in the SR may be compensated by a mechanism for 2-axis adjustment of just one of these three movements. The loss in gain is almost fully recovered and the symmetry in the beam patterns may be restored. For example, SR translation could compensate for SR tilts; an off axis repositioning of the feed could compensate for SR displacements as well as SR tilts. The penalty is a pointing offset; however, the offset will be independent of frequency. It may be worthwhile building in a capability for translating the W-band feed perpendicular to the optical axis instead of building machinery for off axis movement of the SR or for tilting the SR. Small (±3 mm) misalignments and/or tilts in the SR may be compensated by a feed repositioning. Dynamic translation of the feed perpendicular to the elevation axis may be a simpler method of correcting for gravity induced structural deformations as compared to SR repositioning.