Asymmetric Oil Price Shocks and Stock Prices in Nigeria · economies. He concluded that...
27
Munich Personal RePEc Archive Asymmetric Oil Price Shocks and Stock Prices in Nigeria Awolaja, Gbenga Oladapo and Musa, Dasauki C. Babcock University, Babcock University 2017 Online at https://mpra.ub.uni-muenchen.de/92891/ MPRA Paper No. 92891, posted 05 Dec 2019 14:21 UTC
Transcript of Asymmetric Oil Price Shocks and Stock Prices in Nigeria · economies. He concluded that...

Munich Personal RePEc Archive
Asymmetric Oil Price Shocks and Stock
Prices in Nigeria
Awolaja, Gbenga Oladapo and Musa, Dasauki C.
Babcock University, Babcock University
2017
Online at https://mpra.ub.uni-muenchen.de/92891/
MPRA Paper No. 92891, posted 05 Dec 2019 14:21 UTC

1
Oil Price Shocks and Stock Prices in Nigeria
G. O Awolaja1
M.C. Dasauki2
ABSTRACT
This study investigated the relationship between crude oil price, exchange rate and
sectoral stock prices in Nigeria between 2009 and 2016, using quarterly data collected
from the Central Bank of Nigeria (CBN) and Nigeria Stock Exchange. Oil and Gas
stock index of the Nigeria stock exchange was considered as dependent variables. The
study implemented unit root with and without structural breaks to determine the order
of integration and further applied a nonlinear ARDL (NARDL) model, which is an
asymmetric extension of the standard co-integration test and the standard ARDL. The
NARDL was applied to determine the asymmetric effect of crude oil price shocks on
stock prices. Findings from the study indicate that the impact of oil price on stock price
is symmetric and not asymmetric in both short-run and long-run and the effect is
completely transmitted. The symmetric impact means that a given magnitude of positive
and negative oil price shocks will affect the oil and gas stock index in the same fashion.
The study concludes that there should be close monitoring of the oil & gas sectors as
well as appropriate policy actions to curtail systematic risk in the sector since oil price
shocks transmits to oil and gas share prices listed on the Nigeria Stock market since
the listed firms will make as much loss as the profit they made when impacted by
positive and negative oil price shocks.
Keywords: Asymmetry, Nonlinear ARDL, Crude oil price shocks, exchange rate
Sectoral
Word Count: 274

2
1. Introduction
The source of government revenue in Nigeria has been from the oil sector for more than three
decades, using the price of the product in the international market as the benchmark price.
Performance of successive government’s budget in Nigeria has based its budgetary preparations
mostly on earnings from oil; hence the performance of the economy often becomes sensitive to
the variations in crude oil production and its prices to provide the needed foreign currencies
needed to support imports. In recent years, oil prices have not been stable thus having adverse
effects on budgetary planning in Nigeria with serious consequences on the overall economy
(Asaolu & Ilo, 2012). The over-reliance of the economy on the importation of virtually all goods
including refined oil despite being the 5th
largest exporter of crude oil in the world has made the
Nigerian economy more vulnerable to exchange rate volatility, despite the expectations that
depreciating exchange rate is expected to boost exports. According to Daly (2011) volatility is
when a variable change frequently over time, the variable is said to be volatile. Volatility is
associated with unpredictability, uncertainty, and risk. This is why most people consider
volatility to be similar to the risk and they consider high volatility as a symptom of market
disruption whereby securities are not being priced fairly and the capital market is not functioning
well enough as it should. This explains why most economist and analysts paid close -attention to
these changing crude oil prices with a view to minimizing loss of revenue in the future as a result
of price volatility. Oil price has been considered more volatile since the oil crisis of 1973 and this
volatility has been defined as the standard variation or deviation in a given period and it is a
measure of risk ( Fleming and Ostdiek (1999),.
The volatility of stock price has become increasingly important for market participants,
regulators and academicians. To some other researchers, volatility has generated the arrival of
new and unanticipated information which tends to alters expected return on a stock price and as
such, the changes in the price volatility of the stock market would simply be a mere reflection of
changes in the local and global business environment. Sauter and Awerbuch, (2003) showed that
rising oil prices and volatility has a tendency to suppress economic activities and reduce asset
value. It is also shown that countries that engage in oil trade are more exposed to the elements of
price shocks on global commodity markets (Rentschler, (2013), This is also true for performance
of listed oil and gas companies in the stock market. Pindyck, (1991) argues that changes in
energy prices create ambiguity about future energy prices, causing firms to postpone irreversible

3
investment decisions in reaction to the outlook for profits. Hassan and Ratti, (2012) argue that oil
price volatility will impact on stock prices by first of all affecting expected cash flows and
discount rates. Since oil serves as an input in the production process which can also affect the
demand for the output any given industry and also the national levels, then we can conclude the
oil price can directly and significantly affect corporate cash flows.
2. Literature Review
Mukherjee and Naka (1995) applied a vector error correction model to examined the dynamic
relationship between six macroeconomic variables and the Japanese stock market. the study
found found long-term equilibrium relationship between the Japanese stock market and the six
macroeconomic variables including exchange rate, money supply, inflation, industrial
production, long-term government bond rate and call money rate. On the other hand, Sadorsky
(2001) chose Canadian companies with stock market index, energy price, interest rates, and
exchange rates as explanatory variables. The study found the rise of the stock market index and
oil price had a positive effect on oil companies’ returns, while the rise of interest rates and
exchange rates had a negative effect.
Park and Ratti, (2007) examined the U.S. and 13 European countries. The study found
evidence that increased volatility of oil prices significantly depresses real stock returns in the
European countries. further, the study showed The study also found that an increase in real oil
price will bring about a significant increase in the short-term interest rate in the U.S. and eight
out of 13 European countries within one or two months. Counter to findings for the U.S., there is
no evidence of asymmetric effects on real stock returns of positive and negative oil price shocks
for any of the European countries.
Babatunde, (2009) examined whether nonlinear crude oil effect observed in aggregate US
stock return can be explained by unexpected shocks from the crude oil market. The study
separated the distribution of aggregate US stock return into variance component driven by
smoothly arriving news information and discrete Poisson news arriving from the crude oil
market. The study revealed that unexpected crude oil shocks have a nonlinear effect on excess
US stock market return. Contemporaneous and lagged returns on crude oil futures have a
significant negative effect on jump distribution in US stock market returns. Hammoudeh and Li
(2004) have suggested that the oil price increases have had positive impacts on the USA,
Mexico, and Norway oil and transportation industries stock yields, while Boyer and Filion
(2007) have found out the similar impact for the Canadian oil and gas stock returns. Sadorsky

4
(1999) stated that there is no evidence indicating that the shocks caused by the volatility of the
oil prices have an asymmetric impact on the economy.
Maghyereh (2004) studied the dynamic relationship between oil price shocks and stock
market returns for 22 emerging economies. Results from the variance decomposition analysis
show very weak evidence that oil price shocks affect stock market returns in emerging
economies. He concluded that inconsistent with previous empirical studies in developed
economies, stock markets in the emerging economies are inefficient in the transmission of new
information of the oil market, and stock market returns in those countries do not rationally signal
changes in crude oil price.
Rahman & Uddin, (2009) examined the macroeconomic determinants of stock market
returns for the Malaysian stock market by employing the co-integration technique and vector
error correction mechanism (VECM). Using monthly data ranged from January 1986 to March
2008, they found that interest rates, reserves, and industrial production index were positively
related while money supply and exchange rate were inversely related to Malaysian stock market
return in the long-run. Their causality test indicates a bi-directional relationship between stock
market return and interest rates.
Babatunde and Adenikiju (2010) did the first notable work on oil price shocks in Nigeria.
The study examined oil price and the Nigerian stock market between 1995 and 2008. Quarterly
data was used in the study. The study provided evidence that the stock market exhibits an
insignificant positive response to oil price shock which later reverts to negative shocks
depending on the nature of the oil price shock, after a period of time. The statistical evidence of
the study did not support the asymmetric effect of oil price shocks on the Nigerian stock returns.
Ayaz, (2014) investigated the response of various macroeconomic factors (GDP, Money
supply, inflation, exchange rate and size of firm) toward stock market prices in case of Karachi
stock exchange KSE over a period of 1971 to 2012. The study utilized the Autoregressive
Distributed Lag Model (ARDL) technique. The result showed that in long-run each factor
significantly contributed to the stock price while in shot run some factors were significant while
some were not but the error correction term showed significant convergence toward equilibrium.
The findings of the study suggested that for smoothness of the stock market the current factors
must be targeted.
Bhattacharya, (2011) analyzed the causal relationship between the stock market and three
macroeconomic variables in India using Granger non-causality. The result showed that there is
non-causal linkage between stock prices and the three variables considered (exchange rate,

5
foreign exchange reserves and trade balance) while Basher and Sadorsky (2006) investigate the
relationship between oil price risk and stock market returns in 21 emerging stock markets and
find strong evidence that oil price risk impacts stock price returns in emerging markets.
Siddiqui, (2015) analyzed if changes in oil prices at a global level affect the stock market
returns in the Indian market. Daily closing stock market price data from National Stock
Exchange (NSE) and daily oil prices, for the period beginning from January 2010 to December
2014, are taken into consideration. VAR model of cointegration is used to test the relation
between the two variables. It is found that there is no long term integration between oil price and
Indian stock index series. Apart from the long term, these series do not even cause each other in
short-run.
Acikalin, (2008) used cointegration test and vector error correction model to submit that
exchange rate provides a direct long-run equilibrium relationship with the stock market index.
Findings from the study reveal two ways of causalities between the two variables; implying that
the prediction of ISE is possible using the past information on the moves of the exchange rate.
The study of Ali, Kashif, Ayse, Muhammad and Hasan (2010) on the Pakistan Stock Exchange
reveals that the exchange rate has no cointegration with stock exchange price index. The authors
went further to establish that there is no Granger causality between exchange rate and stock
market performance.
Asaolu and Ilo, (2012) Investigated the relationship between the Nigerian stock market
return and the world crude oil price. This has been analyzed under the cointegration and vector
error correction (VECM) framework from 1984 to 2007. They found that oil price has a negative
impact on stock prices(i.e. increases in oil price will depress stock prices while exchange rate
affects stock market prices negatively i.e. exchange rate depreciation will cause stock price
depreciation. The study shows that the Nigerian stock market return and oil price are tied
together in the long –run as anticipated given the dominance of the oil sector on the Nigerian
economy.
Adaramola, (2012) This study examined the long-run and short-run dynamic effects of oil
price on stock returns in Nigeria over 1985:1–2009:4 using the Johansen cointegration tests. A
bivariate model was specified and empirical results show a significant positive stock return to oil
price shock in the short-run and a significantly negative stock return to oil price shock in the
long-run. The Granger causality test shows strong evidence of unidirectional causality with the
causation running from oil price shock to stock returns; implying that variations in the Nigerian
stock prices are explained by oil price volatility.

6
Akomolafe, Jonathan and Danladi, (2014) analyzed the relationship between the industrial
stock returns and changes in oil price. The variables considered include stock market returns for
the selected industries are; banking, oil and gas, and construction industries. World oil price and
market all share index to capture stock market size. Co-integration and Vector Error Correction
mechanism result indicates that industries belonging to sectors apparently do not directly affect by
oil prices, are also sensitive to oil price changes. The banking sector responds mostly to change in
oil price.
Babatunde and Adenikiju (2012) investigated the interactive relationship between oil price
shocks and the Nigeria stock market. The study applied a multivariate vector Auto-regression
which makes use of the generalized impulse response function and the forecast variance
decomposition error. Empirical findings from the study showed that oil price has no significant
impact on stock market returns. The study covered all sectors of the Nigeria stock market. The
empirical findings from the study did not find any evidence of an asymmetric effect of oil price
shocks on the Nigeria stock returns indices. This study has taken credit for being the first notable
work to investigate the dynamic linkage between stock market behavior and oil price shocks in
Nigeria. However, this study failed to capture long-run asymmetry. In our study, we will
investigate both short-run and long-run asymmetric impact of oil price and stock price in the
Nigeria stock market, for oil and gas stock index.
Ogundipe, Ojeagaa, and Ogundipe, (2014) examined the effects of oil price, external
reserves and the interest rate on exchange rate volatility in Nigeria using annual data covering
the period 1970 to 2011. The long-run relationship among the variables was determined using
the Johansen Co-integration technique while the vector correction mechanism was used to
examine the speed of adjustment of the variables from the short-run dynamics to the long-run
equilibrium. It was observed that a proportionate change in oil price leads to a more than
proportionate change in exchange rate volatility in Nigeria; which implies that the exchange rate
is susceptible to changes in oil price. The study, therefore, recommends that the Nigeria
government should diversify from the oil sector to other sectors of the economy hereby
dwindling the impact of crude oil as the mainstay of the economy and overcome the effect of
incessant changes in crude oil prices which often culminate into macroeconomic instability.
Ayinde, (2014) examined the impact of exchange rate fluctuation on the performance of
the manufacturing sector in Nigeria. Testing the hypothesis that high-frequency data matters for
forecasting volatility, the study used of generalized autoregressive conditional heteroscedasticity
7
(GARCH) technique coupled with quarterly time series data spanning the period 1986-2012 to
investigate the relationship. In tandem with theoretical exposition, our results show that the
exchange rate has a significantly negative relationship on manufacturing performance.
Akinlo, (2014) examined the relationship between changes in oil prices and stock market
growth. In his finding, oil price exchange rate and stock market have long-run relationships and
there is unidirectional causality from oil price change to stock market development. The oil price
has a temporary positive impact on stock market growth. His study also showed that stock
market growth depends on oil price changes.
Osuala and Ebieri, (2015) examined empirically the long-held theory that crude oil price
change negatively impacts on stock market return. Using monthly data covering the period 1985
to 2011- resulting in 324 data points, the study examines this theory in the context of Nigeria.
The study finds a significantly positive relationship between oil price and stock market return
both on the short-run and the long-run, and that the direction of the relationship is from oil price
to market return, and finds no reverse causation. The study, therefore, recommends a strong
effort towards diversification of the Nigerian economy in order to avoid the detrimental effect of
fall in oil price in the international market.
Uwubanmwen and Omorokunwa, (2015) investigated the effect of oil price volatility on
stock price in Nigeria using quarterly data from 1990 to 2012 period using both statistical and
econometric techniques for the analysis. The Error Correction Mechanism (ECM) and the Bi-
variate GARCH model were used to test for the relationships and to check if volatility in oil
prices are transmitted to stock prices in Nigeria. The basic indication of the empirical modeling
technique used in the study showed that volatility in oil prices are transmitted to stock price
volatility. The study found a positive relationship between oil price and stock and a Negative
relationship between exchange rate and stock price in Nigeria.
Based on the Random Walk Theory, stock returns should be entirely unpredictable due to
investors’ arbitrage motives and such, share prices behave in an independent manner. There is
no relationship between the past prices of a share and its future price. Hence, the behavior of
prices is largely unpredictable based on their past history. The efficient markets hypothesis
(EMH), popularly known as the Random Walk Theory, is the proposition that current stock
prices fully reflect available information about the value of the firm, and there is no way to earn
excess profits, (more than the market overall), by using this information. The efficient markets
hypothesis (EMH) suggests that profiting from predicting price movements is very difficult and

8
unlikely. The main driver of price changes is the arrival of new information including
information will be automatically reflected in the market price of an asset. A market is said to be
“efficient” if prices adjust quickly and, on average, without bias, to new information. As a result,
the current prices of securities reflect all available information at any given point in time.
3. Motivation
The main objective of this study is to determine empirically, the effects of Oil price Shocks on
NSE Oil and Gas stock price index in Nigeria. Specifically, in this study, we will investigate the
presence of an asymmetric relationship between oil price shocks and stock prices in Nigeria.
Although this subject has been broadly examined in the literature, such studies were mostly
using the All-share index as a proxy for the stock market. All share index is an aggregated stock
price which is made up of several sectors listed in the stock market. If different industrial sectors
will respond differently to oil price shocks which are hidden in aggregated ASI and idiosyncratic
behaviors will not be captured. In this study,, we will concentrate on how oil price shocks affect
the aggregated stock prices of oil and gas listed corporation listed in the Nigeria stock market.
Secondly most of the studies were based on linear models that were built based on
the presumption that the impact of a positive and a negative shock on stock price is symmetric,
however, recent empirical studies showed evidence of existence on asymmetric impact. Thus we
will apply a nonlinear Autoregressive Distributed lags model (NARDL) to investigate the
asymmetric relationship between oil price and stock prices in Nigeria, decomposing oil price in
to positive and negative shocks, and incorporating these shocks as independent variables into the
model to explain variations in stock price of listed oil and gas firms in Nigeria. Among studies
based on Nigerian stock market, Babatunde et al (2012) is the most related work to our study
with is not based on aggregated stock prices using all share index of Nigerian stock market and it
is the first notable work to investigate the dynamic linkage between stock market behavior and
oil price shocks in Nigeria; and the study is based on disaggregated stock returns, since different
sectors will react differently to oil price shocks Hung’s et al. (1996); Faff and Brailsford (1999);
Choe (2002); Sadorsky (2008) have shown that oil price shocks influenced various industries’
stock price differently they further showed that oil price shocks influenced various industries’
stock price differently. A common held view is that oil price shocks are beneficial for oil
companies upstream, yet has an adverse effect on companies downstream and other industries.
9
Our study differs from literature including Babatunde et al. (2012) in that, their study is
based on a short-run model which capture only short-run asymmetries and has no ability to
account for long run asymmetries. Due to this limitation in the study, we will apply the NARDL
model to account for both short-run as well as a long run asymmetric effect on positive and
negative oil price shocks on stock prices in Nigeria stock market. NARDL is an asymmetric
extension of the standard cointegration test of Pasaran and shin (2011).
4. Data and Methodology
The study will use stock closing value for oil and gas sector companies listed in the Nigeria
stock market as proxy for the Nigerian stock market performance. Oil price: international oil
price (Brent) in US dollars and Exchange Rate in Nigeria the rate at which naira in exchange.
The study employed quarterly data from 2009.Q1 to 2016.Q3 collected from the Central Bank of
Nigeria (CBN) Statistical Bulletin and Nigeria Stock Exchange Market. According to the Nigeria
Stock Exchange Fact Sheet for 2018, Quarter 3, In the Nigeria Stock exchange (NSE), equities
are listed under 11 industry sectors. The NSE has 13 indices that track market and sector
performance; they consist of the NSE All-Share Index (ASI), the NSE 30 Index, the NSE
Pension Index, the NSE Banking Index, the NSE Consumer Goods Index, the NSE Industrial
Index, the NSE Insurance Index, the NSE Oil and Gas Index, among others. In this study, we
will focus on only the NSE Oil/Gas Index as a proxy for stock market performance for oil and
gas listed companies listed in the Nigerian stock exchange market.
The study applied the nonlinear ARDL (NARDL) extension to ARDL approach to co-
integration due to its ability to uncover long-run hidden asymmetric relationship which other
techniques such as ARDL are unable to trace (Ibrahim, 2015). Below is the specification of the
asymmetric equation of oil price similar to the original equation of Schorderet, (2003) and Shin
et al. (2011).
0 1 2 3 ................1t t t t tsp exch op op e
Where SP is oil and gas stock price index; and are the associated asymmetric long-run
parameters. They denote the partial sum process which accumulates positive and negative oil
price respectively. They are also referred to as the partial sums of positive and negative changes

10
in top . 1 ,
2 and3 is a co-integrating vector or a vector of long-run parameters to be
estimated (Mansor, 2015).
1 1
1 1
( ,0).....................................(2)
( ,0)......................................(3)
t t
t i i
i i
t t
t i i
i i
op op Max op
op op Min op
As shown in Shin et al. (2011) equation (1) above can be framed in an ARDL setting along the
line of Pesaran and Shin (1999) and Pasaran et al. (2001)
Where, p, q, and s are lag orders 22
0
and 33
0
the aforementioned long-run impacts
of respectively oil price increase (positive shocks) and oil price reduction (negative shocks) on
the stock price. 0
s
i
i
Will measure the short-run influence of oil price increase on stock price
while 0
s
i
i
will Measure the short-run influences of oil price reduction on the stock price.
Hence the NARDL will capture short-run asymmetric influences on stock price in addition to the
long-run asymmetric influences. This study investigates the effects of positive and negative oil
price shocks on oil and gas sector index of the Nigeria stock exchange and so we modify model 4
to arrive at the final specification of the asymmetric model as shown in model 5 below.
If finding from the study shows there is no Asymmetry, then we will reduce model 5 to the
symmetric model specified in model 6 below. Model 6 captures only the symmetric effect of oil
price on stock price, meaning that the impact of an oil price increase is the same as that of an oil
price decrease on stock prices.
11
The application of a multivariate Non-Linear Autoregressive Distributive Lag (NARDL)
model will enable the estimation and analysis of Long-run asymmetric dependence between Oil
price and sector stock price. The stock price for the oil & gas sector was transformed into
logarithm so as to enable data for all variables to be at the same level (percentages). The
implementation of the Nonlinear ARDL (NARDL) approach to co-integration followed the
following procedure: First, Although the ARDL approach to co-integration is applicable
regardless of order of integration i.e. regardless if the variables are I(0) or I(1), however, it was
important to conduct unit root tests to ensure absence of I(2) variable(s). Presence of I(2)
variable(s) will render the computed F statistic for testing cointegration invalid. It is based on
this intuition that we conduct ADF and Ng Peron unit root to establish the order of integration
Mansor, (2015). Second step: equation 6; 7 and 8 were estimated using OLS estimation method
similar to Katrakilidis and Trachanas (2012), the general to the specific procedure will be
followed to arrive at the final specification of the NARDL model by trimming insignificant lags
Thirdly, based on the result of the NARDL, the study implemented bound test of Pesaran
et al. (2001); shin et al. (2011) to test for co integration among variables. The bound testing
approach is used in this study, alternatively, the Wald F test can be used to test the restriction, the
Null Hypothesis that1 2 3 0 against the alternative hypothesis:
1 2 3 0 . The
final step involved the examination of long-run and short-run asymmetries in the relationship
between oil price and sector stock prices (Oil and Gas stock index).
5. Discussion of Result
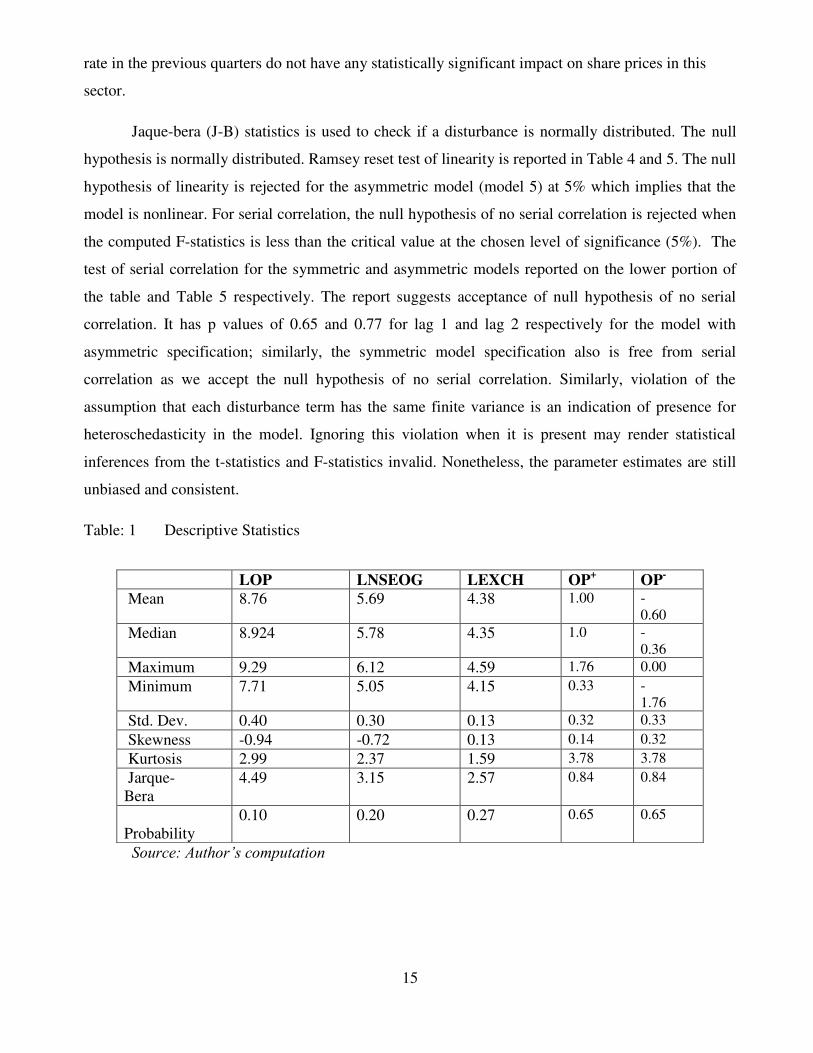
Before inferences are drawn, this study will judge the adequacy of the dynamic specification on
the basis of various diagnostic statistics. The descriptive statistics for the variables under
consideration are reported in 1.1A respectively. The result on Table 1 shows Jaque-bera statistics
to be very low, with P-value greater than 5% for all variables after transformation to log, which
implies that all the series are selected from a normal distribution. All the variables are negatively
12
skewed except exchange rate which is positively skewed. Result of the unit root test is presented
and analyzed below.
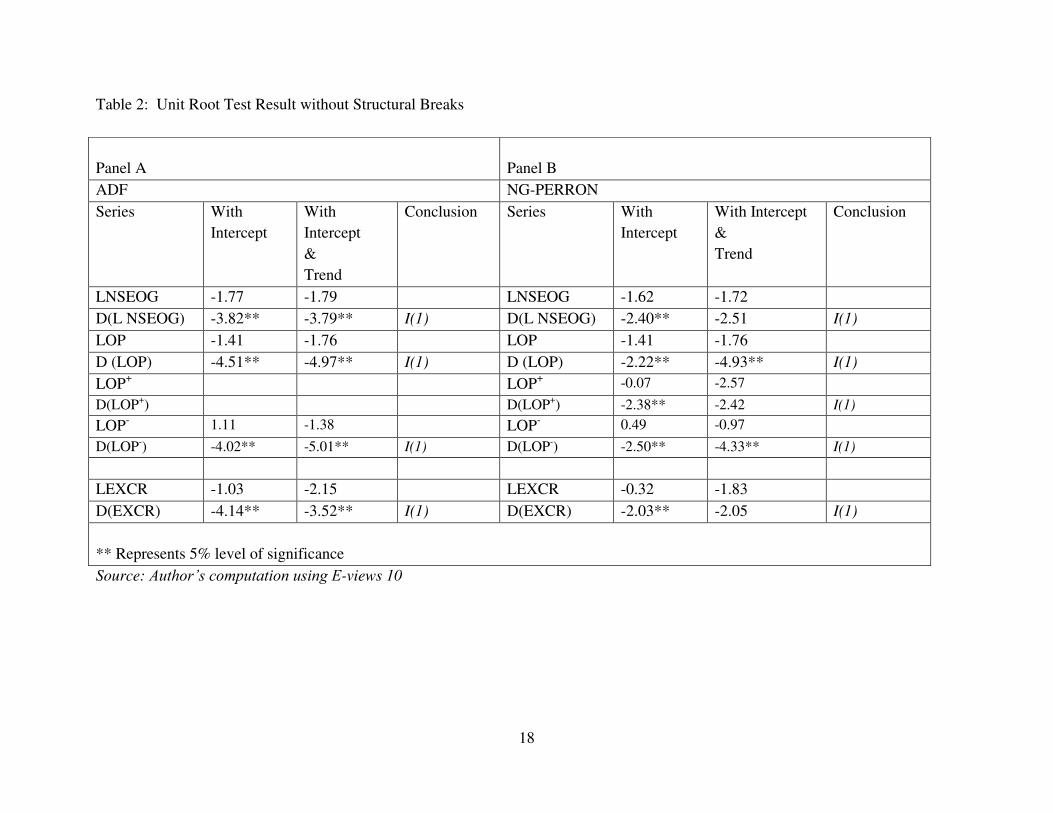
The unit root test statistics reported in Table 2 have rejected the null hypothesis of unit
root at first difference, implying that all the series are not stationary but they will become
stationary after first differencing because the test statistics is greater than the critical value at 5%
level of significance. The ADF and NG-Peron tests reported in Table 2 shows that all the
variables are statically significant at 5% and as such, it suggests the rejection of the null
hypothesis of no unit root. Table 2 presents ADF and Ng-Perron unit root tests on panel A and
Panel B of Table 2 respectively. Due to the inability of ADF and NG-Perron to account for
breaks, which can reduce its power to reject the null hypothesis in presence of structural breaks
in the series, this study also employed the use of Zivot-Andrew test of unit root with breakpoints
and dates. The result for the Zivot-Andrews test is reported in Table 3.1 and Table 3.2 which
shows that all the variables are stationary after first difference and after accounting for structural
breaks. Table 3.2 reports unit root result at first difference while Table 3.1 shows the unit root
test before the transformation of variables to logarithm.
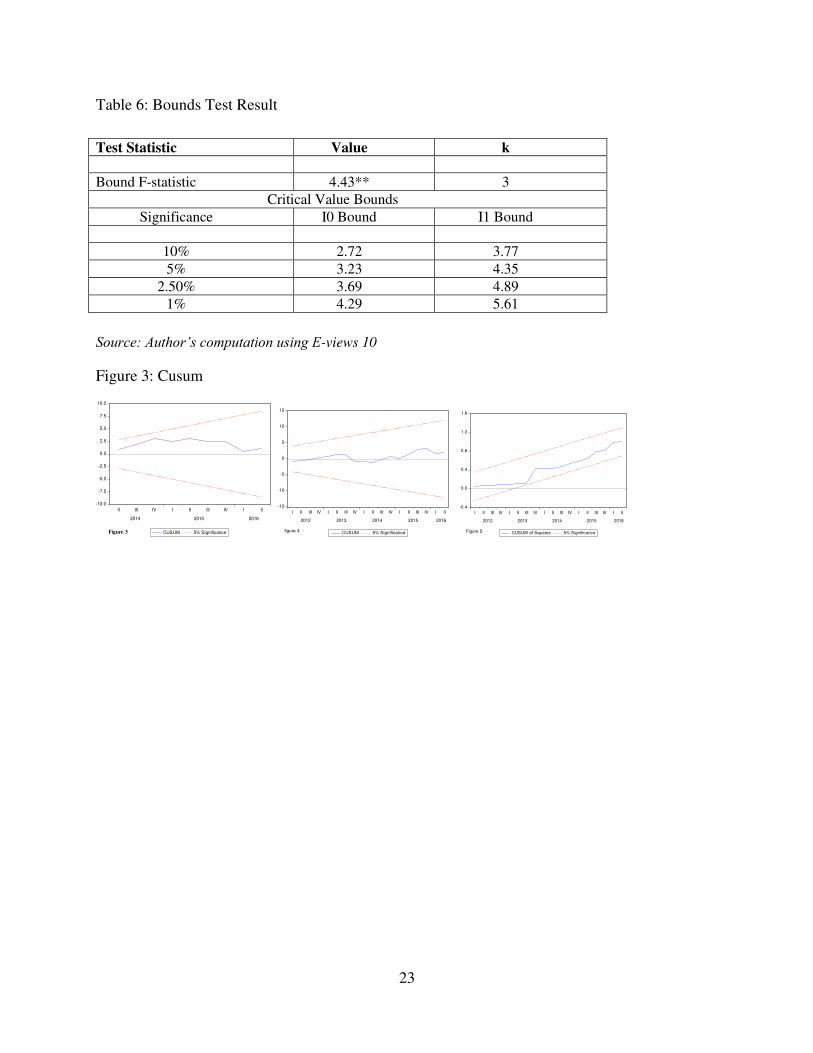
The bound test estimation output reported in Table 6 shows evidence that co-integration
is present. This finding is in harmony with the error correction term in Table 4 and 5 for the
symmetric and asymmetric model respectively. The error correction term for both symmetric and
asymmetric models are negative and statistically significant, which suggests presence of long-run
cointegration however, the bound test statistics is not significant, we conduct the long-run
estimation based on the error correction term.
Long-run and Short-run estimates for the symmetric model are reported on table 4 with
the long-run estimates at the lower end of the table 4.The short-run estimates reported on the
upper part of table 4 shows that the lags of the dependent variable and lags of changes in crude
oil price are not statistically significant.. The oil price has positive coefficient of 0.66%, implying
that a 1% change in oil price will be bring about a 0.66 percentage increase in share price index
of oil and gas sector of NSE while exchange rate has a negative coefficient, showing that a one
percentage increase in oil price will on the average bring about a 1.74 percentage decrease in
share prices of oil and gas sector index of NSE. The symmetric model is free from serial
correlation and hetroschedasticity as shown by the LM (Breausch Godfrey)and Arch test
estimates reported on the lower portion of table 4A.

13
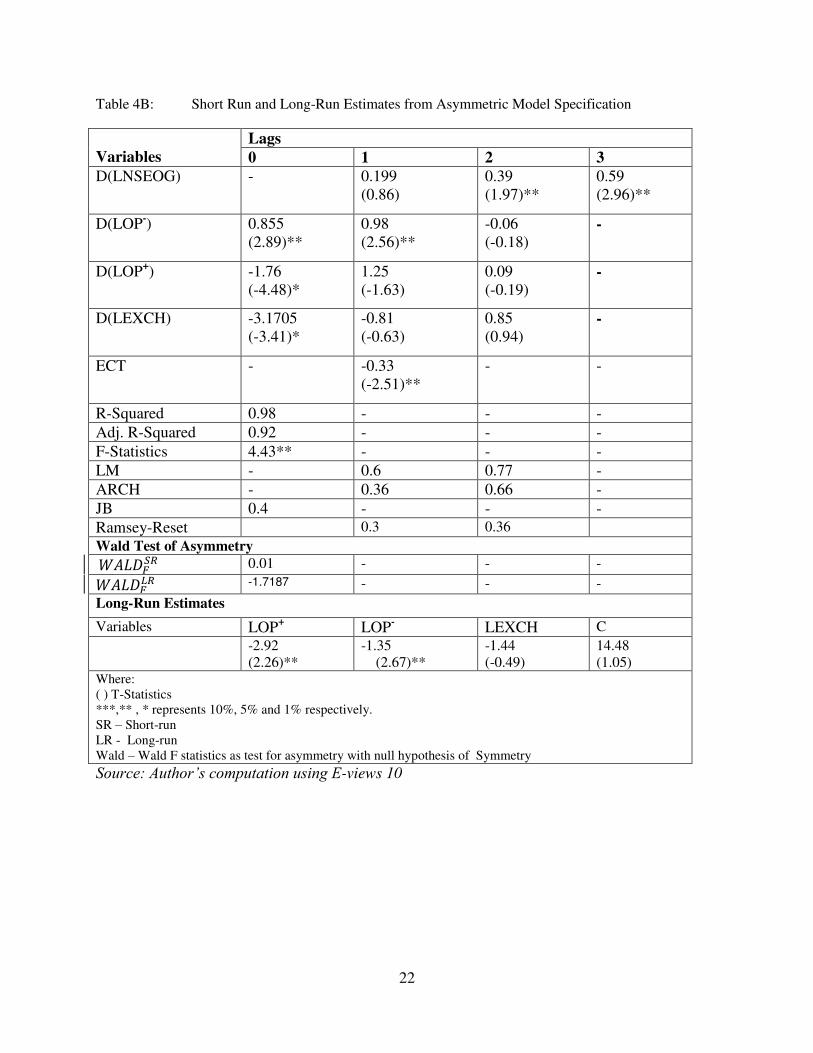
The error correction term on table 5 for the asymmetric model is negative and also
statistically significant, which means 33% of deviations from equilibrium is corrected in the first
quarter. The significance of the error correction term also re-enforces the presence of long-run
co-integration. The long-run estimates for model 5, the asymmetric model, are reported in Table
5. The long-run coefficients on Table 5 are normalized and after normalization, all variables have
positive coefficients. Positive crude oil price and negative crude oil price are statistically
significant both with have positive coefficients. The positive coefficients imply direct
relationship, suggesting that a 1% increase in negative crude oil price shocks will bring about
1.34% increase in share prices in oil and gas sector, while an increase in positive crude oil price
shocks will bring about an increase of 2.91% in share prices in the oil and gas sector in the long-
run.
The lags of positive and negative crude oil price shocks are statistically significant in the
short-run, as well as in the long-run. This means that the short-run effects of positive and
negative oil price changes will last longer or extend into the long-run. The statistical significance
of both positive oil price and negative oil price implies that the oil price pass-through to stock
price is complete and the effect is a permanent effect.Long-run asymmetry is reported on the
lower part of Table 5 which shows that although positive and negative oil price shocks are
statistically significant in the long-run, a given magnitude of positive crude oil price shock has
the same amount impact as negative oil price shocks on oil and gas stock index. This evidence is
reported in the lower part of table 5 with long-run Wald F-statistics not significant suggesting
non rejection the null hypothesis of symmetric impact of oil price shocks on stock prices.
Exchange rate has a coefficient of 1.436 which means that a 1% change in exchange rate will
affect stock prices in oil & gas sector with an increase of 1.43% but this effect is not statistically
significant in the long-run. Exchange rate has a significant impact on stock prices in oil & gas
sector in the short-run but this effect is not significant in the long-run i.e. the effect does not
extend or last into the long-run, as it fizzles away before the long-run, therefore, the effect of
exchange rate on stock price is only temporary.
14
In the upper part of table 5, we report the short-run estimates obtained from the
asymmetric model in order to ascertain the short-run implications of positive and negative crude
oil price shocks on share prices of oil and gas sector in Nigeria. Lags of share prices in oil and
gas sector are statistically significant with coefficients of 0.39 and 0.59 for second and third lags
respectively, implying that share prices in the previous quarter have a statistically significant
impact on share prices in the current quarter of the oil & gas sector by 0.39% and 0.59% for
second and third lags respectively. Negative crude oil price shocks have a statistically significant
positive coefficient of 0.85 which is statistically significant. It means that a 1% increase in
negative shock in crude oil price will bring an increase of 0.85% in share prices in the oil & gas
sector. One Lag of negative crude oil price shock is also positive and significant with a
coefficient of 0.97 implying that a 1% increase in negative shocks of oil price in previous period
will bring about 0.97 percentage increase on current share prices while the second lag is not
statistically significant implying that two lags of oil price decrease do not significantly affect
current share prices in the short-run in the oil and gas sector. Positive crude oil price shock is
statistically significant in the short-run but one and two lags of positive crude oil price shocks are
not statistically significant because they have p-values that are greater than 5%, meaning that
crude oil price shocks in previous years have no statistical impact on the current share prices in
oil and gas sector. Only the current positive crude oil price shock is statistically significant and
as such, 1% increase in positive oil price shocks will bring about a statistically significant
decrease of 0.18% in share prices in the oil and gas sector in the short-run.
The long-run estimates can be interpreted in terms of elasticity, thus, since the long-run
coefficients of positive and negative oil price shocks are greater than one which can be related to
elasticity to mean that, a one percent change in positive oil price shocks will bring more than one
percent change increase in share prices in oil and gas sector. Similarly, a one percent increase in
negative oil price shocks will bring about a more than one percent change in share prices in the
oil and gas sector. Exchange rate also has a coefficient greater than one, indicating an elastic
relationship which is interpreted to mean, a one percent change in exchange rate will bring about
a more than one percent change increase in share prices in the oil and gas sector. Exchange rate
has a coefficient of -3.17 which is statistically significant. It implies that 1% change in exchange
rate will on the average bring about 3.17% decreases in share price in the oil sector. The short-
run lags of exchange rate are not statistically significant and this means that changes in exchange
15
rate in the previous quarters do not have any statistically significant impact on share prices in this
sector.
Jaque-bera (J-B) statistics is used to check if a disturbance is normally distributed. The null
hypothesis is normally distributed. Ramsey reset test of linearity is reported in Table 4 and 5. The null
hypothesis of linearity is rejected for the asymmetric model (model 5) at 5% which implies that the
model is nonlinear. For serial correlation, the null hypothesis of no serial correlation is rejected when
the computed F-statistics is less than the critical value at the chosen level of significance (5%). The
test of serial correlation for the symmetric and asymmetric models reported on the lower portion of
the table and Table 5 respectively. The report suggests acceptance of null hypothesis of no serial
correlation. It has p values of 0.65 and 0.77 for lag 1 and lag 2 respectively for the model with
asymmetric specification; similarly, the symmetric model specification also is free from serial
correlation as we accept the null hypothesis of no serial correlation. Similarly, violation of the
assumption that each disturbance term has the same finite variance is an indication of presence for
heteroschedasticity in the model. Ignoring this violation when it is present may render statistical
inferences from the t-statistics and F-statistics invalid. Nonetheless, the parameter estimates are still
unbiased and consistent.
Table: 1 Descriptive Statistics
Source: Author’s computation
LOP LNSEOG LEXCH OP+ OP
-
Mean 8.76 5.69 4.38 1.00 -
0.60
Median 8.924 5.78 4.35 1.0 -
0.36
Maximum 9.29 6.12 4.59 1.76 0.00
Minimum 7.71 5.05 4.15 0.33 -
1.76
Std. Dev. 0.40 0.30 0.13 0.32 0.33
Skewness -0.94 -0.72 0.13 0.14 0.32
Kurtosis 2.99 2.37 1.59 3.78 3.78
Jarque-
Bera
4.49 3.15 2.57 0.84 0.84
Probability
0.10 0.20 0.27 0.65 0.65

16
To test heteroschedasticity, this study applied the ARCH test the results for both symmetric and
asymmetric model, is reported on the lower portion of Table: 4 and Table 5. The test statistics
show that these models are free from heteroschedasticity problem. The test could not reject the
null hypothesis of no serial correlation at 5% level of significance. The two model specifications
have ARCH p values all greater than 5% which implies that the null hypothesis of
homoschedasticity cannot be rejected at 5%. Finally, the CUSUM test statistics stays within 5%
significance level as shown by two straight lines whose equation are given in brown et al (1975),
then the coefficient estimates are said to be stable. The study also implemented the CUSUM test
of stability to check if model 6 is stabile models. The result of the stability test for model 4 and 5
are presented in Figures 3 and 4 stable models as reported at 5% level of significance.
Our finding is similar to Babatunde and Adenikiju (2012) for the short run with no
evidence of short-run Asymmetry; however we also did not find any evidence of long-run
asymmetry between positive and negative oil price shocks and stock prices in Nigeria.
Babatunde et. at (2012) did not account for long-run asymmetry or is rather silent about long-run
asymmetry as only short asymmetries were captured, in this study, we present evidence that there
is no long run and short run asymmetry as both positive and negative shocks impacts stock prices
with same magnitude.
6. Summary of Findings
In this study, We examined the relationship between oil price shocks and oil and gas stock index
of Nigeria stock market. We specified as symmetric model as well as an Asymmetric
specification to capture the asymmetric effect of oil price which the former cannot account. After
estimation of the symmetric and asymmetric models, we made the following findings:
1. The estimates from the asymmetric model show that there is a negative relationship
between positive oil price shocks and oil and gas stock index while the relationship is
positive and statistically significant for negative oil price shocks in the short-run for the
asymmetric model. On the other hand, exchange rate has a negative relationship with
share prices in oil and gas sector of the NSE. For the asymmetric model, positive and
negative oil price shocks have a negative relationship with share prices of oil and gas
sector of NSE.
2. Our major finding from this study is that In both long-run and short-run, the effect of
positive and negative crude oil price shock is symmetric and not asymmetric. This means

17
that positive and negative oil price shocks will have an impact of the same magnitude on
the share price index of oil and gas listed companies in the Nigerian Stock market. For
this reason, we revert to the findings from the symmetric model.
3. From the Symmetric model, there is a positive relationship between oil price and NSE
Oil and Gas index. That a 1% increase in oil price will improve Oil and Gas stock Index
by 0.66% on average and vice versa.
7. Conclusion
Based on the aforementioned findings of the study, We conclude the there is a strong evidence of
a linkage between NSE oil and gas index and oil price shocks, and that positive and negative
crude oil price shocks have statistically significant impact on NSE oil & gas index, however the
impact of a positive shocks (Good News) and negative oil price shocks (Bad News) will impact
on NSE oil and gas listed companies in a similar fashion. Thus the effect of positive and negative
oil price shock is permanent. On the other hand, exchange rate also statistically impacts on the
share prices on oil & gas sectors in both short-run and long-run.
We recommend that regulators and management of listed oil and gas companies in the
stock market should closely monitor the exposure of such companies to the oil and gas sector by
diversifying their investment and take appropriate measures to curtail against systematic risk in
the sector. Where the listed companies use oil and gas as input in their business operation, there
should also be diversification of their energy mix away from oil and other fossil fuel-related
energy sources, by using alternative sources of energy. They should seek to become more
efficient in the way energy is cultivated and used so as to reduce the impact of negative oil
shocks on the value of the firms. The government should find a more lasting solution to reduce
or eliminate bombing and vandalism of Oil and Gas Pipelines due to Niger-Delta Militant
activities to reduce negative shocks that can induce negative oil price shocks. If positive and
negative shocks impact stock price index in the same way, then listed oil and gas companies will
make as much loss similar to the gains they made due period of Good News (Positive Shock) in
the market.
18
Table 2: Unit Root Test Result without Structural Breaks
Source: Author’s computation using E-views 10
Panel A
Panel B
ADF NG-PERRON
Series With
Intercept
With
Intercept
&
Trend
Conclusion Series With
Intercept
With Intercept
&
Trend
Conclusion
LNSEOG -1.77 -1.79 LNSEOG -1.62 -1.72
D(L NSEOG) -3.82** -3.79** I(1) D(L NSEOG) -2.40** -2.51 I(1)
LOP -1.41 -1.76 LOP -1.41 -1.76
D (LOP) -4.51** -4.97** I(1) D (LOP) -2.22** -4.93** I(1)
LOP+ LOP
+ -0.07 -2.57
D(LOP+) D(LOP
+) -2.38** -2.42 I(1)
LOP- 1.11 -1.38 LOP
- 0.49 -0.97
D(LOP-) -4.02** -5.01** I(1) D(LOP
-) -2.50** -4.33** I(1)
LEXCR -1.03 -2.15 LEXCR -0.32 -1.83
D(EXCR) -4.14** -3.52** I(1) D(EXCR) -2.03** -2.05 I(1)
** Represents 5% level of significance

19
Table 3.1A Andrews Zivot Test with Endogenous at Level
Source: Author’s computation using E-views 10
Intercept and Trend
LNSEOG Decision LOP+ Decision LOP
- Decision LOP Decision LEXCH Decision
Lags Included 1 1 1 1 1
Minimum T- Stats -3.55 -4.06 -4.06 -3.90 -4.09
At Year 2013.Q3 2011.Q3 2011.Q3 2010.Q3 2015.Q1
1% -5.57 -5.57 -5.57 -5.34 -5.57
5% -5.08 -5.08 -5.08 -4.93 -5.08
10% -4.82 -4.82 -4.82 -4.82
INTERCEPT
LNSEOG LOP+ LOP
- LOP LEXCH
Lags Included 1 1 1 1 1
Minimum T- Stats -4.16 -3.28 -3.28 -4.08 -4.13
At Year 2013.Q3 1010.Q3 2010.Q3 2011.Q1 2015.Q1
1% -5.34 -5.57 -5.57 -5.57 -5.34
5% -4.93 -5.08 -5.08 -5.08 -4.93
-4.58 -4.58 -4.58 -4.58 -4.58
** Represents 5% level of significance

20
Table 3.2: Andrews Zivot Test with Endogenous Breaks after First Difference
Source: Author’s computation using E-views 10
Intercept and Trend
D(LNSEOG) Decision D(LOP+) Decision D(LOP
-) Decision D(LOP) Decision D(LEXCH)
Lags Included 1 1 1
Minimum T-
Stats
-4.95*** I(1) -7.22** I(1) -4.59
Year 2012Q4 2015.Q1 -2011.Q3
1% -5.57 -5.57 -5.57
5% -5.08 -5.08 -5.08
10% -4.82 -4.82 -4.82
Intercept
D(LNSEOG) D(LOP+) Decision D(LOP
-) D(LOP) D(LEXCH)
Lags Included 1 1 1 1 1
Minimum T-
Stats
-5.01** I(1) -4.74*** I(1) -6.35* I(1) -5.18** I(1) -4.72*
Year 2012.Q2 2011.Q4 2014.Q2 2011 Q4 2011Q3
1% -5.34 -5.34 -5.34 -5.34 -5.34
5% -4.93 -4.93 -4.93 -4.93 -4.93
-4.58 -4.58
*, **, *** Represents 1%, 5% and 10% level of significance Respectively

21
Table 4A: Short-Run and Long-Run Estimates from the Symmetric Model
Variables
Lags
0 1 2 3
D(LNSEOG) - 0.40
(1.69)
0.51
(1.91)
0.58
(1.78)
D(LOP) -0.28
(-0.92)
0.45
(1.00)
-0.11
(-0.38) -
D(LEXCH) 0.33
(0.30)
-0.37
(-0.19)
0.24
(0.15)
-
ECT -0.54
(2.74)
- - -
R-Squared 0.88 - - -
Adj. R-Squared 0.77 - - -
F-Statistics 2.71 - - -
LM (Breausch Godfrey) 0.02** 0.65** - -
ARCH 0.77** 2.00** - -
JB 0.43 - - -
Ramsey-Reset - 3.06 3.15 - Long-Run Estimates
Variables LOP LEXCH C
0.66**
(-2.75)
-1.74**
(2.16)
3.89**
(-2.75)
-
( ) T-Statistics
***,** , * represents 10%, 5% and 1% respectively
Source: Author’s computation using E-views 10
22
Table 4B: Short Run and Long-Run Estimates from Asymmetric Model Specification
Variables
Lags
0 1 2 3
D(LNSEOG) - 0.199
(0.86)
0.39
(1.97)**
0.59
(2.96)**
D(LOP-) 0.855
(2.89)**
0.98
(2.56)**
-0.06
(-0.18) -
D(LOP+) -1.76
(-4.48)*
1.25
(-1.63)
0.09
(-0.19) -
D(LEXCH) -3.1705
(-3.41)*
-0.81
(-0.63)
0.85
(0.94) -
ECT - -0.33
(-2.51)**
-
-
R-Squared 0.98 - - -
Adj. R-Squared 0.92 - - -
F-Statistics 4.43** - - -
LM - 0.6 0.77 -
ARCH - 0.36 0.66 -
JB 0.4 - - -
Ramsey-Reset 0.3 0.36
Wald Test of Asymmetry
0.01 - - - -1.7187 - - -
Long-Run Estimates
Variables LOP+ LOP
- LEXCH C
-2.92
(2.26)**
-1.35
(2.67)**
-1.44
(-0.49)
14.48
(1.05) Where:
( ) T-Statistics
***,** , * represents 10%, 5% and 1% respectively.
SR – Short-run
LR - Long-run
Wald – Wald F statistics as test for asymmetry with null hypothesis of Symmetry
Source: Author’s computation using E-views 10
23
Table 6: Bounds Test Result
Source: Author’s computation using E-views 10
Figure 3: Cusum
-10.0
-7.5
-5.0
-2.5
0.0
2.5
5.0
7.5
10.0
II III IV I II III IV I II
2014 2015 2016
CUSUM 5% SignificanceFigure 3
-15
-10
-5
0
5
10
15
I II III IV I II III IV I II III IV I II III IV I II
2012 2013 2014 2015 2016
CUSUM 5% Significancefigure 4
-0.4
0.0
0.4
0.8
1.2
1.6
I II III IV I II III IV I II III IV I II III IV I II
2012 2013 2014 2015 2016
CUSUM of Squares 5% SignificanceFigure 5
Test Statistic Value k
Bound F-statistic 4.43** 3
Critical Value Bounds
Significance I0 Bound I1 Bound
10% 2.72 3.77
5% 3.23 4.35
2.50% 3.69 4.89
1% 4.29 5.61

24
REFERENCES
Abdelaziz, M., Chortareas, G. & Cipollini, A (2008). Stock prices, exchange rates, and oil: Evidence
from Middle East oil-exporting countries; Social Science Research Network, 4. 1-27.
Abdelaziz, M; G. Chortareas; and A. Cipollini (2008). Stock Prices, Exchange Rates, and Oil:
Absorbers, NBER Working Paper.
Abdulrasheed Z. (2013) Causal Relationship between Stock Market Index and Exchange Rate:
Evidence from Nigeria. CBN Journal of Applied Statistics 4(2)
Adaramola, O. (2012). Exchange Rate Volatility and Stock Market Behaviour: The Nigerian
Experience: Research Journal of Finance and Accounting, 3 (1) 19-21.
Adebiyi MA, Adenuga AO, Abeng MO, Omanukwue PN (2010). Oil Price Shocks, Exchange Rate
and Stock Oil Price Shocks and Stock Market Behaviour Market Behaviour: Empirical Evidence
from Nigeria. Unpublished Manuscript. From
http://www.Africametrics.org/documents/conference09/papers
Adebiyi, M. A., Adenuga, A. O., Abeng, M. O., Omanukwue, P. N. (2009) Oil price shocks,
exchange rate and stock market behaviour: Empirical evidence from Nigeria”. In Proceedings of the 14th Annual Conference of the African Econometric Society
Akpan E.O. (2009, March 22–24). Oil price shocks and Nigeria’s macroeconomy. A paper presented at the Annual Conference of CSAE Conference, Economic Development in
Africa, Oxford. Google Scholar
Asaolu T., & Ilo B., (2012). The Nigerian Stock Market and Oil Price: A Cointegration Analysis;
Kuwait Chapter of Arabian Journal of Business and Management Review. 1(6)
Asaolu, T. O., & Ogunmuyiwa, M. S. (2011). An Econometric Analysis of the Impact of
Macroeconomic Variables on Stock Market Movement in Nigeria. Asian Journal of Business
Management, 3(1).
Augustine O. (2015) Exchange Rate Fluctuations, Oil Prices and Economic Performance: Empirical
Evidence from Nigeria. Exchange Rate Fluctuations, Oil Prices and Economic Performance:
Empirical Evidence from Nigeria. 5 (2).
Aworinde, O. (2013), Budget Deficits and Economic Performance, A thesis Submitted for the degree
of Doctor of Philosophy; University of Bath, Department of Economics.
Bhattacharya B, & Mookherjee J (2001). Causal relationship between and exchange rate, foreign
exchange reserves, value of trade balance and stock market: case study of India. Department of
Economics, Jadavpur University, Kolkata, India.
Cheung, Y., & L. Ng, (1998). International evidence on the stock market and aggregate economic
activity. Journal of Empirical Finance, 5, 281–296.
Clifford K. (March 10, 2017) Oil Prices: What to Make of the Volatility. Newyorktimes. Retrieved
from https://www.nytimes.com/interactive/2017/01/09/business/energy-environment/oil-
prices.html?_r=0

25
Clifford K. (March 10, 2017) Oil Prices: What to Make of the Volatility. Newyorktimes. Retrieved
from https://www.nytimes.com/interactive/2017/01/09/business/energy-environment/oil-
prices.html?_r=0
Emerging Economy? Evidence from Nigeria. Proceedings of 11th International Business and Social
Science Research Conference 8 - 9 January, 2015, Crowne Plaza Hotel, Dubai, UAE.
Karantininis K, Katrakylidis K, Persson M (2011a) Price Transmission in the Swedish Pork Chain:
Asymmetric Non Linear Ardl. EAAE 2011 Congress, Zurich, Switzerland
Karantininis K, Kostas K, Persson M (2011b) Price transmission in the Swedish pork chain:
Asymmetric nonlinear ARDL., Paper presented at the EAAE 2011 Congress: Challenges and
Uncertainty, September 2, 2011, Zurich, Switzerland
Katrakilidis C, Trachanas E (2012) What drives housing price dynamics in Greech: new evidence
from asymmetric ARDL cointegration. Econ Model 29,1064–9
Maku O. & Atanda A. (2009), Does Macroeconomic Indicators Exert shock on the Nigerian Capital
Market? Online at http://mpra.ub.uni-muenchen.de/17917/
Mansor, (2015), Oil and Food Prices in Malaysia: a nonlinear ARDL analysis, Agricultural and Food
Economics Journal; 5(2)
Mohamed, Foulquier & Fouquau., (2011). Oil prices and Stock Markets In Europe: A Sector
Perspective. Recherches Economiques de Louvain – Louvain Economic Review 77(1)
NAN (2017, February 3) Naira Falls to N500 per Dollar at the Parallel Market. Punch. Retrieved
from: http://punchng.com/naira-falls-n500-per-dollar-parallel-market/
Nandha, M. & Hammoudeh, H. (2007). Systematic Risk, and Oil Price and Exchange Rate
Sensitivities in Asia-Pacific Stock Markets. Research in International Business and Finance, 21,
326-41.
Narayan, P., & Narayan, S. (2010). Modeling the Impact of Oil Prices on Vietnam's Stock Prices,” Applied Energy Journal, 87, 356 - 361.
Omoh Gabriel (June 15, 2015) 18 states bankrupt, can’t pay workers’ salaries. Vanguard News. Read more at: http://www.vanguardngr.com/2015/06/18-states-bankrupt-cant-pay-workers-salaries/
Performance of the Indian Stock Market, Working Paper, University of New Orleans.
Shaharudin, S, Samad, F., & Bhat, S. (2009). Performance and volatility of oil and gas stocks: A
Comparative Study on Selected O&G Companies. International Business Research 2,(4).
Shaharudin, Samad, Bhat, (2009) Performance and Volatility of Oil and Gas Stocks: A Comparative
Study on Selected O&G Companies. International Business Research 2 (4)
Shin Y, Yu B, &Greenwood-Nimmo M. (2011) Modelling Asymmetric Cointegration and Dynamic
Multiplier in a Nonlinear ARDL Framework, Mimeo
Uwubanmwen, A. Omorokunwa G., (2015). Oil Price Volatility and Stock Price Volatility: Evidence
from Nigeria . Academic Journal of Interdisciplinary Studies; 4 (1)

26
Zivot E & Andrews D. (1992), Further Evidence on the Great Crash, the Oil-Price Shock, and the
Unit-Root Hypothesis, Journal of Business Economic Statistics,10(2)
Zubair (2013) Causal Relationship between Stock Market Index and Exchange Rate: Evidence from
Nigeria. CBN Journal of Applied Statistics. 4 (2)