ASV Holdings, Inc. - d1io3yog0oux5.cloudfront.net · Skid Steer Loaders Best Sellers. Go to ......
35
ASV Holdings, Inc. (NASDAQ:ASV) March 2018
Transcript of ASV Holdings, Inc. - d1io3yog0oux5.cloudfront.net · Skid Steer Loaders Best Sellers. Go to ......

ASV Holdings, Inc.(NASDAQ:ASV)
March 2018

This presentation contains forward-looking statements. In some cases, you can identify forward-looking statements by terminology such as “may,” “should,” “expects,” “plans,” “anticipates,” “believes,” “estimates,” “predicts,” “potential,” “intends” or “continue,” and other similar expressions that are predictions of or indicate future events and future trends, or the negative of these terms or other comparable terminology. Forward-looking statements in this presentation include, without limitation: (1) projections of revenue, earnings, capital structure and other financial items, (2) statements of our plans and objectives, (3) statements regarding the capabilities and capacities of our business operations, (4) statements of expected future economic conditions and the effect on us and on dealers or OEM customers, (5) expected benefits of our cost reduction measures, and (6) assumptions underlying statements regarding us or our business.
Our actual results may differ from information contained in these forward looking-statements for many reasons, including those described in the section entitled “Risk Factors” in our Registration Statement on Form S-1 (SEC File No. 333-216912), which was filed in connection with our initial public offering and is available on our EDGAR page at www.sec.gov. These statements are only current predictions and are subject to known and unknown risks, uncertainties and other factors that may cause our or our industry’s actual results, levels of activity, performance or achievements to be materially different from those anticipated by the forward-looking statements. We discuss many of these risks in greater detail under the heading “Risk Factors” and elsewhere in the Registration Statement on Form S-1. You should not rely upon forward-looking statements as predictions of future events. Although we believe that the expectations reflected in the forward-looking statements are reasonable, we cannot guarantee future results, levels of activity, performance or achievements. Except as required by law, after the date of this presentation, we are under no duty to update or revise any of the forward-looking statements, whether as a result of new information, future events or otherwise.
We obtained the industry, market and competitive position data in this presentation from our own internal estimates and research as well as from industry and general publications and research surveys and studies conducted by third parties. Whilewe believe that each of these studies and publications is reliable, we have not independently verified market and industry data from third-party sources. While we believe our internal company research is reliable and the market definitions we use are appropriate, neither such research nor these definitions have been verified by any independent source.
We from time to time refer to various non-GAAP financial measures in this presentation. We believe that this information is useful to understanding our operating results by excluding certain items that may not be indicative of our core operating results and business outlook. Reference to these non-GAAP financial measures should not be considered as a substitute for, or superior to, results that are presented in a manner consistent with GAAP. Rather, the non-GAAP financial information should be considered in addition to results that are presented in a manner consistent with GAAP. A reconciliation of non-GAAP financial measures referred to in this presentation is provided in the tables at the conclusion of this presentation.
Forward-Looking Statements & Non – GAAP Financial Measures
2
3
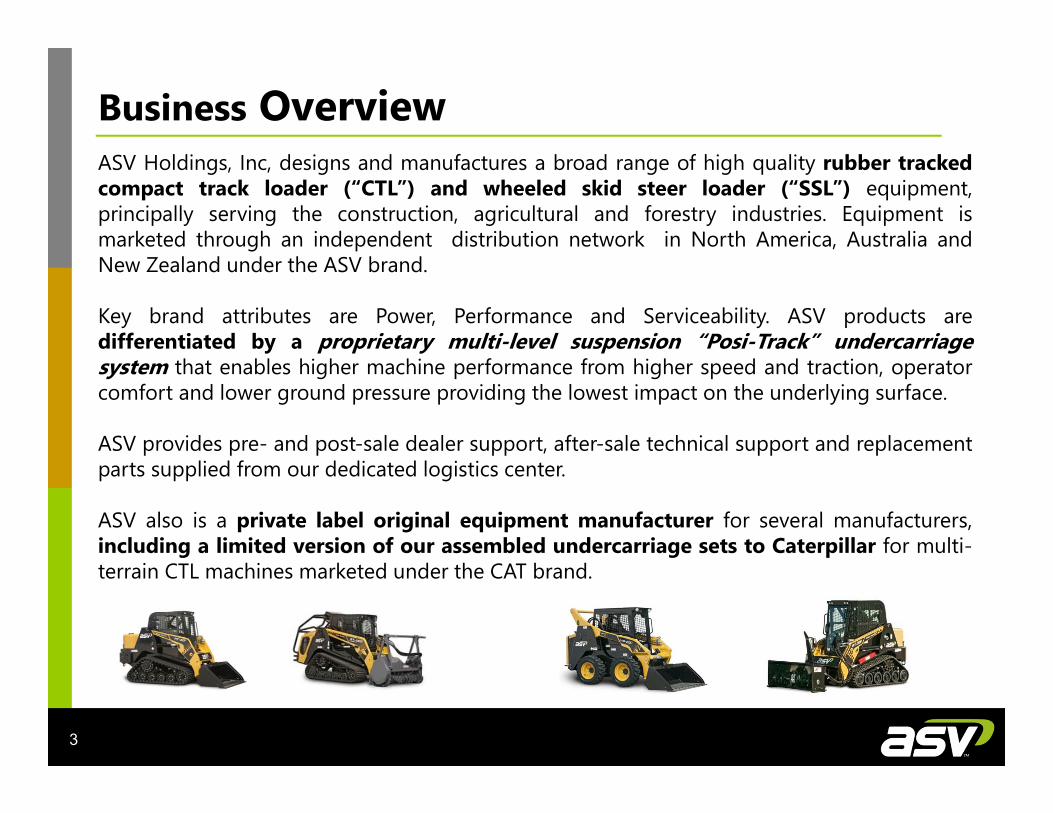
Business OverviewASV Holdings, Inc, designs and manufactures a broad range of high quality rubber trackedcompact track loader (“CTL”) and wheeled skid steer loader (“SSL”) equipment,principally serving the construction, agricultural and forestry industries. Equipment ismarketed through an independent distribution network in North America, Australia andNew Zealand under the ASV brand.
Key brand attributes are Power, Performance and Serviceability. ASV products aredifferentiated by a proprietary multi-level suspension “Posi-Track” undercarriagesystem that enables higher machine performance from higher speed and traction, operatorcomfort and lower ground pressure providing the lowest impact on the underlying surface.
ASV provides pre- and post-sale dealer support, after-sale technical support and replacementparts supplied from our dedicated logistics center.
ASV also is a private label original equipment manufacturer for several manufacturers,including a limited version of our assembled undercarriage sets to Caterpillar for multi-terrain CTL machines marketed under the CAT brand.
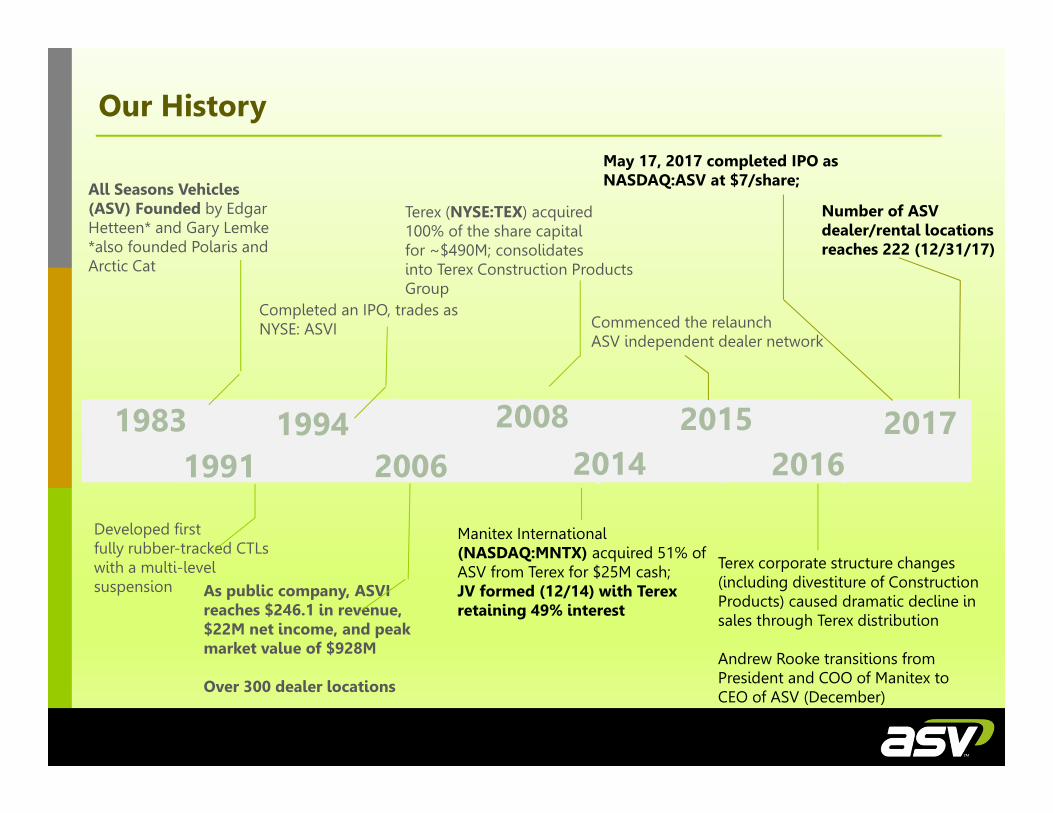
Our History
All Seasons Vehicles (ASV) Founded by Edgar Hetteen* and Gary Lemke*also founded Polaris and Arctic Cat
19831991
19942006
20082014
Completed an IPO, trades as NYSE: ASVI
Terex (NYSE:TEX) acquired 100% of the share capital for ~$490M; consolidates into Terex Construction Products Group
Developed first fully rubber-tracked CTLs with a multi-level suspension As public company, ASVI
reaches $246.1 in revenue, $22M net income, and peak market value of $928M
Over 300 dealer locations
Commenced the relaunch ASV independent dealer network
20152016
Manitex International (NASDAQ:MNTX) acquired 51% of ASV from Terex for $25M cash;JV formed (12/14) with Terex retaining 49% interest
2017
Terex corporate structure changes (including divestiture of Construction Products) caused dramatic decline in sales through Terex distribution
Andrew Rooke transitions from President and COO of Manitex to CEO of ASV (December)
May 17, 2017 completed IPO as NASDAQ:ASV at $7/share;
Number of ASV dealer/rental locations reaches 222 (12/31/17)

Our Products
5
Model: RT30 RT50 RT60 VT70 RT75 RT120 RT120F
Engine Type: Perkins Perkins Perkins Kubota Cummins Cummins Cummins
Emissions: T4I T4I T4I T4F T4F T4F T4F
Lift Arm Design: Radial Radial Radial Vertical Radial Radial Radial
HP / ROC: 32.7 hp / 665 lbs 50 hp / 1,600 lbs 60 hp / 1,900 lbs 65 hp / 2,328 lbs 74 hp / 2,650 lbs 120 hp / 3,535 lbs 120 hp / 3,745 lbs
Model: RS50 RS60 VS60 RS75 VS75
Engine Type: Perkins Perkins Perkins Deutz Deutz
Emissions: T4I T4I T4I T4F T4F
Lift Arm Design: Radial Radial Vertical Radial Vertical
HP / ROC: 50 hp / 1,650 lbs 60 hp / 2,000 lbs 60 hp / 2,300 lbs 74 hp / 2,600 lbs 74 hp / 3,500 lbs
Compact Track Loaders
Skid Steer Loaders
Best Sellers

Go to Market Strategy
6
North America:
• Dealers (new, rental, new and rental) of construction, agriculture, forestry and landscaping, road building equipment; there are 1,000s of equipment dealers, nationwide Typically dealers choose one or two vendors per product category Products are sold/rented at dealer locations and on their websites to a diverse
group of users including contractors, commercial and private users MSRP for new equipment ranges from $42,000-$120,000 depending on features
and capacity• Direct OEM sales of undercarriages to Caterpillar and equipment to others for private
label and branded equipment solutions
Australia and New Zealand:
• Australian sales through master distributor and a strategic account network
• New Zealand dealer network

Management Team
7
Andrew RookeChief Executive Officer
• CEO since December 2016• Led the formation of the joint
venture in 2014 and previously responsible for ASV while working as President of Manitex
• President and COO of Manitex from March 2007 through December 2016
• Previously served as CFO and VP Finance at GKN Sinter Metals for 4 years
Missi HowChief Financial Officer
• Joined ASV in 1999 and named Controller in 2006, assumed lead finance role in 2009, and in 2012, Finance Director of several Terex business units
• Since December 2014, she has assumed the role of Finance Director at ASV
• Previously served with Industrial Lubricant as accounting supervisor for 7 years
Jim DiBiagioChief Operating Officer
• General Manager of ASV since joining in 2013
• Served as the VP of Operations for Oystar North America prior to joining ASV
• Previously with Manitowoc, Johnson Controls, and Kaydon
• Announced retirement effective June 2018
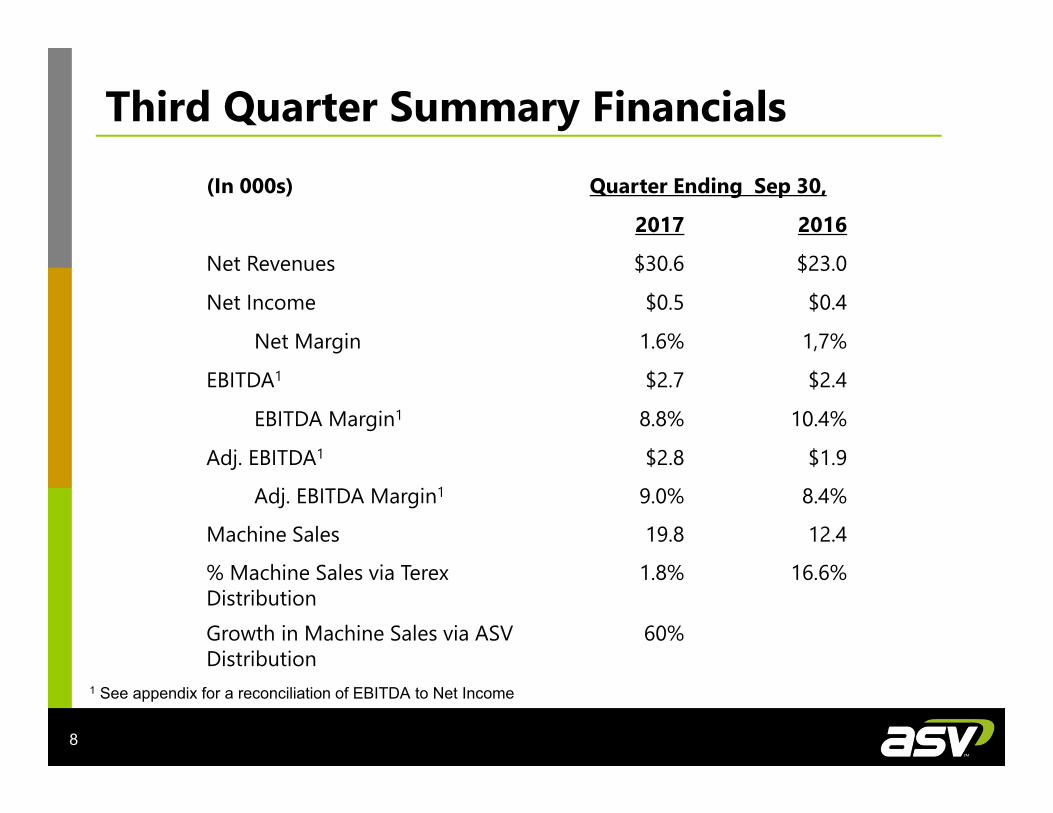
(In 000s) Quarter Ending Sep 30,
2017 2016
Net Revenues $30.6 $23.0
Net Income $0.5 $0.4
Net Margin 1.6% 1,7%
EBITDA1 $2.7 $2.4
EBITDA Margin1 8.8% 10.4%
Adj. EBITDA1 $2.8 $1.9
Adj. EBITDA Margin1 9.0% 8.4%
Machine Sales 19.8 12.4
% Machine Sales via Terex Distribution
1.8% 16.6%
Growth in Machine Sales via ASV Distribution
60%
Third Quarter Summary Financials
8
1 See appendix for a reconciliation of EBITDA to Net Income

(In $millions except EPS and location count)
Full Year Ending Dec 31,
2017 2016
Net Revenues $120 -$125 $103.8
Earnings (loss) per Share $0.18 - $0.20 $(0.15)
Adjusted earnings (loss) per share $0.21 - $0.23 $(0.13)
Adj. EBITDA1 $10.5 - $10.8 $7.8
Adj. EBITDA Margin1 8.5% - 8.8% 7.5%
Net debt $27.0 $43.4
N. American dealer / rental locations 222 133
Full Year 2017-Preliminary and Unaudited
9
1 See appendix for a reconciliation of EBITDA to Net Income

Large and growing market 2015 North American market sales consisted of approximately 40,000 Compact
Track Loaders (CTLs) with a market value of approximately $1.8 billion * CTL market CAGR anticipated to be 5.1% through 2020 * Privately-owned housing starts in January 2018 were at a seasonally adjusted
annual rate of 1,326,000, 7.3 percent above the January 2017 rate of 1,236,000. Total Construction spending during January 2018 was estimated at a seasonally
adjusted annual rate of $1,262.8 billion flat , 3.2 percent above the January 2017 estimate of $1,223.5 billion.
High margin business, currently approaching 10% EBITDA Margin Recurring parts revenues account for 25% - 30% of annual sales Executive Management averages > 20 years of industrials sector experience New, proprietary product lines providing competitive market differentiation North American distribution network growing rapidly; as of 12/31/17, at 74% of last
peak-level*
Investment Thesis
10
*Peak Sales of $246.1 million in 2006 with $25M in EBITDA and 300 dealer locations
* Yengst Associates, July 2016: ** U.S. Census Bureau

INDUSTRY OVERVIEW
11

Housing Market The housing market is a primary driver of CTL sales and has shown
incremental growth since “the great recession” Construction Spending
The construction market is also showing signs of recovery, driven by residential construction. The value of construction in 2017 was $1,230.6 billion, 3.8 percent above the $1,185.7 billion spent in 2016.
Rental Demand Growing demand for rental equipment is another key driver of the
market for CTL equipment 53% of total construction equipment sales to the construction
industry were to the rental equipment market *
Industry Growth Factors
12
* Value of construction put in place, not seasonally adjusted (USCensus)** Rental penetration %

US Residential Construction
13
Housing Starts Privately-owned housing starts in January 2018 were at a seasonally adjusted annual rate of 1,326,000. This is 9.7 percent above the revised December 2017 estimate of 1,209,000, and is 7.3 percent above the January 2017 rate of 1,236,000. Single-family housing starts in January were at a rate of 877,000; this is 3.7 percent above the revised December figure of 846,000.

Construction Spend
14
Total Construction spending during January 2018 was estimated at a seasonally adjusted annual rate of $1,262.8 billion flat with the revised December 2017 estimate of $1,262.7 billion. The January figure is 3.2 percent above the January 2017 estimate of $1,223.5 billion.
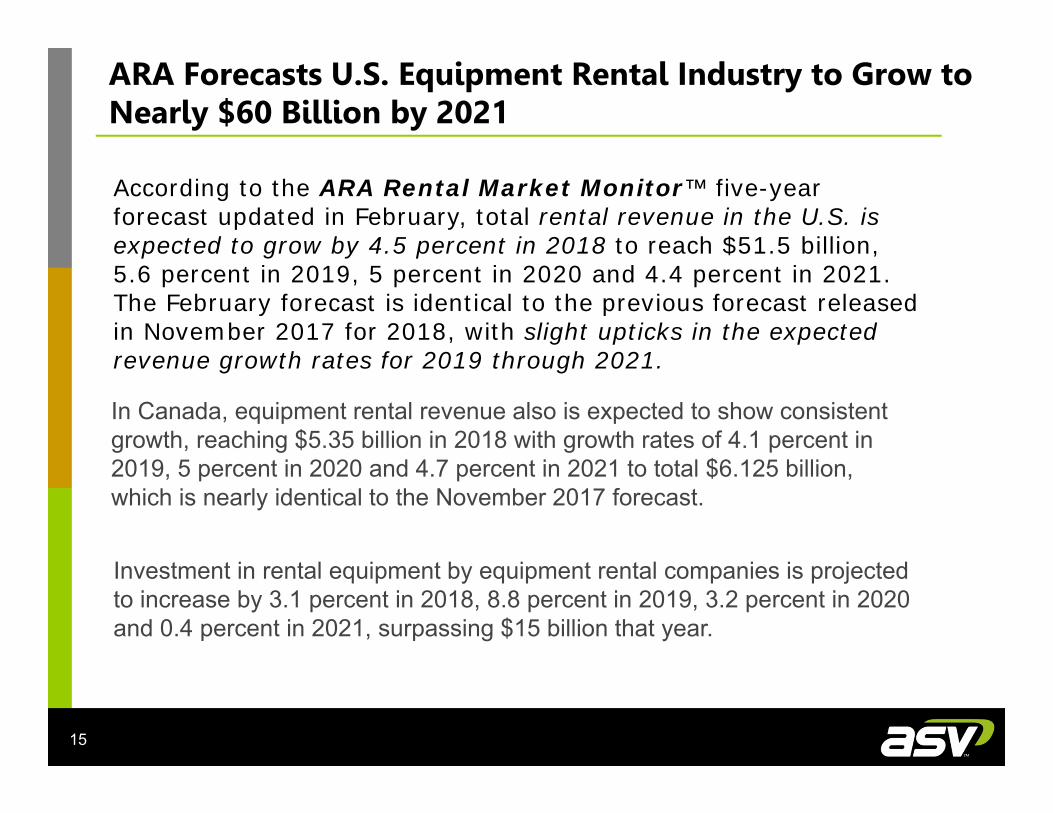
ARA Forecasts U.S. Equipment Rental Industry to Grow to Nearly $60 Billion by 2021
15
According to the ARA Rental Market Monitor™ five-year forecast updated in February, total rental revenue in the U.S. is expected to grow by 4.5 percent in 2018 to reach $51.5 billion, 5.6 percent in 2019, 5 percent in 2020 and 4.4 percent in 2021. The February forecast is identical to the previous forecast released in November 2017 for 2018, with slight upticks in the expected revenue growth rates for 2019 through 2021.
In Canada, equipment rental revenue also is expected to show consistent growth, reaching $5.35 billion in 2018 with growth rates of 4.1 percent in 2019, 5 percent in 2020 and 4.7 percent in 2021 to total $6.125 billion, which is nearly identical to the November 2017 forecast.
Investment in rental equipment by equipment rental companies is projected to increase by 3.1 percent in 2018, 8.8 percent in 2019, 3.2 percent in 2020 and 0.4 percent in 2021, surpassing $15 billion that year.

33%
28%
12%
27%
Rentals Agriculture Landscaping General Construction & other
User Applications-Served Markets
16
Sources: Yengst Associates, Equipment Analysis, North America, Skid Steer Loaders (July 2016)Yengst Associates, Equipment Analysis, North America, Compact Track Loaders (July 2016)
71%
8%
9%
12%
SSL SalesCTL Sales

Market for CTLs and SSLs
17
CTL and SSL volumes have a 5.1% and 5.6% CAGR, respectively, from 2016 through 2020 Sources: Yengst Associates, Equipment Analysis, North America, Skid Steer Loaders (July 2016)
Yengst Associates, Equipment Analysis, North America, Compact Track Loaders (July 2016)

STRATEGIC OVERVIEW
18

Rebuild the ASV brand, emphasizing:
Power, Performance and Serviceability features of ASV Posi-Track Control the product - Bringing aftermarket parts distribution in-house Marketing and advertising initiatives
Expand distribution for our products. Initial target approx. 300 locations in North America
Focus on rental marketplace. Secure several regional accounts
Expand margins through operational and sourcing efficiencies. Target EBITDA margins approaching 12%
Expand product line through both internal R&D and acquisitions.
ASV Growth Strategy
19

Patented “Posi-Track” Undercarriage—CTL’s
20
ASV Patented Posi-Track Industry Standard Steel Track
Drive System Patented low-friction internal drive system
Steel on steel fixed external drive sprocket
Suspension Patented multi-level suspension provides for a smoother ride for operator
Rigid undercarriage fixed directly to machine chassis
Ground Contact
Multiple ground contact points, with rollers that move independently• Lower ground pressure• Improved traction• Less ground disturbance under
tracks
Limited number of rollers, rigid welded casement
Tracks Lighter pure rubber tracks• Speeds as high as 11mph• Typically last longer than steel
embed tracks
Steel embed tracks with steel on steel contact• Typical speeds of 6-8 mph

Power, Performance & Serviceability
21
Power:• ASV offers the Largest, Most Powerful, Highest Performing CTL on the market: The
RT120 • Machines > 70HP - Cummins Diesel Power Plants provide Best In Class Power,
Torque and Reliability.• Best In Class Hydraulic Power Systems coupled with Unparalleled Engine &
Hydraulic Cooling capacities, the RT120 & RT75 are capable of driving the largest attachments in their class around the clock without bogging down or overheating.
Performance:• Higher speed, higher ground clearance, less ground pressure, more traction• Dual Suspension undercarriages on large frames, single suspension on mid and small
frames; ASV offers the most comfortable ride on the roughest terrain. • Patented track design prevents track derailment in even the most severe conditions.
Serviceability:• Best In Class designs for easy access and speed of maintenance• Significant time and cost saving compared to competition
• ASV offers the smallest, most nimble CTL on the market. The RT30 is designed with suspension, traction, low ground pressure and industrial grade characteristics of the larger machines, yet in a smaller package allowing machine access to tighter spaces significantly improving job site efficiency.

0 33
133
222
0
50
100
150
200
250
Jan 1 2015 31-Dec-15 31-Dec-16 31-Dec-17
North American Dealer / Rental Locations
North American Dealer Expansion
22
Peak independent dealer/rental location count was ~300 in 2006; objective is to continue to grow and once again approach this number; does not include Australia or NZ
FINANCIAL OVERVIEW
23

Statement of Operations
24
Quarter Ended Sep 30, Nine Months Ended Sep 30,($000) 2017 2016 2017 2016
Net Sales $30,635 $23,011 $92,885 $78,752 Cost of goods sold 25.798 19,339 78,389 66,241
Gross Profit 4,837 3,672 14,496 12,511Gross Margin 15.8% 16.0% 15.6% 15.9%
Research and Development 503 464 1,561 1,510Selling, General and Administrative expense 2,857 1,509 8,340 6,218
Operating income 1,477 1,699 4,595 4,783Operating Margin 4.8% 7.4% 4.9% 6.1%
Other income (expense)Interest expense (698) (1,259) (2,463) (3,816)Other income (expense) - (2) 1 (18)
Total other expense (698) (1,261) (2,462) (3,834)Income Tax Expense (Benefit) $257 $--- $(372) $---
Net Income $522 $438 $2,505 $949
Adjusted EBITDA* $2,765 $1,925 $8,498 $6,737
% of sales* 9.0% 8.4% 9.1% 8.6%
* See appendix for reconciliation. 2016 includes adjustment for pro forma items including tax and public company costs

(In $millions except EPS and locations) Full Year Ending Dec 31,
2017 2016
Net Revenues $120 -$125 $103.8
Earnings (loss) per Share $0.18 - $0.20 $(0.15)
Adjusted earnings (loss) per share $0.21 - $0.23 $(0.13)
Adj. EBITDA1 $10.5 - $10.8 $7.8
Adj. EBITDA Margin1 8.5% - 8.8% 7.5%
Net debt $27.0 $43.4
N. American dealer / rental locations 222 133
Full Year 2017-Preliminary and Unaudited
25
1 See appendix for a reconciliation of EBITDA to Net Income
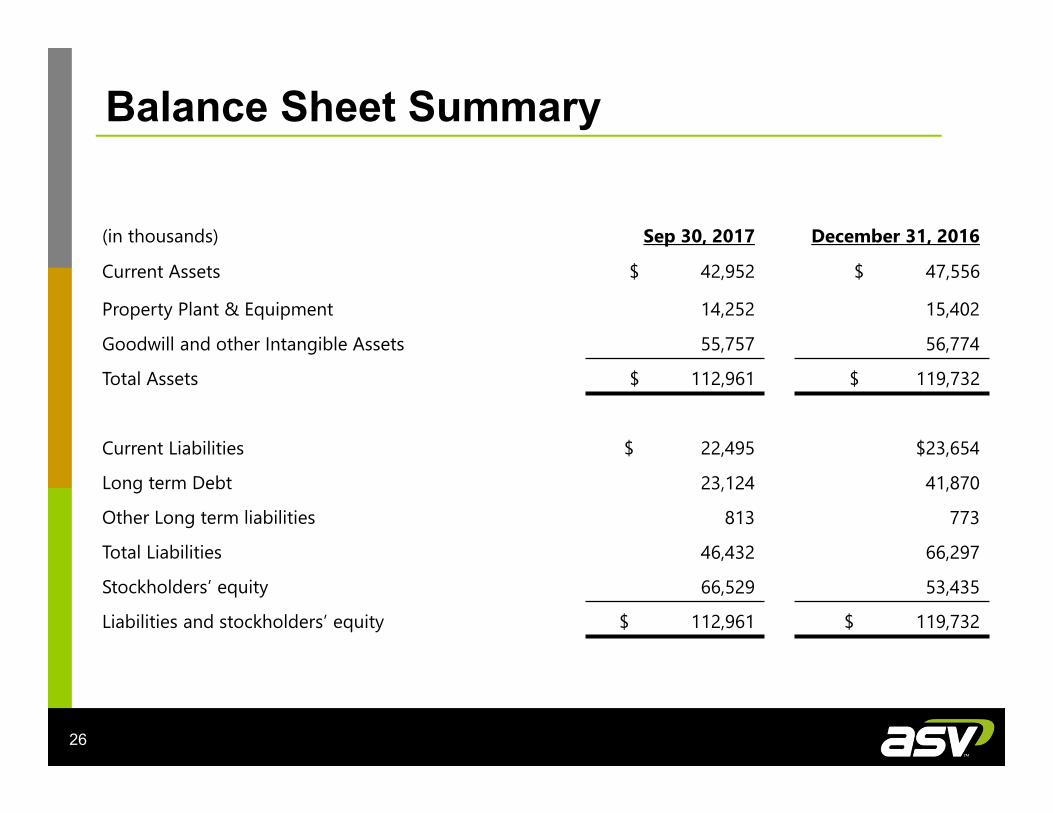
Balance Sheet Summary
26
(in thousands) Sep 30, 2017 December 31, 2016
Current Assets $ 42,952 $ 47,556
Property Plant & Equipment 14,252 15,402
Goodwill and other Intangible Assets 55,757 56,774
Total Assets $ 112,961 $ 119,732
Current Liabilities $ 22,495 $23,654
Long term Debt 23,124 41,870
Other Long term liabilities 813 773
Total Liabilities 46,432 66,297
Stockholders’ equity 66,529 53,435
Liabilities and stockholders’ equity $ 112,961 $ 119,732

Key Balance Sheet/Liquidity Ratios
27
* Net debt is calculated as outstanding principal balance less debt issuance costs, less cash on hand
September 30, 2017
December 31, 2016
Current Ratio 1.9 2.0Net working Capital % of Annualized LQS 22.0% 32.4%
Days Sales Outstanding 54 63
Days Payables Outstanding 57 60
Days Inventory On Hand 89 130
Net Debt* $24.9m $43.4m
TTM Adjusted EBITDA $10.0m $9.3m
Net Debt / Adjusted EBITDA x2.5 x4.7
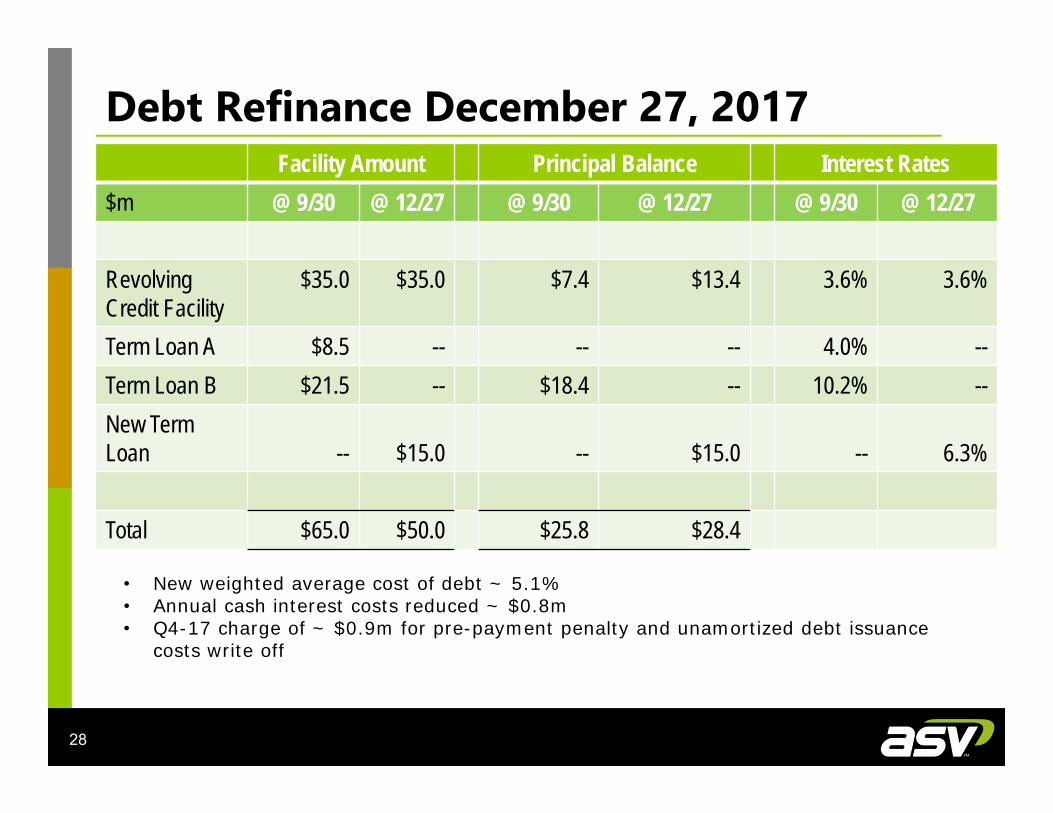
Debt Refinance December 27, 2017
28
Facility Amount Principal Balance Interest Rates$m @ 9/30 @ 12/27 @ 9/30 @ 12/27 @ 9/30 @ 12/27
Revolving Credit Facility
$35.0 $35.0 $7.4 $13.4 3.6% 3.6%
Term Loan A $8.5 -- -- -- 4.0% --Term Loan B $21.5 -- $18.4 -- 10.2% --New Term Loan -- $15.0 -- $15.0 -- 6.3%
Total $65.0 $50.0 $25.8 $28.4
• New weighted average cost of debt ~ 5.1%• Annual cash interest costs reduced ~ $0.8m• Q4-17 charge of ~ $0.9m for pre-payment penalty and unamortized debt issuance
costs write off

Ownership Structure March 2018
29
Pre Deal Pre Deal Shares Post Deal Current CurrentOwnership Shares Sold in IPO Shares Ownership Ownership
Public Ownership 0% -- 1,800,000 4,370,000 5,370,000 55%Terex (NYSE:TEX) 49% 3,920,000 570,000 3,350,000 3,350,000 34%Manitex (NASDAQ:MNTX) 51% 4,080,000 2,000,000 2,080,000 1,080,000 11%
Total 100% 8,000,000 4,370,000 9,800,000 9,800,000 100%
Manitex, 11%
Terex, 34%Public Float, 55%

Non-GAAP Measures and Reconciliations
30
1 EBITDA is defined as income or loss before interest, income taxes, depreciation and amortization2 Adjusted EBITDA is defined as EBITDA less the gain or loss related to non-recurring events
For the Three Months Ended September 30,
For the nine Months Ended September 30,
2017 2016* 2017 2016*
Net income (loss) $ 522 $ 438 $ 2,505 $ 949
Interest Expense 698 1,259 2,463 3,816
Depreciation & Amortization 1,192 1,219 3,626 3,447
Income Tax (Benefit) Expense 257 — (372) —EBITDA (1) $ 2,669 $ 2,916 $ 8,222 $ 8,212
% of Sales 8.7% 12.7% 8.9% 10.4%
EBITDA $ 2,669 $ 2,916 $ 8,222 $ 8,212
Costs of ConExpo trade show — — 122 —
Revision to accrual for legal proceeding expenses less legal costs — (475) (208) (475)
Stock compensation and transaction related compensation costs 96 — 362 —Adjusted EBITDA (2) $ 2,765 $ 2,441 $ 8,498 $ 7,737
Adjusted EBITDA as % of net revenues 9.0% 10.6% 9.1% 9.8%

Non-GAAP Measures and Reconciliations
31
*Pro forma adjustments for public company costs and (C corporation basis) tax expense: The company converted from a LLC to a corporation on May 11, 2017. The pro forma adjustments reflect the actual public company costs incurred in the second quarter of 2017 as if the company had been a corporation in the second quarter of 2016, and a pro forma (C corporation basis) tax charge on income at a tax rate of 36%.
Three Months EndedSeptember 30, 2017 September 30, 2016
Net income as reported $522 $438
Revision to legal costs accrual -- (475)
Pro forma adjustment for public company -- (516)Pro forma income before tax $522 ($553)Pro forma (C corporation basis) tax benefit -- 199
Adjusted Net Income (loss) $522 $(354)
Weighted average diluted shares outstanding 9,800,000 8,000,000Basic and Diluted earnings per share as reported
$0.05 $0.05Total EPS Effect $-- $(0.09)
Adjusted (pro forma C Corporation) earnings (loss) per share
$0.05 $(0.04)

Non-GAAP Measures and Reconciliations
32
Reconciliation of EBITDA to Adjusted EBITDA (in millions except percentages)
Unaudited
For the Year Ended December 31,2017 2016
Net income (loss) $1.6-$1.8 ($1.2) Interest Expense 3.0 5.0 Loss on debt extinguishment 1.0 2.2 Depreciation & Amortization 4.8 4.7 Income Tax (Benefit) Expense (0.6) - EBITDA (1) $9.8-$10.0 $10.7 % of Sales 7.9%-8.1% 10.3%
EBITDA $9.8-$10.0 $10.7 Costs of ConExpo trade show (2) 0.1 - Revision to accrual for legal proceeding expenses less legal costs (3) (0.1) (1.4)Stock compensation and transaction related compensation costs (4) 0.5 - Aftermarket parts distribution center relocation (5) 0.3 - Adjusted EBITDA (6) $10.5-$10.8 $9.3 Adjusted EBITDA as % of net revenues 8.5%-8.8% 9.0% Pro-forma adjustment for public company costs - (1.5)Pro-forma Adjusted EBITDA* $10.5-$10.8 $7.8

Non-GAAP Measures and Reconciliations
33
* * The Company converted to a C corporation in May 2017, and consequently 2017 EBITDA for the three and twelve months ended December 31,2017 includes approximately $0.6 million and $1.5 million of public company costs not included in 2016 EBITDA. For the twelve months endedDecember 31, 2016, Pro Forma Adjusted EBITDA is $7.8 million.
(1) EBITDA is defined as income or loss before interest, income taxes, depreciation and amortization. EBITDA is not a recognized measure underU.S. GAAP and does not have a standardized meaning prescribed by U.S. GAAP. Therefore, EBITDA may not be comparable to similarmeasures presented by other companies. The table above reconciles net income to EBITDA. See “—Cautionary Statements Regarding Non-GAAP Measures” for further information regarding EBITDA.
(2) Costs associated with the 2017 ConExpo trade show. The ConExpo show, which is held every three years, was held in Las Vegas in March ofthis year. This show is an international gathering place for the construction industries. It is estimated that 130,000 professionals from around theworld attended the show.
(3) Revision to accrual for legal proceeding expenses is included in Adjusted EBITDA since it is an adjustment in the period to an accrual establishedat the formation of the Joint Venture and is not representative of the operating activity in the reported period. This adjustment was due to thesettlement of a legal claim lower than the accrued cost.
(4) Stock compensation and IPO transaction related compensation costs.(5) Aftermarket Parts Distribution Center relocation costs are restructuring costs related to the movement of the ASV aftermarket parts operation
from Southaven Memphis to a facility adjacent to the Company principal premises in Grand Rapids MN, which commenced in quarter four of2017 and is expected to be completed in quarter two of 2018.
(6) Adjusted EBITDA is defined as EBITDA less the gain or loss related to non-recurring events. Adjusted EBITDA is not a recognized measureunder U.S. GAAP and does not have a standardized meaning prescribed by U.S. GAAP. Therefore, Adjusted EBITDA may not be comparable tosimilar measures presented by other companies. The table above reconciles EBITDA to Adjusted EBITDA. See “—Cautionary StatementsRegarding Non-GAAP Measures” for further information regarding EBITDA.
(6) 2016 Pro Forma Adjusted EBITDA is defined as Adjusted EBITDA less public company costs

Non-GAAP Measures and Reconciliations
34
Reconciliation of GAAP Net Income to Adjusted Net Income (in millions except shares and EPS)
Unaudited
For the Year Ended December 31, 2017 2016
Net income (loss) as reported $1.6-$1.8 ($1.2) Revision to legal costs accrual 0.1 (1.4) Aftermarket parts distribution center relocation 0.3 - Loss on debt extinguishment 1.0 2.2 Pro-forma adjustment for public company costs - (1.5) Pro-forma income before tax $3.0-$3.2 (1.9) Pro forma (C corporation basis) tax $(1.1)-$(1.2) $0.7 Adjusted Net Income (loss) $1.9-$2.1 ($1.2)
Weighted average diluted shares outstanding 9,125,000 8,000,000 Basic and Diluted earnings (loss) per share as reported $0.18-$0.20 ($0.15) Total EPS Effect $0.03 $0.02 Adjusted (pro forma C Corporation) earnings (loss) per share $0.21-$0.23 ($0.13)
*Pro forma adjustments for public company costs and (C corporation basis) tax expense: The company converted from a LLC to a corporation on May 11, 2017. The pro forma adjustments reflect the actual public company costs incurred in 2017 as if the company had been a corporation for the same period in 2016, and a pro forma (C corporation basis) tax charge on income at a tax rate of 36%.

ASV Holdings, Inc.(NASDAQ:ASV)March 2018
At ASV Holdings, Inc.Andrew Rooke, Chairman & C.E.O.1-218-327-5389
Contact:At Darrow Associates, Inc.Peter Seltzberg, IR for ASV1-516-419-9915