Association Water Treatment Committee Seminar Series Next ......San Diego’s Advanced Water ......
18
SBP style.pptx 1 San Diego’s Advanced Water Purification Demonstration Project: Performance & Integrity Wednesday February 11 th , 2015 GateWay Community College James DeCarolis (Black&Veatch), Bill Pearce (City of San Diego) Arizona Water Association Water Treatment Committee Seminar Series Next Horizons in Water Treatment Outline of Discussion • Project Background • Testing and Monitoring Objectives • Performance Monitoring Water Quality Monitoring Challenge Testing Integrity Monitoring • Summary & Conclusions • Acknowledgments • Pure Water San Diego Update
Transcript of Association Water Treatment Committee Seminar Series Next ......San Diego’s Advanced Water ......

SBP style.pptx 1
San Diego’s Advanced Water Purification Demonstration Project: Performance & Integrity
Wednesday February 11th, 2015
GateWay Community College
James DeCarolis (Black&Veatch), Bill Pearce (City of San Diego)
Arizona Water Association
Water Treatment Committee Seminar Series
Next Horizons in Water Treatment
Outline of Discussion
• Project Background
• Testing and Monitoring Objectives
• Performance Monitoring Water Quality Monitoring
Challenge Testing
Integrity Monitoring
• Summary & Conclusions
• Acknowledgments
• Pure Water San Diego Update

SBP style.pptx 2
PROJECT BACKGROUND
Project Background
• 2004 the City Council approved a study to evaluate options to increase the use of recycled water.
• 2006 Water Reuse Study identified six (6) potential options to maximize reuse with Reservoir Augmentation of the City’s San Vicente Reservoir as the preferred reuse strategy.
• 2007 City Council voted to proceed with a Demonstration Project to evaluate the feasibility of augmentation San Vicente with advanced treated purified water.
SBP style.pptx 3
Demonstration Facility
• Located at the North City Water Reclamation Plant (North City)
• Construction period ‐March to June 2011
• 1 MGD capacity consisting of microfiltration/ ultrafiltration, reverse osmosis, ultraviolet light/advanced oxidation
• Final product water (Purified water) used to supplement the North City recycled water system
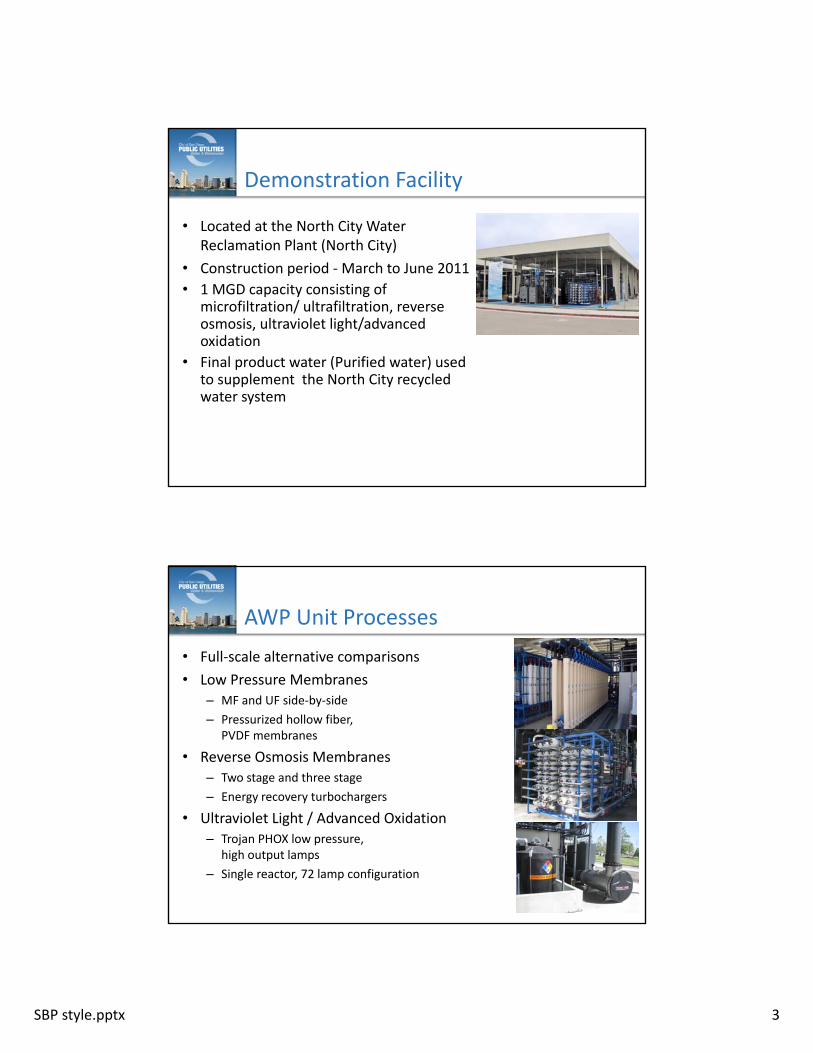
AWP Unit Processes
• Full‐scale alternative comparisons
• Low Pressure Membranes – MF and UF side‐by‐side
– Pressurized hollow fiber, PVDF membranes
• Reverse Osmosis Membranes– Two stage and three stage
– Energy recovery turbochargers
• Ultraviolet Light / Advanced Oxidation– Trojan PHOX low pressure,
high output lamps
– Single reactor, 72 lamp configuration

SBP style.pptx 4
ACE13 A
NNUAL C
ONFERENCE A
ND E
XPOSIT
ION
Demonstration Facility Processes
6
TESTING AND MONITORING OBJECTIVES

SBP style.pptx 5
Testing & Monitoring Objectives
• Verify that final product (purified water) water quality meets public health and reservoir augmentation criteria
• Demonstrate integrity monitoring techniques and performance reliability measures
• Monitor Constituents of Emerging Concern
• Collect operational performance data of the various AWP unit processes to assess O&M requirements of potential full‐scale facility
8
Testing and Monitoring Approach
• Developed & Implemented Testing & Monitoring Plan
• 12 Month Testing Period
• Water Quality Monitoring
• Multiple Certified & Specialty Labs
• Challenge Testing
• Integrity Monitoring
• Operational Performance Monitoring
ACE13 A
NNUAL C
ONFERENCE A
ND E
XPOSIT
ION
INDEPENDENT ADVISORY PANEL(NWRI)
9

SBP style.pptx 6
PERFORMANCE MONITORING
Performance Monitoring
• Water Quality Monitoring – Regulated
– Non Regulated
• Challenge Testing – Nitrosdimethlyamine (NDMA)
– 1,4 Dioxane
• Integrity Testing– Direct & Indirect Methods
– Critical Control Point Monitoring
– CEC Performance
11
ACE13 A
NNUAL C
ONFERENCE A
ND E
XPOSIT
ION
ADVANCED PURIFIED WATER
AWP DEMONSTRATION FACILITY SCADA OVERVIEW SCREEN

SBP style.pptx 7
Water Quality Monitoring
• Federal and State Primary and Secondary Drinking Water Maximum Contaminant Levels (MCLs)
• California Department of Public Health (CDPH) Notification Levels (NLs)
• CDPH Groundwater Replenishment Reuse DRAFT Regulation
• San Diego Regional Water Quality Control Board– Basin Plan Objectives
– California Toxic Rule
– State Implementation Policy
• Constituents of Emerging Concern (State Water Resources Control Board Recycled Water Policy)A
CE13 A
NNUAL C
ONFERENCE A
ND E
XPOSIT
ION
12
Quarterly Water Quality Monitoring
Constituent Group Sampling Location Purpose
Federal & StateRegulated Drinking Water Standards
• Tertiary Effluent• Purified Water• Raw Water
Public Health Regulatory
USEPA’s Priority Pollutant List
•Tertiary Effluent• Purified Water• Raw Water
Public Health Regulatory / Reservoir Regulatory
CDPH Notification Limits & UCMR3
•Tertiary Effluent • Purified Water• Raw Water
Public Health Regulatory
CEC’s •Tertiary Effluent • Purified Water• Raw Water
Public Health / AWP Performance
13

SBP style.pptx 8
Comparison of Water Quality Results to Demonstration Goals
14Note: Phosphorus was determined to be the limiting nutrient in the reservoir. Spiking tests showed RO removes 99.8 to 99.9% of the phosphorous present in the feedwater.
Regulation and Guideline Group
Number of Constituents /
Parameters
Total Number of Tests1
Purified Water Results
Primary Drinking Water
MCL 90 1781 √ Meets all
Secondary Drinking Water
MCL 18 1290 √ Meets all
Microbial 4 1547 √ Non-DetectCDPH Notification
Level 30 716 √ Below all
CDPH Groundwater
Replenishment 142 2244 √ Meets all
Reservoir Limits 143 4404 √ Meets allTotal Number of Constituents /
Parameters231 7,523 -----------------
Water Quality Monitoring Results of Regulated Constituents
15

SBP style.pptx 9
Water quality monitoring results of non‐regulated constituents
• Majority were below quantifiable concentrations in the purified water
• Quantifiable concentrations were below public health concerns (i.e. at least 18 times lower than DWELS and / or other health reference levels.)
< Reporting Limit
> Reporting Limit
Bromochloromethane, hexavalent chromium, acesulfame potassium, iohexal, triclosan , and strontium
111 Constituents
16
UV/AOP Challenge Testing
To Main PLC
• Purpose:
– Demonstrate removal of target constituents
– Gather information related to the impact of UV/peroxide dose on removal efficiency
• Limited feedwater concentrations of target constituents
• Required spiking of concentrated solutions
LAB PREPARED “SPIKING” SOLUTION
SPIKING SOLUTION INJECTION PUMP
17

SBP style.pptx 10
UV/AOP Challenge Testing Results
ChallengeConstituent
1 Target Log Removal
2 Measured Removal (n=3)
EE/O Calculated(kWh/1000 gallons/log removal)
NDMA 1.2 (93.7%) 1.5 (98.6%) 0.188
1,4 Dioxane 0.5 (68.4%) 0.6 (74.9%) 0.302
Notes:1 Target removal based on 2008 DRAFT Groundwater Recharge Regulations,
subsequently revised in 2011 and 2013. 2 Operating under design conditions: 1 MGD, 97% UVT, 3 mg/L hydrogen
peroxide dose
ACE13 A
NNUAL C
ONFERENCE A
ND E
XPOSIT
ION
18
18
Impact of UV Dose on Removal Efficiency

SBP style.pptx 11
Log removal = 0.1152*peroxide dose (mg/L) + 0.2297R² = 0.9927
0.00
0.10
0.20
0.30
0.40
0.50
0.60
0.70
0.80
0.90
1.00
0 1 2 3 4 5 6 7
1,4
Dio
xan
e L
og
Rem
ova
l
Target Peroxide Dose (mg/L)
Target 1,4 Dioxane Removal
Average EED = 0.31 kWh/1000 gallons
Impact of Peroxide Dose on 1,4 Dioxane Removal
20
Integrity Monitoring Objectives
• Demonstrate the reliability of the AWP unit processes
• Establish baseline performance of each unit process under “intact” conditions
• Maintain routine / continuous verification of integrity throughout the testing period
• Demonstrate integrity monitoring methods
• Develop measureable performance criteria and action plan response
ACE13 A
NNUAL C
ONFERENCE A
ND E
XPOSIT
ION
RO MEMBRANE VESSEL PROBING
MF MEMBRANE FIBERS
21

SBP style.pptx 12
Membrane Integrity Monitoring Results ACE13 A
NNUAL C
ONFERENCE A
ND E
XPOSIT
ION
Unit Process Method Frequency ResultMF/UF Pressure Decay
Testing1 per 24 hours Pressure decay <0.08 psi/5 min.
RO Vessel Probing Post membrane installation
Conductivity increased by stage in direction. No leaks detected.
RO Pressure / vacuum decay testing
Pre membrane installation
Vacuum decay <= 0.37 inches Hg/min.
.RO Continuous on-line
RO permeate conductivity monitoring
Continuous Permeate conductivity < 30 µS/cm
RO RO permeate TOC monitoring
Continuous Permeate TOC between 30-60 ug/L
22
Critical Control Point Monitoring
• Critical Control Points– Main unit processes (MF,UF, RO, UV/AOP)
• Critical Limit Parameters (CLPs)– Membrane pressure decay rate to assess the integrity of the
MF/UF membranes
– Online TOC to assess the performance of the RO membranes
– On‐line power consumption to assess electrical energy applied to the UV/AOP system
• Establish performance limits for each CLP
• Develop corrective actions in the event performance limits are exceeded.
23

SBP style.pptx 13
ACE13 A
NNUAL C
ONFERENCE A
ND E
XPOSIT
ION
24
Critical Control Point
Critical Limit Parameter
Monitoring Frequency
Alert Limit Critical LimitExample Corrective
ActionsMF/UF Pressure Decay 1 per day Value above
baseline that approaches Critical limit.
0.4 psi / 5 min. based on the maximum decay predicted to achieve 4 log removal Cryptosporidium.
Confirm Results. Assess fiber breakage. Isolate/ repair/replace damaged membrane.
RO TOC,
Conductivity
Continuous % change of measured concentration in combined RO permeate.
Online permeate conductivity = 150 µs/cm. Online permeate TOC = 100 ppb or greater for five consecutive measurements.
Automatic shutdown (conductivity). Monitor individual RO trains. Verify analyzer accuracy. Conduct vessel probing.
UV/AOP Reactor Power Level
Continuous 100% (2 to 7 lamp failures or 1 to 3 ballast failures).
0% (8 or more lamp failures or 4 ballast failures ).
System alarm. Automatic increase of reactor power to 100% or system shutdown. Check / replace lamps and/or ballasts.
UV/AOP Hydrogen peroxide dose rate
Continuous (flow confirmation)
1 per day by draw down
Continuous flow confirmation
minimum dose (~22 ml/min.) to provide 3 mg/L peroxide
0 ml/min. indicating pump failure or loss of flow confirmation,
Check dosing system. Recalibrate pump. Auto switch to standby pump.
Critical Control Point Monitoring ACE13 A
NNUAL C
ONFERENCE A
ND E
XPOSIT
ION
24
Critical Control Point
Critical Limit Parameter
Monitoring Frequency
Alert Limit Critical LimitExample Corrective Actions
RO TOC,
Conductivity
Continuous % change of measured concentration in combined RO permeate.
Online permeate conductivity = 150 µs/cm. Online permeate TOC = 100 ppb or greater for five consecutive measurements.
Automatic shutdown (conductivity). Monitor individual RO trains. Verify analyzer accuracy. Conduct vessel probing.
Critical Control Point Monitoring

SBP style.pptx 14
Performance Based CEC Monitoring
• Indicators: “Individual chemical occurring at quantifiable level which represents certain physiochemical and biological characteristics of a family of trace organics that are relevant to the fate and transport during treatment and provide a conservative assessment of removal”.
• Surrogates: “quantifiable change of a bulk parameter that can serve as a measure in quantifying the performance of individual unit processes or operation regarding their removal of trace compounds”.
25
Reference: Monitoring Strategies for Chemicals of Emerging Concern (CECs) in Recycled Water, Recommendations of a Science Advisory Panel, Panel Members: Paul Anderson, Jorg E. Drewes (Chair), Adam Olivieri, Daniel Schlenk, and Shane Snyder. State Water Resources Control Board, June 25, 2010.
Performance Based CEC Monitoring Results
• Out of 92 CECs, 37 were identified as possible performance based indicator compounds based on occurrence and relevance in first 4 sampling events.
• 37 reduced to 16 based on consistent presence in RO feed in 4 weekly sampling events.– Typically >90% removal across RO
– None are consistently above detection limit in RO permeate, so they are not adequately present to determine removal across
AOP. presented.
26

SBP style.pptx 15
Differential Removal of Indicator Compounds
27
Indicator
1 Avg. RO Feed (ng/L)
1 Avg. RO Permeate (ng/L)
1 Avg. UV/AOPProduct (ng/L)
RO UV/AOP
Δ Removal (%)
Δ Removal
(%)
Acesulfame‐K 33000 <27 <22 >99.9 >16.5
Sucraloase 55000 <100 <42 >99.9‐‐‐‐‐‐‐‐‐
NDMA 3 <2 <0.96 >65.5‐‐‐‐‐‐‐‐‐
Carbamezapine 190 <5 <1.2 >99 ‐‐‐‐‐‐‐‐‐
1 N=5
Differential removal of Surrogate Compounds
28
SurrogateRO UV/AOP
Δ Removal (%) Δ Removal (%)
TOC 99.6% NA
UV 254 88.8% 68.7%
Monochloramines ‐‐‐‐‐‐‐‐‐‐ 72.8%
Conductivity 99.0% NA

SBP style.pptx 16
SUMMARY AND CONCLUSIONS
Summary & Conclusions
• Regulated Constituents ‐ water quality monitoring of regulated constituents has shown the Purified Water meets or exceeds all water quality goals established from anticipated regulatory requirements for IPR via surface water augmentation.
• Non Regulated Constituents ‐ water quality monitoring of 111 non‐regulated constituents showed only 6 were reported above the RL at least one time at concentrations order of magnitude lower than Drinking Water Equivalent Levels or other health based reference levels.
• Integrity Monitoring – results showed the AWP unit processes to be reliable and allowed for the identification and quick response to the few exceedances of alert limits. 30

SBP style.pptx 17
Summary & Conclusions (Cont.)
• UV/AOP Challenge Testing ‐ demonstrated the target log removal of NDMA & 1,4 Dioxane was achieved and provided information required to assess the electrical efficiency of the UV/AOP system.
• CEC Indicator Compounds ‐ were identified which could be useful to monitor RO & UV/AOP performance.
• CEC Surrogates ‐ surrogates for verifying RO and UV performance have been identified. Further research is needed to identify surrogates for the oxidation aspect of AOP.
31
Acknowledgments
• City Demonstration Project Team
• AWP Operations and Data Management Team
• North City Water Reclamation Plant Operations
• Regulatory Agencies:– California Division of Drinking Water – California Regional Water Quality Control Board San Diego
Region
• National Water Research Institute: Independent Advisory Panel (IAP) Members
• Funding Partners: – United States Bureau of Reclamation – California Department of Water Resources
32

SBP style.pptx 18
Pure Water San Diego Program Update2013 ‐ Present
• City Council adopted the Water Purification Project Report and Directed by City Council to explore all potable reuse options including DPR.
• On going operation & testing at the Demonstration Facility supported by CA Proposition 50, CA Proposition 84 and the WateReuse Research Foundation (WRRF) funding to demonstrate DPR.
• Completion of Siting and Planning Studies for full scale potable reuse facilities.
• The City is working on a 20 year Pure Water Program consisting of a 15 mgdwater purification facility to be operational by 2023 and an additional 83 mgd by 2035.
DOWNLOAD FULL PROJECT REPORTS:http://www.purewatersd.org
Statements of fact and opinion expressed are those of the author(s) and presenter(s). AZ Water Association, AZAWWA and AZWEA assume no responsibility for the content, nor do they represent official policy of the Association.
Q&A