Association of Markers in The
137
ASSOCIATION OF MARKERS IN THE VITAMIN D RECEPTOR WITH MHC CLASS II EXPRESSION AND MAREK'S DISEASE RESISTANCE Dana Praslickova Department of Animal Science McGill University Montreal Canada December, 2007 A thesis submitted to McGill University in partial fulfilment of the requirements of the degree of Doctor of Philosophy © Dana Praslickova, 2007
-
Upload
vivek-pande -
Category
Documents
-
view
42 -
download
5
Transcript of Association of Markers in The

ASSOCIATION OF MARKERS IN THE
VITAMIN D RECEPTOR WITH MHC CLASS II
EXPRESSION AND MAREK'S DISEASE RESISTANCE
Dana Praslickova
Department of Animal Science
McGill University
Montreal
Canada
December, 2007
A thesis submitted to McGill University in partial fulfilment
of the requirements of the degree of
Doctor of Philosophy
© Dana Praslickova, 2007

1*1 Library and Archives Canada
Published Heritage Branch
395 Wellington Street Ottawa ON K1A0N4 Canada
Bibliotheque et Archives Canada
Direction du Patrimoine de I'edition
395, rue Wellington Ottawa ON K1A0N4 Canada
Your file Votre reference ISBN: 978-0-494-50980-7 Our file Notre reference ISBN: 978-0-494-50980-7
NOTICE: The author has granted a nonexclusive license allowing Library and Archives Canada to reproduce, publish, archive, preserve, conserve, communicate to the public by telecommunication or on the Internet, loan, distribute and sell theses worldwide, for commercial or noncommercial purposes, in microform, paper, electronic and/or any other formats.
AVIS: L'auteur a accorde une licence non exclusive permettant a la Bibliotheque et Archives Canada de reproduire, publier, archiver, sauvegarder, conserver, transmettre au public par telecommunication ou par Plntemet, prefer, distribuer et vendre des theses partout dans le monde, a des fins commerciales ou autres, sur support microforme, papier, electronique et/ou autres formats.
The author retains copyright ownership and moral rights in this thesis. Neither the thesis nor substantial extracts from it may be printed or otherwise reproduced without the author's permission.
L'auteur conserve la propriete du droit d'auteur et des droits moraux qui protege cette these. Ni la these ni des extraits substantiels de celle-ci ne doivent etre imprimes ou autrement reproduits sans son autorisation.
In compliance with the Canadian Privacy Act some supporting forms may have been removed from this thesis.
Conformement a la loi canadienne sur la protection de la vie privee, quelques formulaires secondaires ont ete enleves de cette these.
While these forms may be included in the document page count, their removal does not represent any loss of content from the thesis.
Canada
Bien que ces formulaires aient inclus dans la pagination, il n'y aura aucun contenu manquant.

MOTTO
"...for it is not the rock that is the most solid and it is not steel that is the most firm.
In fact, it is an ordinary Joe whose endurance is greatest."
J. C. Hronsky: Jozef Mak.
Published in Czechoslovakia by Tatran, 1965, p. 271

This is dedicated to
my beloved daughter Zuzana for being supportive
and patient throughout all these years...

Contents
TABLE OF CONTENTS
Page
TABLE OF CONTENTS i
ABSTRACT v
RESUME vii
ACKNOWLEDGEMENTS ix
LIST OF TABLES xi
LIST OF FIGURES xii
ABBREVIATIONS xiv
STATEMENT OF ORIGINALITY xvii
CONTRIBUTION OF CO-AUTORS TO MANUSCRIPTS
FOR PUBLICATION xix
CHAPTER 1 - INTRODUCTION 1
1.1 GENERAL INTRODUCTION 1
1.1.1 Hypothesis 2
1.1.2 Objective 2
1.1.3 Experimental model 3
1.2 OVERVIEW OF THESIS CONTENT 3
1.3 REFERENCES 4
CHAPTER 2 - LITERATURE REVIEW 5
2.1 GENERAL DESCRIPTOPN OF MAREK'S DISEASE 5
2.1.1 Marek's disease virus 5
2.1.2 Phatogenesis 7
2.1.3 Immune response of the organism 10
2.1.4 Diagnosis of Marek's disease 12
2.2 CONTROL STRATEGY 13
2.2.1 Vaccination 13
2.2.2 Genetic resistance 15
2.2.3 Major histocompactibility complex genes 16
2.2.4 Non-major histocompactibility complex genes 16

2.3 GENES USED IN OUR STUDY 17
2.3.1 Growth hormone 17
2.3.2 Growth hormone receptor 18
2.3.3 Macrophage inflammatory protein 3a 19
2.3.4 Vitamin D 20
2.4 REFERENCES 23
CONNECTING STATEMENT I 35
CHAPTER 3 - SEQUENCE VARIATIONS IN GENES ENCODING
ENZYMES INVOLVED IN THE VITAMIN D METABOLISM AND
ASSOCIATION WITH SUBCLASSES OF PERIPHERAL BLOOD
MONONUCLEAR CELLS IN CHICKENS 36
3.1 ABSTRACT 37
3.2 INTRODUCTION 38
3.3 MATERIALS AND METHODS 39
3.3.1 Strains of chickens and data collection 39
3.3.2 Flow cytometry 39
3.3.3 Genetic analysis 40
3.3.4 Statistics and graphics 41
3.4 RESULTS 41
3.4.1 Determination of blocks of co-segregating SNP 41
3.4.2 Association of single genes with the cell
differentiation antigens on peripheral blood
mononuclear cells 42
3.4.3 Gene interaction 43
3.4.4 Correlation with production traits 43
3.5 DISCUSSION 44
3.6 ACKNOWLEDGEMENTS 47
3.7 REFERENCES 60
CONNECTING STATEMENT II 63

CHAPTER 4 - EFFECT OF MARKER ASSISTED SELECTION ON
INDICATORS OF MAREK'S DISEASE IN A VACCINATED
COMMERCIAL WHITE LEGHORN STRAIN 64
4.1 ABSTRACT 65
4.2 INTRODUCTION 66
4.3 MATERIALS AND METHODS 68
4.3.1 Strains of chickens and selection strategy 68
4.3.2 Markers selection 68
4.3.3 Challenge 69
4.3.4 Apramycin treatment 69
4.3.5 Viral titers in feather tip extracts 69
4.3.6 Statistical analysis 70
4.4 RESULTS 70
4.4.1 Efficacy of vaccination 70
4.4.2 Effect of selection trial on viral titers 71
4.4.3 Survival analysis 71
4.4.4 Necropsy analysis 72
4.4.5 Effect on body weight, spleen weight and bursal
weight 73
4.5 DISCUSSION 73
4.6 REFERENCES 86
CONNECTING STATEMENT III 89
CHAPTER 5 - ASSOCIATION OF A MARKER IN THE VITAMIN D
RECEPTOR GENE WITH MAREK'S DISEASE RESISTANCE IN
POULTRY 90
5.1 ABSTRACT 91
5.2 INTRODUCTION 92
5.3 MATERIALS AND METHODS 93
5.3.1 Strains of chickens and challenge test 93
5.3.2 DNA extraction and viral titration 93
5.3.3 Genetic analysis of the VDR gene 94
Contents
5.3.4 Statistical analysis 94
5.4 RESULTS 95
5.4.1 Association with viral proliferation 95
5.4.2 Association with MD lesions, mortality and weight
of the bursa 95
5.5 DISCUSSION 96
5.6 REFERENCES 106
CHAPTER 6 - GENERAL CONCLUSION 109
APPENDIX 113

Abstract
ABSTRACT
Vaccination, biosecurity and selection for genetic resistance are used world-wide
in the poultry industry against the threat of Marek's disease (MD). Unfortunately there
are new outbreaks of MD that cause serious economic problems. Scientists are therefore
searching for new and more effective ways to improve existing controls of the disease.
Knowledge of the chicken genome and progress in the study of the molecular biology of
the MD virus are providing new approaches to MD control. A particularly useful strategy
is the identification of genes that affect viral and tumor susceptibility. Genetic markers in
the growth hormone receptor (GHR), the growth hormone (GH) and the chemokine MIP-
3 a that are associated with MD resistance have previously been identified in our
laboratory. In this thesis we identified additional candidate genes by analyzing genes of
the vitamin D metabolism; conducted a large scale challenge experiment with Marek's
disease virus and tested genes encoding enzymes involved in vitamin D metabolism for
association with disease resistance.
The first manuscript describes the analysis of three genes of the vitamin D
metabolism for sequence variability and their association with the proportion of
peripheral blood mononuclear cells (PBMC) that display the surface antigens LYB, MHC
II, CD3, CD4, CD8, TCR1 (Ty8) and TCR2 (Tap1). We identified a genetic marker in the
vitamin D receptor (VDR) gene that affected the frequency of the MHC class II
expressing leukocytes (P=0.0007), and a marker in the vitamin D binding protein gene
that (DBP SIP 15) affected the expression of TCR1.
The goal of the second study was to conduct selection in a commercial strain of
White Leghorns for markers in the GH, GHR and MIP-3a genes that had previously been
associated with MD resistance and to compare the resistance of the selected and non-
selected commercial cross. We conducted two challenge experiments three months apart
with 100 chickens from the selected and 100 chickens from a non-selected population in
each challenge. To maintain similarity in poultry management, we followed a commercial
vaccination procedure. A database was compiled that comprised measurements of the
viral titers in extracts of feather tips on a weekly basis up to 8 weeks post infection, a
record of mortality and a necropsy analysis of all chickens, including those that died
Abstract
during the experiment. The outcome in challenge 1 differed from challenge 2. In
challenge 1 the selected population had a two-fold lower viral load than the non-selected
control population (P= 10") while in challenge 2 the situation was reversed (P=T0"). A
comparison of the effect of the challenge on the two populations shows that the titers in
the non-selected population in the two challenges were similar, while the titers in the
selected population differed by a factor of four. Hence the challenges were reproducible
for the non-selected population but not for the selected population. The same conclusion
was reached when other indicators of MD, such as mortality, frequency of proliferative
lesions, loss of body weight or atrophy of the bursa were measured. The source of the
different behaviors is unknown, but it raises the possibility that immune compromising
factors such as stress, nutritional status, maternal antibodies or infections may
compromise the response to MD infection in a manner that is dependent on the genetic
background.
In the third manuscript we used the database we had created to analyze the
influence of three markers in the chicken VDR gene on MD resistance. We found that the
marker that had been found to be associated with MHC class II was also associated with a
reduced viral titer (P=0.002). The effect of the genotypes was additive with a 50%
difference between the two homozygotes. It was independent of the population as well as
the challenge. Other indicators of MD behaved concordantly. The result is the first
evidence that genetic variants in genes encoding enzymes involved in vitamin D
metabolism may affect MD resistance in chickens.

Resume
RESUME
La vaccination, la biosecurite et la selection pour une resistance genetique sont
utilisees mondialement dans l'industrie avicole contre le danger impose par la maladie de
Marek (MD). Malheureusement, il y a des nouvelles apparences de MD qui causent de
graves problemes financiers. Des scientifiques sont en train de chercher de nouvelles et
meilleures facons d'ameliorer les methodes de controles presentement utilises contre le
MD. Une strategie particulierement utile consiste a identifier les genes qui affectent
l'hypersensibilite virale et tumorale. Les marqueurs genetiques trouves dans le recepteur
de 1'hormone de croissance (GHR), l'hormone de croissance (GH) et le chemokine MIP-
3a, qui sont associes avec la resistance contre la MD, ont deja ete identifies dans notre
laboratoire. Dans cette these on a identifie d'autres genes candidats en analysant les
genes du metabolisme de la vitamine D. Pour accomplir cette tache, on a cree une
experience scientifique, effectuee sur une grande echelle, avec le virus de la maladie de
Marek, et on a teste les genes du metabolisme de la vitamine D associes avec la resistance
contre la maladie.
Dans le premier manuscrit on a decrit 1'analyse des trois genes du metabolisme de
la vitamine D pour la variability dans leur sequence genetique et leur association avec la
proportion des cellules mononuclees du sang peripherique (PBMC) qui exposent les
antigenes de surface: LYB, MHC II, CD3, CD4, CD8, TCR1 (TyS) et TCR2 (Tap). On a
identifie un marqueur genetique dans le gene du recepteur de la vitamine D qui a un effet
sur la frequence des leucocytes exprimant des MHC II (P=0.0007), et un autre marqueur
dans le gene de la proteine fixant vitamine D (DBP S1P15) qui a un effet sur l'expression
deTCRl.
Le but de la deuxieme etude etait d'effectuer une selection dans la lignee
commerciale de White Leghorns pour des marqueurs genetiques dans les genes GH,
GHR, et MIP-3a qui ont deja ete associes avec l'hormone de croissance, et de comparer
la resistance des volaille commerciale selectionnes et non-selectionnes. On a prepare
deux defis avec trois mois d'ecart et avec 100 individus selectionnes et 100 individus
non-selectionnes dans chaque defi. Pour atteindre une coherence dans la gestion des
volailles, on a suivi la procedure pour la vaccination commerciale. Une base de donnees
vii

Resume
a ete compilee, contenant les mesures des titres viraux venant des extraits de bout de
plumes qui ont ete preleves chaque semaine pendant huit semaines apres l'infection, et les
analyses d'autopsie de toutes les volailles, y compris celles qui sont mortes pendant la
manipulation. Les resultats du premier defi etaient differents du second. Dans le premier
defi, la population selectionnee avait une charge virale deux fois moins de celle de la
population non-selectionnee (P=10~5), tandis que cette situation etait inversee lors du
deuxieme defi (P=10"3). Une comparaison de l'effet du defi sur les deux populations
demontre que les titres de la population non-selectionnee sont similaires dans les deux
defis, pendant que les titres de la population selectionnee different d'un facteur de quatre.
Ainsi, les defis etaient reproductibles pour la population non-selectionnee et non pour la
population selectionnee. La meme conclusion a ete atteinte quand les autres indicateurs
de MD, telles que la mortalite, la frequence des lesions proliferatives, la perte de poids,
ou l'atrophie de la bourse ont ete mesurees. La source des differents comportements est
inconnue, mais ceci donne la possibility que les facteurs qui compromettent les defenses
immunitaires comme le stress, l'etat nutritionnel, et les anticorps materaels, ou les
infections peuvent compromettre la reponse a l'infection de MD d'une maniere qui
depend du contexte genetique.
Dans le troisieme manuscrit, on a utilise la base de donnees qu'on a creee dans le
but d'analyser l'influence des trois marqueurs du gene VDR des volailles sur la resistance
contre la maladie de Marek. On a trouve que le marqueur deja associe avec MHC classe
II etait aussi associe avec un titre viral reduit (P=0.002). L'effet des genotypes etait
additif, avec une difference de 50% entre les deux homozygotes. Cet effet se manifestait
independamment de la population et du defi. D'autres indicateurs de la maladie de Marek
se sont conduits en consequence. Le resultat est la premiere indication que les variables
genetiques des genes du metabolisme de la vitamine D peuvent influencer la resistance
contre les maladies des volailles.
V1U

Acknowledgements
ACKNOWLEDGEMENTS
I wish to extend my sincere gratitude and appreciation first of all to my supervisor
Dr. Urs Kiihnlein. His wonderful guidance, encouragement, research suggestions and
daily discussions have made my work in the laboratory very enjoyable. His feelings of
excitement and joy towards science and novel research will always remain etched in my
mind. I will remember everything, and if I ever have my own students I wish they will
have the same feelings about me, as I have about this extraordinary man. Thank you Dr.
Kiihnlein!
My gratitude also belongs to Dr. David Zadworny, my first supervisor and mentor
at the Department of Animal Science, for his guidance and support, and for encouraging
me in my further studies.
I wish to thank Dr. Al Kulenkamp and Dr. George Ansah from the Shaver Poultry
Breeding farms Ltd. Cambridge, ON and Dr. Shayan Sharif, A.J. Sarson, M.F. Abdil-
Careem from the department of the Pathobiology, Veterinary School, University of
Guelph, ON for carrying out the breeding and the Marek's disease challenge experiments
and for their advise in the writing of my thesis.
I wish to acknowledge a very special man who is no longer with us. His rich life
was broken by cancer and I could not be there to express my gratitude. His name is Jozef
Cerman M.D. (Institute of Parasitology, Slovak Republic, Europe), and I thank him for
opening the door for me to the world of science by encouraging my curiosity. His
patience and teachings have taught me how important it is to be organized and to
maintain clear and detailed records of every step made, including mistakes.
I wish to thank Dr. Chadee and Kathy Keller at the Institute of Parasitology,
McGill University, for helping me when I first arrived to Canada in 1999. Particularly
Kathy, she was my voice when I could not speak English.
I wish to thank Dr. Xin Zhao, Dr. Roger Buckland and Dr. Ciro Riuz-Feria, for
acting as my committee members and for always having time to answer my questions.
My sincere thanks go to Alejandra Burchard-Levine, Myriam Fenina and Jean
Daniel Lalande, summer students of Dr. Kiihnlein and Dr. Zadworny, for their help with
DNA extraction in my project. I believe that the amount of feathers that passed trough our
ix

Acknowledgements
hands could provide a few of pairs of the wings for Daedalus and Icarus to escape from
the Crete.
I am thankful to Barbara, Cindy and Sandra, our secretaries for being so friendly
and supportive. Especially for Barbara's advice of an Iron treatment when I was feeling
ill, for Cindy's smile and helpful advice in parenting, and for Sandra's amicable and
cheerful personality.
I want to thank my school mates Katja, Susana, Jimmy, Babu, Reza, Marilyn,
Jovette, Benoit, Nabil, Juliette, Ming-Kai, Stephanie, Gen, Yonju Ha, Vinay, Marsha,
Deeni, Audrey, Jessica, Fadi and Jose for making my everyday life in the department a
bearable one, for introducing me to their different cultures, for making me laugh and for
the many social activities behind the walls of the University.
I would like to thank Charles-Olivier Basile for his tireless effort in correcting my
English.
Last but not least, I would like to thank my loving husband Jan and my family for
the unconditional support they provided me throughout all these years. Especially to my
mother for her boundless love and for her complete understanding when I could not be
with her during her heart surgery. Thank you mamicka!

List of Tables
LIST OF TABLES
Page
Table 3.1 Primers used to amplify segments of the VDR, DBP and Cyp24
genes 48
Table 3.2 Distribution of the polymorphisms 49
Table 3.3 Identification of groups of co-segregating markers in he genes
encoding the DBP 50
Table 3.4 Association of single and pairwise combinations of marker
genotypes with cell surface antigens on leukocytes 52
Table 3.5 Spearman rank correlation between FACS counts 53
Table 3.6 Correlation between egg quality trails and leukocyte cell surface
antigens 54
Table 4.1 Influence of selection on the genotype distribution 76
Table 4.2 Comparison of the cumulative viral titer at 3 and 5 weeks post
infection 76
Table 4.3 Frequency of lesions among chickens for various tissues in trial
1 and 2 77
Table 4.4 Effect of lesions on viral load, body, spleen and bursa weight in
surviving chickens 77
Table 5.1 GLM analysis of the dependence of the integrated viral titers on
trial, population and VDR S1P4 genotype 99
Table 5.2 Mean viral load for different VDR S1P4 genotypes 100

LIST OF FIGURES
List of Figures
Page
Figure 2.1 Marek's disease virus 5
Figure 2.2 Pathogenesis of Marek's disease 9
Figure 2.3 Immune responses to Marek's disease virus 10
Figure 2.4 The sources and metabolism of vitamin D 22
Figure 3.1 Association of VDR genotypes with the MHC class II count and
the CD8/CD3 ratio 55
Figure 3.2 Mean of TCR1 counts for different genotype combinations of
the marker S1P3 in the Cyp24 gene and S1P15 in the DBP gene 57
Figure 3.3 Interactive effect between the DBP gene and the Cyp24 gene on
the TCR1 ratio 58
Figure 4.1 Mating strategy to produce the commercial strain 123 78
Figure 4.2 Protective effect of vaccination on MD mortality 79
Figure 4.3 Effect of vaccination on the viral load integrated over the first 3
weeks post infection 80
Figure 4.4 Time course of viral proliferation 81
Figure 4.5 Percentile distribution of the viral load to 3 weeks in
dependence of trial and population 82
Figure 4.6 Survival curve of the two populations S and U in trial 1 and 2 83
Figure 4.7 Percentile distribution of the bursa-body weight ratio among the
survivors of the challenge experiment 84
Figure 4.8 Relationship between the mean bursa weight and mean of the
log transformed viral load to 35 dpi among survivors of the
challenge experiment 85
Figure 5.1 Map of the VDR gene 101
Figure 5.2 Time course of viral titers in feather tips for different VDR S1P4
genotypes 102
Figure 5.3 Tissue distribution of proliferative and inflammatory lesions 103
Figure 5.4 Survival and hazard rate for different VDR SIP4 genotypes 104
List of Figures
Figure 5.5 Relationship between the proportion of MHC class II positive
peripheral leucocytes and mortality, the viral load to 21 dpi, and
the frequency of lesions/chicken 105

Abbreviations
ABBREVIATIONS
AEV
ANOVA
APC
bp
Ca2+
CCL20
CCR6
CD3
CD4
CD5
Cyp24
DBP
DNA
DNAman
dpi
EARCs
EDTA
et al.
EWT
FP-SBE
F2
g
GH
GHR
GHBP
GLM
HTV
IBD
ICP4
IGF
Avian Encephalomyelitis Virus
Analyses of Variance
Antigen Presenting Cells
Base Pair
Calcium Ions
Chemokine (C-C Motif) Ligand 20
CC Chemokine Receptor 6
Cluster of Differentiation 3 (Accessory Molecules for T Cell)
Cluster of Differentiation 4 (Accessory Molecules for T Cell)
Cluster of Differentiation 4 (Accessory Molecules for T Cell)
Vitamin D 24-hydroxylase
Vitamin D Binding Protein
Deoxyribonucleic Acid
Sequence Analysis Software for Windows and Macintosh
Day Post Infection
Ellipsoid Associated Reticular Cells
Ethylene Diamine Tetraacetic Acid
et alia, Latin for "and others"
Egg Weight in Specific Period
Fluorescence Polarization - Single Base Extension
Second Filial Generation
Gram
Growth Hormone
Growth Hormone Receptor
Growth Hormone Binding Protein
General Linear Model
Herpes Turkey Virus
Infectious Bursal Disease
Infected Cell Protein 4
Insulin Like Growth Factor
Abbreviations
IgGl
INFy
Log
k
LYB
LTD
mRNA
MD
MDV
MHCII
N
NaCl
NCSS
NIH
NK
NO
ODC
P-value
pH
PBMC
PBS
PCR
PEPCK-C
Per
RB1B
RFLP
PFU
S
SDS
SLD
SNP
Immunoglobulin G
Interferon Gamma
Logarithm
Haplogroup
Pan-B cell Monoclonal Antibody
Laron Type Dwarfism
Messenger Ribonucleic Acid
Marek's Disease
Marek's Disease Virus
Major Histocompatibility Complex Class Two
Number of Observations
Sodium Chloride
Number Cruncher Statistical System
National Institutes of Health
Natural Killer Cells
Nitric Oxide
Ornithine Decarboxylase
Probability
Negative Logarithm of the Hydrogen Ion Concentration
Peripheral Blood Mononuclear Cells
Phosphate Buffered Saline
Polymerase Chain Reaction
Cytosolic form of Phosphoenolpyruvate Carboxykinase
Period
Very Virulent Strain of MDV
Restriction Fragment Length Polymorphism
Plug of Units
Selected Population
Sodium Dodecyl Sulfate
Sex Linked Dwarfism
Single Nucleotide Polymorphism

Abbreviations
SPG
T
TCR1 (TyS)
TCR2 (Tap)
Tris-HCl
VD
VDR
VMRD
U
USDA
l,25-(OH)2D
25-OHD
Egg Specific Gravity
Trial
T Cell Receptor (Distinct Chains)
T Cell Receptor (Distinct Chains)
Trishydroxymethylaminomethane Hydrochloride
Vitamin D
Vitamin D Receptor
Veterinary Medical Research and Development
Unselected Population
United States Department of Agriculture
1,25 Dihydroxyvitamin D3
25 Hydroxyvitamin D3

Statement of Originality
STATEMENT OF ORIGINALITY
1) In chapter 3 (manuscript #1) the genetic variations in three genes of the vitamin D
metabolism were analyzed. Arbitrarily chosen markers were tested for an association with
differences in the profile of peripheral blood leukocytes. A marker in the vitamin D
binding protein and a marker in the vitamin receptor were found to affect the proportion
of TCR1 (TCRyS) and MHC class II expressing leukocytes, respectively. This is the first
report of an association of markers in genes of the vitamin D metabolism with immune
parameters in chickens.
2) Chapter 4 (manuscript #2) is the first report on DNA based selection for the markers
associated with Marek's disease resistance in poultry. Two hatches of a control
population and a population enriched for markers located in the growth hormone receptor,
the growth hormone, and the macrophage inflammatory protein 3a (MIP-3a) were
compared. Although the results in the two hatches were contradictory, it makes an
important point. Extraneous factors such as stress or the health status of the chickens may
affect the course of a disease and may reverse the effects of genetic markers on disease
resistance.
3) The challenge test was conducted in 400 vaccinated chickens, is larger and more
complete than those found in the literature. In particular, the database included a profile
of viral proliferation over 8 weeks, a record of mortality, measurements of the body
weight, spleen weight and bursa weight and extensive necropsy data. Furthermore, it is
the first such database established in vaccinated chickens. This database will be useful for
the identification of markers associated with Marek's disease in commercial population
that are usually vaccinated.
4) In chapter 6 (manuscript #3) we used our database to test the association of three
markers in the vitamin D receptor gene with disease resistance. The marker that had been
found to affect the expression of MHC class II was found to be associated with Marek's
disease susceptibility. All the other markers had no effect. This is the first report of
xvii

Statement of Originality
showing that the chicken segregates for vitamin D receptor variants that affect Marek's
disease susceptibility. Besides a recent report that the vitamin D receptor affects
susceptibility of humans to the hepatitis virus B, it is the first documentation of the
vitamin D receptor to have an impact on a viral disease.
XVUl

Contributors
CONTRIBUTION OF CO-AUTHORS TO MANUSCRIPTS FOR PUBLICATION
The thesis follows the form of manuscripts according to the "Guidelines
concerning Thesis Preparation" of the faculty of Graduate Studies and research. The
thesis consists of three manuscripts that are under review. Each manuscript has several
co-authors. The description of their contribution in the articles, and their corresponding
address are mentioned below.
Dana Praslickova4, (Ph.D. Candidate), conceptualized the project, conducted the
laboratory experiments, gathered and analyzed the data collected, and wrote the first and
subsequent drafts of all three manuscripts for scientific publication.
Urs Kuhnlein4 (Professor), supervisor of the Ph.D. candidate, provided invaluable
guidance on the experimental design, advised throughout the project, the data analysis,
the interpretation and the editing for the scientific publication and theses.
David Zadworny4 (Associate Professor), provided laboratory supplies and financial
support.
Dr. All Kulenkamp1 (Research Scientist) and Dr. George Ansah1 (Research Scientist)
carried out breeding and selection of the White Leghorn strains and vaccination.
M. Lessard 2 (Research Scientist) provided database for the analysis of immune traits.
Dr. Shay an Sharif3 (Associate Professor), Aimee J. Sarson3 (Graduate student),
Mohamed Faizal Abdul-Careem3 (Graduate student), carried out the Marek's disease
challenge experiments, necropsy analysis and valuable advises in the writing of my thesis.
Four different institutions were involved in this study: 1 Shaver Poultry Breeding Farms Ltd. 500 Franklin Boulevard, Cambridge, ON,
Canada, N1R8G6.

Contributors
Dairy and Swine research and development Centre, Agriculture and Agri-Food
Canada, Lennoxville, QC, Canada, JIM 1Z3.
Department of the Pathobiology, Veterinary School, University of Guelph,
Guelph, ON, Canada, NIG 2W1.
Department of Animal Science McGill University, 21-111 Lakeshore Road, Ste.
Anne de Bellevue. QC, Canada, H9X 3V9.

Chapter 1
CHAPTER 1
INTRODUCTION
1.1 GENERAL INTRODUCTION
Fossil records indicate that birds separated from mammals about 310 million years
ago (Furlong, 2005). The birds that we know as domestic poultry descended from the Red
Jungle Fowl (Gallus gallus). They were domesticated about 8000 years ago in South East
Asia (Kaul et al., 2004), and over the years have evolved into many different breeds. In
recent years selection by the poultry industry has been very extensive, using various
crossbreeding strategies to increase rate of growth, body weight, egg production, and
other traits aimed at increasing production.
New horizons, emerged, when the National Human Genome Research Institute
(NHGRI) announced the first draft of the chicken genome in 2004 (International Chicken
Genome Sequencing Consortium, 2004). Composed of about 1 billion base pairs of
sequence, the chicken genome was the first non-mammalian vertebrate, and the first
agricultural animal genome to be sequenced. The sequencing of the chicken genome was
accelerated because of outbreaks of avian flu that emphasized the need to learn more
about the chicken genome, and how genetic variation may play a role in the susceptibility
to the disease.
Identification of genetic variations that are involved in resistance, susceptibility or
tolerance to diseases such as salmonellosis, coccidiosis, lymphoid leucosis, Marek's
disease, ascites, sudden death syndrome, and infectious bursal disease will make it
feasible to select for disease resistance in poultry.
Our laboratory focused on the study of variation in the genes influencing the
resistance of chickens to Marek's disease (MD). Marek's disease is a highly contagious,
lymphoproliferative, re-emerging, and economically important disease in the poultry
industry. It is caused by an avian herpes virus. The continual evolution of MD virus
(MDV) towards greater virulence, and the evidence of reoccurrence of MD in vaccinated
flocks in the last decade, suggests that future outbreaks of MD could cause serious
problems. As a consequence, there has been a renewed effort to improve existing control
of the disease. Such control strategies are effective vaccination, good biosecurity, and
1

Chapter 1
selection for genetic resistance (Gimeno, 2004). It is also very important to note that the
economic impact of MD on the world poultry industry is thought to be in the range of
US$1-2 billion annually (Morrow and Fehler, 2004).
Genetic resistance is a reliable, long lasting, and environmentally sound solution.
The essential strategy is to identify the presence of variations in specific regions of the
genome (termed "marker") which affect viral and tumor susceptibility. We have
identified variations in the growth hormone receptor (GHR) gene, the growth hormone
(GH) gene (Kuhnlein et al, 1997; Feng et al, 1998) and the macrophage inflammatory
protein 3a (MIP-3a, CCL20, ahl89) gene (Masilamani, 2003) that were associated with
MD resistance.
The search for genetic variants that affect disease resistance is a continuous
process and the first manuscript in this thesis describes the association of three genes of
the vitamin D metabolism with changes in the immune response. In the second
manuscript we describe marker assisted selection for the three genes described above.
This experiment also provided us with a database to test the association of markers with
resistance. In the last manuscript, we used this database to analyze the effect of a marker
of the vitamin D receptor gene that we had found to be associated with a reduced
expression of MHC class II antigen on peripheral blood leukocytes.
1.1.1 Hypothesis
1) Similar to humans, chickens are segregating for variants in genes of the vitamin D
metabolism that affect the cognate immune system.
2) Selection for the favorable alleles can be used to improve disease resistance for MD in
commercial strains of the chicken.
3) Genes of the vitamin D metabolic pathway that affect the immune response will also
affect MD.
1.1.2 Objective
1) Characterization of genes encoding enzymes in the vitamin D pathway. Search for
markers that affect the profile of peripheral blood leukocytes. Such markers will provide
us with candidate markers for MD resistance.
2

Chapter 1
2) Conduct marker assisted selection in a commercial cross to improve Marek's disease
resistance (MDR) using markers previously associated with MDR and to simultaneously
create a database for the detection of additional resistance associated markers.
3) Test the genetic variations in the genes of vitamin D pathway that affect immune traits
for association with resistance to MD.
1.1.3 Experimental model
A strain of White Leghorn chickens was used in our study, a non-inbred
experimental strain that was developed and maintained at Agriculture Canada (Ottawa,
Ontario), and a commercial strain that was developed by Shaver Poultry Breeding Farms
Ltd. (Cambrige, Ontario).
The genes we chose for selection in our experiment were candidate genes (GH,
GHR and MIP-3a) involved in growth and immune responsiveness. The genetic variation
of the genes were previously identified in our laboratory as being associated with
resistance to MD. The genes of the vitamin D metabolism were chosen on the basis of
their association with immune responsiveness and disease resistance in humans.
Breeding was carried out by the Shaver Poultry Breeding Farms Ltd. (Cambridge,
ON) and the challenge by the Dept of Pathobiology of the Ontario Veterinary School, of
the University of Guelph (ON). The project was approved by the Animal Care Committee
of that department. They are an accredited institution specialized in poultry breeding with
personal and/or animal protective equipment, animal housing in standard cages, and
environmentally safe procedures that avoid exposure with (and/or inactivate) all of the
potential pathogens.
1.2 OVERVIEW OF THE THESIS CONTENT
There are six chapters in this thesis, beginning with the introduction describing the
hypothesis and the objective of this study, followed by a literature review. The literature
review contains a general description of Marek's disease, control strategies of the poultry
industry and a characterization of the genes used in our study. Chapter 3, 4 and 5 are
manuscripts describing our results, including the references specific to each manuscripts.
Chapter 6 contains the conclusion.
3

Chapter 1
1.3 REFERENCES
Feng, X.P., Kuhnlein, U., Fairfull, R.W., Aggrey, S.E., Yao, Y. and Zadworny, D. (1998)
A genetic marker in the growth hormone receptor gene associated with body
weight in chickens. J. Hered., 89: 355-359
Furlong, R.F. (2005) Insights into vertebrate evolution from the chicken genome
sequence. Genome Biol, 6:207
Gimeno, I.M. (2004) Future strategies for controlling Marek's disease. Marek's disease:
An Evolving problem. Elsevier Academic press, London, UK, pp. 186-199
International Chicken Genome Sequencing Consortium (2004) Sequence and comparative
analysis of the chicken genome provide unique perspectives on vertebrate
evolution. Nature 432: 695-716
Kaul, R., Shah, J.N. and Chakrabarty, B. (2004) An assessment of important physical
traits shown by captive Red Jungle Fowl in India. Curr. Sci., 87:1498-1499
Kuhnlein, U., Ni, L., Weigend, S., Gavora, J.S., Fairfull, W. and Zadworny, D. (1997)
DNA polymorphisms in the chicken growth hormone gene: Response to selection
for disease resistance and association with egg production. Anim. Genet., 28: 116-
123
Masilamani, T.J. (2003) Identification of genetic markers associated with Marek's disease
in chickens. M.Sc. Thesis, McGill University
Morrow, Ch., and Fehler, F. (2004) Marek's disease: a worldwide problem. Marek's
disease: An Evolving problem. Elsevier Academic press, London, UK, pp. 49-61
4

Chapter 2
CHAPTER 2
LITERATURE REVIEW
2.1 GENERAL DESCRIPTION OF MAREK'S DISEASE
Marek's disease was first described by Jozef Marek in 1907 (Marek, 1907). It is
characterized by paralysis, as a result of lymphoid infiltration into peripheral nerves,
lymphomas in various organs, skin lesions, immunosuppression and blindness
accompanied by non-specific signs such as weight loss and pallor (Zelnik, 2004). It is
caused by a herpesvirus, the Marek's disease virus (MDV). An important step forward in
the study of the disease was the isolation of MDV from a chicken kidney tumor cell
culture by Churchill and Biggs, (1968) and independently from cultured duck embryo
cells by Nazerian et al. (1968) and Solomon et al. (1968).
2.1.1 Marek's disease virus
MDV (Figure 2.1) is a member of the Alphaherpesvirinae subfamily of the
Herpesviridae (Cantello et al, 1991). Herpesviridae genomes are double stranded linear
DNA molecules that range in size from 108 - 230 kbp (Davison, 2002).
Figure 2.1 Marek's disease virus (Shumacher, 2001).
5

Chapter 2
Three MDV serotypes have been identified, of which only serotype 1 (MDV-1) is
pathogenic, whereas MDV serotype 2 (MDV-2) and serotype 3 (herpesvirus of turkeys,
HVT) are not pathogenic or only weakly pathogenic and non-oncogenic in chickens
(Tischer et al, 2002). All three serotypes have been sequenced and it has been shown
that the gene contents and linear arrangements are similar but they vary in the content of
guanine and cytosine (GC): 44.1 %, 53.2 % and 47.2 % in MDV-1, MDV-2 and HTV,
respectively (Lee et al, 2000). Genome comparisons suggest that the three viruses have
evolved in parallel from different viral species (Fragnet et al, 2003). The virus genome
is comprised of a long unique sequence (UL) and short unique sequence (Us) each of
which is bracketed by inverted internal (IRL, IRS) and terminal repeats (TRL, TRS) (Nair et
al, 2004).
A total of 103 (MDV-1), 102 (MDV-2) and 99 (HTV) genes have been identified.
The putative oncogene for MDV1 is MDV EcoRI-Q (meq) (Brown et al, 2006). Other
important genes associated with pathogenicity of MDV are phosphoprotein 38 (pp38) and
viral interleukin 8 (vIL8). MDV EcoRI-Q and pp38 both play important roles in latency
and tumor formation (Ross et al, 1997), and vIL8 (Parcells et al, 2001) attracts
lymphocytes and plays a role in oncogenesis (Sick et al, 2000). An important
immediate-early (IE) gene expressed early after infection is ICP4 (infected cell
polypeptide 4) which regulates aspects of viral replication (DeLuca and Schaffer, 1985).
Another group includes the genes that code for the proteins involved in MDV replication
and infection of cells. For example, the capsid protein VP5 and the tegument proteins
VP11/12, VP13/14, VP16 play important roles in MDV growth in cells (Lupiani et al,
2001), and the tegument protein VP22 is required for virus replication and virus
transmission between cells (Dorange et al, 2002). MDV membrane glycoproteins gE
and gl are absolutely required for MDV replication (Schumacher et al, 2001). The gC
gene encodes antigen A, which is expressed on the cell surface and in the cytoplasm of
infected cells (Coussens et al, 1989), but does not appear to be oncogenic (Calnek and
Witter, 1997). More research is needed to study genes that are involved in MDV
replication and pathogenesis to better understand and control MD.
6

Chapter 2
2.1.2 Pathogenesis
Marek's disease spreads by horizontal infection. Sources of infectious virus are
dust and dander shed from the feather follicle epithelium. The virus can then be inhaled
and enter the respiratory tract. Although most chickens develop symptoms of the disease,
many are carrier of the virus. Contaminated poultry units may be infectious for several
months at 20 to 25 °C and for several years at 4 °C (Calnek, 1980).
Marek's disease progresses through four sequential stages of infection: an early
cytolytic phase, a latent phase, a late cytolytic phase and transformation (Figure 2.2).
MDV is carried by macrophages from the pulmonary epithelium into the bloodstream and
enters primary (thymus and bursa) and secondary (spleen) lymphoid tissues. The peak
viral titer in these tissues is observed at 4 days post infection (dpi). It is likely that these
tissues become infected synchronously. Recent studies show that MDV also replicates
cytolytically in macrophages (Barrow et al, 2003). The open-ended capillaries of the
spleen are surrounded by ellipsoid-associated reticular cells (EARCs). The EARCs can
phagocytose the virus and present MDV antigens in the early stages of the disease
(Jeurissen et al, 1989). Macrophages and EARCs play important roles in the transfer of
MDV to the primary targeted cells: B lymphocytes. This stage is characterized as an
early cytolytic infection (Shek et al, 1983). The pathogenicity of the infecting virus and
the resistance of the host may affect the severity of the early cytolytic infection in terms
of the extent of lymphoid organ atrophy and early mortality (Witter et al, 1980).
As immune responses of the host develop around 6-7 dpi, the disease enters into
the latent stage. Latency is characterized by the infection of activated T lymphocytes.
Resting T cells cannot be infected, but cytolytic infection of B cells activates T cells and
they become susceptible to infection (Calnek et al, 1984). Some latently infected T cells
may become transformed; the exact reasons and time for the switch between the latent
and transformed stage is not fully understood (Baigent and Davison, 2004). In
genetically resistant chickens, MDV infection does not progress past latency, although
viral particles continue to be shed from the feather follicle epithelium (Calnek and Witter,
1997). In susceptible birds, a late cytolytic infection (14-21 dpi) occurs simultaneously
with permanent immuno-suppression. Focal necrosis in the tissues of epithelial origin
and in visceral organs occurs, and inflammatory reactions develop. Lymphoproliferative
7
Chapter 2
changes lead to the final stage of the infection. Lymphomas generally consist of
neoplastic, inflammatory and immunologically active cells. Activated T helper
lymphocytes are the primary targets for transformation (Schat et al, 1991).
Transmission of the virus to the environment is through the feather-follicle
epithelium. The virus is carried to the skin by latently infected peripheral blood
lymphocytes (10-12 dpi) that aggregate around the infected follicles. At around 13 dpi,
virus replication is fully productive, resulting in cell cytolysis and release of enveloped
cell-free virus. The amount of the shed virus increases until 21 dpi and then decreases
(Kiihnlein, 2006). All chicken strains can be infected by MDV but infection differs on the
basis of their susceptibility.
8

Chapter 2
PATHOGENESIS
Inhalation.
Enveloped MD virus
W LUNG.
MDV infected cells
Bursa •Spleen Thymus
Productive
infection
Death
Productive cytolytic infection
( Latent
infection
, Transformation
Lymphoma
Tumor cells
Figure 2.2 Pathogenesis of Marek's disease. Marek's disease virus is inhaled by the
chicken. It is phagocytized by macrophages and transported to the primary and secondary
lymphoid tissues where it infects B and activated T lymphocytes and replicates
cytolytically (early cytolytic stage). As a reaction to the immune response of the
organism, disease enters a latent stage at 6 -7 dpi. Around 14-21 dpi because of the
inflammatory changes in the lymphoid organs, cytolytic replication resumes (late
cytolytic infection). Some of the infected T and B-cells infiltrate the feather follicles and
infect epithelial cells that produce infectious enveloped viruses that are shed into the
environment. Some T-cells become transformed and infiltrate a diverse array of tissues,
leading to inflammatory and proliferative leasions and death (Calnek, 1986).
9
Chapter 2
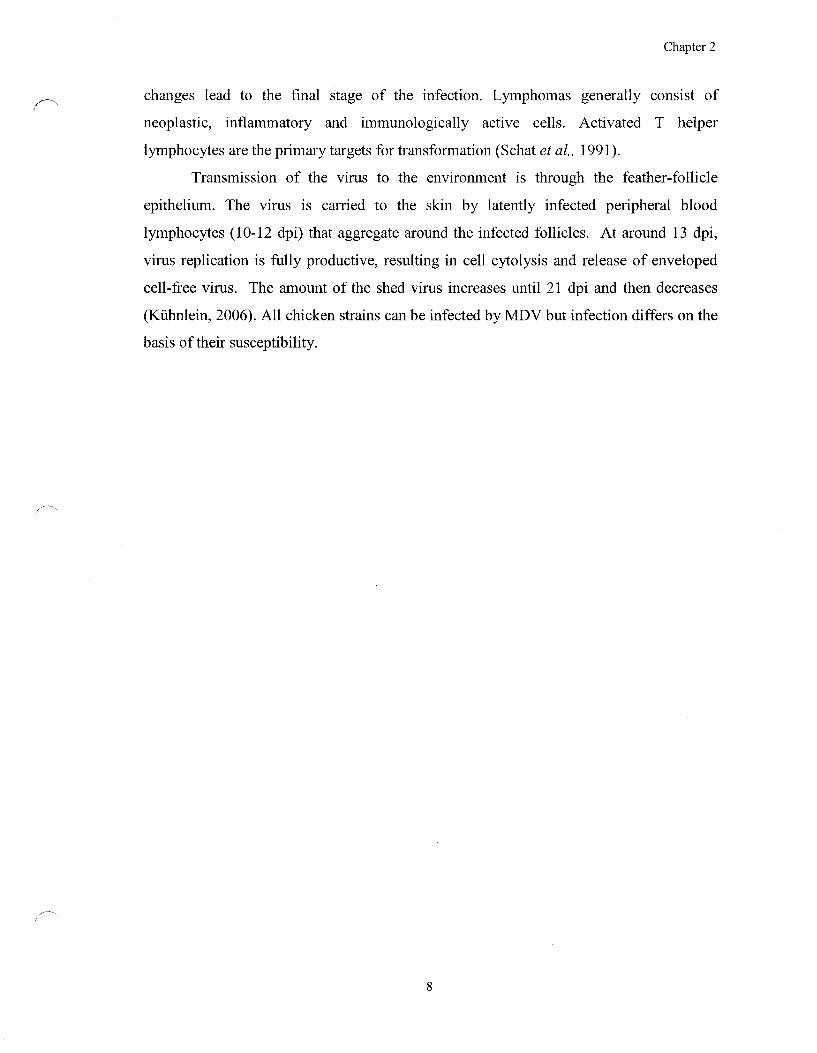
2.1.3 Immune response of the organism
Non-specific (innate) and specific (humoral and cell-mediated immunity, also
called aquired immunity) immune response control virus infections (Schat and
Markowski-Grimsrud, 2001) (Figure 2.3).
Figure 2.3 Immune responses to Marek's disease virus. The line at the bottom of the
figure represents dpi starting at day 0 (day of the infection). After MDV enters the lungs,
macrophages phagocytose MDV particles and transport them to lymphoid tissues where
they infect B cells and activated T cells (early cytolytic infection). Natural killer cells
play an important role in the innate defense against herpesviruses by killing infected cells.
The acquired immune response involving the activation of CD4+ cells and CD8+ cells
develops around 6-7 dpi disease. The infected cells then enter the latent stage when no
further viral replication takes place. Two to three weeks later, the cytolytic stage resumes
in the susceptible chickens (late cytolytic phase). Lesions and tumors appear and death
may occur.
10

Chapter 2
Innate immunity is the first line of defense against invading pathogens. MDV
enters the narrows of the lung parabronchi capillaries where it is ingested by
macrophages. Macrophages carry the virus from the pulmonary epithelium to the
primary and secondary lymphoid tissues where lymphocytes become infected and the
virus begins to replicate. Macrophages play an important role in the development of the
adaptive immune response by acting as antigen presenting cells (APC). They express
MDV antigens ICP4, pp38 and gB (Barrow et al, 2003) and release a variety of cytokines
as well as nitric oxide (NO) which can inhibit replication of MDV (Xing and Schat,
2000). Cytokines attract natural killer (NK) cells of the innate immune system. They are
non-phagocytic but are able to kill virus-infected and tumour cells (Cerwenka and Lanier,
2001). NK cells produce cytokines that regulate some of the functions of T lymphocytes,
B lymphocytes, and macrophages. They are the major source of interferon gama (IFN-y).
The level of IFN-y is higher in resistant chickens and increases with maximal activity at 7
dpi (Heller and Schat, 1987). NK cells also play a critical role in the defense against
MDV (Davison and Kaiser, 2004).
The major histocompactibility complex (MHC) proteins play important roles in
the response of an organism to infection. The MHC class I complex presents antigens to
cytotoxic T cells, thus offering targets for cytolysis (Ambagala et.al, 2005). The MHC
class II complex activates T helper cells (CD4) by displaying antigenic peptides
(LeibundGut-Landmann et.al, 2004). In the past it was shown that herpesviruses down-
regulate expression of MHC class I and II on the cell surface. However, Niikura, (2007)
published new findings which suggest possible up-regulation of MHC class II by MDV in
in vitro studies in MDV-infected chicken embryo fibroblasts as well as in vivo in infected
lymphocytes. MacLea and Cheng (2007) suggested that MDV increases expression of
MHC class II proteins to promote cytolytic infection of CD4 cells, as a strategy that
enables the virus to spread faster.
The specific immune response requires the activation of the B and T lymphocytes
to produce antibodies and cytotoxic T lymphocytes (CD8+). Antibodies delay
development of clinical signs of MD, tumor formation, and mortality (Calnek, 1972). It
is difficult to study the role of B and T lymphocytes in the defense against MDV because
the cells themselves become infected.
11

Chapter 2
The role of the cytokines in the immune response of an organism with MD were
poorly understood, but the development of a comprehensive panel of chicken cytokine
reagents by Secombes and Kaiser, (2003) made it possible to identify their function and
expression profile. The TH1 cytokines INF-y, interleukins (IL-2, IL-12, IL-18), the pro
inflammatory cytokines (IL-1(3, IL-6, IL-15) from resistant and susceptible chicken have
been sequenced and studied. Expression of INF-y in all infected birds was associated
with increased MDV loads. Differences were found in the expression of IL-6 and IL-8.
Susceptible birds over-express these cytokines while resistant chickens express neither of
them (Kaiser et al, 2003).
In addition the immune defense mechanism of the host, the transfer of maternal
antibodies by the vaccinated hens (maternal antibodies) has also been shown to reduce the
severity of the disease (Chubb and Churchill, 1969).
2.1.4 Diagnosis of Marek' s disease
Marek's disease virus was first identified by electron microscopic observations
(Nazerian et al, 1968). Chicken kidney cells or duck embryo fibroblasts are commonly
used for in vitro propagation of MDV and can be used to titrate MDV on the basis of
plaque formation (Churchill and Biggs, 1967). Three serotypes can be identified based
on the morphological characteristics of the plaques (Witter, 1983). Today electron
microscopy techniques are used mainly to study MDV morphology, physiology and tissue
distribution of the virus during infection (Zelnik, 2004).
Progress in immunological and molecular biology has enabled faster, more
accurate and more sensitive methods to detect MDV. Ideally, two independent
techniques for detection of MDV should always be included. Laboratory diagnosis of
MD involves mostly the isolation of the virus, followed by identification and
characterization using DNA analysis, antigen and antibodies.
Viral antigens can be detected in feather follicle epithelium from feather tips,
infected lymphoid tissues, or infected cell cultures by fluorescent antibody tests (FA)
(Spencer and Calnek, 1970), agar gel precipitation tests (AGP) (Haider et al, 1970) and
enzyme-liked immunosorbent assays (ELISA) (Cheng et al, 1984). Use of these tests is
12

Chapter 2
limited because MD antigen containing cells are rare in the lymphomas and latently
infected tissues. FA, AGP and ELISA can also be used for the detection of antibodies in
the chicken sera (Sharma, 1989).
The polymerase chain reaction (PCR) introduced in the 1980s has revolutionized
the detection and quantification of MDV. PCR can also be used to differentiate between
pathogenic and attenuated (Silva, 1992), and oncogenic and non-oncogenie (Zhu et al.,
1992) strains of MDV. Attenuated, non-oncogenic strains of serotype MDV-1 contain
multiple copies of a 132 base pair repeat; pathogenic strains contain one to three copies of
the same repeat sequence. After PCR, this difference is effectively visualized by
electrophoresis (Hirai et al, 1984). Complete DNA sequences of the MDV-1, MDV-2
and HTV genomes are available (Kingham et al, 2001) which allowed us to design
primers that can differentiate among MDV serotypes. Another application of PCR is the
quantification of the viral titer in samples (Bumstead et al, 1996). Absolute
quantification of viral DNA in a sample can be achieved by competitive PCR using viral
DNA of known concentration as an internal standard (Reddy et al., 2000; Linher, 2000).
2.2 CONTROL STRATEGY
Various factors can affect resistance of a chicken organism to MD. Some of these
factors include different methods of exposure to the virus (either by direct contact or
injection), gender (females are more susceptible to the disease than males) (Grander et
al, 1972), genetic background of the host, and the environmental factors.
In general, strategies to prevent MD in poultry include proper management to
avoid exposure to the virus (biosecurity), stress, prevention to infection by other
pathogens that suppress the immune system, vaccination and selection for disease
resistance.
2.2.1 Vaccination
Vaccination is the primary control strategy for MD in the poultry industry.
Churchill et al. (1969) described the first vaccine against MD. The vaccination strategy
involves intramuscular or subcutaneous administration of the vaccine to one-day-old
chicks, or the automated delivery of the vaccine in ovo to the amniotic fluid at
13

Chapter 2
embryonation day 18 (Sharma and Ricks, 2002). Other protocols include vaccination in
ovo followed by revaccination on the day of hatch or vaccination at hatch followed by
revaccination after 4-12 hours or at 7, 18, 21 days of age (Gimeno, 2004). Four general
types of MD vaccines are commercially available, HTV alone, HTV combined with
MDV serotype 2, CV1988 (also known as Rispens) alone or combined with MDV
serotype 2 or 3 (Witter, 1998), and the new MDV-1 vaccine (strain BH16) introduced by
Karpathy et al. (2002, 2003). New vaccines (recombinant vaccines) and adjuvants to
enhance the immune response are under trial (Gimeno, 2004). Recombinant vaccines are
individual viral proteins (i.e., not the whole virus) produced in yeast or bacteria. In
studies that compared different recombinant vaccines such as gB, gC, gD, gE, gl, gH
(viral membrane glycoproteins), the best level of protection was shown by gB
recombinant vaccine (Heine et al, 1997; Lee et al, 2003).
Vaccination can prevent mortality by reducing viral proliferation several fold and
by decreasing formation of tumors and clinical signs. Vaccination success depends on the
proper handling of the vaccine, strain of chicken, time between vaccination and exposure,
stress, and immune status of the chicken (Calnek and Witter, 1997). Continual evolution
of MDV towards greater virulence and recurrence of MD in vaccinated flocks (vaccine
failures) in the last decade suggest that future outbreaks of MD can cause serious
problems. The latest information about the occurrence of the disease was an outbreak in
six districts in vaccinated flocks in Haryana state in India (Kamaldeep et al, 2007). In
73,300 chickens of different production types (layer, broiler, and breeder) and age, the
morbidity and mortality ranged from 0.66% - 4.44% and 0.24% -1.00% respectively.
As a consequence, there is a great need to improve existing control of the disease
(Witter, 2001; Morrow and Fehler, 2004). There is therefore a renewed interest in host
genetic resistance. The genetic background of the host affects pathogenicity (Smith and
Calnek, 1974) as well as vaccine efficacy (Spencer et al, 1974). The mechanism by
which genetic background affects these processes remains to be elucidated (Calnek et al,
1988).
14

Chapter 2
2.2.2 Genetic resistance
The importance of genetic resistance in the control of MD was reported several
years ago, and it was used as the sole method of prevention prior to vaccine development.
The application of phenotypic selection in the poultry industry is impractical because it
requires exposure of the chicken to the pathogens with the danger of contaminating the
environment (Asmudson and Biely, 1932; Hutt and Cole, 1947; Cole, 1968).
Identification of genetic markers appears to be a more feasible strategy for improving
disease resistance.
The first genes identified as being associated with MD resistance were those
involved in the immune response of the chicken organism (Keller and Sevoian, 1981;
Calnek and Witter, 1997). These included the MHC genes, which regulate antigen
processing and presentation of antigenic peptides on the cell surface (Kaufman and
Venugopal, 1998). Selection for MHC haplotypes with resistance to MD has been used in
the poultry industry. However, since MHC genes are specific for peptides, it is feared that
such selection may reduce the repertoire of antigen recognition and render chickens more
susceptible to other infectious diseases.
There is evidence for variation in other genes that affect disease resistance; either
by modifying immune responsiveness or through other biological pathways
(Fredericksen et al, 1977; Bacon et al., 2001). We provided evidence for variations in
genes of the growth hormone axis (Kuhnlein et al, 1997), the macrophage inflammatory
receptor 3a (MIP-3a), ornithine decarboxylase (ODC) (Aggrey et al, 1996; Masilamani,
2003) and mitochondrial phosphoenolpyruvate carboxykinase (PEPCKM) (Li et al,
1998a, 1998b). Although we originally thought that these genes were unrelated to
immune responsiveness, recent evidence indicated that these genes have a general effect
on immune responsiveness. It reflects how extensively genes interact with each other.
The genes associated with genetic resistance can be divided into MHC and non-
MHC genes (Bacon et al, 2001).
15

Chapter 2
2.2.3 Major histocompactibility complex genes
The chicken MHC molecules are divided into three classes: class I, class II and
class IV. Based on similarity to mammals, class I molecules are present in all cell types
while class II are expressed by antigen presenting cells (APC). The MHC class II
molecules play an important role in APC - B cells - T cells interaction. Class IV
molecules are unique to avian species (Sander, 1993). They are expressed on
erythrocytes, liver cells, bursa and thymic lymphoblasts, and intestinal epithelial cells.
These molecules function in the antibody response of the organism, and they might be
involved in the enteric mucosal immunity against viruses and other pathogens (Zekarias
et al, 2002).
Chicken MHC was originally described as the blood group system B (chickens
have four blood groups: A, B, C, and E) (Plachy et al, 2003). Certain haplotypes of the
MHC gene have been associated with resistance to MD (Bacon, 1987; Zekarias et al,
2002). It was demonstrated that the B21 haplotype is associated with resistance to MDV,
while the B19 haplotype is associated with susceptibility to MDV tumor development
(Hansen et al, 1967). Kaufmann et al (1995) found a correlation between the level of 91
MHC class 1 expression and resistance to MD. The B haplotype expresses the lowest
level of MHC class 1 and has the highest degree of resistance. The possible explanation
of this mechanism is that low levels of MHC class I molecules lowers cytotoxic T cell
activity, and maximizes activity of NK cells (Zekarias et al, 2002; Plachy et al, 2003).
Selection for resistance associated with MHC haplotypes is used in the poultry industry.
MHC haplotypes also influence the efficacy of the response to MD vaccines depending
on the serotype used for the vaccination (Bacon and Witter, 1992, 1994).
2.2.4 Non-major histocompactibility complex genes
Evidence for the importance of non-MHC genes in disease resistance has been
known for more than two decades but was not well studied (Gimeno, 2004). This
changed when the sequence of the chicken genome was published by the National Human
Genome Research Institute (NHGRI) in 2004 (International Chicken Genome Sequencing
16

Chapter 2
Consortium, 2004). The availability of the chicken genome offers great opportunities to
expand studies of genes and genetic resistance.
Non-MHC markers for genetic resistance may be present in a variety of genes.
The genes may either be directly involved in the immune response or they can be
unrelated or only indirectly involved with the immune system (Fredericksen et ah, 1997;
Bacon et ah, 2001).
The proliferation and pathogenicity of MD virus involves the interaction of many
genes encoded by the viral genome with host genes. It is therefore expected that multiple
host genes will affect disease resistance (Witter, 1997). Such genes may affect the course
of the disease at the level of viral proliferation, oncogenic transformation, the viral
antigens that are recognized by the humoral and innate immune system, or the general
resilience of the host to MD (Calnek, 2001).
2.3 GENES USED IN OUR STUDY
2.3.1 Growth hormone
Growth hormone (GH), also known as somatotropin, is a protein hormone
synthesized and secreted in the anterior pituitary gland by somatotrophs. GH is also
produced in neural tissue, immune cells and reproductive tissue (Harvey and Hull, 2003).
These extrapituitary tissues also have GH receptors and are target sites for GH action. It
is therefore possible that the local production of GH has paracrine and autocrine actions
in addition to the endocrine actions of pituitary GH (Harvey et ah, 2000).
GH is obligatory for growth and also plays an important role in the regulation of
the metabolism of many cells. GH has direct and indirect effects. Direct effects are
mediated by GH binding to a specific receptor on a target cell. For example, GH
suppresses the ability of adipocytes to absorb lipids (Richelsen, 1997). Indirect effects on
a cell are mediated by another endocrine factor, insulin-like growth factor-I (IGF-I),
whose production is stimulated in other cells by GH. Insulin-like growth factor-I
stimulates the proliferation and differentiation of chondrocytes (cartilage cells) resulting
in bone elongation (Baker et ah, 1993).
17
Chapter 2
The GH promotes growth of the thymus, a gland responsible for the maturation of
T cells. For this purpose it is used in the treatment of HIV positive patients (Napolitano et
al, 2002). Cytokines such as interleukin-1 (IL-1) and interleukin-6 (IL-6) stimulate the
secretion of GH during the immune response (Koyu et al, 1999).
The GH gene in the chicken has been analyzed for its association with egg
production, age at first egg, egg weight in layers, gain in body weight, and feed
conversion in the broilers. Kuhnlein et al. (1997) and Feng et al. (1997) showed the
association of polymorphisms in the chicken GH gene with production traits. Linher
(2000) identified a marker in the GH gene that was associated with MDV proliferation in
lymphoid tissue (spleen). The same marker had been previously shown to be co-selected
with selection for MD resistance (Kuhnlein et al, 2006). Liu et al. (2001) confirmed the
association of this GH marker with MD resistance and showed that GH and the MDV
protein SORF2 (found only in serotype MDV-1) bind to each other.
2.3.2 Growth hormone receptor
The GHR is one of several members in the family of hematopoietin receptors
(Moutoussamy et al, 1998). It has three domains, a ligand binding domain, a single
hydrophobic trans-membrane domain and an intracellular domain. Although GHR is
expressed in a number of tissues (Hughes and Fiessen, 1985; Isaksson et al, 1985), the
highest concentration of receptors is found in the liver, where GH induces synthesis and
secretion of IGF-I (Isaksson et al, 1985).
Growth hormone exerts its effect by binding to the GHR resulting in the
dimerization of the GHR and recruitment of the cytoplasmatic tyrosine kinase named
Janus Associated Kinase 2 (JAK-2) and its phosporylation. Phosporylation of JAK-2 can
be detected within a few minutes of exposure the targeted cells to the extracellular
stimulation of GH. Activated JAK-2 phosporylate tyrosines on transcription factor
proteins (STATs). STATs will form dimmers and undergo translocation into the nucleus
where they act as transcriptional regulatory proteins. JAK-2 also activates mitogen-
activated protein kinase (MAPK) pathways affecting gene regulation (Alberts et al,
2002).
18

Chapter 2
In chickens, Vanderpooten et al. (1993) reported that the level of hepatic GHR
expression is affected by selection for growth or feed efficiency. A marker in the GHR
gene has been shown to be associated with juvenile body weight in strain 7 and strain 9 of
White Leghorn chickens (Feng et al, 1998). Variants of the GHR may affect interaction
with GH and, ultimately, the cellular response. Laron-type dwarfism (LTD) in humans
and sex-linked dwarfism (SLD) in the chickens are examples of disorders involving
defects in the GHR. LTD caused by a deletion in the GHR gene is characterized by high
levels of GH and low levels of IGF-I in the circulation (Godowski et al, 1989). SLD has
a similar profile and the mutation caused 30-40 % reduction in body weight, shortened
long bones, lower basal metabolism and greater accumulation of body fat (Burnside et ah,
1991).
2.3.3 Macrophage inflammatory protein 3a
MIP-3a, also known as a CCL20, LARC or EXODUS, is a chemokine involved in
attracting cells of the immune system (lymphocytes and dendritic cells) to sites of
inflammation and to facilitate their entry into the tissue.
Chemokines are categorized by the number and position of the conserved cysteine
residues. Four groups are distinguished: C, CC, CXC, and CXXXC (Sick et al, 2000).
Chemokines have small molecular weights (8-14 kDa). They regulate immune responses
by binding to seven-transmembrane G-protein-coupled receptors on the surface of
leukocytes (Giansanti et al., 2006). Chemokines are induced by proinflammatory
cytokines, extracellular proteins that regulate the intensity of the immune response by
stimulating or inhibiting the activation, proliferation, and/or differentiation of various
cells, and by regulating the secretion of antibodies or other cytokines.
The only known receptor for MIP-3a is the CC-chemokine receptor 6 (CCR6)
which is expressed on resting memory T cells, B cells and dendritic cells. This suggests
that the complex of CCR6 and MIP-3a plays a role in the physiology of resting memory
T cells, B cells and dendritic cells, and the interaction among these cells (Liao, 1999;
Wang, 2005). MIP-3a and CCR6 participate in morphogenesis and hematopoiesis (Sick
et al., 2000). The human alveolar epithelium is an important source of MIP-3a and may
play a critical role in the control of the movement of dendritic cells through the lung
19
Chapter 2
under normal and inflammatory conditions (Thorley, 2005). They therefore may also play
an important role in the host defense against MD infection. Studies indicate that MIP-3a
is overexpressed in pancreatic tumors (Kleeff et al, 1999) and hepatocellular carcinomas
(Yamauchi et al., 2003), but very little is known about the connection between cancer and
the expression of the chemokines in the avian species.
Hughes et al. (2001) isolated cDNA clones of three chicken chemokines
belonging to the CC group. The three clones identified were ah 189, ah 294 and ah 221
with EMBL accession numbers AY037861, AY037859 and AY037860 respectively.
According to Hughes et al. (1985), ahl89 showed 58% homology to human MIP-3a. In
our laboratory, Masilamani (2003) reported the association of Hin6l RFLP in the MIP-3a
(ahl 89) gene with the viral titer in MD challenged non-vaccinated chickens.
2.3.4 Vitamin D
Vitamin D is a steroid hormone that must undergo metabolic alteration before
being biologically active. Vitamin D has a wide spectrum of actions that include the
regulation of the levels of calcium and phosphorus, the growth and differentiation of cells
and the modulation of the immune system.
There are two sources of vitamin D, dietary intake and activation of an
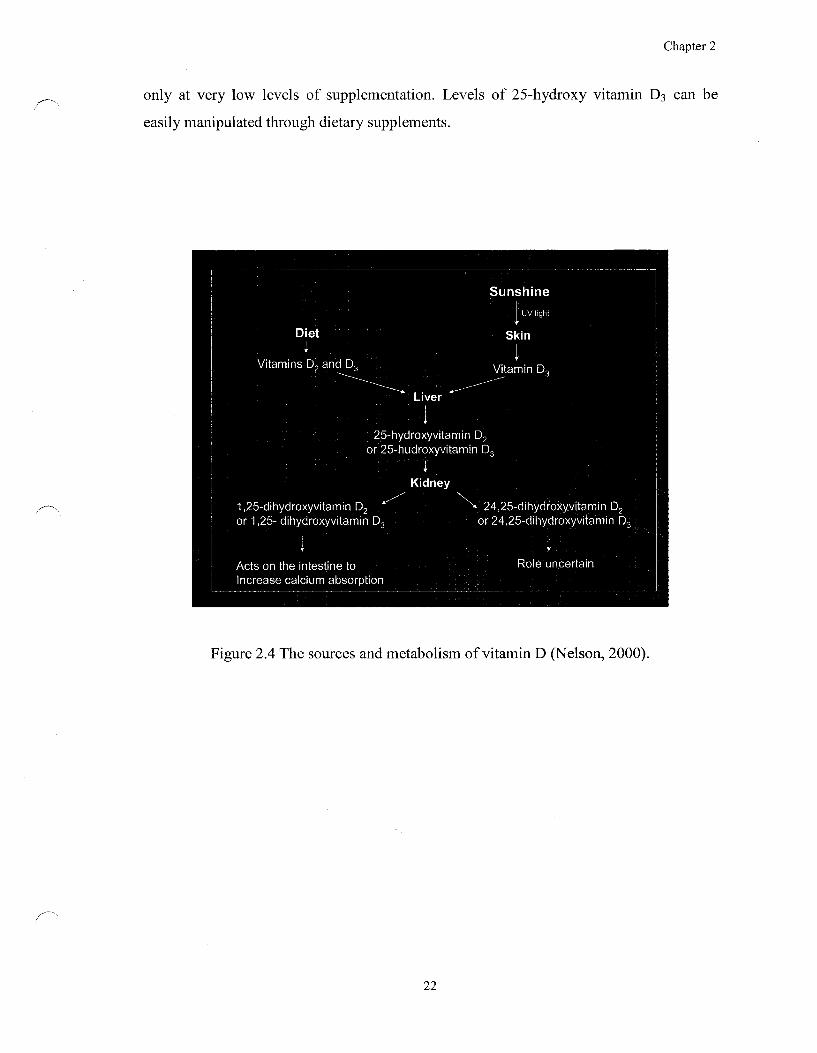
endogenous precursor by solar radiation (Figure 2.4). The dietary sources of vitamin D
are ergocalciferol from plants (vitamin D2) (Windaus et al, 1930) and cholecalciferol
(vitamin D3) from animal sources (Brockmann, 1936). In poultry, the vitamin D binding
protein (DBP) does not bind vitamin D2 effectively; therefore this form of vitamin D2
cannot be used as a feed additive (Soares et al, 1995). Cholecalciferol is generated in
epidermal skin cells by ultraviolet light induced conversion of 7-dehydrocholesterol, a
derivative of cholesterol (Goldblatt and Soames, 1923). Vitamin D3 is transported by
DBP to the liver, where it is hydroxylated to 25-hydroxy vitamin D3. This form of
vitamin D3 is then transported to the kidney where it is converted to the most active form
of vitamin D3, 1,25-dihydroxy vitamin D3, by the enzyme 1-alpha hydroxylase. The
cellular effects of vitamin D3 are mediated by the vitamin D receptor (VDR) (Kato, 2000;
Marcinkowska, 2001). VDR has two cellular locations, the nucleus and the cellular
matrix. The nuclear VDR acts as a transcription factor, while the membrane located
20

Chapter 2
receptor mediates the immediate actions of vitamin D3 via a signaling pathway. The
chicken VDR was isolated and characterized by Zhongjian et al. (1997, 2000).
Vitamin D within physiological concentrations has a positive effect on human
health. One of these effects is an attenuation of the immune system, thus preventing
autoimmune diseases (Deluca and Cantorna, 2001). In mouse model systems it was
shown that 1,25-dihydroxyvitamin D3 can either prevent or markedly suppress model
autoimmune disorders such as autoimmune encephalomyelitis, multiple sclerosis,
rheumatoid arthritis, systemic lupus erythematosus, type I diabetes, and inflammatory
bowel disease. The mechanism may be explained by the stimulation of transforming
growth factor (TGFP-1) and interleukin 4 (IL-4) productions which in turn may suppress
inflammatory T cell activity. Vitamin D also has antiseptic functions. Wang et al. (2004)
reported its ability to increase the expression of catathelicidin antimicrobial peptide
(camp) in human neutrophils.
In addition to its effect on the immune response, vitamin D also affects other
human diseases. McGrath et al. (2004) reported an association between vitamin D and a
reduced risk of schizophrenia. Intake of vitamin D by males in the first year of their life
may help prevent schizophrenia, but no similar pattern was found for women. Vitamin D
has protective effects against certain cancers. Epidemiological studies in humans
demonstrated a correlation between low levels of vitamin D intake and an increased risk
of several cancers. Kallay et al. (2005) reported that 1,25-dihydroxy vitamin D3
decreased the expression of p21 protein (regulating intestinal cell proliferation,
maturation and tumorigenesis), and thus led to hyperproliferation in the ascending colon.
In poultry, vitamin D has mostly been studied for its metabolic and physiological
effects when added as a feed component. Interestingly, feeding studies in poultry showed
that 25-hydroxy vitamin D3, but not 1,25-dihydroxy vitamin D3> has a positive effect on
fertility and hatchability (Soares et al., 1995). Increasing levels of 1,25-dihydroxy
vitamin D3 for a long period of time even showed toxic effects. Harms et al. (1988)
reported a decrease in egg production, egg weight, and feed consumption in laying hens
that were fed high levels of 1,25-dihydroxy vitamin D3. Atencio et al. (2005) compared
different levels of vitamin D3 and 25-hydroxy vitamin D3 fed to the broiler breeder hens,
and it was found that 25-hydroxy vitamin D3 had a greater potency than vitamin D3 but
21
Chapter 2
only at very low levels of supplementation. Levels of 25-hydroxy vitamin D3 can be
easily manipulated through dietary supplements.
Sunshine
Vitamins D, and D, Vitamin D,
Liver *"
25-hydroxyvitamin D2
or 25-hudroxyvitamin D3
1 Kidney
1,25-dihydroxyvitamin D2 *~ or 1,25- dihydroxyvitamin D3
* 24,25-dihydroxyvitamin D2
or24,25-dihydroxyvitamin D3
Acts on the intestine to Increase calcium absorption
Role uncertain
Figure 2.4 The sources and metabolism of vitamin D (Nelson, 2000).
22

Chapter 2
2.4 REFERENCES
Aggrey, S.E., Lessard, M., Hutchings, D., Joseph, S., Feng, X.P., Zadworny, D. and
Kuhnlein, U. (1996) Association of genetic markers with immune traits.
Proceedings of the 5th International symposium on Marek's disease, pp. 80-85
Alberts, B., Johnson, A., Lewis, J., Raff, M., Roberts, K., Walter, P. (2002) Molecular
biology of the Cell. Fourth edition. Garland Science, New York 10001-2299,
pp.884-886
Ambagala, A.P., Solheim, J.C., Srikumaran, S. (2005) Viral interference with MHC class
I antigen presentation pathway: the battle continues. Vet. Immunol.
Immunopathol., 107:1-15
Asmudson, L.D. and Biely, J. (1932) Inheritance of resistance to flow paralysis
(neurolymphomatosis gallinarum). I. Differences in susceptibility. Can.J.Res., 6:
171-176
Atencio, A., Pesti, G.M. and Edwards, H.M. Jr. (2005) Twenty-five
hydroxycholecalciferol as a cholcalciferol substitute in broiler breeder hen diets
and its effect on the performance and general health of the progeny. Poultry Sci.,
84: 1277-1285
Bacon, L.D. (1987) Influence of major histocompactibilyty complex on disease resistance
and productivity. Poultry Sci., 66: 802- 811
Bacon, L.D. and Witter, R.L. (1992) Influence of turkey herpesvirus vaccination on the
B-haplotype effect on Marek's disease resistance on the 15.B congenic chickens.
Avian Dis., 36:378-385
Bacon, L.D. and Witter, R.L. (1994) B haplotype influence on the relative efficacy of
Marek's disease vaccines in commercial chickens. Poultry Sci., 73: 481-487
Bacon, L.D., Hunt, H.D. and Cheng, H.H. (2001) Genetic resistance to Marek's disease.
Curr. Top. Microbiol. Immunol, (ed. Hirai, K.), Springer-verlag, Berlin, Germany,
pp. 121-142
Baigent, S.J. and Davison, F. (2004) Marek's disease virus: biology and life cycle.
Marek's disease: An Evolving problem. Elsevier Acad, press, London, UK, pp. 62
-77
23

Chapter 2
Baker, J., Liu, J.P., Robertson, E.J., Efstratiadis, A. (1993) Role of insulin-like growth
factors in embryonic and postnatal growth. Cell, 75: 73-82
Barrow, A.D., Burgess, S.C., Baigent, S.J., Howes, K., Nair, V.K. (2003) Infection of
macrophages by a lymphotropic herpesvirus: a new tropism for Marek's disease
virus. J. Gen. Virol, 84: 2635-2645
Brockmann, H. (1936) Die Isolierung des antirachitischen Vitamins aus Thunfischleberol.
H.-S.Zeit. Physiol. Chem., 241:104-115
Brown, A.C., Baigent, S.J., Smith, L.P., Chattoo, J.P., Petherbridge, L.J., Hawes, P.,
Allday, M.J. and Venugopal, N. (2006) Interaction of MEQ protein and C-
terminal-binding protein is critical for induction of lymphomas by Marek's
disease virus. PNAS, 103:1687-1692
Bumstead, N.J., Sillibourne, M. Rennie, N., Ross, L.J.N, and Davison, F. (1996)
Quantification of Marek's disease virus in avian lymphocytes using the
polymerase chain reaction. In R.F. Silva, H.H. Cheng, P.M. Coussens, L.F., Lee,
and L.F. Velicer (eds.). Current research on Marek's Disease. Am. Assoc. Avian
Pathol., Kennett Square, Pennsylvania, pp. 322-327
Burnside, J., Liou, S.S. and Cogburn, L.A. (1991) Molecular cloning of the chicken
growth hormone receptor complementary deoxyribonucleic acid: mutation of the
gene in sex linked dwarf chickens. Endocrinology, 128: 3183-3192
Cantello, J. L., Anderson, A. S., Francesconi, A. and Morgan, R. W. (1991) Isolation of a
Marek's disease virus (MDV) recombinant containing the lacZ gene of
Escherichia coli stably inserted within the MDV US2 gene. J.Virol., 65:1584-1588
Calnek, B.W. (1972) Antibody development in chickens exposed to Marek's disease
virus. In: P.M. Biggs, G. de-The and L.N. Payne Editors, Oncogenesis and
herpesviruses, International Agency for Research on Cancer, Lyon, France, pp.
129-136
Calnek, B.W. (1980) Marek's disease virus and lymphoma. In F.Rapp (ed.) Oncogenic
herpesviruses. CRC Press, Boca Raton, FL, pp. 103-143
Calnek, B.W., Schat, K.A., Ross, L.J.N., Shek, W.R. and Chen, L.H. (1984) Further
characterization of Maker's disease virus-infected lymphocytes. 1. In vivo
infection. Int. J.Cancer, 33: 389-398
24
Chapter 2
Calnek, B.W. (1986) Marek's disease - a model for herpesvirus oncology. CRC
Crit.Rev.MicrobioL, 12:293-319
Calnek, B.W, Adene, D.F., Schat, K.A. and Abpianalp H. (1988) Immune response
versus susceptibility to Marek's disease. Poultry Sci., 68:17-26
Calnek, B.W. and Witter R.L. (1997) Marek's disease. In B.W. Calnek and R.L. Witter
(eds.) Diseases of Poultry, 10l ed. Iowa State University Press, Ames, Iowa, pp.
369-413
Calnek, B.W. (2001) Pathogenesis of Marek's disease virus infection. Curr. Top.
Microbiol. Immunol., 255: 25-55
Cerwenka, A. and Lanier, L.L. (2001) NK cells, viruses and cancer. Nat. Immun. Rev., 1:
41-49
Cole, R.K. (1968) Studies on genetic resistance to Marek's disease. Avian Dis., 12: 9-28
Cheng, Y.Q., Lee, L.F., Smith, E.J. and Witter, R.L. (1984) An enzyme-linked
immunosorbent assay for the detection of antibodies to Marek's disease virus.
Avian Dis., 28:900-911
Chubb, R.C. and Churchill, A.E. (1969) Effect of maternal antibody on Marek's disease.
Vet. Record, 85: 303-305
Churchill, A.E. and Biggs, P.M. (1967) Agent of Marek's disease in tissue culture.
Nature, 215: 528-530
Churchill, A.E. and Biggs, P.M. (1968) Herpes-type virus isolated in cell culture from
tumors of chickens with Marek's disease. II. Studies in vivo. J. Natl. Cancer Inst.,
4: 951-956
Churchill, A.E., Payne, L.N. and Chubb, R.C. (1969) Immunization against Marek's
disease using a life attenuated virus. Nature, 221: 744-747
Coussens, P.M., Wilson, M.R., Roehl, H., Isfort, R.J. and Velicer, L.F. (1989) Nucleotide
sequence analysis of the Marek's disease herpesvirus strain GA and herpesvirus of
turkey stain PCI26 gp 57-65 (A antigen) genes. In S. Kato, T. Horiuchi, T.
Miteami and K Hirai (eds.) Advances in marek's Disease research. Japanese
Association on marek's Disease, Osaka, Japan, pp. 99-106
Davison, A. (2002) Comments on the phylogenetics and evolution of herpesviruses and
other large DNA viruses.Virus Res., 82: 127-132
25

Chapter 2
Davison, F. and Kaiser, P. (2004) Immunity to Marek's disease. In: Marek's disease, an
evolving problem. F. Davison F. and V. Nair eds. Elsevier Academic Press.
London,UK, pp. 126-141
DeLuca, N. A., and Schaffer, P.A. (1985) Activation of immediate-early, early, and late
promoters by temperature-sensitive and wild-type forms of herpes simplex virus
type 1 protein ICP4. Mol. Cell. Biol, 5: 1997-2008
Deluca, H.F. and Cantorna, M.T. (2001) Vitamin D: its role and uses in immunology.
FASEB J., 15:2579-2585
Dorange, F., Tischer, B.K., Vautherot, J.F. and Osterrieder, N. (2002) Characterization of
Marek's disease virus serotype 1 (MDV-1) deletion mutants that lack UL46 to
UL49 genes: MDV-1 UL49, encoding VP22, is indispensable for virus growth. J.
Virol., 76: 1959-1970
Feng, X,P., Kuhnlein, U., Aggrey, S,E„ Gavora, J.S. and Zadworny, D. (1997) Trait
association of genetic markers in the growth hormone and growth hormone
receptor gene in a white Leghorn strain. Poult Sci., 76:1770-1775
Feng, X.P., Kuhnlein, U., Fairfull, R.W., Aggrey, S.E., Yao, Y. and Zadworny, D. (1998)
A genetic marker in the growth hormone receptor gene associated with body
weight in chickens. J. Hered., 89: 355-359
Fragnet, L., Blasco, MA, Klapper, W., Rasschaert, D. (2003) The RNA subunit of
telomerase is encoded by Marek's disease virus. J. Virol., 77: 5985-5996
Fredericksen, T.N., Longenecker, B.M., Pazderka, F., Gilmour, D.G. and Ruth, R.F.
(1997) A T-cell antigen system of chickens: Ly-4 and marek's disease.
Immunogenetics, 5: 535-552
Giansanti, F., Giardi, M.F. and Botti, D. (2006) Avian Cytokines - An overview. Curr.
Parm. Des., 12:3083-3099
Gimeno, I.M. (2004) Future strategies for controlling Marek's disease. Marek's disease:
An Evolving problem. Elsevier Academic press., London, UK, pp. 186-199
Godowski, P.J., Leung, D.W., Meacham, L.R., Galgani, J.P., Hellmis, R., Keret, R.,
Parks, J.S., Laron, Z. and Wood, W.I. (1989) Characterization of the human
growth hormone receptor gene and demonstration of a partial gene deletion in two
patients with Laron-type dwarfism. Proc. Natl. Acad. Sci. USA, 86: 8083-8087
26
Chapter 2
Goldblatt, H. and Soames, K.N. (1923) A study of rats on normal diet and irradiated daily
by the mercury vapor quartz lamp or kept in darkness. Biochem. J., 17: 294-297
Grander, A.A., Jeffers, T.K., Spencer J.L., Robertson, A. and Speckman, G.W. (1972)
Resistance of strains of chickens to Marek's disease. Can. J. Anim. Sci., 52: 1-10
Haider, S.A., Lapen, R.F. and Kenzy, S.G. (1970) Use of feathers in a gel precipitation
test for marek's disease. Poultry Sci., 49: 1654-1657
Harms, R.H., Wilson, H.R. and Miles, R.D. (1988) Influence of 1,25-dihydroxy vitamin
D3 on the performance of commercial laying hens. Poultry Sci., 67: 1233-1235
Harvey, S., Azumaya, Y., Hull, K.L. (2000) Pituitary and extrapituitary growth hormone:
Pit-1 dependence? Can. J. Physiol. Pharmacol., 78: 1013-1028
Harvey, S. and Hull., K.L. (2003) Growth hormone: An update. J. Mol. Neurosci. 20:1-14
Heine, H.G., Foord, A.J., Young, P.L., Hooper, PT. and Lehrbach, P.R. (1997)
Recombinant fowl pox virus vaccines against Australian virulent Marek's disease
virus: gene sequence analysis and comparison of vaccine efficacy in specific
pathogen free and production chickens. Virus Res., 50: 23-33
Heller, E.D. and Schat, K.A. (1987) Enhancement of natural killer cell activity by
Marek's disease vaccines. Avian Pathol., 16:51-60
Hintze, L. (1997) NCSS, Kaysville. Utah
Hirai, K., Ikuta, K. and Kato, S. (1984) Evaluation of DNA homology of Marek's disease
virus, herpesvirus of turkey and Epstein-Barr virus under varied stringent
hybridization conditions. J. Biochem., 95: 1215-1218
Hughes, J.P and Friessen, H.G. (1985) The nature and regulation of the receptors for
pituitary growth hormone. Am. Rev. Physiol., 47: 469-482
Hugher, S., Haynes, A., O' Regan, M. and Bumstead, N. (2001) Identification, maping
and phylogenetic analysis of three novel chicken CC chemokines.
Immunogenetics, 53: 674-683
Hutt, F.B. and Cole, R.K. (1947) Genetic control of lymphomatosis in the Flow. Science,
106: 379-384
International Chicken Genome Sequencing Consortium (2004) Sequence and comparative
analysis of the chicken genome provide unique perspectives on vertebrate
evolution. Nature, 432: 695-716
27

Chapter 2
Isaksson, O.G.P., Eden, S. and Jansson, J.O. (1985) Mode of action of piruitary growth
hormone on target cells. Annu. Rev. Physiol., 47: 482-499
Jeurissen , S.H.M., Janse, E.M., Kok, G.L. and De Boer, G. F. (1989) In situ detection by
monoclonal antibody D-35.1 of cells infected with Marek's disease virus that
interact with splenic ellipsoid-associated reticulum cells. Avian Dis., 33: 657-663
Kaiser, M.H., Underwood, G. and Davison, F. (2003) Differential cytokine responses
following Marek's disease virus infection in chicken genotypes differing in
resistance to Marek's disease. J. Virol., 77: 762-768
Kallay, E., Bises, G., Bajna, E., Bieglmayer, Ch., Gerdenitsch, W., Steffan, I., Kato., Sh.,
Armbrecht, J. and Cross, H.S. (2005) Colon-specific regulation of vitamin D
hydroxylases—a possible approach for tumor prevention. Carcinogenesis, 26:
1581-1589
Kamaldeep, P.C., Sharma, N., Nrang, G., Narang, J. (2007) Occurrence of Morek's
disease in Vaccinated Poultry Flocks of Haryana (India). Int. J. Poultry Sci.,
6:372-377
Karpathy, R.C., Firth, G.A. and Tannock, G.A. (2002) Derivation, safety and efficacy of a
Marek's disease vaccine developed from an Australian isolate of very virulent
Marek's disease virus. Austr. Vet. J., 80: 61-66
Karpathy, R.C., Firth, G.A. and Tannock, G.A. (2003) Field evaluations of safety and
efficacy of an Australian Marek's disease vaccine. Austr. Vet. J., 81: 222-225
Kato, S. (2000) The function of vitamin D receptor in vitamin D action. J. Biochem., 127:
717-722
Kaufman, J.F. and Venugopal, K. (1998) The importance of MHC for Rous sarcoma virus
and Marek's disease virus - some Payne - full considerations. Avian Pathol.,
27:S82-87
Keller, L.H. and Sevoian, M. (1981) Studies of histocompactibility and immune response
of chickens selected for resistance and susceptibility to Marek's disease. Avian
Dis. 27:7-20
Kleeff, J., Kusama, T., Rossi, D.L. (1999) Detection and localization of MIP-
3a/LARC/Exodus, a macrophage proinflammatory chemokine, and its CCR6
receptor in human pancreatic cancer. Int. J. Cancer, 81: 650-657
28

Chapter 2
Kingham, B.F., Zelnik, V., Kopacek, J., Majerciak, V., Ney, E., and Schmidt, C.J. (2001)
The genome of herpesvirus of turkeys: comparative analysis with Marek's disease
viruses. J. Gen. Virol., 82: 1123-1135
Koyu, A., OzgUner, M.F., Caliskan S., Akdogan, M. and Koylu, H.(1999) Changes in
blood levels of prolactin, growth hormone and immunoglobulins during immune
response. East. J. Med., 4: 70-72
Kuhnlein, U., Ni, L., Weigend, S., Gavora, J.S., Fairfull, W. and Zadworny, D. (1997)
DNA polymorphisms in the chicken growth hormone gene: Response to selection
for disease resistance and association with egg production. Anim. Genet., 28: 116-
123
Kuhnlein, U.,Spencer, J.L., Chan, M., Praslickova, D., Linher, K., Kulenkamp., A. and
Ansah, G. (2006) Relationship between Marek's disease and the time course of
viral genome proliferation in feather tips. Avian Dis., 50:173-178
Lee, L.F., Wu, P., Sui, D., Ren, D., Kamil, J., Kung, H.J. and Witter, R.L. (2000) The
complete unique long sequence and the overall genomic organization of the GA
strain of Marek's disease virus. Proc. Natl. Acad. Sci. USA, 97: 6091-6096
Lee, L.E., Witter, R.L., Reddy, S.M., Wu, P., Yanagida, N., and Yoshida, S. (2003)
Protection and synergism by recombinant fowl pox vaccines expressing multiple
genes from Marek's disease virus. Avian Dis., 47: 105-114
LeibundGut-Landmann, S., Waldburger, J.M., Krawczyk, M., Otten, I.A., Suter, T.,
Fontana, A., Acha-Orbea, H., Reith, W. (2004) Specificity and expression of
CUT A, the master regulator of MHC class II genes. Eur. J. Immunol. 34:1513-
1525
Li, S., Aggrey, S.E., Zadworny, D., Fairfull, W. and Kuhnlein, U. (1998a) Evidence for
genetic variation in the mitochondrial genome affecting traits in White Leghorn
chickens. J. Hered., 89: 222-226
Li, S., Zadworny, D., Aggrey, S.E. and Kuhnlein, U. (1998b) Mitochondrial PEPCK: A
highly polymorphic gene with alleles co-selected with Marek's disease resistance
in chickens. Animal Genet., 29: 395-397
Liao, F., Rabin, R.L., Smith, C.S., Sharma, G., Nutman, T.B. and Farber, J.M. (1999) CC-
Chemokine Receptor 6 Is Expressed on Diverse Memory Subsets of T Cells and
29
Chapter 2
Determines Responsiveness to Macrophage Inflammatory Protein 3a. J.
Immunol., 162: 186-194
Linher, K. (2000) Association of markers in genes of the growth hormone axis with the
viral load in lymphoid tissues of chickens with Marek's disease virus. M. Sc.
Thesis, McGill University
Liu, H.C., Kung, H.J., Fulton, J.E., Morgan, R.W. and Cheng, H.H. (2001) Growth
hormone interacts with Marek's disease virus SORF2 protein and is associated
with disease resistance in chicken. Genetics, 98: 9203-9208
Lupiani, B., Lee, L.F. and Reddy, S.M. (2001) Protein coding content of the sequence of
the Marek's disease virus type 1. Curr. Top. Mycrobiol. Immunol., 255: 159-190
MacLea, K.A. and Cheng, H.H. (2007) The treat of Marek's Disease Virus Is Expanding.
Microbe, 2:238-243
Marcinkowska, E. (2001) A run for a membrane vitamin D receptor. Biol. Sign. Rec,
10:341-349
Marek, J. (1907) Multiple nervenentzunendung (polyneuritis) bei Huhnern. Deutsche
Tieraerztliche Wochenschreibung, 15: 417-421
Masilamani, T.J. (2003) Identification of genetic markers associated with Marek's disease
in chickens. M.Sc. Thesis. McGill University
McGrafh, J., Saari, K., Hakko, H., Jokelainen, J., Jones, P., Jarvelin, M.R., Chant, D. and
Isohanni, M. (2004) Vitamin D supplementation during the first year of life and
risk of schizophrenia: a Finnish birth cohort study. Schizoph. Res., 67: 237-245
Morrow, Ch. And Fehler, F. (2004), Marek's disease: a worldwide problem. Marek's
disease: An Evolving problem. Elsevier Acad. Press, London, UK, pp. 49-61
Moutoussamy, S., Kelly P.A. and Finidori, J. (1998) Growth hormone-receptor and
cytokine receptor-family signaling. Eur. J. Biochem., 255: 1-11
Nair, V. and Kung, H.J. (2004) Marek's disease virus oncogenicity: molecular
mechanisms. Marek's disease: An Evolving problem. Elsevier Acad. Press,
London, UK, pp. 32-48
Napolitano, L.A., Lo, J.C., Gotway, M.B., Mulligan, K., Barbour, J.D., Schmidt, D.,
Grant, R.M., Halvorsen, R.A., Schambelan, M. and McCune, J.M. (2002)
30

Chapter 2
Increased thymic mass and circulating naive CD4+ T-cell counts in HIV-1-
infected adults treated with growth hormone. AIDS, 16:683-692
Nazerian, K., Soloman, J.J. Witter, R.L. and Burmester, B.R. (1968) Studies on the
etiology of Marek's disease. II. Finding of a herpesvirus in cell culture. Proc. Soc.
Exp. Biol. Med., 127: 177-82
Nelson, D.L and Cox, M.M. (2000) Lehninger Principles of Biochemistry. Third edition
Worth Publishers, New York, USA, pp. 722-734
Niikura, M., Kim, T., Hunt, H.D., Burnside, J., Morgan, R.W., Dodgson, J.B. and Cheng,
H.H. (2007) Marek's disease virus up-regulates major histocompatibility complex
class II cell surface expression in infected cells. Virol., 359: 212-219
Parcells, M. S., Lin, S.-F., Dienglewicz, R. L., Majerciak, V., Robinson, D. R., Chen, H.-
C, Wu, Z., Dubyak, G. R., Brunovskis, P., Hunt, H. D., Lee, L. F., Kung, H.-J.
(2001), Marek's Disease Virus (MDV) Encodes an Interleukin-8 Homolog (vIL-
8): Characterization of the vIL-8 Protein and a vIL-8 Deletion Mutant MDV. J.
Virol, 75: 5159-5173
Plachy, J., Kaiser, P. and Hala, K. (2003) Genetics of the immune System. Poultry
Genetics, Breeding and Biotechnology, CABI Publishing, Cambridge, USA, pp.
293-309
Richelsen, B. (1997) Action of growth hormone in adipose tissue. Horm. Res., 48: 105-10
Reddy, S.M., Witter, R.L. and Gimeno, I. (2000) Development of a quantitative-
competitive polymerase chain reaction assay for serotype 1 Marek's disease virus.
Avian Dis., 44: 770-775
Ross, N., O'Sullivan, G., Rothwell, C, Smith, G., Burgess, S.C., Rennie, M., Lee, L.F.
and Davison, T.F. (1997) Marek's disease virus EcoRI-Q gene (meq) and a small
RNA antisense to ICP4 are abundantly expressed in CD4+ cells and cells carrying
a novel lymphoid marker, AV37, in Marek's disease lymphomas. J. Gen. Virol.,
78:2191-2198
Sander, J.E. (1993) The major histocompatibility complex and its role in poultry
production. World Poultry Sci. J., 49: 132-138
Schat, K.A., Chen L.H., Calnek B.W. and char D. (1991) Transformation of T-
lymphocyte subsets by Marek's disease herpesvirus. J. Virol., 65: 1408-1413
31

Chapter 2
Schat, K.A. and Markowski-Grimsrud, C.J. (2001) Immune responses to Marek's disease
virus infection. Curr. Top. Microbiol. Immunol., 255: 91-120
Schumacher, D., Tischer, B.K., Reddy, S.M., Osterrieder, N. (2001) Glycoproteins E and
I of Marek's disease virus serotype 1 are essential for virus growth in cultured
cells. J. Virol., 75: 11307-11318
Sick, C, Schneider, K., Staeheli, P. and Weining, K.C. (2000) Novel chicken
cxc and cc chemokines. Cytokine, 12: 181-186
Silva, R.F. (1992) Diterentiation of pathogenic and non-pathogenic serotypes 1 Marek's
disease viruses (MDV's) by the polymerase chain reaction amplification of the
tandem direct repeats with the MDV genome. Avian Dis., 36: 521-528
Secombes, C.J. and Kaiser, P. (2003) The phylogeny of cytokines. In: The Cytokine
Handbook, 4th ed. A. Thomson and M.T. Lotze (eds.) London: Acad. Press, pp.
57-84
Sharma, J.M. (1989) Marek's disease. In H.G. Purchase, L.H. Arp, C.H. Domermuth and
J.E. Pearson (eds.) A laboratory manual for the isolation and identification of
avian pathogens, 3rd ed. American association of pathologists. New Bolton centre,
PA, pp. 89-94
Sharma, J.M. and Ricks, C. (2002) In ovo technology - future directions. Proceedings of
the American association of Avian Pathologists Symposium, Nashville,
Tennessee, AAAP, Kennett Square, Pennsylvania
Shek, W.R., Calnek, K.A., Dchat, K.A. and Chen, L.H. (1983) Characterization of
Marek's disease virus-infected lymphocytes: discrimination between cytolytically
and latently infected cells. J. Natl. Cancer Inst., 70: 485-491
Smith, M.W. and Calnek, B.W. (1974) High virulence marek's disease virus infection in
chickens previously infected with low-virulence virus. J. Natl. Cancer Inst., 52:
1595-1603
Soares, J.H. Jr., Kerr, J.M. and Gray, R.W. (1995) 25-hydroxycholecalciferol in poultry
nutrition. Poultry Sci., 74: 1919-1934
Solomon, J.J., Witter, R.L., Nazerian, K. and Burmester, B.R. (1968) Studies on the
etiology of Marek's disease. I. Propagation of the agent in cell culture. Proc. Soc.
Exp. Biol. Med., 127: 173-177
32
Chapter 2
Spencer, J.L. and Clanek, B.W. (1970) Marek's disease: Application of
immunofluorescence for detection of antigen and antibody. Am. J. Vet. Res., 21:
993-1010
Spencer, J.L., Gavora, J.S., Grander, A.A., Robertson, A. and Speckman, G.W. (1974)
Immunization against marek's disease: Influence of strain of chickens, maternal
antibody, and type of vaccine. Avian Dis., 18: 3-44
Thorley, A.J., Goldstraw, P., Young, A. and Tetley, T.D. (2005) Primary Human
Alveolar Type II Epithelial Cell CCL20 (Macrophage Inflammatory Protein-300-
Induced Dendritic Cell Migration. Am. J. Respir. Cell Mol. Biol., 32: 262-267
Tischer, B.K., Schumacher, D., Beer M., Beyer, J., Teifke, J.P., Osterrieder, K., Wink
K, Zelnik V, Fehler F, Osterrieder N. (2002) A DNA vaccine containing an
infectious Marek's disease virus genome can confer protection against tumorigenic
Marek's disease in chickens. J. Gen. Virol., 83: 2367-76
Vanderpooten, A., Janssens. W., Buyse, J., Leenstra, F., Berghman, L., Decupere, E. and
Kuhn, E.R. (1993) Study of the hepatic growth hormone receptor at different ages
in chickens selected for a god feer conversion and fast weight gain. Dom. Anim.
Endocrinology, 10: 199-206
Wang, T., Nestel, F.P., Bourdeau, V., Nagai, N., Wang, O., Liao, J., Tavera-Mendoza, L.,
Lin, R., Hanrahan, J.H., Mader, S. and White, J.H. (2004) Cutting edge: 1,25-
dihydroxyvitamin D3, is a direct inducer of antimicrobial peptide gene expression.
J. Immunol., 173: 2909-2912
Wang, J., Adelson, D.L., Yilmaz, A., Sze, S-H., Jin, Y. and Zhu, J.J. (2005) Genomic
organization, annotation, and ligand-receptor inferences of chicken chemokines
and chemokine receptor genes based on comparative genomics. BMC Genomics.,
6: 45
Witter, R.L., Sharma, J.M. and Fadley, A.M. (1980) Pathogenicity of variant Marek's
disease isolants in vaccinated and unvaccinated chickens. Avian Dis., 24: 210-232
Witter, R.L. (1983) Characteristic of Marek's disease viruses isolated from vaccinated
commertial chicken floks: Association of viral pathotype with lumphoma
frequency. Avian Dis., 27:113-132
33

Chapter 2
Witter, R.L. (1997) Marek's disease: an evolving poultry pathogen. Current and future
strategies for its control. PSA Ancillary Scientists and AAAP Symposium:
Infectious Poultry Dis., Athens, GA
Witter, R. L. (1998) Control strategies for Marek's disease: a perspective for the future.
Poultry Sci., 77:1197-1203
Witter, R. L. (2001) Protective efficacy of Marek's disease vaccines. Curr. Top.
Microbiol. Immunol., 255: 57-90
Xing, Z. and Schat, K.A. (2000) Inhibitory effects of nitric oxide and gamma interferon
on in vitro and in vivo replication of Marek's disease virus. J. Virol., 74: 3605-
3612
Yamauchi, K., Akbar, F., Horiike, N., Michitaka, K. and Onji, M. (2003) Increased serum
levels of macrophage inflammatory protein-3a in hepatocellular carcinoma:
Relationship with clinical factors and prognostic importance during therapy. Int. J.
Mol. Med., 11:601-605
Zelnik, V. (2004) Diagnosis of Marek's disease. Marek's Disease: An Evolving problem.
Elsevier Acad. Press., London, UK, pp. 156-167
Zekarias, B., Ter Hurne, A.A.H.M, Landman, W.J.M., Rebel, J.M.J., Pol, J.M.A., Gruys,
E. (2002) Immunological basis of differences in disease resistance in the
chicken.Vet. Res., 33: 109-125
Zhongjian, L., Hanson, K. and DeLuca, H.F. (1997) Cloning and origin of the two forms
of chicken vitamin D receptor. Arch. Biochem. Bioph., 339: 99-106
Zhongjian L., Jehan, F., Zierold, C. and DeLuca, F.H. (2000) Isolation and
Characterization of the Chicken Vitamin D receptor gene and its promoter. J. Cell.
Biochem., 77: 92-102
Zhu, G.S., Ojima, T., Hironaka, T., Ihara, T., Mizukoshi, N., Kato, A., Ueda, S. and Hirai,
K. (1992), Differentiation of oncogenic and non-oncogenie strains of Marek's
disease virus type 1 by using polymerase chain reaction DNA amplification.
Avian Dis., 36: 637-645
34

Chapter 3
CONNECTIVE STATEMENT I
Our overall goal is to identify non-MHC genes that segregate for variants that affect
disease resistance to Marek's disease in chickens. As discussed in the previous chapter,
vitamin D metabolism is an important modulator of the immune system as shown in mice
models and epidemiological studies in humans. We chose to analyze the variability of
three genes of the vitamin D metabolism in a non-inbred strain of chickens for which a set
of immune parameters had been measured. It showed that all three genes were highly
variable. Some non-redundant markers were then screened in the entire database for
association with cell surface markers of peripheral blood leukocytes. Since the vitamin D
metabolism can be modulated by dietary means, the identification of associated markers
may not only provide means to improve disease resistance by selection, but also by feed
additives.
35
Chapter 3
CHAPTER 3
Sequence Variations in Genes Encoding Enzymes Involved in
Vitamin D Metabolism and Association with Subclasses of Peripheral
Blood Mononuclear Cells in Chickens
Dana Praslickova ', Martin Lessard2, Donna L. Hutchings 3, David Zadworny1,
Urs Kiihnlein l
department of Animal Science, McGill University, 21-111 Lakeshore Road, Ste. Anne
de Bellevue, QC, Canada, H9X 3V9 2Dairy and Swine Research and Development Centre, Agriculture and Agri-Food Canada,
Lennoxville, QC, Canada, JIM 1Z3 3 Canadian Food Inspection Agency,Veterinary Biologies Section,Ottawa, ON, Canada,
K1A 0Y9
Corresponding author:
Urs Kiihnlein
Tel: (514) 398 7799
Fax:(514)398 7964
e-mail: [email protected]
36
Chapter 3
3.1 Abstract
The sequence variability of three genes involved in VD metabolism was analyzed
in a non-inbred White Leghorn strain. The genes were vitamin D 24-hydroxylase
(Cyp24), vitamin D receptor (VDR) and vitamin D binding protein (DBP). For each gene
two segments of about lkb each were sequenced in 20 individuals and the minimal
number of segregating haplotypes was determined. Intron variability was similar in all
three genes and ranged from 2.0 to 2.6 SNP per 100 bp. However, the number of
segregating haplotypes varied with the VDR being the most variable with a minimum of
15 haplotypes, followed by the Cyp24 and DBP with 7 and 5, respectively.
Blocks of co-segregating SNP in each gene were determined by aligning the
genotypes of the 20 individuals. Two SNP belonging to different blocks were analyzed
for association with the proportion of peripheral blood mononuclear cells (PBMC) that
displayed the surface antigens LYB, MHC class II, CD3, CD4, CD8, TCR1 (Ty5) and
TCR2 (Tap). The proportion of subsets of PBMC characterized by these antigens varied
significantly between genotypes defined by single markers or pairs of markers. The only
exception was the proportion of cells displaying the B-cell marker LYB. The results
indicate that genetic variations in genes that regulate vitamin D metabolism affect the
differentiation of cells of the immune system, in particular the proportion of cells that
express MHC class II and TCR1. Similar to mammals, such genetic variants may
therefore also be associated with disease resistance in poultry.
Keywords: vitamin D, vitamin D 24-hydroxylase, vitamin D binding protein, single
nucleotide polymorphisms, haplotypes, chickens, lymphocyte subclasses, TCR1, class II
MHC
37

Chapter 3
3.2 Introduction
Accessibility to the annotated chicken genome sequence has greatly facilitated the
genetic dissection of phenotypic traits. Primers to amplify DNA segments of known
location can be identified by inspecting the genome sequence; genotypes can be classified
and diagnostic markers analyzed for trait associations. It will lead to an understanding of
the complex dynamics of the genotype-phenotype relationship and enable us to conduct
selection at the DNA level. Such selection can be used as an adjunct to phenotypic
selection and may be particularly important for developing disease resistant strains of
poultry.
In this communication we analyzed variability of three genes associated with
vitamin D (VD) metabolism in chickens. It has been shown in humans and mice that VD
status is associated with the innate and adaptive immune response, in addition to its
classical role in the regulation of Ca2+ and PO4 " homeostasis. In particular, VD reduces
the susceptibility to cancer, to auto-immune disorders and to infection by Mycobacterium
tuberculosis (van Etten and Matthieu, 2005; Liu et ah, 2006; Wee-Chian et ah, 2005;
Agoston et ah, 2006). Genes that regulate vitamin D metabolism are therefore functional
candidate genes for variants that affect the immune response and hence disease resistance.
Clarification of the interrelationship between vitamin D metabolism and immune
response may provide rationales for improving disease resistance by dietary means in
addition to selection for appropriate alleles.
Three genes were analyzed, the vitamin D binding protein (DBP), the 24-
hydroxylase (Cyp24) and the vitamin D receptor (VDR). VDR is a transcription factor
that binds to VDR response elements. When activated by binding to 1,25-hydroxy VD3
(l,25-(OH)2D), it modulates gene transcription (Uitterlinden et ah, 2004). Cyp24 plays a
pivotal role in the control of levels of l,25-(OH)2D by inactivating 25-hydroxy VD3 and
l,25-(OH)2D through hydroxylation at the 24 position (Masuda et ah, 2006). It is itself
under the transcriptional control of a VDR response element. DBP has multiple roles,
some of which are unrelated to VD metabolism (Gomme and Bertolini, 2004; Speeckaert
et ah, 2006). It serves as a transport protein of VD and fatty acids, acts as an extracellular
actin scavenger, and is involved in macrophage chemotaxis.
38

Chapter 3
The chicken strain analyzed had been founded from 4 North American
commercial White Leghorn strains in 1958 and was propagated as a closed breeding
population while maintaining a large effective population size (Gowe et ah, 1959, 1993).
A database consisting of production traits and immune traits had been established in
1995. It provides us with the opportunity to analyze variability within or between genes,
and to correlate such variants with production traits and immune traits.
3.3 MATERIALS AND METHODS
3.3.1 Strains of chickens and data collection
Chickens were from strain 7, a strain that was established by mating 4 commercial
North American White Leghorn strains in 1958 (Gowe et al.,1959; Gowe et ah, 1993). It
was propagated by pedigreed random mating using 100 sire families and mating one sire
to two females in every generation. At the time of data collection, the inbreeding
coefficient was estimated to be 0.026 (Kiihnlein et ah, 1990). The collection of
production traits in this strain has been described previously (Parsanejad et ah, 2002).
3.3.2 Flow cytometry
All birds were immunized between 8-10 month of age with vaccines against
Marek's disease virus (MDV), infectious bronchitis disease (IBD) and avian
encephalomyelitis virus (AEV). Twelve days after the MDV, IBD and AEV injections,
blood samples were taken to evaluate cell mediated immunity and characterize different
populations of leukocytes by flow cytometry. Peripheral blood mononuclear cells
(PBMC) were prepared from heparinized blood samples as described by Lessard et al.
(1993). Briefly, whole blood samples were layered onto Lymphocyte-H (Cederline
Laboratories, Hornby, Ontario, Canada) and centrifuged. The PMBC were harvested and
washed three times in Hank's basal salt solution and adjusted to 5 x 10⁶ cells/ml in PBS,
pH 7.2. Monoclonal antibodies specific for the T-cell surface antigens CD3, CD4 and
CD8 and the T-cell receptors TCR1 (Ty8) and TCR2 (Ta|3) were purchased from
Southern Biotechnologies Associates (Birmingham, AL 35226). Pan-B cell monoclonal
antibody (LYB) directed against Bu-la cell surface antigen was provided by Dr. Ratcliffe
39

Chapter 3
(McGill University, Montreal, Ca) and antibody against MHC class II antigen by H.
Lillehoj (USDA, Agricultural Service, Livestock and Poultry Sciences Institute,
Beltsville, MD 20705). PBMC were stained with 1:100 dilutions of the monoclonal
antibodies and goat anti-mouse IgG-FITC conjugate as previously described (Griebel et
al, 1987; Lillehoj et al, 1988). Data from 10,000 cells were collected on a FACScan
(Becton Dickinson, Missasuaga, Ontario, Canada) and two-parameter analysis of
forward-angle light scatter was used to channel the lymphocyte population to
fluorescence analysis. The percentage of positive cells was determined and corrected for
the percentage of PBMC that stained with mouse monoclonal antibody specific for the
CD5 marker on equine leukocytes (HT23A monoclonal IgGl class; VMRD at Pullman,
WA).
3.3.3 Genetic analysis
DNA was extracted from erythrocytes of 20 unrelated males of strain 7. Blood
samples were lysed, digested with proteinase K, extracted with phenol-chloroform and
ethanol precipitated following standard procedures. Primers for two DNA segments in
each gene were designed using the NIH database and the DMAman for Windows™
(Lynnon Bio Soft, Vaudreuil, Quebec, Canada). Initially we used the cDNA sequences to
search for homology with unassembled genomic clones. At a later date we used the
assembled and annotated chicken genomic sequence (http://www.ncbi.nlm.nih). The
primers used to amplify gene segments are listed in Table 3.1. Amplification conditions
were as described previously (Parsanejad et al, 2004). The reverse and forward
sequences of the amplified products were determined by Genome Quebec (McGill
University and Genome Quebec Innovation Centre, Montreal, Quebec, Ca) using the
amplification primers as sequence primers. SNPs and indels were read by visual
inspection of the sequence traces. In clean runs there were no difficulties in reading
heterozygotes. Two SNPs of each gene were chosen and genotyped by primer extension
in the entire database using either Fluorescence polarization - single base extension (FP-
SBE) genotyping or the GenomeLab™ SNPstream® Genotyping System (formerly
Orchid SNPstream UHT).
40

Chapter 3
3.3.4 Statistics and graphics
For statistical evaluations and graphs we used the NCSS software (Hintze, 2004).
Association analyses were conducted by GLM procedures. Linkage disequilibria between
pairs of marker genotypes were analyzed by exact tests without breaking up the
genotypes at individual loci (Lewis and Zaykin, 2001). The frequency of double-
heterozygotes within a gene was estimated by using Hill's iteration method, a procedure
that assumes Hardy-Weinberg equilibrium (Hill, 1974).
3.4 RESULTS
3.4.1 Determination of blocks of co-segregating SNP
Two randomly chosen sections of each gene were sequenced in 20 chickens
(Table 3.2). On average 2 to 2.6 variants per 100 nucleotides were observed in introns, a
frequency that was similar to that observed previously for ornithine decarboxylase (ODC)
in the same set of individuals (Parsanejad et al, 2004). Although there was no difference
of the overall density of variants in the different genes, there were considerable
differences within intronic regions of the same gene, indicating sequence conservation.
As an example, in the DBP gene, 19 variants were observed in 530 bp of segment 1, but
none in 448 bp of segment 2. Only four mutations were observed in exons, three of which
were synonymous substitutions (Table 3.2).
Blocks of co-segregating markers in the population of interest were determined by
aligning the genotypes and sorting the markers by zygocity. The minimal requirement for
markers to co-segregate is that they have the same zygocity among all individuals and
that the homozygotes are in phase (e.g. if in one individual the genotype at PI is A/A and
at P2 is C/C then it has to be so in all homozygotes). Table 3.3 shows the DBP gene as an
example. In this gene a total of 19 markers were identified. Based on the observed
genotypes, markers co-segregated in a minimum of five blocks. In the Cyp24 gene, 29
markers were observed, forming 7 blocks and in the VDR gene 14 markers forming 11
blocks.
By first defining blocks, redundant genotyping can be avoided. The number of
blocks is also an indicator of the minimal number of haplotypes. Assuming maximal
41
Chapter 3
parsimony, markers in a single block define 2 haplotypes and each additional block adds
a haplotype. Hence k blocks will give rise to a minimum of k+1 haplotypes. Additional
haplotypes are to be expected if markers were scrambled by historical recombination or
gene conversion. Indeed, inspection of the marker genotypes of the three genes analyzed
here indicates that the linkage disequilibrium between markers is not maximal and hence
additional haplotypes must have been formed by past recombination (Table 3.3).
The k+1 haplotypes can combine to form (k+1) • (k+2)/2 different genotypes.
Hence the minimal number of genotypes expected to segregate in strain 7 ranges from 21
for the VDB gene to a staggering 71 for the VDR gene.
Two markers from different blocks were chosen in each gene and genotyped in
the entire population. As expected in a randomly mated population, genotypes defined by
single markers did not deviate significantly from Hardy-Weinberg disequilibrium
(0.21<P<0.89). Linkage disequilibria between markers in the same gene were significant
(P<10~6). However, as already inferred from the sequence analysis of a sub sample, the
linkage disequilibrium although significant, was not maximal; reflecting historical
recombination, gene conversions or reoccurrence of identical mutations. Markers located
in different genes were not at disequilibrium (P>0.28), with the exception of the marker
S1P1 in the Cyp24 gene and the marker S2P2 in the VDR gene (P=0.009).
3.4.2 Association of single genes with cell differentiation antigens on peripheral
blood mononuclear cells
Genotypes defined by single markers or pairs of markers in the same gene were
analyzed for association with the distribution of PBMC classified by cell surface antigens
(Table 3.4). The cell surface antigen measured were the T-cell receptors TCR1 and
TCR2, the T-cell surface markers CD3, CD4 and CD8, the B-cell antigen LYB and the
MHC class II antigen. Since proportions rather than the absolute titers of cells on
different PBMC classes were measured, the values are highly correlated (Table 3.5). As
an example LYB is negatively associated with all markers on T-cells, while all the T-cell
markers are positively associated with CD3, an antigen common to all T-cells.
42
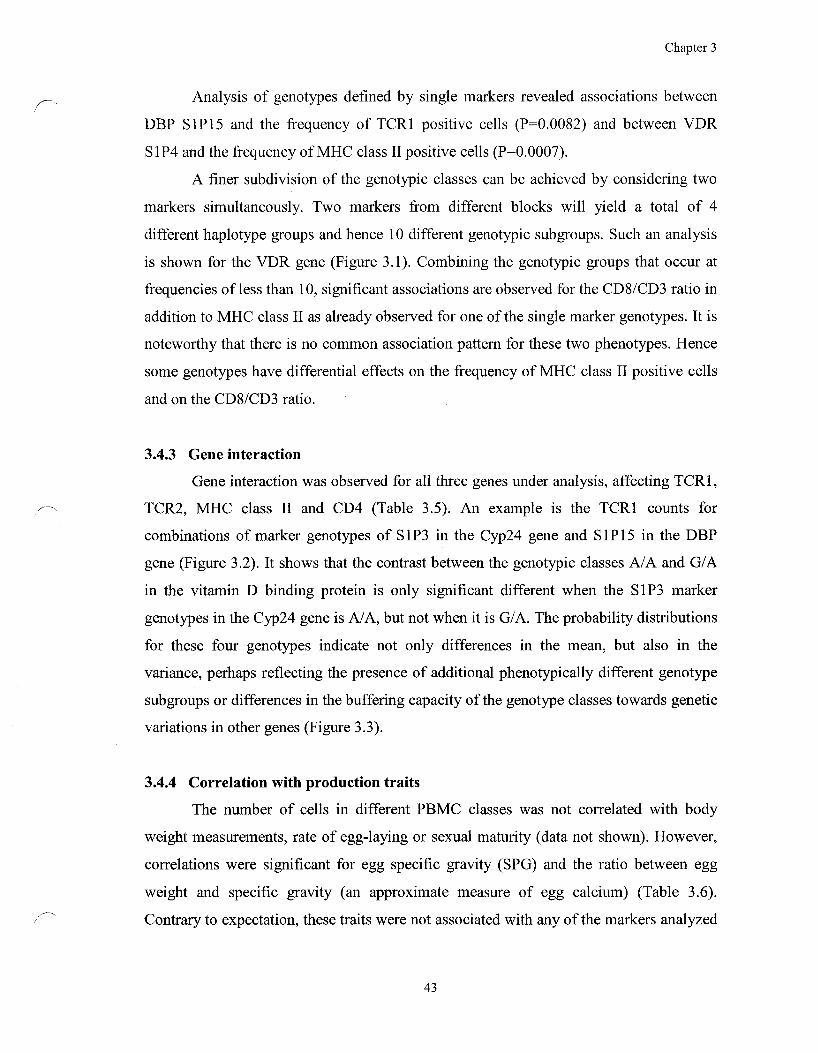
Chapter 3
Analysis of genotypes defined by single markers revealed associations between
DBP S1P15 and the frequency of TCR1 positive cells (P=0.0082) and between VDR
S1P4 and the frequency of MHC class II positive cells (P=0.0007).
A finer subdivision of the genotypic classes can be achieved by considering two
markers simultaneously. Two markers from different blocks will yield a total of 4
different haplotype groups and hence 10 different genotypic subgroups. Such an analysis
is shown for the VDR gene (Figure 3.1). Combining the genotypic groups that occur at
frequencies of less than 10, significant associations are observed for the CD8/CD3 ratio in
addition to MHC class II as already observed for one of the single marker genotypes. It is
noteworthy that there is no common association pattern for these two phenotypes. Hence
some genotypes have differential effects on the frequency of MHC class II positive cells
and on the CD8/CD3 ratio.
3.4.3 Gene interaction
Gene interaction was observed for all three genes under analysis, affecting TCR1,
TCR2, MHC class II and CD4 (Table 3.5). An example is the TCR1 counts for
combinations of marker genotypes of S1P3 in the Cyp24 gene and SIP 15 in the DBP
gene (Figure 3.2). It shows that the contrast between the genotypic classes A/A and G/A
in the vitamin D binding protein is only significant different when the S1P3 marker
genotypes in the Cyp24 gene is A/A, but not when it is G/A. The probability distributions
for these four genotypes indicate not only differences in the mean, but also in the
variance, perhaps reflecting the presence of additional phenotypically different genotype
subgroups or differences in the buffering capacity of the genotype classes towards genetic
variations in other genes (Figure 3.3).
3.4.4 Correlation with production traits
The number of cells in different PBMC classes was not correlated with body
weight measurements, rate of egg-laying or sexual maturity (data not shown). However,
correlations were significant for egg specific gravity (SPG) and the ratio between egg
weight and specific gravity (an approximate measure of egg calcium) (Table 3.6).
Contrary to expectation, these traits were not associated with any of the markers analyzed
43

Chapter 3
here. An exception may be an interactive effect (P=0.05) of the marker genotypes DBP
S1P4 and VDR S1P4 on the ratio EWT/SPG, a marker combination that was not
associated with any of the PBMC counts.
3.5 DISCUSSION
The main purposes for identifying markers associated with quantitative traits in
chickens are (1) to gain information about gene function and (2) to apply selection at the
DNA level. In the former case the main focus is on genes that have strong effects on the
trait of interest. In a randomly mated population, individuals with such genes are outliers
of the trait distribution. When the focus is on marker assisted selection, genes that are
frequent but have relatively minor phenotypic effects are equally important. Selection for
such genes is less likely to destroy the fabric of gene interaction that had been established
by long-term historical selection. Association analysis, that is the association of markers
with traits in a randomly propagated population, is an approach geared towards
identifying such markers.
In a randomly mated population, associations will only be observed for markers
that are closely linked to the putative trait mutation. It is therefore logical to analyze
markers in candidate gene, i.e. genes that are biologically relevant for the trait of interest.
An obvious source are genes that affect similar traits in other species. A search for such
markers may be conducted in elements of a gene that are suspected to affect gene
function, such as exons or elements that regulate gene expression. However, our
understanding of gene regulation is incomplete, and the choice of regions for marker
analysis is far from obvious. Indeed, in our analysis we found genomic regions with no
apparent function that had low variability, indicating evolutionary constraints. We
therefore focused our analysis on intronic sequences that are more variable. Sequence
differences enable us to delineate the major haplotypes (blocks of SNP) that segregated in
the population of interest. Putative quantitative trait mutations are expected to co-
segregate with one of these haplotypes.
For the delineation of genotypes we decided to use direct sequencing of PCR
amplified genomic segments. It has the disadvantage over subcloning that indel-
heterozygotes are difficult to read and that double-heterozygotes are not resolved. Despite
44

Chapter 3
these drawbacks, direct sequencing of PCR products is less labor intensive, it doubles the
sample size and blocks of co-segregating markers can still be discerned.
Despite domestication and intensive selection, chickens have a surprisingly
polymorphic genome whose nucleotide diversity is about 5-10 times greater than that of
the human genome (International Chicken Polymorphism Consortium, 2004; Tishkoff
and Verrelli, 2003). Further, for all three genes analyzed here (and for genes previously
analyzed), we found that the Red Jungle fowl haplotype as defined by the NIH database,
was still present in the sample of 40 White Leghorn genomes. It indicates that in contrast
to humans, chickens have not gone through a genetic bottle neck and that the intensive
selection since domestication of the chickens has not led to a loss in genetic diversity.
Such a conclusion has also been reached on the basis of genome wide comparison of the
SNP spectra in a wide variety of chicken breeds (International Chicken Genome
Sequencing Consortium, 2004). Selection may actually have contributed to the
maintenance of genetic diversity through selective advantage of hybrids or gene
interaction (Kuhnlein et al., 1989).
However, in contrast to the average nucleotide diversity, the number of haplotypes
varied considerably, ranging from 3 for ornithine decarboxylase (ODC) (Parsanejad et al,
2004) to more than 15 for the VDR receptor. It indicates that there was selection pressure
on some of the genes. Maintenance of the nucleotide diversity but reduction in the
number of haplotypes may reflect that some haplotypes may be phenotypically equivalent
despite being genetically distant from each other.
The significance of associations is critically dependent on the sample size.
Because of the extensive genotypic variation, the number of observations within
genotypic classes defined by haplotypes may be small. It is therefore necessary to
consider only one or two markers at a time. A single marker will subdivide the data set
into three groups corresponding to the three marker genotypes, while two markers will
yield 9 groups. By analyzing markers diagnostic for different sets of haplotypes, the
partitioning that yields the largest contrast can be determined and the haplotype that
harbors a putative quantitative trait mutation can be identified. Similar considerations
apply to the analysis of gene interaction, where in most cases only two markers can be
included in the statistical analysis.
45

Chapter 3
Associations were observed for most PBMC surface antigens and/or ratios,
reflecting the general effect of VD on the proportion of cell types of the immune system.
The pattern of associations varied with different genotypes, indicating qualitatively
different responses to different genetic variants. Whether this is a reflection of differences
in the regulation of VD or whether the enzymes studied here may have alternative
functions is unknown. Such alternative functions are known for DBP, a protein that
regulates VD transport, is involved in actin metabolism and serves as a chemokine.
We observed the most significant effects of genetic variants on the proportions of
MHC class II and TCR1 (Ty8) positive cells. The majority of MHC class II positive
leukocytes in peripheral blood are cells of the monocytes/macrophages lineage and B-
cells. VD may affect the former cell type, since there was no significant effect on the
proportion of the LYB antigen presenting cells. Little is known about the biological
function of TCR1 positive cells in chickens. They are predominantly CD4", CD8" and the
y8 receptors which are less diverse than the aP receptors of the TCR2 cells (Chen et al,
1988; Dieterlen-Lievre, 1994). They have regulatory, cytotoxic and possibly also antigen
presenting functions. In the murine species and mammals they have been shown to have
antimicrobial and antitumor properties. In our genetic analysis, the DBP appears to be a
determinant of the proportion of TCR1 positive cells. The molecular mechanism of this
relationship is unknown, but may be related to the chemotactic properties of the protein
rather than to its involvement in VD metabolism.
The complexity of the cross-talk between cells of the immune system renders it
difficult to predict the outcome of genetic selection for different marker genotypes in
terms of disease resistance. As an example, selection for the marker A3 of the VDR gene
(Figure 3.1) would optimize the number of MHC class II positive cells, but will lead to an
overall reduction of the CD8/CD3 ratio in the strain of interest. Hence this genotype may
promote the humoral immune response while reducing the cell mediated immune
response. The effect of such variations on the resistance to pathogens has to await
experimental selection and challenge tests.
46

Chapter 3
3.6 ACKNOWLEDGMENTS
This work was supported by grants from the Natural Sciences and Engineering
Council of Canada, the Poultry Industry Research Council of Canada and Shaver Poultry
Research Farms Ltd.
47

Table 3.1 Primers used to amplify segments of the VDR, DBP and Cyp24 genes.
VDR Segment 1 F: gctgggaggagaaaggagtgtt
R: aacgcacgcacttctcagga
VDR Segment 2 F: gctggggagggaagattgagag
R: agcttctggatcatcttggcgt
DBP Segment 1 F: taagaaaggtcactggacgg
R: cctgcagcaaagtccttcg
DBP Segment 2 F: agaggatgcgcggctgagatgt
R: ctctgttcccatttgctgtcg
Cyp24 Segment 1 F: tccaactccctgctttcttcc
R: gtggtggtttcctcagaagc
Cyp24 Segment 2 F: ggtaagatgtggctgtgggt
R: tgagcagattgtgtggcagg
48

Chapter 3
Table 3.2 Distribution of the polymorphisms.
Gene and Chromosome
location
VDR Chr.Un
DBP Chr.4*
Cyp24 Chr. 20
Start of sequence
SI: 2841
S2 24727
SI: 20712134
S2:20709442
Sl:n.d.d
S2: n.d.
Intron
DNA sequenced
468 bp
241 bp
530 bp
448 bp
617 bp
384 bp
Number of SNP or indel
12
2
19
0
19
7
Exon
DNA sequenced
79bpa
223 bp
250 bp
350 bp
97 bp
245 bp
SNP or indel
1
0
lb
0
0
3 C
Unique Genotypes
13
4
9
Blocks
11
5
7
a Non-coding exon
Synonymous codon change for leucine (TTG<-^CTG) c Two mutations were codon changes for glutamine and isoleucine, respectively. A third
mutation led to a change of histidine to leucine
The genome sequence needs to be clarified. Exons and introns were determined by
hybridization with mRNA sequence (GenBank accession number AF428109). The
assembly of the Red Jungle Fowl genomic sequence for this region needs to be revised.
The cDNA and our two sequences hybridize to contig NW-06081.1 (chromosome
location unknown) and NW-606635.1 (chromosome 20).
* contig NW-0603457.1
49

Chapter 3
Table 3.3 Identification of groups of co-segregating markers in the genes encoding the
DBPa.
Marker
P-2 P-l P5 P7 P8 P9
PlOa Pl l P12 P19
Genotype and number of observations (N)
#1
(N=16)
C C G C C G G G A G
#2
(N=2)
C C G C C G G G A G
#3
(N=l)
C C G C C G G G A G
#4
(N=l)
T/C T/C A/G T/C T/C A/G A/G A/G A/C A/G
RJb
T T A T T A A A C A
Block
PI P2 P3 P4 P10
T A T A T
T/C A/G T/C A/G T/C
T/C A/G T/C A/G T/C
T/C A/G T/C A/G T/C
C G C G C
2 2 2 2 2
P6 P14
T inc
T in
T/G in/del
T in
T in
3 3
P13 A A/G G A/G G 4
P15 T T/C C T T 5
a Two segments of the gene were sequenced in 20 individuals. Only one of the segments
was polymorphic (see Table 1). The different genotypes were identified (columns) and
the markers sorted on the basis of zygocity at the individual markers (rows). The markers
formed 3 groups with 10, 5 and 2 markers whose alleles' co segregated, respectively, and
two groups of single markers that did not co-segregate with any of the other markers.
Pair-wise comparison of markers indicated that with the exception of PI5 all were at
maximal linkage disequilibrium (i.e. one of the four possible combinations was missing).
PI5 was not at maximal disequilibrium with markers in group 2. The genotypes at PI and
50

Chapter 3
PI5, for example, can only be explained if of all four allelic combinations (i.e. T-T, T-C,
C-C and C-T).
Marker genotype of the red jungle fowl according to the NCBI database. Genotype #4
can be explained as a heterozygote between alleles of RJ allele and genotype #1 c Insertion of ATTTC
51

Chapter 3
Table 3.4 Association of single and pairwise combinations of marker genotypes with cell
surface antigens on leukocytes a.
Cyp24 -S1P1
Cyp24 -S1P3
DBP-S1P4
DBP-S1P15
VDR-S1P3
VDR-S5P2
Vitamin D 24-hydroxylase Cyp24-S1P1 TCR1/ TCR2
Cyp24-S1P3 CD8/CD3
n.s.
Vitamin D binding protein DBP-S1P4 n.s.
n.s.
n.s.
DBP-SlP15b
TCR2
TCR1
TCR1/CD3
n.s.
TCR1
TCR1/CD3
TCR1/TCR2
Vitamin D receptor
VDR-S1P3
CD4
TCR1/CD3
TCR1
TCR1/CD3
n.s.
MHC class II
VDR-S5P2 CD4
MHC class II
CD4/CD3 n.s.
n.s.
n.s.
CD8/CD3
n.s.
a The surface antigens analyzed were CD3, CD4, CD8, LyB and MHC class II. The
analysis included the direct FACS counts and the ratios CD4/CD3, CD8/CD3,
TCR1/CD3, TCR2/CD3 and TCR1/TCR2. Analysis was by GLM. Single marker effects
or significant marker interaction within a gene are indicated in italics. Significant
interactive terms that were significant (P<0.05) are indicated in regular script.
The rare genotype A/A was omitted from the analysis
52

Chapter 3
Table 3.5 Spearman rank correlation between FACS counts.
CD3
CD4
CD8
TCR1
TCR2
MHCII
LyB
CD3
—
CD4
0 37***
—
CD8
0.30***
0.18*
—
TCR1
0 41 ***
-0.30***
-0.04
—
TCR2
0 44***
0.75***
0.33***
—0 37***
—
MHCII
-0.16*
0.17*
0.07
-0.11
0.08
—
LYB
-0.43***
-0.36***
-0.13
-0.24**
-0.26**
0 37***
—
*P<0.05; **P<0.01; ***P<0.001
N=182
53

Chapter 3
Table 3.6 Correlation between egg quality traits and leukocyte cell surface antigens.
Surface antigen
CD3
CD4a
CD8
TCR1
TCR2
TCR1/CD3
TCR2/CD3
TCR1/TCR2
MHCII
LYB
Spearman-rank correlation coefficient
and significance (N=145)
EW
-0.09
0.06
0.05
-0.16*
0.09
-0.01
0.17*
-0.17*
0.17*
0.07
SPG
-0.24**
-0.07
-0.04
-0.16*
-0.03
-0.07
0.11
-0.08
0.10
0.22**
Shell
densityb
-0.23**
0.03
0.00
-0.26**
0.09
-0.19*
0.24**
-0.22**
0.22**
0.20*
* PO.05 **P<0.01 a No significant associations were observed for the ratios CD4/CD3 and CD8/CD3 bThe shell density is approximated as (SPG minus 1) • (EW) (Parsanejad et al, 2004).
54
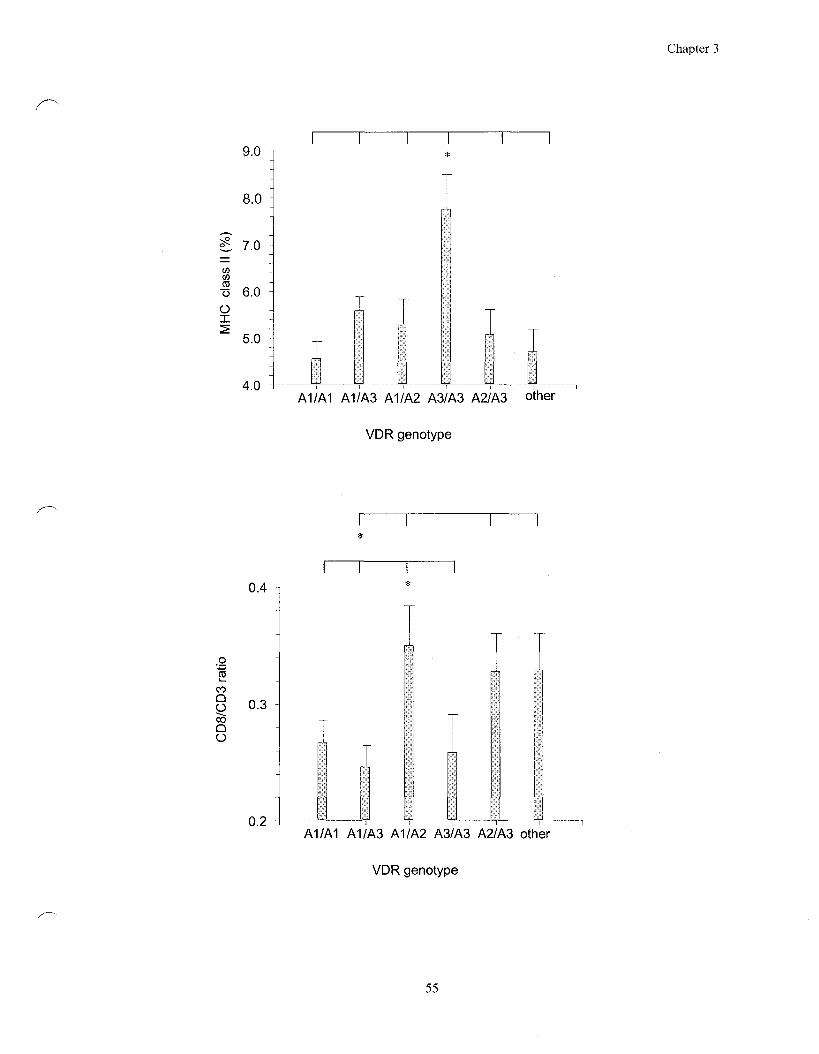
Chapter 3
9.0
8.0
b 7.0
CO
to
% 6.0 O X
5.0
4.0
I
I I _1 T_ A1/A1 A1/A3 A1/A2 A3/A3 A2/A3 other
VDR genotype
0.4
.o •i—<
03 i—
CO
8 0.3 oo O O
0.2
I I
A1/A1 A1/A3 A1/A2 A3/A3 A2/A3 other
VDR genotype
55

Chapter 3
Figure 3.1 Association of VDR genotypes with the MHC class II count and the CD8/CD3
ratio. The two markers S1P4 and S2P2 in the VDR gene defined four different haplotype
groups (Al: A-G; A2: G-G; A3: G-A; A4: A-A). These haplotypes in turn define 10
different genotypes. The haplotype frequencies estimated by the EM algorithm (Hill,
1974) were Al: 0.43; A2: 0.18; A3: 0.34; and A4: 0.05. Two genotypes (A1/A3 and
A2/A4) are not distinguishable. However, the expected frequency of the genotype A2/A4
was only 0.02 as compared to 0.29 for the genotype A1/A3. These two genotypes were
therefore designated as A1/A3. Rare genotypes (<10) are grouped as "other". They
comprise A2/A2, A1/A4 and A3/A4. The genotype A4/A4 was not observed in the data
set of 166 individuals. ANOVA indicate the MHC class II counts (upper panel) and
CD8/CD3 ratio (lower panel) differed significantly at P=0.0007 and 0.015, respectively.
Comparison of groups showed a higher MHC class II counts for genotypes A3/A3
than for any other any other genotypic class. It indicates that A3 is a recessive haplotype
for a high MHC class II titer. For the CD8/CD3 ratio significant contrasts were
A1/A2>A1/A1, A1/A3 or A3/A3 as well as A1/A3 < A1/A2, A2/A3 or "other".
56
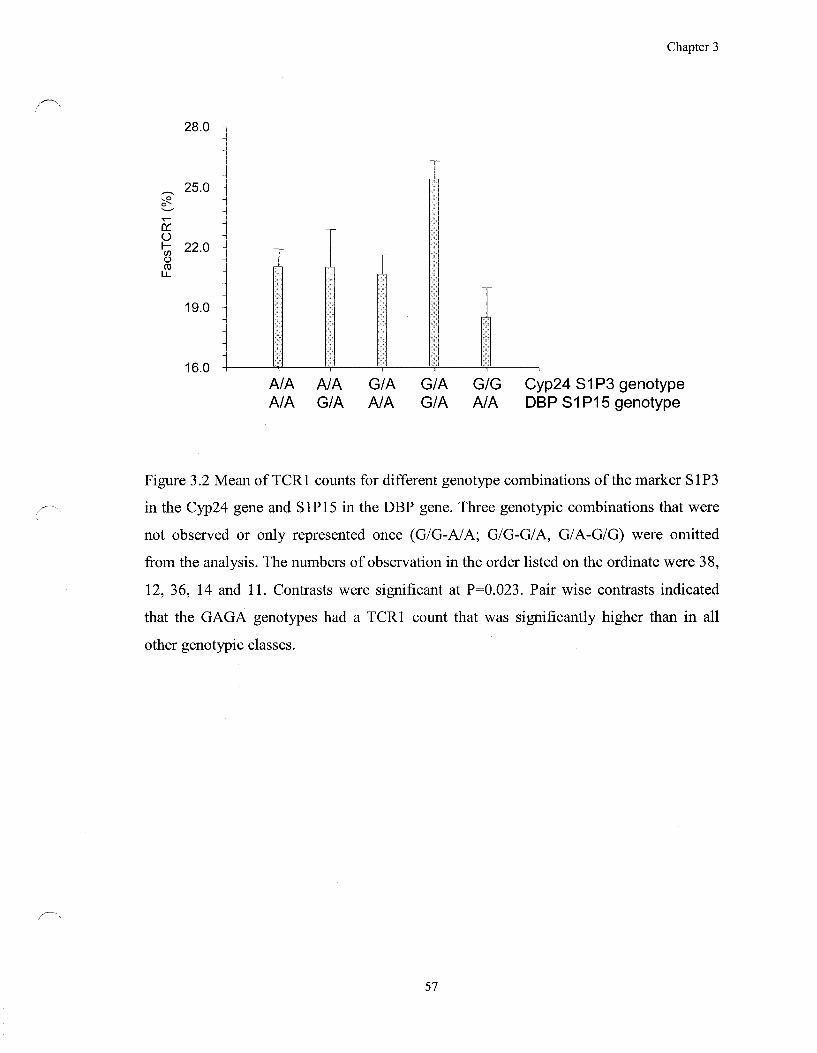
Chapter 3
28.0
_ 25.0 j
O
o CD
19.0
16.0
I
I I
A/A A/A G/A G/A G/G Cyp24 S1P3 genotype A/A G/A A/A G/A A/A DBP S1P15 genotype
Figure 3.2 Mean of TCR1 counts for different genotype combinations of the marker S1P3
in the Cyp24 gene and S1P15 in the DBP gene. Three genotypic combinations that were
not observed or only represented once (G/G-A/A; G/G-G/A, G/A-G/G) were omitted
from the analysis. The numbers of observation in the order listed on the ordinate were 38,
12, 36, 14 and 11. Contrasts were significant at P=0.023. Pair wise contrasts indicated
that the GAGA genotypes had a TCR1 count that was significantly higher than in all
other genotypic classes.
57
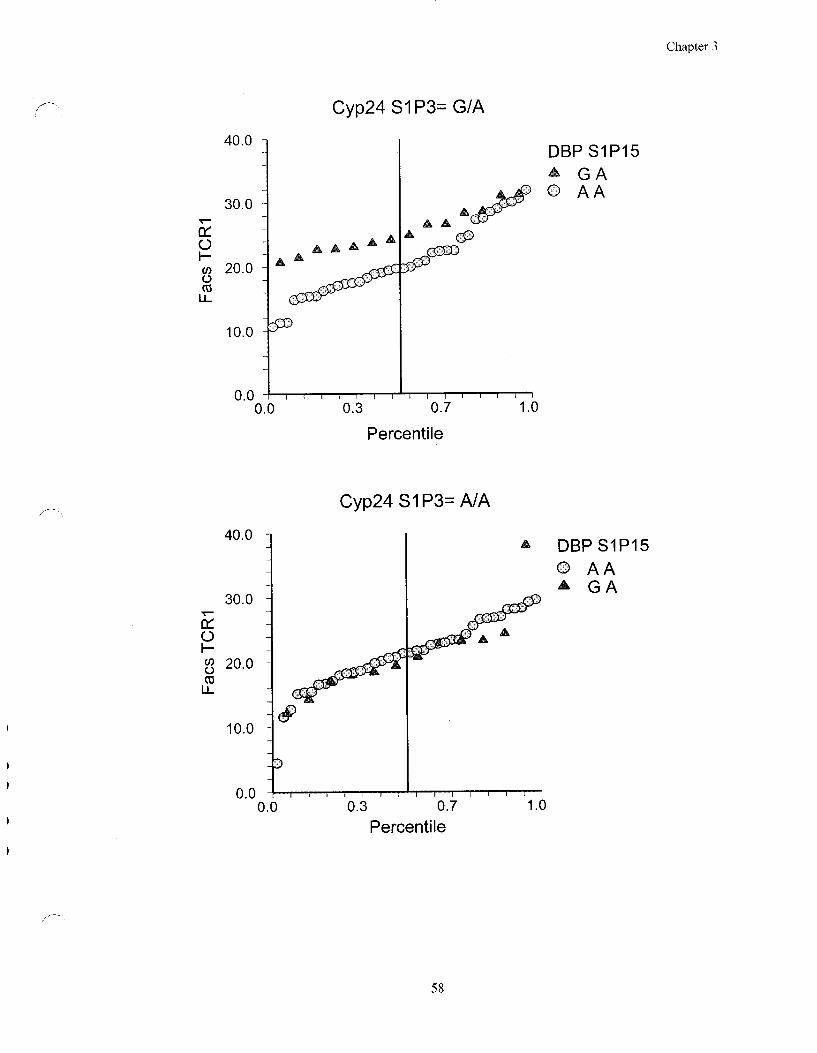
Cyp24S1P3=G/A
40.0
30.0
cE o h-co 20.0 o cc
10.0
4 A ^
±£D
A A
DBPS1P15 A G A O AA
cP 43X0
0 .0 H — i — i — i — i — i — i — r * - i — i — i — i — i — i — i — i 0.0 0.3 0.7 1.0
Percentile
40.0
30.0
a: o w 20.0 CO
LL
10.0
0.0 0.0
Cyp24S1P3=A/A
DBPS1P15 © AA A GA
0.3 0.7 Percentile
58

Chapter 3
Figure 3.3 Interactive effect between the DBP gene and the Cyp24 gene on the TCR1
ratio. Upper panel: Percentile distribution of the DBP SIP 15 genotypes G/A and A/A
when the Cyp24 S1P3 genotype is G/A. The two distributions are different (Kolmogorov-
Smirnoff test for unequal distributions, P=0.009). Differences are more pronounced at the
lower end of the distribution, resulting in an unequal variance (Variance-ratio equal
variance test, P=0.045). Lower panel: Percentile distributions for the DBP S1P15
genotypes G/A and A/A when the Cyp24 S1P3 genotype is A/A. The two distributions do
not differ significantly.
59

Chapter 3
3.7 REFERENCES
Agoston E.S., Hatcher M.A., Kensler T. W. and Posner G. H. (2006) Vitamin D analogs
as anti-carcinogenic agents Anticancer Agents Med. Chem ., 6: 53-71
Dieterlen-Lievre (1994) Hemopoiesis during avian ontogeny. Poultry Sci. Rev., 5: 273-
305
Chen, C.L., Cihak J., Losch U. and Cooper M.D. (1988) Differential expression of two
T-cell receptors, TCR1 and TCR2 on chicken lymphocytes. Eur. J. Immunol., 18:
539-43
Gomme, P. and Bertolini, T. (2004) Therapeutic potential of vitamin D-binding protein.
Trends Biotech., 22: 340-345
Gowe, R.S., Fan-full, R.W, McMillan, I. and Schmidt, G.S. (1993) A strategy for
maintaining high fertility and hatchability in a multi-trait egg-stock selection
program. Poultry Sci., 72:1433-1448
Gowe, R.S., Robertson, A. and Latter, B.D.H. (1959) Environment and poultry breeding
problems . 5. The design of poultry control strains. Poultry Sci., 38:462-471
Griebel, P.J., Qualtiere, L., Davis, W.C., Lawman, M.J., Babiuk, L.A. (1987) Bovine
peripheral blood leukocyte subpopulation dynamics following a primary bovine
herpes virus-1 infection. Viral Immunol., 1: 267-286
Hill, W. G. (1974) Estimation of linkage disequilibrium in randomly mating populations.
Heredity, 33:229-239
Hintze, J. (2004) NCSS and Pass. Number Cruncher Statistical Systems. Kaysville, Utaj.
www.NCSS.com
International Chicken Polymorphism Consortium (2004) A genetic variation map for
chicken with 2.8 million single-nucleotide polymorphisms. Nature, 432: 717-721
Kuhnlein, U., Zadworny D., Dawe Y., Fairfull R.W., and Gavora J.S. (1990). Assessment
of inbreeding by DNA fingerprinting: Development of a calibration curve using
defined strains of chickens. Genetics, 125: 161-165
Kuhnlein, U., Sabour J., Gavora J.S., Fairfull R.W. and Bernon D.E. (1989) Influence of
selection for egg production and MD resistance on the incidence of endogenous
viral genes in White Leghorns. Poultry Sci., 68:1161-1167
60

Chapter 3
Lessard, M., Yang, W.C., Elliot, G. S., Deslaurier, N., Brisson, G.J., Van Vleet, J.F. and
Schultz, R.D. (1993) Suppressive effect of serum from pigs and dogs fed a diet
deficient in vitamin E and selenium on lymphocyte proliferation. Vet. Res., 24:
291-303
Lewis, P. O., and Zaykin, D. (2001) Genetic Data Analysis: Computer program for the
analysis of allelic data. Version 1.0 (dl6c). Free program distributed by the
authors over the internet from http://lewis.eeb.uconn.edu/lewishome/
software.html
Lieu, P. T., Stenger, S., Li, H., and Wenzel, L., Tan, B.H., Krutzik, S., Ochoa, M.T.,
Schauber, J., Wu, K., Meinken, Ch., Kamen, D.L., Wagner, M., Bals, R.,
Steinmeyer, A., ZUgel, U., Gallo, R.L., Eisenberg, D., Hewison, M., Hollis,
B.W., Adams, J.S., Bloom, B.R. and Modlin, R.L. (2006) Toll-like receptor
triggering of a vitamin D-mediated human antimicrobial response. Science, 311:
1770-1773
Lillehoj, H.S., Lillehoj, E.P., Weinstock, D. and Schat, K.A. (1988) Functional and
biochemical characterization of avian T-lymphocyte antigens identified by
monoclonal antibodies. Eur. J. Immunol., 18: 2059-2065
Masuda, S., Byford, V., Arabian, A., Sakai, Y., Demay, M.B., St.-Arnaud R. and
Glenville, J. (2004) Altered pharmacokinetics of la,25-dihydroxyvitamin D3 an
25-hydroxyvitaminD-24-hydroxylase (Cyp24al) Endocrinology, 146: 825-834
Parsanejad, R., Praslickova, D., Zadworny, D. and Kiihnlein, U. (2004) Ornithine
decarboxylase: haplotype structure and trait associations in White Leghorn
chickens. Poultry Sci., 83:1518-23
Parsanejad, R., Torkamanzehi, A., Zadworny, D. and Kuhnlein, U. (2003) Alleles of
cytosolic phosphoenolpyruvate carboxykinase (PEPCK): trait association and
interaction with mitochondrial PEPCK in a strain of White Leghorn chickens.
Poultry Sci., 82:1708-15
Parsanejad, R., Zadworny, D., and Kunhlein, U. (2002) Genetic variability of the
cytosolic phosphoenolpyruvate carboxykinase gene in White Leghorn chickens.
Poult Sci., 81:1668-70
61

Chapter 3
Uitterlinden, A. G., Fang, Y., Van Meurs, J.B., Pols, H.A., Van Leeuven, J.P. (2004)
Genetics and biology of vitamin D receptor polymorphisms. Gene, 338: 143-156
Ren, S., Nguyen, L., Wu, S., Encinas, C., Adams, J.S., and Hewison, M. (2005)
Alternative splicing if vitamin D-24-hydroxylase. J. Biol. Chem., 280: 20604-
20611
Speeckaert, M., Huang, G., Delanghe, J. R. and Taes, Y. E. (2006) Biological and clinical
aspects of the vitamin D binding protein (Gc-globulin) and its polymorphism.
Clin. Chim, Acta, 372: 33-42
Tishkoff, S., and Verelli, B.C. (2003) Patterns of human genetic diversity: Implications
for human evolutionary diversity. Annu. Rev. Hum. Genet., 4: 293-340
Van Etten , E. and Mathieu, C. (2005) Immunoregulation by 1,25-dihydroxyvitamin D3:
basic concepts. J. Steroid Biochem. Mol. Biol.., 97: 93-101
Wee-Chian, L., Hanauer, S. B. and Li, Y. C. (2005) Mechanisms of disease: vitamin D
and inflammatory bowel mdisease. Nature Clin. Pract. Gastroenterol and Hepatol.,
2:308-315
62

Chapter 4
CONNECTIVE STATEMENT II
Based on previous research that indicated an association of variants in the GH gene, the
GHR gene and the chemokine MIP-3a with Marek's disease resistance, we wanted to
conduct DNA based selection in commercial White Leghorn chickens. In contrast to
previous studies, we used vaccinated chickens to make our study more relevant to the
commercial situation. This study also provided us with a database to analyze the
association of markers in other genes with disease resistance.
63

Chapter 4
CHAPTER 4
Effect of Marker Assisted Selection on Indicators of Marek's Disease in
a Vaccinated Commercial White Leghorn Strain
Dana Praslickova1, Shayan Sharif2, Aimie J. Sarson2, Mohamed Faizal Abdul-Careem2,
David Zadworny , Al Kulenkamp , George Ansah and Urs Kuhnlein
'Dept. of Animal Science, McGill University, 21111 Lakeshore Rd., Ste. Anne de
Bellevue, Qc, Canada, H9X3V9 2 Department of Pathobiology, Ontario Veterinary College, University of Guelph, Guelph,
On, Canada, NIG 2W1 3Shaver Poultry Breeding Farms Ltd., 500 Franklin Boulevard, Cambridge, On, Canada,
N1R 8G6
Corresponding author:
Urs Kuhnlein
Tel.: (514) 398 7799
Fax:(514)398 7964
e-mail: [email protected]
64

Chapter 4
4.1 ABSTRACT
A commercial strain of chickens was selected for markers located in the GH gene,
the GH receptor gene and the gene for the chemokine MIP-3a . Female offspring of the
selected and a control population were vaccinated with HVT at hatch and challenged by
intraperitoneal injection of 250 PFU of the RB-1B strain of the MD virus at 5 days of
age. Two challenge tests were conducted in hatches collected three month apart and the
course of MD monitored for 8 weeks. The MD indicators measured were the viral titers in
feather-tips, mortality, presence and organ distribution of MD lesions, body weight,
spleen weight and bursa weight. Analysis by ANOVA or non-parametric statistics
showed significant interaction between population and trial. Specifically, in trial 1 the
viral titer in the selected population was 2 fold lower than in the control, while in trial 2
the situation was reversed. Similar observations were made for other MD associated
parameters. Further, the organ distribution indicated a different course of the disease in
the two trials. The results indicate that the effect of genes on MD may depend on
environmental factors.
Keywords: Marek's disease, disease resistance, marker associated selection, survival,
distribution of MD lesion, bursa weight
65

Chapter 4
4.2 INTRODUCTION
Marek's disease (MD) is a highly contagious, re-emerging and economically
important disease in the poultry industry. Marek's disease is caused by an avian
herpesvirus. It is characterized by paralysis, as a result of lymphoid infiltration into
peripheral nerves or inflammation of the brain, lymphomas in various organs including
the skin, immunosuppression, and blindness accompanied by non-specific signs such as
weight loss (Zelnik, 2004). The economic impact of MD on the world poultry industry is
thought to be in range of US$1-2 billion annually (Morrow and Fehler, 2004).
Control of MD is based on effective vaccination, proper biosecurity and selection
for genetic resistance. But MD herpesvirus (MDV) can evolve towards greater virulence
and the occurrence of MD in vaccinated flocks indicates that MDV can bypass current
methods of disease control (Gimeno, 2004).
Genetic resistance to MD has been known for more than 60 years (Calnek, 1985).
Resistance has been usually assessed based on the mortality or the development of
lesions. Asmundson and Biely (1932) first demonstrated significant differences among
families. Cole (1968) extended this knowledge by comparing susceptibility and/or
resistance of different commercial families challenged by MDV. Later viral titration by
plaque assays or the polymerase chain reactions in various organs has been added as an
indicator for the presence of the disease (Baigent et al, 2005).
The first genes that were shown to affect MD resistance were genes involved in
the immune response. Hansen et al. (1967) found an association of resistance with blood
group B haplotypes (Keller and Sevoian, 1983; Calnek and Witter, 1997). The blood
group B locus is closely linked to the major histocompatibility locus (MHC) that
regulates the processing and presentation of antigens (Drof, 1981; Briles, et al, 1983;
Kaufman and Venugopal, 1998). Haplotypes B13, B15, and B19 were associated with
susceptibility, whereas the B21 haplotype was associated with resistance to MD (Bacon et
al, 2001). Selection for B haplotypes has been used in the poultry industry and several
mechanisms have been proposed to explain the association between B-complex variation
and resistance to MD (Kaufman and Salomonsen, 1997). However, since MHC genes are
specific for peptides, it is feared that such selection may reduce the repertoire of antigen
recognition and render chickens more susceptible to other infectious diseases.
66

Chapter 4
In addition to MHC, other genes may have a strong influence on disease resistance
as exemplified by the two inbred lines 63 and I2 that differ in MD resistance, but are
homozygous for the same B haplotype. Analysis of F2 crosses between these two lines
revealed the presence of 14 chromosomal regions that were associated with MD
resistance (Vallejo et al; 1998; Yonash et al, 1999). Taking into account that the genetic
effects were measured against the relatively narrow genetic background determined by
these two inbred lines, it is likely that that the number of genes that affect MD resistance
in non-inbred strains is quite large. More recently, the strategy for gene mapping has
shifted towards the more pragmatic association analysis of variations in candidate genes
with traits of interest. Such candidate genes can be chosen on the basis of position,
biological properties, co-selection with disease resistance, and differential expression in
strains with contrasting susceptibility, or association with disease resistance in other
species.
Even when the causative mutations or genes have not been identified, selection for
linked markers may improve resistance. Here we report the outcome of a marker selection
experiment in a commercial line of chickens, following a commercial breeding strategy.
The challenge was carried out in vaccinated chickens to mimic the normal commercial
situation, and MD susceptibility was assessed from mortality, necropsy observations and
the measurement of the viral titers in feather-pulp. The selected markers were located in
the genes encoding growth hormone (GH), growth hormone receptor (GHR) and
chemokine macrophage inflammatory protein-3a (MIP-3a). The GH gene had been
implicated in MD resistance, and immune responsiveness in several laboratories
(Kuhnlein et al, 1997; Linher et al, 2000; Liu et al, 2001). Similar to alleles of the GH
gene, alleles of the GHR gene are co-selected with selection for MD resistance and are
associated with differences in the immune responsiveness (Feng et al, 1998; Kuhnlein et
al, 2003). CCL20 is a chemokine that attracts activated T-cells and B-cells and has been
implicated in the control of Salmonella dissemination in mice (Williams, 2006; Kaiser et
al, 2005; Fahy et al, 2004). A preliminary MD challenge experiment in a closely related
commercial population indicated that the three alleles that were chosen for selection were
associated with a reduced titer of MD virus in the spleen and/or thymus (Masilamani,
2003).
67
Chapter 4
4.3 MATERIALS AND METHODS
4.3.1 Strains of chickens and selection strategy
All strains used were White Leghorn strains of Shaver Poultry Breeding Farms
Ltd. What is referred to as the commercial line is the offspring of three pure lines using
the mating strategy outlined in Figure 4.1. Two grandparent lines were used to produce
the dams which where mated with sires from a third pure line to yield the commercial
dams.
Selection for the desired markers was carried out in two generations on the dam
side (line 2 and 3 and 23) and over one generation in the sire line 1 (Figure 4.1). In the
final cross, 10 sires were crossed with 10 females each to produce the offspring used in
the challenge experiment. In each cross, selection was based on the genotypes of 250
individuals of each parental line. The standard commercial line was used as a control
population. To produce this population, twelve pools of semen of four males were
prepared and 17 females were inseminated with each pool. The offspring of the
commercial line were reared without tracking parentage.
The challenge tests (trials) were conducted in populations hatched three months
apart. In the selected population (S) the same sires and dams were used. Hence the
offspring were full-sibs. In the control population the same females were used in the two
hatches, but the semen pools were prepared from different sires of the same generation as
in the first challenge test. Hence, the offspring were half-sibs.
4.3.2 Marker selection
The restriction fragment polymorphisms (RFLP) alleles selected for were GH
Sacl+ , GHR HindHl+ , and MIP-3a Hin6l- (Kuhnlein et al., 1998; Feng et al., 1998;
Masilamani, 2003). While RFLP measurements were used during selection, the final
progeny was genotyped by primer extension (Genome Quebec, FP-SBE platform,
Molecular Devices, Sunnyvale, CA; or SNP Stream® Genotyping System, Beckman TM
Coulter ). The genotypic frequencies in the selected and control population are shown in
Table 4.1.
68

Chapter 4
4.3.3 Challenge
Chickens were hatched at Shaver Breeding Farms Ltd. (Cambridge, ON),
vaccinated with the herpes virus of turkeys (HVT) using the dose recommended by the
supplier (Merial Canada Inc., Baie d'Urfe, QC), and immediately shipped to the
University of Guelph. At 5 days of age, the chickens were challenged by intraperitoneal
injection with 250 PFU of the MD virus strain RB1B. MDV strain RB1B (passage 9) was
provided by Dr. K.A. Schat (Cornell University, NY, USA) (Schat et al, 1982).
In each of the two trials 100 selected and 100 non-selected female chickens were
randomly assigned to 3 isolation units. The chickens were observed daily and those who
showed signs of disease such as wing droopiness, huddling or limping due to paralysis
were euthanized. The experiments were terminated at 8 weeks post-infection. All
chickens, including those that that died or had to be euthanized during the experiment
were subjected to necropsy.
4.3.4 Apramycin treatment
In the first trial seventeen chickens, nine of the selected and eight of the non-
selected group, died before or within 48 hours of challenge. Necropsy indicated
septicemia and tissue swaps revealed the presence of Escherichia coli. The isolated strain
was sensitive to apramycin and the chickens were subsequently treated with this
antibiotic. After the beginning of the treatment two more chickens, one from each group,
died from septicemia during the first week post infection. In the second trial, similar
symptoms (acytes, airsaculitis) were observed in two chickens from each group that died
between 21 and 25 dpi. The chickens were subsequently also treated with apramycin
although no Escherichia coli infection was observed.
4.3.5 Viral titers in feather tip extracts
Feathers were plucked at weekly intervals post-infection and stored frozen at -
80°C. For DNA extraction, the tips at the bottom of the feather were cut into small pieces
with sterile scissors and placed in 1.5 ml tubes with 400 ul of extraction buffer containing
2% 2-mercaptoethanol, 10 mM Tris-HCL at pH 8.0, 100 mM NaCl, 10 mM EDTA at pH
8.0 and 0.5% SDS. After an incubation for 30 minutes at 50°C, proteinase K (Gibco BRL)
69
Chapter 4
was added to a final concentration of 200 ug/ml and the incubation at 50°C continued
overnight. DNA was extracted with phenol:chloroform:isoamyl alcohol (25:24:1)
(BioShop® Canada Inc.) and precipitated with an equal volume of ice-cold 100% ethanol.
The pellets were rinsed with 500 ul 70% ethanol, air-dried and dissolved in 300 ul of
deionized water. The DNA concentrations were measured using the NanoDrop ND-1000
Spectrophotometer (Nanodrop® Technologies). The DNA concentration was adjusted to
lOOng/ul and the samples were stored at -20 C. Viral titers were determined by
competitive PCR as described previously (Kuhnlein et al., 2006). We adhered to this
method since it was reliable and less costly than the real-time PCR methodologies that
have been developed in the mean time (Baigent et al, 2005).
4.3.6 Statistical analysis
Survivorship plots, hazardplots and associated statistics were generated using the
Kaplan-Meier limit estimate. Viral titers were exponentially distributed and were either
analyzed by non-parametric statistics, or parametrically after log transformation. All
analyses and graphics were carried out using the NCSS 2004 software (Hintze, 2004).
Analysis by GLM using the trial as a random variable indicated that the effect of selection
on parameters of Marek's disease was not significant. However, subsequent analysis
revealed that the progression of the disease differed in the two trials. The trial was
subsequently treated as fixed effect and the analysis focused on a comparison of the
relationship between indicators the four groups defined by selection and trial. There was
no significant effect of housing on the viral titers or the tumor frequency. Sire information
was only available for the selected population. Using the trial as a fixed variable and the
sires nested within the trial indicates again that SI is significantly smaller than S2.
4.4 RESULTS
4.4.1 Efficacy of vaccination
A pretrial was conducted to verify that our viral stock and challenge conditions
were adequate. In particular, since we had chosen the time course of viral proliferation in
feather pulp as an endpoint we wanted to avoid excess mortality. The pretrial also enabled
70

Chapter 4
us to test the protective effect of vaccination on mortality and viral proliferation in feather
pulp.
Forty chickens were divided into four groups, group A (vaccination/challenge),
group B (no vaccination/challenge), group C (vaccination/ no challenge) and group D (no
vaccination/ no challenge). As expected no mortality was observed in groups C and D. In
group B, signs of Marek's disease were observed starting from 25 dpi and at 41 dpi all
chickens had either died or had to be euthanized (Figure 4.2). Necropsy revealed
multifocal tumors in various organs in all 10 chickens. In group A, one chicken died at 2
dpi without displaying any MD lesions. Two additional chickens died in the 5l and 6*
week, respectively. Necropsy revealed multifocal tumors in both of these and in one
additional chicken among the survivors at 56 dpi. Hence, vaccination was very effective
in reducing MD mortality.
Viral titers was measured in extracts from feather tips taken on a weekly basis.
The vaccinated group revealed a bell shaped curve with a peak at 3 weeks post-infection
and a declining phase between week 3 and 4. In the non-vaccinated chickens the high
mortality precluded reliable assessment of the viral titers at 3 and 4 dpi. We therefore
integrated the viral titers over the first three weeks as a measure of early viral
proliferation (Figure 4.3). Vaccination reduced the early viral load by a factor of two. The
viral titer in the vaccinated control group C was 50 times lower than in group B and
presumably represented background amplification of the HVT used for vaccination. No
positive samples were detected in the unvaccinated control group.
4.4.2 Effect of selection and trial on viral titers
The time dependence curve of the viral titers was bell shaped in both trials and
populations, with the maximal titer observed at 21dpi (Figure 4.4). However, the relative
response of the two populations in the two trials was reversed. In trial 1 the selected
population (S) had a consistently lower titer than the control population (U), while in trial
2 the situation was reversed.
For statistical evaluation we summed the viral titer up to 21 dpi, the starting
point of mortality (see below). Similar to the titers at individual time-points, the
distribution of this measure of the viral load was exponentially distributed and could be
71

Chapter 4
normalized by log transformation. Analysis by GLM revealed that the control population
(U) had similar viral loads in both trials, while the viral load in the selected population
(S) differed by a factor of 3.8 between the trials. The same response was observed for the
total viral load of the survivors at five weeks post infection (Figure 4.5; Table 4.2).
4.4.3 Survival analysis
In contrast to the viral titers, the survival curves in the two trials differed for the
control population, but were similar for the selected population. (Figure 4.6). Cumulative
mortalities for population U at the end of the trials were 40% and 22%, respectively,
while the cumulative mortalities for the population S were 22% and 23%, respectively
(chi-sq=9.46, df=3, P=0.023). The death rate curves had distinct shapes that appeared to
be characteristic of the population and were similar in both trials. In the population U the
death rate increased until 30 dpi, was followed by a decrease, and then again an increase
towards the end of the experiment. In contrast, the death rate for the selected population
(S) increased steadily with the time post-infection in both trials.
4.4.4 Necropsy analysis
Necropsy revealed that 82% of the chickens that died or were euthanized had
tumors ranging from the size of pinpoints to several cm in diameter. Among the survivors
the percentage of chickens that had tumor-like lesions ranged from 18% to 31%. The
frequency of chickens with tumor-like lesions did not differ significantly among the two
populations and the two trials (chi-square test). The same was true when discoloration or
enlargement of organs were included in the analysis.
The most frequent lesions (36%) were observed in the spleen, ranging from an
enlargement and discoloration to pinpoint lesions and tumors. The frequency of lesions in
other organs were 28% in the kidney, 26% in the ovary, 25% in the liver, 18% in the
proventriculus, 13% in the muscle and 6.4% in the heart.
Although the frequency of chickens with lesions was similar in the two trials; the
distribution of lesions among organs differed significantly (Table 4.3). Specifically, in
trial 1 there were significantly more lesions found in the muscle, the proventriculus and
the heart. No differences were found when the two populations were compared.
72

Chapter 4
4.4.5 Effect on body weight, spleen weight and bursal weight
Among the survivors, there was a significant effect of the presence of lesions on
the body weight, the bursal weight and the spleen weight. Chickens that displayed lesion
had a reduced body weight and bursal weight. In contrast, the spleen weight was higher in
chickens with lesions, presumably reflecting infiltration of the spleen by transformed cells
or B-cell proliferation (Table 4.4). Analysis of the influence of population and trial on
these three parameters revealed a significant effect of the trial on the bursal weigh
(P<10~6), a marginally significant interactive effect on body weight (P=0.05) and no effect
on the spleen weight.
The three variables are confounded, but a rather specific role has been assigned to
the atrophy of the bursa as an indicator of viral replication. Since the bursa is also
expected to be influenced by the body weight, we reanalyzed the influence of the
population and trial on the bursal weight with the body weight as a covariant. It indicated
significant effects of the trial and the interaction between trial and population (Figure
4.7). A comparison of the mean of the bursal weights and the viral titers in the four
different groups indicates that the two measures are equivalent (Figure 4.8).
4.5 DISCUSSION
Quantitatively, MD resistance may be defined as the probability of a chicken to
survive when exposed to MD virus. It is dependent on environmental and genetic factors
and their interactions. The genetics of survival to MD is therefore expected to be complex
and involve many different genes. In addition, the shape of survival curve (i.e. the hazard
rate) is difficult to assess and relate to genetic and environmental variations. It is therefore
customary to analyze other manifestation of MD, such as survival to a fixed amount of
time, the frequency of MD lesions, viral proliferation, or changes in the body weight or
organs. Viral proliferation in the epithelium of feather-tips where infectious virus is
formed is arguably the most important. Lack of formation of infectious virus would entail
that an infected chicken is unable to transmit the virus, such curtailing the spread of the
virus within a flock.
73
Chapter 4
Of these parameters, survival, MD lesions and viral proliferation were correlated,
with the highest correlation being observed between the survival and the presence of MD
(lesions data not shown). It reflects that all chickens that died before the end of the
experiment had MD lesions, suggesting that MD lesions were the ultimate cause of death.
Whether some of the surviving chickens that had MD lesions would have recovered from
MD is unknown.
The chickens in this challenge experiment were still in the growing phase. Hence
analysis of the relationship between MD and body weight, spleen weight and bursa
weight required age matched chickens. Since body weight was only measured at the end
of the experiment, the analysis was restricted to the survivors. Among these, chickens
with MD lesions had a higher viral load, a higher spleen weight and a reduced body
weight and bursal weight. It indicated that weight measurement were also indicators of
MD. In the case of body weight, it would have been worthwhile to extend the
measurement of body weight gain over the entire period of the experiment.
The distribution of lesions in the two trials differed indicating a different course of
the disease. Differences were also evident from measurements of most other parameters
of MD. In particular, there were significant differences in the viral titer in feather tips, the
survival, and the body and organ weights. The reason for the lack of reproducibility is
unknown. The observation of inflammatory lesions early in trial 1 and at about 3 weeks
post infection in trial 2 and subsequent treatment with apramycin is a possible factor.
Other possibilities are differences in the exposure to stress during shipment of the
chickens prior to exposure or parental age differences. No untoward symptoms were
observed in the parents or in littermates that were maintained at the breeding facility.
It is disquieting that in the two trials the relative order of incidence of MD in the
two populations was reversed. Regardless of the MD associated parameter that was
measured, the selected population S was more resistant than population U, while in trial 2
the control population U was more resistant. Markers that had been identified in a single
challenge test as being associated with disease resistant may under certain environmental
situations confer susceptibility.
In its early stage of infection, MDV replicates cytolytically in B and T-cells, cells
that also determine the efficacy of HVT vaccination. Some genes may affect both, the
74
Chapter 4
immune response and viral replication and lead to an unstable response to MDV
infection.
75

Chapter 4
Table 4.1 Influence of selection on the genotype distribution
Marker
MIP-3a Hindi
GH
Sacl
GHR Hindm b
Selected
Control
Selected
Control
Selection
Control
Frequency of genotypes +/+ 0
0.319
1
0.658
0.822
0.582
+/-0.368
0.529
0
0.312
—
-
- / -
0.6323
0.152
0
0
0.178
0.418
3 Genotypes selected for are indicated in bold
The GHR gene in female chickens is haploid.
Table 4.2 Comparison of the cumulative viral titer at 3 and 5 weeks post-infectiona.
Cumulative
viral load
toa
3 weeks
5 weeks
Trial 1
Selected
(SI)
3.43b
5.13
Control
(Ul)
6.97
9.63
Trial 2
Selected
(S2)
13.24
18.33
Control
(U2)
7.98
9.38
Significant contrasts0
SK(U1,U2)<S2
SK(U1,U2)<S2
a For analysis the weekly viral titers (virus/cell) were summed to 3 and 5 weeks,
respectively. The data was normalized by log transformation values and analyzed by
GLM using population (P) and trial (T) as independent variables. The variables T and the
interaction PxT were significant (P<10~5). b Back-transformed means of the log-transformed values.
°Contrast were analyzed for significance using the Tukey-Kramer multiple comparison
test.
76

Chapter 4
Table 4.3 Frequency of lesions among chickens for various tissues in trial 1 and 2a.
Tissue
Spleen
Liver
Muscle
Proventriculus
Ovary
Kidney
Heart
Other
All tissues
Lesion Frequencyb
Trial 1
27%
27%
19%
26%
29%
30%
12%
9%
45%
Trial 2
33%
23%
9%
12%
24%
27%
2%
13%
46%
Chi-
Square
1.89
0.69
8.33
13.55
1.29
0.44
16.17
0.89
0.01
P-valuec
n.s.
n.s.
4x10"3
2x10"4
n.s.
n.s.
6x10"5
n.s.
n.s.
a The selected and non-selected population did not differ.
Percentage of chickens with one or more lesions. c The cut-off of significance after Bonferroni adjustment is 6x10
Table 4.4 Effect of lesions on viral load, body, spleen and bursa weight in surviving
chickens
Viral load to 5 weeks
Body weight (g)
Bursal weight (g)
Spleen weight (g)
Lesions
Present (N=63)
17.0±1.1
619 ±7
2.02 ±0.14
3.48 ±0.12
Absent (N=226)
6.1 ±1.2
709 ± 14
2.99 ± 0.07
2.06 + 0.06
P-value
<10"6
<10"6
<10"6
<10"6

Chapter 4
Sire line
1
Dam line
2
A S \
123
/
3
A 23
?
Figure 4.1 Mating strategy to produce the commercial strain 123. Selection for desired
genotypes was conducted in strains 1, 2, 3 and 23.
78

Chapter 4
1.000-j
0.800-
0.600-
0.400-
0.200-
O.OOOH , r~, r—i r—r—r—T—! 1 i r—, 1 r—i ! 1 1
0.0 15.0 30.0 45.0 60.0 Days Post-Infection
Figure 4.2 Protective effect of vaccination on MD mortality. The survival curves of group
A (vaccinated/challenged) and group B (not vaccinated/challenged) differed significantly
(log-rank test, P=10"4).
A B
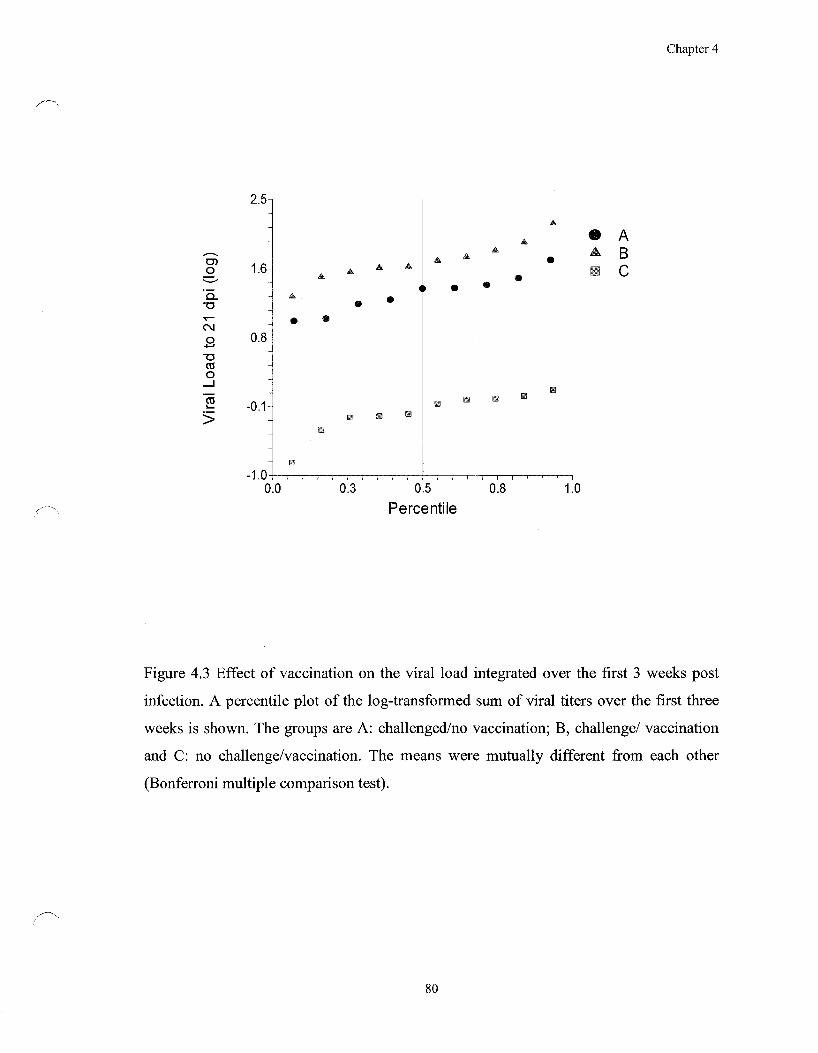
Chapter 4
CD O
Q . TJ
CM
O
T 3 CO O
CO
>
2.5n
1.6-
0.8-
-0.1-
* •
A B C
-1.0-0.0
~l I I I I I I I I I I i I I I [ I
0.3 0.5 Percentile
0.8 1.0
Figure 4.3 Effect of vaccination on the viral load integrated over the first 3 weeks post
infection. A percentile plot of the log-transformed sum of viral titers over the first three
weeks is shown. The groups are A: challenged/no vaccination; B, challenge/ vaccination
and C: no challenge/vaccination. The means were mutually different from each other
(Bonferroni multiple comparison test).
80
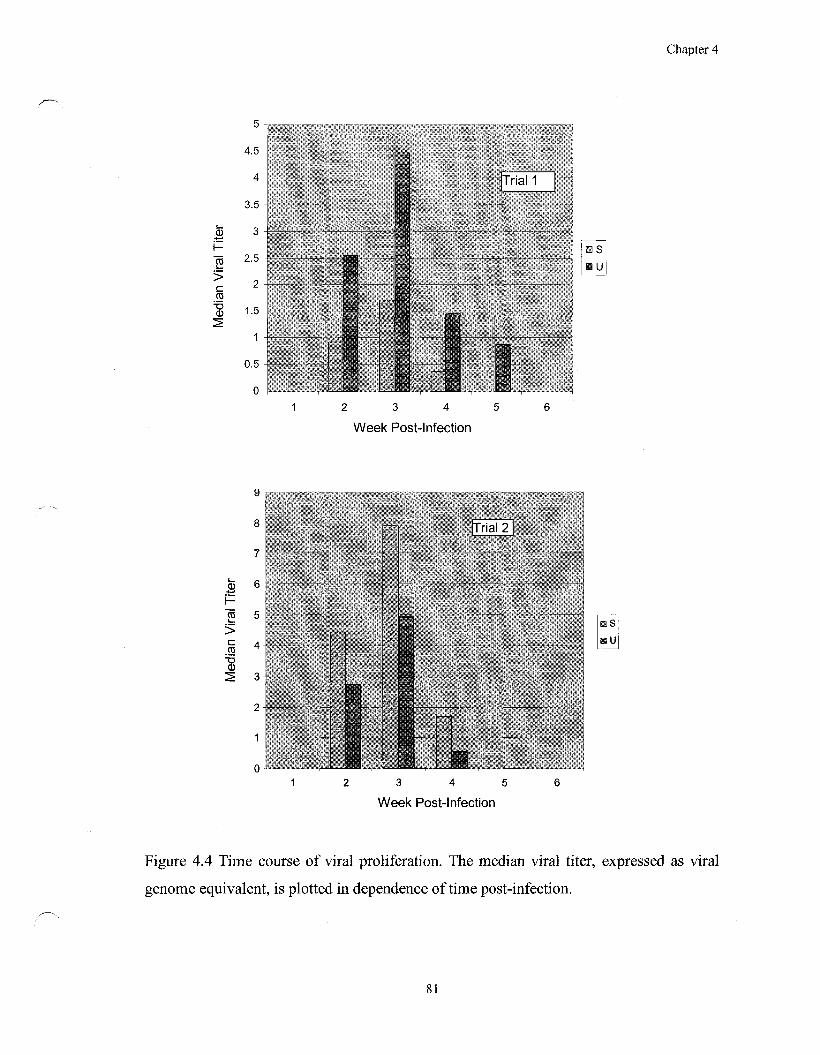
Chapter 4
£ iZ
Med
ian
Vir
al"
5
4.5 -
4 -
3.5
3 -
2.5
2 -
1.5 -
1 -
0.5 -
0 -
•Trial 1
2 3 4 5
Week Post-Infection
Tite
r V
iral
r
Med
ia
9
8
7
6
5
4
3
2-
0
• — • •
• ~ • " — -
zi '.'
1
__
fr
•:.
%.
f— • -
:
1 I 1
'•>••;:
' '''•'.;
'-•rk
>-:':
,*;.'•••! > ^
V Ve
— " "Trial 2 ~
- - • • • - • ~ —
- —
| " " ~ " ~ " "
I .. _ ~ ~ ~ .. ™ _ , .
1 I I <
''*.;?
u '/
i 4 5 6
ek Pos t-l ifection
Figure 4.4 Time course of viral proliferation. The median viral titer, expressed as viral
genome equivalent, is plotted in dependence of time post-infection.
81

Chapter 4
CD
o
CM
o
-I—»
CO
o CD
>
0.5
Percentile
Figure 4.5 Percentile distribution of the viral load to 3 weeks in dependence of trial and
population.
82

Chapter 4
v>
Sur
vivo
i
1 .UUU'
0.900-
0.800-
0.700
0.6001
0.500-
"•\_. h *- - n-
>^7~L,
-
0.025!
S1 -— S2
0.0 15.0 30.0 45.0 Days Post-Infection
60.0
15.0 30.0 45.0 Days Post-Infection
1.000
0.900
£ 0.800
GO 0.700
0.600
0.500
0.020H
U2 U1
Rat
e ar
d
to
0.016
0.012
0.008
0.0 15.0 30.0 45.0
Days Post-Infection 60.0
0.004
0.000 15.0 30.0 45.0
Days Post-Infection
Figure 4.6 Survival curve of the two populations S and U in trial 1 and 2. The four
survival curves differ significantly at P=0.018 (LOGRANK test). Pair-wise comparisons
indicate that survival curve for Ul (population U in trial 1) differed significantly from the
other three survival curves, while the differences between U2, SI and S2 were not
significant. The hazard rate functions appear to have shapes characteristic of the two
populations 1 and 2.
83
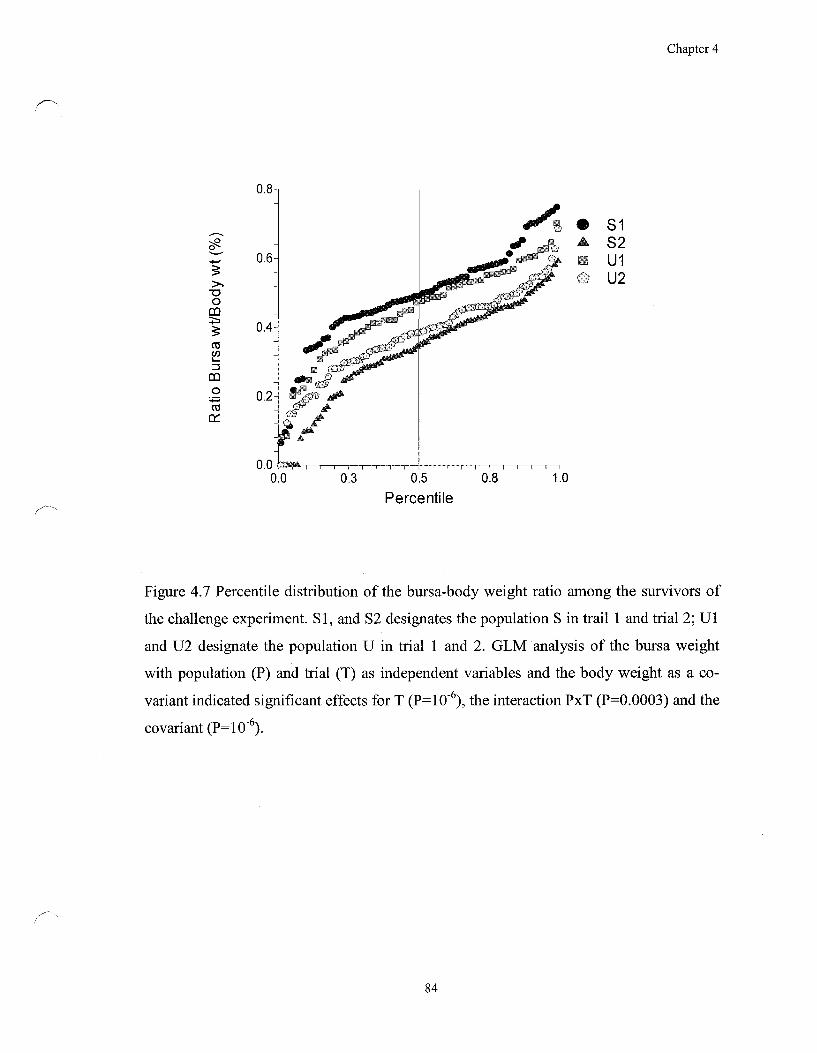
Chapter 4
X3 O
CO
CD <n
O
IS a:
0.0 0.5 Percentile
Figure 4.7 Percentile distribution of the bursa-body weight ratio among the survivors of
the challenge experiment. SI, and S2 designates the population S in trail 1 and trial 2; Ul
and U2 designate the population U in trial 1 and 2. GLM analysis of the bursa weight
with population (P) and trial (T) as independent variables and the body weight as a co-
variant indicated significant effects for T (P=10~6), the interaction PxT (P=0.0003) and the
covariant(P=l(T6).
84

Chapter 4
0.5 0.7 0.9
Viral Load (log)
1.1 1.3
Figure 4.8 Relationship between the mean bursa weight and mean of the log transformed
viral load to 35 dpi among the survivors of the challenge experiment. Linear regression of
the mean bursa weight on the mean viral titer was significant at P=0.011. The Spearman
rank-correlation between individual measurements was -0.349 (N=243,P<10"6).
85
4.6 REFERENCES
Chapter 4
Asmundson, V.S., and Biely, J. (1932) Inheritance of resistance to paralysis (neuro-
lymphomatosis gallinarum) I. Differences in susceptibility. Can. J. Res., 6:171-
176
Bacon L.D., Hunt, H.D. and Cheng, H.H. (2001) Genetic resistance to Marek's disease
Curr. Top. Microbiol. Immun., 255: 121-141
Baigent, S.J., Petherbridge. L.J., Howes, K., Smith, L.P., Currie, R.J.W. and Nair, V.K.
(2005) Absolute quantification of Marek's disease virus genome copy number in
chicken feather and lymphocyte samples using real-time PCR. J. Virol. Meth.,
123:53-64
Briles ,W.E., Briles, R.W., Tafs, R.E. and Stone, H.A. (1983) Resistance to a malignant
lymphoma in chickens is mapped to subregion of major histocompatibility (B)
complex. Science, 219: 977-979
Calnek, B.W. (1985) Genetic resistance. In: Marek's disease—scientific basis and
methods of control. L.N.Payne ed. Martinus Nijhoff, Boston, pp. 293-329
Calnek, B.W. and Witter, R.L. (1997) Marek's disease. In: Diseases of Poultry, 10th ed.
B.W. Calnek and R.L. Witter eds. Iowa State University Press, Ames, pp. 369-413
Cole, R.K. (1968) Studies on genetic resistance to Marek's disease. Avian Dis., 12: 9-28
Drof, M.E. (1981) The role of the major histocompactibility complex in immunology.
Garland Press, New York, NY
Fahy, O. L., Townley, A.L., Coates, N.J., Ckark-Lewis, I. and McColl, S.R. (2004)
Control of Salmonella dissemination in vivo by macrophage inflammatory protein
(MIP)-3a/CCL20. Lab. Invest., 84: 1501-1511
Feng, X.P., Kuhnlein, U., Fairfull, R.W., Aggrey, S.E., Yao, Y. and Zadworny, D.
(1998) A genetic marker in the growth hormone receptor gene associated with
body weight in chickens. J. Hered., 89: 355-359
Fredericksen, T.N., Longenecker, B.M., Pazderka, F., Gilmour, D.G. and Ruth, R.F.
(1977) A T-cell antigen system of chickens: Ly-4 and Marek's disease.
Immunogenetics, 5: 535-552
86

Chapter 4
Gimeno, I. M. (2004) Future strategies for controlling Marek's disease. Marek's disease:
In: Marek's disease: an evolving problem. F. Davison and V. Nair, eds. Elsevier,
London, UK, pp. 186-199
Hansen, M.P., van Zandt, J.N., and Law, G.R.J. (1967) Differences in susceptibility to
Marek's disease in chickens carrying two different B locus blood group alleles.
Poultry Sci., 46: 1268
Hintze, J. (2004) NCSS and Pass. Number Cruncher Statistical Systems. Kaysville, Utaj.
www.NCSS.com
Kaiser, P., Poh, T.Y , Rothwell, L.S., and Avery, A. (2005) A genomic analysis of
chicken cytokines and chemokines. J. Interferon & Cytikine Res., 25: 467-484
Kaufman, J., and Salomonsen, J. (1997) The "minimal essential MHC" revisited: both
peptide-binding and cell surface expression level of MHC Molecules are
polymorphisms selected by pathogens in chickens. Hereditas, 127: 67-73
Kaufman, J.F. and Venugopal, K. (1998) The importance of MHC for Rous sarcoma
virus and Marek's disease virus - some Payne - full considerations. Avian Pathol.,
27: S 82-87
Keller L.H. and Sevoian M. (1983) Studies of histocompactibility and immune response
of chickens selected for resistance and susceptibility to Marek's disease. Avian
Dis., 27: 7-20
Kuhnlein, U., Spencer, J.L., Chan, M., Praslickova, D., Linher, K., Kulenkamp, A. and
Ansah, G. (2006) Relationship between Marek's disease and the time course of
viral genome proliferation in feather Tips. Avian Dis., 50: 173-178
Kuhnlein, U., Ni L., Weigend, N.L.S., Gavora J.S., Fairfull W. and Zadworny D (1997)
DNA polymorphisms in the chicken growth hormone gene: response to selection
for disease resistance and association with egg production. Anim. Genet., 28: 116-
123
Kuhnlein, U., Aggrey, S.E. and Zadworny,D. (2003) Progress and prospects in resistance
to disease. In: Poultry genetics, breeding and biotechnology. W. M. Muir and S.E.
aggrey, eds. CABI Publishing, Wallingford, UK, pp. 283-292
87
Chapter 4
Li, S., Zadworay, D., Aggrey, S.E. and Kiihnlein ,U. (1998) Mitochondrial PEPCK: A
highly polymorphic gene with alleles co-selected with Marek's disease resistance
in chickens. Anim. Genetics, 29: 395-397
Linher, K., Aggrey, S.E., Spencer, J.L., Zadworny, D. and Kiihnlein, U. (2000) Effect of
selection for markers in the growth hormone and growth hormone on early
viremia in chickens infected with Marek's disease virus. In: Proceedings of the
v6th international symposium on Marek's disease. Montreal, pp. 80-85
Liu, H.C., Kung, H.J., Fulton, J.E., Morgan, R.W. and Cheng, H.H. (2001) Growth
hormone interacts with the Marek's disease virus SORF2 protein and is associated
with disease resistance in chicken. Proc. Natl. Acad. Sci. USA, 98: 9203-9208
Masilamani T.J. (2003) Identification of genetic markers associated with Marek's disease
in chickens. M.Sc. Thesis. McGill University
Morrow, C. and Fehler, F. (2004) Marek's disease: a worldwide problem. In: Marek's
disease: an evolving problem. F. Davison and V. Nair, eds. Elsevier, London, UK,
pp. 49-61
Stone, H.A. (1975) Use of Highly inbred chickens in research. U. S. Department of
Agriculture, ARS, Washington DC, Technician Bulletin, 1514: 1-22
Thoday, J.M. (1961) Location of polygenes. Nature, 191: 363-370
Vallejo, R. L., Bacon, L.D., Liu, H.C., Witter, R.L., Groenen, M.A., Hillel, J. and
Cheng, H.H. (1998) Genetic mapping of quantitative trait loci affecting
susceptibility to Marek's disease virus induced tumors in F2 intercross chickens.
Genetics, 148: 349-360
Williams, I. R. (2006) CCR6 and CCL20: partners in intestinal immunity and
lymphorganogenesis. Ann. N.Y. Acad. Sci., 1072: 52-61
Yonash, N., Bacon, L.D., Witter, R.L. and Cheng, H.H. (1999) Higher resolution
mapping and identification of quantitative trait loci (QTL) affecting susceptibility
to Marek's disease. Anim. Genet., 30: 126-135
Zelnik, V. (2004) Diagnosis of Marek's disease. In: Marek's disease: an evolving
problem. F. Davison and V. Nair, eds. Elsevier, London, UK, pp. 156-167
88
Chapter 5
CONNECTIVE STATEMENT III
In the first manuscript of this thesis we found that one of three markers in the vitamin D
receptor gene was associated with the expression of the MHC class II antigen on
peripheral blood leukocytes. In this manuscript we used the database for MD
susceptibility that we had described in the previous chapter to analyze whether the three
markers in the VDR gene were associated with MD resistance. Only the marker that had
been found to be associated with MHC class II expression levels was associated with
resistance. It indicates that MHC class II expression may be the link between vitamin D
metabolism and MD resistance.
89

Chapter 5
CHAPTER 5
Association of a marker in the Vitamin D receptor gene with Marek's
disease resistance in poultry
Dana Praslickova1, Shayan Sharif2, Aimie J. Sarson2, Mohamed Faizal Abdul-Careem2,
David Zadworny , Al Kulenkamp , George Ansah and Urs Kuhnlein
!Dept. of Animal Science, McGill University, 21111 Lakeshore Rd., Ste. Anne de
Bellevue, Qc, Canada, H9X3V9 2 Department of Pathobiology, Ontario Veterinary College, University of Guelph, Guelph,
On, Canada, NIG 2W1 3Shaver Poultry Breeding Farms Ltd., 500 Franklin Boulevard, Cambridge, On, Canada,
N1R 8G6
Corresponding author:
Urs Kuhnlein
Tel: (514) 398 7799
Fax:(514)398 7964
e-mail: [email protected]
90

Chapter 5
5.1 ABSTRACT
A genetic marker in the vitamin D receptor gene that had previously been
associated with changes in the proportion of MHC class II antigen positive peripheral
blood cells (PBC) was analyzed for association with Marek's disease resistance. The
database consisted of 400 commercial White Leghorn chickens that were vaccinated with
herpes turkey virus and challenged by intraperitoneal injection of the virulent Marek's
disease virus (MD) RB1B. Viral proliferation in feather tips was determined at weekly
intervals for eight weeks, mortality was recorded and necropsy analyses preformed in all
chickens. The marker had an additive effect on viral load (integration of the viral titer
over time) (P=3xl0~3) with the two homozygotes differing by a factor of 2. Consistent
with resistance to MD, the genotype with the lowest viral load also had the lowest score
for MD lesions and the lowest mortality. There was no effect on the tissue distribution of
MD lesions. The genotype associated with the highest proportion of MHC class II
positive PBCs was associated with the highest degree of resistance.
Keywords: Vitamin D, vitamin D receptor, viral proliferation, Marek's disease
resistance, MHC class II expression
91

Chapter 5
5.2 INTRODUCTION
Vitamin D is an essential nutrient that in addition to its classical role in calcium
and phosphate metabolism affects the proliferation, differentiation and function of many
different cell types, including the cells of the immune system. Epidemiological studies
and studies in mice support the importance of Vitamin D in the susceptibility to colorectal
cancer (Lamprecht and Lipkin, 2003), autoimmune diseases such as insulin dependent
diabetes mellitus (Zella and DeLuca, 2003), multiple sclerosis (Ascherio and Munger,
2007), rheumatoid arthritis (RA) (Cantorna, 2000), and Crohn's disease (Simmons et al,
2000). In addition, the vitamin D status is thought to modulate the susceptibility to
infectious diseases such as pulmonary tuberculosis (Selvaraj et al, 2003; Wilbur et al,
2006; Liu et al, 2006), influenza (Cannel et al, 2006), hepatitis B virus (Suneetha et al,
2006) and leprosy (Roy et ah, 1999). The association of the vitamin D status with the
incidence of autoimmune and infectious diseases in man prompted us to search for
variants in genes of the vitamin D metabolism that affect the immune response and
disease resistance in chickens.
In a previous study (see manuscript #1) we studied genetic variation in three genes
of vitamin D metabolism in White Leghorn strain. The three genes analyzed were the
vitamin D binding protein (DBP), the vitamin D receptor (VDR) and 25-hydroxyvitamin
D-24-hydroxylase (Cyp24). DBP is the main transporter of vitamin D to target cells,
VDR is the receptor that mediates the effect of vitamin D on gene transcription and
Cyp24 a major regulatory enzyme that inactivates vitamin D by hydroxylation (Dusso et
al, 2005; Omdahl et al, 2002).
Non-redundant markers in these genes were identified in a non-inbred strain and
tested for association with the proportion of peripheral leukocytes classified on the basis
of the cell surface markers CD3, CD4, CD8, MHC class II and lyB (manuscript #1). The
most significant effect was found for a marker in the VDR that affected the proportion of
MHC class II positive cells. MHCII mediates the display of antigens on antigen
presenting cells, thus stimulating effector cells of the immune system. MHC class II
expression may be an important modulator of MD, since it is up-regulated in various cell
types in response to viral infection (Niikura et al, 2007). It prompted us to analyze
whether markers of the vitamin D receptor affect MDV proliferation. The database used
92

Chapter 5
to test for such an association was a commercial White Leghorn strain that had been
intraperitoneally infected with MDV and has been described previously (manuscript #2).
5.3 MATERIALS AND MEHTODS
5.3.1 Strains of chickens and challenge test
We used a database of 400 female commercial White Leghorn chickens from two
different populations that had been intraperitoneally infected with MDV. The origin of
these two populations and the challenge protocol had been described previously
(manuscript #2). Briefly, the first population (S) was generated by mating two lines of
chickens that had been selected for markers in the GHR , the GH and the chemokine
MIP-3a. Ten sires were mated to ten females each. The second population (U) was the
standard commercial cross of the non-selected parental strains used to generate
population S. It was generated by pooling semen from 4 males per pool and inseminating
17 females with each semen pool.
Two challenge tests were conducted in two hatches spaced three month apart. For
the population S the same parents in both hatches. For the generation U different pools of
semen were used, but the inseminated females were the same. For the challenge, 100
female chickens of each strain were hatched, vaccinated with HTV, banded, intermingled
and transported from the hatchery to the University of Guelph. They were housed
intermingled and challenged at 5 days of age.
5.3.2 DNA extraction and viral titration
Feather samples were collected from the wings of the chickens on 7, 14, 21, 28,
35, 42, 49, 56 dpi and shipped from the University of Guelph to our laboratory for
analysis. Extraction of the DNA from feather tips was carried out using a protocol
adapted from Kuhnlein et al. (2006). Feather tips were cut into small pieces with sterile
scissors and placed into 1.5 ml tubes containing 400 ul of extraction buffer (2% 2-
mercaptoethanol, 10 mM Tris HCL at pH 8.0, lOOmM NaCl, 10 mM EDTA at pH 8.0
and 0.5% SDS). After an incubation period of 30 minutes proteinase K (Gibco BRL) was
added to a final concentration of 200 (J-g/ml, and the incubation was continued at 50°C for
16 hours. DNA was extracted with phenol:chloroform:isoamyl alcohol (25:24:1)
93

Chapter 5
(BioShop), precipitated with an equal volume of ice-cold 100% ethanol and rinsed with
500 ul 70% ethanol. The samples were air-dried and the DNA dissolved in 300 \xl of
deionized water. The DNA concentration was measured by spectrophotometry
(NanoDrop® ND-1000 Spectrophotometer). The samples were diluted to 100 ng/ul and
2ul per each reaction were used in the competitive quantitative polymerase chain reaction
(PCR). The competitive PCR to quantitate viral DNA has been described (Kuhnlein et ah,
2006).
5.3.3 Genetic analysis of the VDR gene
The VDR gene had been analyzed in strain 7, a non-inbred White Leghorn strain
that had been generated by mating 4 North American commercial strains in 1955 and was
propagated by pedigreed random mating without selection using 100 sires mated to 2
dams each. Genetic variations were assessed by sequencing two segments of 20 offspring
from different sire families. The locations of the two segments and the polymorphisms
within the VDR gene are shown in Figure 5.1. The 14 SNP in these two segments
required at least 10 taggers for complete characterization of the haplotypes. For budgetary
reasons we restricted our analysis to the three taggers VDR S1P4, VDR SI PI 2 and VDR
S2P2. The marker VDR S1P4 was associated with variations in the number of peripheral
blood cells expressing the MHC class II antigen.
These three markers also segregated in the commercial population that was
subjected to the challenge test. They were genotyped by the McGill University and
Quebec Genome Innovation Center by fluorescence polarization detection of single base
extension (FP-SBE) using a Analyst HT reader (Molecular Devices, Sunnyvale, CA)
and/or by the GenomeLab™ SNP Stream® Genotyping System (Beckman Coulter ).
5.3.4 Statistical analysis
The statistical evaluation and graphical illustration were conducted with the NCSS
software (Hintze, 2004). Association analyses were conducted by using general linear
model procedures (GLM). Survival and hazard rates were analyzed using the Kaplan-
Meier procedure.
94

Chapter 5
5.4 RESULTS
5.4.1 Association with viral proliferation
The time course of viral proliferation in feathertips was bell-shaped with a peak
observed at 21 dpi with the on-set of mortality (Kuhnlein et al, 2006). The profiles for
the genotypes of the marker VDR S1P4 are shown in Figure 5.2. At each time point the
lowest median viral titer was observed for the genotype AA, followed by AG and GG.
The profiles for the markers VDR SIP 12 and VDR S2P2 were similar for all genotypes
(data not shown).
For statistical analysis we summed the weekly viral load prior to the onset of
mortality (the viral load to 21 dpi) and to 35 dpi (viral load to 35 dpi). The latter measure
includes only the chickens that were still alive at 35 dpi. Significant single variable
effects were observed for the VDR S1P4 genotype and the trial (Table 5.1). The
interaction term between the population and the trial was also significant as reported
previously (manuscript #2). It reflects that the two populations were differentially
affected in the two trials. However, the interactions of the VDR genotypes with both trial
and population were not significant, indicating that the effects of the VDR genotype were
independent of the population and trial. The mean viral loads for the different VDR S1P4
genotypes are shown in Table 5.2. A comparison of the means indicates additivity for the
VDR locus with the viral load differing between the homozygotes by a factor of 2.
The two other markers in the VDR gene, VDR SIP 12 and VDR S2P2 had no
effect on the proportion of leukocyte subtypes, and in the previous analysis they also had
no significant effect on the viral titer in feather tips (data not shown).
5.4.2 Association with MD lesions, mortality and weight of the bursa
Other indicators of MD are the frequency of chickens with MD lesions, the
cumulative mortality and the bursa weight. These parameters were not significantly
dependent on the VDR S1P4 genotype (Table 5.2). However, the ranking by the three
genotypes was consistent with the ranking of the viral titers. The magnitude of the means
again indicated an additive effect of the VDR polymorphism.
95

Chapter 5
The frequency of chickens with lesions categorized by tissue is shown in Figure
5.3. For each tissue the frequency of chickens that had lesions was lowest for the
genotype AA, followed by genotype AG and GG. Hence, the ranking of the genotypic
classes on the basis of the presence of one or more lesions is concordant. The ranking of
the tissues by the genotypic classes is also concordant, indicating that the tissue
distribution of lesions is not significantly influenced by the VDR receptor genotype.
An analysis of the time course of mortality suggests that the VDR S1P4 genotype
may affect the time dependence of the rate of mortality (Figure 5.4). In genotype AA
chickens the mortality rate peaked at 28 dpi. This peak was shifted by one week in
genotype GG chickens. The mortality rate curve in genotype AG chickens was between
the curves for the two homozygotes.
5.5 DISCUSSION
In the present study we screened a population of 400 White Leghorns chickens for
the association of Marek's disease resistance with three polymorphisms in the VDR gene.
Only one of the markers, VDR S1P4 that had previously been found to be associated with
the frequency of MHC class II positively expressing leukocytes in peripheral blood
leukocytes had a significant effect. The effect of this marker on MD resistance was
additive, similar to the effect on MHC class II expression that had been measured in a
different strain of White Leghorn chickens.
MD resistance was assessed using three different indicators, viral titers in feather
pulp, survival to 56 dpi, the frequency of MD lesions and the weight of the bursa. A
significant effect of the VDR marker VDR S1P4 on MD resistance was only observed for
the viral titer in feather tips. However, the other indicators behaved concordantly as
expected from the relationship of mortality, frequency of lesions and viral titer in feather
tips (manuscript #2).
The ranking of the number of lesions on the basis of the three genotypes was the
same in each of 8 groups of tissues and was concordant with the effect of VDR S1P4
genotype on the viral titer (AA<AG<GG). Similarly, the ranking of lesions was
consistent for each genotype, indicating that there were no tissue specific effects of the
VDR genotype on the distribution of lesions.
96

Chapter 5
The VDR may affect the level of cell transformation and of viral proliferation
independently. In humans mutations in the VDR gene leading to the hereditary vitamin D
resistant rickets (HVDRR), have been shown to be associated with hair-loss (alopecia)
(Malloy et al, 1999). Similarly, VDR-null mice display alopecia, presumably due to a
defect in keratinocyte stem cell function that is essential for hair follicle homeostasis
leading to the absence of the initiation of new hair growth cycles (Clanferroti et al, 2007;
Demay et al, 2007). Viral proliferation of MDV in the epithelial cells of feather tips may
be dependant on a normal progression of cell differentiation in feather follicles. In
particular, the transient viral proliferation we observed in our challenge tests may not
reflect the course of the disease, but may be related to the age dependent development of
feather follicles.
Vitamin D has also antiproliferative actions (Bouillon et al, 2006). VDR-KO
mice are more prone to develop tumor when exposed to oncogenes or carcinogens and
epidemiological studies indicate that there is an inverse relationship between UV-B
exposure and the incidence of colorerectal, breast and prostate cancer. Hence, VDR may
affect tumor formation and survival independently of its effect on viral proliferation.
Alternatively to a pleiotropic action on several manifestations of MD, l,25(OH)2D
may exert its effect on MD via its impact on the immune system. Virus proliferation in
feather tips is thought to be mediated by sustained contact of epithelial cells with infected
B and T lymphocytes that infiltrate the feather follicles. The infiltration rate and hence the
number of infected lymphocytes may therefore be rate limiting for viral titers in feather
tips. Cytolytically infected lymphocytes are also the precursors of latently infected B and
T cells that may infiltrate different tissues and give rise to the proliferative lesions
characteristic of MD.
Vitamin D affects many cells of the cognate and innate immune system (Griffin et
al, 2003). In general it exerts an inhibitory effect on the immune system by attenuating
the differentiation and proliferation of cells of the immune system. Specifically, it has
been reported to reduce the surface expression of MHC class II and other co-stimulatory
ligands on dendritic cells, and to induce a shift of the immune response of Thl profile to
the Th2 profile of the immune system (Chen et al, 2007; Overbergh et al, 2000). The
association of autoimmune diseases with vitamin D deficiency is thought to be due to a
97

Chapter 5
relatively high Thl response that leads to the activation of CTLs and subsequent tissue
damage. However, an inhibitory effect of l,25(OH)2D on the B-cell maturation,
proliferation and IgE production has also been reported (Chen et al, 2007). An example
of the effect of vitamin D on the innate immune system is the upregulation of the VDR
and vitamin D-l hydroxylase in response to activation of Toll-like receptors, leading to
the induction of the antimicrobial peptide cathelicidin (Liu et al, 2006).
MD resistance is affected by the innate immune system as well as the Thl and
Th2 branches of the cognate immune system (Davison and Kaiser, 2004). A general
attenuation of the response of the immune system by vitamin D would be expected to
increase the susceptibility to MD. Indeed, most viruses down regulate the immune system
as part of their strategy to escape immune surveillance. The most important pathways are
the inhibition of the expression of MHC class II genes by blocking the pathway that
induces the expression of the MHC class II transactivator and the inhibition of the MHC
class II antigen presenting pathway (Hegde et al, 2003). Surprisingly, Marek's disease
virus does not subscribe to this strategy. To the contrary, it up-regulates the MHC class II
cell surface expression in response to MDV infection, apparently by an INF-y mediated
pathway (Niikura et al, 2007; Gimeno et al, 2001).
The VDR S1P4 marker that we have found to be associated with MD resistance
has previously found to be associated with the proportion of MHC class II expressing
cells in peripheral blood leukocyte. Paradoxically, the chickens of the genotype
associated with the highest proportion of MHC class II expressing lymphocytes were the
most resistant to MD (Figure 5.5). Since the association of the VDR marker with the
MHC class II positive peripheral leukocytes, it is expected to reflect the proportion of
leukocytes that constitutively express MHC class II antigen. Whether the VDR
polymorphism has an effect on the induction of MHC class II antigen expression by viral
infection remains to be determined. Further, it has to be considered that our challenge test
was conducted in chickens vaccinated with HVT, an attenuated virus of the Mardi virus
family. The association of the VDR polymorphism with susceptibility to MD may
therefore reflect an effect of VDR on the response to vaccination (Ivanov et al, 2006).
98

Chapter 5
Table 5.1 GLM analysis of the dependence of the integrated viral titers on trial,
population and VDR S1P4 genotype.
Source
VDR
Population (P)
Trial (T)
VDRxP
VDRxT
PxT
Residual
Viral load to 21 dpi (log)
Mean
square3
1.64
0.02
8.80
0.33
0.32
5.49
0.20
P-value
3 -10"4
0.73
<10'6
0.19
0.20
<10'6
Viral load to 35 dpi (log)
Mean
square
2.71
0.18
4.01
0.68
0.01
7.03
0.25
P-value
2 -10"5
0.40
7 -10"5
0.06
0.96
<10"6
a The parameters VDR, P and T and their interactions accounted for 22% of total sum of
squares. VDR alone accounted for 3.7% of the total sum of squares.
The parameters VDR, P and T and their interactions accounted for 20% of total sum of
squares. VDR alone accounted for 5.6 % of the total sum of squares
99

Chapter 5
Table 5.2 Mean viral load for different VDR S1P4 genotypes
Indicators of MD
Viral load to 21 dpib
Viral load to 35 dpi
Cumulative mortality (%)c
Chickens with proliferative lesions (%)c
Frequency of proliferative lesions/chicken
Bursa weight (g)c
VDR S1P4 genotype3
AA (N=48)
4.69 ±1.18
5.00 ±1.21
19.3
27.3
0.473
2.89 ±0.18
AG(N=175)
6.49 ±1.09
9.62 ±1.10
24.5
38.8
0.776
2.80 ±0.10
GG(N=135)
9.07 ±.1.10
13.20± 1.12
30.6
43.0
0.915
2.70 ±0.12
a The total number of chickens that had been genotyped and assayed is indicated.
The mean and standard error were computed from the log transformed values of the sum
of the viral titers measured at 7, 14 and 21 dpi (viral load to 21 dpi) and day 7, 14, 21, 28
and 35 dpi (viral load to 35 dpi). The values indicated were back-transformed. c Not significant, but concordant with the ranking by viral load.
100

Chapter 5
Exon 1 Exon 3 Exon 2 Exon 4
+ 2000bp 0 Segmentl
- H -
P4 P5 P7 PI P2 P3 \ \ ,b /P8P9 P10 Pll P12
J iL 50bp A Exon 2 A 5 4 1
Exon 5 Exon 6 Exon 7
-H Segment 2
sna-E X O n 6 # Exon 7
464
Figure 5.1 Map of the VDR gene. The arrows indicate the position of the markers VDR
S1P4, VDR S1P12 and VDR S2P2 that were analyzed. The association with the viral load
was significant for P4 in segment 1.
101
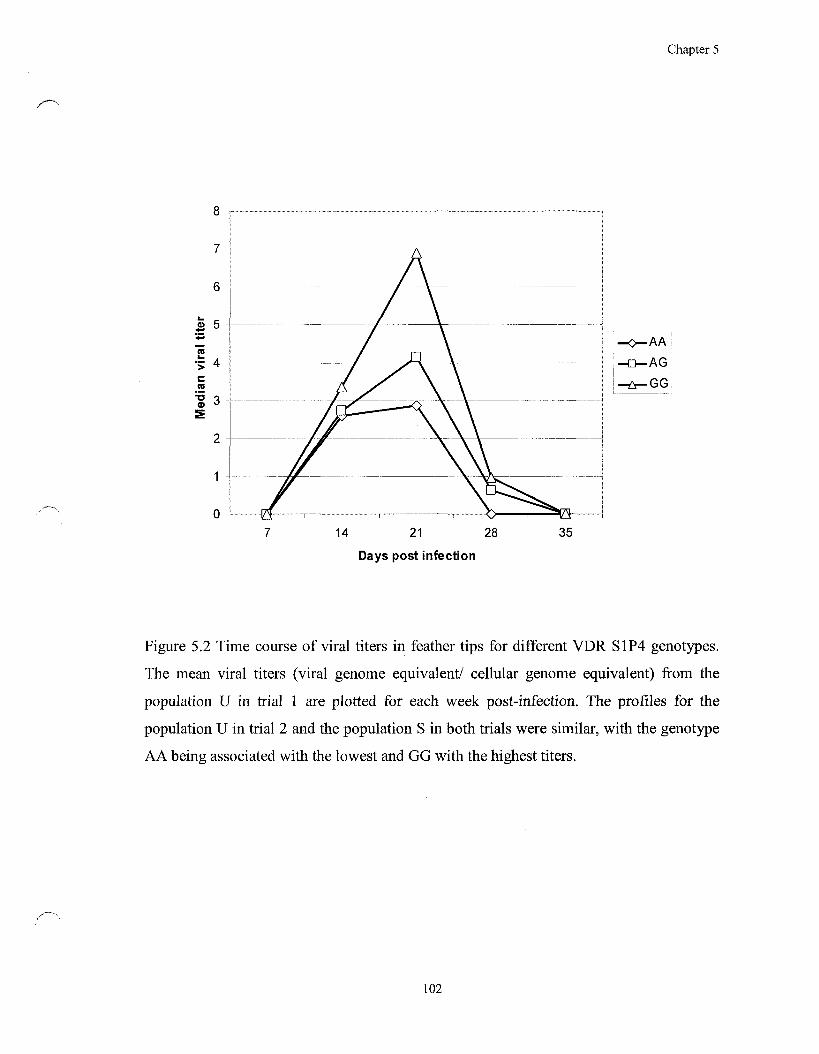
Chapter 5
-AA
-AG
-GG
14 21 28
Days post infection
Figure 5.2 Time course of viral titers in feather tips for different VDR S1P4 genotypes.
The mean viral titers (viral genome equivalent/ cellular genome equivalent) from the
population U in trial 1 are plotted for each week post-infection. The profiles for the
population U in trial 2 and the population S in both trials were similar, with the genotype
AA being associated with the lowest and GG with the highest titers.
102

Chapter 5
40 T
£ 30
to
o 'to
20 4
5 w c 0)
J *
o
O
10 4
IS r\f\
• AG
• GG
Spleen Liver Muscle Prov Ovary Kidney Heart Misc
Figure 5.3 Tissue distribution of proliferative and inflammatory lesions. The bars
represent the frequency of chickens that had proliferative lesions in the tissues indicated.
The ranking of the tissues by the genotypes was concordant (Kendall coefficient of
concordance W=l, P=3T0"5). Similarly, the ranking of the three genotypes by the tissues
was significant (W=l, P=0.006).
103

Chapter 5
AA AG GG
15.0 30.0 45.0 Days Post-Infection
60.0
15.0 30.0 45.0 Days Post-Infection
Figure 5.4 Survival and hazard rate for different VDR S1P4 genotypes. The genotypes
AA and GG are associated with the lowest and highest viral loads, respectively.
104

Chapter 5
5 6 7
MHC class II titer (%)
• Mortality
A Viral load
O Lesions/chicken
Figure 5.5 Relationship between the proportion of MHC class II positive peripheral
leukocytes and mortality, the viral load to 21 dpi, and the frequency of lesions/chicken.
The values were plotted for each of the genotypes of the three markers in the VDR gene.
105

Chapter 5
5.6 REFERENCES
Ascherio, A. and Munger, K.L. (2007) Environmental risk factors for multiple sclerosis.
Part II: Noninfectious factors. Ann Neurol., 61: 504-13
Association of vitamin D receptor gene variants of BsmI, Apal and Fokl polymorphisms
with susceptibility or resistance to pulmonary tuberculosis. Curr. Science, 12:
1564-1568
Bouillon, R., Eelen, G., Verlinden, L., Mathieu, C, Carmeliet, G., Verstuyf, A. (2006)
Vitamin D and cancer. J. Steroid Biochem. Mol. Biol., 102: 156-62
Cannell, J.J., Vieth, R., Umhau, J.C., Holick, M.F., Grant, W.B., Madronich, S., Garland,
C.F., Giovannucci, E.(2006) Epidemic influenza and vitamin D. Epidemiol Infect.,
134: 1129-40
Cantorna, M.T. (2000) Vitamin D and Autoimmunity: Is Vitamin D Status and
Enviromental Factor Affecting Autoimmune Disease Prevalence? P.S.E.B.M.,
233: 230-233
Cianferotti, L., Cox, M., Skorija, K., Demay, M.B. (2007) Vitamin D receptor is essential
for normal keratinocyte stem cell function. Proc. Natl. Acad. Sci. USA, 104:
9428-33.
Chen, S., Sims, G.P., Chen, X.X., Gu, Y.Y., Chen, S. and Lipsky, P.E. (2007) Modulatory
effects of 1,25-dihydroxyvitamin D3 on human B cell differentiation. J. Immunol.,
179:1634-47
Davison, F. and Kaiser, P. (2004) Immunity to Marek's disease. In: Marek's disease, an
evolving problem. F. Davison F. and V. Nair eds. Elsevier Academic Press.
Amsterdam, pp. 126-141
Demay, M.B., MacDonald, P.N., Skorija, K., Dowd, D.R., Cianferotti, L. and Cox, M.
(2007) Role of the vitamin D receptor in hair follicle biology. J. Steroid Biochem.
Mol. Biol, 103:344-346
Dusso, A.S., Brown, A.J. and Slatopolsky, E. (2005) Vitamin D. Am. J. Physiol. Renal.
Physiol., 289: F8-F28
Gimeno, I.M., Witter, R.L., Hunt, H.D., Lee, L.F., Reddy, S.M. and Neumann, U. (2001)
Marek's disease virus infection in the brain: virus replication, cellular infiltration,
106

Chapter 5
and major histocompatibility complex antigen expression. Vet. Pathol., 38: 491-
503
Gowe, R.S., Fairfull, R.W., McMillan, I. and Schmidt G.S. (1993) A strategy for
maintaining high fertility and hatchability in a multi-trait egg-stock selection
program. Poultry Sci., 72: 1433-1488
Hegde, N.R., Chevalier, M.S. and Johnson, D.C. (2003) Viral inhibition of MHC class II
antigen presentation. Trends Immunol., 24: 278-85
Griffin, M.D., Xing, N. and Kumar, R.(2003) Vitamin D and its analogs as regulators of
immune activation and antigen presentation. Annu. Rev .Nutr., 23: 117-45
Hintze, J. (2004) NCSS and Pass. Number Cruncher Statistical Systems. Kaysville, Utaj.
www. NCSS.com.
Ivanov, A.P., Dragunsky, E.M., Chumakov, K.M . (2006) 1,25-dihydroxyvitamin d3
enhances systemic and mucosal immune responses to inactivated poliovirus
vaccine in mice. J. Infect. Dis., 193: 598-600
Kiihnlein, U., Spencer, J.L., Chan, M., Praslickova, D., Linher, K., Kulenkamp, A. and
Ansah, G. (2006) Relationship between Marek's disease and the time course of
viral genome proliferation in feather tips. Avian Dis., 50: 173-178
Lamprecht, S.A. and Lipkin, M.(2003) Chemoprevention of colon cancer by calcium,
vitamin D and folate: Molecular mechanisms. Nature reviews, 3: 601-614
Liu, P.T, Stenger, S., Li, H., Wenzel, L., Tan, B.H., Krutzik, S.R., Ochoa, M.T.,
Schauber, J., Wu, K., Meinken, C, Kamen, D.L., Wagner, M., Bals, R.,
Steinmeyer, A., ZUgel, U., Gallo, R.L., Eisenberg, D., Hewison, M., Hollis,
B.W., Adams, J.S., Bloom, B.R. and Modlin, R.L. (2006) Toll-like receptor
triggering of a vitamin D-mediated human antimicrobial response. Science, 311:
1770-1773
Malloy, P.J., Pike, J.W. and Feldman, D. (1999) The vitamin D receptor and the
syndrome of hereditary 1,25-dihydroxyvitamin D-resistant rickets. Endocr. Rev.,
20: 156-88.
Niikura, M., Kim, T., Hunt, H.D., Burnside, J., Morgan, R.W., Dodgson, J.B. and Cheng,
H.H. (2007) Marek's disease virus up-regulates major histocompatibility complex
class II cell surface expression in infected cells. Virology, 359: 212-219
107

Chapter 5
Omdahl, J.L., Morris, H.A. and May, B.K. (2002) Hydroxylase enzymes of the vitamin D
pathway: expresion, function, and regulation. Annu. Rew. Nutr. 22: 139-166
Overbergh, L., Decallonne, B., Waer, M., Rutgeerts, O., Valckx, D., Casteels, K.M.,
Laureys, J., Bouillon, R. and Mathieu, C. (2000) lalpha,25-dihydroxyvitamin D3
induces an autoantigen-specific T-helper 1/T-helper 2 immune shift in NOD mice
immunized with GAD65 (p524-543).Diabetes, 49: 1301-1307
Roy, S., Frodsham, A., Saha, B., Hazra, S.K., Mascie-Taylor, C.G. and Hill, A.V. (1999)
Association of vitamin D receptor genotype with leprosy. J. Infect. Dis., 179: 187-
191
Selvaraj, P., Chandra, G., Kurian, S.M., Reetha, A.M. and Narayanan, P.R. (2003)
Simmons, J.D., Mullighan, C, Welsh, K.I. and Jewell, D.P. (2000) Vitamin D receptor
gene polymorphism: association with Crohn's disease susceptibility. Gut, 47: 211-
214
Suneetha, P.V., Sarin, S.K., Goyal, A., Kumar, G.T., Shukla, D.K. and Hissar, S. (2006)
Association between vitamin D receptor, CCR5, TNF-alpha and TNF-beta gene
polymorphisms and HBV infection and severity of liver disease. J. Hepatol. 44:
856-863
Wilbur, A.K., Kubatko, L.S., Hurtado, A.M., Hill, K.R. and Stone, A.C. (2007) Vitamin
D receptor gene polymorphisms and susceptibility M. tuberculosis in native
Paraguayans. Elsevier Ltd., Tuberculosis 2007
Zella, J.B. and DeLuca F. (2003) Vitamin D and autoimmune diabetes. J. Cell. Biol. 88:
216-222
108

CHAPTER 6
GENERAL CONCLUSIONS
The primary interest of the poultry breeding industry is to develop healthy
chickens that can produce eggs and meat economically and in a sustainable fashion.
Among the factors that disrupt sustainable production are viral diseases, including
Marek's disease, which drives researchers to look for ways to enhance existing control.
Viral diseases are not only causing losses due to direct effects, but also because they
weaken the immune system and render chickens susceptible to other diseases.
An adjunct to vaccination and proper management is the selection for genes that
improve the disease resistance. Efforts in the past decade have been focused on
identifying such genes. The general approach was to construct a genetic map of the
chicken genome and to map loci by conducting segregation analyses. Map construction
has culminated in the sequencing of the entire genome. However, identification loci that
affect resistance using segregation analysis have to some extent been disappointing. This
is mainly due to an unforeseen genetic diversity of the chicken genome, which is still
present despite extensive selection since the domestication of the chicken. Our analysis of
the VD receptor is a case in point. A second problem is that disease resistance appears to
be a quantitative trait, determined by many partially redundant pathways. It is therefore
difficult to conduct mapping of loci with sufficient precision to identify genes and to
generalize findings from the analysis of inbred lines or families to the population at large.
To this one has to add the tremendous costs in whole genome scans.
The same is to some extent true in human genetic studies. The paradigm has
therefore shifted to analyzing the association between traits and genetic variations in
candidate genes, i.e. genes that are thought to be involved in a trait on the basis of their
biological properties and gene location (if data is available). It has led to an explosion of
data relating genetic variations with human genetic disorders. With the availability of the
chicken genomic sequence, the same approach can be applied to chickens.
The limited resources available in poultry research require a judiciary approach
when selecting candidate genes. One possibility is to concentrate on genes that had
preciously associated with disease resistance in human and/or mice studies. The argument
109

is that if genetic variations that affect disease resistance have survived human and/or
mouse evolution, they may also have survived evolution of the chicken. We therefore
chose to analyze markers in three genes of the vitamin D metabolism. Vitamin D
metabolism has been shown to be an important modulator of the innate and cognitive
immune system and several of its genes have been shown to be associated with disease
resistance in humans.
In the first manuscript we identified sequence variations in the three genes of the
vitamin D pathway (DBP, VDR, Cyp24), and their association with disease resistance in
vaccinated, Strain 7 of White Leghorn chickens. Two randomly selected sections for
each of the following genes: DBP, VDR and Cyp24 were sequenced to establish genetic
variations and to determine the blocks of the co-segregating SNPs. The analysis
demonstrated the high degree of genetic variability still present in White Leghorn
chickens despite the high degree of selection. Of particular interest is the VDR gene that,
similar to the human gene, shows a low degree of linkage disequilibrium between
markers, indicative of a high degree of historical recombination.
Two to three non redundant markers in each gene were analyzed for associations
with peripheral blood mononuclear cells (PBMC). There was significant association
between a marker in the VDR gene and a marker in the DBP gene and the proportion the
MHC class II and TCR1 positive cells, respectively. None of these markers affected egg
production traits. There was significant interaction between markers, indicating that they
are part of the same pathway.
In the second manuscript we conducted DNA based selection for RFLP markers in
the GHR, GH1, and MIP-3a. These markers were chosen as candidate genes on the basis
of their function and/or co-selection with selection for resistance to MD virus. Marker
assisted selection, apart from selection for MHC class II haplotypes, has not yet been
conducted in poultry. Besides testing the usefulness of a putative resistance marker in
breeding, it provides us with a database for future marker identification.
Two populations were created, a selected population and a non-selected control
population. The challenge was conducted in two hatches, three months apart. The strain to
develop the selected and non-selected population was a commercial White Leghorn strain
and was vaccinated to mimic normal commercial conditions. As an endpoint of resistance
110

we measured a series of parameters that included the viral load in feather tips, the
survival, the frequency of MDV induced tumors and the atrophy of the bursa.
The outcome was clear. In the first trial the selected population was more resistant
than the non-selected population, indicating that the marker based selection for resistance
was successful. In the second trial the outcome was reversed with the same clarity. What
went wrong? The chickens were hatched and vaccinated at Shaver Poultry Farms Ltd., a
company that has developed and marketed poultry strains since many years. The chickens
in each of the two trials were intermingled immediately after hatch and the parents
showed no signs of ill health or reduced production.
Necropsy indicated that the course of the disease differed in the two trials.
Specifically, the tissue distribution of the MD lesions in the two trials differed
significantly. Every living organism can develop different manifestations of the disease
with different magnitudes of infection. This depends on the virulence of the virus, the
quality of the vaccine batch, the environment, the genetic background, the parental age,
the body condition and the infection by other pathogen. During trial 1, nine of the S and
eight of the U chickens died before or within 48 hours post infection. The necropsy
analysis indicated septicemia and tissue swabs confirmed the presence of infection with
Escherichia coli sensitive to apramycin. The chickens were therefore immediately treated
with apramycin. In trial 2, ascites and airsaculitis were observed in two chickens from
each group; these chickens died within 2 1 - 2 5 dpi. Again apramycin treatment was
commenced, but Escherichia coli was not detected.
The comparison of the selected and non-selected population in two trials revealed
contradicting results, both at a high level of significance. It may reflect that in one of the
trials the two populations were exposed to different extraneous factors or that the two
populations differed in their response to a common factor, reflecting a destabilizing effect
of selection. Although we cannot distinguish between these two possibilities, our results
indicate that it is important to test the effect of marker assisted selection under a variety of
conditions before applying it at the industrial level.
The challenge experiment provided us with an excellent database consisting of
two populations tested for resistance to MD in two different trials. We used this database
to test whether or not the marker genotypes of the vitamin D receptor gene that we had
111
analyzed in the first chapter were associated with MD resistance. Among the three
markers only the one that had been found to affect the proportion of peripheral blood
leukocytes expressing the MHC class II antigen was found to be associated with MD
resistance. The marker associated with the presence of high levels of MHC class II
expressing cells was associated with high resistance to MDV. It consistently reduced the
viral load, mortality, lesion frequency and bursal atrophy independent of population and
trial. Hence, selection for this marker may lead to a reproducible improvement of MD
resistance.
In summary, we showed that genetic variance in the genes used in our study have
an effect on the susceptibility of chickens to MDV. By having built a valuable database of
the DNA from two, vaccinated, and challenged populations, we have created a possibility
not only to study the effect of the genetic markers that were used for the selection, but
also to look for new candidate genes to be used for future selections.
112

APPENDIX
113