Association of Doctoral Programs in Criminology & Criminal ...
52
1 Association of Doctoral Programs in Criminology & Criminal Justice (ADPCCJ) 2019 Survey Report ADPCCJ Executive Board Jodi Lane (President) David L. Myers (Vice President and President-Elect) Deborah Koetzle (Secretary) Gaylene Armstrong (Past President) Monday, December 02, 2019
Transcript of Association of Doctoral Programs in Criminology & Criminal ...

1
Association of Doctoral Programs in Criminology & Criminal Justice (ADPCCJ)
2019 Survey Report
ADPCCJ Executive Board
Jodi Lane (President) David L. Myers (Vice President and President-Elect)
Deborah Koetzle (Secretary) Gaylene Armstrong (Past President)
Monday, December 02, 2019

2
Table of Contents Table of Contents ....................................................................................................................................................................2 List of Tables ............................................................................................................................................................................3 List of Figures ..........................................................................................................................................................................4 Purpose......................................................................................................................................................................................6 Overview of ADPCCJ Criminology and Criminal Justice Programs ..............................................................................6 CCJ Faculty Related Information Reported in the 2019 ADPCCJ Survey ....................................................................7
Active Students .................................................................................................................................................................. 12 Incoming Students ............................................................................................................................................................ 16
Program Requirements .............................................................................................................................................................. 22 Appendix A. Summary Data from 2019 ADPCCJ Survey for Programs Ranked in Top 5 by U.S. News & World Report. .................................................................................................................................................................................... 25 Appendix B. List of ADPCCJ Members, 2019. ............................................................................................................... 38
Appendix C. Trends from 2010 to 2019 for all ADPCCJ Programs…………………………………………...39

3
List of Tables Table 1. Participating Programs (N = 38). ........................................................................................................................... 7 Table 2. Faculty Salaries......................................................................................................................................................... 10 Table 3. Graduate Director Compensation (N = 28). ...................................................................................................... 10 Table 4. Faculty Time Distribution (N = 36). ................................................................................................................... 10 Table 5. Class Sections Offered by Degree, Relative to Faculty Size and Graduate Student Involvement............. 11 Table 6. Faculty Productivity in Past Year. ........................................................................................................................ 12 Table 7. Graduate Program Size, by Degree Type. ........................................................................................................... 13 Table 8. GRE Scores and Percentiles for Newly Admitted Doctoral Students. .......................................................... 19 Table 9. Degree Background Percentages for Newly Admitted Master’s and Doctoral Students. ........................... 20 Table 10. Areas of Concentration……………………………………………………………………………...24 Appendix A Tables Appendix Table 1. ADPCCJ Programs with Top 5 Rankings in 2019 U.S. News & World Report (N = 7) ......... 25 Appendix Table 2. Faculty Salaries for Top Ranked ADPCCJ Reporting Programs. ............................................... 27 Appendix Table 3. Graduate Director Compensation for Top Ranked ADPCCJ Reporting Programs. ................ 27 Appendix Table 4. Faculty Time Distribution for Top Ranked ADPCCJ Reporting Programs (N = 7). .............. 27 Appendix Table 5. Class Sections Offered by Degree, Relative to Faculty Size and Graduate Student Involvement for Top Ranked ADPCCJ Reporting Programs. ....................................................................................... 28 Appendix Table 6. Faculty Productivity in Past Year for Top Ranked ADPCCJ Programs. .................................... 29 Appendix Table 7. Graduate Program Size, by Degree Type for Top Ranked ADPCCJ Programs........................ 30 Appendix Table 8. GRE Scores for Newly Admitted Doctoral Students, Top Ranked ADPCCJ Programs. ....... 35 Appendix Table 9. Degree Background Percentages for Newly Admitted Master’s and Doctoral Students for Top Ranked ADPCCJ Programs. ........................................................................................................................................ 35 Appendix C Tables Appendix C Table 1. Race/Ethnicity Composition of Master's Students…………………..…………………...45 Appendix C Table 2. Race/Ethnicity Composition of Doctoral Students…………………..………………….46

4
List of Figures Figure 1. CCJ Faculty Members by Gender and Race/Ethnicity. .................................................................................... 8 Figure 2. Tenure Status of Full-Time Faculty. ..................................................................................................................... 9 Figure 3. CCJ Faculty Members by Rank. ............................................................................................................................ 9 Figure 4. Undergraduate Majors (N = 29,814) Standardized by Full-Time Faculty Size (N = 739). ....................... 13 Figure 5. Gender (N = 2,430) and Race/Ethnicity (N = 2,432) of Active Master’s Students. ................................. 14 Figure 6. Gender (N = 1,187) and Race/Ethnicity (N = 1,164) of Active Doctoral Students. ................................. 15 Figure 7. Employment of 2018-2019 Graduates of ADPCCJ Doctoral Programs (N = 38 Programs, 146 Graduates)................................................................................................................................................................................ 15 Figure 8. Acceptance Rate (N = 1,042) for Applications Submitted (N = 1,468) to Master's Programs (Traditional). ............................................................................................................................................................................ 16 Figure 9. Enrollment Rate (N = 702) for Persons Accepted (N = 1,062) to Master's Programs (Traditional) ...... 17 Figure 10. Acceptance Rate (N = 849) for Applications Submitted (N = 1,159) to Master's Programs (Distance Learning). ................................................................................................................................................................................. 17 Figure 11. Enrollment Rate (N = 630) for Persons Accepted (N = 849) to Master's Programs (Distance Learning). ................................................................................................................................................................................. 18 Figure 12. Admission Rate (N = 411) for Applications Submitted (N = 1,130) to Doctoral Programs. ................ 18 Figure 13. Enrollment Rate (N = 201) for Persons Accepted (N = 411) to Doctoral Programs ............................. 19 Figure 14. Basic Doctoral Stipends (N = 36)..................................................................................................................... 21 Figure 15. Most Lucrative Doctoral Stipends (N = 33). .................................................................................................. 21 Figure 16. Basic Master's Stipends (N = 23). ..................................................................................................................... 22 Figure 17. Most Lucrative Master's Awards (N = 23). ..................................................................................................... 22 Figure 18. Comprehensive Exam Format (N = 37)………………………………………………………………………….23 Appendix A Figures Appendix Figure 1. CCJ Faculty Members by Gender (N = 142) and Race/Ethnicity, Top Ranked ADPCCJ Programs. ................................................................................................................................................................................. 26 Appendix Figure 2. Tenure Status of Full-Time Faculty (N = 142), Top Ranked ADPCCJ Programs. ................. 26 Appendix Figure 3. CCJ Faculty Members (N = 148) by Rank, Top Ranked ADPCCJ Programs. ........................ 27 Appendix Figure 4. Undergraduate Majors (N = 7,621) Standardized by Full-Time Faculty Size (N = 148), Top Ranked ADPCCJ Reporting Programs. .............................................................................................................................. 29 Appendix Figure 5. Gender (N = 858) and Race/Ethnicity (N = 878) of Active Master’s Students for Top Ranked ADPCCJ Program Respondents. .......................................................................................................................... 30 Appendix Figure 6. Gender (N = 339) and Race/Ethnicity (N = 341) of Active Doctoral Students for Top Ranked ADPCCJ Program Respondents. .......................................................................................................................... 31 Appendix Figure 7. Employment of Recent CCJ Graduates for Top Ranked ADPCCJ Programs (N = 5 Programs, 44 Graduates). ...................................................................................................................................................... 31 Appendix Figure 8. Acceptance Rate (N = 196) for Applications Submitted (N = 302) to Master's Programs (Traditional) at Top Ranked ADPCCJ Doctoral Programs. ........................................................................................... 32 Appendix Figure 9. Enrollment Rate (N = 125) for Persons Accepted (N = 196) to Master's Programs (Traditional) at Top Ranked ADPCCJ Doctoral Programs. ........................................................................................... 32 Appendix Figure 10. Acceptance Rate (N = 437) for Applications Submitted (N = 396) to Master's Programs (Distance Learning) at Top Ranked ADPCCJ Doctoral Programs. .............................................................................. 33 Appendix Figure 11. Enrollment Rate (N = 300) for Persons Accepted (N = 437) to Master's Programs (Distance Learning) at Top Ranked ADPCCJ Ph.D. Programs. .................................................................................... 33 Appendix Figure 12. Acceptance Rate (N = 132) for Applications Submitted (N = 416) to Top Ranked Doctoral Programs. ................................................................................................................................................................................. 34 Appendix Figure 13. Enrollment Rate (N = 55) for Persons Accepted (N = 132) to Top Ranked ADPCCJ Doctoral Programs. ................................................................................................................................................................ 34 Appendix Figure 14. Basic Doctoral Stipends at Top Ranked ADPCCJ Reporting Programs (N = 7). ................. 35 Appendix Figure 15. Most Lucrative Doctoral Awards at Top Ranked ADPCCJ Programs (N = 7). .................... 36

5
Appendix Figure 16. Basic Master's Stipends at Top Ranked ADPCCJ Programs (N = 2). ..................................... 36 Appendix Figure 17. Most Lucrative Master's Stipends at Top Ranked ADPCCJ Programs (N = 3). ................... 37 Appendix C Figures Appendix Figure 1. Trends in Percentage of Tenured Faculty…………………..…………………………...…40 Appendix Figure 2. Trends in Number of New Hires (Assistant Professor Positions)…………………...……..41 Appendix Figure 3. Trends in Number of New Hires (Associate Professor Positions)…………………...…….41 Appendix Figure 4. Trends in Number of New Hires (Full Professor Positions)…………………...…………..42 Appendix Figure 5. Median 9 Month Salary for Assistant Professors…………………..………………………42 Appendix Figure 6. Median 9 Month Salary for Associate Professors…………………...……………………...43 Appendix Figure 7. Median 9 Month Salary for Full Professors…………………..……………………………43 Appendix Figure 8. Mean Number of Undergraduate Criminal Justice Majors in ADPCCJ Programs ………...44 Appendix Figure 9. Mean Number of Criminal Justice Majors by Program……………………………………44 Appendix Figure 10. Gender Composition of Master’s Students………………..….…………………....……..45 Appendix Figure 11. Gender Composition of Doctoral Students…………………..………………….….……46 Appendix Figure 12. Number of Applications Received for Master’s Programs……………………………….47 Appendix Figure 13. Mean Number of Master’s Applications Received by Program……..………………….....47 Appendix Figure 14. Mean Percentage of Applicants Admitted to Master’s Programs….…………………...…48 Appendix Figure 15. Mean Percentage of Admitted Students Enrolled in Master’s Programs……………….....48 Appendix Figure 16. Number of Applications Received for DL Master’s Programs............................…………...49 Appendix Figure 17. Mean Number of DL Master’s Applications Received by Program………………………49 Appendix Figure 18. Mean Percentage of Applicants Admitted to DL Master’s Programs…………………......50 Appendix Figure 19. Mean Percentage of Admitted Students Enrolled in DL Master’s Programs……………...50 Appendix Figure 20. Number of Applications Received for Doctoral Programs…………………..…………...51 Appendix Figure 21. Mean Number of Doctoral Applications Received by Program………………………….51 Appendix Figure 22. Mean Percentage of Applicants Admitted to Doctoral Programs…………………..…….52 Appendix Figure 23. Mean Percentage of Admitted Students Enrolled in Doctoral Programs…………………52

6
Association of Doctoral Programs in Criminology & Criminal Justice (ADPCCJ) 2019 Survey Report Purpose
The Association of Doctoral Programs in Criminology and Criminal Justice (ADPCCJ) is comprised of universities and colleges offering the doctorate in criminal justice, criminology, and related areas of study. The ADPCCJ was developed in the late 1970s, and has become more formally organized in the last two decades. Membership is open to all institutions that currently have or are developing a doctoral program in criminology, criminal justice, or a closely related discipline. The members meet twice per year (in conjunction with the American Society of Criminology and Academy of Criminal Justice Sciences conferences), conduct an annual survey of doctoral program activities, and work to advance the study of crime and justice. As outlined in the Association’s charter (see www.adpccj.com/charter.html), the primary purpose of the ADPCCJ is to “promote doctoral education with a primary focus on crime and justice.”
A key function of the ADPCCJ is to collect and disseminate information that will aid in the advancement of doctoral education in crime and justice. Since 1998, the ADPCCJ has fielded an annual survey of doctoral programs and publically disseminated the results (reports are available at www.adpccj.com). In addition, Frost and Clear (2007, Journal of Criminal Justice Education, 18: 35-52) describe the history of CCJ doctoral programs and summarize ADPCCJ survey results from the late 1990s through the mid-2000s. During the spring of 2019, the ADPCCJ Executive Board distributed a survey to all active member programs. The current report outlines the aggregated results from the 2019 ADPCCJ survey.
This report begins with a brief overview of the programs that reported data to ADPCCJ, followed by details regarding their faculty, graduate programs, enrollment, and financial data. In response to requests for information on “top” Criminology and Criminal Justice programs, this report includes an appendix that summarizes data for the top 7 programs according to the 2018 U.S. News & World Report including University of Maryland – College Park, University at Albany-SUNY, University of California – Irvine, University of Cincinnati, Arizona State University, Florida State University, and the University of Missouri-St. Louis (for a listing of all 2019 rankings for Criminology and Criminal Justice programs, see: https://www.usnews.com/best-graduate-schools/top-humanities-schools/criminology-rankings). Appendix B lists the current program members of the ADPCCJ. Appendix C includes trends in ADPCCJ programs since 2010. This includes trends in faculty and student demographics, faculty salaries and new hires, and admittance and enrollment in master’s and doctoral programs.
Overview of ADPCCJ Criminology and Criminal Justice Programs
The thirty-eight programs that participated in the 2019 ADPCCJ survey are listed in Table 1. Programs are located throughout the United States, spanning 26 US states, 17 of which are located in the Southern region, 4 in the West, 9 in the Midwest, and 7 in the Northeast. One program is located outside of the United States, specifically in Slovenia. Five members of the ADPCCJ are not included in these results, yielding an 88% participation rate.

7
Table 1. Participating Programs (N = 38). American University University of Arkansas – Little Rock Arizona State University University of California – Irvine
Florida State University University of Central Florida George Mason University University of Cincinnati Georgia State University University of Florida Indiana University University of Illinois – Chicago Indiana University of Pennsylvania University of Louisville
John Jay College of Criminal Justice University of Maribor Michigan State University University of Maryland North Dakota State University University of Massachusetts – Lowell Northeastern University University of Missouri – St. Louis Old Dominion University University of Nebraska – Omaha Prairie View A&M University University of Nevada – Las Vegas Rutgers University - Newark University of New Haven Sam Houston State University University of South Carolina Southern Illinois University – Carbondale University of South Florida Texas Southern University University of Texas – Dallas Texas State University – San Marcos University of Wisconsin – Milwaukee University at Albany – SUNY Washington State University
In 2019, the survey respondents (N = 38 programs) collectively employed 738 full-time faculty members and
reported serving 29,814 criminology and criminal justice undergraduate majors and 3,785 graduate students actively pursuing advanced degrees (i.e., master’s and doctoral degrees). Relevant timeframes are indicated throughout the report but typically faculty data reference status at the time of the survey (Spring 2019). Other items (i.e., courses taught, student data) refer to the 2018-2019 academic year. We begin by presenting results for key attributes of the faculties represented in the participating programs, followed by a summary of programs and their graduate students. Sample sizes vary across the items subsequently discussed due either to relevance (e.g., programs with only Ph.D. programs did not provide responses to questions about master’s programs) or non-response. Sample sizes are noted.
CCJ Faculty Related Information Reported in the 2019 ADPCCJ Survey Demographic Composition
The median full-time faculty size in 2019 for the 38 programs was 18 faculty members (this includes full professors, associate professors, assistant professors, instructors, and other full-time faculty). The smallest CCJ doctoral program, as measured by the number of full-time faculty members, included 7 faculty members, while the largest program employed 64 full-time faculty members. As Figure 1 shows, about 81 percent of faculty members from responding institutions are non-Latinx white, approximately 6 percent were identified as non-Latinx black, with the remaining approximately 13% identified as belonging to another racial or ethnic group. About 57 percent of the full-time faculty members of the ADPCCJ reporting programs are male.

8
Figure 1. CCJ Faculty Members by Gender1 and Race/Ethnicity.2
1 Gender (N = 671) data provided by 37 programs. 2 Race/ethnicity (N = 670) data provided by 37 programs. Tenure and Rank
The median length of time in service prior to review for tenure and promotion to associate professor in the reporting programs is six years. About 71% of the reporting programs indicated that tenure was considered in the sixth year of employment, but the effective period varied from three years to seven years across programs.
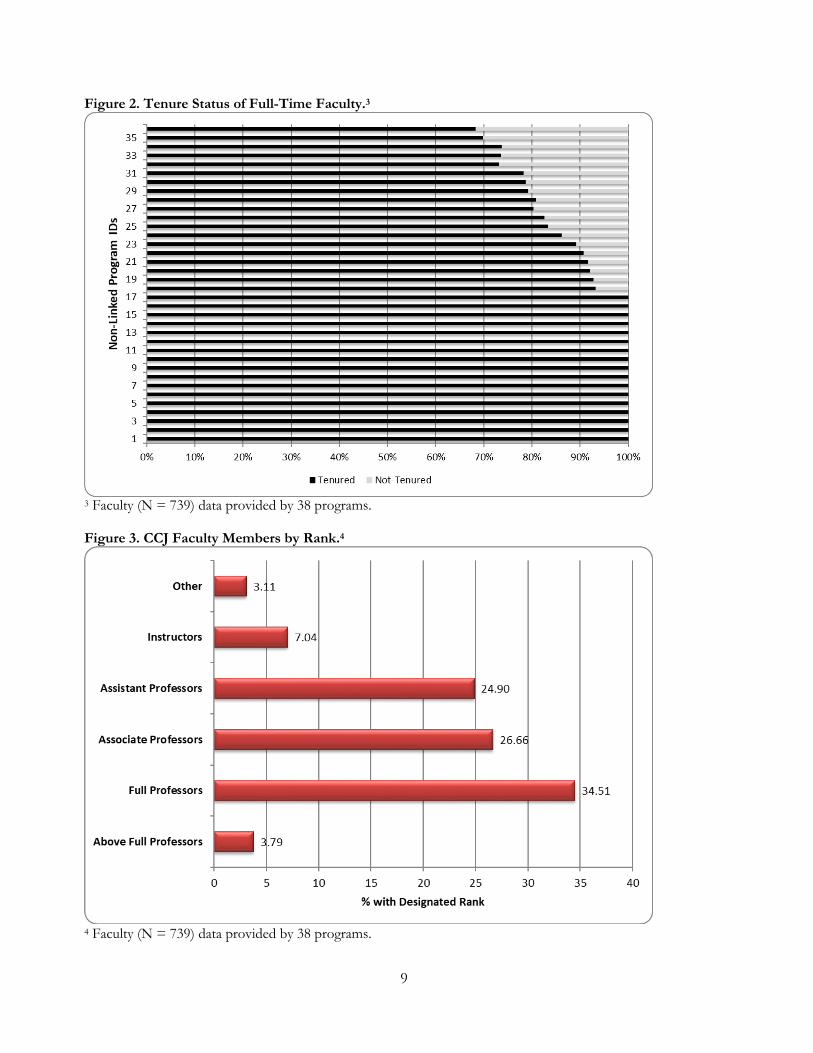
The vast majority of full-time faculty members in the reporting programs are tenured or on the tenure-track. Approximately 62% of full-time faculty members are tenured, and in only three programs are more than 40% of full-time faculty members in non-tenured or non-tenure track positions. As Figure 2 shows, significant variation across programs exists in the percentage of full-time faculty who are tenured and untenured.1
A similar trend emerges with faculty rank. As Figure 3 reveals, the most prevalent rank among the reporting
programs is full professor, followed by associate professor, assistant professor, and finally instructors and others. Variation exists across programs. In some programs only 19% of faculty are full professors, whereas in other programs over 60% of faculty are full professors. The wide range is similar for the ranks of associate (9% to 50%) and assistant (0% to 63%) professors.
1 Programs are identified only with a number that cannot be linked in any direct way to specific programs.
9
Figure 2. Tenure Status of Full-Time Faculty.3
3 Faculty (N = 739) data provided by 38 programs. Figure 3. CCJ Faculty Members by Rank.4
4 Faculty (N = 739) data provided by 38 programs.

10
Faculty Compensation
The ADPCCJ survey also gathered data on faculty salaries by rank. Table 2 shows the median nine-month salaries for all full professors, associate professors, and assistant professors as well as for recently hired assistant professors across the 32 programs that provided such data. Within each of these categories, the minimum and maximum salaries also are displayed. Table 2 indicates substantial variability in faculty salaries both between and within ranks.
Table 2. Faculty Salaries
Mean Salary
Median Salary
Minimum Salary
Maximum Salary
Current Full Professors (N = 29) $130,850 $129,700 $70,000 $421,524 Current Associate Professors (N = 30) $88,479 $87,681 $51,000 $164,800 Current Assistant Professors (N = 30) $73,800 $73,975 $45,000 $98,000
Most Recently Hired Assistant Professor (N = 32) $72,129 $71,264 $60,000 $98,000
Advising, mentoring, and directing graduate students is a time consuming and important role for graduate
programs. Table 3 demonstrates that an overwhelming majority of graduate directors (92%) are compensated in some way for their oversight of graduate students and programs. On average, faculty receive at least one course release (average is 1.36), a stipend during the academic year (average $3,795), and a summer salary or stipend (average $5,500). Some graduate directors (N = 8) are provided additional conference travel funding with an average additional allocation of $524. Table 3. Graduate Director Compensation (N = 28).
Mean Median Min Max Course Release (N = 28) 1.36 1.00 0.00 4.00 Monetary Stipend – Academic Year (N = 11) $3,795 $2,250 $0 $15,000 Monetary Stipend- Summer (N = 9) $5,500 $5,000 $0 $15,000 Travel support (N = 8) $524 $0 $0 $3,000
The ADPCCJ survey also assessed the typical course-loads and overall distribution of duties across teaching,
service, and research. The majority (74%) of programs (N = 28) indicated that full-time faculty were typically assigned four courses per academic year; a small handful reported higher teaching loads, up to 8 total courses per year. The median number of courses assigned per academic year across these programs was four. Considering work-load more broadly, Table 4 indicates most of the programs expected time distribution for faculty equating to 45% teaching, 38% research, and 17% service. The table also shows that the expected time allocated to each of the three major dimensions of professional scholarship differs significantly across programs.
Table 4. Faculty Time Distribution (N = 36).
Mean Median Min Max Percentage of Time on Research 38% 40% 10% 70% Percentage of Time on Teaching 45% 40% 20% 80% Percentage of Time on Service 17% 20% 0% 33%
In terms of faculty teaching responsibility, substantial variation was found in the number of course sections
offered and the manner in which classes are staffed. As indicated in Table 5, the median number of undergraduate class sections offered in the preceding academic year (2018-2019) was 98, ranging from 28 to 327 across programs.

11
The mean number of master’s classes was 28, ranging from 0 to 142 classes. Also, on average 12 doctoral classes were offered at institutions, ranging from 2 to 34.
Considering the number of full-time faculty members in the reporting programs, these data translate into a
ratio of undergrad sections offered (including online sections) to faculty members that ranges from approximately 2 to 14 across programs and which is, on average, 6.71 for 32 programs. Responding programs also indicated the number of online class sections offered with the number of online undergraduate class sections ranging from 0 to 172. Fewer master’s classes are offered online, with a mean number of 13, which ranged from 0 to 82; although doctoral classes online were more limited with a mean of 0.58, ranging from 0 to only 6 classes. Table 5 reveals also that graduate students frequently teach undergraduate courses (percent includes online courses) in ADPCCJ reporting programs. In a few institutions, only a few undergraduate courses are taught by graduate students, but in several programs more than three-fourths of the undergraduate sections are covered by graduate students and in one instance this figure surpasses 80%. Across all programs, the median percentage of undergraduate sections taught by graduate students is 47%. Table 5. Class Sections Offered by Degree, Relative to Faculty Size and Graduate Student Involvement.
Mean Median Min Max 2018-2019 Undergraduate Class Sections (N = 32) 115 98 28 327 Online Undergraduate Class Sections (N = 29) 31 15 0 175 Ratio of Sections to Faculty (N = 32) 6.71 6.09 1.81 14.10 Percent Taught by Graduate Students (N = 31) 44% 47% 0% 83%
2018-2019 Master’s Class Sections (N = 34) 28 17 0 142 Online Master’s Class Sections (N = 31) 14 7 0 82 Ratio of Sections to Faculty (N = 34) 1.51 1.20 0 5.30 Percent Taught by Graduate Students (N = 30) 18% 9% 0% 100%
2018-2019 Doctoral Class Sections (N = 32) 14 12 2 41 Online Doctoral Class Sections (N = 24) 0.58 0 0 6 Ratio of Sections to Faculty (N = 36) 0.87 0.60 0 4.75 Percent Taught by Graduate Students (N = 31) 6% 0% 0% 100%
A final piece of information gathered on CCJ faculty members in the ADPCCJ survey concerns faculty
scholarly productivity (i.e., publications and grants). Program representatives reported on the number of articles published in peer-reviewed journals and on the number of books published during the previous academic year. The information provided is summarized in Table 6. It is important to note that these estimates make no adjustments for the prestige of the journals in which the articles appear or the quality of the book publisher, but they provide an indication of the overall quantity of publications across programs during the period. The data indicate that the median number of journal articles published per faculty members in these programs was 2, a figure that varied from less than one to about four across programs. For a more detailed account of faculty productivity in doctoral programs, see publications in the Journal of Criminal Justice Education (i.e., Kleck & Barnes (2011) 22: 43-66; Kleck & Mims (2016) Online First: 1-21; Kleck, Wang, & Tark (2007) 18: 385-405).

12
Table 6. Faculty Productivity in Past Year.
Mean Median Min Max Articles and Books Peer Reviewed Journal Articles Published (N = 33) 42.00 38.00 4.00 116.00 Articles Per Faculty Member 2.24 2.09 0.50 4.50 Books Published (N = 33) 3.42 3.00 0.00 15.00 Books Per Faculty Member 0.18 0.17 0.00 0.58
Grant Applications and Awards Competitive National Grants Submitted (N = 31) 11.6 6 0 54 Competitive National Grants Received (N = 31) 5.8 2 0 50
Grant Dollars Received Total Dollars Received Last Fiscal Year (N = 30) $3,390,697 $521,154 $0 $34,826,638 Federal Grant Dollars Received (N = 29) $1,354,341 $367,000 $0 $10,300,000 State and Local Grant Dollars Received (N = 29) $906,836 $100,000 $0 $19,958,963 Foundation Grant Dollars Received (N = 23) $1,403,309 $23,000 $0 $27,000,000 Private Grant Dollars Received (N = 20) $193,534 $0 $0 $3,391,519
Book publications were much less common, with an average of three books published per program, but there was substantial variability between programs. With respect to grants, the ADPCCJ survey reveals that the median number of “competitive national grants” submitted across programs was 11, and the median number of such grants that were funded was 5. Some programs did not receive any of these grants, while others had a very large number of submissions (e.g., as many as 54) and awards (e.g., as many as 50). Not surprisingly, this translated into substantial variation in the amount of grant funds received by CCJ programs surveyed, as illustrated in the bottom of Table 6. CCJ Student Information Reported in the 2019 ADPCCJ Survey Active Students
The ADPCCJ survey elicits a wide array of information on the students who apply for, enroll in, and pursue studies at the responding programs. As noted above, the thirty-eight programs that participated in the 2019 ADPCCJ collectively serve 29,814 criminology and criminal justice undergraduate majors, 2,598 students actively pursuing master’s degrees, and 1,187 students actively pursuing doctoral degrees.
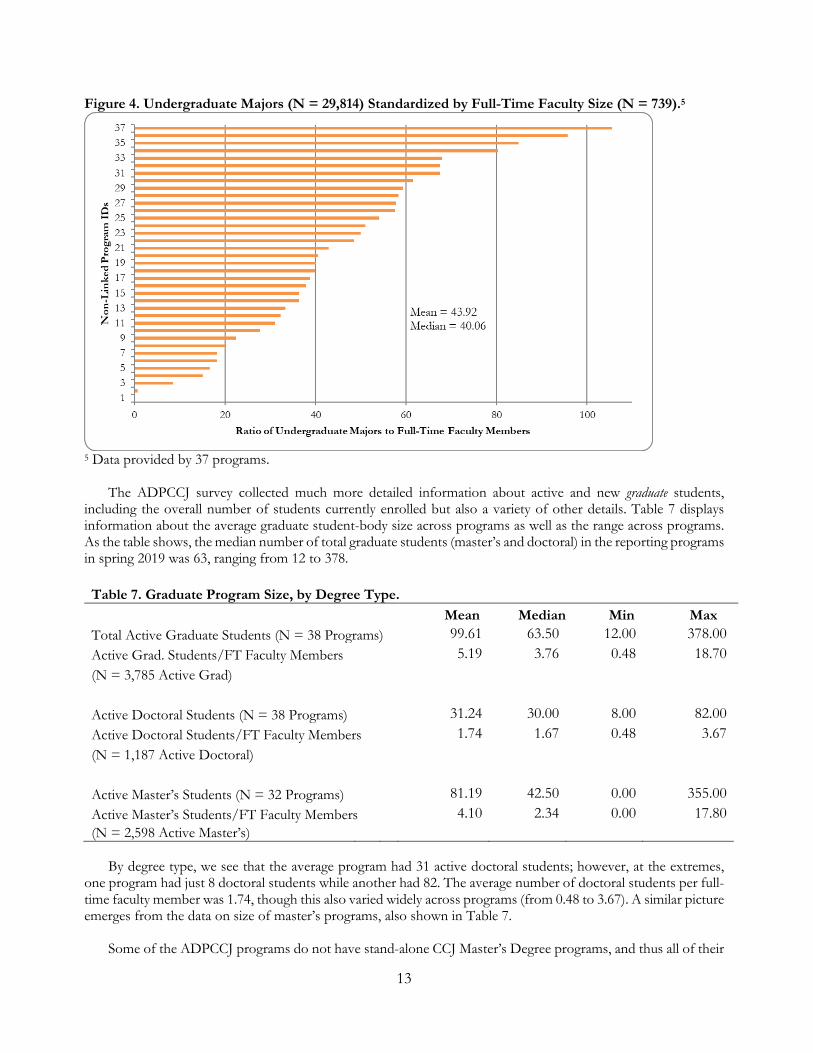
The median number of undergraduate majors across the 36 programs that provided the relevant data is 669,
but this varies across programs from 7 to 2,955. Programs differ significantly in the number of full-time faculty employed, so data on the number of undergraduate majors are standardized by faculty size. Figure 4 shows the ratio of undergraduate majors to full-time faculty for the 37 programs that provided data. As noted in the figure, the median student-to-faculty ratio for the reporting programs during the reference period (Spring 2019) was 40, but the ratio ranged from 0.70 to 106 across programs.
13
Figure 4. Undergraduate Majors (N = 29,814) Standardized by Full-Time Faculty Size (N = 739).5
5 Data provided by 37 programs.
The ADPCCJ survey collected much more detailed information about active and new graduate students, including the overall number of students currently enrolled but also a variety of other details. Table 7 displays information about the average graduate student-body size across programs as well as the range across programs. As the table shows, the median number of total graduate students (master’s and doctoral) in the reporting programs in spring 2019 was 63, ranging from 12 to 378. Table 7. Graduate Program Size, by Degree Type.
Mean Median Min Max Total Active Graduate Students (N = 38 Programs) 99.61 63.50 12.00 378.00 Active Grad. Students/FT Faculty Members 5.19 3.76 0.48 18.70 (N = 3,785 Active Grad)
Active Doctoral Students (N = 38 Programs) 31.24 30.00 8.00 82.00 Active Doctoral Students/FT Faculty Members 1.74 1.67 0.48 3.67 (N = 1,187 Active Doctoral)
Active Master’s Students (N = 32 Programs) 81.19 42.50 0.00 355.00 Active Master’s Students/FT Faculty Members 4.10 2.34 0.00 17.80 (N = 2,598 Active Master’s)
By degree type, we see that the average program had 31 active doctoral students; however, at the extremes,
one program had just 8 doctoral students while another had 82. The average number of doctoral students per full-time faculty member was 1.74, though this also varied widely across programs (from 0.48 to 3.67). A similar picture emerges from the data on size of master’s programs, also shown in Table 7.
Some of the ADPCCJ programs do not have stand-alone CCJ Master’s Degree programs, and thus all of their

14
graduate students are pursuing doctoral degrees. Most programs contain a mix of doctoral and master’s students, and overall the average mix is roughly even between the two groups, with master’s students more represented (69%) than doctoral students (31%) among those pursuing graduate studies. Both groups exhibit similar demographic attributes, as illustrated in Figures 5 and 6. Similar to faculty data presented earlier, the vast majority of graduate students in CCJ (as reported by programs that participated in the ADPCCJ survey) are non-Latinx white. Unlike the pattern observed for full-time faculty, a majority of graduate students in the programs that reported to ADPCCJ are female.
The ADPCCJ survey also elicited information on the status of doctoral students and recent graduation patterns. One dimension of the former is whether doctoral students active in the year preceding the survey were still enrolled and, if not, the reasons for the ‘disappearance’ of those no longer enrolled. The 2019 ADPCCJ data indicate that this form of student attrition is relatively rare. The median response to the question of how many students had been enrolled in 2017-2018 but were no longer enrolled in 2018-2019 was 1 student, and in the majority of cases in which students dropped out (N = 63) they did so prior to comprehensive exams (N = 34). Additionally, some left the university all but dissertation (N = 12), or personally decided to leave graduate school (N = 40), with 20 students failing to pass examinations. Figure 5. Gender (N = 2,430)6 and Race/Ethnicity (N = 2,432)7 of Active Master’s Students.
6 Data provided by 31 programs. 7 Data provided by 30 programs.

15
Figure 6. Gender (N = 1,187)8 and Race/Ethnicity (N = 1,164)9 of Active Doctoral Students.
8 Data provided by 38 programs and three students were identified as transgender. 9 Data provided by 36 programs.
With respect to graduation patterns, the ADPCCJ data indicate that the reporting programs combined to confer master’s degrees (N = 27) to 1,178 graduate students and doctoral degrees (N = 38) to 146 graduate students in 2018-2019. About one-quarter (24.14%) of the doctoral graduates during this period first enrolled in the fall of 2014 or after, completing the degree in five years or less. Overall, approximately 55% of these recent graduates completed their degrees in seven years; the remainder took longer than seven years to complete their degrees. Enrollment semesters for doctoral graduates range from spring of 1999 to fall of 2016.
Figure 7 shows that not only is the employment rate among recent graduates very high—83% are known to
be employed in a tenure-track academic position, a local, state, or federal research agency, or a private research firm – but also that academic positions are by far the most prevalent mode of employment for almost 62% of graduates.
Figure 7. Employment of 2018-2019 Graduates of ADPCCJ Doctoral Programs (N = 38 Programs, 146 Graduates).

16
Incoming Students The 2019 ADPCCJ survey gathered information on new graduate students who enrolled in the 2018-2019 academic year. The 32 participating programs that provided data on master’s students received an aggregate total of 2,627 applications from prospective students, with application counts ranging from 0 to 395 across programs. Data on new master’s students were separated by traditional master’s students (i.e., those who attend class in person) and distance learning (DL) master’s students (i.e., those who take classes online). The 32 programs that provided data on traditional master’s students received an aggregate total of 1,468 applications from prospective students, with application counts ranging from 0 to 140. Programs that provided data on DL master’s students (N = 18) reported receiving 1,159 applications, with counts ranging from 0 to 341. The 36 programs that responded to similar questions about doctoral programs took in 1,130 applications for doctoral study, ranging from a low of 0 to a high of 94. No programs reported receiving doctoral DL applications.
Figures 8 through 11 summarize the program-specific (non-identified) acceptance rates (i.e. the percentage of applications received that resulted in a decision to admit) and enrollment rates (i.e., the percentage of admitted students who subsequently enrolled) for master’s (traditional and DL) and doctoral programs, respectively.
Overall, for the 30 programs that provided data on applications and admissions decisions for traditional
master’s programs, the median acceptance rate was 68.29%. Figure 8 shows that such acceptance rates varied widely across programs, ranging from 0% to 95%. Figure 9 also reveals substantial variation in enrollment rates for those accepted into traditional master’s programs; the median enrollment rate was 62.22%, ranging from 37.5% to 100%. The average acceptance and enrollment rates for DL master’s programs were higher than for traditional master’s programs. Figure 8. Acceptance Rate (N = 1,042) for Applications Submitted (N = 1,468) to Master's Programs (Traditional).10
10 Data provided by 30 programs.

17
Figure 9. Enrollment Rate (N = 702) for Persons Accepted (N = 1,062) to Master's Programs (Traditional).11
11 Data provided by 30 programs. Figure 10. Acceptance Rate (N = 849) for Applications Submitted (N = 1,159) to Master's Programs (Distance Learning).12
12 Data provided by 12 programs.

18
Figure 11. Enrollment Rate (N = 630) for Persons Accepted (N = 849) to Master's Programs (Distance Learning).13
13 Data provided by 12 programs.
For the 11 programs that provided data on admission decisions for DL master’s programs, the median acceptance rate was 76.18%. Figure 10 shows that acceptance rates varied from 57.14% to 97.06% across reporting programs. Figure 11 shows that the median enrollment rate for DL master’s programs was 79.75% and ranged from 34.41% to 100%. Average acceptance rates were lower for doctoral programs than traditional master’s programs (46% vs. 68%), with considerable variation across programs, (see Figure 12). While more than forty-five percent of applicants in the 35 participating programs were accepted, in some programs less than 15% of applicants were admitted, while in others 100% were admitted. Figure 12. Admission Rate (N = 411) for Applications Submitted (N = 1,130) to Doctoral Programs.14
14 Data provided by 35 programs.

19
As shown in Figure 13, the median enrollment rate for the 35 programs that provided the data was 55%, but this figure ranged from 0% to 100% (all of the accepted Ph.D. students enrolled).
Figure 13. Enrollment Rate (N = 201) for Persons Accepted (N = 411) to Doctoral Programs.15
15 Data provided by 35 programs.
The average undergraduate grade point average (GPA) for newly admitted doctoral students in ADPCCJ reporting programs was 3.49, varying from 3.00 to 3.79 across programs (N = 32). Graduate GPAs ranged from 3.47 to 3.98 with an average of 3.76. ADPCCJ respondents provided the information summarized in Table 8 in response to questions about the average GRE scores among recently admitted doctoral students. As illustrated in Table 8, the median “average GRE combined” score across programs was 304, ranging from 285 to 322. Table 8. GRE Scores and Percentiles for Newly Admitted Doctoral Students.
GRE Scores (N = 22) Mean Median Low High Average GRE Verbal 154 154 142 162
Average GRE Quantitative 149 150 139 159 Average GRE Analytic Writing 3.99 4.00 3.00 5.00
Average GRE Combined 304 304 285 322 Percentiles (N = 22)
Average GRE Percentile Verbal 61.74% 63.50% 17.00% 88.00% Average GRE Percentile Quantitative 36.93% 37.50% 6.00% 72.00%
Average GRE Percentile Analytic Writing 58.41% 61.50% 18.00% 83.00%
Additional degree background information was provided for incoming master’s and doctoral students in both traditional and distance learning programs. The majority of new master’s (96%) and master’s DL (96%) students had previously received either a Bachelor’s of Science or Arts at their previous institutions. Furthermore, the majority of newly admitted doctoral students had mainly been granted Master of Art or Science degrees (72%). As further illustrated by Table 9, some variation did exist in background degree type for all students.

20
Table 9. Degree Background Percentages for Newly Admitted Master’s and Doctoral Students. BS BA MA MS JD LLM MPH PhD New Master’s Students (N = 24) 52% 45% 2% 1% 0% 0% 0% 0% New Master’s DL (N = 10) 62% 34% 2% 2% 0% 0% 0% 0% New Doctoral Students (N = 29) 8% 12% 33% 44% 2% 1% 0% 0%
Note: BS = Bachelor of Science; BA = Bachelor of Arts; MA = Master of Science; MS = Master of Arts; JD = Juris Doctor; LLM = Master of Laws; MPH = Master of Public Health (includes Master of Public Administration); PhD = Doctor of Philosophy.
The ADPCCJ survey indicated that 578 new students enrolled in traditional master’s programs across the 24 programs that provided such data (461 DL master’s students enrolled across the 11 reporting programs). In total, 195 new doctoral students enrolled across the 30 programs that reported such data (no DL doctoral students enrolled in any reporting programs). Approximately 61% of new doctoral and 76% of new traditional master’s enrollments are studying full-time, while only approximately 57% of new DL master’s students are studying full-time.
The gender, race, and ethnic composition of these incoming cohorts of graduate students were similar to the
patterns shown above for all active students (see Figures 5 & 6). The reporting programs indicated that for master’s degree programs, the majority of incoming students were female (the median was 63.5% female for traditional master’s programs and 60% female for DL master’s programs) and non-Latinx white (the median was 58% non-Latinx white). Incoming cohorts of Ph.D. students also exhibited quite a bit of variability across programs in race, ethnic, and gender composition; overall the medians were 71% female and 75% non-Latinx white.
A large majority of newly admitted doctoral students in the 2019 ADPCCJ reporting programs received tuition
remission and were funded as either a research or teaching assistant (or both). Overall, 75% of active doctoral students in the 37 programs that reported data on funding sources were funded through a teaching or research assistantship. While some programs relied exclusively on teaching assistantships and others relied exclusively on research assistantships, these forms of funding contribute about equally to those supported by non-grant financial resources across all programs. About 15% of active doctoral students were supported primarily through external grants.
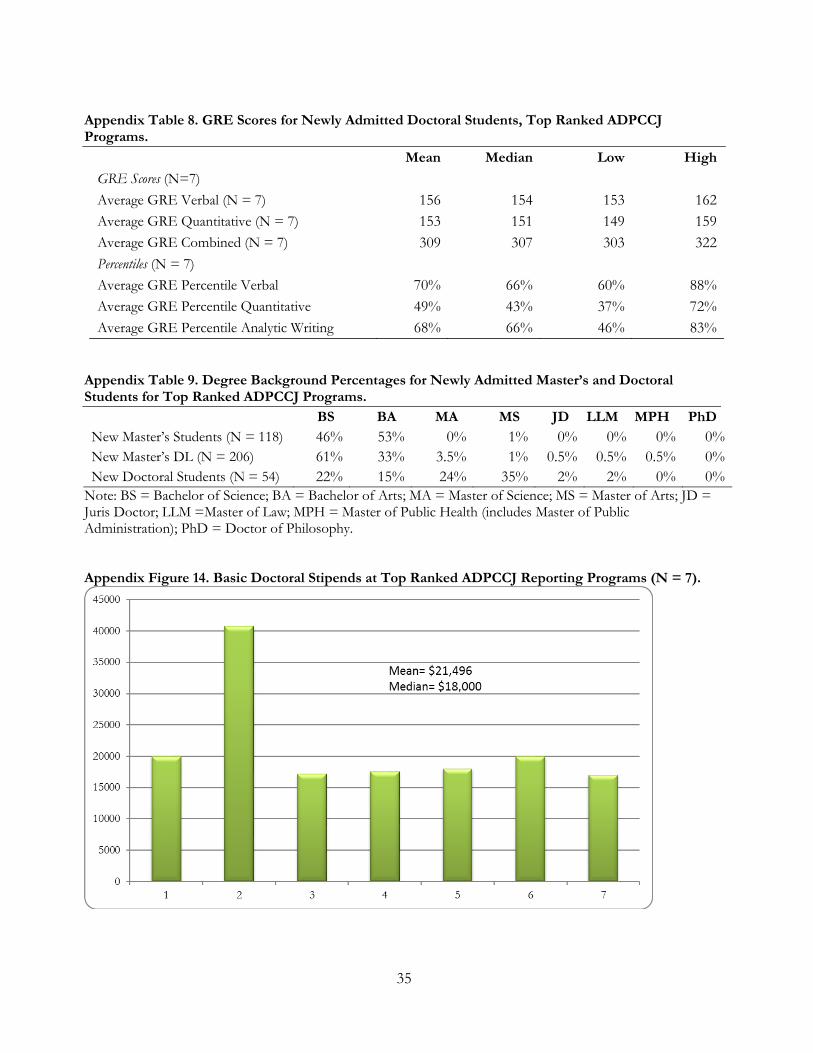
The 2019 ADPCCJ data indicate that the amount of the stipend given to students by programs varied. Figure
14 shows the median “basic stipend” for doctoral students was $18,173, with a range from $7,500 to $40,769. In terms of “most lucrative” awards, the average award across programs is $24,887, though as Figure 15 shows there is again substantial variability across programs from $10,000 to $65,770.

21
Figure 14. Basic Doctoral Stipends (N = 36).
Figure 15. Most Lucrative Doctoral Stipends (N = 33).
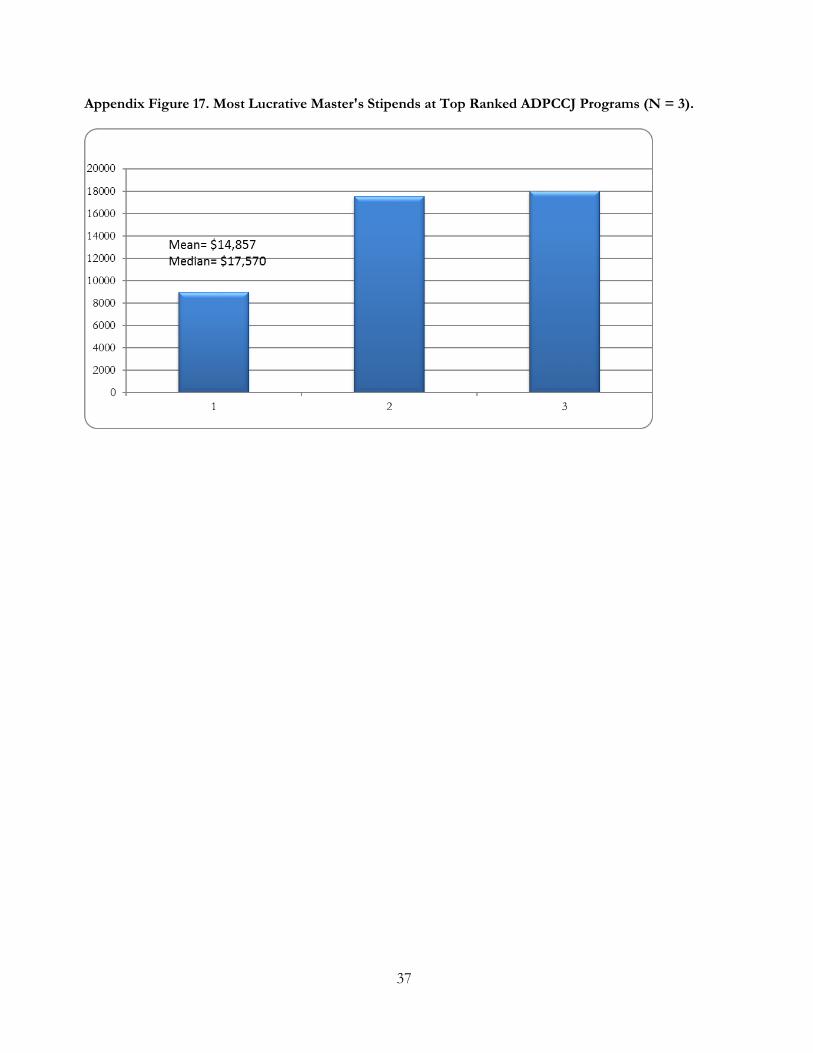
Similarly, Figures 16 and 17 present the awards for master’s students. As Figure 16 shows the median basic stipend was $8,000 for master’s students across the 23 programs that reported data. At the other extreme, some programs provide funding for master’s students that is comparable to typical funding levels for doctoral students. Additionally, as Figure 17 shows, a few programs reserve some significant awards (e.g., $18,000) for especially promising master’s students although the average most lucrative master’s funding was $9,087.

22
Figure 16. Basic Master's Stipends (N = 23).
Figure 17. Most Lucrative Master's Awards (N = 23).
Program Requirements About 92% (N = 34) of the 37 programs that offer master’s degrees require 30 to 36 credits for degree completion. The median number of credit hours designated for required/core courses is 15. The median number of credit hours designated for elective course is 15. The median number of thesis credit hours required is 4, ranging from 0 to 6 hours. Completing a thesis is an optional track in about 81% of programs (N = 30). The other 19% of programs (N = 7) require the completion of a thesis to be eligible for graduation. Ph.D. requirements range from 36 credits to 96 credits, depending on whether the student enters the program having already completed a master’s degree. Approximately 50 percent of programs require between 54 and 60 credits for degree completion. The median number of required credit hours for doctoral students is 60. Of these, the median number of credit hours designated for required/core courses is 27. The median number of

23
credit hours designated for elective courses is 16. The median number of required dissertation hours is 12. All of the programs that responded to the question regarding the format of the dissertation (N = 37) allow for a traditional dissertation option. Nineteen percent (N = 7) of programs also allow for a multiple paper option in lieu of a traditional dissertation. The overwhelming majority (94.7%) of programs require a comprehensive or qualifying exam for completion of a doctoral degree. The format of the comprehensive exam varies widely by program (N = 37). Only two programs do not require a comprehensive exam. As Figure 18 indicates, about 49% of programs require a written exam (N = 18), 22% require a research paper (N = 8), 22% require a take home exam (N = 8), and 8% require both a written exam and a research paper (N = 3). About 13.5% (N = 5) of the programs also require students to complete an oral defense of their work after completing the exam requirement. Figure 18. Comprehensive Exam Format (N = 37)
Additionally, 27% of the programs (N = 10) offer areas of concentration spanning 18 topics. All of the programs that offer areas of concentration have at least two options and some have as many as six. As Table 10 indicates, policing is the most common area of concentration offered (N = 5). Criminal Justice (N = 4) and Corrections (N = 4) are also offered often.

24
Table 10. Areas of Concentration Offered Areas of Concentration Number of Programs Policing 5 Criminal Justice 4 Corrections 4 Criminology 2 Law and Society 2 Public Policy 2 Research Methods 2 Public Administration 1 American Politics 1 Comparative Politics 1 Juvenile Justice 1 Courts 1 Crime Prevention 1 Violence Studies 1 Gender and Women’s Studies 1 Latin American and Latino Studies 1 Investigative Science 1 Criminal Behavior 1
Conclusion
This report provides a snapshot of graduate programs as they looked in 2019. We hope the information summarized above is useful to current ADPCCJ members, others in the CCJ scholarly community, and prospective students and faculty members. Placed in the recent historical context (see, e.g., Frost and Clear, 2007, Journal of Criminal Justice Education), the two dominant themes that emerge from the results described herein are continued growth in the number and size of CCJ doctoral programs and an impressive stability in many of the features highlighted above. Some of the data elements summarized in this report (e.g., funding sources and details for graduate students, class sections offered, tenure time-lines) only recently were added to the ADPCCJ survey, so we do not have a good indication of how the reported figures compare with previous eras, but by and large the snap-shot of CCJ doctoral programs provided above is highly similar to what we have seen in the survey over the past several years. For additional information, please visit the ADPCCJ website (www.adpccj.com).

25
Appendix A. Summary Data from 2019 ADPCCJ Survey for Programs Ranked in Top 5 by U.S. News & World Report.2
According to U.S. News & World Report, the ranking of doctoral programs in Criminology and Criminal Justice were based on the result of peer assessment surveys. Schools offering doctoral programs in Criminology and Criminal Justice were sent surveys in which department heads, directors of graduate studies, or senior faculty members were asked to rate the academic quality of other institution’s doctoral programs. ADPCCJ provided the list of schools to be surveyed (N = 44). Questionnaires were based on a 5-point scale: outstanding (5), strong (4), good (3), adequate (2), and marginal (1). Once surveys were returned, a trimmed mean was computed to determine the scores for each school, and schools were then ranked in descending order. There was an overall response rate of 90% for the Criminology programs surveyed (for a complete description of the methodology used, see https://www.usnews.com/best-graduate-schools/top-humanities-schools/criminology-rankings. Appendix Table 1. ADPCCJ Programs with Top 5 Rankings in 2019 U.S. News & World Report (N = 7)
Rank School 1 University of Maryland – College Park 2 University at Albany, SUNY 3 University of California – Irvine 3 University of Cincinnati 5 Arizona State University 5 Florida State University 5 Pennsylvania State University* 5 University of Missouri – St. Louis
*Not included in analyses
2 The table and figure numbers listed below parallel those for all reporting programs in full report.

26
Appendix Figure 1. CCJ Faculty Members by Gender (N = 142) and Race/Ethnicity, Top Ranked ADPCCJ Programs.16
16 Data provided by 7 programs. Appendix Figure 2. Tenure Status of Full-Time Faculty (N = 142), Top Ranked ADPCCJ Programs.17
17 Data provided by 7 programs.

27
Appendix Figure 3. CCJ Faculty Members (N = 148) by Rank, Top Ranked ADPCCJ Programs.18
18 Data provided by 7 programs. Appendix Table 2. Faculty Salaries for Top Ranked ADPCCJ Reporting Programs.
Mean Median Minimum Maximum Salary Salary Salary Salary
Current Full Professors (N = 7) $146,669 $142,163 $91,700 $334,597 Current Associate Professors (N = 7) $92,385 $92,901 $76,155 128,995 Current Assistant Professors (N = 7) $71,350 $75,265 $62,700 $87,125 Most Recently Hired Assistant Professor (N = 6) $74,667 $75,500 $65,000 $82,000
Appendix Table 3. Graduate Director Compensation for Top Ranked ADPCCJ Reporting Programs.
Mean Median Min Max
Course Release (N = 6) 1.00 1.00 1.00 1.00
Monetary Stipend-Academic Year (N = 3) $9,000 $10,000 $5,000 $12,000
Monetary Stipend- Summer (N = 3) $4,000 $5,000 $2,000 $5,000 Appendix Table 4. Faculty Time Distribution for Top Ranked ADPCCJ Reporting Programs (N = 7).
Mean Median Min Max Percentage of Time on Research 45% 45% 30% 70% Percentage of Time on Teaching 43% 45% 20% 60%
Percentage of Time on Service 12% 10% 5% 20%

28
Appendix Table 5. Class Sections Offered by Degree, Relative to Faculty Size and Graduate Student Involvement for Top Ranked ADPCCJ Reporting Programs.
Mean Median Min Max
2018-2019 Undergraduate Class Sections (N = 7) 130.1 104.0 57.0 327.0 Online Undergraduate Class Sections (N = 7) 30.6 10.0 0.0 119.0 Ratio of Sections to Faculty (N = 7) 6.3 5.1 2.0 12.5 Percent Taught by Graduate Students (N = 6) 43% 36% 7% 78% 2018-2019 Master’s Class Sections (N = 7) 43.3 18.0 7.0 142.0 Online Master’s Class Sections (N = 7) 19.4 8.0 0.0 82.0 Ratio of Sections to Faculty (N = 7) 1.8 1.3 0.5 4.6 Percent Taught by Graduate Students (N = 6) 23% 4% 0% 100% 2018-2019 Doctoral Class Sections (N = 7) 16.43 18.00 4.00 34.00 Online Doctoral Class Sections (N = 6) 1.33 0.00 0.00 5.00 Ratio of Sections to Faculty (N = 7) 0.83 0.62 0.29 1.84 Percent Taught by Graduate Students (N = 6) 19% 0% 0% 100%

29
Appendix Table 6. Faculty Productivity in Past Year for Top Ranked ADPCCJ Programs. Articles and Books (N = 7) Mean Median Min Max Peer Reviewed Journal Articles Published 53.43 58 21 78 Articles Per Faculty Member 2.6 2.3 1.1 3.6 Books Published 4 4 2 8 Books Per Faculty Member 0.2 0.2 0.1 0.3 Grant Applications and Awards (N = 7) Competitive National Grants Submitted 12.14 12 1 29 Competitive National Grants Received 4.29 3 0 13 Grant Dollars Received Total Dollars Received Last Fiscal Year (N = 6) $1,122,592 $557,577 $92,852 $3,070,900 Federal Grant Dollars Received (N = 6) $465,312 $396,622 $88,352 $1,358,527 State and Local Grant Dollars Received (N = 6) $680,304 $306,220 $0 $2,435,500 Foundation Grant Dollars Received (N = 5) $12,600 $0 $0 $40,000 Private Grant Dollars Received (N = 4) $119,789 $104,579 $0 $270,000
Appendix Figure 4. Undergraduate Majors (N = 7,621) Standardized by Full-Time Faculty Size (N = 148), Top Ranked ADPCCJ Reporting Programs.19
19 Data provided by 7 reporting programs.

30
Appendix Table 7. Graduate Program Size, by Degree Type for Top Ranked ADPCCJ Programs.
Mean Median Min Max Total Active Graduate Students (N = 7) 141.43 111.00 49.00 378.00 Active Grad. Students/FT Faculty Members 6.27 5.50 2.17 12.19 (N = 990 Active Grad) Active Doctoral Students (N = 7) 48.57 39.00 25.00 79.00 Active Doctoral Students/FT Faculty Members 2.36 2.17 1.26 3.59 (N = 340 Active Doctoral) Active Master’s Students (N = 6) 108.33 57.50 14.00 339.00 Active Master’s Students/FT Faculty Members 4.57 2.93 1.00 10.94 (N = 650 Active Master’s)
Appendix Figure 5. Gender (N = 858) and Race/Ethnicity (N = 878) of Active Master’s Students for Top Ranked ADPCCJ Program Respondents.20
20 Data provided by 7 programs for race/ethnicity and 7 programs for gender.
31
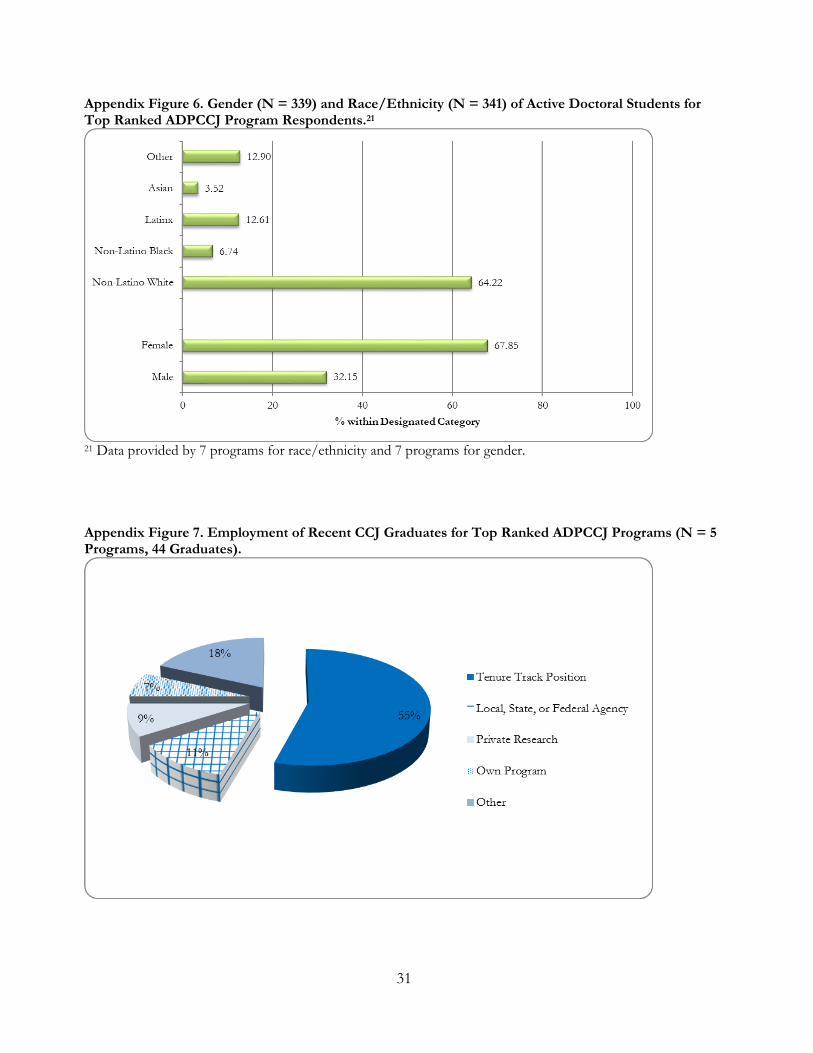
Appendix Figure 6. Gender (N = 339) and Race/Ethnicity (N = 341) of Active Doctoral Students for Top Ranked ADPCCJ Program Respondents.21
21 Data provided by 7 programs for race/ethnicity and 7 programs for gender. Appendix Figure 7. Employment of Recent CCJ Graduates for Top Ranked ADPCCJ Programs (N = 5 Programs, 44 Graduates).

32
Appendix Figure 8. Acceptance Rate (N = 196) for Applications Submitted (N = 302) to Master's Programs (Traditional) at Top Ranked ADPCCJ Doctoral Programs.22
22 Data provided by 6 programs. Appendix Figure 9. Enrollment Rate (N = 125) for Persons Accepted (N = 196) to Master's Programs (Traditional) at Top Ranked ADPCCJ Doctoral Programs.23
23 Data provided by 6 programs.

33
Appendix Figure 10. Acceptance Rate (N = 324) for Applications Submitted (N = 396) to Master's Programs (Distance Learning) at Top Ranked ADPCCJ Doctoral Programs.24
24 Data provided by 3 programs. Appendix Figure 11. Enrollment Rate (N = 206) for Persons Accepted (N = 324) to Master's Programs (Distance Learning) at Top Ranked ADPCCJ Ph.D. Programs.25
25 Data provided by 3 programs.
34
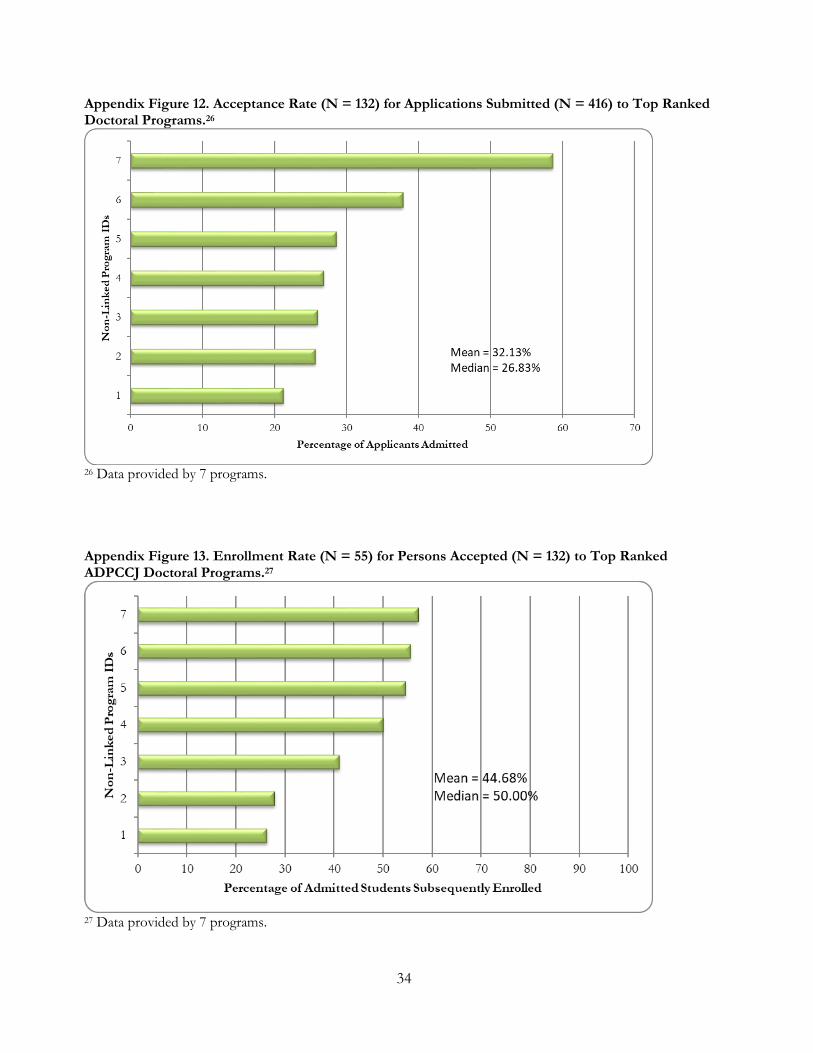
Appendix Figure 12. Acceptance Rate (N = 132) for Applications Submitted (N = 416) to Top Ranked Doctoral Programs.26
26 Data provided by 7 programs. Appendix Figure 13. Enrollment Rate (N = 55) for Persons Accepted (N = 132) to Top Ranked ADPCCJ Doctoral Programs.27
27 Data provided by 7 programs.
35
Appendix Table 8. GRE Scores for Newly Admitted Doctoral Students, Top Ranked ADPCCJ Programs.
Mean Median Low High GRE Scores (N=7) Average GRE Verbal (N = 7) 156 154 153 162 Average GRE Quantitative (N = 7) 153 151 149 159 Average GRE Combined (N = 7) 309 307 303 322 Percentiles (N = 7) Average GRE Percentile Verbal 70% 66% 60% 88% Average GRE Percentile Quantitative 49% 43% 37% 72% Average GRE Percentile Analytic Writing 68% 66% 46% 83%
Appendix Table 9. Degree Background Percentages for Newly Admitted Master’s and Doctoral Students for Top Ranked ADPCCJ Programs. BS BA MA MS JD LLM MPH PhD New Master’s Students (N = 118) 46% 53% 0% 1% 0% 0% 0% 0% New Master’s DL (N = 206) 61% 33% 3.5% 1% 0.5% 0.5% 0.5% 0% New Doctoral Students (N = 54) 22% 15% 24% 35% 2% 2% 0% 0%
Note: BS = Bachelor of Science; BA = Bachelor of Arts; MA = Master of Science; MS = Master of Arts; JD = Juris Doctor; LLM =Master of Law; MPH = Master of Public Health (includes Master of Public Administration); PhD = Doctor of Philosophy. Appendix Figure 14. Basic Doctoral Stipends at Top Ranked ADPCCJ Reporting Programs (N = 7).

36
Appendix Figure 15. Most Lucrative Doctoral Awards at Top Ranked ADPCCJ Programs (N = 7).
Appendix Figure 16. Basic Master's Stipends at Top Ranked ADPCCJ Programs (N = 2).
37
Appendix Figure 17. Most Lucrative Master's Stipends at Top Ranked ADPCCJ Programs (N = 3).

38
Appendix B. List of ADPCCJ Members, 2019.
Member Location
Year of PhD program
establishment Website American University Washington, DC -- http://www.american.edu/spa/jlc/index.cfm Arizona State University Phoenix, AZ 2008 http://ccj.asu.edu California University of Pennsylvania California, PA -- https://www.calu.edu/academics/graduate/doctoral/criminal-
justice/index.aspx Florida State University Tallahassee, FL 1958 www.criminology.fsu.edu/ George Mason University Fairfax, VA 2005 http://cls.gmu.edu/ Georgia State University Atlanta, GA 2010 www.cjgsu.net Indiana University Bloomington, IN 1997 www.indiana.edu/~crimjust/ Indiana University of Pennsylvania Indiana, PA 1988 www.iup.edu/criminology/default.aspx John Jay College of Criminal Justice New York, NY 1981 www.jjay.cuny.edu/ Michigan State University East Lansing, MI -- www.cj.msu.edu/ North Dakota State University Fargo, ND 2003 http://www.ndsu.edu/cjps/ Northeastern University Boston, MA 2004 www.northeastern.edu/sccj/ Old Dominion University Norfolk, VA 2007 http://al.odu.edu/sociology/ Pennsylvania State University University Park, PA 1960 http://sociology.la.psu.edu/graduate/programs/crime-law-and-
justice/the-graduate-program-in-crime-law-and-justice-1 Prairie View A&M University Prairie View, TX 2001 http://www.pvamu.edu/cojjp/graduate/graduate-academics/doctor-of-
philosophy-in-juvenile-justice/ Rutgers University Newark, NJ 1974 http://rscj.newark.rutgers.edu/prospective-students/phd/ Sam Houston State University Huntsville, TX 1970 www.cjcenter.org/ Simon Frasier University Burnaby, B.C.
Canada 1985 www.sfu.ca/criminology/
Southern Illinois University Carbondale, IL 2012 http://cola.siu.edu/ccj/ Temple University Philadelphia, PA 1994 www.temple.edu/cj/ Texas Southern University Houston, TX 2009 http://bjmlspa.tsu.edu/departments/administration-of-justice/ Texas State University San Marcos, TX 2009 www.cj.txstate.edu/ University of Albany, SUNY Albany, NY 1968 www.albany.edu/scj/ University of Arkansas, Little Rock Little Rock, AR -- http://ualr.edu/criminaljustice/ University of California, Irvine Irvine, CA 1991 http://cls.soceco.uci.edu/ University of Central Florida Orlando, FL 2015 www.cohpa.ucf.edu/crim.jus/ University of Cincinnati Cincinnati, OH 1991 www.cech.uc.edu/criminaljustice/ University of Delaware Newark, DE -- http://www.udel.edu/soc/ University of Florida Gainesville, FL 1972 http://soccrim.clas.ufl.edu/ University of Illinois at Chicago Chicago, IL 2002 http://clj.las.uic.edu/index.html

39
University of Louisville Louisville, KY -- https://louisville.edu/justiceadministration University of Maribor Ljubljana,
Slovenia -- www.fvv.uni-mb.si/en/index.aspx
University of Maryland College Park, MD 1977 www.ccjs.umd.edu/ University of Massachusetts - Lowell Lowell, MA -- http://www.uml.edu/FAHSS/Criminal-Justice/default.aspx University of Missouri, St. Louis St. Louis, MO 1996 http://www.umsl.edu/~ccj/ University of Nebraska, Omaha Omaha, NE 1994 www.unomaha.edu/criminaljustice University of Nevada, Las Vegas Las Vegas, NV -- https://www.unlv.edu/degree/phd-criminology-criminal-justice University of New Haven West Haven, CT 2010 www.newhaven.edu/36182 University of South Carolina Columbia, SC 2008 www.cas.sc.edu/crju/ University of South Florida Tampa, FL 1998 http://criminology.cbcs.usf.edu/ University of Texas - Dallas Richardson, TX 2002 www.utdallas.edu/epps/crim/ University of Wisconsin - Milwaukee Milwaukee, WI -- https://uwm.edu/socialwelfare/doctor-philosophy-social-welfare Washington State University Pullman, WA -- http://libarts.wsu.edu/crimj/index.asp

40
Appendix C. Trends from 2010 to 2019 for All ADPCCJ Programs. This section of the report focuses on trends in ADPCCJ programs from 2010 through 2019. These statistics are overall numbers across all programs that completed the survey in a given year. The following figures are meant to provide an understanding of changes in ADPCCJ programs over time. Appendix C is divided into two parts: (1) Faculty and Students and (2) Admissions. Faculty and Students As shown in Figure 1, the percentage of tenured faculty across programs peaked at 71% in the 2014-2015 academic year and has steadily declined since that time, with 62% reported across programs in the 2018-2019 academic year. Appendix Figure 1. Trends in Percentage of Tenured Faculty.
Figures 2, 3, and 4 illustrate the number of new hires for assistant professor positions, associate professor positions, and full professor positions respectively. The number of new hires for assistant professor positions reached its peak since 2010, at 38 newly hired assistant professors. The hiring of new associate professors is much more sporadic. In the 2017-2018 academic year, four associate professors and one full professor were hired. In the 2018-2019 academic year, however, one associate professor and two full professors were reportedly hired at ADPCCJ programs.

41
Appendix Figure 2. Trends in Number of New Hires (Assistant Professor Positions).
Appendix Figure 3. Trends in Number of New Hires (Associate Professor Positions).

42
Appendix Figure 4. Trends in Number of New Hires (Full Professor Positions).
In Figures 5, 6, and 7, the median 9 month salary reported for assistant, associate, and full professors is presented. This shows that the median salary for assistant professors has been steadily increasing, with a median 9 month salary of $73,975 for the 2018-2019 academic year. In comparison, the median 9 month salary for assistant professors in the 2010-2011 academic year was $64,201. The median 9 month salary of $91,090 for associate professors was reportedly higher in the 2017-2018 academic year than in the 2018-2019 academic year, which was $87,776. However, this is a substantial increase from the 2010-2011 academic year when the median 9 month salary was $77,602. Appendix Figure 5. Median 9 Month Salary for Assistant Professors.

43
Appendix Figure 6. Median 9 Month Salary for Associate Professors.
The median 9 month salary for full professors has been steadily increasing from $113,525 in the 2010-2011 academic year to $135,588 in the 2017-2018 academic year. However, the median 9 month salary for full professors decreased in the 2018-2019 academic year to $129,700. Appendix Figure 7. Median 9 Month Salary for Full Professors.

44
Appendix Figure 8. Mean Number of Undergraduate Criminal Justice Majors in ADPCCJ Programs.
In Figure 8, the total number of undergraduate criminal justice majors in ADPCCJ programs is reported. This number has increased slightly from 20,620 students in the 2010-2011 academic year to 29,814 students in the 2018-2019 academic year. Figure 9 shows the mean number of undergraduate criminal justice majors by program. This indicates the average of 885 undergraduate majors in 2017-2018 has decreased to 806 in 2018-2019. Appendix Figure 9. Mean Number of Undergraduate Criminal Justice Majors by Program.

45
Figure 10 indicates that the ratio of male to female master’s students has remained relatively constant since the 2010-2011 academic year. Roughly 40% of master’s students are male and 60% are female. Appendix Figure 10. Gender Composition of Master’s Students.
Table 1 reports the racial composition of master’s students by academic year. This has also stayed relatively constant since the 2010-2011 academic year. Between 58% and 66% of master’s students are reportedly European American in any given year. Appendix Table 1. Race/Ethnicity Composition of Master’s Students.
Year Non-Latinx White Non-Latinx Black Latinx Asian Other Total2010-2011 60% 19% 9% 4% 8% 100%2011-2012 65% 16% 9% 3% 7% 100%2012-2013 66% 15% 8% 3% 8% 100%2013-2014 65% 16% 9% 3% 7% 100%2014-2015 66% 17% 8% 2% 7% 100%2015-2016 65% 16% 9% 4% 6% 100%2016-2017 59% 18% 12% 3% 8% 100%2017-2018 61% 15% 15% 3% 6% 100%2018-2019 58% 18% 14% 4% 6% 100%
Masters Student Race/Ethnicity Composition

46
Figure 11 indicates that the ratio of male to female doctoral students has remained relatively constant since the 2010-2011 academic year. Roughly 40% of doctoral students are male and 60% are female. Appendix Figure 11. Gender Composition of Doctoral Students.
Table 2 reports the racial composition of doctoral students by academic year. This has also stayed relatively constant since the 2010-2011 academic year. Between 65% and 70% of doctoral students are reportedly European American in any given year. Appendix Table 2. Race/Ethnicity Composition of Doctoral Students.
Year Non-Latinx White Non-Latinx Black Latinx Asian Other Total2010-2011 70% 10% 5% 4% 11% 100%2011-2012 65% 11% 6% 5% 13% 100%2012-2013 66% 7% 6% 5% 16% 100%2013-2014 67% 8% 6% 7% 12% 100%2014-2015 66% 11% 6% 5% 12% 100%2015-2016 69% 9% 6% 6% 10% 100%2016-2017 65% 9% 7% 8% 11% 100%2017-2018 68% 8% 8% 6% 10% 100%2018-2019 68% 7% 6% 5% 14% 100%
Doctoral Student Race/Ethnicity Composition

47
Admissions This section focuses on the trends in application, admission, and enrollment for traditional master’s programs, distance learning (DL) master’s programs, and doctoral programs. Figure 12 indicates the total number of applications received for traditional master’s programs peaked in the 2013-2014 academic year, with 3,151 applications. In the 2017-2018 academic year, 1,183 applications were received and in the 2018-2019 academic year, 1,468 applications were received for traditional master’s programs. Figure 13 shows that the mean number of applications received by program for traditional master’s programs has increased from 38 in 2017-2018 to 49 in 2018-2019. Appendix Figure 12. Number of Applications Received for Master’s Programs.
Appendix Figure 13. Mean Number of Master’s Applications Received by Program.
48
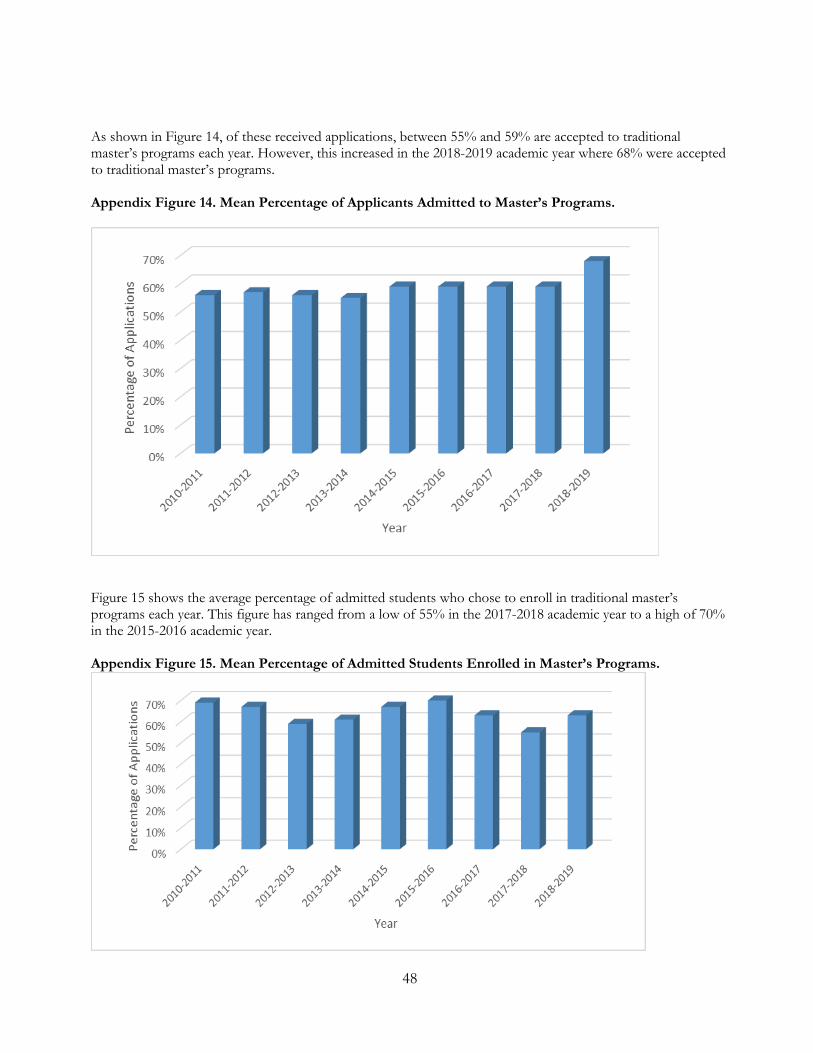
As shown in Figure 14, of these received applications, between 55% and 59% are accepted to traditional master’s programs each year. However, this increased in the 2018-2019 academic year where 68% were accepted to traditional master’s programs. Appendix Figure 14. Mean Percentage of Applicants Admitted to Master’s Programs.
Figure 15 shows the average percentage of admitted students who chose to enroll in traditional master’s programs each year. This figure has ranged from a low of 55% in the 2017-2018 academic year to a high of 70% in the 2015-2016 academic year. Appendix Figure 15. Mean Percentage of Admitted Students Enrolled in Master’s Programs.

49
Figure 16 indicates the number of applications received for distance learning master’s programs has stayed relatively constant since the first data on distance learning programs was collected in the 2012-2013 academic year. The number of applications received for distance learning master’s programs has ranged from a low of 1,022 in the 2017-2018 academic year to a high of 1,298 in the 2013-2014 academic year. Figure 17 shows that the mean number of applications received by program for distance learning master’s programs has increased from 57 in 2017-2018 to 97 in 2018-2019. Appendix Figure 16. Number of Applications Received for Distance Learning Master’s Programs.
Appendix Figure 17. Mean Number of Distance Learning Master’s Applications Received by Program.

50
As shown in Figure 18, of these received applications, between 72% and 84% are accepted to distance learning master’s programs each year. For the past two years, 76% of applicants were accepted to distance learning master’s programs. Appendix Figure 18. Mean Percentage of Applicants Admitted to Distance Learning Master’s Programs.
Figure 19 shows the average percentage of admitted students who chose to enroll in distance learning master’s programs each year. This figure has ranged from a low of 72% in the 2014-2015 academic year to a high of 88% in the 2012-2013 academic year. Appendix Figure 19. Mean Percentage of Admitted Students Enrolled in Distance Learning Master’s Programs.

51
Figure 20 indicates the number of applications received for doctoral programs peaked in the 2013-2014 academic year, with 1,561 applications. In the 2017-2018 academic year, 1,172 applications were received and in the 2018-2019 academic year, 1,130 applications were received for doctoral programs. Figure 21 shows that the mean number of applications received by program for doctoral programs has steadily decreased since the 2012-2013 academic year, when the mean number of applications was 42. The mean number of doctoral applications for the 2018-2019 academic year has decreased to 32. Appendix Figure 20. Number of Applications Received for Doctoral Programs.
Appendix Figure 21. Mean Number of Doctoral Applications Received by Program.
As shown in Figure 22, of these received applications, between 37% and 46% are accepted to doctoral programs each year. This admission rate peaked in the 2018-2019 academic year, as 46% of applicants were accepted to doctoral programs.

52
Appendix Figure 22. Mean Percentage of Applicants Admitted to Doctoral Programs.
Figure 23 shows the average percentage of admitted students who chose to enroll in doctoral programs each year. This figure has ranged from a low of 51% in the 2016-2017 academic year to a high of 63% in the 2011-2012 academic year. Appendix Figure 23. Mean Percentage of Admitted Students Enrolled in Doctoral Programs.