Association mapping reveals novel stem rust resistance ... · PDF fileAssociation mapping...
46
1 Association mapping reveals novel stem rust resistance loci in durum wheat at the 2 seedling stage 3 4 Tesfaye Letta 1,5* , Pablo Olivera 2 , Marco Maccaferri 1 , Yue Jin 2 , Karim Ammar 3 , Ayele Badebo 4 , Silvio 5 Salvi 1 , Enrico Noli 1 , Jose Crossa 3 , Roberto Tuberosa 1 6 7 Author affiliation 8 9 Tesfaye Letta, Marco Maccaferri, Silvio Salvi, Enrico Noli, Roberto Tuberosa: 1 DipSA, University of 10 Bologna, Viale Fanin 44, 40127 Bologna, Italy 11 Pablo Olivera, Yue Jin: 2 United States Department of Agriculture-Agricultural Research Service 12 (USDA-ARS), Cereal Disease Laboratory, 1551 Lindig Street, St. Paul, MN 55108, USA 13 Karim Ammar, Jose Crossa: 3 CIMMYT, Carretera Mexico-Veracruz KM. 45, 56130 Texcoco, Mexico 14 Ayele Badebo: 4 Debre Zeit Agricultural Research Center, Debre Zeit, Ethiopia 15 Tesfaye Letta: 5 Sinana Agricultural Research Center, Bale-Robe, Ethiopia 16 17 Received____________________________________ 18 19 * Corresponding author email: [email protected] 20 21 22 23 The Plant Genome: Posted 22 Nov. 2013; doi: 10.3835/plantgenome2013.08.0026
Transcript of Association mapping reveals novel stem rust resistance ... · PDF fileAssociation mapping...
1
Association mapping reveals novel stem rust resistance loci in durum wheat at the 2
seedling stage 3
4
Tesfaye Letta1,5*, Pablo Olivera2, Marco Maccaferri1, Yue Jin2, Karim Ammar3, Ayele Badebo4, Silvio 5
Salvi1, Enrico Noli1, Jose Crossa3, Roberto Tuberosa1 6
7
Author affiliation 8
9
Tesfaye Letta, Marco Maccaferri, Silvio Salvi, Enrico Noli, Roberto Tuberosa: 1DipSA, University of 10
Bologna, Viale Fanin 44, 40127 Bologna, Italy 11
Pablo Olivera, Yue Jin: 2United States Department of Agriculture-Agricultural Research Service 12
(USDA-ARS), Cereal Disease Laboratory, 1551 Lindig Street, St. Paul, MN 55108, USA 13
Karim Ammar, Jose Crossa: 3CIMMYT, Carretera Mexico-Veracruz KM. 45, 56130 Texcoco, Mexico 14
Ayele Badebo: 4Debre Zeit Agricultural Research Center, Debre Zeit, Ethiopia 15
Tesfaye Letta: 5Sinana Agricultural Research Center, Bale-Robe, Ethiopia 16
17
Received____________________________________ 18
19
* Corresponding author email: [email protected] 20
21
22
23
The Plant Genome: Posted 22 Nov. 2013; doi: 10.3835/plantgenome2013.08.0026

Abstract 24
Wheat stem rust rapidly evolves new virulence to resistance genes. Recently emerged races in East 25
Africa such as TTKSK (or Ug99) possess broad virulence to durum cultivars and only a limited number 26
of genes provide resistance. An association mapping (AM) study conducted on 183 durum wheat 27
accessions has allowed us to identify 41 QTLs (R2 values from 1.1 to 23.1%) for seedling resistance to 28
one or more of four highly virulent stem rust races: TRTTF, TTTTF, TTKSK (Ug99) and JRCQC, two 29
of which (TRTTF and JRCQC) were isolated from Ethiopia. Among these loci, 24 are novel while the 30
remaining 17 overlapped with loci previously shown to provide field resistance in Ethiopia and/or 31
chromosome regions known to harbor designated Sr loci. The identified loci were either effective 32
against multiple races or race specific, particularly for race JRCQC. Our results highlight that stem rust 33
resistance in durum wheat is governed in part by loci for resistance across multiple races and in part by 34
race-specific ones (23 and 18, respectively). Collectively, these results provide useful information to 35
improve the effectiveness of marker-assisted selection towards the release of durum wheat cultivars 36
with durable stem rust resistance. 37
Abbreviations 38
AM, association mapping; ANOVA, analysis of variance; APR, adult plant resistance; DArT, Diversity 39
Array Technology marker; H2, broad-sense heritability; IT, seedling infection type; K, kinship matrix; 40
LD linkage disequilibrium; Q, population structure covariate; R2, determination coefficient; r2, marker 41
pair-wise linkage disequilibrium estimate; RIL, recombinant inbred line; SNP, single nucleotide 42
polymorphism; Sr, stem rust resistance designated loci; STS, sequence tagged site marker; SSR, simple 43
sequence repeat marker. 44
KEY WORDS: 45
Genome wide association studies; wheat; plant disease. 46
The Plant Genome: Posted 22 Nov. 2013; doi: 10.3835/plantgenome2013.08.0026

47
INTRODUCTION 48
Durum wheat (Triticum turgidum ssp. durum Desf.) is an important crop in the Mediterranean Basin, 49
particularly in West Asia and North Africa (WANA) where durum wheat is grown annually over more 50
than 13 million hectares. Mediterranean countries account for approximately 75% of global worldwide 51
durum wheat production. In Sub-Saharan Africa, Ethiopia is the largest wheat-growing country and is 52
one of the centers of diversity for tetraploid wheat. Durum wheat represents approximately 40% of the 53
total wheat area in Ethiopia, with a tendency to increase in response to the growing internal demand for 54
pasta. 55
Durum production and kernel quality can be negatively affected by rust diseases (Singh et al. 2005). 56
Historically, stem rust infections of Puccinia graminis Pers. f. sp. tritici, (Pgt) have caused severe 57
losses to wheat production (McIntosh and Brown, 1997; Eversmeyer and Kramer, 2000; Singh et al. 58
2011). While more than 50 stem rust resistance (Sr) loci have been identified in cultivated wheat and 59
wild relatives, only a few of them remained effective against the newly emerged races in East Africa, 60
including TTKSK = Ug99 (Pretorious et al. 2000) and its variants, and even fewer are effective against 61
the durum-specific Ethiopian races (Admassu et al. 2009; Rouse et al. 2012). In Ethiopia, Ug99 was in 62
fact added to previously existing races, several of them specifically virulent on durum wheat (Admassu 63
and Fekedu. 2005; Haile et al. 2012). Two such races, typed as TRTTF and JRCQC, have a combined 64
virulence on stem rust resistance genes Sr9e and Sr13 (Olivera et al. 2012). Virulence on Sr13 appears 65
to be widespread in Ethiopia (Admassu et al. 2009). Very limited effective resistance (5.2%) to races 66
TRTTF and JRCQC was found in a highly diverse collection of 996 tetraploid genotypes evaluated for 67
field reaction at the Debre Zeit Research Center in Ethiopia (Olivera et al. 2012). Therefore, the 68
combination of Ug99 with Sr9e- and Sr13-virulent Ethiopian races represents a major threat to the 69
viability of the Ethiopian durum wheat production. Achieving higher and more durable stem rust 70
The Plant Genome: Posted 22 Nov. 2013; doi: 10.3835/plantgenome2013.08.0026
resistance requires the characterization of the genetic basis underlying the resistance present in 71
improved germplasm or in exotic sources used for introgression in breeding. Only then can breeding 72
programs develop strategies to pre-emptively counter the emerging new virulence types in the pathogen 73
populations. Whereas field resistance is the ultimate goal sought in breeding programs, seedling tests 74
are a good complement for resistance characterization as they allow screening a large number of lines 75
for reaction to multiple races, one race at a time, in relatively short periods and with modest space 76
requirements. Seedling screening provides information for postulating the presence of designated loci 77
based on the series of available races and/or the presence of novel loci, avoiding the confounding 78
effects of having several races acting at the same time, as is usually the case in field experiments. 79
Marker-based approaches can be used to identify genes/quantitative trait loci (QTLs) governing the 80
disease responses. Until recently, the standard approach is to use biparental mapping populations to 81
relate phenotypic information to genotypic data obtained from molecular markers in order to determine 82
the number and chromosomal location of resistance loci (Maccaferri et al. 2008; Simons et al. 2011; 83
Singh et al. 2013). An alternative to the use of biparental mapping is association mapping (AM) or 84
linkage disequilibrium (LD)-based mapping in which genotype-phenotype relationships are explored in 85
germplasm collections or natural populations (Flint-Garcia et al. 2003; Zhu et al. 2008). Since its first 86
use in plants a decade ago, AM has been used in many crops due to advances in high-throughput 87
genotyping technologies, increased interest in identifying useful and/or novel alleles and improvements 88
in statistical methods (Gupta et al. 2005; Yu et al. 2006; Zhu et al. 2008). In both tetraploid and 89
hexaploid wheat, AM has already proven to be an effective strategy to identify marker-trait associations 90
for agronomically valuable traits (Breseghello and Sorrells, 2006; Maccaferri et al. 2010, 2011) and 91
response to diseases (Adhikari et al. 2012; Kollers et al. 2013), including resistance to stem rust (Yu et 92
al. 2011) and leaf rust (Maccaferri et al. 2010) in durum wheat. Linkage disequilibrium (LD) in the 93
elite durum wheat germplasm utilized herein ranges from 5 to 10 cM (Maccaferri et al. 2005), similarly 94
to observations carried out in elite hexaploid wheat (Zhang et al. 2010), thus enabling a whole-genome 95
The Plant Genome: Posted 22 Nov. 2013; doi: 10.3835/plantgenome2013.08.0026
scan analysis for marker-trait associations with a relatively modest number of markers as compared to 96
species with lower LD. 97
The objectives of this study were to carry out a genome-wide search in durum wheat for resistance loci 98
to Pgt races TRTTF, TTTTF, TTKSK and JRCQC at the seedling stage and the identification of 99
genomic regions suitable for marker-assisted selection and further genetic dissection. 100
101
The Plant Genome: Posted 22 Nov. 2013; doi: 10.3835/plantgenome2013.08.0026
MATERIALS AND METHODS 102
Plant materials 103
One hundred eighty-three accessions from different durum wheat-growing regions of Mediterranean 104
countries (Italy, Morocco, Spain, Syria and Tunisia), the Southwestern USA and Mexico already used 105
in previous AM analysis for stem rust resistance under field conditions (Letta et al. 2013) were 106
analyzed in this study. A detailed description of the accessions at the molecular and phenotypic level is 107
reported in Maccaferri et al. (2006 and 2010). 108
Pathogen races 109
The AM panel was evaluated for reaction to four Pgt races: TRTTF, TTTTF, TTKSK and JRCQC. The 110
race designation is based on the letter code nomenclature system (Roelfs and Martens, 1988; Roelfs et 111
al. 1993), modified to further delineate races in the TTKS lineage (Jin et al. 2008). These races were 112
selected based on their differential virulence pattern and/or importance for durum wheat. Race TTKSK 113
(Ug99) has a wide virulence spectrum and is rapidly evolving in East Africa. Race TTTTF is the most 114
widely virulent race known in the United States, producing high infection types on the majority of stem 115
rust differential lines (Jin et al. 2007). Races TRTTF and JRCQC, both present in Ethiopia, possess a 116
virulence combination that overcomes both the resistance genes Sr13 and Sr9e, two genes present at 117
high frequency in durum wheat (Klindworth et al. 2007). Information about the stem rust isolates used 118
in the disease phenotyping tests is summarized in Table 1. 119
Inoculation, incubation and disease assessment 120
The AM panel was evaluated under controlled conditions using a completely randomized design with 121
two replications (over time) for each of the four races. Five to six seedlings per line were inoculated on 122
the fully expanded primary leaves 8 to 9 days after planting. This work was conducted at the Cereal 123
Disease Laboratory, St. Paul, MN, USA and the experimental procedures in inoculation and disease 124
The Plant Genome: Posted 22 Nov. 2013; doi: 10.3835/plantgenome2013.08.0026
assessment were carried out as described by Jin et al. (2007). Wheat cultivar McNair 701 (CItr 15288) 125
was used as susceptible control. Plants were evaluated for their infection types (ITs) 14 days post-126
inoculation using the 0-4 scale according to Stakman et al. (1962), where ITs of 0, ;, 1, 2, or X are 127
considered as low ITs and ITs of 3 or 4 are considered as high ITs. Lines giving variable reactions 128
between experiments were repeated again to confirm the most likely reactions. 129
Statistical analysis 130
Stakman’s ITs were converted to a linear scale using a conversion algorithm proposed by Zhang et al. 131
(2011). Briefly, infection types are converted as follows: 0, 1-, 1, 1+, 2- , 2, 2+, 3-, 3 and 3+ are coded 132
as 0, 1, 2, 3, 4, 5, 6, 7, 8 and 9, respectively. The symbol for hypersensitive flecks (;) is converted to 0 133
and IT 4 is converted to 9. Special annotation codes C and N are ignored. Double minus and double 134
plus annotations are converted to single minus and single plus, respectively. Complex ranges such as 135
;12+ are first collapsed to ;2+. Then the first and last ITs of the ranges are converted and averaged; with 136
the first IT double-weighted because the most prevalent IT is listed first. Infection types X-, X and X+ 137
are converted to linearized scores of 4, 5 and 6, respectively. These linearized 0-9 scale values were 138
used for subsequent statistical analysis. 139
The heritability of linearized infection type responses was calculated for each of the four races on a 140
mean basis across two replications according to the following: h2 = σ2G / (σ2
G + σ2E/r) where r = 141
number of replicates, σ2G = genotypic component of the MS among accessions and σ2
E = MSerror, with 142
MS indicating the mean square values as from the ANOVA results. 143
The dendrogram analysis was carried out using NTSYS-pc software version 2.0 (Rohlf 1997) and was 144
based on the virulence phenotypes (Infection Types estimated with a 0–4 scale) of the races; the 145
distances among races have been computed using the standardized Manhattan distances (‘city-block’ 146
method). 147
The Plant Genome: Posted 22 Nov. 2013; doi: 10.3835/plantgenome2013.08.0026
Molecular profiling 148
Genomic DNA extraction and other molecular procedures were carried out as described in Maccaferri 149
et al. (2010). The accessions were profiled with 350 simple sequence repeat loci (SSR), 900 Diversity 150
Array Technology (DArT) markers and three additional sequence tagged site (STS) markers including 151
those previously reported to be associated to major stem rust resistance genes (Yu et al. 2010). 152
The choice of SSR marker loci, fluorescent PCR amplification and polyacrylamide-gel electrophoresis 153
were carried out as detailed in Letta et al. (2013). Genotype alleles of the 183 Durum Panel accessions 154
were scored using founder genotypes as an allele reference set. DArT marker genotypes were obtained 155
as reported in Letta et al. (2013). 156
157
Association mapping 158
Genome-wide association mapping was carried out with software and analysis parameter settings as 159
described in Letta et al. (2013), with minor modifications. Briefly, only markers with non-rare alleles 160
(frequency > 0.10) were considered for the LD and marker-trait association analysis. Rare alleles and 161
data-points showing residual allelic heterogeneity within accessions were considered as missing data. 162
Association mapping tests were carried out with the molecular data produced from 323 SSRs and STSs 163
plus 538 DArT markers for which both map position on a durum-specific consensus map (described in 164
Letta et al. 2013) and the genotype score of the 183 durum panel accessions were already available. 165
The genetic structure of the panel has been investigated with a combination of model- and distance-166
based analyses using the software programs STRUCTURE v. 2 (Pritchard et al. 2000) and NTSYS-pc 167
v. 2 (Rohlf 1997). Details for structure and kinship analysis were reported in Maccaferri et al. (2010, 168
2011). TASSEL (http://www.maizegenetics. net) was used to estimate the LD parameters D’ and r2 169
values as a function of the corresponding inter-marker distances and the comparison-wise significance 170
The Plant Genome: Posted 22 Nov. 2013; doi: 10.3835/plantgenome2013.08.0026

was computed with 10,000 permutations. The r2 parameter was estimated for all loci on the same 171
chromosome and compared based on the genetic distances measured in cM. If all pairs of adjacent loci 172
within a given chromosomal region were in LD (r2 ≥ 0.4 and highly significant LD P values), then the 173
region was referred to as a LD block. 174
Marker-phenotype association analysis 175
Genome-wide scan for loci governing stem rust resistance at the seedling stage was conducted using 176
phenotypic data converted to a linear scale. AM analysis was carried out with TASSEL, ver. 2.1 (www. 177
maizegenetics.net; Yu et al. 2006). The 323 SSRs and STSs and 538 DArT markers were tested for 178
significance of marker-trait associations under: (i) the fixed general linear model (GLM) including the 179
Q population structure results as covariates (Q GLM), (ii) the mixed linear model (MLM) including the 180
Q population structure results plus the K kinship matrix (Q + K MLM). 181
For GLM analysis, besides the marker-wise association probability values, the experiment-wise 182
association significance probability was obtained based on a permutation test (10,000 permutations). In 183
the MLM analysis, experiment-wise significance was inspected using the False Discovery Rate (FDR) 184
approach according to Storey and Tibshirani (2003) and implemented in Qvalue program. 185
Multiple adjacent co-segregating significant markers were assigned to a unique QTL region upon 186
meeting the following conditions: less than 20 cM of inter-marker genetic distance, presence of 187
significant and strong LD among the markers (with R2 values ≥ 0.4) within the QTL region and 188
consistency of allelic effects across significant markers. 189
In order to estimate the cumulative effect of the markers that were significant in the single-marker 190
analysis association tests, several multiple regressions considering the markers that were significant at 191
the experiment-wise (or genome-wise) level (FDR approach, P ≤ 0.05) only and markers significant at 192
both the experiment-wise (P ≤ 0.05) and marker-wise (P ≤ 0.01) levels were performed for each race. 193
The Plant Genome: Posted 22 Nov. 2013; doi: 10.3835/plantgenome2013.08.0026

The number of markers included in the multiple regressions varied from three to four when considering 194
the experiment-wise significant markers and from 15 to 20 markers when considering both the 195
significant experiment-wise and the marker-wise highly significant markers. Finally, all significant 196
markers (41 in total) were used for a multiple regression analysis for the responses to all the four races.197
The Plant Genome: Posted 22 Nov. 2013; doi: 10.3835/plantgenome2013.08.0026

RESULTS 198
Seedling evaluations 199
Seedling ITs for each of the 183 durum accessions are presented in the Supplemental Table S1. The ITs 200
frequency distribution presented in Figure 1 depicts a continuous variation for all four races, with that 201
for JRCQC being skewed toward susceptibility scores (3 and 4). 202
The analysis of variance for stem rust seedling response showed highly significant differences (P ≤ 203
0.0001) among races and accessions with highly significant effects of subgroups of accessions and 204
subgroup × race interaction (results not reported). The highly variable classification and ranking of the 205
accessions (supplemental Table S1) based on their responses to the different races supports the 206
significance of the race × accession interaction. Heritability of the linearized IT values was high for all 207
four races, ranging from h2 = 93.0% for race TTTTF to h2 = 98.9% for TTKSK. 208
The frequencies of accessions categorized as resistant, susceptible and heterogeneous in their reaction 209
to the four races varied markedly depending on the race (Table 2). Seedling resistance to TRTTF, 210
TTTTF, TTKSK and JRCQC was observed in 149 (81.4%), 117 (63.9%), 106 (57.9%) and 87 (47.5%) 211
accessions, respectively (Table 2). Sixty-six (36.1%) accessions were resistant (IT = 0 to 23) to all four 212
races. 213
Figure 2 reports the pattern of diversity among the four stem rust races based on the UPGMA-cluster 214
analysis of the avirulence/virulence patterns on the 183 durum accessions. The dendrogram clearly 215
shows that the races grouped into three well-distinct groups with TTTTF and TTKSK that clearly 216
clustered together while TRTTF and JRCQC showed independent virulence patterns. 217
Highly significant correlations of ITs among genotypes were observed for all the four races. In 218
particular, relatively high r-values were observed for the pair-correlations of TTKSK vs. TTTTF (0.72), 219
The Plant Genome: Posted 22 Nov. 2013; doi: 10.3835/plantgenome2013.08.0026

TTTTF vs. JRCQC (0.57), TRTTF vs. TTTTF (0.51) and TTKSK vs. TRTTF (0.46). The correlation of 220
ITs between JRCQC and TTKSK or JRCQC and TRTTF was rather weak (0.36 and 0.15, respectively). 221
Relationship between population structure and seedling response to stem rust 222
The genetic relationships among the accessions were investigated using both a genetic-similarity and a 223
model-based Bayesian clustering method and the results have been reported elsewhere (Maccaferri et 224
al. 2006, 2011; Letta et al. 2013). Both methods pointed out that the minimum and optimum number of 225
hypothetically well-distinct subgroups present in the panel was equal to five, corresponding to clearly 226
distinct breeding lineages (from S1 to S5). Each subgroup contains 11, 55, 26, 56 and 35 accessions, 227
respectively. The differences for seedling stem rust response among the five subgroups were highly 228
significant (P ≤ 0.001, data not shown). The coefficients of membership to the five main subgroups as 229
estimated with STRUCTURE were used to assess the effect of population structure to single race 230
responses by means of multiple regression. The percentage of phenotypic variation accounted for by 231
population structure ranged from a minimum of 9.09% for response to race TTKSK to a maximum of 232
12.15% for response to race JRCQC. 233
The percentage of resistant and susceptible accessions for each of the five main subgroups is reported 234
in Table 3. This clearly shows that all five subgroups included accessions with different responses thus 235
indicating that all subgroups are equally informative for AM purposes. 236
The complete dataset of seedling phenotypic response and population structure membership 237
coefficients for each of the 183 accessions included in the association panel is reported as 238
Supplemental Table S1. 239
The ranking values of the four races based on their frequencies of avirulence/virulence interactions 240
considering the germplasm collection as a whole (with TRTTF showing the highest degree of avirulent 241
interactions, followed by TTTTF, TTKSK and finally JRCQC, which showed the highest frequency of 242
virulent interactions) was roughly confirmed when considering each of the five different subgroups of 243
The Plant Genome: Posted 22 Nov. 2013; doi: 10.3835/plantgenome2013.08.0026
germplasm accessions separately (Table 3). One exception was observed for the race virulence 244
spectrum to accessions of subgroup 3 (including the Italian and early ‘70s CIMMYT germplasm) 245
where race TTTTF showed the highest frequency of avirulence and race TTKSK resulted in the most 246
virulent. 247
Differences among subgroups for frequency of resistance were observed in the proportion of accessions 248
resistant to a given race. For all four races, subgroup 5 (CIMMYT germplasm of the late 80s, early 90s) 249
had the highest frequency of seedling resistant accessions, mostly scored as IT = 2 (Table 3). On the 250
other hand, subgroup 1 (ICARDA accessions for rainfed environments), which is also the least 251
represented within the panel, had the highest frequency of susceptible accessions, except when 252
considering TRTTF, for which only subgroup 3 showed a higher frequency of susceptible accessions. 253
Overall, more accessions in subgroups 4 and 5 showed resistance to all four races than in the other 254
subgroups. 255
Association mapping for seedling response to stem rust 256
Association mapping revealed multiple putative QTLs for stem rust resistance to the four races (Table 257
4). In total, 41 distinct QTLs represented by either single markers or sets of closely linked markers, 258
were found to be significantly associated to the seedling responses to the four tested races under the Q 259
+ K MLM models, with 15, 20, 19 and 19 QTLs for the response to TRTTF (marker R2 from 1.13 to 260
8.34%), TTTTF (R2 from 1.92 to 17.64%), TTKSK (R2 from 1.75 to 23.12%) and JRCQC (R2 from 261
1.51 to 15.33%), respectively (Table 4). All these regions identified with the Q + K MLM showed 262
significant effects also with the Q GLM model. In some cases, the presence of a QTL was evidenced by 263
multiple significant associations at linked SSR and DArT markers within 10 cM, as estimated from the 264
durum consensus map and LD r2 values higher than 0.4 in most cases (results not reported). Using a 265
more stringent model including the False Discovery Rate (FDR) multiple testing correction and Q + K 266
MLM model, the number of chromosomal regions (QTLs) that showed significant (P ≤ 0.05) 267
The Plant Genome: Posted 22 Nov. 2013; doi: 10.3835/plantgenome2013.08.0026

associations were 4, 3, 4 and 4 for races TRTTF, TTTTF, TTKSK and JRCQC, respectively (Table 4), 268
while the Q GLM model detected a higher number of significant markers. 269
Based on the simultaneous fit of the most significant markers found in this study (results reported in 270
Table 5), it is worth noting that as few as three to four markers, i.e. those that were significant at the 271
experiment-wise levels according to Table 4, accounted for a rather sizeable portion of the global 272
phenotypic variation that varied between 29.2 to 46.5%, depending on the stem rust race (TTTTF to 273
JRCQC, respectively). By considering pools of 15 to 20 markers that included both the experiment-274
wise significant (P 0.05) and the marker-wise highly significant (P 0.01) markers it was possible to 275
account for a percentage of phenotypic variation ranging from 54.9 (TRTTF race) to 72.3% (JRCQC 276
race). Finally, when considering all markers that showed at least one significant association to any of 277
the four different race responses (41 markers in total, see Table 4), the percentage of phenotypic 278
variation accounted for by the marker genotypes varied between 75.4 (TTTTF) and 80.9 (JRCQC) % 279
of the overall response variation. 280
The molecular genotypes of the 183 accessions for all the significant markers are reported on 281
Supplementary Tables S3 (experiment-wise significant markers only) and S4 (all significant markers) 282
by sorting the genotypes according to their phenotypic responses (from accessions that showed a 283
completely resistant response against all the four races to the accessions that were completely 284
susceptible). The graphical genotypes of the accessions underlines the remarkable association between 285
marker alleles (associated to partial resistance or susceptibility, respectively) and classes of phenotypic 286
response to the four races (from completely resistant to completely susceptible responses). 287
The most important region in terms of significance and R2 effects was observed on chromosome arm 288
6AL, in a 28.7 cM interval (based on the durum consensus map reported in Letta et al. 2013) harboring 289
four distinct QTLs with R2 values ranging from 1.51 to 23.12%. Within this wide interval, noticeable 290
associations across the four races were found at the two sites tagged by CD926040 (143.9 cM on the 291
The Plant Genome: Posted 22 Nov. 2013; doi: 10.3835/plantgenome2013.08.0026
consensus linkage group) and barc104 (155.3 cM). These two markers (CD926040 and barc104) 292
showed consistently high R2 values (from 10.47 to 23.12%) for races TTTTF, TTKSK and JRCQC. 293
Conversely, CD926040 and barc104 showed only a limited effect, though still significant, for race 294
TRTTF (R2 equal to 3.52 and 2.84% respectively). Supplemental Table 3 highlights the tight 295
association between molecular marker alleles at CD926040 and barc104 at chromosome 6BL and 296
TTKSK response.In terms of significance across all four races, apart from the two sites on chromosome 297
arm 6AL, only one QTL on chromosome 5A (gwm410) showed significant effects in response to all the 298
four races considered in this study. Two genomic regions were identified on chromosomes 1B (barc61) 299
and 2A (wPt-5839) that were putatively effective across three races (TRTTF, TTTTF and TTKSK but 300
not for race JRCQC at both regions). The R2 values of markers on chromosome 1B ranged from 2.27 to 301
2.45% while markers on chromosome 2A explained from 1.60 to 2.44% of the phenotypic variation. 302
On chromosome 3A, marker wPt-1923 tagged a region significant for TTTTF, TTKSK and JRCQC 303
with R2 values from 2.09 to 3.98%. 304
Race-specific effects (P < 0.001) were observed for each race as following: for race TRTTF, putative 305
genomic regions significantly affecting the response were found on chromosomes 2A, 2B and two 306
regions on chromosome 7A. The region with the largest effect (R2 = 8.34%) was tagged by gwm47 on 307
chromosome 2BL. The second and third regions with a sizeable effect to the response to race TRTTF 308
were tagged by markers wPt-6668 and gwm344 both on chromosome 7A with R2 values of 2.70 and 309
5.79%, respectively. Marker wPt-2293 on chromosome 2A tagged an additional region with a sizeable 310
effect (R2 = 4.20%) on this race. Also in this case, Supplemental Table 3, shows the strong association 311
of marker alleles at wPt-2293 on chromosome 2A and gwm47 on chromosome 2BL to the accessions 312
response to TRTTF. 313
The Plant Genome: Posted 22 Nov. 2013; doi: 10.3835/plantgenome2013.08.0026

For race TTTTF, marker wmc517 on chromosome 7B showed a significant effect (R2 = 8.00%) that 314
was shared with race TTKSK (R2 = 4.96%). A QTL (R2 = 4.87 and 2.75%) specific for TTKSK and 315
TTTTF, respectively, was observed on chromosome 3B (wmc43). 316
Remarkably, up to ten QTLs with high specificity for race JRCQC were identified. These ten QTLs 317
were tagged by wPt-1876, wPt-9049, barc78, gwm1570, barc165, gwm234, wPt-2991, gwm816, 318
gwm573 and gwm333. Among those QTLs, the most important in terms of significance and R2 value 319
was located on chromosome 4A, tagged by barc78 (R2 = 9.36%). 320
A previous study has examined the present collection for resistance to stem rust at the adult stage in the 321
field (Letta et al. 2013) using an inoculum which included three of the four races (TTKSK, TRTTF and 322
JRCQC) tested herein. Letta et al. (2013) highlighted the presence of 24 QTLs with significant effects 323
in two out of four seasons and 12 QTLs in three out of four seasons. The results of the seedling tests 324
confirm that more than half (15 in total) of the loci reported in Letta et al. (2013) were detectable 325
through association mapping carried out based on the response to P. graminis tested at the seedling 326
stage (Table 4). The features of those loci that could be detected both at the seedling stage and under 327
field conditions showed that the majority were effective against two to three races while those that 328
showed a race-specific response were mostly effective against JRCQC and TRTTF, i.e. the two 329
Ethiopian races, as expected (Table 4). 330
More in detail, the most interesting regions based on their effects across both selected races and field 331
trials were those located on chromosomes 1B, 2B, 3A, 6A, 7A and 7B. QTLs tagged by barc61 (1B), 332
gwm1300 and wmc356 (2B), wPt-1923 (3A), the complex locus tagged by gwm169, gwm427, 333
CD926040, barc104 (6A) and wmc517 (7B) were all effective against race TTKSK, present throughout 334
Africa and Ethiopia, as well as other races and in two to four field trials.Three additional QTLs 335
significant for both seedling tests and field trials were mostly shown to be specifically effective for the 336
Ethiopian race JRCQC (gwm1620 on chromosome 3A, barc78 on chromosome 4A and gwm573 on 337
The Plant Genome: Posted 22 Nov. 2013; doi: 10.3835/plantgenome2013.08.0026

chromosome 7B). Another QTL highly effective in the field (tagged by wPt-6668 on chromosome 7A) 338
was shown to be specific for the second Ethiopian race used in this study (TRTTF). 339
The graphical genotypes of the 183 Durum Panel elite accessions herein characterized were inspected 340
for the most significant loci, side to side to their responses across the four tested races (as reported in 341
Supplemental Table 3, accessions clustered based on classes of increasing susceptibility response). In 342
the first group of accessions, classified as resistant to all the four races, up to 32 accessions showed a 343
frequency of cumulated favorable marker alleles equal or higher than 0.60, suggesting that these 344
accessions carried at least five to seven favourable alleles across the ten marker loci considered. A few 345
of these accessions with promising seedling response were originated directly or indirectly from the 346
CIMMYT and ICARDA breeding programs. Some accessions from the Italian breeding program were 347
susceptible to TTKSK (Ug99) but showed valuable resistances to the highly virulent JRCQC race and 348
also to TRTTF. Conversely, a high frequency of accessions completely susceptible to the tested races 349
was present in high frequency in the Italian germplasm and in some ICARDA materials including the 350
old Haurani landrace founder. 351
352
353
354
355
356
357
358
359
The Plant Genome: Posted 22 Nov. 2013; doi: 10.3835/plantgenome2013.08.0026
DISCUSSION 360
There is a growing interest in applying association mapping (AM) to a wide range of crops to identify 361
loci responsible for quantitatively inherited variation, including durable resistance (Hall et al. 2010; 362
Kollers et al. 2013). Accordingly, a better understanding of the genetic basis underlying the naturally 363
occurring genetic diversity for stem rust response in durum wheat could help to accelerate the progress 364
for enhancing stem rust resistance of this crop while shedding light on the evolution of the host-365
pathogen relationships. Along this line, the panel of accessions herein evaluated surveys the genetic 366
variation present in elite germplasm pool commonly used by durum breeders, a feature that makes our 367
results more readily transferable to breeding activities. 368
The survey was carried out based on a set of Pgt isolates belonging to four races chosen to represent 369
the most virulent, diverse and aggressive pathotypes challenging durum wheat world-wide, i.e. the 370
TTKSK (= Ug99) race now diffused throughout Central and North-East Africa and Iran in Asia (Singh 371
et al. 2006, FAO 2008), The North American TTTTF race (Jin et al. 2008) and two recently described 372
and highly virulent Ethiopian races (TRTTF and JRCQC) that overcame some of the few resistance 373
genes effective against Ug99 (Olivera et al. 2012). These four races complement each other in terms of 374
their virulence/avirulence formula, thus providing a nearly complete spectrum of virulence against 375
known resistance loci (Rouse et al. 2011; Pretorius et al. 2012). 376
Association mapping test identified 41 distinct QTL regions for resistance to stem rust at the seedling 377
stage, a number higher than those reported in both durum and bread wheat for response at the adult 378
plant stage under field conditions (Yu et al. 2011 and 2012; Letta et al. 2013). The higher number of 379
significant loci herein reported is in line with the expectation based on: (i) the higher heritability values 380
of the phenotypes at the seedling stage as compared to the field-based phenotypes, (ii) the satisfactory 381
genome coverage level reached in this study through a combined utilization of different marker classes 382
(SSR and DArT) and (iii) the higher potential of AM as compared to bi-parental mapping in revealing 383
The Plant Genome: Posted 22 Nov. 2013; doi: 10.3835/plantgenome2013.08.0026

segregating loci, based on the wider genetic diversity explored (Hall et al. 2010; Sukumaran and Yu, 384
2013). Only a few mapping studies have reported complete genome-wide surveys of rust resistance at 385
both seedling and adult-plant field conditions and compared the results observed in such conditions 386
(Crossa et al. 2007; Maccaferri et al. 2010; Ingala et al. 2012). 387
This evaluation at the seedling stage allowed us to identify the most important loci effective under field 388
conditions, as reported in Letta et al. (2013), while providing evidence for the presence of additional 389
loci involved in stem rust response. Overall, these results show that an accurate and targeted screening 390
at the seedling stage is effective in identifying loci for resistance under field conditions 391
Significant markers tagging identified Sr genes or novel resistance loci 392
To determine whether any known resistance gene coincided with the putative genomic regions 393
identified in this study, the current results were compared with previous findings for stem rust 394
resistance in wheat. A number of QTLs identified in this study co-located with previously reported 395
major Sr loci (within a 10 cM-wide interval) as well as with QTLs recently identified through linkage 396
mapping in tetraploid wheat (Haile et al. 2012) and AM in hexaploid wheat (Yu et al. 2011, 2012). One 397
QTL tagged by wPt-1876 (chromosome 1B) for response to race JRCQC corresponds to a region 398
previously shown to influence stem rust resistance in two independent field studies (Crossa et al. 2007; 399
Yu et al. 2011). Moreover, this region harbors Sr14 which appears effective against several stem rust 400
races (Singh et al. 2006). This region did not show significant effects for race TTKSK, in accordance to 401
the Sr14 seedling IT reported by Jin et al. (2007). The genomic region on the distal part of chromosome 402
1B, tagged by wmc44, and associated with seedling resistance to TTTTF and JRCQC has been shown 403
to harbor genes for multiple diseases: Lr46/Yr29/Pm39 and a still undesignated gene for adult plant 404
resistance (APR) to stem rust (Bhavani et al. 2011; Ravi Singh, personal communication). On 405
chromosome 2A, cfa2201 and wPt-5839 co-located with the region known to host Sr38 and Sr34, 406
respectively. However, both genes are ineffective against races of the Ug99 lineage (Jin et al. 2007; 407
The Plant Genome: Posted 22 Nov. 2013; doi: 10.3835/plantgenome2013.08.0026

Singh et al. 2011) and originate from T. comosum and T. ventricosum, which makes their presence in 408
durum wheat highly unlikely. Consequently, cfa2201 and wPt-5839 appear to tag new resistance loci. 409
Several Sr genes are located on chromosome arm 2BL, including Sr9, Sr16, Sr28 (McIntosh et al. 410
1995) and SrWeb (Hiebert et al. 2010). SrWeb confers resistance to Ug99 while none of the four alleles 411
of Sr9 confers resistance to the same race (Jin et al. 2007). Hence, the significant effects detected by 412
gwm1300 for race TTKSK might be tagging the presence of SrWeb (Hiebert et al. 2010) while gwm47, 413
detected for race TRTTF, tags potentially new alleles near or at the Sr9 locus. Additionally, at the end 414
of chromosome 2B, significant effects of wmc356 on races TTTTF and JRCQC were detected, but it is 415
unlikely that Sr16 or Sr28 plays any role since both genes are ineffective to these races. Chromosome 416
arm 3BS harbors several Sr genes including Sr2, Sr51, Sr12 and SrB (Yu et al. 2009). 417
Among the more than 50 Sr resistance loci identified so far, Sr2 has been one of the most widely 418
deployed and has provided durable adult plant rust resistance for more than 50 years (McIntosh et al. 419
1995). A previous study suggested that the Sr2 APR allele is rare in the AM panel considered herein 420
(Letta et al. 2013). Accordingly, none of the markers near the position of Sr2 showed significant effects 421
(Mago et al. 2010). Based on IT responses, the chances of detecting Sr2 at the seedling stage a low, 422
being Sr2 an APR locus. Nevertheless, Sr2 has been reported to be tightly linked to a specific leaf 423
chlorosis (mosaic) phenotype that was not observed in the panel (Olivera, unpublished results). 424
However, the genomic region at wmc43 on chromosome arm 3BS conferring resistance to races 425
TTKSK and TTTTF is in the same region as a previously reported QTL region for field stem rust 426
resistance (Yu et al. 2011). 427
Four markers that were mapped in a 28.7 cM-wide region (as estimated based on the consensus map 428
reported in Letta et al. 2013) on chromosome arm 6AL with negligible LD as to each other (gwm169, 429
gwm427, CD926040 and barc104) were strongly associated with resistance to all stem rust races and 430
showed significant effects in the same region previously reported to harbor genes for stem rust 431
resistance. For instance, gwm427, CD926040 and barc104 correspond to the region reported by Simons 432
The Plant Genome: Posted 22 Nov. 2013; doi: 10.3835/plantgenome2013.08.0026

et al. (2011) and Letta et al. (2013) while gwm169 co-locates with Sr26, a gene effective against Ug99 433
(Singh et al. 2006) and the Ethiopian races (Badebo and Ammar, unpublished results). However, Sr26 434
has been reported to be present exclusively in bread wheat following an introgression from the wild 435
relative Thynopirum elongatum, thus its presence within the elite durum wheat germplasm included in 436
this study is unlikely. The gwm427-CD926040-barc104-wide region co-locates with Sr13 that in 437
tetraploid wheat has been mapped within a 1.2 to 2.8 cM interval, flanked by the EST-derived markers 438
CD926040 and BE471213 (Admassu et al. 2011; Dubcovsky et al. 2011; Simons et al. 2011). In our 439
study, CD926040 showed the largest R2 value and significance effects for resistance to all four races. 440
Sr13 is effective against the TTKS complex of Pgt namely TTKSK (Ug99), TTKST and TTTSK but its 441
resistance has been overcome by Ethiopian stem rust populations (Admassu et al. 2009) and more 442
specifically by the two recently characterized Ethiopian races (TRTTF and JRCQC) used in this study 443
and collected at the site near Debre Zeit (Olivera et al. 2012). The strong association between the 444
markers located in the Sr13 region and resistance to the TRTTF and JRCQC races as well as to the 445
moderate resistance shown in Debre Zeit field trials suggests the presence on chromosome arm 6AL of 446
an additional and novel gene closely linked to Sr13. Fine mapping and more precise characterization of 447
allelic variation (SNP-haplotyping) present in the germplasm will help to elucidate the precise genetic 448
basis underlying the chromosome 6AL-related resistance to stem rust in durum wheat. Other Sr genes 449
were mapped to chromosome 6A, such as Sr5 and Sr8a, both highly effective for races TRTTF and 450
JRCQC (Yue Jin, personal communication). However, their mapping locations did not coincide with 451
the 6AL-distal region. 452
Two significant QTLs for resistance to stem rust were found on chromosome arm 7AL, where Sr22 and 453
Sr15 are located. Sr15 is distally located on chromosome arm 7AL near gwm344 while wPt-7299 454
appears to be linked to Sr22. Finally, AM detected a QTL at the distal end of chromosome arm 7BL 455
near wmc517, a region known to harbor Sr17, a gene linked to Lr14a and Pm5 in bread wheat (Crossa 456
et al. 2007). It is also consistent with a region reported to include a stem rust QTL in the Arina x Forno 457
The Plant Genome: Posted 22 Nov. 2013; doi: 10.3835/plantgenome2013.08.0026
RIL population (Bansal et al. 2008). The majority (30 out of 41) of significant markers tagged regions 458
where no stem rust genes had previously been reported. These regions with significant associations 459
were detected for all chromosome groups except for Group 1. Six of these regions were also relevant 460
for adult-based field resistance in Debre Zeit. 461
Among the regions for which designated candidate loci could not be envisaged, cfa2201 and wPt-5839 462
co-located in a region on chromosome 2A known to host Sr38 and Sr34, respectively. However, both 463
designated genes are ineffective against the Ug99 race lineage (Jin et al. 2007; Singh et al. 2011) and 464
originate from T. comosum and T. ventricosum, which makes their presence in durum wheat unlikely. 465
QTLs on chromosome 3A (gwm1620 and wmc264) mapped where Sr27 and Sr35, both effective 466
against Ug99, have been reported (McIntosh et al. 1995; Singh et al. 2006; Jin et al. 2007). However, as 467
Sr27 originated from a wheat-rye translocation present mostly in triticale and Sr35 from T. 468
monococcum and then transferred to some tetraploids of Canadian origin, none of which were present 469
in this study or in the pedigree of the accessions of the AM panel, the chromosome 3A-related 470
associations detected herein are likely to involve alternative and unknown loci. Additionally, no Sr gene 471
has been reported on chromosome arm 3BL and thus the significant effects associated with wmc418 472
and wPt-9049 is likely due to putatively novel loci. Similarly, the QTL on chromosome arm 4AL with a 473
major effect for race JRCQC and the QTL on chromosome 4BL for race TTTTF represent new race-474
specific loci for stem rust resistance. 475
The significant markers identified on chromosomes 5A and 5B did not overlap with any reported major 476
Sr gene, although QTLs for response to Ug99 have been mapped in similar locations in hexaploid 477
wheat and represent six novel loci for resistance in durum wheat (Yu et al. 2011). Accordingly, all the 478
four significant regions identified on chromosome arm 6BS did not coincide with any of the reported 479
major Sr genes and thus may also represent new Sr loci. Additionally, the two genomic regions detected 480
on chromosome 7AS by wPt-6668 and wPt-7188 were not significantly associated with stem rust 481
resistance in previous reports. Although no Sr gene has been reported for chromosome arm 7BS, two 482
The Plant Genome: Posted 22 Nov. 2013; doi: 10.3835/plantgenome2013.08.0026

distinct QTLs were detected for race JRCQC near gwm573 and gwm333, which could thus also be 483
considered as novel Sr loci. Following further characterization and validation, diagnostic markers for 484
all these resistance loci reported in this paragraph would be useful for enhancing APR to stem rust, 485
provided they are also associated with broad range, adult plant resistance. 486
Reaction of race-specific resistance genes 487
All designated genes, except Sr2 and the recently characterized Sr55 and Sr57 are race specific. In our 488
study, several race-specific QTLs associated to resistance to three or four of the races were detected 489
that, upon pyramiding, may reduce susceptibility and enhance durability. Most studies in which several 490
races were used to detect QTLs for resistance have reported either race-specific QTLs (Niks et al. 491
2000; Zhu et al. 2003) or a combination of broad-spectrum and race-specific QTLs with various effects 492
on resistance (Qi et al. 1999). The results of our study appear even more complex, since it was possible 493
to report the concomitant presence of different categories of loci involved in the stem rust response, 494
such as (i) race-specific QTLs with strong effects on resistance (e.g. the QTL on chromosome 2B 495
tagged by wPt-2293 and gwm47 for race TRTTF and the QTL on chromosome 4A tagged by barc78 for 496
race JRCQC), (ii) QTLs with relatively strong effects that were confirmed across at least two races 497
(e.g. QTL on chromosome 7B tagged by wmc517 for races TTKSK and TTTTF), (iii) some minor 498
QTLs were effective across all races (QTL on chromosome 5A tagged by gwm410) and (iv) the QTL 499
cluster on chromosome 6A tagged by CD926040 and barc104 that showed broad spectrum resistance 500
with major effects for races TTKSK, TTTTF and JRCQC and relatively minor effects for race TRTTF. 501
The greater complexity observed in our study could partly derive from the evaluation of a large number 502
of accessions originated from different genetic backgrounds tested with races characterized by distinct 503
virulence. 504
505
The Plant Genome: Posted 22 Nov. 2013; doi: 10.3835/plantgenome2013.08.0026
Breeding perspectives and Conclusions 506
This study clearly shows that the level of seedling resistance to stem rust in elite durum wheat is 507
governed by a relatively high number (41 in total) of QTLs whose effects have been detected across 508
races as well as in race-specific interactions. Among these, a sizeable portion (73%) are novel 509
chromosome regions for which no previously designated loci have been mapped. Notwithstanding the 510
clearly quantitative and complex base of genetic response to stem rust in the elite materials studied 511
herein, the few (up to ten) marker loci that proved successful in tagging a sizeable portion of the 512
phenotypic variation can be conveniently used for pre-screening of the breeding germplasm to be used 513
in crosses specifically designed to improve stem rust resistance. 514
In the case of the major QTL on chromosome 6A (known to harbor Sr13), the results with the single 515
races suggest that the resistance could be more complex than what was expected based on the model of 516
a single gene-for-gene interaction. Selection for markers closely linked to these loci has thus the 517
potential to improve stem rust resistance in pedigree-related breeding materials based upon marker 518
haplotyping (Maccaferri et al. 2007; Yu et al. 2010; Haile et al. 2013). Suitable markers are already 519
available for Sr9 (Tsilo et al. 2007), Sr13 (Simons et al. 2011), Sr26 (Mago et al. 2005; Liu et al. 2010) 520
and Sr25 (Yu et al. 2010). If further confirmed, the QTLs reported here for seedling resistance and the 521
corresponding closely linked molecular markers will contribute to broadening the genetic basis of stem 522
rust resistance, an important goal of durum wheat breeding. Our results indicate the suitability of AM to 523
identify novel sources of stem rust resistance alleles in order to accelerate durum wheat improvement 524
and cultivar release. Additionally, the results confirm the role of Sr9, Sr13 and Sr14 previously 525
described in biparental mapping studies while unveiling the presence of putatively novel loci. 526
Combining the results of this study with those on APR in the field where races such as TTKSK, TRTTF 527
and JRCQC prevail (Letta et al. 2013) will facilitate the selection of suitable parental lines for further 528
improving stem rust resistance of durum wheat. Notably, some of the durum wheat lines that were 529
tested herein carry resistance to all four Pgt races. Interestingly, a number of these accessions 530
The Plant Genome: Posted 22 Nov. 2013; doi: 10.3835/plantgenome2013.08.0026

characterized by an overall valuable phenotypic response to stem rust and carrying beneficial resistance 531
alleles at different QTLs at the same time have been identified and reported. These accessions would 532
then be useful donor parents in traditional breeding programs as well as in marker-assisted 533
backcrossing schemes aimed at selecting lines with resistance alleles at different loci in an elite genetic 534
background. Further characterization of sets of near-isogenic lines in different genetic backgrounds 535
would confirm the QTL effects while providing more accurate estimates of allelic effects and their 536
possible epistatic interactions. In the near future, the availability of high-density SNP platforms 537
including thousands of markers will allow for studies with almost complete genome coverage and a 538
much more refined resolution at the haplotype level (Trebbi et al. 2011; You et al. 2011; van Poeke et 539
al. 2013). The use of the same SNP assays in applied breeding programs will also facilitate the 540
simultaneous selection of multiple, beneficial alleles for partial resistance. Finally, the relatively large 541
number and small effects of the QTLs herein described suggest that a more comprehensive selection 542
strategy, such as genomic selection (Heffner et al. 2009; Rutkoski et al. 2011 and 2012), may prove 543
more cost-effective than conventionall MAS at accumulating beneficial alleles in breeding populations. 544
Acknowledgments 545
The financial contribution of the Beachell-Borlaug International Scholar Initiative to support Tesfaye L. 546
Dugo and the AGER-Agroalimentare e Ricerca" foundation, "From Seed to Pasta" project are 547
gratefully acknowledged. 548
549
The Plant Genome: Posted 22 Nov. 2013; doi: 10.3835/plantgenome2013.08.0026

References 550
Adhikari, T.B., S. Gurung, J.M. Hansen, E.W. Jackson, J.M. Bonman. 2012. Association mapping of 551
Quantitative Trait Loci in spring wheat landraces conferring resistance to bacterial leaf streak and spot 552
blotch. Plant Genome 5:1–16 553
Admassu, B. and E. Fekadu. 2005. Physiologic races and virulence diversity of Puccinia graminis f. sp. 554
tritici on wheat in Ethiopia. Phytopathol. Mediterr. 44:313–318 555
Admassu, B., V. Lind, W. Friedt, F. Ordon. 2009. Virulence analysis of Puccinia graminis f. sp. tritici 556
populations in Ethiopia with special consideration of Ug99. Plant Pathol. 58:362–369 557
Admassu, B., D. Perovic, W. Friedt, F. Ordon. 2011. Genetic mapping of the stem rust (Puccinia 558
graminis f. sp. tritici Eriks. & E. Henn) resistance gene Sr13 in wheat (Triticum aestivum L.). Theor. 559
Appl. Genet. 122: 643–648 560
Akbari, M., P. Wenzl, V. Caig , J. Carling, L. Xia, S. Yang, G. Uszynski, V. Mohler, A. Lehmensiek, H. 561
Kuchel, M.J. Hayden, N. Howes, P. Sharp, P. Vaughan, B. Rathmell, E. Huttner, A. Kilian 2006. 562
Diversity arrays technology (DArT) for high-throughput profiling of the hexaploid wheat genome. 563
Theor. Appl. Genet. 113:1409–1420 564
Bansal, U.K., E. Bossolini, H. Miah, B. Keller, R.F. Park, H.S. Bariana 2008. Genetic mapping of 565
seedling and adult plant stem rust resistance in two European winter wheat cultivars. Euphytica 566
164:821–828 567
Bhavani, S., R.P. Singh, O. Argillier, J. Huerta-Espino , S. Singh, P. Njau, S. Brun, S. Lacam, N. 568
Desmouceaux 2011. Mapping durable adult plant stem rust resistance to the race Ug99 group in six 569
CIMMYT wheats. In: McIntosh RA (ed) BGRI 2011 Technical Workshop. Borlaug Global Rust 570
Initiative, St Paul, MN, USA, pp 43-53 571
Bradbury, PJ, Z Zhang, DE Kroon, TM Casstevens, Y Ramdoss, ES Buckler 2007. TASSEL: software 572
for association mapping of complex traits in diverse samples. Bioinformatics 23:2633–2635 573
Breseghello, F., M.E. Sorrells. 2006. Association mapping of kernel size and milling quality in wheat 574
(Triticum aestivum L.) cultivars. Genetics. 172:1165–1177 575
de Givry, S, M Bouchez, P Chabrier, D Milan, T Schiex 2005. CAR(H)(T)AGene: multipopulation 576
integrated genetic and radiation hybrid mapping. Bioinformatics 21:1703–1704 577
The Plant Genome: Posted 22 Nov. 2013; doi: 10.3835/plantgenome2013.08.0026

Dubcovsky, J., F. Ordon, D. Perovic, B. Admassu, W. Friedt, Z. Abate, W. Zhang, S. Chao. 2011. 578
Conflicting mapping results for stem rust resistance gene Sr13. Theor. Appl. Genet. 122:659–659 579
Eversmeyer, M.G., C.L. Kramer 2000. Epidemiology of wheat leaf and stem rust in the central Great 580
Plains of the USA. Annu. Rev. Phytopathol.. 38:491–513 581
Flint-Garcia, S.A., J.M. Thornsberry, E.S. Buckler 2003. Structure of linkage disequilibrium in plants. 582
Annu. Rev. Plant Biol. 54:357–374 583
Gupta, P.K., S. Rustgi, P.L. Kulwal 2005. Linkage disequilibrium and association studies in higher 584
plants: present status and future prospects. Plant Mol. Biol. 57:461–485 585
Haile, J.K., M.M. Nachit, K. Hammer, A .Badebo, M.S. Roder 2012. QTL mapping of resistance to 586
race Ug99 of Puccinia graminis f. sp. tritici in durum wheat (Triticum durum Desf.) Mol. Breed. 587
30:1479–1493 588
Haile, J.K., K. Hammer, A. Badebo, R.P. Singh, M. Röder. 2013. Haplotype analysis of molecular 589
markers linked to stem rust resistance genes in Ethiopian improved durum wheat varieties and 590
tetraploid wheat landraces. Genet. Resour. Crop Evol. 60:853–864 591
Hall, D., C. Tegstrom, P.K. Ingvarsson. 2010. Using association mapping to dissect the genetic basis of 592
complex traits in plants. Brief Funct. Genom. 9:157–165 593
Heffner, E.L., M.E. Sorrells, J. Jannink. 2009. Genomic selection for crop improvement. Crop Sci. 594
49:1–12 595
Hiebert, C.W., T.G. Fetch, T. Zegeye. 2010. Genetics and mapping of stem rust resistance to Ug99 in 596
the wheat cultivar Webster. Theor. Appl. Genet. 121:65–69 597
Ingala, L., M. Lopez, M. Darino, M.F. Pergolesi, M.J. Diequez, F. Sacco 2012. Genetic analysis of leaf 598
rust resistance genes and associated markers in the durable resistant wheat cultivar Sinvalocho MA. 599
Theor. Appl. Genet. 124:1305–1314. 600
Jin, Y., R.P. Singh, R.W. Ward, R. Wanyera, M. Kinyua, P. Njau. ZA Pretorius 2007. Characterization of 601
seedling infection types and adult plant infection responses of monogenic Sr gene lines to race TTKS 602
of Puccinia graminis f. sp. tritici. Plant Dis. 91:1096–1099 603
Jin, Y., L.J. Szabo, Z.A. Pretorius, R.P. Singh, R. Ward, T.J.R. Fetch 2008. Detection of virulence to 604
resistance gene Sr24 within race TTKS of Puccinia graminis f. sp. tritici. Plant Dis. 92:923–926 605
The Plant Genome: Posted 22 Nov. 2013; doi: 10.3835/plantgenome2013.08.0026
Klindworth, D.L., J.D. Miller, Y. Jin, S.S. Xu 2007. Chromosomal locations of genes for stem rust 606
resistance in monogenic lines derived from tetraploid wheat accession ST464. Crop Sci. 47:1441–1450 607
Kollers, S., B. Rodemann, J. Ling, V. Korzun, E. Ebmeyer, O. Argillier, M. Hinze, J. Plieske, D. 608
Kulosa, M.W. Ganal, M.S. Röder 2013. Whole Genome Association Mapping of Fusarium Head Blight 609
Resistance in European Winter Wheat (Triticum aestivum L.) PLoS One 8(2):e57500 610
Letta, T., M. Maccaferri, K. Ammar, A. Badebo, A. Ricci, J. Crossa, R. Tuberosa 2013. Searching for 611
novel sources of field resistance to Ug99 and Ethiopian stem rust races in durum wheat via association 612
mapping. Theor. Appl. Genet. 126:1237-1256 613
Liu, S., L.X. Yu, R.P. Singh, Y. Jin, M.E. Sorrells, JA Anderson (2010) Diagnostic and co-dominant 614
PCR markers for wheat stem rust resistance genes Sr25 and Sr26. Theor. Appl. Genet. 120:691–697 615
Maccaferri, M., M.C. Sanguineti, E. Noli, R. Tuberosa 2005. Population structure and long-range 616
linkage disequilibrium in a durum wheat elite collection. Mol. Breed. 15:271–289 617
Maccaferri, M., M.C. Sanguineti, V. Natoli, J.L.A. Ortega, M. Ben Salem, J. Bort, C. Chenenaoui, E. 618
De Ambrogio, L.G. del Moral, A. De Montis, A. El- Ahmed, F Maalouf, H Machlab, M. Moragues, J. 619
Motawaj, M. Nachit, N. Nserallah, H. Ouabbou, C. Royo, R. Tuberosa. 2006. A panel of elite 620
accessions of durum wheat (Triticum durum Desf.) suitable for association mapping studies. Plant Gen. 621
Res. 4:79–85 622
Maccaferri, M., M.C. Sanguineti, C. Xie, J.S. Smith, Tuberosa R 2007. Relationships among durum 623
wheat accessions. II. A comparison of molecular and pedigree information. Genome 50:385–399. 624
Maccaferri, M., M.C. Sanguineti, S. Corneti, J.L.A. Ortega, M. Ben Salem, J. Bort, De.Ambrogio E, 625
LFG del Moral, A. Demontis, A.El-Ahmed, F. Maalouf, H. Machlab, V. Martos, M ..Moragues, J. 626
Motawaj, M. Nachit, N. Nserallah, H. Ouabbou, C. Royo, A. Slama, R. Tuberosa 2008. Quantitative 627
trait loci for grain yield and adaptation of durum wheat (Triticum durum Desf.) across a wide range of 628
water availability. Genetics 178:489–511 629
Maccaferri, M., M.C. Sanguineti, P. Mantovani, A. Demontis, A. Massi, K. Ammar, J. Kolmer, J. 630
Czembor, S. Ezrati, R. Tuberosa 2010. Association mapping of leaf rust response in durum wheat. Mol. 631
Breed. 26:189–228 632
Maccaferri, M., M.C. Sanguineti, L.F.G. del Moral, A. Demontis, A. El.-Ahmed, F. Maalouf, H 633
.Machlab, V. Martos, M. Moragues, J. Motawaj , M. Nachit, N. Nserallah, H. Ouabbou, C. Royo, A 634
The Plant Genome: Posted 22 Nov. 2013; doi: 10.3835/plantgenome2013.08.0026
Slama, Tuberosa R. 2011. Association mapping in durum wheat grown across a broad range of water 635
regimes and yield potential. J. Exp. Bot. 62:409–438 636
Mago, R, HS Bariana., I.S. Dundas, W. Spielmeyer, G.J. Lawrence, A.J. Pryor, JG Ellis 2005. 637
Development of PCR markers for the selection of wheat stem rust resistance genes Sr24 and Sr26 in 638
diverse wheat germplasm. Theor. Appl. Genet. 111:496–504 639
Mago, R., G. Brown-Guedira, S. Dreisigacker, J Breen, Y Jin, R Singh, R Appels, ES Lagudah, J Ellis, 640
W Spielmeyer. 2010. An accurate DNA marker assay for stem rust resistance gene Sr2 in wheat. Theor. 641
Appl. Genet. 122:735–744 642
Mantovani, P, M Maccaferri, M.C. Sanguineti, R. Tuberosa, i Catizone, P. Wenzl, B. Thomson, J. 643
Carling, H. Eric, E. De-Ambrogio, A. Kilian. 2008. An integrated DArT-SSR linkage map of durum 644
wheat. Mol. Breed. 22:629–648 645
McIntosh, R.A., C.R. Wellings, R.F. Park. 1995. Wheat rusts: an atlas of resistance genes. CSIRO, 646
Canberra 647
McIntosh, R.A., G.N. Brown. 1997. Anticipatory breeding for resistance to rust diseases in wheat. 648
Annu. Rev. Phytol. 35:311–326 649
Niks, R.E., E. Fernández, B. Van Haperen, B. Bekele Aleye, F.B. Martínez 2000. Specificity of QTLs 650
for partial and non-host resistance of barley to leaf rust fungi. Acta Phytopathol. Hun. 35:13–21 651
Olivera, P.D., Y. Jin, M. Rouse, A. Badebo , T. Fetch, Jr., R.P. Singh, and A.M. Yahyaoui. 2012. Races 652
of Puccinia graminis f. sp. tritici with combined virulence to Sr13 and Sr9e in a field stem rust 653
screening nursery in Ethiopia. Plant Dis. 96:623–628 654
Pretorius, Z.A., R.P. Singh, W.W. Wagoire, T.S. Payne 2000. Detection of virulence to wheat stem rust 655
resistance gene Sr31 in Puccinia graminis f. sp. tritici in Uganda. Plant Dis. 84:203 656
Pritchard, J.K., M. Stephens, P. Donnelly 2000. Inference of population structure using multilocus 657
genotype data. Genetics 155:945–959 658
Qi, X., G. Jiang, W. Chen, R.E. Niks, P. Stam, P. Lindhout 1999. Isolate-specific QTLs for partial 659
resistance to Puccinia hordei in barley. Theor. Appl. Genet. 99:877–884 660
Roelfs, A.P., J.W. Martens. 1988. An international system of nomenclature for Puccinia graminis f. sp. 661
tritici. Phytopathology 78:526–533 662
The Plant Genome: Posted 22 Nov. 2013; doi: 10.3835/plantgenome2013.08.0026

Roelf, A.P., D.L. Long, J.J. Robert 1993. Races of Puccinia graminis in the United States during 1990. 663
Plant Dis. 77:125–128 664
Rohlf, F.J. 1997. NTSYS-pc version 2.0. Exeter Press, East Setauket, NY, USA 665
Rouse, M.N., I.C. Nava, S. Chao, J.A. Anderson, Y. Jin 2012. Identification of markers linked to the 666
race Ug99 effective stem rust resistance gene Sr28 in wheat (Triticum aestivum L.). Theor. Appl. Genet. 667
125:877–885 668
Roy, J.K., K.P .Smith, G.J. Muehlbauer, S. Chao, T.J. Close, B.J. Steffenson. 2010. Association 669
mapping of spot blotch resistance in wild barley. Mol. Breed. 26:243–256 670
Rutkoski, J.E., E.L. Heffner, M.E. Sorrells 2011. Genomic selection for durable stem rust resistance in 671
wheat. Euphytica 179:161–173 672
Rutkoski, J.E., J Benson, Y. Jia, G. Brown-Guedira, J.-L. Jannink, M. Sorrells 2012. Evaluation of 673
genomic prediction methods for Fusarium head blight resistance in wheat. Plant Genome 5:51-61 674
Schuelke, M. 2000. An economic method for the fluorescent labelling of PCR fragments. Nat. 675
Biotechnol. 18:233–234 676
Simons, K, Z. Abate , S. Chao , W. Zhang , M. Rouse , Y. Jin , E. Elias, J. Dubcovsky 2011. Genetic 677
mapping of stem rust resistance gene Sr13 in tetraploid wheat (Triticum turgidum ssp. durum L.) Theor. 678
Appl. Genet. 122:649–658 679
Singh, R.P., D.P. Hodson, Y. Jin, J. Huerta-Espino, M.G. Kinyua, R. Wanyera, P. Njau, R.W. Ward 680
2006. Current status, likely migration and strategies to mitigate the threat to wheat production from 681
race Ug99 (TTKS) of stem rust pathogen. In: CAB reviews: perspectives in agriculture, veterinary 682
science, nutrition and natural resources. 1, No. 054 683
Singh, R.P., D.P. Hadson, J. Huerta-Espino, Y. Jin, S. Bhavani, P. Njau, S. Herrera-Foessel, Singh P.K., 684
Singh S., Govindan V. 2011. The emergence of Ug99 races of the stem rust fungus is a threat to world 685
wheat production. Ann. Rev. Phytopathol. 49:465–481 686
Singh, A., M.P. Pandey, A.K. Singh, Knox R.E., Ammar K., J.M. Clarke, F.R. Clarke, Singh R.P., C.J. 687
Pozniak, R.M. Depauw, B.D. McCallum, R.D. Cuthbert, H.S. Randhawa, Fetch T.G. 2013. 688
Identification and mapping of leaf, stem and stripe rust resistance quantitative trait loci and their 689
interactions in durum wheat. Mol. Breed. 31:405–418 690
The Plant Genome: Posted 22 Nov. 2013; doi: 10.3835/plantgenome2013.08.0026

Stakman, E.C., D.M. Steward, W.Q. Loegering. 1962. Identification of physiologic races of Puccinia 691
graminis var. tritici. US Dep. Agric. Agric. Res. Serv. E-617 692
Storey, J.D., R. Tibshirani 2003. Statistical significance for genome wide studies. Proc. Natl. Acad. Sci. 693
USA 100:9440–9445 694
Sukumaran, S., J. Yu. 2013. Association mapping of genetic resources: Achievements and future 695
perspectives. In Tuberosa R, Graner A, Frison E (eds) Genomics of Plant Genetic Resources, Springer, 696
Berlin, in press 697
Trebbi, D., M. Maccaferri, P. de Heer, A. Sorensen, S. Giuliani, S. Salvi, M.C. Sanguineti, A. Massi, 698
E.A.G. van der Vossen, R Tuberosa. 2011. High-throughput SNP discovery and genotyping in durum 699
wheat (Triticum durum Desf.). Theor. Appl. Genet. 123:555–569 700
Tsilo, T.J., Y. Jin, J.A. Anderson. 2007. Microsatellite markers linked to stem rust resistance allele Sr9a 701
in wheat. Crop Sci. 47:2013–2020 702
van Poecke, R., Maccaferri M., Tang J., Truong H., Janssen A., van Orsouw N., Salvi S., Sanguineti 703
M.C., Tuberosa R., E.A.G. van der Vossen. 2013. Sequence-based SNP genotyping in durum wheat. 704
Plant. Biotech. J. 11:809-817 705
You, F.M., N.X. Huo, K.R. Deal, Y.Q. Gu, M.C. Luo, P.E. McGuire, J. Dvorak, O.D. Anderson. 2011. 706
Annotation-based genome-wide SNP discovery in the large and complex Aegilops tauschii genome 707
using next-generation sequencing without a reference genome sequence. BMC Genomics 12:59 708
Yu, J.M., G. Pressoir, W.H. Briggs, IV, M. Yamasaki, J.F. Doebley, M.D. McMullen, B.S. Gaut, Nielsen 709
D.M., J.B. Holland, S. Kresovich, E.S. Buckler 2006. A unified mixed-model method for association 710
mapping that accounts for multiple levels of relatedness. Nat. Genet. 38:203–208 711
Yu, L-X., Z. Abate, J.A. Anderson, U.K. Bansal, Bariana H.S., S. Bhavani, J. Dubcovsky, ES Lagudah, 712
S.X. Liu, P.K. Sambasivam, R.P. Singh, M.E. Sorrells 2009. Developing and optimizing markers for 713
stem rust resistance in wheat. Proceedings of 2009 Technical Workshop, Borlaug Global Rust Initiative, 714
Cd. Obregón, Sonora, Mexico, pp 117-130 715
Yu, L-X., S. Liu, J.A. Anderson, R.P. Singh, Y. Jin, J Dubcovsky, G. Brown- S. Guedira, Bhavani, A 716
Morgounov, Z. He, J. Huerta-Espino, M.E. Sorrells. 2010. Haplotype diversity of stem rust resistance 717
loci in uncharacterized wheat lines. Mol. Breed. 26: 667–680 718
The Plant Genome: Posted 22 Nov. 2013; doi: 10.3835/plantgenome2013.08.0026

Yu, L-X., S. Liu, J.A. Anderson, R.P. Singh, Y. Jin, G. Brown-Guidera, S. Bhavani, A. Morgounov, Z. 719
He, J. Huerta-Espino, M.E. Sorrells 2010. Haplotype diversity of stem rust resistance loci in 720
uncharacterized wheat lines. Mol. Breed. 26:667–680 721
Yu, L-X., A. Lorenz, J. Rutkoski, R.P. Singh, S. Bhavani, J. Huerta-Espino, M.E. Sorrells. 2011. 722
Association mapping and gene-gene interaction for stem rust resistance in CIMMYT spring wheat 723
germplasm. Theor. Appl. Genet. 123:1257–1268 724
Yu, L-X., A. Morgounov, R. Wanyera, M. Keser, S.K. Singh, M.E. Sorrells. 2012. Identification of 725
Ug99 stem rust resistance loci in winter wheat germplasm using genome-wide association analysis. 726
Theor. Appl. Genet. 125:749–758 727
Zhang, D., G. Bai, C. Zhu, J. Yu, Carver B.F. 2010. Genetic diversity, population structure, and linkage 728
disequilibrium in U.S. elite winter wheat. Plant Genome 3:117-127 729
Zhang, D., R. Bowden, G. Bai. 2011. A method to linearize Stakman infection type ratings for statistical 730
analysis. In: Proceedings of the 2011 BGRI Technical Workshop, Minnesota, St. Paul, USA, June 17-731
20, 2011, 28. 732
Zhu, C., M. Gore, E.S. Buckler, Yu J 2008. Status and prospects of association mapping in plants. Plant 733
Genome 1:5–20 734
Zhu, S., K.J. Leonard, H.F. Kaeppler 2003. Quantitative trait loci associated with seedling resistance to 735
isolates of Puccinia coronata in oat. Phytopathol. 93:860-866 736
Zwer, PK, RF Park, RA McIntosh 1992. Wheat-Stem rust in Australia-1969-1985. Aust. J. Agric. Res. 737
43:399–432. 738
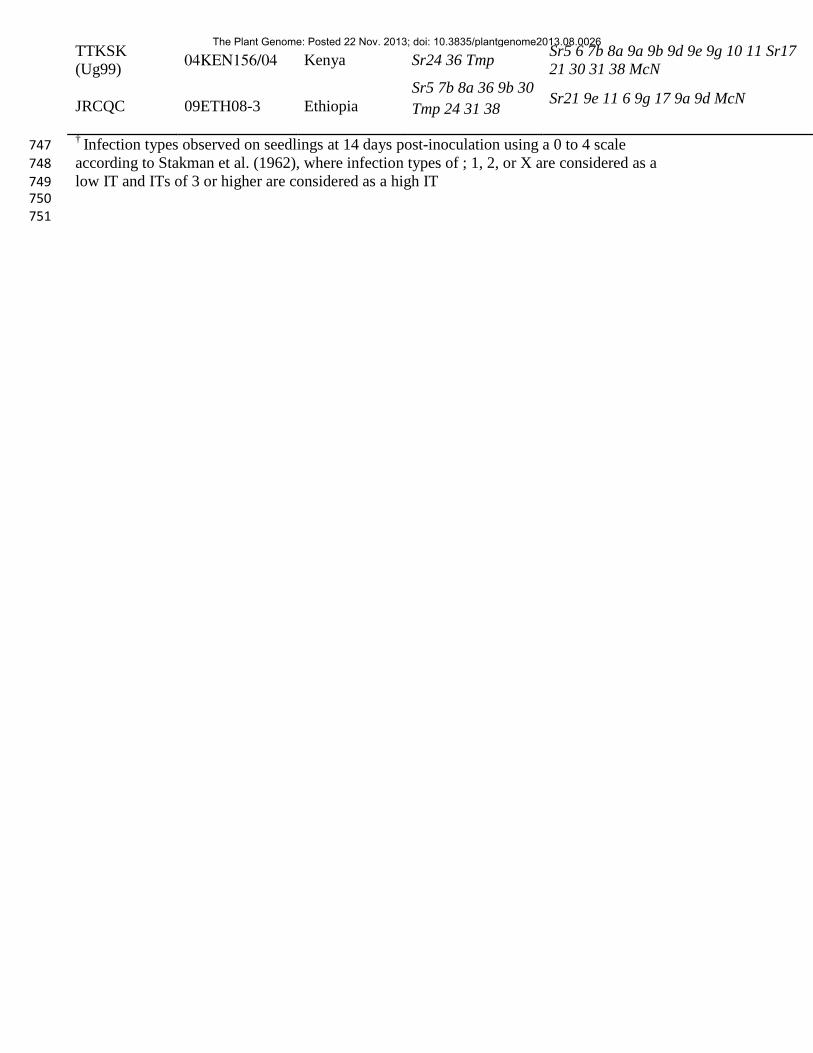
Fig. 1. Frequency distribution of Infection Types (ITs) of 183 durum genotypes challenged at the 739 seedling stage with four stem rust races. 740 Fig. 2. UPGMA-dendrogram of the 4 stem rust (Puccinia graminis Pers. F. sp. tritici) races used to 741 characterize the durum germplasm collection. 742 Table 1. Origin and virulence properties of the Puccinia graminis f. sp. tritici races used to 743 evaluate the durum panel. 744 745 746
Race Isolate Origin Avirulence Virulence
TRTTF 06YEM34-1 Yemen Sr8a 24 31 Sr5 6 7b 9a 9b 9d 9e 9g 10 11 17 Sr21 30 36 38 McN
TTTTF 01MN84A-1-2 United States Sr24 31 Sr5 6 7b 8a 9a 9b 9d 9e 9g 10 11 Sr17 21 30 36 38 McN
The Plant Genome: Posted 22 Nov. 2013; doi: 10.3835/plantgenome2013.08.0026
TTKSK (Ug99) 04KEN156/04 Kenya Sr24 36 Tmp Sr5 6 7b 8a 9a 9b 9d 9e 9g 10 11 Sr17
21 30 31 38 McN
JRCQC 09ETH08-3 Ethiopia Sr5 7b 8a 36 9b 30 Tmp 24 31 38 Sr21 9e 11 6 9g 17 9a 9d McN
† Infection types observed on seedlings at 14 days post-inoculation using a 0 to 4 scale 747 according to Stakman et al. (1962), where infection types of ; 1, 2, or X are considered as a 748 low IT and ITs of 3 or higher are considered as a high IT 749 750 751
The Plant Genome: Posted 22 Nov. 2013; doi: 10.3835/plantgenome2013.08.0026

Table 2. Numbers and frequencyies of infection types (IT) and resistant, susceptible and 752 heterogeneous reactions of the 183 durum genotypes included in the AM panel to four races of 753 Puccinia graminis f. sp. tritici and combined reactions to all races. 754 755
IT † / Reaction TRTTF TTTTF TTKSK (Ug99) JRCQC
Lines % Lines % Lines % Lines %
“0” or “;” 10 5.5 3 1.6 2 1.1 4 2.2 “1” 1 0.5 10 5.5 1 0.5 5 2.7 “2” or “23” or “X” 138 75.4 104 56.8 103 56.3 78 42.6 Resistant reaction 149 81.4 117 63.9 106 57.9 87 47.5
“3” 22 12.0 47 25.7 53 29.0 39 21.3 “4” 4 2.2 2 1.1 13 7.1 50 27.3 Susceptible reaction 26 14.2 49 26.8 66 36.1 89 48.6 Heterogeneous‡ 8 4.4 17 9.3 11 6.0 7 3.8 † Infection types observed on seedlings at 14 days post-inoculation using a 0 to 4 scale according to 756 Stakman et al. (1962), where infection types of ; 1, 2, or X are considered as a low IT and ITs of 3 or 757 higher are considered as a high IT 758 ‡ Accessions that contained both resistant and susceptible plants 759 760 761 762 763 764 765 766 767 768 769 770 771 772 773 774 775
776
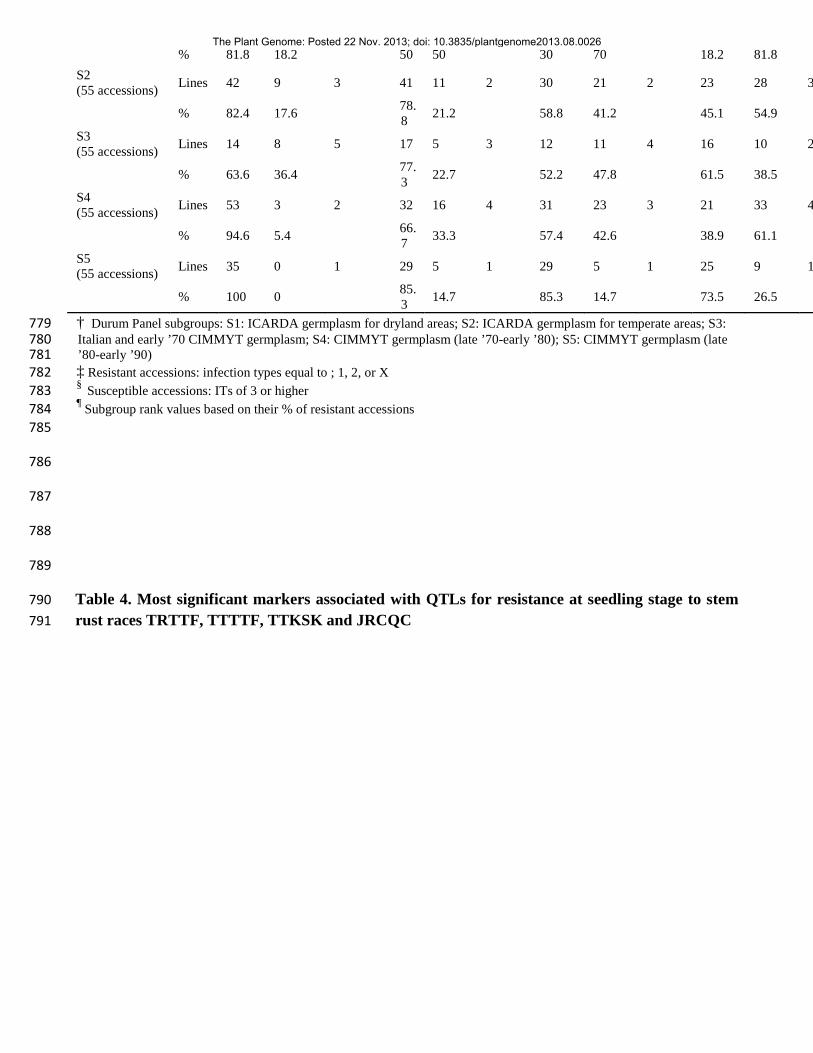
Table 3. Numbers and frequencies of reactions of 183 durum genotypes included in the AM panel 777 to four races of Puccinia graminis f. sp. tritici classified by origin subgroups. 778
Durum Panel subgroup† TRTTF TTTTF TTKSK JRCQC
Res.‡ Sus.§ % Res.¶ Res. Sus. % Res. Res. Sus. % Res. Res. Sus. %
no. no. rank no. no. rank no. no. rank no. no. ra S1 (11 accessions) Lines 9 2 4 5 5 5 3 7 5 2 9 5
The Plant Genome: Posted 22 Nov. 2013; doi: 10.3835/plantgenome2013.08.0026
% 81.8 18.2 50 50 30 70 18.2 81.8 S2 (55 accessions) Lines 42 9 3 41 11 2 30 21 2 23 28 3
% 82.4 17.6 78.8 21.2 58.8 41.2 45.1 54.9
S3 (55 accessions) Lines 14 8 5 17 5 3 12 11 4 16 10 2
% 63.6 36.4 77.3 22.7 52.2 47.8 61.5 38.5
S4 (55 accessions) Lines 53 3 2 32 16 4 31 23 3 21 33 4
% 94.6 5.4 66.7 33.3 57.4 42.6 38.9 61.1
S5 (55 accessions) Lines 35 0 1 29 5 1 29 5 1 25 9 1
% 100 0 85.3 14.7 85.3 14.7 73.5 26.5
† Durum Panel subgroups: S1: ICARDA germplasm for dryland areas; S2: ICARDA germplasm for temperate areas; S3: 779 Italian and early ’70 CIMMYT germplasm; S4: CIMMYT germplasm (late ’70-early ’80); S5: CIMMYT germplasm (late 780 ’80-early ’90) 781 ‡ Resistant accessions: infection types equal to ; 1, 2, or X 782 § Susceptible accessions: ITs of 3 or higher 783 ¶ Subgroup rank values based on their % of resistant accessions 784 785
786
787
788
789
Table 4. Most significant markers associated with QTLs for resistance at seedling stage to stem 790 rust races TRTTF, TTTTF, TTKSK and JRCQC 791
The Plant Genome: Posted 22 Nov. 2013; doi: 10.3835/plantgenome2013.08.0026

† P values of markers that showed significant (P ≤ 0.05) effects at the genome-wise level are reported 792 in bold 793 ‡ Results reported in Letta et al. (2013) 794 (continued) 795 796 797 798 799
P value (Q+K model)† R2 (%) Number of signi tests over four r
Marker Chr. cM TRTTF TTTTF TTKSK JRCQC TRTTF TTTTF TTKSK JRCQC Marker-wise tests
Genwis
wPt-1876 1B 31.3 - - - 0.0033 - - - 3.13 1 0 barc61 1B 87.2 0.0306 0.0393 0.0328 - 2.45 2.27 2.41 - 3 0 barc81 1B 119.9 - 0.0144 0.0131 - - 2.42 2.37 - 2 0 wmc44 1B 158.1 - 0.0283 - 0.0093 - 3.88 - 4.86 2 0 wPt-5839 2A 0 0.0165 0.0098 0.0155 - 1.60 2.44 2.17 - 3 0 cfa2201 2A 47.8 0.0054 - 0.0137 - 4.25 - 3.50 - 2 0 wPt-2293 2A 63.7 1.26E-4 - - - 4.20 - - - 1 1 gwm410 2B 64.1 0.009 - - - 3.70 - - - 1 0 gwm47 2B 158.9 1.81E-5 - - - 8.34 - - - 1 1
gwm1300 2B 169.1 - 0.0215 0.0041 - - 3.36 4.66 - 2 0 wmc356 2B 220 - 0.0421 - 0.008 - 2.44 - 4.22 2 0 wPt-1923 3A 46.4 - 0.0029 0.017 6.94E-4 - 3.17 2.09 3.98 3 1 gwm1620 3A 83 - 0.0375 - 0.0152 - 2.47 - 3.09 2 0 wmc264 3A 119.6 0.0217 - - 0.0322 3.7 - - 3.49 2 0 wmc43 3B 57.9 - 0.0127 0.0017 - - 2.75 4.87 - 2 1 wmc418 3B 122 0.0116 0.0143 - - 3.66 3.56 - - 2 0 wPt-9049 3B 182.5 - - - 0.0043 - - - 2.84 1 0 barc78 4A 110.6 - - - 6.87E-7 - - - 9.36 1 1 gwm1084 4B 91.9 - 0.0081 - - - 3.67 - - 1 0 gwm617 5A 4.4 - - 0.0024 - - - 4.80 - 1 0 gwm1570 5A 32.6 - - - 0.004 - - - 2.94 1 0 barc165 5A 57.1 - - - 0.0248 - - - 3.50 1 0 gwm410 5A 120 0.0155 0.0191 0.009 0.0032 2.04 1.92 2.56 3.56 4 0 wPt-5514 5B 0 - 0.011 0.0067 - - 2.48 2.89 - 2 0 gwm234 5B 27.2 - - - 0.007 - - - 3.51 1 0 wPt-0566 5B 189.1 0.0415 0.0021 - - 1.13 3.56 - - 2 0
The Plant Genome: Posted 22 Nov. 2013; doi: 10.3835/plantgenome2013.08.0026

800 801 802
803 804 805 806 807 808 809 810 811 812 813 814 815 816 Table 5. Percentage of phenotypic variation explained by the simultaneous fit 817 of the most significant markers associated with QTLs for resistance at seedling 818 stage to stem rust races TRTTF, TTTTF, TTKSK and JRCQC. 819
TRTTF TTTTF TTKSK JRCQC
Multiple regression model Markers R2 Markers R2 Markers R2 Markers
no. % no. % no. % no. Experiment-wise significant markers † 4 (7 alleles) 32.7 3 (9 alleles) 29.2 4 (9 alleles) 44.5 4 (11 alleles
P value (Q+K model)† R2 (%) Number o significant
Marker Chr. cM TRTTF TTTTF TTKSK JRCQC TRTTF TTTTF TTKSK JRCQC Marker-wise
G-w
gwm169 6A 126.6 - 0.002 0.0345 - - 3.68 1.75 - 2 0 gwm427 6A 139.5 - - 0.0153 0.0323 - - 2.49 1.51 2 0 CD926040 6A 143.9 0.0087 3.43E-12 4.17E-16 1.56E-10 3.52 17.64 23.12 15.33 4 3 barc104 6A 155.3 0.037 7.52E-7 3.35E-10 4.02E-6 2.84 11.95 17.82 10.47 4 3 wPt-2991 6B 19.4 - - - 0.0095 - - - 2.4 1 0 wPt-0470 6B 51.6 - 0.0088 0.0086 - - 2.45 2.50 - 2 0 gwm518 6B 84.1 - - 0.0032 - - - 4.31 - 1 0 gwm816 6B 102.1 - - - 0.0307 - - - 2.60 1 0 wPt-6668 7A 32.7 8.35E-4 - - - 2.70 - - - 1 1 wPt-7188 7A 80.4 0.0056 - 0.0341 - 2.11 - 1.77 - 2 0 wPt-7299 7A 150.7 - - 0.0037 - - - 3.14 - 1 0 gwm344 7A 241.9 5.25E-4 0.0088 - - 5.79 3.79 - - 2 1 gwm573 7B 66.6 - - - 0.0347 - - - 3.18 1 0 gwm333 7B 99.7 - - - 0.0182 - - - 3.90 1 0 wmc517 7B 155.6 - 1.73E-5 0.0016 - - 8.0 4.96 - 2 2 Total significant regions Marker-wise test 15 20 19 19
Total Regions after FDR Genome-wise test 4 3 4 4
The Plant Genome: Posted 22 Nov. 2013; doi: 10.3835/plantgenome2013.08.0026
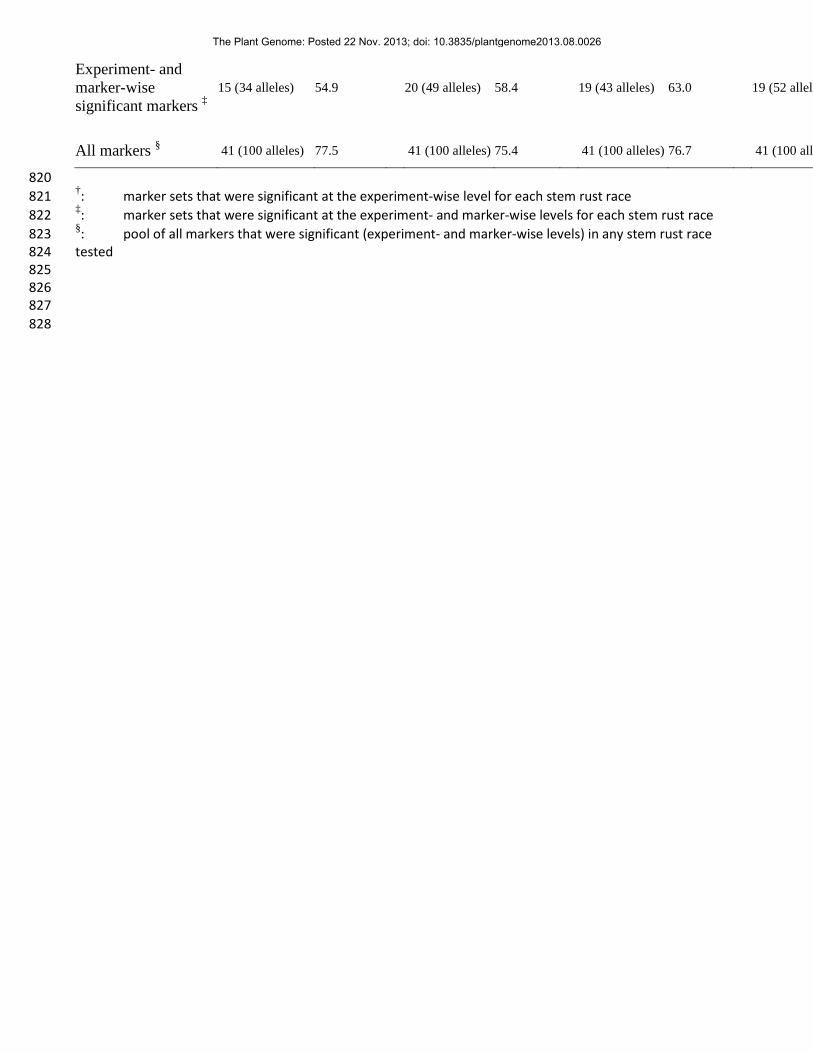
Experiment- and marker-wise significant markers ‡
15 (34 alleles) 54.9 20 (49 alleles) 58.4 19 (43 alleles) 63.0 19 (52 allele
All markers § 41 (100 alleles) 77.5 41 (100 alleles) 75.4 41 (100 alleles) 76.7 41 (100 alle
820 †: marker sets that were significant at the experiment-wise level for each stem rust race 821 ‡: marker sets that were significant at the experiment- and marker-wise levels for each stem rust race 822 §: pool of all markers that were significant (experiment- and marker-wise levels) in any stem rust race 823 tested 824 825 826 827 828
The Plant Genome: Posted 22 Nov. 2013; doi: 10.3835/plantgenome2013.08.0026

Fig. 1. Frequency distribution of Infection Types (ITs) of 183 durum genotypes challenged at the seedling stage with four stem rust races.
Infection Type (IT = 0-4)
Num
ber of accessions (no.)
ITs were assigned according to Long and Kolmer (1989) with resistant reactions indicated by ITs between 0-2 and susceptible reactions indicated by ITs of 3 or 4.
The Plant Genome: Posted 22 Nov. 2013; doi: 10.3835/plantgenome2013.08.0026
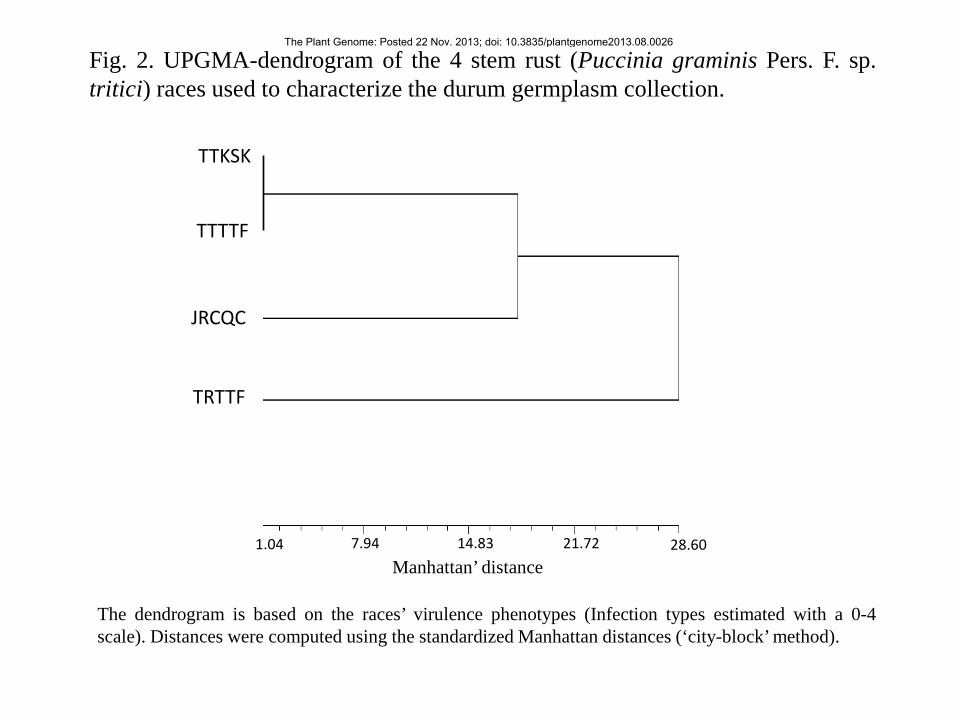
Fig. 2. UPGMA-dendrogram of the 4 stem rust (Puccinia graminis Pers. F. sp. tritici) races used to characterize the durum germplasm collection.
TTKSK
TTTTF
JRCQC
TRTTF
Manhattan’ distance 1.04 7.94 14.83 21.72 28.60
The dendrogram is based on the races’ virulence phenotypes (Infection types estimated with a 0-4 scale). Distances were computed using the standardized Manhattan distances (‘city-block’ method).
The Plant Genome: Posted 22 Nov. 2013; doi: 10.3835/plantgenome2013.08.0026
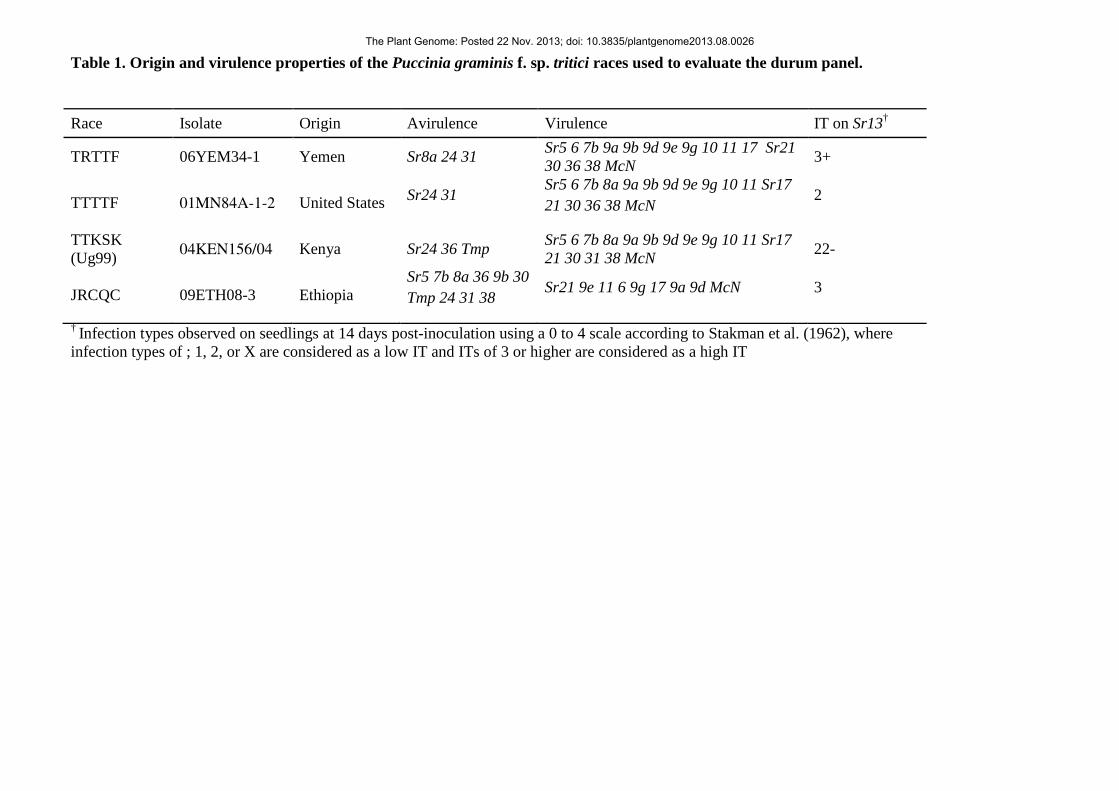
Table 1. Origin and virulence properties of the Puccinia graminis f. sp. tritici races used to evaluate the durum panel. Race Isolate Origin Avirulence Virulence IT on Sr13†
TRTTF 06YEM34-1 Yemen Sr8a 24 31 Sr5 6 7b 9a 9b 9d 9e 9g 10 11 17 Sr21 30 36 38 McN 3+
TTTTF 01MN84A-1-2 United States Sr24 31 Sr5 6 7b 8a 9a 9b 9d 9e 9g 10 11 Sr17 21 30 36 38 McN
2
TTKSK (Ug99) 04KEN156/04 Kenya Sr24 36 Tmp Sr5 6 7b 8a 9a 9b 9d 9e 9g 10 11 Sr17
21 30 31 38 McN 22-
JRCQC 09ETH08-3 Ethiopia Sr5 7b 8a 36 9b 30 Tmp 24 31 38 Sr21 9e 11 6 9g 17 9a 9d McN 3
† Infection types observed on seedlings at 14 days post-inoculation using a 0 to 4 scale according to Stakman et al. (1962), where infection types of ; 1, 2, or X are considered as a low IT and ITs of 3 or higher are considered as a high IT
The Plant Genome: Posted 22 Nov. 2013; doi: 10.3835/plantgenome2013.08.0026
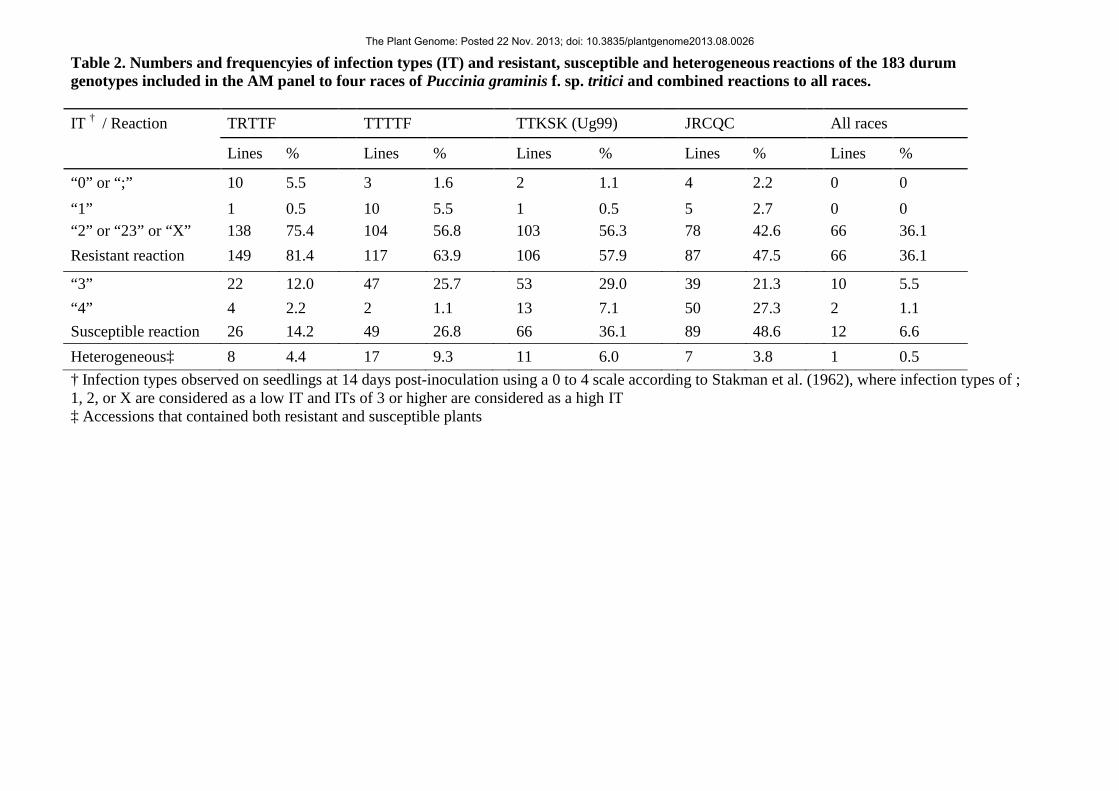
Table 2. Numbers and frequencyies of infection types (IT) and resistant, susceptible and heterogeneous reactions of the 183 durum genotypes included in the AM panel to four races of Puccinia graminis f. sp. tritici and combined reactions to all races. IT † / Reaction TRTTF TTTTF TTKSK (Ug99) JRCQC All races
Lines % Lines % Lines % Lines % Lines %
“0” or “;” 10 5.5 3 1.6 2 1.1 4 2.2 0 0 “1” 1 0.5 10 5.5 1 0.5 5 2.7 0 0 “2” or “23” or “X” 138 75.4 104 56.8 103 56.3 78 42.6 66 36.1 Resistant reaction 149 81.4 117 63.9 106 57.9 87 47.5 66 36.1
“3” 22 12.0 47 25.7 53 29.0 39 21.3 10 5.5 “4” 4 2.2 2 1.1 13 7.1 50 27.3 2 1.1 Susceptible reaction 26 14.2 49 26.8 66 36.1 89 48.6 12 6.6 Heterogeneous‡ 8 4.4 17 9.3 11 6.0 7 3.8 1 0.5 † Infection types observed on seedlings at 14 days post-inoculation using a 0 to 4 scale according to Stakman et al. (1962), where infection types of ; 1, 2, or X are considered as a low IT and ITs of 3 or higher are considered as a high IT
‡ Accessions that contained both resistant and susceptible plants
The Plant Genome: Posted 22 Nov. 2013; doi: 10.3835/plantgenome2013.08.0026

Table 3. Numbers and frequencies of reactions of 183 durum genotypes included in the AM panel to four races of Puccinia graminis f. sp. tritici classified by origin subgroups.
Durum Panel subgroup† TRTTF TTTTF TTKSK JRCQC Across races
Res.‡ Sus.§ % Res.¶ Res. Sus. % Res. Res. Sus. % Res. Res. Sus. % Res. Res. Sus. % Res.
no. no. rank no. no. rank no. no. rank no. no. rank no. no. rank S1 (11 accessions) Lines 9 2 4 5 5 5 3 7 5 2 9 5 2 1 4
% 81.8 18.2 50 50 30 70 18.2 81.8 66.7 33.3 S2 (55 accessions) Lines 42 9 3 41 11 2 30 21 2 23 28 3 22 6 3
% 82.4 17.6 78.8 21.2 58.8 41.2 45.1 54.9 78.6 21.4
S3 (55 accessions) Lines 14 8 5 17 5 3 12 11 4 16 10 2 8 4 5
% 63.6 36.4 77.3 22.7 52.2 47.8 61.5 38.5 66.7 33.3
S4 (55 accessions) Lines 53 3 2 32 16 4 31 23 3 21 33 4 19 2 2
% 94.6 5.4 66.7 33.3 57.4 42.6 38.9 61.1 90.5 9.5
S5 (55 accessions) Lines 35 0 1 29 5 1 29 5 1 25 9 1 26 0 1
% 100 0 85.3 14.7 85.3 14.7 73.5 26.5 100 0
† Durum Panel subgroups: S1: ICARDA germplasm for dryland areas; S2: ICARDA germplasm for temperate areas; S3: Italian and early ’70 CIMMYT germplasm; S4: CIMMYT germplasm (late ’70-early ’80); S5: CIMMYT germplasm (late ’80-early ’90)
‡ Resistant accessions: infection types equal to ; 1, 2, or X
§ Susceptible accessions: ITs of 3 or higher
¶ Subgroup rank values based on their % of resistant accessions
The Plant Genome: Posted 22 Nov. 2013; doi: 10.3835/plantgenome2013.08.0026

Table 4. Most significant markers associated with QTLs for resistance at seedling stage to stem rust races TRTTF, TTTTF, TTKSK and JRCQC
† P values of markers that showed significant (P ≤ 0.05) effects at the genome-wise level are reported in bold ‡ Results reported in Letta et al. (2013) (continued)
P value (Q+K model)† R2 (%) Number of significant tests over four races
Effectiveness under field conditions ‡
Suggestive designated Sr locus
Marker Chr. cM TRTTF TTTTF TTKSK JRCQC TRTTF TTTTF TTKSK JRCQC Marker-wise tests
Genome-wise tests
wPt-1876 1B 31.3 - - - 0.0033 - - - 3.13 1 0 yes (R2 = 4.6%) Sr14 barc61 1B 87.2 0.0306 0.0393 0.0328 - 2.45 2.27 2.41 - 3 0 yes (R2 = 1.0%) - barc81 1B 119.9 - 0.0144 0.0131 - - 2.42 2.37 - 2 0 no - wmc44 1B 158.1 - 0.0283 - 0.0093 - 3.88 - 4.86 2 0 no - wPt-5839 2A 0 0.0165 0.0098 0.0155 - 1.60 2.44 2.17 - 3 0 no - cfa2201 2A 47.8 0.0054 - 0.0137 - 4.25 - 3.50 - 2 0 no - wPt-2293 2A 63.7 1.26E-4 - - - 4.20 - - - 1 1 no - gwm410 2B 64.1 0.009 - - - 3.70 - - - 1 0 no - gwm47 2B 158.9 1.81E-5 - - - 8.34 - - - 1 1 no Sr9/Srweb
gwm1300 2B 169.1 - 0.0215 0.0041 - - 3.36 4.66 - 2 0 yes (R2 = 1.7%) Srweb wmc356 2B 220 - 0.0421 - 0.008 - 2.44 - 4.22 2 0 yes (R2 = 4.1%) Sr16/Sr28 wPt-1923 3A 46.4 - 0.0029 0.017 6.94E-4 - 3.17 2.09 3.98 3 1 yes (R2 = 2.2%) - gwm1620 3A 83 - 0.0375 - 0.0152 - 2.47 - 3.09 2 0 yes (R2 = 4.0%) - wmc264 3A 119.6 0.0217 - - 0.0322 3.7 - - 3.49 2 0 no - wmc43 3B 57.9 - 0.0127 0.0017 - - 2.75 4.87 - 2 1 no - wmc418 3B 122 0.0116 0.0143 - - 3.66 3.56 - - 2 0 no - wPt-9049 3B 182.5 - - - 0.0043 - - - 2.84 1 0 no - barc78 4A 110.6 - - - 6.87E-7 - - - 9.36 1 1 yes (R2 = 1.9%) - gwm1084 4B 91.9 - 0.0081 - - - 3.67 - - 1 0 no - gwm617 5A 4.4 - - 0.0024 - - - 4.80 - 1 0 no - gwm1570 5A 32.6 - - - 0.004 - - - 2.94 1 0 no - barc165 5A 57.1 - - - 0.0248 - - - 3.50 1 0 no - gwm410 5A 120 0.0155 0.0191 0.009 0.0032 2.04 1.92 2.56 3.56 4 0 no - wPt-5514 5B 0 - 0.011 0.0067 - - 2.48 2.89 - 2 0 no - gwm234 5B 27.2 - - - 0.007 - - - 3.51 1 0 no - wPt-0566 5B 189.1 0.0415 0.0021 - - 1.13 3.56 - - 2 0 no -
The Plant Genome: Posted 22 Nov. 2013; doi: 10.3835/plantgenome2013.08.0026
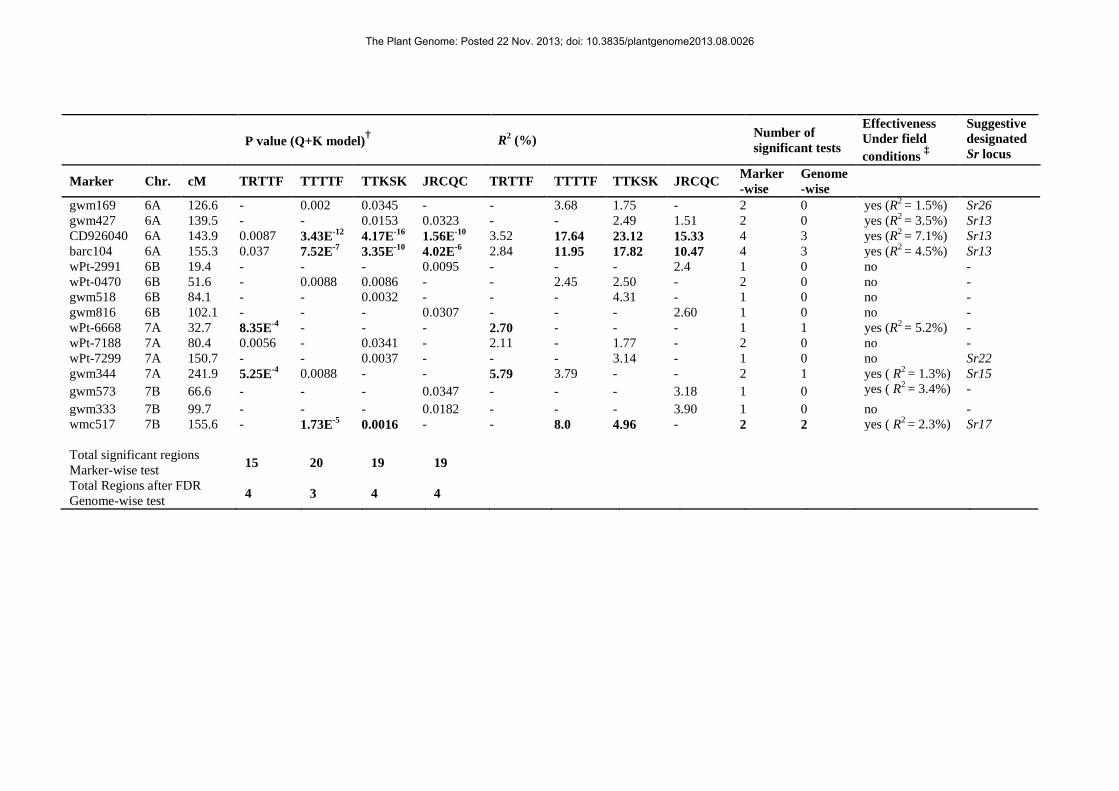
P value (Q+K model)† R2 (%) Number of significant tests
Effectiveness Under field conditions ‡
Suggestive designated Sr locus
Marker Chr. cM TRTTF TTTTF TTKSK JRCQC TRTTF TTTTF TTKSK JRCQC Marker-wise
Genome-wise
gwm169 6A 126.6 - 0.002 0.0345 - - 3.68 1.75 - 2 0 yes (R2 = 1.5%) Sr26 gwm427 6A 139.5 - - 0.0153 0.0323 - - 2.49 1.51 2 0 yes (R2 = 3.5%) Sr13 CD926040 6A 143.9 0.0087 3.43E-12 4.17E-16 1.56E-10 3.52 17.64 23.12 15.33 4 3 yes (R2 = 7.1%) Sr13 barc104 6A 155.3 0.037 7.52E-7 3.35E-10 4.02E-6 2.84 11.95 17.82 10.47 4 3 yes (R2 = 4.5%) Sr13 wPt-2991 6B 19.4 - - - 0.0095 - - - 2.4 1 0 no - wPt-0470 6B 51.6 - 0.0088 0.0086 - - 2.45 2.50 - 2 0 no - gwm518 6B 84.1 - - 0.0032 - - - 4.31 - 1 0 no - gwm816 6B 102.1 - - - 0.0307 - - - 2.60 1 0 no - wPt-6668 7A 32.7 8.35E-4 - - - 2.70 - - - 1 1 yes (R2 = 5.2%) - wPt-7188 7A 80.4 0.0056 - 0.0341 - 2.11 - 1.77 - 2 0 no - wPt-7299 7A 150.7 - - 0.0037 - - - 3.14 - 1 0 no Sr22 gwm344 7A 241.9 5.25E-4 0.0088 - - 5.79 3.79 - - 2 1 yes ( R2 = 1.3%) Sr15 gwm573 7B 66.6 - - - 0.0347 - - - 3.18 1 0 yes ( R2 = 3.4%) - gwm333 7B 99.7 - - - 0.0182 - - - 3.90 1 0 no - wmc517 7B 155.6 - 1.73E-5 0.0016 - - 8.0 4.96 - 2 2 yes ( R2 = 2.3%) Sr17 Total significant regions Marker-wise test 15 20 19 19
Total Regions after FDR Genome-wise test 4 3 4 4
The Plant Genome: Posted 22 Nov. 2013; doi: 10.3835/plantgenome2013.08.0026

Table 5. Percentage of phenotypic variation explained by the simultaneous fit of the most significant markers associated with QTLs for resistance at seedling stage to stem rust races TRTTF, TTTTF, TTKSK and JRCQC.
TRTTF TTTTF TTKSK JRCQC
Multiple regression model Markers R2 Markers R2 Markers R2 Markers R2
no. % no. % no. % no. % Experiment-wise significant markers † 4 (7 alleles) 32.7 3 (9 alleles) 29.2 4 (9 alleles) 44.5 4 (11 alleles) 46.5
Experiment- and marker-wise significant markers ‡
15 (34 alleles) 54.9 20 (49 alleles) 58.4 19 (43 alleles) 63.0 19 (52 alleles) 72.3
All markers § 41 (100 alleles) 77.5 41 (100 alleles) 75.4 41 (100 alleles) 76.7 41 (100 alleles) 80.9
†: marker sets that were significant at the experiment-wise level for each stem rust race ‡: marker sets that were significant at the experiment- and marker-wise levels for each stem rust race §: pool of all markers that were significant (experiment- and marker-wise levels) in any stem rust race tested
The Plant Genome: Posted 22 Nov. 2013; doi: 10.3835/plantgenome2013.08.0026


![Identification of Stripe Rust Resistance in Ethiopian Durum Wheat … · 2019-12-31 · KASP based assays are relatively easy-going, have better resolution power [42] and low cost](https://static.fdocuments.net/doc/165x107/5f1431d82aab826152599983/identification-of-stripe-rust-resistance-in-ethiopian-durum-wheat-2019-12-31-kasp.jpg)