ASSISTED DEVELOPMENT OF MESOPHASE PITCH WITH …
113
University of Kentucky University of Kentucky UKnowledge UKnowledge Theses and Dissertations--Mechanical Engineering Mechanical Engineering 2018 ASSISTED DEVELOPMENT OF MESOPHASE PITCH WITH ASSISTED DEVELOPMENT OF MESOPHASE PITCH WITH DISPERSED GRAPHENE AND ITS RESULTING CARBON FIBERS DISPERSED GRAPHENE AND ITS RESULTING CARBON FIBERS Aaron Owen University of Kentucky, [email protected] Author ORCID Identifier: https://orcid.org/0000-0003-0858-3151 Digital Object Identifier: https://doi.org/10.13023/etd.2018.454 Right click to open a feedback form in a new tab to let us know how this document benefits you. Right click to open a feedback form in a new tab to let us know how this document benefits you. Recommended Citation Recommended Citation Owen, Aaron, "ASSISTED DEVELOPMENT OF MESOPHASE PITCH WITH DISPERSED GRAPHENE AND ITS RESULTING CARBON FIBERS" (2018). Theses and Dissertations--Mechanical Engineering. 126. https://uknowledge.uky.edu/me_etds/126 This Master's Thesis is brought to you for free and open access by the Mechanical Engineering at UKnowledge. It has been accepted for inclusion in Theses and Dissertations--Mechanical Engineering by an authorized administrator of UKnowledge. For more information, please contact [email protected].
Transcript of ASSISTED DEVELOPMENT OF MESOPHASE PITCH WITH …

University of Kentucky University of Kentucky
UKnowledge UKnowledge
Theses and Dissertations--Mechanical Engineering Mechanical Engineering
2018
ASSISTED DEVELOPMENT OF MESOPHASE PITCH WITH ASSISTED DEVELOPMENT OF MESOPHASE PITCH WITH
DISPERSED GRAPHENE AND ITS RESULTING CARBON FIBERS DISPERSED GRAPHENE AND ITS RESULTING CARBON FIBERS
Aaron Owen University of Kentucky, [email protected] Author ORCID Identifier:
https://orcid.org/0000-0003-0858-3151 Digital Object Identifier: https://doi.org/10.13023/etd.2018.454
Right click to open a feedback form in a new tab to let us know how this document benefits you. Right click to open a feedback form in a new tab to let us know how this document benefits you.
Recommended Citation Recommended Citation Owen, Aaron, "ASSISTED DEVELOPMENT OF MESOPHASE PITCH WITH DISPERSED GRAPHENE AND ITS RESULTING CARBON FIBERS" (2018). Theses and Dissertations--Mechanical Engineering. 126. https://uknowledge.uky.edu/me_etds/126
This Master's Thesis is brought to you for free and open access by the Mechanical Engineering at UKnowledge. It has been accepted for inclusion in Theses and Dissertations--Mechanical Engineering by an authorized administrator of UKnowledge. For more information, please contact [email protected].

STUDENT AGREEMENT: STUDENT AGREEMENT:
I represent that my thesis or dissertation and abstract are my original work. Proper attribution
has been given to all outside sources. I understand that I am solely responsible for obtaining
any needed copyright permissions. I have obtained needed written permission statement(s)
from the owner(s) of each third-party copyrighted matter to be included in my work, allowing
electronic distribution (if such use is not permitted by the fair use doctrine) which will be
submitted to UKnowledge as Additional File.
I hereby grant to The University of Kentucky and its agents the irrevocable, non-exclusive, and
royalty-free license to archive and make accessible my work in whole or in part in all forms of
media, now or hereafter known. I agree that the document mentioned above may be made
available immediately for worldwide access unless an embargo applies.
I retain all other ownership rights to the copyright of my work. I also retain the right to use in
future works (such as articles or books) all or part of my work. I understand that I am free to
register the copyright to my work.
REVIEW, APPROVAL AND ACCEPTANCE REVIEW, APPROVAL AND ACCEPTANCE
The document mentioned above has been reviewed and accepted by the student’s advisor, on
behalf of the advisory committee, and by the Director of Graduate Studies (DGS), on behalf of
the program; we verify that this is the final, approved version of the student’s thesis including all
changes required by the advisory committee. The undersigned agree to abide by the statements
above.
Aaron Owen, Student
Dr. Rodney Andrews, Major Professor
Dr. Alexandre Martin, Director of Graduate Studies

ASSISTED DEVELOPMENT OF MESOPHASE PITCH WITH DISPERSED
GRAPHENE AND ITS RESULTING CARBON FIBERS
THESIS
A thesis submitted in partial fulfillment of the requirements
for the degree of Master of Science in Mechanical
Engineering in the College of Engineering at the University
of Kentucky
By
Aaron Owen
Lexington, Ky
Director: Dr. Rodney Andrews, Professor of Mechanical Engineering
Copyright © Aaron Owen 2018
https://orcid.org/0000-0003-0858-3151

ABSTRACT OF THESIS
ASSISTED DEVELOPMENT OF MESOPHASE PITCH WITH DISPERSED
GRAPHENE AND ITS RESULTING CARBON FIBERS
The efficacy of dispersed reduced graphene oxide (rGO) as a nucleation site for
the growth of mesophase in an isotropic pitch was investigated and quantified in this
study. Concentrations of rGO were systematically tested in an isotropic petroleum and
coal-tar pitch during thermal treatments and compared to pitch without rGO. The
mesophase content of each thermally treated pitch was quantified by polarized light point
counting. Further characterization of softening temperature and insolubles were
quantified. Additionally, the pitches with and without rGO were melt spun, graphitized,
and tensile tested to determine the effects of rGO on graphitized fiber mechanical
properties and fiber morphology.
KEYWORDS: Mesophase, Reduced graphene oxide, Melt spinning, Carbon fiber
Aaron Owen
December 5, 2018
Date

ASSISTED DEVELOPMENT OF MESOPHASE PITCH WITH DISPERSED
GRAPHENE AND ITS RESULTING CARBON FIBERS
By
Aaron Owen
Dr. Rodney Andrews
Director of Thesis
Dr. Alexandre Martin
Director of Graduate Studies
December 5, 2018
Date

iii
ACKNOWLEDGMENTS
Thank you to my patient wife who has graciously dealt with my long days and late
nights throughout this process.
Also, thank you to everyone in the Carbon Group at CAER that helped guide me
along to be a better engineer and scientist and dealt with my constant barrage of questions.
Lastly, thank you to my advisor, Rodney Andrews and co-advisor Matt
Weisenberger for taking the time to guide me in my research and thesis work.

iv
TABLE OF CONTENTS
ACKNOWLEDGMENTS ................................................................................................. iii
TABLE OF CONTENTS ................................................................................................... iv
LIST OF TABLES ............................................................................................................ vii
LIST OF FIGURES ........................................................................................................... ix
Chapter 1. BACKGROUND ...........................................................................................1
1.1 Introduction ............................................................................................................... 1
1.2 History of Pitch ......................................................................................................... 4
1.3 Petroleum Pitch Origin ............................................................................................. 6
1.4 Coal-tar Pitch Origin ................................................................................................. 7
1.5 Isotropic and Mesophase ........................................................................................ 10
1.6 Previous Pitch Improvement Methods .................................................................... 16
1.7 Fiber Processing ...................................................................................................... 18
1.7.1 Melt Spinning............................................................................................... 18
1.7.2 Oxidation...................................................................................................... 24
1.7.3 Carbonization and Graphitization ................................................................ 24
1.8 Conclusion .............................................................................................................. 27
Chapter 2. GRAPHENE AS A SEED CRYSTAL FOR MESOPHASE
DEVELOPMENT ..............................................................................................................29
2.1 Introduction ............................................................................................................. 29
2.2 Experimental Materials and Methods ..................................................................... 30
2.2.1 Materials ...................................................................................................... 30
2.2.2 Experimental Methods ................................................................................. 30
2.2.3 Temperature Control .................................................................................... 33
v
2.2.3 Heat Treatment............................................................................................. 34
2.2.4 Insoluble Testing .......................................................................................... 35
2.2.5 Dynamic Mechanical Analysis (DMA) ....................................................... 36
2.2.6 Polarized Light Microscopy ......................................................................... 37
2.3 Results ..................................................................................................................... 39
2.3.1 Petroleum Pitch ............................................................................................ 39
2.3.2 Coal-tar Pitch ............................................................................................... 49
2.3.3 Observations During Heat Treatments......................................................... 57
2.2.5 Milled Mitsubishi and THF Insolubles ........................................................ 58
2.4 Conclusion .............................................................................................................. 59
Chapter 3. MELT SPINNING .......................................................................................61
3.1 Introduction ............................................................................................................. 61
3.1.1 Wayne Extruder (WEXT) Spinning ............................................................. 63
3.1.2 Pressure Spinning Capsule ........................................................................... 67
3.1.3 Melt Pool Spinning ...................................................................................... 71
3.1.4 Lessons Learned........................................................................................... 72
3.2 Method .................................................................................................................... 73
3.3 Results ..................................................................................................................... 74
3.4 Conclusion .............................................................................................................. 76
Chapter 4. THERMAL CONVERSION AND CARBON FIBER PROPERTIES .......77
4.1 Introduction ............................................................................................................. 77
4.2 Mechanical Properties ............................................................................................. 78
4.2.1 Thermal Conversion..................................................................................... 78
4.2.2 Microscopy .................................................................................................. 79
4.2.3 Tensile Testing ............................................................................................. 83

vi
4.3 Results ..................................................................................................................... 84
4.4 Conclusion .............................................................................................................. 87
Chapter 5. CONCLUSION ............................................................................................89
5.1 Future Work ............................................................................................................ 91
APPENDIX ........................................................................................................................92
REFERENCES ..................................................................................................................94
VITA ..................................................................................................................................98

vii
LIST OF TABLES
Table 1.1 CHN Analysis of various pitches. Carbon (C), hydrogen (H), nitrogen (N),
sulfur (S), oxygen (O) and carbon: hydrogen ratio (C/H). Percentages are by weight. ...... 6
Table 1.2 Representative properties of carbon fibers from various precursors. ............... 13
Table 1.3 Mechanical properties of graphitized fibers with various textures. Diameter (∅),
tensile strength (TS), Young’s modulus (E), compressive strength (CS). ........................ 24
Table 2.1 Average temperatures at each treatment time with deviation. .......................... 40
Table 2.2 Comparing rGO wt.% with closer average temperatures. Target temperature
was 370 °C. ....................................................................................................................... 42
Table 2.3 Comparison of mesophase percentages for the 0.5-hour treatment samples that
had the smallest deviation of average pitch temperature. ................................................. 43
Table 2.4 Average temperature during the heat treatment for all coal-tar samples and the
deviation of temperatures. ................................................................................................. 50
Table 2.5 Comparing rGO wt.% with closer average temperatures. Target temperature
was 370 °C.. ...................................................................................................................... 52
Table 2.6 Mesophase percentage for coal-tar pitch samples with same average
temperature heat treated for 0.5-hours. ............................................................................. 53
Table 3.1 Initial spinning parameters for experimental pitches. Filter pore size, nitrogen
pressure (P), spinneret diameter (Ø), spinneret temperature (Spin Temp), take-up spool
setting (RPM), and meters per minute (m/min) of fiber collected. ................................... 73
Table 3.2 Optimization of spinning conditions for each heat-treated pitch; petroleum
(Pet.) and coal-tar (Coal) with listed mesophase percentage (M), softening temperature
(Tsp), controlled spin temperature (Spin T), monitored pitch temperature (Pitch T),
nitrogen pressure (P), and spool take-up speed (RPM) .................................................... 75
Table 4.1 Change in lengths and masses for the petroleum (P) and coal-tar (C) pitches
with 0 wt% and 0.01 wt % rGO. Initial green fiber carbon yield (CY) after graphitization.
........................................................................................................................................... 79
Table 4.2 Diameter (Ø) of the four graphitized fibers samples as measured by SEM.
Petroleum (P) and coal-tar (C) pitch. ................................................................................ 82

viii
Table 4.3 Break Tenacity (T)(cN/dtex) and Initial Modulus (E)(cN/dtex), and Coefficient
of Variance (COV) of the graphitized pitch fibers. Shown are petroleum (P) and coal-tar
(C) with 0 wt.% and 0.01 wt.% rGO................................................................................. 84
ix
LIST OF FIGURES
Figure 1.1 Tensile properties of carbon fibers from various precursors. ............................ 2
Figure 1.2 PAN and Pitch, raw material to carbon fibers. .................................................. 3
Figure 1.3 Representative of the type of molecular structure expected to find within (a)
coal-tar pitch and (b) petroleum pitch ................................................................................. 6
Figure 1.4 Coal coke oven where coal-tar pitch production is a by-product. ..................... 8
Figure 1.5 Solvent refining process where pitch or coke can be produced. ....................... 8
Figure 1.6 Fischer-Tropsch process to produce diesel and gasoline. Pitch is a by-product
towards the beginning of the process. ................................................................................. 9
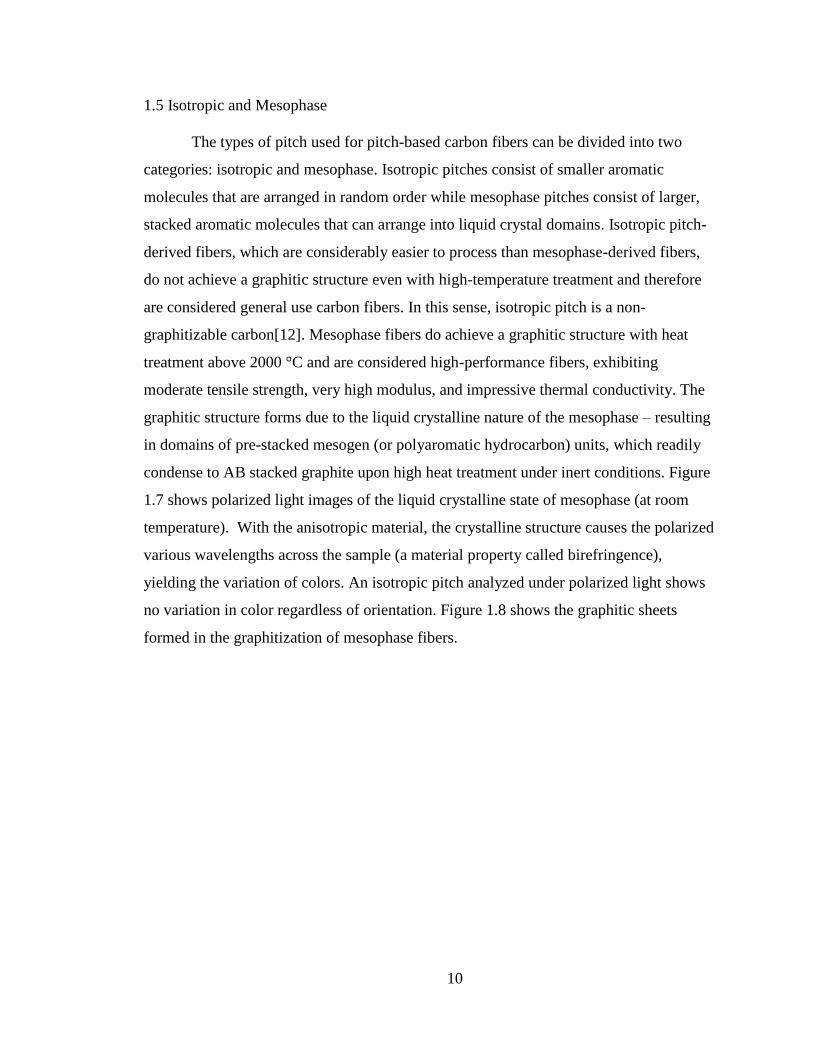
Figure 1.7 Polarized light image of a mesophase pitch. Here, the sample is 100%
mesophase. ........................................................................................................................ 11
Figure 1.8 Graphitic radial texture in graphitized fibers derived from 100% mesophase
(polymerized naphthalene AR pitch). ............................................................................... 12
Figure 1.9 Mesophase spheres (magenta and cyan) within an isotropic matrix. .............. 14
Figure 1.10 Viscosity comparison of isotropic and mesophase pitches ........................... 19
Figure 1.11 The alignment of discotic mesophase during melt spinning. ........................ 20
Figure 1.12 Pitch green fiber that has a "bulge" in the fiber most likely caused by
insolubles in the pitch. This nodule is a defect in the fiber and yields significantly lower
mechanical properties. ...................................................................................................... 21
Figure 1.13 Melt-spinning extruder process. .................................................................... 22
Figure 1.14 Internal morphology for graphitic mesophase fibers, classified as radial,
onion-skin, random, flat-layer, radial-folded, and line-origin. ......................................... 23
Figure 1.15 Graphite AB structure. Basal plane view showing the AB stacking offset. .. 25
Figure 1.16 Top view of graphite AB stacking. The A plane is a solid line and the B plane
is a dotted line. .................................................................................................................. 26
Figure 2.1 Test matrix followed for testing rGO in coal-tar and petroleum isotropic pitch.
Each treatment time and rGO wt.% were replicated at least once leading to 60 separate
thermal treatments. ............................................................................................................ 31
Figure 2.2 Thermal treatment arrangement. ..................................................................... 33

x
Figure 2.3 A comparison of the pitch temperature during heat treatments with the
temperature being controlled by the pitch thermocouple or the mantle thermocouple. ... 34
Figure 2.4 Example of a DMA analysis to determine the softening temperature of a pitch.
The derivative of displacement with respect to temperature is plotted and the peak of this
curve is representative of the softening temperature. ....................................................... 36
Figure 2.5 Example of a polished “puck” of pitch inside an epoxy. This “puck” was used
for polarized light microscopy to determine the mesophase percentage of the heat-treated
pitch. Puck was 1 inch in diameter. .................................................................................. 38
Figure 2.6 The average temperature of the pitch during the heat treatment for every
petroleum pitch sample tested. .......................................................................................... 40
Figure 2.7 Petroleum mesophase percentage as determined by polarized light microscopy.
Three samples were tested at three rGO weight percentages: 0 (baseline), 0.01, and 0.10.
........................................................................................................................................... 41
Figure 2.8 The mesophase percentage compared with less deviation in the average
temperatures. ..................................................................................................................... 42
Figure 2.9 Isotropic petroleum-based pitch under polarized light. No mesophase content
is present. The two white dots are epoxy. ......................................................................... 44
Figure 2.10 Mesophase growth comparison by polarized for 0.5-hours of thermal
treatment for the 0 wt.% (i) 0.01 wt.% (ii) and 0.10 wt.% (iii) samples. Scale bar is 50
µm. .................................................................................................................................... 45
Figure 2.11. Mesophase content for the petroleum sample at treatment times of 1 hour (i),
2-hour (ii), 3-hour (iii), and 4-hour (iv). ........................................................................... 47
Figure 2.12 Softening temperatures of the pitches by DMA compression test for all
petroleum pitches tested. The softening temperature was determined by a controlled force
test. Then the derivative of displacement with respect to temperature was plotted. ........ 48
Figure 2.13 Quinoline insolubles (QIs) for all the petroleum pitches tested. As expected,
the QIs increased with increased mesophase percentage. ................................................. 49
Figure 2.14 The average temperature of the pitch during the heat treatment for every
coal-tar sample tested. ....................................................................................................... 50

xi
Figure 2.15 Coal-tar pitch mesophase percentage as determined by polarized light
microscopy. Three samples were tested at three rGO weight percentages: 0 (baseline),
0.01, and 0.10. ................................................................................................................... 51
Figure 2.16 The mesophase percentage compared with less deviation in the average
temperatures. ..................................................................................................................... 52
Figure 2.17 Isotropic coal-based pitch under polarized light. No mesophase content is
present. The white dot is epoxy. ....................................................................................... 54
Figure 2.18. Mesophase content for the petroleum sample at treatment times of 0.5-hours
(i), 1-hour (ii), 2-hour (iii), 3-hour (iv), and 4-hour (v). ................................................... 55
Figure 2.19 Softening temperatures of the pitches by DMA compression test for all coal-
tar pitches tested. The softening temperature was determined by the derivative of
displacement with respect to temperature. ........................................................................ 56
Figure 2.20 Quinoline insolubles (QIs) for all the coal-tar pitches tested. As expected, the
QIs increased with increased mesophase percentage. ....................................................... 57
Figure 3.1 Representative shear rate sweep for a 100% mesophase pitch. ....................... 62
Figure 3.2 Extruder screw for the WEXT. ........................................................................ 63
Figure 3.3 Side view of the WEXT with the listed monitored (M) and controlled (C)
parameters. ........................................................................................................................ 64
Figure 3.4 Controlled temperatures zones for the WEXT where the pitch transitions from
right to left. Melt temperature and pressure transducer location are shown. .................... 65
Figure 3.5 Extruder melt spun mesophase carbon fibers. ................................................. 67
Figure 3.6 UKY CAER pressure spinning capsule with monitored pitch temperature,
controlled spinneret temperature, and controlled nitrogen flow. ...................................... 68
Figure 3.7 Melt spinning apparatus used for spinning green fibers. A 20 µm fritted metal
filter was used during spinning to filter out particulates. The parameters controlled for
pressure spinning are shown: nitrogen pressure, spinneret temperature, and take-up spool
RPM. ................................................................................................................................. 69
Figure 3.8 Green fibers after being pressure spun for a mesophase pitch (i). Graphitized
mesophase fiber with desired graphitic sheets and undesired voids in the fiber (ii). ....... 71

xii
Figure 3.9 Melt pool spinning where only the exit of the spinneret is shown at 330 µm
(A), the pitch exits and begins to swell to a pool size of 3.774 mm (E) and decreases to
2.867 mm once pulled into a fiber (F). ............................................................................. 72
Figure 3.10 Green fiber melt spun pitch sample. The collection of fiber forms a band
around the spool. Individual filaments are highlights in the callout image. ..................... 76
Figure 4.1 SEM images of melt-spun graphitized (i) petroleum pitch 0 wt.% rGO (ii)
petroleum pitch 0.01 wt.% rGO (iii) coal-tar pitch 0 wt.% rGO (iv) coal-tar pitch 0.01
wt.% rGO. ......................................................................................................................... 81
Figure 4.2 Example of a fiber that had non-uniform shrinkage during thermal conversion.
Here the fiber was approximately 120 mm in length and approximately 30 µm in
diameter............................................................................................................................. 82
Figure 4.3 Break stress of the graphitized petroleum (P) and coal-tar (C) pitch fibers in
textile units (cN/dtex) with mesophase percentage. ......................................................... 86
Figure 4.4 Modulus of the graphitized petroleum (P) and coal-tar (C) pitch fibers in
textile units (cN/dtex) with mesophase percentage. ......................................................... 87
Figure 5.1 Distribution of the tensile stress against probability of failure using a Weibull
analysis of graphitic fibers ................................................................................................ 93

1
Chapter 1. BACKGROUND
1.1 Introduction
Materials science has made great advancements over the last twenty years. There
has been a significant focus on making materials both stronger and lighter. Composites
are an excellent choice because they are composed of a reinforcing material within a
matrix material, which combine to provide advantageous mechanical, thermal, or
electrical properties. Composite materials are of high value in industries where weight
reduction and high strength are imperative, as in aerospace and, increasingly, automotive
applications. A commonly used material in these industries is carbon fiber reinforced
composite (CFRC), which is comprised of high modulus and strength reinforcing carbon
fibers within, typically, a polymeric matrix, often epoxy. The matrix protects the fibers
and imparts shape and toughness to composite parts.
Polyacrylonitrile (PAN) based carbon fibers dominate the field of carbon fiber
composites. The main reason the PAN-based carbon fibers are the primary product on the
market is the high strength and high strain to failure, or high fiber toughness. A potential
alternative is pitch-based carbon fibers. Pitch-based carbon fibers have two primary
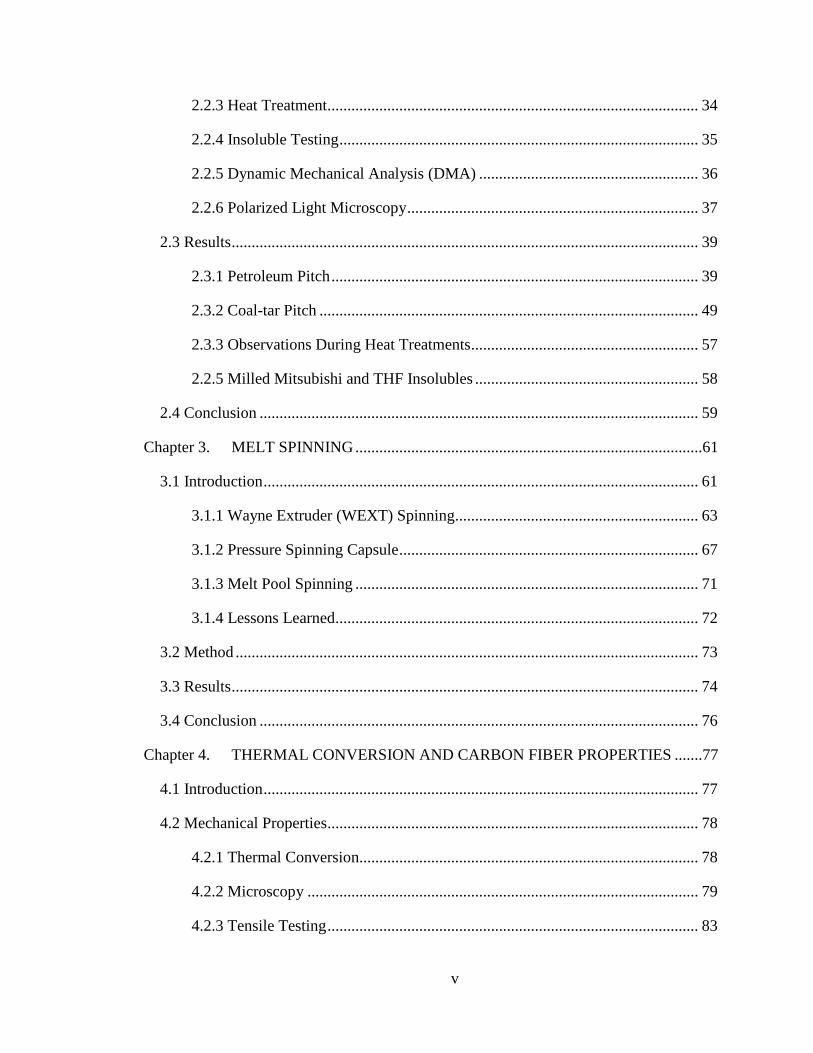
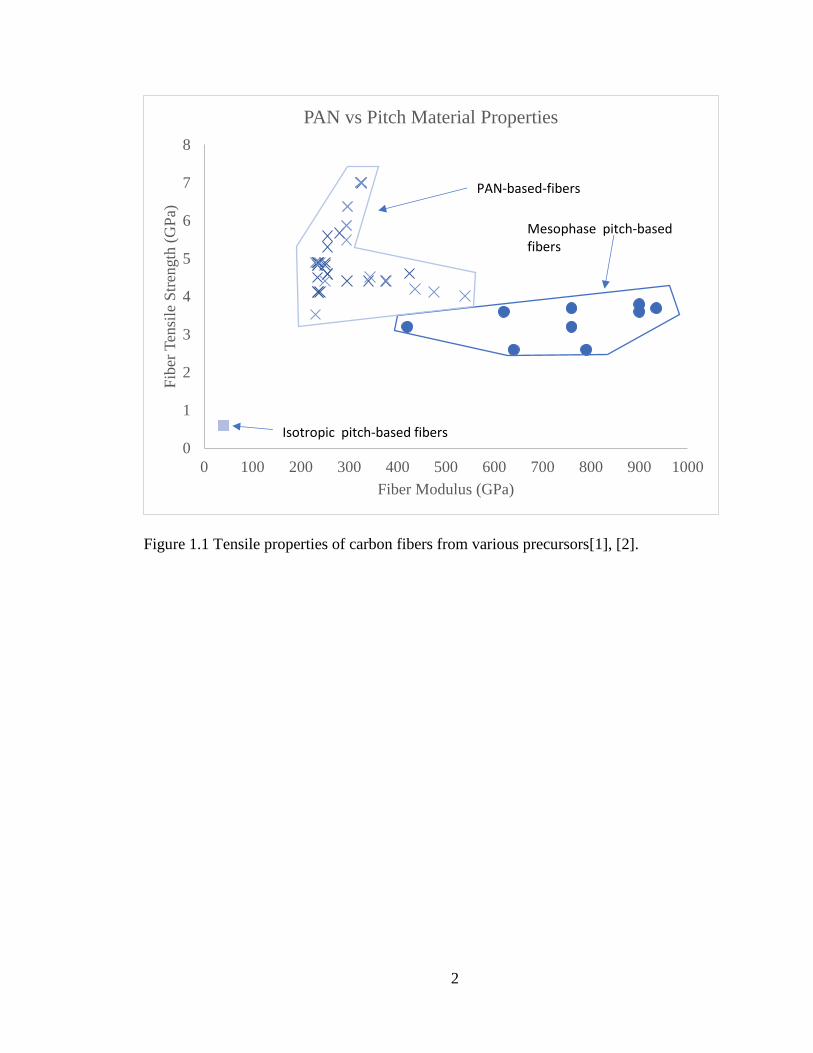
sources: coal-tar pitch, and petroleum pitch. In Figure 1.1 the respective properties of
PAN-based and pitch-based carbon fibers are shown. The mesophase pitch fibers have a
lower tensile strength but show an exceedingly high tensile modulus with high thermal
conductivity, while the PAN-based fibers are high in tensile strength, but do not have as
high tensile modulus.
2
Figure 1.1 Tensile properties of carbon fibers from various precursors[1], [2].
0
1
2
3
4
5
6
7
8
0 100 200 300 400 500 600 700 800 900 1000
Fib
er T
ensi
le S
tren
gth
(G
Pa)
Fiber Modulus (GPa)
PAN vs Pitch Material Properties
Isotropic pitch-based fibers
PAN-based-fibers
Mesophase pitch-basedfibers
3
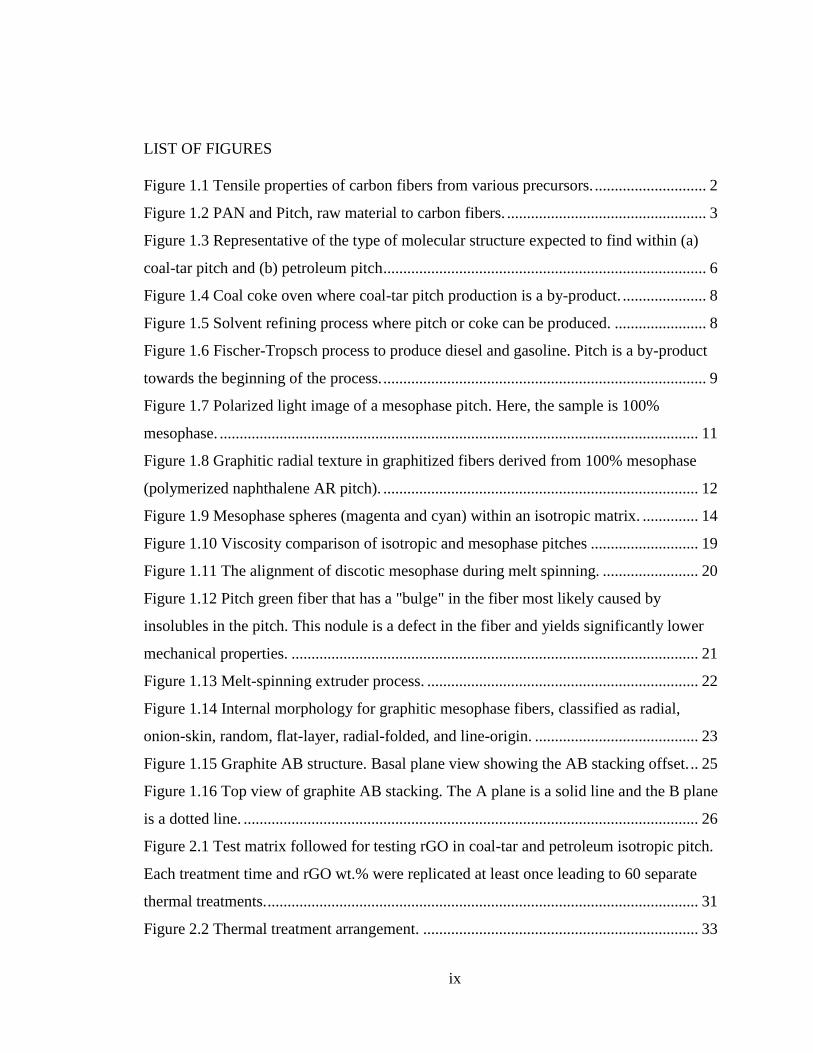
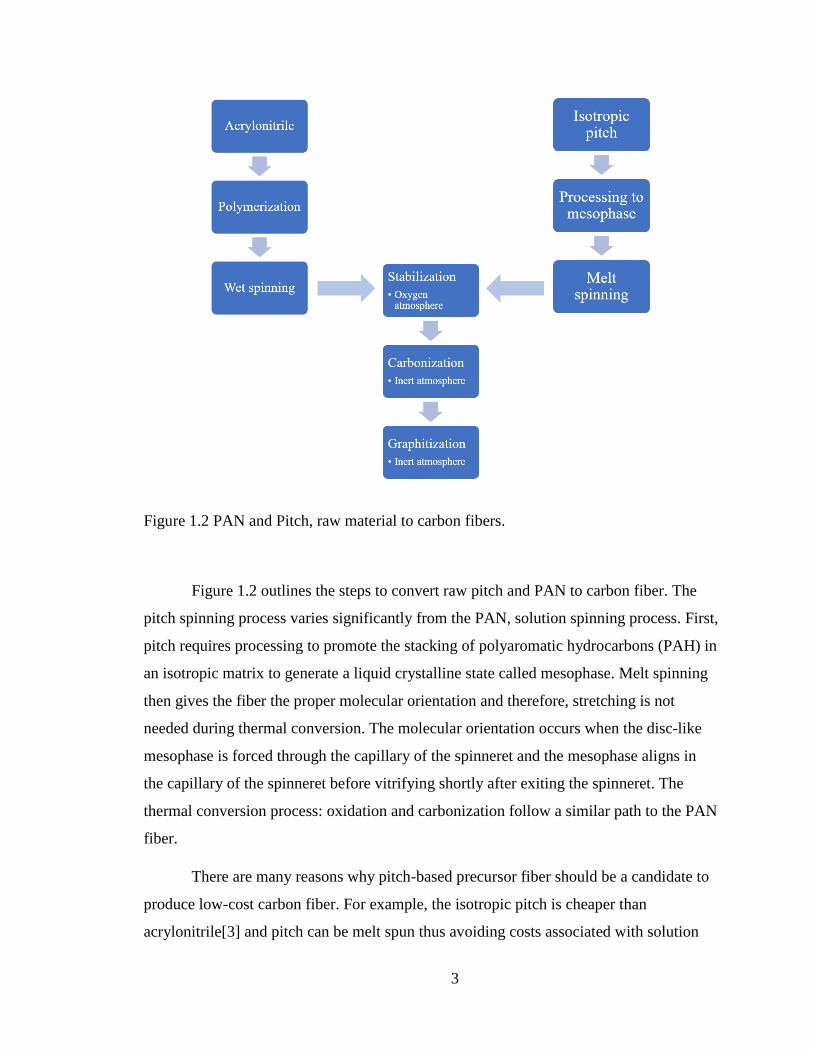
Figure 1.2 PAN and Pitch, raw material to carbon fibers.
Figure 1.2 outlines the steps to convert raw pitch and PAN to carbon fiber. The
pitch spinning process varies significantly from the PAN, solution spinning process. First,
pitch requires processing to promote the stacking of polyaromatic hydrocarbons (PAH) in
an isotropic matrix to generate a liquid crystalline state called mesophase. Melt spinning
then gives the fiber the proper molecular orientation and therefore, stretching is not
needed during thermal conversion. The molecular orientation occurs when the disc-like
mesophase is forced through the capillary of the spinneret and the mesophase aligns in
the capillary of the spinneret before vitrifying shortly after exiting the spinneret. The
thermal conversion process: oxidation and carbonization follow a similar path to the PAN
fiber.
There are many reasons why pitch-based precursor fiber should be a candidate to
produce low-cost carbon fiber. For example, the isotropic pitch is cheaper than
acrylonitrile[3] and pitch can be melt spun thus avoiding costs associated with solution

4
spinning PAN. Moreover, the carbon fiber carbon yield (from precursor fiber) for
mesophase pitch is approximately 80% by weight, while for PAN it is 50% to 55%[4].
One advantage of melt spinning is that solvent recovery is not necessary as is
required during PAN precursor fiber production. For the PAN precursor fiber production,
it is estimated for every 1 kg of precursor fiber generated, 40 kg of solvent wash water is
generated. The elimination of this portion of the spinning process could potentially help
offset some of the additional processing costs of the production of green (as-spun, non-
oxidized) pitch fiber, which primarily consists of the cost to process isotropic pitch to
mesophase pitch. Also, the physical footprint of the melt spinning process is considerably
smaller than that of the PAN precursor fiber production. However, the green fiber is
considerably more fragile than PAN precursor fiber. Therefore, extreme care must be
taken when collecting and handling the green fiber before oxidation which is not the case
with PAN precursor fiber. While the cost of mesophase pitch has been coming down in
recent decades, the cost of PAN-based carbon fibers is still lower at $10-30 per pound
versus mesophase pitch at $50+ per pound[5].
1.2 History of Pitch
Pitch is derived from three common products: petroleum, coal, and plants. Plant-
derived pitch has been utilized for thousands of years to seal sailing vessels. This pitch
was a product of the distillation of wood, aptly named “wood tar.” In production, wood
was heated until pitch (tar) was dripping from the wood and left behind charcoal. While
pitch and tar are used interchangeably, at room temperature pitch is usually solid, while
tar exists in a liquid state.
The history of pitch-based carbon fibers dates back to 1970 where the Kureha
Corporation industrialized an isotropic carbon fiber using a method invented by Otani[6].
Higher performance pitch-based carbon fibers were achieved by the Union Carbide
Corporation (currently Cytec Solvay Group) using another method invented by Otani[7].
These high-performance fibers exhibited anisotropic (mesophase) characteristics. Other
companies have been involved with the production of high-performance mesophase

5
fibers since the 1980s including Exxon and Du Pont but have since ceased production. In
modern production methods, the refining of crude oil and coking of metallurgical coal
generate pitches as by-products. The current economic climate is favorable to produce
pitch-based carbon fibers because there is considerable interest in using coal-tar pitch as a
raw material. Currently, there is one United States-based pitch carbon fiber manufacturer
(Solvay-Cytec Industries) and four Japan-based manufacturers (Nippon Graphite Fiber
Co., Ltd.; Mitsubishi Plastics, Inc.; Kureha Corp.; and Osaka Gas Chemicals Co.,
Ltd.)[8].
Petroleum and coal-tar pitches can vary significantly. For petroleum and coal-tar
pitch of comparable densities, petroleum pitch has little to no native quinoline-insolubles
(QI) while coal-tar pitch has significant QI due to the coking process, which introduces
small amounts of soot into the pitch. Native QI is a measure of the cumulative mineral
matter, coke, and quite high molecular weight hydrocarbons in the pitch. Therefore,
native QI is a significant characterization factor in the production and categorization of
coal-tar pitch as a raw material, while it is less significant for petroleum pitch as a raw
material. Another important characterization for pitches is softening temperature which is
the temperature when the pitch begins to soften (without a phase transition) and
resembles a viscous liquid. This softening is a transition for the pitch from a glassy solid
to a glassy liquid. The isotropic raw material pitch used for processing to carbon fibers
generally has an initial softening temperature of approximately 100 °C.
The chemical structure of coal-tar and petroleum-derived mesophase pitch varies
for several reasons. While both consist of a polyaromatic hydrocarbon (PAH) molecular
structure, petroleum pitch has been shown to have aliphatic carbon while coal-tar pitch
has not been observed to have significant aliphatic carbon. Figure1.3 shows a
representative molecular structure for coal-tar and petroleum pitches. The coal-tar pitch is
primarily planar, which allows for strong intermolecular forces, while the petroleum pitch
molecular structure is more mobile because of the aliphatic carbon areas[9]. This
mobility in petroleum-derived pitches allows for the rearrangement of molecules more
readily and mesophase generally grows more quickly than in coal-derived pitches and the
aromaticity of coal-tar-derived pitch is higher than petroleum-derived pitch.

6
(a) (b)
Figure 1.3 Representative of the type of molecular structure expected to find within (a)
coal-tar pitch and (b) petroleum pitch[9].
The aromaticity of a pitch can be estimated by a CHN (carbon, hydrogen,
nitrogen, oxygen by subtraction) analysis. The larger the carbon/hydrogen ratio (C/H),
the more aromatic a pitch is. Using these ratios, the aromaticity of the coal-tar pitch can
be seen to be higher than the petroleum pitch. Synthetic pitches which were produced
with an HF-BF3 catalyst (section 1.6), range in aromaticity, namely Mitsubishi AR and
Mitsubishi LSP (Table 1.1).
1.3 Petroleum Pitch Origin
The production of petroleum pitch stems from the distillation of crude oil during
the process of producing fuels and chemicals. The types of petroleum pitch produced are
Table 1.1 CHN Analysis of various pitches. Carbon (C), hydrogen (H), nitrogen (N),
sulfur (S), oxygen (O) and carbon: hydrogen ratio (C/H). Percentages are by weight.
Sample Type %C %H %N %S %O C/H
Mitsubishi
AR
Synthetic 93.64 5.14 <0.01 0.00 1.22 18.22
Mitsubishi
LSP
Synthetic 93.49 5.89 <0.01 0.00 0.62 15.87
Petroleum Petroleum 93.09 5.50 0.04 0.60 0.74 16.93
Coal-tar Coal-tar 93.11 5.00 0.82 0.52 0.55 18.62

7
highly dependent on the processing conditions of the crude oil and the severity of the
process.
Fluid catalytic cracking (FCC) is a traditional method for processing crude oil and
generating heavy bottoms which then can be processed to make pitch. This process has
become more popular than traditional thermal cracking methods because FCC produces
gases that are more aromatic. During the FCC process the feedstock, or crude oil, is
heated to a high temperature and moderate pressure with the addition of a catalyst. This
catalyst breaks the long chain hydrocarbons into shorter chains creating a vapor. These
vapors flow through the reactor and are distilled into end products including naphtha, fuel
oil and off gas. The petroleum naphtha is further processed to produce fuels, and from
this processing, and further processing of the heavy bottoms of the cracking towers, a low
softening point (<50°C) pitch-like material is formed. Through further filtration and
distillation, the softening point rises to approximately 100 °C, and is formed into
isotropic pitch.
1.4 Coal-tar Pitch Origin
Three main production processes yield coal-tar pitch: coking, solvent extraction,
and gasification. The coking process is the most widely used that produces pitch as a by-
product. This process is outlined in Figure 1.4[10]. The coal is heated in the coking
ovens, called batteries, to produce a nearly pure carbon solid fuel called coke. The
volatiles captured during the process are collected as a sludge. This sludge is again heated
to a gaseous form, then steam distilled. The by-product of this steam distillation is coal-
tar pitch. The coal-tar pitch produced can vary drastically based on the parent coal.

8
Figure 1.4 Coal coke oven where coal-tar pitch production is a by-product.
Solvent extraction of coal is another method by which products are made, one of
which is pitch. One solvent extraction process is outlined in Figure 1.5[11]. Here, the coal
is mixed with a solvent feed (e.g., anthracene oil) inside the reactor tank. The mixed feed
is then processed to remove virtually all the mineral matter present in the coal. Once this
coal solution has been gathered, it may be processed into coke or pitch.
Figure 1.5 Solvent refining process where pitch or coke can be produced[11].

9
Lastly, gasification is another process for refining coal that produces pitch as a
by-product, which relies heavily on the Fischer-Tropsch process9. Synthesis gas is
produced from coal using steam and oxygen in Lurgi gasifiers, which are vertical
distillation units used to capture gas off-take with the introduction of hot steam to gasify
the coal. Many of the by-products gathered during the gasification process are the tar
distillates which are further refined to gasoline and diesel fuel. The heavy oils and waxes
produced during the process are fractionated and refined. Figure 1.6 shows the coal
refining process for producing fuels, where pitch is a by-product during the purification
stage.
Figure 1.6 Fischer-Tropsch process to produce diesel and gasoline. Pitch is a by-product
towards the beginning of the process.
10
1.5 Isotropic and Mesophase
The types of pitch used for pitch-based carbon fibers can be divided into two
categories: isotropic and mesophase. Isotropic pitches consist of smaller aromatic
molecules that are arranged in random order while mesophase pitches consist of larger,
stacked aromatic molecules that can arrange into liquid crystal domains. Isotropic pitch-
derived fibers, which are considerably easier to process than mesophase-derived fibers,
do not achieve a graphitic structure even with high-temperature treatment and therefore
are considered general use carbon fibers. In this sense, isotropic pitch is a non-
graphitizable carbon[12]. Mesophase fibers do achieve a graphitic structure with heat
treatment above 2000 °C and are considered high-performance fibers, exhibiting
moderate tensile strength, very high modulus, and impressive thermal conductivity. The
graphitic structure forms due to the liquid crystalline nature of the mesophase – resulting
in domains of pre-stacked mesogen (or polyaromatic hydrocarbon) units, which readily
condense to AB stacked graphite upon high heat treatment under inert conditions. Figure
1.7 shows polarized light images of the liquid crystalline state of mesophase (at room
temperature). With the anisotropic material, the crystalline structure causes the polarized
various wavelengths across the sample (a material property called birefringence),
yielding the variation of colors. An isotropic pitch analyzed under polarized light shows
no variation in color regardless of orientation. Figure 1.8 shows the graphitic sheets
formed in the graphitization of mesophase fibers.
11
Figure 1.7 Polarized light image of a mesophase pitch. Here, the sample is 100%
mesophase.

12
Figure 1.8 Graphitic radial texture in graphitized fibers derived from 100% mesophase
(polymerized naphthalene AR pitch).
Clean (low-QI), isotropic petroleum or coal-tar pitch is a relatively easy substance
to melt spin into green fiber. This isotropic matrix is forgiving to temperature fluctuations
and multiple ranges of spinning speeds[4]. However, the isotropic pitch generally has a
lower softening point (< 150 °C, mesophase > 220 °C) since the molecular structure of
the isotropic pitch consists of lower molecular weight species. This softening point is an
important distinction because if it is too low, the fibers are susceptible to fusion during
thermal conversion. The softening point can be increased through an oxygen-rich air
blowing heat treatment[13], causing the aromatic molecules to cross-link via oxygen
linkages. This reaction can be inhibitive to the growth of mesophase. The final isotropic
fiber product will not have the required mechanical or thermal properties that are needed
to make pitch-based carbon fiber an attractive product for the structural materials market.
Mesophase derived carbon fiber, with its high modulus, moderate strength and thermal
conductivity, has value for structural composites. Isotropic pitch derived carbon fiber
does not, and has been used as activated, chopped carbon fiber and thermal insulation.

13
Table 1.2 shows a comparison of general mechanical properties for isotropic-based
carbon fiber, mesophase-based carbon fiber, and traditional PAN-based carbon fiber12.
Table 1.2 Representative properties of carbon fibers from various precursors[2].
Material Fiber Modulus (GPa) Fiber Tensile Strength (GPa)
PAN 234 4.8
Mesophase 790 2.6
Isotropic 40 0.6
Brooks and Taylor first observed mesophase (anisotropy) in 1965[12], which was
deemed a liquid crystal. Experiments with hot-stage microscopy using polarized light
gave them the ability to observe the sequential steps of the liquid crystalline mesophase
spheres nucleation, growth, and coalescence. However, if the temperature became too
high during these observations, the pitch would form infusible coke. The images first
captured by Brooks and Taylor detail the structures of the mesophase within an isotropic
pitch matrix[12]. These aromatic self-organizing spherical domains, after the coalescence
phase, have two poles which correspond to the ends of the axis of the sphere. These poles
are related to the layered structure and the arrangement of the aromatic rings and signify
the intersection of the axis of symmetry with the planar sections.
The reason the aromatic sheets would form into spherical domains was presumed
to be the mesophase minimizing its interface with the isotropic phase. Brooks and Taylor
observed these spheres growing with a high molecular order in the isotropic matrix of the
pitch and initially suggested that the underlying molecular structure was tens of aromatic
rings in length. They observed during the heat treatment process the spheres coalescing
and with appropriate shear formed into a flow field of mesophase, as in Figure 1.7. They
also observed that as the mesophase sphere grew, it would be deformed by any insoluble
present, such as dispersed coke particles. No insoluble particle was observed in the
sphere, only at the interface of the mesophase and the isotropic matrix. This suggested
insolubles present in the pitch would prevent further growth of mesophase. Specifically,
they observed the growth of mesophase with mica and graphite present. The mesophase
remained non-wetting on the mica surface while it thoroughly wetted the surface of the

14
graphite. This observation is essential to the work of this thesis which will be discussed in
section 1.8.
The two most important factors in the growth of the mesophase were temperature
and time. The lower temperature at which the spheres were formed was observed to be
approximately 400 °C. With increased temperature, the mesophase formed quicker, but
the risk of coking the pitch was higher. Upon graphitization, they observed the
carbonaceous mesophase spheres would form graphitic structures.
Figure 1.9 Mesophase spheres (magenta and cyan) within an isotropic matrix.
Mesophase pitch exhibits thermotropic and lyotropic properties, meaning the
liquid crystalline state can form through heat or addition of a solvent, respectively[14].
Liquid crystals are fluids that have relatively long-range order with the rod-like or disc-

15
like constituent molecules. A common orientation of liquid crystalline mesophase can be
seen in Figure 1.9 where a mesophase sphere is quiescent within an isotropic matrix of
pitch.
Although mesophase is considered a liquid crystal, it possesses several
differences from traditional liquid crystalline phases. Two-dimensional, planar, PAH
formations are the building blocks of the graphitic structure. Generally, the carbonaceous
mesophase forms primarily upon heating, although some studies[15] have shown that it
may form under specific cooling conditions. Also, the growth of mesophase depends on
the liquid crystalline mobility (which is enhanced by shear). The elevated temperatures
during the heating process are responsible for molecular arrangement which promotes the
growth of the mesogens in two directions, stacking and coalescing, as well as volatizing
the lighter weight species. Therefore, there is a higher concentration of large molecules
once heat treatment is complete.
The structure of mesophase pitch has been thoroughly studied by Mochida et al.
who proposed mesophase is formed by aromatic rings that stack to allow 𝜋-𝜋 bonding
interactions. These aromatic rings are thought to be 0.6 to 1.5 nm in diameter and linked
together through methylene bridges giving the molecular structure a weight range of 400
to 4000 amu. It is believed that the alkyl groups contribute to the solubility and
fusibility[16] (Figure 1.3).
Through various heat treatments in a nitrogen atmosphere, the volatilization of
lower weight species and the polymerization of the aromatic molecules encourages the
growth of mesogens into mesophase. The lower molecular weight species allow for the
fusibility of the mesophase pitch and act as a solvent by increasing mobility of mesogens;
making their interactions more frequent. Therefore, it is important not to be too
aggressive during the removal of lightweight species because they are essential in
forming a viable mesophase pitch product. It should be noted that petroleum and coal-tar
pitch are constituted by thousands of individual molecules and it is tremendously difficult
to get an exact molecular model for a given pitch material.

16
1.6 Previous Pitch Improvement Methods
A high carbon content makes the pitch a viable candidate in the production of
precursor carbon fiber. However, since the mechanical and thermal advantages are
realized with mesophase pitch that requires processing from isotropic pitch, it can be an
expensive process. Various methods have been utilized to produce mesophase pitch
cheaper and are discussed in this section.
As mentioned by Mochida, the evolution of treatment began with heat-treatment
by Otani[17]. Then, Signer et al.[18] and Union Carbide Co. (UCC) effectively produced
a mesophase pitch with a softening point below 350 °C by using a vigorous nitrogen
flow, with the goal being to remove the low molecular weight, non-mesophase, species
which were attributed to the isotropic phase of the material. Using nitrogen and heat was
effective for generating mesophase but it was discovered that long, vigorous nitrogen
treatments led to the condensation reactions of the low reactive species. These
condensation reactions may produce infusible solids in the pitch as well as remove the
solvent in which the mesophase forms.
Solvent extraction is another method used to create a viable mesophase pitch.
This was proposed by Diefendorf, with support from Exxon, to create a pitch that was
more than 75% mesophase[19]. The pitch used was an Ashland A240 isotropic petroleum
pitch that was dissolved in 70% toluene-30% heptane mixture, then the separated
insoluble pitch was heated to 350 °C at 10 °C/min. This fraction had a softening point of
375 °C. With a further heat treatment at 400 °C for 10 minutes, the pitch was converted
to greater than 75% mesophase material and was stated as having less than 25% QIs.
The next evolution in mesophase generation and separation was heat treatment
through high-temperature centrifugation. Strehlow was the first to write that the
mesophase matrix of the pitch could be separated from the isotropic matrix of the pitch
through high-temperature centrifugation. The mesophase fraction is higher density than
the isotropic phase fraction causing the mesophase to settle at the bottom of the vessel
during centrifugation. This was accomplished with a coal-tar pitch at temperatures up to
525 °C[20].

17
Further refinement of the pitch improvement process included work by Mochida
in using hydrogenation with a catalyst during heat treatment. Mochida discovered that the
short alkyl chain groups are essential in maintaining a lower softening point for stable
spinning[15]. Mochida was able to achieve a synthetic mesophase pitch by using
naphthalene, methylnaphthalene, and ethylene tar as a base product and using HF-BF3 as
the catalyst. This new pitch, called AR mesophase, was said to have very similar
properties to heavy oil residues or coal-tar pitch using heat soak methods. Moreover,
since the preparation of the mesophase pitch was carried out at lower temperatures (200-
300 °C) through polymerization, it prevented the creation of infusible solids. The HF-BF3
allowed the formation of large polyaromatic ring structures, which made the rapid growth
of mesophase possible. The softening point of this synthetic mesophase was
approximately 286 °C by a controlled force, Dynamic Mechanical Analysis (DMA) test.
This softening temperature allowed the pitch to be melt processed and permitted for a
more rapid and stable oxidation process. Therefore, AR mesophase pitch became highly
studied, and subsequent research was completed studying its melt-viscosity[21] and
spinability[22].
With any pitch improvement method, it is important to assess the percent yield of
mesophase and the processability of the improved pitch. The distribution of molecular
weight is essential for both isotropic and mesophase pitch to be a melt processible pitch.
A method of understanding the molecular weight distribution of the pitch is by dissolving
the pitch in a solvent and measuring the insolubles. The insolubles of the pitch dissolved
in various solvents (quinoline, toluene, tetrahydrofuran) can be used to get a general
understanding of the molecular weight distribution of a pitch. The most common solvent
used in understanding the molecular weight and dispersed solids in the pitch is quinoline.
There is a sharp distinction between native quinoline insolubles (QIs) and QIs generated
through heat treatment. Generally, a pitch with native QIs above 1 wt.% will not be a
viable product for fiber spinning because the insolubles make it challenging to form
mesophase by inhibiting their growth.
Quinoline is a strong solvent, capable of dissolving high molecular species, while
toluene and tetrahydrofuran dissolve smaller molecular weight species. Certain resins
18
including alpha-resins (quinoline insolubles) – highest molecular weight, beta-resins
(quinoline solubles less the toluene insolubles) – moderate molecular weight, and gamma
resins (toluene solubles) – lower molecular weights, have been characterized. Beta-resins
have been shown to produce mesophase in some studies and are discussed at length by
Oberlin[23]. Solvent fractionation methods are used to narrow the molecular weight
distribution of pitch and to provide a more homogeneous matrix with similar softening
temperatures and flow characteristics. The utilization of solvents to accomplish this
makes it an economically unfavorable process, as it would be more cost effective to
produce the homogenous material during heat treatment, i.e., without solvents.
Additionally, QIs may also be used to estimate the mesophase percentage of pitch after
thermal treatments since mesophase is not soluble in pitch.
1.7 Fiber Processing
1.7.1 Melt Spinning
The treated coal or petroleum pitch can be melt spun into green fibers. Green
fibers are simply as-spun pitch fibers which have yet been given any thermal conversion
treatment. There are various extrusion methods by which to accomplish this which
include using a screw, gas overpressure, or a plunger to force the pitch through a small
capillary. For most processes, the operating temperature at the spinnerette is generally 30-
40 °C above the softening point of the pitch. For mesophase pitches, molecular alignment
of the mesophase with the flow direction occurs in the spinneret capillary during the melt
spinning process. This means the choice of a spinnerette capillary diameter and aspect
ratio is crucial. D. Edie et al. have conducted extensive studies on mesophase liquid
crystalline behavior during spinning[4]. Also, studies have analyzed the viscosity of the
mesophase and isotropic pitch[4], [21], [24]–[26]. Isotropic pitch has been shown to
follow Newtonian behavior but becomes non-Newtonian (exhibiting shear thinning) once
mesophase is formed. The viscosity of mesophase pitch is also highly temperature
dependent[4]. Together, a small window of processing temperature results, and is one of
the main factors influencing the difficulty of mesophase pitch spinning. Even a small
change in temperature of 3.5 °C could cause a 15% variation in diameter of fibers[27],
[28]. This temperature dependence can be seen in Figure 1.10 where the two mesophase

19
pitches have a sharp change in viscosity over small temperature changes, which is not the
case for the isotropic pitch shown.
Figure 1.10 Viscosity comparison of isotropic and mesophase pitches. Reprinted from
Carbon, 27(5), Edie DD, Dunham MG, Melt spinning pitch based carbon fibers,647-655,
1989, with permission from Elsevier.
As mentioned, mesophase is a liquid crystal and the molecular orientation of the
pitch green fiber is determined during melt spinning[29] (Figure 1.11). Pitch molecular
arrangement is advantageous because, upon heating, PAN chains tend to randomize,
while mesophase will retain its alignment – even through the oxidation heat treatment
which stabilizes the fibers to render them infusible with its neighboring filament. The
spinning capsule, which is a heated chamber where pitch is placed for gas pressure
spinning (simple rendering Figure 1.11), can vary the flow characteristics by its shape
and therefore the orientation of the pitch during spinning. The orientation of the pitch
during spinning can also vary greatly depending on the L/D (length over diameter) ratio
and shape of the spinneret capillary. The manipulation of either one of these conditions
may result in a drastically different fiber even with the same raw material. The spinneret
diameter sizes ranging from 0.15 mm - 0.660 mm and a L/D of approximately 5[30] can
produce good mesophase carbon fibers.

20
Figure 1.11 The alignment of discotic mesophase during melt spinning.
Achieving a pitch softening temperature below 300 °C (but above 200 °C to
prevent fusion during oxidation) is desirable because the spinning temperature must be
below approximately 350 °C. The higher the spin temperature, the more reactive pitch
will be inside the equipment and with air once it exits the spinneret, which can cause
excessive polymerization and pyrolysis that can significantly vary the green fiber. Some
of these disadvantages may be addressed by the addition of heated air or nitrogen quench
surrounding the fiber as it exits the spinneret. The elevated quench temperature decreases
the delta temperature between the ambient air and the spinning temperature[4], thus,
decreasing the reactivity of the molten pitch to air.
If insoluble particles are present in the pitch during spinning, they will not melt or
deform. These insolubles cause the isotropic or mesophase matrix to behave
unpredictably, clog the capillaries, and become embedded in the green fiber. Insoluble
particles embedded in fibers, as shown in Figure 1.12, are considered a gross defect that
cause the fiber to be generally useless for mechanical applications.

21
Figure 1.12 Pitch green fiber that has a "bulge" in the fiber most likely caused by
insolubles in the pitch. This nodule is a defect in the fiber and yields significantly
lower mechanical properties.

22
Figure 1.13 Melt-spinning extruder process.
For an industrial operation, continuous fiber spinning by a melt extrusion process
is used. A representative melt extrusion process is shown in Figure 1.13. Ground pitch
(<1.00 mm pellet) is fed into a hopper where an extruder melts and meters the liquid
pitch through a spinneret. The primary variables to control during melt spinning are
temperature, extrusion rate (or pressure), spinneret capillary diameter, quench air flow
rate, quench air temperature, and winding speed. There are generally four primary
temperature zones which need controlling. Three are in the “Heating Zones” portion of
the process where the pitch is gradually melted as it travels along the extruder screw. The
fourth primary temperature to control is the “Heated die”, which sets the spinning
temperature for the pitch and is the last heating zone before the pitch exits the spinneret.
For melt spun fibers, the internal morphology for graphitic mesophase fibers is
classified as radial, onion, or random texture, as shown in Figure 1.14. The graphitic
sheet stacking is easily seen in all molecular orientations, along with the presence
microdomains (subsets of the crystalline region) in the structure. In a study by Mochida
et.al[31], the radial and onion-skin textures showed a homogeneous structure. The

23
benefits of having a homogeneous distribution of orientation with the random fibers are
realized during oxidation, carbonization, and graphitization where the fiber should have
uniform shrinkage in all directions. The non-homogeneous orientation of the molecular
structure of the radial and onion-skin orientations led to non-uniform shrinkage during
high-temperature heat treatments. The non-uniform shrinkage can lead to defects and
have a significant effect on the mechanical properties of the fibers. The mechanical
properties for the different molecular textures can be seen in Table 1.3 with the random
texture having the highest tensile strength at 3.6 GPa and radial having the highest
modulus at 800 GPa. The main variables affecting the internal carbon fiber texture are the
chemistry of the precursor, controlling the flow of the pitch as the precursor fiber is
formed, and the tensile forces the pitch is exposed to while spinning. Controlling the flow
includes the capillary shape of the spinneret and the temperature of the spinneret. As the
temperature increases, these textures have been shown to form in order of lower
temperature to a higher temperature: onion-skin, random, radial-folded, radial, radial with
open-wedge[27] (sometimes referred to as ‘pac man’ shaped fibers).
Figure 1.14 Internal morphology for graphitic mesophase fibers, classified as radial,
onion-skin, random, flat-layer, radial-folded, and line-origin. Reprinted from Carbon,
36(4), Edie DD, The effect of processing on the structure and properties of carbon
fibers,345-362, 1998, with permission from Elsevier.

24
Table 1.3 Mechanical properties of graphitized fibers with various textures. Diameter
(∅), tensile strength (TS), Young’s modulus (E), compressive strength (CS). Reprinted
from Carbon, 36(4), Edie DD, The effect of processing on the structure and properties
of carbon fibers,345-362, 1998, with permission from Elsevier.
Texture
Ø
(µm)
TS
(GPa)
E
(GPa)
CS
(GPa)
Radial with open wedge 11.0 2.8 740 -
Skin Radial-core random 8.1 3.4 800 0.4
Random 9.2 3.6 780 0.7
Quasi-onion 10.4 2.6 720 -
1.7.2 Oxidation
Oxidation is a process that introduces oxygen to diffuse through the fibers and
react to crosslink PAHs, dramatically increasing the softening temperature such that the
filaments are infusible upon further heating and carbonization [8]. This process can be a
difficult task for pitch fibers that require 1-24 hours to complete because the fibers are
susceptible to fusion. Generally, this process begins with no tension on the fibers with a
temperature of 100-150 °C, then the temperature gradually increases to a range of 300-
400 °C. The higher the softening point of the treated pitch, the faster the rate of
temperature increase may be during oxidation without inter-filament fusing. For lower
softening point fibers (< 200 °C) the oxidation process could span days to ensure the
fibers do not re-soften and fuse. Therefore, it is essential the softening temperature of the
pitch be closer to 300 °C for pitch fibers to be economically practical for an industrial
process where the oxidation process needs to be less than a couple hours.
1.7.3 Carbonization and Graphitization
After the pitch fibers have been stabilized to prevent fusing, the carbonization
process is analogous to the PAN fiber carbonization process with the exception, again,
that pitch fibers do not require tension. The goal of this process is to introduce the
stabilized fibers to an inert environment at temperatures 900-1200 °C for many minutes.
The carbon yield of pitch fibers is generally 70-80 wt% of the precursor green fibers.
With mesophase fibers, the mechanical and thermal property advantages are realized

25
once the fibers are graphitized. During thermal conversion at temperatures of 2300-2700
°C for many minutes, the graphite crystalline structure is formed[8].
The graphite structure that is formed during graphitization gives the mesophase
derived fibers excellent strength and rigidity as well as attractive thermal properties. The
graphite layers formed by carbon-carbon double bonds expand in-plane to give the
graphite layer a direction. These layers are stacked together through weak Van Der Waals
bonds and give the layers an AB stacking sequence. This stacking sequence can be seen
in Figure 1.15 and Figure 1.16 where the advantageous properties are ‘in-plane’, not
‘through-plane’.
Figure 1.15 Graphite AB structure. Basal plane view showing the AB stacking offset.

26
Figure 1.16 Top view of graphite AB stacking. The A plane is a solid line and the B plane
is a dotted line.
This graphite crystal is not realized in isotropic pitch derived fibers because they
do not possess discotic mesogen molecules (capable of forming into graphitic layers upon
high heat treatment). Therefore, isotropic fibers have low strength, low modulus, and low
thermal conductivity and are only useful for general fiber applications where mechanical
properties are not essential.
Graphene, which is the base structure of graphite with no basal edges (1 layer) is
similar to the desired mesophase and subsequent graphitic structure in graphitized fibers.
However, pure graphene is difficult and expensive to produce. Therefore, an effective
way to produce nearly pure graphene is to use graphite, which is readily available, that is
oxidized to produce graphite oxide. Then, exfoliation in a solvent by sonication is used to
break the 3-dimensional structure of graphite oxide to single layered graphene oxide

27
(GO). The GO can then be reduced to produce nearly pure graphene, which is called
reduced graphene oxide (rGO).
1.8 Conclusion
Recent economic factors have rekindled interest in pitch as a favorable candidate
to produce carbon fibers. The goal of producing low cost pitch-based carbon fiber
requires the large-scale production of mesophase pitch from which high modulus and
high thermal conductivity carbon fibers are derived. Mesophase pitch production is an
energy intensive process and needs significant optimization before pitch fibers can reach
more of the carbon fiber market. A process that can simplify and reduce the processing
time for the growth of the mesophase will commensurately increase carbon fiber
production efficiency.
As mentioned before, the energy barrier of mesophase formation can be high and
take up to one day[32] for the sufficient formation of mesophase. Therefore, the addition
of a catalyst to decrease the activation energy required for the formation of mesophase
could drastically improve the time required for the formation of mesophase. If a catalyst
is added to the isotropic pitch to facilitate mesophase growth, its effect as a quinoline
insoluble in pitch and therefore its influence on the melt spinning process is of chief
concern. Consequently, the catalyst used to promote the growth of mesophase would
need to be indistinguishable in the mesophase spheres. As seen with the Brooks and
Taylor experiments with hot-stage microscopy, as the mesophase coalesced, it was
deformed by insoluble particles (e.g. mica) present in the isotropic matrix. However,
when graphite was present within the isotropic matrix, the mesophase spheres readily
wetted the surface of the graphite. This observation suggests mesophase growth and
coalescence may be accelerated with a graphite-like structure present that resembles the
mesophase structure. With this conclusion milled graphite would be a candidate to disperse in pitch to
promote the growth of mesophase. However, the large surface area of the milled graphite
relative to the aromatic ring structure of mesophase would limit the sites upon which

28
mesophase could nucleate. Additionally, the milled graphite which has basal edges is a
large insoluble in pitch and could become embedded in the fiber during melt spinning.
This insoluble embedded in melt spun fibers cause mechanical properties to drastically
decrease and can even prevent the formation of fibers. Therefore, the nucleation site must
be small enough not to interfere with melt spinning but still resemble the molecular
structure of graphite. Graphene is an attractive candidate as a seed crystal (catalyst) to
provide a nucleation site where mesophase growth would readily occur and is small
enough to be soluble in the pitch. This is because the structure of graphene is similar to
the desired mesophase and subsequent graphitic structure in graphitized fibers.
In this study, the efficacy of dispersed graphene (as rGO), in the isotropic parent
pitch, to serve as a nucleation site for the accelerated growth of mesophase will be
investigated.
The results will be discussed and quantified by systematic thermal treatment
experiments with a petroleum and coal-tar derived isotropic pitch. This hypothesis stems
from the work by Brooks and Taylor[12] which showed that mesophase tended to wet
graphite.
The specific questions studied in this thesis are;
1. Determining if graphene influences the growth of mesophase in an isotropic
petroleum and coal-tar pitch
2. If the addition of graphene influences the processability of the created mesophase
pitch into carbon fibers (melt spinning, thermal conversion)
Furthermore, the thermally treated pitch (with and without the use of graphene)
will be melt spun into precursor green fiber. The green fiber will be graphitized to
determine mechanical properties and the structure analyzed by scanning electron
microscopy (SEM) and the effects of graphene on the final graphitized fibers will be
evaluated.

29
Chapter 2. GRAPHENE AS A SEED CRYSTAL FOR MESOPHASE
DEVELOPMENT
2.1 Introduction
The ease of processing needs to be considered when attempting the difficult task
of promoting the growth of mesophase within isotropic pitch. Therefore, heat treating,
which was the most straightforward method to transition an isotropic pitch to a
mesophase pitch, was used in the following experiments. For the purposes of this study,
heat treatment refers to heating pitch to a specific temperature in an inert atmosphere
while introducing shear, by nitrogen sparging, to the molten pitch. Nitrogen sparging
created an inert atmosphere to help prevent the polymerization of pitch at higher
temperatures while the flow of nitrogen directed into the molten pitch introduced shear
by bubbling and mixing the molten pitch. The goal of the heat treatments was to create a
thermodynamically favorable environment that encouraged the arrangement of the PAHs
present in the isotropic pitch into stacked layers of PAHs, which is the base structure of
mesophase. Stacking of the aromatic structures occurred because this was a lower energy
state for the molecules and happened readily because the high-temperature environment
allowed the PAHs to become more mobile. The shear increased the chances of the
aromatic structures becoming aligned into stacked layers. The two main challenges of using graphene as a seed crystal were: reducing
graphene from graphene oxide (GO) and using efficient method to disperse graphene
homogeneously throughout the pitch. For this study, microwave reduction of graphene
oxide was used which excites the functional groups of the GO to break bonds with the
aromatic rings then quickly form new bonds. The newly bonded compounds were then
off-gassed from the microwave[33]. The dispersion of the rGO was conducted by
sonication in a pitch: tetrahydrofuran (THF) mixture which allowed the rGO to be
dispersed homogeneously throughout the pitch.
To test the efficacy of the rGO as a seed crystal, milled Mitsubishi AR was also
tested as a nucleation site. To test the effect of THF insolubles present in the pitch, a heat

30
treatment experiment was conducted with insolubles removed from the pitch: THF: rGO
mixture by centrifugation.
2.2 Experimental Materials and Methods
2.2.1 Materials
An isotropic petroleum pitch and an isotropic coal-tar pitch were used for the heat
treatments. The graphene oxide (GO) was supplied from Apply Nano Solutions out of
Alicante, Spain. Initial softening points of the pitches were approximately 100 °C for the
coal-tar pitch and 110 °C for the petroleum pitch as determined by Dynamic Mechanical
Analysis (DMA). The coal-tar and petroleum pitch had QIs of 0.36 wt.% and 1.00 wt.%,
respectively and showed excellent spinnability as a baseline, isotropic pitch.
2.2.2 Experimental Methods
For each of the base pitches, two concentrations of rGO were examined, 0 wt.%
(baseline), 0.01 wt.% and 0.10 wt.%. These weight percentages were chosen to determine
if the added rGO nucleated the mesophase at a very small concentration (0.01 wt.%) and
a relatively higher concentration (0.10 wt.%). Additionally, a mesophase pitch was tested
as a seed crystal to determine the novelty of using rGO (section 2.2.5). Five treatment
times were chosen to study the effect of mesophase formation with rGO as compared to
the mesophase formation of the base pitches. The test matrix is shown in Figure 2.1.

31
rGO wt.%
Pitch Treatment
Time (hr) 0 0.01 0.10
Coal-tar 0.5
1
2
3
4
Petroleum 0.5
1
2
3
4
Figure 2.1 Test matrix followed for testing rGO in coal-tar and petroleum isotropic pitch.
Each treatment time and rGO wt.% were replicated at least once leading to 60 separate
thermal treatments.
The example test matrix shows the plan for a 30-test experiment with at least one
replication for each wt.% and treatment time, leading to a total of 60 individual
experiments. All processing parameters for the heat treatments such as treatment set
temperature, treatment time, nitrogen flow rate, and pitch: solvent ratio remained constant
except for the addition of rGO.
Graphene oxide was reduced using microwave energy before dispersion in the
parent pitch and subsequent thermal treatments[34]. For the 0.01 wt.% and 0.10 wt.%
concentrations, the GO was reduced by placing 0.25-0.50 g of GO in a 250 ml beaker
with fiberglass covering the opening of the beaker, inside a 1200 W microwave for one
minute. This reduction was done immediately before the pitch-THF mixture was placed
on the hotplate. The masses of the GO and reduced GO (rGO) were recorded to quickly
ensure reduction, with an average mass loss of 15 wt.%.
The pitch preparation and treatment method were as follows. For all samples, a
500 ml beaker was tared on a scale and 20 g of coarsely ground pitch was added. The
solvent: pitch ratio of 1 g: 10 ml was used, therefore 200 ml of THF was added in the
32
beaker and the beaker was placed on a hotplate. A one-inch long magnetic stirrer was
placed in the beaker and set to 50 RPM and the temperature was set to 50 °C to ensure
the pitch dissolved in the THF. The rGO was added to the pitch-THF mixture once it was
placed on the hotplate. A watch glass covered the top of the beaker to prevent
evaporation of THF. A k-type thermocouple placed on the heating surface on the hotplate
was monitored by a portable digital thermometer to verify the temperature of the hotplate.
The pitch was left to dissolve for 2-hours.
After 2-hours of magnetic stirring on the hotplate, the mixture was then sonicated
continuously at room temperature. A Fisherbrand™ Model 505 Sonic Dismembrator was
used for two hours at 15% power to give a homogeneous dispersion of the rGO, also with
magnetic stirring (one-inch magnetic bar). The beaker of pitch-THF-rGO was placed in
ice during sonication to help prevent the evaporation of THF. The mixture was
transferred to a 500 ml three-neck flask where a THF flush of the beaker was used to
ensure all pitch-rGO was removed from the beaker. The 500 ml flask was then placed in
a Brisk HM0500MC1™ mantle heater with a k-type thermocouple placed between the
bottom center of the flask and the mantle heater. A second k-type thermocouple 0.125-
inch probe was placed through the center neck of the flask and positioned near the bottom
of the pitch-THF-rGO mixture to monitor the temperature of the mixture during
processing. The temperature was controlled using a PID controller by monitoring the
mantle temperature which was set to 425 °C for all samples in an attempt to achieve a
pitch temperature of 370 °C. Temperatures were logged using a Graphtec GL240 data
logger at a sampling rate of 1-point/sec.
The nitrogen was supplied through a rubber bung into a stainless-steel tube that
was placed near the bottom of the pitch-THF-rGO mixture to ensure sparging throughout
the entire heat treatment process. The arrangement can be seen in Figure 2.2. The
stainless-steel tube for nitrogen and the pitch thermocouple were placed a few inches
apart to help prevent error in the temperature readings. Prior to beginning the heat
treatment, the THF was evaporated from the pitch by setting the mantle temperature to
100 °C and condensing the THF in a connected flask placed on ice. Once the majority of

33
the THF appeared to have evaporated from the pitch, the controller was set the 425 °C for
the thermal treatment.
Figure 2.2 Thermal treatment arrangement.
2.2.3 Temperature Control
With mesophase being a thermotropic liquid crystalline material, the temperature
control during heat treatment was an important factor. The goal of the heat treatment
experiments was to set the pitch to a consistent and repeatable temperature of
approximately 370 °C for all heat treatments. Two options were explored to determine
the best method to control the temperature of the pitch. Using a mantle heater, the
temperature was controlled by a k-type thermocouple placed under the treatment flask to
set the temperature of the mantle. Additionally, a 12-inch, 0.125-inch diameter k-type
thermocouple probe was placed in the pitch to control the treatment temperature, as in
Figure 2.2. Logging the temperature showed that controlling the temperature by the
mantle thermocouple produced a less variable treatment temperature and was closer to
the desired temperature of 370 °C throughout the run. The variation in the pitch-
controlled thermocouple run was from the lag of the controller relay turning on, then

34
turning on the heating mantle, and finally the time to get the pitch to the set point. With a
mantle temperature of 425 °C, the pitch reached the desired temperature of approximately
370 °C more consistently than a pitch-controlled temperature set to 370 °C. These results
can be seen in Figure 2.3, where the variation in temperature for the pitch-controlled
sample was significantly larger than the variation in the mantle-controlled temperature.
Figure 2.3 A comparison of the pitch temperature during heat treatments with the
temperature being controlled by the pitch thermocouple or the mantle thermocouple.
2.2.3 Heat Treatment
As previously stated, the goal was to create a thermodynamically favorable
environment for the aromatic structures of the pitch and rGO to align and build larger
polyaromatic structures. To accomplish this, nitrogen sparging was conducted in a 500 ml
flask placed in a mantle heater set to a temperature of 425 °C. This mantle temperature was
controlled by a PID controller and led to a pitch temperature of approximately 370 °C. The
difference between the mantle temperature and pitch temperature was due to the heat losses
340
345
350
355
360
365
370
375
380
385
390
1142
283
424
565
706
847
988
1129
1270
1411
1552
1693
1834
1975
2116
2257
2398
2539
2680
2821
2962
3103
3244
3385
3526
3667
Tem
per
ature
(°C
)
Time (s)
Temperature of Pitch, Mantle and Pitch Control
Pitch Control Mantle Control

35
caused by the volatiles being removed from the pitch. These reactions led to difficulty in
having a precise temperature for some heat treatments.
The thermal treatment lasted for 0.5, 1, 2, 3, and 4-hours, while the mantle was held
isothermally at 425 °C, with a nitrogen flow rate of 30 l/hr (STP). The volatiles were
condensed in a connected flask that was cleaned after each run by heating the flask to
500 °C for multiple hours in air. Additionally, insulation was wrapped around the treatment
flask to prevent the loss of heat during treatments. Once the heat treatment was complete,
the flask air cooled to room temperature with the flow of nitrogen continuing throughout
the entire heating and cooling process. Then the pitch was removed from the treatment
flask and weighed for mass loss.
2.2.4 Insoluble Testing
The primary insoluble metric of interest was quinoline since it was the most widely
reported insoluble in the literature and can be compared to the parent isotropic pitch QIs.
To determine the quinoline insoluble portion of the heat-treated pitch, the following
method was used and repeated in triplicate for each sample. Approximately 0.5 g of pitch
was placed in a 50 ml beaker and quinoline was added with a pitch:solvent ratio of 1 g:20
ml. If the sample proved too difficult to filter because of a high concentration of insolubles,
the test was repeated with a 0.25 g of pitch. The pitch-quinoline mixture was placed on a
hot plate set to temperature of 120 °C for at least 1-hour with a watch glass to prevent
evaporation of the solvent. The mixture was stirred every 15 minutes to help prevent pitch
from adhering to the flask. The carefully pre-dried filter to be used for filtration was
weighed in order to calculate insolubles. Using vacuum filtration system with a 0.7 µm
pore size borosilicate glass filter, the hot pitch-quinoline mixture was poured over the filter.
Additional quinoline was used to rinse the 50 ml beaker and rinse the walls of the vacuum
filter apparatus. Once the bulk of quinoline had been filtered, THF was used to further
displace the quinoline from the pitch. This THF rinse was essential because of the high
boiling point of quinoline, it is difficult to remove from the pitch by using only heat. After
the THF rinse, the vacuum was left to filter for an additional 5-minutes. Then the filter with
the quinoline insoluble pitch was placed in a small aluminum pan and placed on a hot plate

36
set to 100 °C to evaporate any remaining THF. After at least 2-hours the filter and pitch
were weighed to calculate insolubles using equation 2.1.
𝑄𝐼 (%) =
(𝐹𝑖𝑙𝑡𝑒𝑟 𝑓𝑖𝑛𝑎𝑙 𝑚𝑎𝑠𝑠) − (𝐹𝑖𝑙𝑡𝑒𝑟 𝑖𝑛𝑖𝑡𝑖𝑎𝑙 𝑚𝑎𝑠𝑠)
𝑃𝑖𝑡𝑐ℎ 𝑖𝑛𝑖𝑡𝑖𝑎𝑙 𝑚𝑎𝑠𝑠𝑥 100
[2.1]
2.2.5 Dynamic Mechanical Analysis (DMA)
Softening points were determined by using a TA Q800™ DMA with a
compression clamp. A controlled force program was used to provide a constant force of
0.1 N applied to a small pellet of pitch while the temperature ramped from 25 °C to 450
°C at a rate of 5 °C/min. Once the pitch sample yielded (softened to liquid-like viscosity),
the run was automatically stopped. To determine the softening temperature, the derivative
of displacement with respect to temperature was plotted. Figure 2.4 shows a graphical
representation of the DMA softening point test with the softening temperature marked.
Figure 2.4 Example of a DMA analysis to determine the softening temperature of a pitch.
The derivative of displacement with respect to temperature is plotted and the peak of this
curve is representative of the softening temperature.

37
2.2.6 Polarized Light Microscopy
To determine the mesophase percentage of a sample ASTM 4616-95, Standard Test
Method for Microscopical Analysis by Reflected Light and Determination of Mesophase
in Pitch, was used. Approximately 1 g of the treated pitch was coarsely ground, mixed with
a small amount of epoxy from Pace Technologies™ (ULTRA-3000R-128-resin and
ULTRA-3000H-32 hardener), and then placed in a Leco® 25 mm mold. Additional epoxy
was poured on top of the pitch: epoxy mixture for the “puck” to be polished in a Buehler
EcoMet 3000™ with an AutoMet 200™ attachment. This epoxy-pitch “puck” cured in a
convection air oven set to 50 °C for at least two hours. The “puck” surface was polished
with five subsequent steps with tap water using 240 grit, 400 grit, and 600 grit sandpaper.
The final two polishing steps were with a Buehler Ultrapol™ pad using 3-micron alumina
slurry and a Buehler TexMet™ pad with a 0.05-micron alumina slurry. The samples were
rinsed with tap water and patted dry with a cloth. An example of the final product is shown
in Figure 2.5.
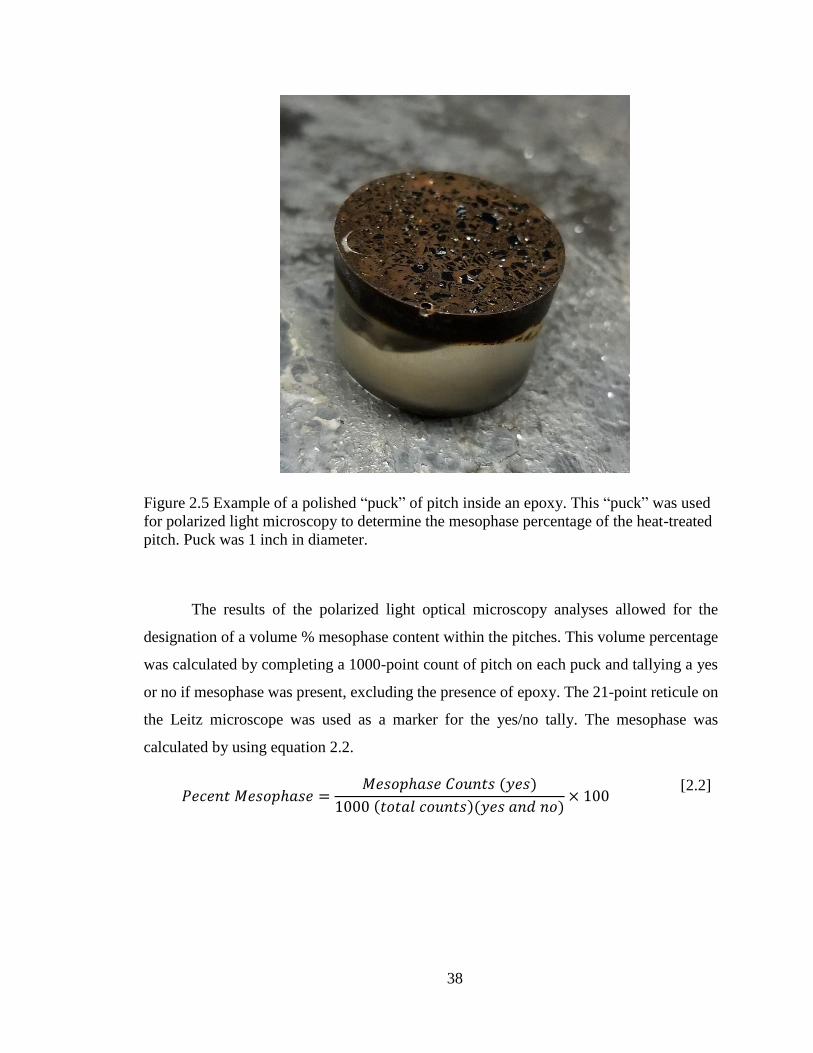
38
Figure 2.5 Example of a polished “puck” of pitch inside an epoxy. This “puck” was used
for polarized light microscopy to determine the mesophase percentage of the heat-treated
pitch. Puck was 1 inch in diameter.
The results of the polarized light optical microscopy analyses allowed for the
designation of a volume % mesophase content within the pitches. This volume percentage
was calculated by completing a 1000-point count of pitch on each puck and tallying a yes
or no if mesophase was present, excluding the presence of epoxy. The 21-point reticule on
the Leitz microscope was used as a marker for the yes/no tally. The mesophase was
calculated by using equation 2.2.
𝑃𝑒𝑐𝑒𝑛𝑡 𝑀𝑒𝑠𝑜𝑝ℎ𝑎𝑠𝑒 =
𝑀𝑒𝑠𝑜𝑝ℎ𝑎𝑠𝑒 𝐶𝑜𝑢𝑛𝑡𝑠 (𝑦𝑒𝑠)
1000 (𝑡𝑜𝑡𝑎𝑙 𝑐𝑜𝑢𝑛𝑡𝑠)(𝑦𝑒𝑠 𝑎𝑛𝑑 𝑛𝑜)× 100
[2.2]

39
2.3 Results
2.3.1 Petroleum Pitch
The mesophase percentages per sample were averaged for each treatment time
and the results comparing the three rGO wt% for the petroleum pitch are shown in Figure
2.7. As previously mentioned in section 2.2.2, the goal was to determine if the added rGO
nucleated the mesophase at a very small concentration (0.01 wt.%) and a relatively higher
concentration (0.10 wt.%).
The temperature controlling method stated in section 2.2.3, was to minimize the
variation in the average temperature of the pitch once it reached treatment temperature.
While this did lead to a decreased variation in treatment temperatures, there was still
some variation in the temperature most likely due to the manual placement of the
thermocouples and the endothermic volatilization. Since the formation of the mesophase
was sensitive to the treatment temperature, when analyzing the results and averaging the
mesophase percentages across all samples with replication, some error occurred.
The logged temperature of the pitch was used to determine the average
temperature of the pitch once it reached the mantle set-point temperature of 425 °C until
the controller cut power to the heating mantle and cooling began. The plot of the average
pitch temperature of each petroleum heat treatment can be seen in Figure 2.6. The
average temperature and mesophase percentage relationship do not appear to favor a
specific sample. Table 2.1 shows the average temperature for all samples at each
treatment time. The pitch temperature generally reached a maximum temperature towards
the beginning of the run, then slowly decreased as the run progressed. Therefore, the
longer the treatment time, the lower the average temperature tended to be. Even though
the pitch temperature goal was 370 °C, after 0.5-hours, it was difficult to attain.

40
Figure 2.6 The average temperature of the pitch during the heat treatment for every
petroleum pitch sample tested.
Table 2.1 Average temperatures at each treatment time with deviation.
Treatment Time (hr) Avg. Temp (°C) Std. dev. (°C)
0.5 373 16
1 351 28
2 357 33
3 355 27
4 338 27
This deviation in temperature was reflected in the deviation of mesophase
percentage for the samples as seen in Figure 2.7. The largest mesophase deviation was
with the 1-hour sample. When analyzing the results with the deviation in temperatures,
the sample weight percentages of rGO that were tested suggest that rGO was beneficial
for accelerating mesophase nucleation at 0.01 wt.%, especially at 2-hours. However, the
rGO does not appear to assist in the nucleation of mesophase at 0.10 wt.% rGO. The
largest differences in mesophase growth after nucleation appear at treatment times of 0.5,
0
50
100
150
200
250
300
350
400
450
0.0% 20.0% 40.0% 60.0% 80.0% 100.0%
Tem
per
ature
(°C
)
Mesophase (%)
Avg. Pitch Temperature During Petroleum Heat
Treatments
0 wt.% 0.01 wt.% 0.10 wt.%

41
1, and 2-hours. Then it appears that all the samples begin to slow in the rate of mesophase
growth from 3 to 4-hours.
Figure 2.7 Petroleum mesophase percentage as determined by polarized light microscopy.
Three samples were tested at three rGO weight percentages: 0 (baseline), 0.01, and 0.10.
To decrease the deviation in average temperatures to determine if the results were
a function of temperature rather than rGO, samples with closer average temperatures
were compared but this comparison removes the replication of each rGO wt.%. Table 2.2
list the average temperatures and the reduction of the deviation in temperatures. The
mesophase percentages with closer related average temperatures, i.e. less deviation, is
shown in Figure 2.8. With less deviation in the temperatures, it appears that the effects of
rGO at 0.01 wt.% become more pronounced. The treatment time that had the smallest
deviation in temperature is shown in Table 2.3. With a deviation of approximately 2 °C,
the 0.01 wt.% sample had significantly more mesophase at 5.6% than the 0 wt.% and
0.10 wt.% at 0.9% and 1.2%, respectively.
0.0%
10.0%
20.0%
30.0%
40.0%
50.0%
60.0%
70.0%
80.0%
90.0%
100.0%
0.5 1 2 3 4
Mes
op
has
e %
Treatment Time (Hours)
Petroleum Mesophase %
0 wt% rGO 0.01 wt% rGO 0.10 wt% rGO

42
Table 2.2 Comparing rGO wt.% with closer average temperatures. Target temperature
was 370 °C.
Treatment Time (hr) Avg. Temp (°C) Std. dev. (°C)
0.5 362 2
1 336 12
2 339 31
3 377 23
4 323 13
Figure 2.8 The mesophase percentage compared with less deviation in the average
temperatures.
0.0%
10.0%
20.0%
30.0%
40.0%
50.0%
60.0%
70.0%
80.0%
90.0%
0.5 1 2 3 4
Mes
ophas
e %
Treatment Time (hr)
Petroleum Mesophase % with Closer Avg. Temperature
0 wt% 0.01 wt% 0.10 wt%

43
Table 2.3 Comparison of mesophase percentages for the 0.5-hour treatment samples that
had the smallest deviation of average pitch temperature.
rGO % Treatment Time (hr) Avg. Pitch Temperature (°C) Mesophase %
0 0.5 360 0.9
0.01 0.5 362 5.6
0.10 0.5 365 1.2
The highest difference in mesophase percentages occurred within the first 2-hours
of heat treatment. With the dispersed rGO in the pitch, there were more opportunities for
the mesophase to form because of the available PAHs nucleation sites. This suggests that
the rGO at 0.01 wt% accelerated the overall mesophase growth by being a nucleation site.
For all samples, it appeared that the growth of mesophase begets more mesophase.
Therefore, with more mesophase initially, the 0.01 wt% sample can generate mesophase
at a faster rate. Once the nucleation sites matured in the growth of mesophase, the rate of
growth for the 0.01 wt% rGO sample more resembled a non-rGO sample as seen in the 3-
hour and 4-hour treatment times.
As mentioned in section 2.2.6, polarized light microscopy was conducted on a
Leitz microscope following the procedure outlined in ASTM 4615-95. Using a 20x air
objective, 1000-points were counted for each puck to determine the mesophase
percentage using a zig-zag pattern. Figure 2.9 shows the polarized light analysis of the
base pitch petroleum product. No anisotropy (mesophase) was visible with the rotation of
the analyzer or the rotation of the stage.

44
Figure 2.9 Isotropic petroleum-based pitch under polarized light. No mesophase
content is present. The two white dots are epoxy.
When the heat-treated samples were analyzed under the polarized light, the
mesophase content appears in tones of bright cyan, yellow and magenta, while the
isotropic pitch matrix (and isotropic epoxy matrix) remained a static tone of purple. The
isotropic matrix was the same color throughout because it reflected light at the same
wavelength throughout the material. However, with the anisotropic material, the
crystalline structure caused the polarized light to reflect at various wavelengths across the
sample, yielding the variation of colors. This effect was seen by rotating the stage the
sample was placed on by 90 degrees, which caused the colors to change from cyan to
magenta and magenta to cyan.

45
An example of the nucleation of mesophase in the 0.01 wt.% sample can be seen
with the polarized light images for the 0.5-hour samples as shown in Figure 2.10. The 0
wt.% sample did have small mesospheres form (Figure 2.10 (i)), but they were below the
minimum 4 µm diameter used to count mesophase as outlined in the ASTM. The 0.01
wt.% sample had similar sporadic areas of small mesophase nucleation with spheres that
were slightly larger than the 0 wt% sample. However, there were sites of large mesophase
growth and coalescence within the 0.01 wt% sample, as seen in Figure 2.10 (ii). These
areas of mesophase could be the sites where the rGO allowed for the nucleation of
mesophase, which then led to the earlier growth of mesophase. The 0.10 wt% sample
appeared to have larger spheres than the 0 wt% sample sporadically dispersed in the
isotropic pitch Figure 2.10 (iii), but there were not areas of mesophase growth as seen in
the 0.01 wt% sample.
(i)
(ii)
(iii)
Figure 2.10 Mesophase growth comparison by polarized for 0.5-hours of thermal
treatment for the 0 wt.% (i) 0.01 wt.% (ii) and 0.10 wt.% (iii) samples. Scale bar is 50
µm.
The evolution of mesophase nucleation then growth for the petroleum sample is
shown in Figure 2.11. All samples appeared to go through similar mesophase cycles of
initial formation (nucleation), growth, and coalescence, but at different rates. Towards the
end of the treatment times, even though the mesophase percentages begin to converge,
the type of mesophase formed appeared to vary between the three samples. The 0 wt%

46
sample had larger dispersed spheres, the 0.01 wt% had more flow fields of mesophase
and the 0.10 wt% had smaller dispersed spheres. The smaller dispersed spheres in the
0.10 wt% sample could be representative of the higher number of nucleation sites present
that may be competing for coalescence with the other spheres present. The balance of
promoting nucleation but not oversaturating the pitch could explain the higher mesophase
percentages in the 0.01 wt% sample.
Petroleum Pitch
0 wt % rGO 0.01 wt% rGO 0.10 wt% rGO
(i)
(ii)
(iii)

47
(iv)
Figure 2.11. Mesophase content for the petroleum sample at treatment times of 1 hour (i),
2-hour (ii), 3-hour (iii), and 4-hour (iv).
After treatment, each sample was analyzed for softening point temperature. The
important characteristic of softening temperature was determined by DMA. This test was
to determine if the pitches once spun into fibers, could be oxidized without interfilament
fusion and to estimate the melt spinning temperature. As the mesophase content increased
(extended thermal treatment) the softening temperature increased as well, which is
highlighted in Figure 2.12. The increase in softening temperature was because the
mesophase molecular weight is generally larger than the isotropic molecular weight and
therefore will have a higher softening temperature. The softening temperature of the pitch
drastically increased from the parent pitch softening temperature of 110 °C after 0.5-
hours of treatment to above 200 °C for all samples. After the initial 0.5-hours of
treatment, the rate of softening temperature increase appeared to slow. This decreased
rate suggests that the majority of the lighter molecular weight compounds present in the
pitch are volatized within the first 0.5-hours of heat treatment leading to the drastic
increase in softening temperature. For all weight percentage samples and all treatment
times, there was a similar softening temperature and the minimum temperature required
for oxidation of 220 °C was reached within the first 0.5-hours. The slight softening
temperature decrease from 3 to 4-hours was due to sampling pitches that had a lower
treatment temperature at the 4-hour mark. It does not imply that if a portion of the same
sample was tested at 3-hours then 4-hours, the softening temperature would be lower.

48
Figure 2.12 Softening temperatures of the pitches by DMA compression test for all
petroleum pitches tested. The softening temperature was determined by a controlled force
test. Then the derivative of displacement with respect to temperature was plotted.
Another important characterization of the heat-treated pitch was the amount of
pitch insoluble in quinoline. After each heat treatment, approximately 0.5 g of the pitch
was used for insoluble testing and completed in triplicate. The results are plotted in
Figure 2.13. The QIs appeared to follow the trend of mesophase formation shown by
point-counting, that is, as the mesophase content increased, as did the QIs. The 0.01 wt%
sample had more initial QIs, but all the samples trend towards a similar QI percentage
near four-hours.
0
50
100
150
200
250
300
350
400
0.5 1 2 3 4
Soft
enin
g T
emper
ature
(°C
)
Treatment Time (hr)
Petroleum DMA Softening Temperature
0 wt% rGO 0.01 wt% rGO 0.10 wt% rGO

49
Figure 2.13 Quinoline insolubles (QIs) for all the petroleum pitches tested. As expected,
the QIs increased with increased mesophase percentage.
2.3.2 Coal-tar Pitch
Following the same procedure used for the petroleum-based pitch, the mesophase
percentages per sample were averaged for each treatment time and the results comparing
the three rGO wt.% for the coal-tar pitch are shown in Figure 2.15. The goal was to
determine if the added rGO nucleated the mesophase at a very small concentration (0.01
wt.%) and a relatively higher concentration (0.10 wt.%).
Since the same heat treatment arrangement was used for the coal-tar heat
treatments as with the petroleum pitch heat treatments, there was variation in average
temperatures across all samples. This variation is shown in Figure 2.14, where the
average temperature during the heat treatments was plotted versus mesophase percentage.
The deviations in the temperatures for each treatment time can be seen in Table 2.4.
Except for the 0.5-hour treatment time, there were large variations across the average
temperature. Additionally, with the same mantle set temperature of 425 °C used with the
0%
10%
20%
30%
40%
50%
60%
70%
80%
90%
0.5 1 2 3 4
QIs
(%
)
Treatment Time (hr)
Quinoline Insolubles
0 wt% rGO 0.01 wt% rGO 0.10 wt% rGO

50
petroleum samples, the coal-tar pitch samples on average had a lower average pitch
temperature. The precise temperature control of the pitch proved difficult because of the
endothermic volatization. Even though the target pitch temperature was 370 °C, it was
difficult to achieve for the longer treatment times.
Figure 2.14 The average temperature of the pitch during the heat treatment for every
coal-tar sample tested.
Table 2.4 Average temperature during the heat treatment for all coal-tar samples and the
deviation of temperatures.
Treatment Time (hr) Avg. Temp (°C) Std. dev. (°C)
0.5 364 0
1 331 20
2 308 54
3 353 27
4 330 9
0
50
100
150
200
250
300
350
400
450
0.0% 10.0% 20.0% 30.0% 40.0% 50.0% 60.0% 70.0%
Tem
p (
°C)
Mesophase (%)
Avg. Pitch Temperature During Coal-tar Heat Treatments
0 wt% rGO 0.01 wt% rGO 0.10 wt% rGO

51
The deviation in temperatures led to more deviation of mesophase in the coal-tar
samples than with the petroleum samples. This led to no apparent trend once all samples
were averaged for mesophase percentages as shown in Figure 2.15. To separate the effect
of temperature with the effect of rGO on mesophase growth, samples with less deviation
of average pitch temperatures were analyzed. Table 2.5 shows the improved deviation of
average temperature once outlier average temperature samples were removed. Figure
2.16 shows the mesophase percentages but again, this removes replication.
Figure 2.15 Coal-tar pitch mesophase percentage as determined by polarized light
microscopy. Three samples were tested at three rGO weight percentages: 0 (baseline),
0.01, and 0.10.
0.0%
10.0%
20.0%
30.0%
40.0%
50.0%
60.0%
70.0%
80.0%
90.0%
100.0%
0.5 1 2 3 4
Mes
ophas
e %
Treatment Time (Hours)
Coal-tar Mesophase %
0 wt% rGO 0.01 wt% rGO 0.10 wt% rGO

52
Table 2.5 Comparing rGO wt.% with closer average temperatures. Target temperature
was 370 °C.
Treatment Time (hr) Avg. Temp (°C) Std. dev. (°C)
0.5 364 0
1 327 17
2 360 12
3 376 4
4 326 3
Figure 2.16 The mesophase percentage compared with less deviation in the average
temperatures.
Once the deviation in average temperature was decreased, the addition of rGO
appears to assist in the growth of mesophase. This effect of an increased nucleation of
mesophase was similar to the petroleum sample where the largest difference in
mesophase growth was around the 2-hour treatment time. Similarly, as the heat treatment
0.0%
10.0%
20.0%
30.0%
40.0%
50.0%
60.0%
70.0%
80.0%
90.0%
100.0%
0.5 1 2 3 4
Mes
ophas
e %
Treatment Time (hr)
Coal-tar Mesophase % with Closer Avg. Temperature
0 wt% 0.01 wt% 0.10 wt%

53
times progress, the amount of mesophase for each sample converges to a similar amount
at 4-hours.
At 0.5-hours of treatment time, shown in Table 2.6, all samples had the same
average temperature. With the rGO samples, the mesophase percentages were higher than
the sample with 0 w.t% rGO, suggesting the rGO assisted in the rate of mesophase
development. For the rGO samples of 0.01 wt.% and 0.10 wt.%, the mesophase
percentages were 3.2 % and 4.9 %, where the 0 wt% rGO sample had 1.9 % mesophase.
The amount of mesophase for all three samples were similar to the mesophase
percentages at 0.5-hours with the petroleum pitch.
Table 2.6 Mesophase percentage for coal-tar pitch samples with same average
temperature heat treated for 0.5-hours.
rGO % Treatment Time (Hour) Avg. Pitch Temperature (°C) Mesophase %
0 0.5 364 1.9
0.01 0.5 364 3.2
0.10 0.5 364 4.9
For the coal-tar sample, both rGO wt.% were similar in mesophase growth. Additionally,
the amount of mesophase growth in the coal-tar sample was lower than the petroleum
sample. This lower growth may be due to the lack of mobility in the coal-tar molecular
structure. Since the coal-tar had less aliphatic areas, the energy and time required to
generate mesophase was higher than that of the petroleum sample.
Polarized light microscopy was conducted on a Leitz microscope following the
procedure outlined in 2.2.6. Using a 20x air objective, 1000-points were counted for each
puck to determine the mesophase percentage using a zig-zag pattern. Figure 2.17 shows
the polarized light analysis of the base pitch coal-tar product. No anisotropy (mesophase)
was visible with the rotation of the analyzer or the rotation of the stage. The nucleation
and growth of mesophase is shown with the polarized light images in Figure 2.18.

54
Figure 2.17 Isotropic coal-based pitch under polarized light. No mesophase content is
present. The white dot is epoxy.
Coal-tar Pitch
0 wt % rGO 0.01 wt% rGO 0.10 wt% rGO
(i)

55
(ii)
(iii)
(iv)
(v)
Figure 2.18. Mesophase content for the petroleum sample at treatment times of 0.5-hours
(i), 1-hour (ii), 2-hour (iii), 3-hour (iv), and 4-hour (v).
Softening temperature of the coal-tar pitches followed a similar trend as the
petroleum pitches and are shown in Figure 2.19. The softening temperature drastically
increased from the baseline of 100 °C to near 200 °C within the first 0.5-hours of
treatment. However, the rate of increase for the softening temperature decreased as the

56
length of the heat treatment increased. Again, this suggests the majority of the lighter
molecular weight compounds were volatized during the first 0.5-hours of the heat
treatment. From 2-hours to 4-hours, both petroleum and coal-tar samples have a similar
softening temperature.
Figure 2.19 Softening temperatures of the pitches by DMA compression test for all coal-
tar pitches tested. The softening temperature was determined by the derivative of
displacement with respect to temperature.
The QIs were measured following the heat treatments with the same procedure
outlined in 2.2.4 and the results are shown in Figure 2.20. The QIs for the coal-tar pitch
samples do not have the same drastic difference as shown between the petroleum pitch
samples. Overall, the QIs for all samples increase at a similar rate as the treatment times
increase. The disparity of the polarized light results and the QIs could be from the size of
mesophase formed for each sample or polymerization of the isotropic matrix[35].
0
50
100
150
200
250
300
350
400
0.5 1 2 3 4
Soft
enin
g T
emper
ature
(°C
)
Treatement Time (hr)
Coal-tar DMA Softening Temperature
0 wt% rGO 0.01 wt% rGO 0.10 wt% rGO

57
Figure 2.20 Quinoline insolubles (QIs) for all the coal-tar pitches tested. As expected, the
QIs increased with increased mesophase percentage.
Polymerization of the isotropic matrix could have caused the PAHs to form longer
poly aromatic chains instead of stacking. Since the coal-tar pitch molecular structure is
not as mobile as the petroleum pitch, it is a possibility this occurred. It has been shown
that the molecular weight of the isotropic matrix is not constant throughout the heat
treatment process, and continuously transforms[36]. Therefore, if a sample has lower
mesophase content because of the isotropic matrix polymerization, it could still yield a
higher insoluble content because of the long-chained, insoluble isotropic molecules.
2.3.3 Observations During Heat Treatments
During the heat treatments, the type of volatiles produced for the petroleum and
coal-tar pitch varied significantly by visual inspection. While the weight percentage
losses were similar between the samples (40-60 wt.%), the coal-tar pitch had more
0%
10%
20%
30%
40%
50%
60%
70%
80%
90%
100%
0.5 1 2 3 4
QIs
(%
)
Treatment Time (Hours)
Coal-tar Quinoline Insolubles
0 wt% rGO 0.01 wt% rGO 0.10 wt% rGO

58
volatiles condense in the condensing flask, where the petroleum volatiles mainly
condensed in the fume hood. The “dirtier” heat treatment of the coal-tar pitch may be due
to the complexity of the mixture of organic compounds present in the pitch[37]. While
the nitrogen was used for mixing the molten pitch by sparging, the flow rate of the
nitrogen had a significant effect on the mesophase development which is supported by
empirical evidence from previous experiments. The higher the nitrogen purge flow rate,
the more aggressive the removal of volatiles from the heat treatment vessel. This
aggressive flow rate of nitrogen mitigated the condensation of the lighter and more
volatile species evolved during the heat treatment and facilitated the development PAH
condensation into mesophase pitch.
Once the sample had cooled to room temperature, the isotropic pitch fraction
tended to have a shiny, glassy appearance, while the mesophase pitch appeared more
matte grey. The difference in appearance suggests phase separation of the mesophase and
isotropic phases during cooling. Separation occurred because the mesophase was of a
higher density than the isotropic pitch, therefore tended to settle on the bottom of the
flask[38].
2.2.5 Milled Mitsubishi and THF Insolubles
A synthetic mesophase pitch, Mitsubishi AR, was used as a seed crystal to test if
it affected mesophase growth similar to rGO when dispersed in the petroleum-based
pitch. This experiment was important because it helped probe the novel nature of rGO as
a nucleation site compared to other similarly structured catalysts upon which the
mesophase could nucleate. The AR pitch was ground in a ball mill and then tested at
concentrations of 0.01 wt.% and 0.10 wt.% for 0.5 hours of heat treatment following the
same procedure for the rGO doped samples. The growth of mesophase was lower than
the pitch with rGO as a seed crystal yielding 2.1% and 0.8% mesophase versus 5.6% and
1.2%, respectively. Therefore, the results showed that rGO is better at mesophase
generation than a mesophase seed crystal, Mitsubishi AR. The surface area only of the
rGO and the relatively short length scale of rGO compared to milled AR pitch appear to
be the most important factors that allowed it to be a novel solution as a nucleation site of
mesophase.

59
Also, an experiment was conducted to determine the influence the insolubles of
the pitch had on the mesophase growth since insolubles were not removed from the pitch-
THF mixture during the heat treatment process. This experiment was important because
the THF insolubles in pitch could have affected the homogenous dispersion of rGO. An
experiment was conducted with each concentration of rGO to remove the insolubles to
determine the effect this had on mesophase growth. After sonication, the samples were
placed in a centrifuge at ambient air temperatures with a rotation speed of 500 rpm for
one hour. The solution was decanted, and then heat treated the same as previous samples
at 1 and 2-hours. There was an average of 12 wt.% THF insolubles for all samples. No
discernable difference was observed in the growth of mesophase in these centrifuged
samples compared to the non-centrifuged samples.
2.4 Conclusion
In these experiments rGO was used as a nucleation site, “catalyst”, in petroleum
and coal-tar pitch to assist in the formation of mesophase. The petroleum pitch results
suggest that an exceptionally low concentration of rGO (0.01 wt.%) dispersed into an
isotropic pitch acts as nucleation sites to aid in the development of mesophase domains.
The results of the 0.01 wt.% were promising because of the high cost of rGO, the less
material that can be used would make the addition of rGO a more economically viable
process. The type of mesophase growth varied as well. With 0 wt.% rGO the mesophase
was less dispersed throughout the isotropic matrix and consisted of larger mesophase
spheres. For the 0.01 wt%, the mesophase had a similar dispersion to the 0 wt%, but the
nucleation of mesophase was more rapid. This nucleation of mesophase is because the
0.01 wt% concentration of rGO possibly lowered the energy required for the PAHs to
stack and form mesophase structures. The 0.10 wt% mesophase was more dispersed with
smaller mesospheres than the other weight percentages and did not appear to coalesce as
quickly. For all petroleum samples the softening temperature increased drastically in the
first 0.5-hours of treatment from 100 °C to approximately 220 °C suggesting the
volatization of lighter compounds occurred in the beginning of the heat treatment
process. After the first 0.5-hours, the softening temperature gradually rose to over 250 °C
at the 4-hour treatment time.

60
The coal-tar pitch results suggested when looking at similar average treatment
temperatures, the addition of rGO assisted in the growth of mesophase for both the 0.01
wt% and the 0.10 wt% samples. However, overall the results of the coal-tar sample were
more enigmatic than the petroleum sample. These results could be from the lack of
mobility of the coal-tar sample compared to the petroleum sample that would make it
more sensitive to variations in temperature. Also, for the coal-tar pitch, the aggressive
volatization of the lighter compounds may have contributed to the higher QIs and smaller
sized formation of mesophase because the isotropic solvent was removed too
aggressively or polymerized early in the process. Since the coal-tar pitch compounds
were less mobile than the petroleum pitch, it may require a less aggressive nitrogen flow
rate during the growth phase of mesophase. This could allow the lighter compounds to
act as a solvent in which the mesophase could form.
The following chapters will discuss the efforts to melt spin the treated pitch into
fiber, and to characterize graphitized fibers by tensile testing for tensile properties.
Moreover, the morphology of the graphitized fibers was analyzed by SEM imaging of
fracture surfaces.

61
Chapter 3. MELT SPINNING
3.1 Introduction
As mentioned, the goal with melt spinning was to transition the solid pitch into a
softened state then quickly vitrify in air while applying tension in order to draw a green
fiber. There were two methods used at UKY to melt spin; a single filament extruder and a
single filament pressure capsule. Generally, pressure spinning with the capsule was used
for smaller batches of experimental pitches (<40 g) or to test the spinnability of certain
pitches. This was useful because certain pitches, especially mesophase pitches, can
require multiple runs to optimize the spinning conditions. When pressure spinning,
multiple spinning runs can be completed on the same day because fewer parts are
required to clean. The extruder, while useful for bulk continuous filament spinning,
requires significantly more time to get started and clean, and therefore only a few runs
per day are possible. Prior to the work in this thesis, approximately 100 spinning runs
were completed between the extruder and pressure spinning apparatus. The goal of these
runs was to understand the operational parameters (pressure, temperature, take-up speed)
effect on generating a green fiber. With experimental pitches, it was difficult to predict
the best-operating conditions prior to spinning. Therefore, it was appropriate to start with
general estimated conditions, then slowly adjust the available parameters to generate
green fiber. However, unlike isotropic pitches, mesophase pitches require precise
temperature control due to their highly non-Newtonian behavior[24].
The temperature dependence of mesophase pitch can be characterized using
rheological analysis. The mesophase shows a shear thinning (non-Newtonian) behavior
as the shear rate increases. Therefore, at a constant temperature the viscosity of the
mesophase pitch decreases as the shear rate increases (Figure 3.1), where the viscosity for
an isotropic pitch would remain constant. At low shear rates, the domains of the
mesophase liquid crystalline structure are stretched and the size of the mesophase
structure decreases, which decreases the viscosity of the pitch. If the shear rate increases
still, the mesophase domains shift into a monodomain field[39] (oriented in the same
direction) which leads to the viscosity slightly increasing, or remaining constant.

62
Figure 3.1 Representative shear rate sweep for a 100% mesophase pitch.
The following sections discuss the extruder and pressure melt spinning process as
well as the spin runs conducted with the pitches specific to this thesis. For the rGO
pitches, since the dispersed rGO is significantly smaller than the diameter of the spinneret
and the filter, it was not expected to affect the fibers generated. Additionally, the
phenomena of melt pool spinning is discussed and the difficulties it caused in generating
a small, consistent diameter green fiber without voids. The variation of operating
parameters with an isotropic and mesophase pitch will be discussed by examining the
previous Wayne Extruder (WEXT) and pressure spinning runs. While various pitches
have been spun with the WEXT and pressure capsule, a comparison of the operating
conditions for the isotropic petroleum pitch and the 100-percent mesophase Mitsubishi
AR pitch will be discussed.
1
10
100
1000
10000
0.1 1 10 100
Vis
cosi
ty (
Pa-
s)
Shear Rate (1/s)

63
3.1.1 Wayne Extruder (WEXT) Spinning
Extruder melt spinning was an involved process where multiple parameters
require adjusting to ensure the molten pitch was at the right temperature, pressure, and
flow rate to generate green fiber.
An extruder functions by using a screw to meter finely ground pitch (0.15-0.70
mm) through heated zones to gradually soften the pitch and force it through a capillary
into a spinneret. A screw was used to generate pressure by adjusting the RPM and
tapering threaded flutes in the direction of flow. The friction between the solid pitch and
the wall of the capillary provides the necessary force required to push the pitch through
the various temperature zones and generate the necessary pressure at the end of the
screw, which vary for isotropic and mesophase pitches. An example of an extruder screw
is shown in Figure 3.2. The hexagonal right side of the screw was coupled with the motor
to turn the screw. As the flutes move from right to left, the height decreases from
approximately 1.0 mm to 0.5 mm. Generally, the melt spinning run began with a screw
speed of 20 RPM and was adjusted throughout the run to reach the optimal flow rate.
This leads to a range of pressures depending on the flow characteristics of the pitch. For
an isotropic pitch, the pressures were usually around 100 psi while the mesophase pitches
ranged from a few hundred psi to near 1000 psi. Additionally, an important factor with
melt spinning by extrusion was feeding the ground pitch to the screw at a constant rate.
Without a consistent feed rate and properly sized pitch (function of flute size), successful
extruder melt spinning was not possible. A hopper cannot be used to feed the pitch
because it becomes bound in the throat of the hopper due to the pitch adhering to the
walls of the feed hole.
Figure 3.2 Extruder screw for the WEXT.

64
1. Zone 1 heater (C)
2. Zone 2 heat (C)
3. Die Zone 1 heater (C)
4. Die Zone 2 heater (C)
5. Melt temperature (M)
6. Start
7. Stop
8. Barrel screw RPM (C)
9. Emergency stop
10. Amperage (M)
11. Screw RPM display
12. Pressure display
13. Input for pitch powder
Figure 3.3 Side view of the WEXT with the listed monitored (M) and controlled (C)
parameters.
Figure 3.3 shows a side view of the WEXT with the controls listed. A basic
schematic of the extruder was shown in section 1.7.1. In order to control these
parameters, the WEXT had four temperature zones, the screw RPM which varies flow
rate and therefore pressure, and spinnerets which range from 0.30 - 1.00 mm in diameter.
The temperature zones and pressure transducer location are shown in Figure 3.4. As
Flow of Pitch

65
mentioned, the goal with the extruder was to provide sieved pitch (0.15-0.70 mm) to the
screw which metered the pitch by friction with the wall through the temperatures zones to
soften the pitch to a liquid-like viscosity. The maximum size of the ground pitch needed
to be smaller than the maximum height of the screw flutes, else the screw could not force
the pitch through the capillary. The melt temperature thermocouple was located near
where this softening transition occurs. The spinneret was located below Die Zone 2, and
this was where the single filament fiber forms.
Figure 3.4 Controlled temperatures zones for the WEXT where the pitch transitions from
right to left. Melt temperature and pressure transducer location are shown.
To manage the shear thinning behavior on the WEXT, the four temperature zones
must be properly set (by experimentation) to have a successful run. While the DMA
softening temperature assisted in setting the initial spinning parameters, ultimately, they
were adjusted throughout the run as the behavior of the pitch was observed. This was not
necessarily the case with isotropic pitches or low mesophase pitches (< 20%) where the
softening temperature was used to set parameters near the optimal operating conditions.

66
After multiple spinning experiments, the following ratios were generated
(equation 3.1) in order to quickly estimate a baseline target of temperatures for the start
of each run. This table was generated from the most successful spin runs on the extruder
and calculates the four zone temperatures as a ratio of the DMA softening temperature
(𝑇𝑠𝑝). The four zones are shown in Figure 3.4, Zone 1 (𝑍1), Zone 2 (𝑍2), Die Zone 1
(𝐷𝑍1), and Die Zone 2 (𝐷𝑍2).
𝑍1 =𝑇𝑠𝑝
1.17 𝑍2 =
𝑇𝑆𝑝
0.86 𝐷𝑍1 =
𝑇𝑠𝑝
0.86 𝐷𝑍2 =
𝑇𝑠𝑝
0.86
[3.1]
For an isotropic pitch with a 110 °C softening temperature, green fibers were spun
with starting zone temperatures of 94 (𝑍1), 127 (𝑍2), 127 (𝐷𝑍1), and 127 °C (𝐷𝑍2).
These temperatures were systematically adjusted to 90, 145, 150, and 150°C to generate
the most consistent and smallest diameter fiber throughout multiple runs by monitoring
the flow characteristics of the pitch as it exited the spinneret. The range of adjustment to
temperatures was standard for any isotropic pitch spun. However, these ratios of
temperatures did not apply for mesophase pitches since they generally required different
set temperatures depending on the source of the pitch, the softening temperature, and
mesophase content. For example, the Mitsubishi AR pitch required zone settings of 225
(𝑍1), 320 (𝑍2), 330 (𝐷𝑍1), 330 °C (𝐷𝑍2) with a 286 °C softening temperature to generate
a green fiber. The ratios of these temperatures applicable to this specific mesophase pitch
were not applicable to other mesophase products. Multiple spin runs were required to
determine ideal temperatures for other high-percentage mesophase pitches. Once the
temperature ratios were properly set (as determined by experimentation) and with a
consistent feed rate of ground pitch, small diameter fibers were spun. Figure 3.5 shows
the carbonized fibers of 100-percent mesophase pitch melt spun from an extruder.

67
Figure 3.5 Extruder melt spun mesophase carbon fibers.
3.1.2 Pressure Spinning Capsule
As mentioned, pressure spinning was advantageous for small amounts of
experimental pitches generated on a research scale. While the goal of generating a small
diameter (< 20 µm) fiber was the same as extruder melt spinning, there was only one
temperature zone to set and pressure was applied by nitrogen instead of a screw. The
methodology of choosing a starting temperature and pressure, then iteratively adjusting
both to obtain continuous fiber filament spinning was the same as the extruder. Figure 3.6
shows the pressure spinning capsule used at UKY CAER.
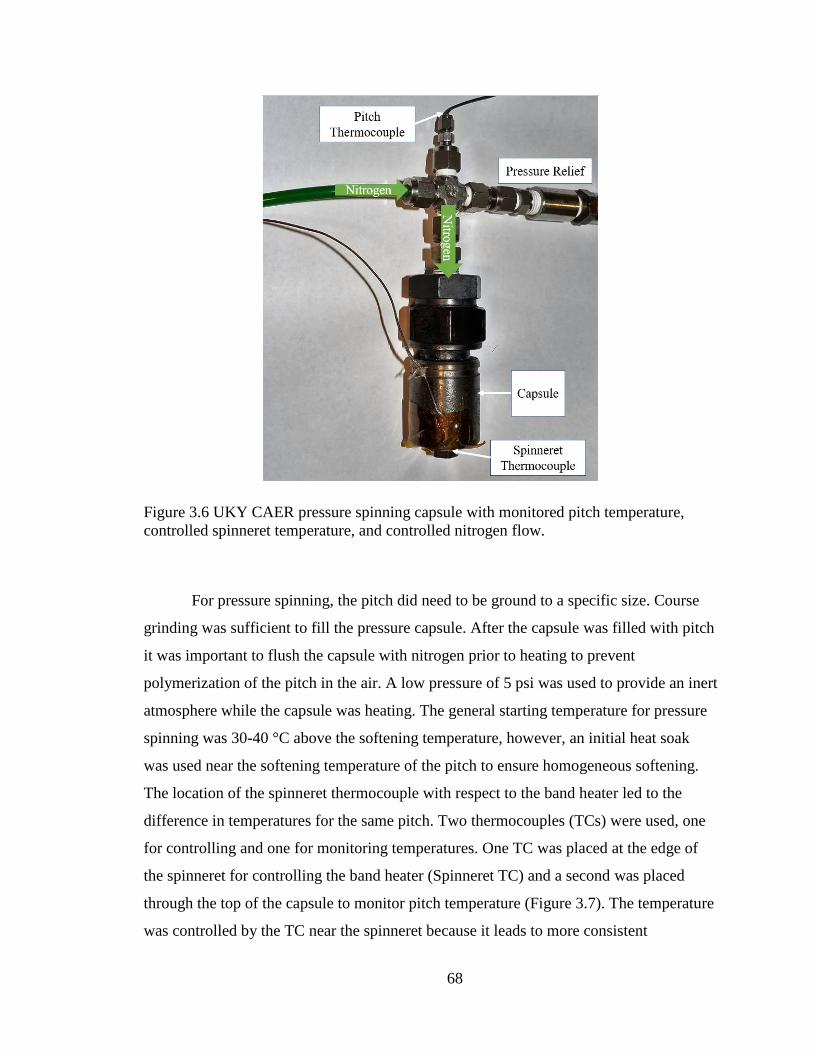
68
Figure 3.6 UKY CAER pressure spinning capsule with monitored pitch temperature,
controlled spinneret temperature, and controlled nitrogen flow.
For pressure spinning, the pitch did need to be ground to a specific size. Course
grinding was sufficient to fill the pressure capsule. After the capsule was filled with pitch
it was important to flush the capsule with nitrogen prior to heating to prevent
polymerization of the pitch in the air. A low pressure of 5 psi was used to provide an inert
atmosphere while the capsule was heating. The general starting temperature for pressure
spinning was 30-40 °C above the softening temperature, however, an initial heat soak
was used near the softening temperature of the pitch to ensure homogeneous softening.
The location of the spinneret thermocouple with respect to the band heater led to the
difference in temperatures for the same pitch. Two thermocouples (TCs) were used, one
for controlling and one for monitoring temperatures. One TC was placed at the edge of
the spinneret for controlling the band heater (Spinneret TC) and a second was placed
through the top of the capsule to monitor pitch temperature (Figure 3.7). The temperature
was controlled by the TC near the spinneret because it leads to more consistent

69
temperatures as compared to controlling the heater by the pitch temperature. The same
problem of controlling temperature by the pitch appears that occurred during heat
treatments. There was significant lag between the heater turning on, and the pitch
thermocouple reaching the desired temperature. When the heater was controlled by the
pitch temperature, there was more variation in the temperature over time. However, the
manual placement of the spinneret TC still caused a variation in the spin temperature
used for each run of a few degrees Celsius, even with the same pitch sample used. For
example, the petroleum isotropic pitch that was spun on the WEXT was initially set to
100 °C for ten minutes before ramping to the spinning temperature of 135 °C. This
temperature was 15 °C lower than the DZ2 temperature used for the WEXT.
Figure 3.7 Melt spinning apparatus used for spinning green fibers. A 20 µm fritted metal
filter was used during spinning to filter out particulates. The parameters controlled for
pressure spinning are shown: nitrogen pressure, spinneret temperature, and take-up spool
RPM.

70
A fritted stainless-steel candlestick filter (with a nominal pore size of 20 µm) was
used to filter the molten pitch prior to entry into the spinneret to ensure no solid,
insoluble particles became embedded in the fiber. Previous experiments with melt
spinning have shown that a 20-µm pore size was sufficient to properly filter the molten
pitch without requiring excessively high pressures to force pitch through the filter.
However, spinning time was reduced as the in-line filter became blinded. The time for the
filter to become blinded depended on the pitch used, but generally limited the spin run to
less than 20 minutes for high-mesophase content pitches.
As with the WEXT, multiple mesophase and isotropic pitches have been pressure
spun to ascertain the spinnability of pitches and to generate small-scale fibers. The
isotropic pitches were resilient to changes in nitrogen pressure and spin temperature. The
isotropic petroleum pitch was able to be spun successfully at temperatures ranging from
120-140 °C with pressures ranging from 5-65 psi. However, the mesophase pitch was
much more difficult to spin in the pressure capsule because the temperature was not as
precisely controlled compared the WEXT. Pressure spinning the AR mesophase sample
used for the WEXT required a set temperature of 365 °C in order to begin to generate a
fiber, compared to 330 °C when spun using the WEXT. Figure 3.8 shows fibers that were
generated by pressure spinning and the graphitic structure after graphitizing. It is
important to note that voids were present in the fiber, which was common during the
pressure spinning process if the fibers were too large in diameter. These voids may be
removed by conducting a vacuum distillation slightly above the spinning temperature of
the pitch.

71
(i) (ii)
Figure 3.8 Green fibers after being pressure spun for a mesophase pitch (i). Graphitized
mesophase fiber with desired graphitic sheets and undesired voids in the fiber (ii).
3.1.3 Melt Pool Spinning
The difficulty of melt spinning was further compounded by the phenomena of
melt pool spinning which was a common occurrence with the extruder and pressure
capsule. A pool was formed on the face of the spinneret from where the nascent fiber was
drawn. With the fibers spinning from a pool it was tremendously difficult to calculate a
draw down ratio (DDR) or accurately control the flow of the pitch. The draw down ratio
is the ratio of the fiber diameter exiting the spinneret to the diameter of the fiber collected
on the spool. Figure 3.9 provides an example of melt pool spinning on the extruder as a
function of time and shows that the pitch wets and pools on the surface of the spinneret
prior to being pulled into a fiber. This isotropic pitch was spun from a 330 µm spinneret
and the melt pool grew to 3.7 mm (Figure 3.9 (E)) before being pulled into a fiber (Figure
3.9 (F)). The viscoelastic behavior of the pitch, surface energy of the spinneret, spinneret
temperature, and pitch flow rate were possible variables that caused the melt pool to
form.

72
Figure 3.9 Melt pool spinning where only the exit of the spinneret is shown at 330 µm
(A), the pitch exits and begins to swell to a pool size of 3.774 mm (E) and decreases to
2.867 mm once pulled into a fiber (F).
3.1.4 Lessons Learned
Melt spinning fiber regardless of the method used was a delicate process that
required significant experience to intuitively know how to change the parameters to
produce quality fiber. While initial conditions were estimated, pitches usually needed
multiple runs with varying parameters to determine the optimal operating parameters. For
isotropic pitches, these operating parameters were generally linear in nature and could
translate from one isotropic to another. However, high-percentage mesophase pitch
generally needed multiple test runs with precise temperature control to generate a small
diameter fiber without voids. Additionally, the properties of the fibers were highly
dependent on the processability of the pitch during spinning. The mechanical properties
were a function of the mesophase percentage, but also a function of voids present in the
fiber and diameter of the fiber. The voids and diameter were highly dependent on the
spinning process (spin temperature, pressure, capillary shape, spinneret diameter, etc.).
The melt spinning process still requires optimization in order to prevent melt pool

73
spinning, accurately predict optimal spinning conditions, and consistently generate a
small diameter fiber without voids.
3.2 Method
For the rGO experiments, because the quantities of pitch produced were generally
tens of grams, the pressure capsule method was used for spinning fibers. The spinning
procedure followed the progression outlined in section 3.1.2 where specific starting
conditions were chosen for the pitches (Table 3.1) and systematically adjusted to the
optimal levels. These samples were chosen because the results suggested 0.01 wt.% rGO
assisted in mesophase development for the petroleum pitch and possibly the coal-tar
pitch. Therefore, to judge the efficacy of using rGO to assist in mesophase development,
the rGO doped pitch was melt spun to determine if adding rGO was a viable method for
the entire fiber production process. For each base pitch, two variations of the pitch were
spun, one baseline 0 wt.% and one containing 0.01 wt.% dispersed rGO, all heat-treated
at 4-hours. The 4-hour treatment time was chosen in order to spin with higher mesophase
percentages. The nitrogen pressure, capsule temperature, and spool RPM were the three
variables adjusted to ensure continuous fiber spinning. The Spin Temp listed was the
starting temperature used for the heat soak of the pitches.
Table 3.1 Initial spinning parameters for experimental pitches. Filter pore size, nitrogen
pressure (P), spinneret diameter (Ø), spinneret temperature (Spin Temp), take-up spool
setting (RPM), and meters per minute (m/min) of fiber collected.
Filter (µm) P (psi) Spinneret Ø (µm) Spin Temp (°C) RPM m/min
20 20 660 225 150 78
After the initial heat soak, the initial settings for each pitch were systematically
adjusted to optimize the spinning process. Once the fiber started to form with the
optimized settings, it was allowed to reach the spool before any external force was
applied. This allowed time to observe the flow of the molten pitch, the vitrification point
of the fiber, and the uniformity of the vitrified fiber. To attach the fiber to the spool,

74
double-sided tape was placed on the spool. Immediately after the fiber was attached, the
motor was started to turn the spool.
The non-heat-treated base pitch samples were not included in the experiments
because of their low softening points. While petroleum and coal-tar base pitches have
spun remarkably well into green fiber in previous experiments, their softening
temperatures of 110 °C and 100 °C respectively, were too low to avoid fusion of fibers
during oxidation.
3.3 Results
While the spinning conditions were similar for all pitches (Table 3.2), the
difficulty of spinning each varied. It is important to note that even with similar
mesophase percentages and the same base material, the size of the mesophase spheres
and polymerization of the isotropic phase could vary between samples and therefore
affect the spinnability of the pitch. An additional factor, melt pool spinning, mentioned in
section 3.1.3 affected all spin runs leading to variation in the flow path of the molten
pitch and vitrification point of the fibers. As mentioned, melt pool spinning was when the
pitch wetted the surface of the spinneret upon exiting the capillary. This surface wetting
could be caused by the high surface energy of the spinneret used (steel) and the flow rate
of the pitch (function of temperature and pressure) and was a laborious problem to solve.
When wetting occurred, it was extremely difficult to determine the draw down ratio
(DDR) of the fibers as well as the flow characteristics of the pitch. Certain steps may be
taken to overcome melt pool spinning including a silicon spinneret spray and adjusting
starting temperature and pressure. Each step was attempted to resolve melt pool spinning
but it still occurred during all spin runs. Generally, once wetting began during a spin run,
it was not possible to stop without restarting the spin run with a clean spinneret surface.
All pitch samples showed a tendency to wet during spin runs and therefore all fiber
samples were collected under melt pool spinning conditions. Additionally, voids were
present in all fibers but were more prominent in the coal-tar samples, possibly due to
more volatiles evolving in the fibers that condensed in the pitch during heat treatment.

75
Table 3.2 Optimization of spinning conditions for each heat-treated pitch; petroleum
(Pet.) and coal-tar (Coal) with listed mesophase percentage (M), softening temperature
(Tsp), controlled spin temperature (Spin T), monitored pitch temperature (Pitch T),
nitrogen pressure (P), and spool take-up speed (RPM)
Sample rGO % M % Tsp (°C) Spin T (°C) Pitch T (°C) P (psi) RPM
Pet. 0 45 205 270 280 40 284
Pet. 0.01 54 248 275 288 40 300
Coal 0 29 220 280 303 60 224
Coal 0.01 29 215 275 287 40 178
Figure 3.10 shows a typical band of green fiber as taken up by the rotating spool.
This green fiber was exceptionally fragile and required oxidation before it could be more
readily handled. The fiber was attached to the spool by using double-sided tape near the
edge of the spool and single filaments may be seen in the image. After multiple
revolutions of the spool, the fibers formed a “band” of fibers as shown. In this case,
unwinding of the filament was nearly impossible. Linear traversers may be used to extend
the collection of fibers to the ends of the spool in a helical pattern, which is more
amenable to unwinding. However, for these small research samples, no traversing of the
spool was required since the fibers were cut from the spool and placed in ceramic boats
for oxidation.

76
Figure 3.10 Green fiber melt spun pitch sample. The collection of fiber forms a band
around the spool. Individual filaments are highlights in the callout image.
3.4 Conclusion
The initial spin conditions (pressure, temperature, spool RPM) chosen for the
pitches were adjusted to optimize the single filament fiber production for each sample.
With these optimized conditions, green fiber was collected from each sample. The most
robust pitches during the pressure spinning tests were the petroleum pitch with 0.01 wt.%
rGO and coal-tar pitch with 0 wt.% rGO. Melt pool spinning conditions made it difficult
to predict the DDR and affected the further optimization of the melt spinning process.
Therefore, because of melt pool spinning conditions, no precise conclusions can be made
about the effect of rGO on fiber production other than fibers were able to be produced
from the pitches that contained rGO. The green fibers of the selected pitches were
successfully spun, although their quality appeared to be less conclusively related to the
rGO content and more determined by spinning conditions.

77
Chapter 4. THERMAL CONVERSION AND CARBON FIBER PROPERTIES
4.1 Introduction
After green fiber is melt spun from a pitch source, it must be thermally treated to
convert it to a carbon fiber. Green fiber is only vitrified pitch molecules, largely
polyaromatic hydrocarbons, assembled in a fiber form. These hydrocarbons must be
thermally converted to a fully carbon, graphitic state. The processes to do so begins with
oxidative stabilization, where oxygen is introduced to the green fibers by an addition
reaction where the oxygen diffuses through the fibers and reacts to crosslink the
polyaromatic hydrocarbons. The softening temperature of the fibers increases at a faster
rate than the oxidation heating rate which dramatically increases the softening
temperature such that the filaments were infusible upon further heating and
carbonization. Carbonization occurs in an inert atmosphere where most of the non-carbon
atoms of the stabilized fiber were driven off as volatiles. Lastly, and particularly for
mesophase derived fiber, the fibers are treated to graphitization temperatures (nominally
greater than 2000 °C). The thermal energy allows for atomic rearrangement of the
constituent carbon atoms into a well-defined graphite crystal, oriented with the basal
planes (graphene planes) parallel to the fiber axis. After graphitization, the fibers are
nearly a complete carbon structure with over 99 wt.% carbon content.
Through the described thermal conversion and subsequent tensile testing of the
fibers, the goal was to determine if rGO, dispersed in the parent pitch to generate more
mesophase and then spun into green fiber, affected the carbon fiber morphology,
mechanical properties or the overall mass conversion to carbon fiber relative to the green
fiber (or carbon yield). Characterization of the graphitized fibers was completed through
scanning electron microscope (SEM) imaging to peer into the fiber morphology, and
tensile testing to probe their mechanical properties.
Tensile testing entailed careful mounting of individual filaments into a
FAVIMAT+ tensile testing machine where a stress-strain test was conducted. The tension
in the filament was recorded as a function of applied strain. At small elastic strains, the
apparent modulus defined the slope of the stress-strain curve. All fibers were quite
linearly elastic to failure. The tensile strength was recorded as the highest stress on the

78
curve. Each sample had fibers tested at four-gauge lengths (20 mm, 30 mm, 40 mm, and
50 mm) to determine the average break tenacity and initial modulus. The multiple gauge
lengths were used to calculate a system compliance, which accounts for the error
introduced by the FAVIMAT+ due to the spring constant of the instrument clamp and the
load cell being of similar magnitude of the high modulus (more resistant to strain) pitch
carbon fibers. However, because the compliance requires an accurate cross-sectional area
of the carbon fibers which was generally non-uniform for the experimental samples,
accuracy of compliance calculations and therefore the accuracy of the break strength
(MPa) and Young’s modulus (GPa) could not be determined with reasonable accuracy.
For these reasons, the compliance results are only included in Appendix A as a reference
and the tensile testing results are reported in textile units which is discussed in section
4.2.3.
4.2 Mechanical Properties
4.2.1 Thermal Conversion
After the green fibers had been collected on the spool, the fibers were cut from the
cardboard spool in a single location and released as a length or bundle of collimated fiber.
The bundle was laid straight, with no tension, in a ceramic boat for oxidation. Mass and
length of the fibers were measured before and after oxidation. Oxidation took place in a
Herathem™ General Protocol Convection oven for up to 24 hours, reaching temperatures
up to 350 °C. The fibers were allowed to air cool and visually inspected for fusion and no
oxidized fiber sample appeared to be fused. Once the change in mass and length of the
fibers were noted, the fibers were placed in a graphite crucible in a Thermal
Technology™ (1000-3060-FP20) graphitization furnace where they underwent
carbonization and graphitization within the same run. The temperature was ramped to
800-1000 °C for carbonization with a dwell for many minutes. Then the temperature was
quickly ramped to a graphitization temperature over 2000 °C with a dwell for many
minutes. The changes in mass and length of the fibers were noted after graphitization and
are shown in Table 4.1.

79
Table 4.1 Change in lengths and masses for the petroleum (P) and coal-tar (C) pitches
with 0 wt% and 0.01 wt % rGO. Initial green fiber carbon yield (CY) after
graphitization.
Sample ∆Mass (%) ∆Length (%) CY (%)
P - 0 wt% -26% -7% 74%
P - 0.01 wt% -28% -7% 72%
C - 0 wt% -19% -7% 81%
C - 0.01wt% -18% -7% 82%
After graphitization, the petroleum pitches had more mass loss than the coal-tar
pitch samples, most likely due to the petroleum pitch initially having more aliphatic
structures. Concerning the thermal conversion process and the final carbon yield, rGO did
not appear to affect the processability of the fibers towards graphitization (other than
mesophase nucleation), most likely because it was inert to the thermal conversion
process. Additionally, the higher carbon yields of the coal-tar pitch fibers could be
attributed to the initial C/H ratio of the coal-tar base pitch being higher than the
petroleum base pitch (Table 1.1). Overall, the carbon yield (CY) of the petroleum and
coal-tar samples were similar to the CY common among pitch-based fibers[8].
4.2.2 Microscopy
After graphitization, the fibers were Au sputter coated and imaged using a Hitachi
S4800 field-emission SEM. The fiber fracture surfaces were imaged for the presence of
internal voids. The fiber surfaces were also imaged to investigate roughness and
diameter uniformity. Voids in the fiber can drastically reduce the tensile strength of the
fiber and in addition to reducing the filament cross sectional area (relative to a nominal
diameter-defined area), voids function as stress risers. Moreover, the fiber modulus,
which also depends on the actual cross-sectional area of the fiber, can be measured to be
lower than expected with the presence of large internal voids. Variations in diameters and
the presence of voids were from of the spinning process. This variation could be due to
fluctuations in temperature near the exit of the spinneret or caused by the pitch evolving a
small amount of volatile gas, at spinning temperature, when the pitch quickly goes from
high pressure to low pressure upon exit of the spinneret.

80
Since diameters were primarily dependent on consistent and stable spinning
conditions, the pitch with the most stable spinning generally had the smallest fiber
diameter. All fiber samples collected had voids present and variations in diameter. Figure
4.1 shows images of all the graphitized fibers starting with petroleum 0 wt.% (i) (45%
mesophase), petroleum 0.01 wt.% (ii) (54% mesophase), coal-tar 0 wt% (iii) (29%
mesophase), and coal-tar 0.01 wt% (iv) (29% mesophase).
(i)
(ii)

81
(iii)
(iv)
Figure 4.1 SEM images of melt-spun graphitized (i) petroleum pitch 0 wt.% rGO (ii)
petroleum pitch 0.01 wt.% rGO (iii) coal-tar pitch 0 wt.% rGO (iv) coal-tar pitch 0.01
wt.% rGO.
The petroleum pitch fibers had the smallest and most uniform diameter (i-ii) as
measured by the SEM (Table 4.2). The smoothness of the petroleum pitch fibers may be
due to the aliphatic areas of the pitch allowing the mesophase to flow more easily in a
molten state or less volatiles present in the petroleum pitch. Thus, the petroleum pitch
would experience less tensile stress at the vitrification point and a higher faster take-up
RPM could be used. This may be the case since the petroleum pitches were collected
from 284-300 RPM and the coal-tar pitches were collected from 178-224 RPM. Again,

82
these take-up speeds were optimized for each pitch and represent the maximum allowable
value where fiber collection was still possible.
Average diameters measured using SEM are listed in Table 4.1 with the
petroleum fibers with 0.01 wt% rGO showing the smallest diameter, which generally
correlates to the best spinnability. Therefore, it may be the case that since higher RPMs
can be used with the petroleum fibers, smaller diameters were formed, and with smaller
diameters there was less of a chance for voids to form.
Table 4.2 Diameter (Ø) of the four graphitized fibers samples as measured by SEM.
Petroleum (P) and coal-tar (C) pitch.
Sample Average Ø (µm) Std Dev. N
P - 0 wt% 23.50 5.30 15
P - 0.01 wt% 15.90 1.80 15
C - 0 wt% 33.10 10.50 15
C - 0.01wt% 33.00 11.90 15
For fibers spun from the neat coal tar derived pitch, there were more significant
variations in fiber diameter possibly due to insolubles and non-uniform shrinkage in the
axial or transverse direction during thermal conversion where varying diameters would
cause different rates of reaction. The different rates of reaction during thermal conversion
can lead to “crimped” fibers (Figure 4.2). The nodules (insolubles) primarily present in
the coal-tar pitch fibers (iii-iv) can also cause variations in the diameters of the fibers as
seen in Figure 4.1 (iii). The coal-tar pitch fibers with 0.01 wt% rGO were the only fibers
with potentially some graphitic texture visible, shown in Figure 4.1 (iv).
Figure 4.2 Example of a fiber that had non-uniform shrinkage during thermal conversion.
Here the fiber was approximately 120 mm in length and approximately 30 µm in
diameter.

83
4.2.3 Tensile Testing
The single filament tensile testing was completed using a Textechno FAVIMAT+
with (AI)ROBOT2 equipped with auto feed. This robotic system uses a sample storage
case consisting of magazines capable of loading 25 fibers each and uses a robotic arm
with a transfer clamp to move one fiber at a time to the testing clamp. When using the
auto feed to grab the fibers, due to the brittle nature of graphitic pitch fibers, the robotic
arm mechanical clamp of the auto feed would often break the pitch fibers. Therefore, all
fibers were manually loaded. To load the fiber, the testing clamps were set to the proper
gauge length and the fiber was manually mounted with rubber tipped tweezers and the
clamps were manually closed. Each fiber sample was tested with ten fibers at four-gauge
lengths (𝐿) (N = 40), 20, 30, 40, and 50 mm. After the fiber was properly pretensioned,
the FAVIMAT+ measured the linear density of the fiber and calculated the diameter (𝐷)
of the fiber, with the assumption the fiber was circular and solid. The FAVIMAT+ uses
ASTM D1577, Standard Test Methods for Linear Density of Textile Fibers, with the
vibration method to determine the fiber’s linear density (𝜇) by using the pretension (𝑇),
gauge length (𝐿), and resonant frequency (𝑓𝑛) to calculate the linear density (𝜇) (equation
4.1). With a user inputted volumetric density (𝜌) the diameter can be calculated (equation
4.2).
𝐿𝑖𝑛𝑒𝑎𝑟 𝐷𝑒𝑛𝑠𝑖𝑡𝑦 (𝜇) =
𝑇
4 ∙ 𝑓𝑛2 ∙ 𝐿2
[4.1]
𝐷𝑖𝑎𝑚𝑒𝑡𝑒𝑟 (𝐷) = √µ
𝜌∙
4
𝜋
[4.2]
An in-line load cell (210 cN max) measured the axial tension in the fibers until
breakage with a cross head speed of 1 mm/min and a pretension of 1.0 cN/tex. Since the
non-circular shape of the fibers caused discrepancies in the diameter measurements as

84
compared to the SEM diameter measurements, linear density was used for mechanical
property analysis. The units of force per linear density (cN/dtex, or grams-force/deci-tex)
stem from the textile industry and are used in place of force per cross sectional area.
Where “dtex” is an abbreviation for deci-tex, which is a unit of measurement equal to one
gram of mass per 10-km of length. In fact, the linear density unit of measurement is
largely a proxy for cross sectional area and is rooted in the difficulty of measuring the
cross-sectional area of irregularly shaped textile filaments (e.g. sheep wool fiber).
Therefore, the textile analog of strength is called tenacity, in units of force at break per
linear density. With these textile units the stress-strain curve was produced and plotted by
the FAVIMAT+ along with the force per linear density measurements. The break stress
and modulus values were calculated and reported by the instrument testing parameters
and can be found in Appendix A[40], [41].
4.3 Results
The results of the single filament tensile testing on experimentally produced
mesophase pitch carbon fibers are shown in Table 4.3. Results are reported in textile units
of break tenacity (cN/dtex) and modulus (cN/dtex) which helps account for the presence
of voids by normalizing to linear density (dtex) and using the break force (cN). Four fiber
samples were not included for the coal-tar pitch 0.01 wt.% sample because the results
indicated multiple fibers may have been mounted for one test, leading to tremendously
high values.
Table 4.3 Break Tenacity (T)(cN/dtex) and Initial Modulus (E)(cN/dtex), and Coefficient
of Variance (COV) of the graphitized pitch fibers. Shown are petroleum (P) and coal-tar
(C) with 0 wt.% and 0.01 wt.% rGO.
Sample T COV E COV N
P - 0 wt.% 2 73% 199 68% 40
P - 0.01 wt.% 13 51% 215 18% 40
C - 0 wt.% 2 61% 276 50% 40
C - 0.01 wt.% 4 70% 331 67% 36

85
Although diameter was not accounted for with textile units, as mentioned in Chapter 3,
the smaller diameter can be indicative of a sample that spun better and therefore has less
voids. Analysis of the mechanical property results of the fibers in textile units of cN/dtex
shows the smallest, most uniform, diameter fiber sample had the highest Break Tenacity
(T), which was the petroleum with 0.01 wt.% rGO (Figure 4.3). Voids are a gross defect
in the fiber and will cause the force at breakage to be much lower than a comparable fiber
with less voids. The other three samples have no difference in the Break Tenacity and
significantly large coefficient of variances (COV). In addition to voids, the large
variances could be explained by the occasional crimp in the fibers tested. This crimp
could cause the fiber to not be completely pre-tensioned and therefore cause an error in
the natural frequency calculation of the fiber where the length (L) was slightly longer
than the FAVIMAT+ was measuring (equation 4.1).
Additionally, because of the varied spinning conditions, it was difficult to draw any
conclusions of the influence rGO had on the mechanical properties of the fibers. While
both 0.01 wt.% rGO pitch samples had slightly better tenacity and modulus than the
comparative 0 wt.% sample (Figure 4.3, 4.4), with the current information and analysis,
no definite conclusions can be made to the influence of rGO on mechanical properties.
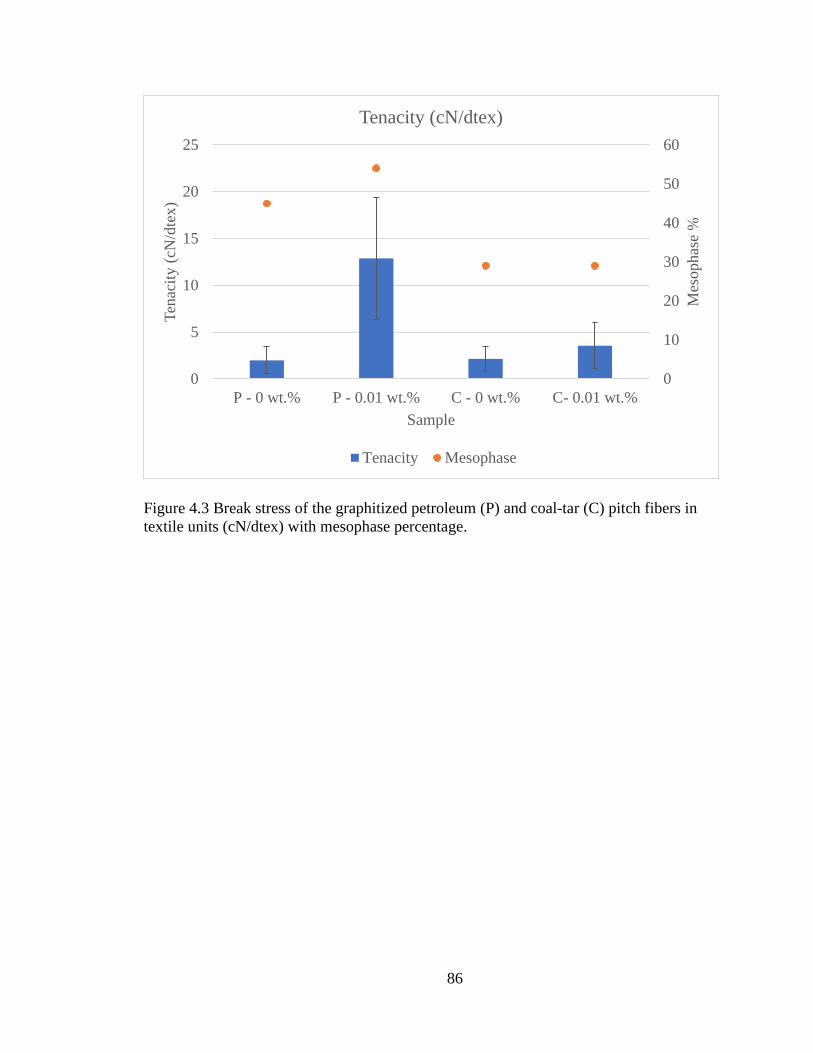
86
Figure 4.3 Break stress of the graphitized petroleum (P) and coal-tar (C) pitch fibers in
textile units (cN/dtex) with mesophase percentage.
0
10
20
30
40
50
60
0
5
10
15
20
25
P - 0 wt.% P - 0.01 wt.% C - 0 wt.% C- 0.01 wt.%
Mes
ophas
e %
Ten
acit
y (
cN/d
tex
)
Sample
Tenacity (cN/dtex)
Tenacity Mesophase

87
Figure 4.4 Modulus of the graphitized petroleum (P) and coal-tar (C) pitch fibers in
textile units (cN/dtex) with mesophase percentage.
4.4 Conclusion
SEM imaging and single filament tensile testing were used to determine if there
were any effects from the dispersed rGO in the parent mesophase pitch on the structure
and mechanical properties of the resultant graphitic fibers. Graphitic texture
representative of high mesophase content was only observed slightly in the coal-tar 0.01
wt.% sample (Figure 4.1 (iv)) but was not prevalent throughout the sample as determined
by SEM imaging. Additionally, the coal-tar samples appeared to have a higher degree of
voids than the petroleum samples, which were influenced by the volatiles present in the
coal-tar samples and thus reflected with difficulty spinning. This led to the diameters
measured by the SEM showing the petroleum samples had smaller diameters and less
variance of diameters.
While it was found that the 0.01 wt.% rGO samples had slightly better mechanical
properties than the 0 wt.% samples, the variances were large enough to prevent a
0
10
20
30
40
50
60
0
100
200
300
400
500
600
P - 0 wt.% P - 0.01 wt.% C - 0 wt.% C- 0.01 wt.%
Mes
ophas
e %
Modulu
s (c
N/d
tex
)
Sample
Modulus (cN/dtex)
Modulus Mesophase

88
definitive conclusion that the improvement was due to the rGO. Overall, fibers generated
from all pitch samples showed similar mechanical properties except for the relatively
high Break Tenacity of the petroleum 0.01 wt.% sample. For all samples, the influence of
the melt spinning process appears to dominate the fiber structure as determined by SEM
and subsequently the tensile testing results. Regardless of the pitch used or rGO
concentrations, the properties and structure of the fiber were set by the spinning process.
Therefore, it was difficult to conclude the influence, if any, rGO had on the mechanical
properties of petroleum or coal-tar pitch carbon fibers considered for these experiments.

89
Chapter 5. CONCLUSION
The specific questions addressed in this thesis were; determining if rGO
influences the growth of mesophase in an isotropic petroleum and coal-tar pitch and if the
addition of rGO influences the processability of the created mesophase pitch into carbon
fibers (melt spinning, thermal conversion). The central findings and conclusions of this
work are reviewed in the following.
Using low QI isotropic petroleum and isotropic coal-tar pitch from UKY CAER,
rGO was dispersed into a pitch-THF mixture using sonication and systematically heat
treated to promote the growth of mesophase. For the petroleum and coal-tar pitches two
concentrations of rGO were tested, 0.01 wt.% and 0.10 wt.%, with respect to the base
isotropic pitch. The length of heat treatments varied from 0.5-hours to 4-hours using a
mantle temperature of 425 °C which led to an average pitch temperature of
approximately 370 °C. Nitrogen sparging was used to create an inert atmosphere and
generate shear in the molten pitch. The quantification of mesophase was conducted by
using polarized light microscopy to determine an estimated volumetric mesophase
percentage for each sample. Additionally, softening temperature and quinoline insolubles
were measured and correlated to spinnability for each sample.
For the petroleum pitch, it was found that the 0.10 wt.% rGO sample did not assist
in the growth of mesophase at any treatment time. However, the 0.01 wt.% rGO results
suggested the rGO assisted in the accelerated growth of mesophase, particularly for 0.5-
2-hours of heat treatment. This accelerated growth of the 0.01 wt.% sample led to an
average increase of mesophase to 3.9% (0.5-hours), 38% (1-hour), and 45% (2-hours
compared to the 0 wt.% sample of 0.9% (0.5-hours), 16% (1-hour), and 24% (2-hours)
respectively. However, after 2-hours, the rate of mesophase growth for the 0.01 wt% rGO
sample slows significantly and at 4-hours of treatment time the average mesophase
percentage of all samples nearly converge to 68% (0 wt.%), 70% (0.01 wt.%), and 64%
(0.10 wt.%).
For the coal-tar pitch, the results showed a slight correlation to the rGO assisting
mesophase growth in the first 2-hours of treatment time for the 0.01 wt.% sample.

90
However, the error for the coal-tar samples makes it difficult to say definitively whether
the rGO was beneficial as with the petroleum pitch.
The petroleum and coal-tar samples all had a dramatic increase in softening
temperature after the first 0.5-hours of heat treatment from approximately 100 °C to over
200 °C. This increase in softening temperature suggests the aggressive removal of lighter
weight species present in both pitches. The softening temperature continued to increase
but at a slower rate to a softening temperature > 260 °C for all samples treated for 4-
hours. Additionally, the QIs appeared to correlate with the increase in mesophase
percentage where more mesophase generally meant more QIs.
For melt spinning the pitch into green fibers four samples were tested. All
samples were heat treated for four hours, petroleum 0 wt.% and 0.01 wt.% and coal-tar 0
wt.% and 0.01 wt.%. Each sample was successfully melt spun into green fiber and then
stabilized, carbonized, and graphitized where carbon yields ranged from 72-82 wt.%
(with respect to the initial green fiber mass). The graphitized fibers were imaged by SEM
and variations in diameter and internal void occurrence were observed for each sample.
All samples had varying degrees of voids, but both petroleum samples had the most
uniform diameters. Graphitic texture was observed only for a few fibers with the coal-tar
0.01 wt.% rGO sample. The mechanical properties of the graphitized fibers were
quantified by break tenacity (cN/dtex) and initial modulus (cN/dtex) which are units that
stem from the textile industry where linear density is used in place of cross-sectional
area. This proved useful for all pitch fiber samples tested because of the variation in
diameters and voids present in the graphitized fibers.
Mechanical properties of the graphitized fibers were determined using single
filament tensile testing to determine the effect of rGO on mechanical properties. The
results showed that the 0.01 wt.% rGO sample of both base pitches had slightly better
initial modulus than the 0 wt.% samples. For the petroleum 0.01 wt.% rGO sample, the
break tenacity was significantly higher than the 0 wt.% rGO sample. However, due to the
melt spinning process, it was difficult to determine the effects of rGO on mechanical
properties because of the voids present in the fibers. Therefore, further research would be
needed to determine if the variations were due to the rGO or melt spinning process.

91
5.1 Future Work
The fibers generated for this thesis appeared to be primarily influenced by the
melt spinning process and therefore made it difficult to ascertain the influence, if any,
rGO had on graphitic fiber production. Future work should focus on investigating
additional rGO loadings and the precise control of the pitch heat treatment temperatures,
as well as optimizing the melt spinning process. This optimization could include more
precise temperature control, vacuum distillation to remove volatiles from pitch prior to
spinning, and a heated air quench for higher spinning temperatures. While the results
suggested a benefit to using rGO as a nucleation site for the growth of mesophase in an
isotropic pitch, further studies would be needed to understand the mesophase nucleation
with higher, precise temperatures. Increasing the heat treatment temperature of the pitch
to above 370 °C could potentially allow for quicker mesophase nucleation and
subsequent growth than shown here. Additionally, varying weight percentages of rGO
between 0.01 wt.% and 0.10 wt.% of isotropic pitch could be studied to determine if there
was a more efficient weight percentage to be used as a nucleation site.

92
APPENDIX
System Compliance
The calculated modulus of the fibers needs to be adjusted due to the spring
constant of the tensile testing machine being of the same magnitude of the fibers. Due to
the stiff nature of carbonized fibers, the system introduces an error into the calculated
modulus values. To correct for this error, a corrected compliance (𝐶) is calculated using
an average indicated compliance (𝐶𝑎) and an extrapolated y-intercept system compliance
(𝐶𝑆) from the plot of 𝐶𝑎 against each gauge length. Using the diameters calculated
through frequency resonance measurements, the corrected modulus (𝐸𝑐) can be
calculated.
𝐶 = 𝐶𝑎 − 𝐶𝑠 [A.1]
𝐶𝑎 =
𝑙0
𝐸𝑎 ∙ 𝐴
[A.2]
𝐸𝑐 =
𝑙0
𝐶 ∙ 𝐴
[A.3]
𝐶 = Corrected Compliance
𝐶𝑎= Indicated Compliance
𝐶𝑆 = System Compliance
𝑙0 = Gauge length
𝐴 = Cross-sectional area of fiber
𝐸𝑎 = Average modulus
𝐸𝑐 = Corrected modulus

93
Weibull Analysis
The spinning and thermal conversion processes of carbon fibers causes defects to
form in the fibers. These defects greatly affect the mechanical properties and can lead to
large variations when calculating break stress. A Weibull modulus is used to help
quantify the variation in calculated break stress, where a higher Weibull modulus
indicated less variation in the data.
Sample Weibull Modulus
Pet. 2.02
Pet. 2.03
Coal 1.74
Coal 1.45
Figure 5.1 Distribution of the tensile stress against probability of failure using a Weibull
analysis of graphitic fibers

94
REFERENCES
[1] Toray, “Toray Composite Materials America, Inc.” [Online]. Available:
https://www.toraycma.com/page.php?id=661. [Accessed: 01-Oct-2018].
[2] Mitsubishi, “Pitch Fiber - Mitsubishi Chemical Carbon Fiber Composites.”
[Online]. Available: http://mccfc.com/pitch-fiber/. [Accessed: 01-Oct-2018].
[3] T. Matsumoto, “Mesophase pitch and its carbon fibers,” Pure Appl. Chem., vol.
57, no. 11, pp. 1553–1562, 1985.
[4] D. D. Edie and M. G. Dunham, “Melt spinning pitch-based carbon fibers,” Carbon
N. Y., 1989.
[5] A. Singh Gill, D. Visotsky, L. Mears, and J. D. Summers, “Cost Estimation Model
for Polyacrylonitrile-Based Carbon Fiber Manufacturing Process,” J. Manuf. Sci.
Eng., vol. 139, no. 4, p. 041011, 2016.
[6] S. Ohtani, “Japan Patent,” S41-15728, 1966.
[7] S. Ohtani, K. Watanabe, and T. Araki, “Japan Patent,” S49-8634, 1974.
[8] J. The Society of Fiber Science and Technology, High-Performance and Specialty
Fibers. Springer, Tokyo, 2016.
[9] K. Azami, S. Yamamoto, T. Yokono, and Y. Sanada, “In-situ monitoring for
mesophase formation processes of various pitches by means of high-temperature
13C-NMR,” Carbon N. Y., vol. 29, no. 7, pp. 943–947, 1991.
[10] J. Madias and M. De Cordova, “Foundry Coke Without Coal More Than Half-
century of Production in Argentina,” pp. 144–154.
[11] R. J. Andrews, T. Rantell, D. Jacques, J. C. Hower, J. Steven Gardner, and M.
Amick, “Mild coal extraction for the production of anode coke from Blue Gem
coal,” Fuel, vol. 89, no. 9, pp. 2640–2647, Sep. 2010.
[12] J. D. Brooks and G. H. Taylor, “The formation of graphitizing carbons from the
95
liquid phase,” Carbon N. Y., vol. 3, no. 2, pp. 185–193, Oct. 1965.
[13] T. Maeda, S. Ming Zeng, K. Tokumitsu, J. mondori, and I. Mochida, “Preparation
of isotropic pitch precursors for general purpose carbon fibers (GPCF) by air
blowing-I. Preparation of spinnable isotropic pitch precursor from coal tar by air
blowing,” Carbon N. Y., 1993.
[14] R. H. Hurt and Z. Chen, “Liquid Crystals and Carbon Materials,” Phys. Today,
vol. 53, no. 3, pp. 39–44, Mar. 2000.
[15] I. Mochida, Y. Korai, C.-H. H. Ku, F. Watanabe, and Y. Sakai, “Chemistry of
synthesis, structure, preparation and application of aromatic-derived mesophase
pitch,” Carbon N. Y., vol. 38, no. 2, pp. 305–328, Jan. 2000.
[16] I. Mochida, S.-H. Yoon, and Y. Korai, “Mesoscopic Structure and Properties of
Liquid Crystalline Mesophase Pitch and Its Transformation into Carbon Fiber,”
Chem. Rec., vol. 2, no. 2, pp. 81–101, Mar. 2002.
[17] I. Mochida, Y. Korai, C. H. Ku, F. Watanabe, and Y. Sakai, “Chemistry of
synthesis, structure, preparation and application of aromatic-derived mesophase
pitch,” Carbon N. Y., vol. 38, no. 2, pp. 305–328, 2000.
[18] I. Mochida, Y. Korai, C. H. Ku, F. Watanabe, and Y. Sakai, “Chemistry of
synthesis, structure, preparation and application of aromatic-derived mesophase
pitch,” Carbon N. Y., vol. 38, no. 2, pp. 305–328, 2000.
[19] Diefendorf et al., “Forming Optically Anisotropic Pitches,” 4208267, 1980.
[20] L. S. Strehlow, R.A.; Singer, “High-temperature centrifugation - application to
mesophase pitch,” 1970.
[21] A. D. Cato and D. D. Edie, “Flow behavior of mesophase pitch,” Carbon N. Y.,
vol. 41, pp. 1411–1417, 2003.
[22] E. M. Dianov and D. S. Starodubov, “The viscoelastic behavior of pitches,”
Library (Lond)., vol. 2777, no. May 2010, pp. 60–70.
[23] K. Lafdi, S. Bonnamy, and A. Oberlin, “Mechanism of anisotropy occurence in a

96
pitch precursor of carbon fibers: Part I- pitches a and b,” Carbon N. Y., vol. 29, no.
7, pp. 857–864, 1991.
[24] O. Fleurot and D. D. Edie, “Steady and transient rheological behavior of
mesophase pitches,” J. Rheol. (N. Y. N. Y)., vol. 42, no. 49, 1998.
[25] A. D. Cato, D. D. Edie, and G. M. Harrison, “Steady state and transient rheological
behavior of mesophase pitch, Part I: Experiment,” J. Rheol. (N. Y. N. Y)., vol. 49,
no. 101, 2005.
[26] D. Grecov and A. D. Rey, “Steady state and transient rheological behavior of
mesophase pitch, Part II: Theory,” J. Rheol. J. Rheol., vol. 49, no. 85, 2005.
[27] P. Morgan, Cabron Fiber and Their Composites, 1st ed. Boca Raton, FL: CRC
Press, 205AD.
[28] D. D. Edie and M. G. G. Dunham, “Melt spinning pitch-based carbon fibers,”
Carbon N. Y., vol. 27, no. 5, pp. 647–655, Jan. 1989.
[29] J. J. McHugh and D. D. Edie, “The orientation of mesophase pitch during fully
developed channel flow,” Carbon N. Y., vol. 34, no. 11, pp. 1315–1322, 1996.
[30] D. D. Edie, N. K. Fox, B. C. Barnett, and C. C. Fain, “Melt-spun non-circular
carbon fibers,” Carbon Vol, vol. 24, no. 4, pp. 477–482, Jan. 1986.
[31] I. Mochida, S.-H. Yoon, N. Takano, F. Fortin, Y. Korai, and K. Yokogawa,
“Microstructure of mesophase pitch-based carbon fiber and its control,” Carbon N.
Y., vol. 34, no. 8, pp. 941–956, Jan. 1996.
[32] Y. Kofui et al., “Preparation of carbon fiber from isotropic pitch containing
mesophase spheres,” Carbon N. Y., vol. 35, no. 12, pp. 1733–1737, 1997.
[33] Y. Zhu, S. Murali, M. D. Stoller, A. Velamakanni, R. D. Piner, and R. S. Ruoff,
“Microwave assisted exfoliation and reduction of graphite oxide for
ultracapacitors,” Carbon N. Y., vol. 48, no. 7, pp. 2118–2122, 2010.
[34] S. Pei and H.-M. Cheng, “The reduction of graphene oxide,” Carbon N. Y., vol. 50,
no. 9, pp. 3210–3228, Aug. 2012.

97
[35] R. Menndez et al., “On the chemical composition of thermally treated coal-tar
pitches,” Energy and Fuels, vol. 15, no. 1, pp. 214–223, 2001.
[36] R. A. Greinke and L. S. Singer, “Constitution of coexisting phases in mesophase
pitch during heat treatment: Mechanism of mesophase formation,” Carbon N. Y.,
vol. 26, no. 5, pp. 665–670, Jan. 1988.
[37] A. Mianowski, S. Blazewicz, and Z. Robak, “Analysis of the carbonization and
formation of coal tar pitch mesophase under dynamic conditions,” Carbon N. Y.,
2003.
[38] F. R. Vieira, C. H. M. de Castro Dutra, and L. D. de Castro, “Determining the
anisotropic content in a petroleum pitch – Comparison of centrifugation and
optical microscopy techniques,” Fuel, vol. 90, no. 2, pp. 908–911, Feb. 2011.
[39] O. Fleurot, D. D. Edie, and J. J. Mchugh, “Elastic behavior of mesophase pitch,” in
The American Carbon Society 22nd Biennial Conference, 1995, pp. 268–269.
[40] “ASTM Standard 3822-07,” 2007.
[41] “ASTM Standard 3379.” .

98
VITA
Name:
Aaron Michael Owen
Place of Birth:
Henderson, KY, USA
Education:
University of Kentucky
Bachelor of Science in Mechanical Engineering May 2017
Positions Held:
Undergraduate Research Assistant
Center for Applied Energy Research, University of Kentucky
January 2015 – May 2017
Graduate Research Assistant
Center for Applied Energy Research, University of Kentucky
May 2017 – July 2018
Conferences and Presentations:
Owen, A.M., M.C. Weisenberger, D.L. Eaton, and R.J. Andrews. 2018. "Assisted
Development of Mesophase in Pitch with the Use of Dispersed Graphene."
Carbon 2018. Madrid, Spain.