Omitted Variable Bias Methods of Economic Investigation Lecture 7 1.
8/6/2019 (ASSIGNMENT)+Economic Variable
http://slidepdf.com/reader/full/assignmenteconomic-variable 1/23
1
Impact of Economic Variables onImpact of Economic Variables on
Stock PricesStock Prices
A Research Paper by
Prof. Rana Abdul Qudous
Fariha Shoukat Malik
Prof. Dr. M. Iqbal Saif
8/6/2019 (ASSIGNMENT)+Economic Variable
http://slidepdf.com/reader/full/assignmenteconomic-variable 2/23
2
Abstract
The objective of this paper is to analyze the relationship
between stock prices and certain relevant macroeconomic
variables. These variables include money supply, exports,
foreign exchange rate, industrial production and interest
rate. The study covers a period of 10 Years from January 1,
2000 to December 31, 2009. The results indicate that all
macroeconomic variables
««««««««««««««««««««««««««««««««««««««««««««««««««
«««««««««««««««««««««««««
«««««««««««««««««««««««««
«««..

8/6/2019 (ASSIGNMENT)+Economic Variable
http://slidepdf.com/reader/full/assignmenteconomic-variable 3/23
3
Stock market is an enigma for many people who think that
it has something to do with riches only whereas may
believes it is a heaven for gamblers and is not related to
common man in any sense.
Stock market is a place where we can buy or sell shares and
securities. Stock market can be easily understood by
dividing it into primary and secondary markets. Primary
market is where companies and government issue share
and securities to the public to finance their operations. This
way savings of the people are channelized to productive
ventures.
8/6/2019 (ASSIGNMENT)+Economic Variable
http://slidepdf.com/reader/full/assignmenteconomic-variable 4/23
4
Secondary markets provide the investors an opportunity to selltheir shares and securities to other investors. These trades are
facilitated by the brokers who charge a commission for the order
executed by them on behalf of their clients. Stock exchanges like
Karachi Stock Exchange and Lahore Stock Exchange are
secondary markets.
Pakistan has three stock exchanges. Karachi Stock Exchange,
Lahore Stock Exchange and Islamabad Stock Exchange. Karachi
Stock Exchange(KSE) is the oldest stock exchange of the country.
It was incorporated on March, 1949. It started with 5 companieswith a paid up capital of Rs. 37 Million(.44 Million USD) and now
the market capitalization is equal to 26.48 Billion US Dollar with
651 companies listed on the Exchange

8/6/2019 (ASSIGNMENT)+Economic Variable
http://slidepdf.com/reader/full/assignmenteconomic-variable 5/23
5
It has four indices ie. KSE 100 index, KSE 30, KMI 30 andKSE All Shares Index. KSE 100 Index is most represented
index of the Pakistani stock market. The KSE-100 Index was
introduced in November, 1991 and was recomposed in
November 1994. This index showed a return of 40.19% for
the year 2007.

8/6/2019 (ASSIGNMENT)+Economic Variable
http://slidepdf.com/reader/full/assignmenteconomic-variable 6/23
6
Purpose of the Study
The focus of this study is to analyze the relationship between
stock prices and certain relevant macroeconomic variables
and whether these variables can be used to predict stock
pries in Pakistan?. These variables include money supply,
export, foreign exchange rate and interest. The stock prices
are represented by KSE-100 index.

8/6/2019 (ASSIGNMENT)+Economic Variable
http://slidepdf.com/reader/full/assignmenteconomic-variable 7/23
7
Stock Prices and Interest Rates:
The perception concerning the relationship between interest
rates and equity prices is well recognized, signifying that anincrease in interest rates increases the opportunity cost of
holding money and thus substituted by interest bearing
securities, which then cause a fall in equity prices. Another
argument is that when interest rate increases, it increases the
cost of production and decreases the profits of the companywhich, thus, reduces the prices of shares.
Economic VariablesEconomic Variables

8/6/2019 (ASSIGNMENT)+Economic Variable
http://slidepdf.com/reader/full/assignmenteconomic-variable 8/23
8
Increase in industrial production decreases production cost
due to fixed cost element because fixed cost remains fixed andit is only the variable cost which is added. So per unit cost is
decreased. This leads to higher profit margins and ultimately
increase in stock price.
Industrial production index and Stock Prices:
Economic VariablesEconomic Variables
8/6/2019 (ASSIGNMENT)+Economic Variable
http://slidepdf.com/reader/full/assignmenteconomic-variable 9/23
9
Increase in money supply bring essentially needed liquidity to
the market. Due to availability of the money, trading activity in
the market is increased which results into increase in stock
prices. Moreover, increase in money supply bring inflation,
which is rise in prices. Along with prices of the goods, price of
shares and securities is also increased.
Stock Prices and Money Supply:
Economic VariablesEconomic Variables

8/6/2019 (ASSIGNMENT)+Economic Variable
http://slidepdf.com/reader/full/assignmenteconomic-variable 10/23
10
Change in foreign exchange rate affects the market in two
ways. If the currency is depreciated, stock will be available
to the potential international investor at a cheaper rate.Whereas those who have already invested will fear a
decrease in their return, thus, there will a higher trading
activity affecting stock prices with a change in currency
value.
Stock Prices and Exchange rate:
Economic VariablesEconomic Variables
8/6/2019 (ASSIGNMENT)+Economic Variable
http://slidepdf.com/reader/full/assignmenteconomic-variable 11/23
11
Exports brings much needed foreign exchange to the country
which has a healthy impact on the economy. The exporting
companies enjoys tax concessions and lower rate of interest onloans meant for export purpose. This way their profit margin
is increased. These companies charge a better price from their
customers in advanced countries and consequently the profits
are increased. So increase in exports leads to the increase in
stock prices
Stock Prices and Exports
Economic VariablesEconomic Variables
8/6/2019 (ASSIGNMENT)+Economic Variable
http://slidepdf.com/reader/full/assignmenteconomic-variable 12/23
12
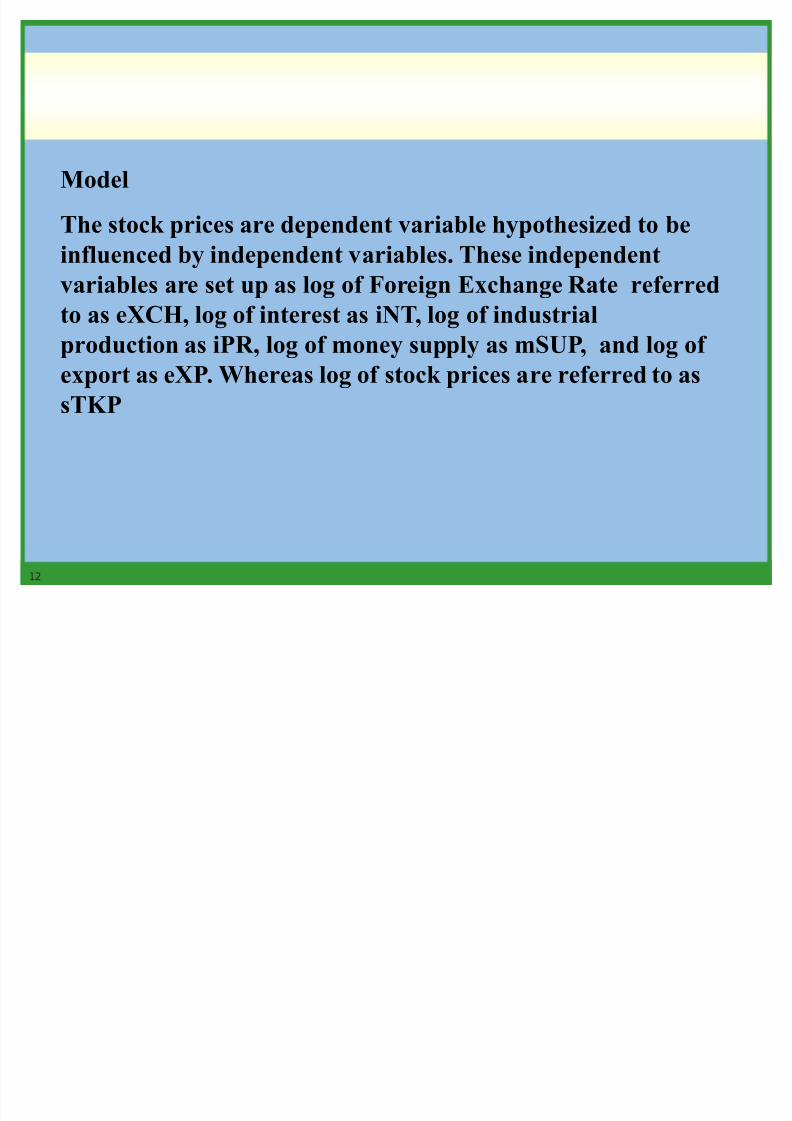
Model
The stock prices are dependent variable hypothesized to be
influenced by independent variables. These independent
variables are set up as log of Foreign Exchange Rate referredto as eXCH, log of interest as iNT, log of industrial
production as iPR, log of money supply as mSUP, and log of
export as eXP. Whereas log of stock prices are referred to as
sTKP
8/6/2019 (ASSIGNMENT)+Economic Variable
http://slidepdf.com/reader/full/assignmenteconomic-variable 13/23
13
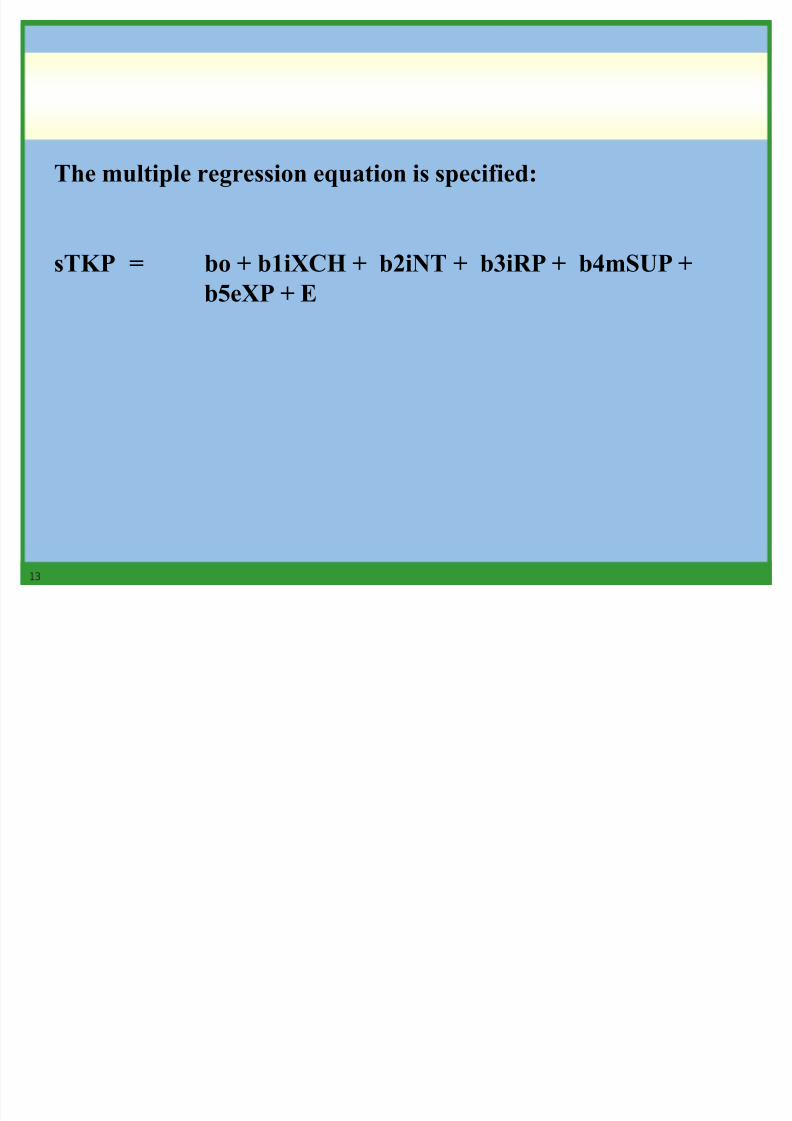
The multiple regression equation is specified:
sTKP = bo + b1iXCH + b2iNT + b3iRP + b4mSUP +
b5eXP + E

8/6/2019 (ASSIGNMENT)+Economic Variable
http://slidepdf.com/reader/full/assignmenteconomic-variable 14/23
14
Where
bo = a constant
b1 = regression coefficient that measures the
sensitivity of sTKP to iXCH
b2 = regression coefficient that measures the
sensitivity of sTKP to iNT
b3 = regression coefficient that measures the
sensitivity of sTKP to iRP
b4 = regression coefficient that measures the
sensitivity of sTKP to mSUPb5 = regression coefficient that measures the
sensitivity of sTKP to eXP
E = Error Term
8/6/2019 (ASSIGNMENT)+Economic Variable
http://slidepdf.com/reader/full/assignmenteconomic-variable 15/23
15
Data
The data used in the empirical investigation covers monthly
data for the period from 2000 to 2009. The data about KSE-
100 index is collected from electronic data provided by theweb site finance.yahoo.com and data of economic variables
is extracted from electronic data of ³International Financial
Statistics´ provided by International Monetary Fund.

8/6/2019 (ASSIGNMENT)+Economic Variable
http://slidepdf.com/reader/full/assignmenteconomic-variable 16/23
16
Analytical Framework
A systematic approach for data analysis was used. The
Augmented Dickey-Fuller (ADF) Test was applied to check
the stationarity of the data. Useful inference can be drawn if the time series consists of stationary data. A data series is
considered to be stationary if its mean and variance are
constant over time and the value of covariance between two
time periods depends only on the lag between the two time
periods and not on the actual time at which the covariance iscomputed. Linear regression was used to quantify the
strength of relationship between stock prices and other
independent variables.
8/6/2019 (ASSIGNMENT)+Economic Variable
http://slidepdf.com/reader/full/assignmenteconomic-variable 17/23
17
Data Analysis
Conclusion
8/6/2019 (ASSIGNMENT)+Economic Variable
http://slidepdf.com/reader/full/assignmenteconomic-variable 18/23
18
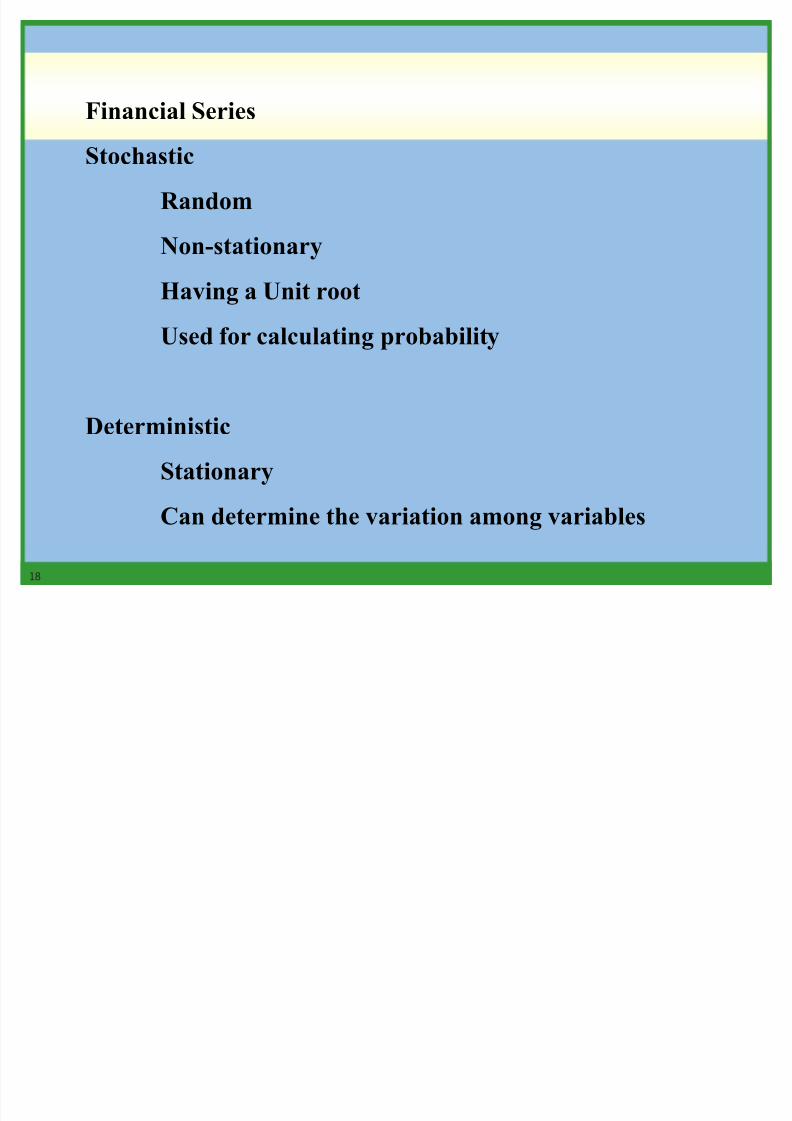
Financial Series
Stochastic
Random
Non-stationary
Having a Unit root
Used for calculating probability
Deterministic
Stationary
Can determine the variation among variables

8/6/2019 (ASSIGNMENT)+Economic Variable
http://slidepdf.com/reader/full/assignmenteconomic-variable 19/23
19
Unit Root Test
For series considered as stationary t-stat < 5% CV
If series is not statinary then take its natural log return
8/6/2019 (ASSIGNMENT)+Economic Variable
http://slidepdf.com/reader/full/assignmenteconomic-variable 20/23
20
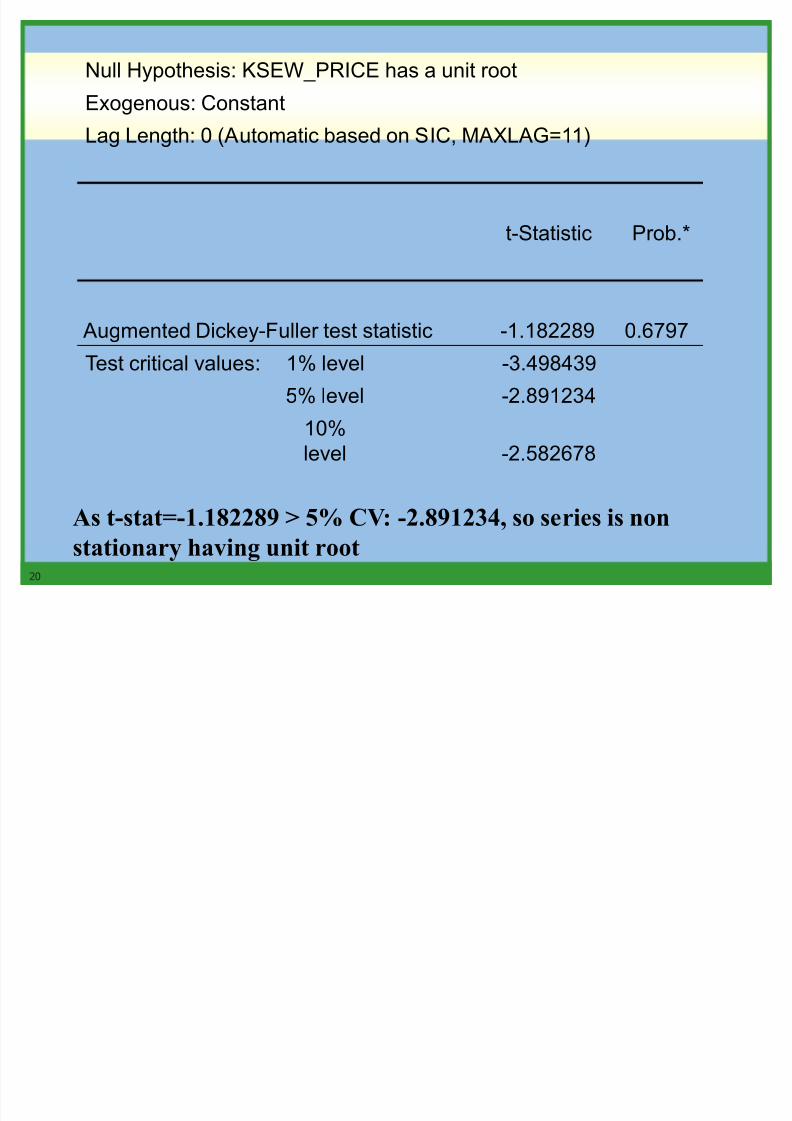
Null Hypothesis: KSEW_PRICE has a unit root
Exogenous: Constant
Lag Length: 0 (Automatic based on SIC, MAXLAG=11)
t-Statistic Prob.*
Augmented Dickey-Fuller test statistic -1.182289 0.6797
Test critical values: 1% level -3.498439
5% level -2.891234
10%
level -2.582678
As t-stat=-1.182289 > 5% CV: -2.891234, so series is non
stationary having unit root

8/6/2019 (ASSIGNMENT)+Economic Variable
http://slidepdf.com/reader/full/assignmenteconomic-variable 21/23
21
Unrestricted Cointegration Rank Test (Trace)
Hypothesi
zed Trace 0.05
No. of CE(s)
Eigenvalue Statistic
CriticalValue Prob.**
None * 0.329454 68.22679 15.49471 0.000
At most 1 0.211774 25.46290 3.841466 0.000
Cointegration
If Trace Statistics is less than 5% CV then variables are not
cointegrated

8/6/2019 (ASSIGNMENT)+Economic Variable
http://slidepdf.com/reader/full/assignmenteconomic-variable 22/23
22
Trace Statistics i.e. 68.22679 is greater than 5% CV
i.e. 15.49471 then variables are cointegrated

8/6/2019 (ASSIGNMENT)+Economic Variable
http://slidepdf.com/reader/full/assignmenteconomic-variable 23/23
23
GrangerCausality Test
If F-statistics is large and the probability value is close to0 then the variableGranger causes the other variable.
Null Hypothesis:Observation
F-
Statistic
Probability
eXCH does not Granger
Cause sTKP 118 0.488 0.6150sTKP does not Granger Cause
eXCH 0.616 0.5415