Assignment 1 due Wednesday, January 10 General notes...
12
Math 141, Winter 2018 Instructor – Linda C. Stephenson Assignment 1 – Solving Equations Page 1 of 12 Assignment 1 – due Wednesday, January 10 Assignment Description: The purpose of this assignment is to use a plotting applet to plot and solve various types of functions. We will use this particular applet (or a similar one) frequently. It is found at the following website: Desmos: https://www.desmos.com/calculator See the next page for basic instructions on using the applet. General notes on assignments: Always read and follow the instructions for assignments very carefully. I will give very specific instructions, and I expect you to follow them! Also, make sure that you read the “What you Need to Turn In” section very carefully, to make sure that your assignment is complete. We will use some applets in multiple assignments, and I will only give a detailed explanation once, so hold on to your assignments for future use. I am ALWAYS happy to “pre-check” your assignments before you turn them in. Just bring them to class before they are due (NOT on the due date), and I will look them over. The whole point is to LEARN from the assignments, and if they are all wrong, that won’t be accomplished. Read the separate file (posted) about ‘Printing Out Applet Output’ – it describes the preferred method for printing out graphs and stuff.
Transcript of Assignment 1 due Wednesday, January 10 General notes...
Math 141, Winter 2018 Instructor – Linda C. Stephenson Assignment 1 – Solving Equations
Page 1 of 12
Assignment 1 – due Wednesday, January 10
Assignment Description:
The purpose of this assignment is to use a plotting applet to plot and solve
various types of functions. We will use this particular applet (or a similar one)
frequently. It is found at the following website:
Desmos: https://www.desmos.com/calculator
See the next page for basic instructions on using the applet.
General notes on assignments:
Always read and follow the instructions for assignments very carefully.
I will give very specific instructions, and I expect you to follow them!
Also, make sure that you read the “What you Need to Turn In” section
very carefully, to make sure that your assignment is complete.
We will use some applets in multiple assignments, and I will only give a
detailed explanation once, so hold on to your assignments for future
use.
I am ALWAYS happy to “pre-check” your assignments before you turn
them in. Just bring them to class before they are due (NOT on the due
date), and I will look them over. The whole point is to LEARN from the
assignments, and if they are all wrong, that won’t be accomplished.
Read the separate file (posted) about ‘Printing Out Applet Output’ – it
describes the preferred method for printing out graphs and stuff.
Math 141, Winter 2018 Instructor – Linda C. Stephenson Assignment 1 – Solving Equations
Page 2 of 12
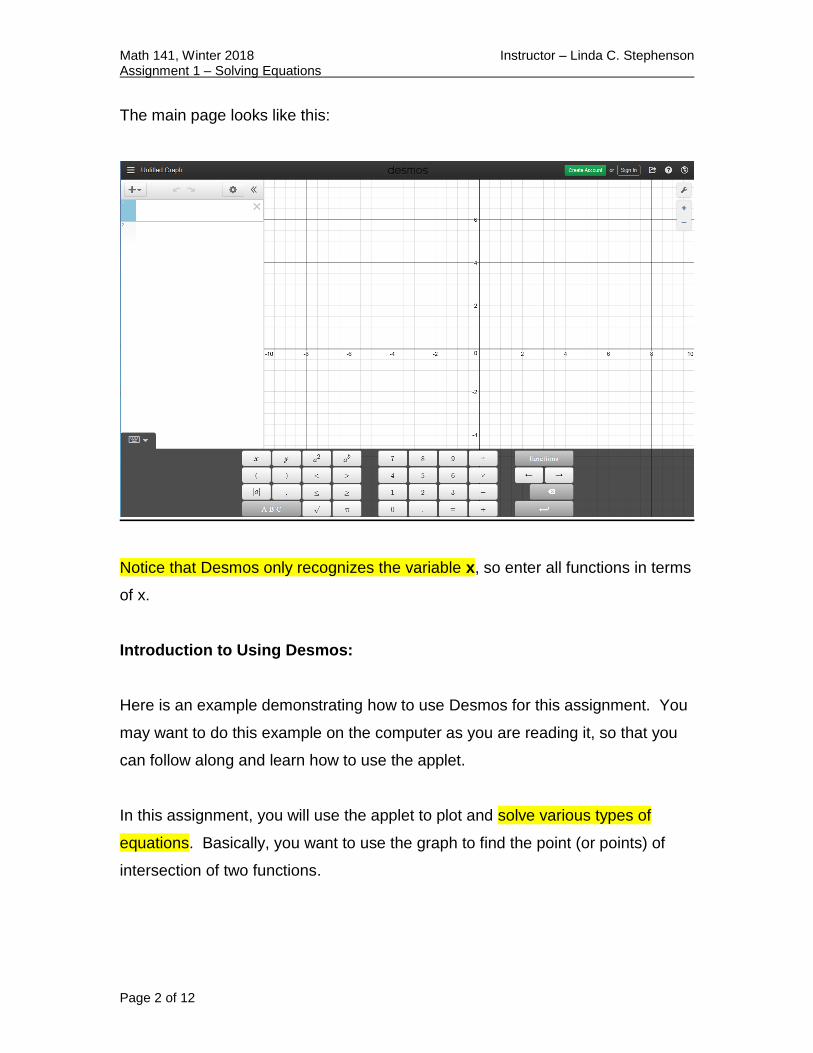
The main page looks like this:
Notice that Desmos only recognizes the variable x, so enter all functions in terms
of x.
Introduction to Using Desmos:
Here is an example demonstrating how to use Desmos for this assignment. You
may want to do this example on the computer as you are reading it, so that you
can follow along and learn how to use the applet.
In this assignment, you will use the applet to plot and solve various types of
equations. Basically, you want to use the graph to find the point (or points) of
intersection of two functions.
Math 141, Winter 2018 Instructor – Linda C. Stephenson Assignment 1 – Solving Equations
Page 3 of 12
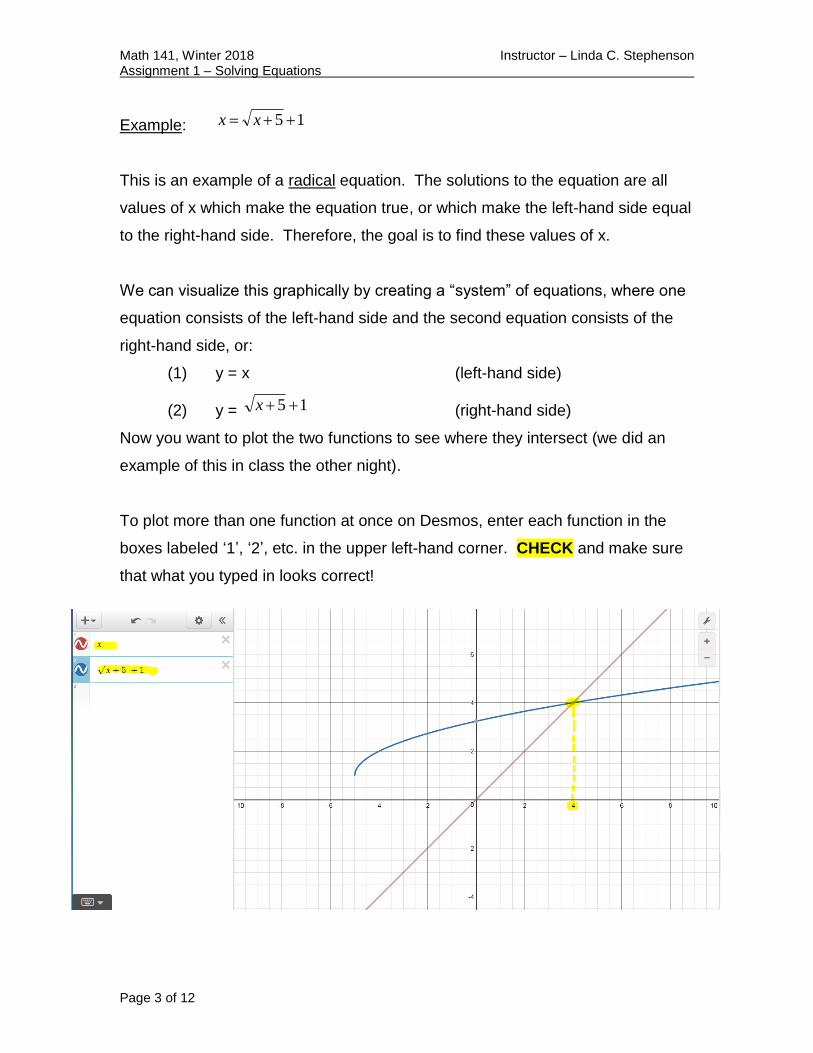
Example: 15 xx
This is an example of a radical equation. The solutions to the equation are all
values of x which make the equation true, or which make the left-hand side equal
to the right-hand side. Therefore, the goal is to find these values of x.
We can visualize this graphically by creating a “system” of equations, where one
equation consists of the left-hand side and the second equation consists of the
right-hand side, or:
(1) y = x (left-hand side)
(2) y = 15 x (right-hand side)
Now you want to plot the two functions to see where they intersect (we did an
example of this in class the other night).
To plot more than one function at once on Desmos, enter each function in the
boxes labeled ‘1’, ‘2’, etc. in the upper left-hand corner. CHECK and make sure
that what you typed in looks correct!
Math 141, Winter 2018 Instructor – Linda C. Stephenson Assignment 1 – Solving Equations
Page 4 of 12
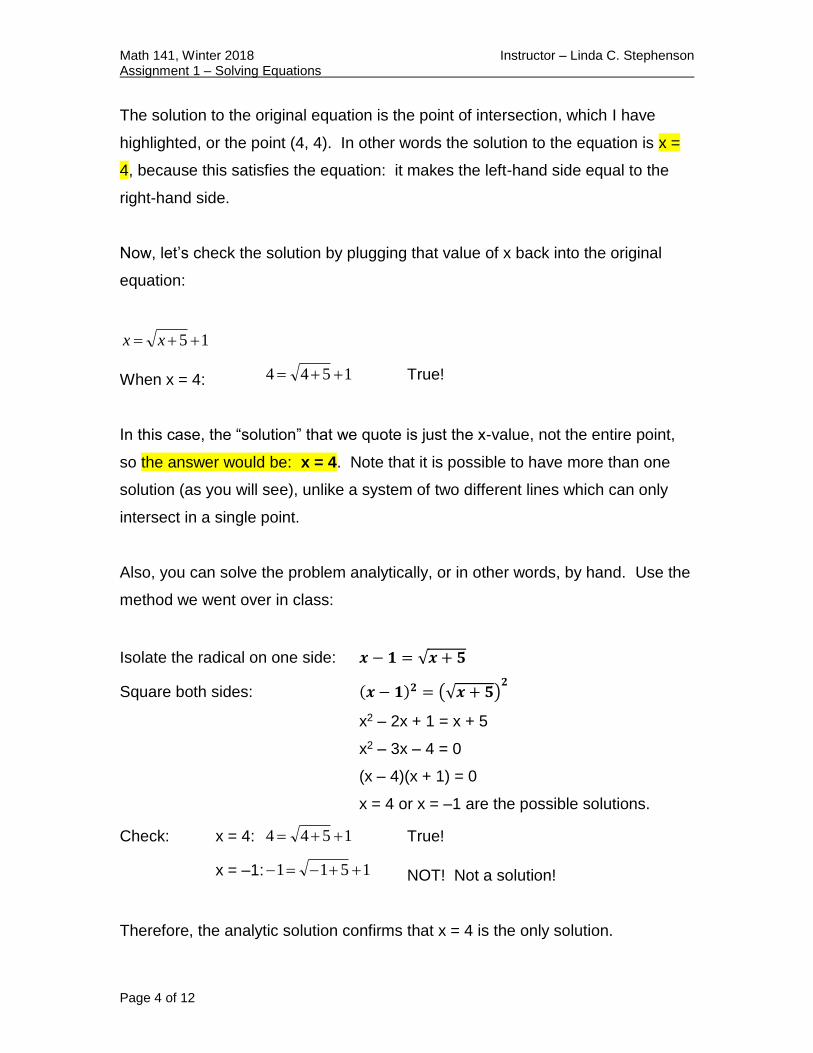
The solution to the original equation is the point of intersection, which I have
highlighted, or the point (4, 4). In other words the solution to the equation is x =
4, because this satisfies the equation: it makes the left-hand side equal to the
right-hand side.
Now, let’s check the solution by plugging that value of x back into the original
equation:
15 xx
When x = 4: 1544 True!
In this case, the “solution” that we quote is just the x-value, not the entire point,
so the answer would be: x = 4. Note that it is possible to have more than one
solution (as you will see), unlike a system of two different lines which can only
intersect in a single point.
Also, you can solve the problem analytically, or in other words, by hand. Use the
method we went over in class:
Isolate the radical on one side: 𝒙 − 𝟏 = √𝒙 + 𝟓
Square both sides: (𝒙 − 𝟏)𝟐 = (√𝒙 + 𝟓)𝟐
x2 – 2x + 1 = x + 5
x2 – 3x – 4 = 0
(x – 4)(x + 1) = 0
x = 4 or x = –1 are the possible solutions.
Check: x = 4: 1544 True!
x = –1: 1511 NOT! Not a solution!
Therefore, the analytic solution confirms that x = 4 is the only solution.
Math 141, Winter 2018 Instructor – Linda C. Stephenson Assignment 1 – Solving Equations
Page 5 of 12
KEY POINT! The WHOLE point of doing this is to use the graph to confirm
your analytic solution. They should be the SAME!!! If your graph and
analytic solution are not the same, then one of them is wrong, and you
need to check your work! Don’t forget this!!!
HOW TO PRINT YOUR GRAPHS:
There are various methods for doing this, and I will let you guys decide which
method you prefer. We looked at this briefly in class the other night. In the
upper right corner, go to the little arrow icon which leads you to options to ‘Share
you graph’. You can try any of those options: print, export, or embed, and see
what works best. I chose to not use ANY of those, because I am a huge fan of
the Windows ‘Snipping’ tool. There’s a discussion on how to use that in a file
posted on our Assignments page, ‘Printing out Applet Output’. I can do a demo
in class also.
WHAT YOU NEED TO TURN IN:
Fully completed Answer Sheets (5 pages total).
Print out of one plot for each problem (5 plots total), with all points of
intersection (solutions) circled on the plots (problems 1-4).
When you snip and copy the plots (or otherwise print), make sure you get
the ENTIRE output window, including the input functions. (If there’s
something wrong with your graph, and I can’t see the functions you typed
in, then I can’t tell what went wrong).
Label all plots with the problem number, and attach everything in order!
Math 141, Winter 2018 Instructor – Linda C. Stephenson Assignment 1 – Solving Equations
Page 6 of 12
Problems:
1. Solve the radical equation: 1495 xx
syntax to enter in the function box:
left-hand side: sqrt(5x-9)-sqrt(x+4) OR use sq root tool right-hand side: y=1 (note: this will just plot a horizontal line)
Note: use the right-arrow key to get out from “under” the radical symbol. Print out your Desmos plot showing the graphical solution. There is only
one solution to this one, and it is a nice integer value of x. Circle the point of intersection by hand on the graph.
2. Solve the equation: (x2 + 2x)2 – 8(x2 + 2x) + 15 = 0 syntax:
left-hand side: (x^2+2x)^2-8(x^2+2x)+15 right-hand side: y=0 (note: this will just plot a horizontal line)
There are four solutions to this one, two of which are nice integer values of
x. You can click on the points of intersection with your mouse, and a dot will appear, along with the coordinates of the point. This will give you an estimate of the solution (the x-value) to the nearest thousandth. Print out your plot showing the graphical solution, and circle the points of intersection by hand on the graph.
3. Solve the rational equation: 𝒙+𝟒
𝒙+ 𝟏 =
𝒙−𝟔
𝒙
syntax:
left-hand side: (x+4)/x+1 Note: hit right-arrow key after doing the (x+4)/x
right-hand side: (x-6)/x Print out your plot showing the graphical solution, and circle the point of
intersection by hand on the graph.
For example, I clicked on the point of intersection of these two graphs. The x-coordinate of the “red dot” point are displayed to the right. The graphs intersect when x is about 1.6.
Math 141, Winter 2018 Instructor – Linda C. Stephenson Assignment 1 – Solving Equations
Page 7 of 12
4. Solve the absolute value equation: |2 – 3x| = 2x – 1 syntax:
left-hand side: abs(2-3x) OR use the |a| tool at the bottom right-hand side: 2x-1
Note: you may want to zoom in on this one in order to see the points of
intersection better. Use the + symbol at the upper right Print out your plot showing the graphical solution, and circle the points of intersection by hand on the graph.
5. A water balloon is catapulted straight up into the air from an initial height of 2.4 meters, such that its height ‘h’ in meters after ‘t’ seconds is given by the following equation:
h = –4.9t2 + 27t + 2.4 Plot the equation with the following syntax, and use the plot to answer all
of the questions: Syntax: -4.9x2+27x+2.4 In particular, notice that the x-axis represents the time ‘t’ in seconds that
the water balloon is in the air, and the y-axis represents the height ‘h’ in meters that the balloon is at, at any particular time. The water balloon is simply traveling straight up and straight down, it is NOT tracing out the path shown in the graph. Make sure you understand what the graph is showing.
For this graph, you will need to adjust the y-axis scale. Go into the Graph
Settings by clicking the little wrench at the upper right corner, and change the maximum value for the y-axis to 40.
You can just click around on the graph to read off the coordinates of the points that you need to answer the questions. You can also “grab” the points, and slide them up and down the curve, to get a more accurate answer. Print out your plot showing the graphical solution.
Math 141, Winter 2018 Name: Assignment 1 – Solving Equations
Page 8 of 12
Answer Sheet
1. Solve the equation: 1495 xx
Solution(s): x =
Remember to attach your plot showing the graphical solution, with the point of intersection circled. Show all work (NEATLY!) here for the analytic solution:
IMPORTANT NOTE: For all problems, you are going to show your work for the analytic (i.e. “by hand”) solution. Therefore, you should list the exact answers from your analytic solutions in the answer spaces given below. Do not list approximate values which may have been obtained from your graphs. Note that your analytic solutions should match your graphical solutions – that is the whole point! So don’t forget to verify that your solutions are correct.
Math 141, Winter 2018 Name: Assignment 1 – Solving Equations
Page 9 of 12
2. Solve the equation: (x2 + 2x)2 – 8(x2 + 2x) + 15 = 0
Solution(s): x = Remember to attach your plot showing the graphical solution, with the points of intersection circled. Show all work here (NEATLY!) for the analytic solution (using substitution method):
Math 141, Winter 2018 Name: Assignment 1 – Solving Equations
Page 10 of 12
3. Solve the equation: 𝒙+𝟒
𝒙+ 𝟏 =
𝒙−𝟔
𝒙
Solution(s): x =
Remember to attach your plot showing the graphical solution, with the point of intersection circled. Show all work here (NEATLY!) for the analytic solution:
Math 141, Winter 2018 Name: Assignment 1 – Solving Equations
Page 11 of 12
4. Solve the equation: |2 – 3x| = 2x – 1
Solution(s): x = Remember to attach your plot showing the graphical solution, with the points of intersection circled. Use the solution and graph to solve the inequality: |2 – 3x| < 2x – 1
List the solution in interval notation: Show all work here (NEATLY!) for the analytic solution (to the equation):
Math 141, Winter 2018 Name: Assignment 1 – Solving Equations
Page 12 of 12
5. Water balloon problem: No analytic solution is necessary here, just use your graph to answer the following questions. Give all answers to the nearest tenth (one decimal place). How high is the balloon after 1 second? meters For how long is the balloon more than 30 meters high? sec What is the maximum height of the balloon? meters How long is the balloon in the air? sec Remember to attach your plot showing the graphical solution.