assigned to zl 8/27/ · 8. Statistical significance of the estimated difference in...
23
Series 2, Number 133 Compensating for Provider Nonresponse Using Response Propensities to Form Adjustment Cells: The National Immunization Survey Data From the National Health Care Survey U.S. DEPARTMENT OF HEALTH AND HUMAN SERVICES Centers for Disease Control and Prevention National Center for Health Statistics Hyattsville, Maryland October 2001 DHHS Publication No. (PHS) 2001-1333
Transcript of assigned to zl 8/27/ · 8. Statistical significance of the estimated difference in...

Series 2, Number 133
Compensating for Provider Nonresponse Using Response Propensities to Form Adjustment Cells: The National Immunization Survey
Data From the National Health Care Survey
U.S. DEPARTMENT OF HEALTH AND HUMAN SERVICESCenters for Disease Control and PreventionNational Center for Health Statistics
Hyattsville, Maryland October 2001 DHHS Publication No. (PHS) 2001-1333

Copyright information
All material appearing in this report is in the public domain and may be reproduced or copied without permission; citation as to source, however, is appreciated.
Suggested Citation
Smith PJ, Rao JNK, Battaglia MP, et al. Compensating for provider nonresponse using response propensities to form adjustment cells: The National Immunization Survey. National Center for Health Statistics. Vital Health Stat 2(133). 2001
Library of Congress Cataloging-in-Publication Data
Compensating for provider nonresponse in the national immunization survey with adjustment cells formed using response propensities / Philip J. Smith ... [et al.].
p.; cm. — (Vital and health statistics. Series 2, Data evaluation and methods research ; no. 133) (DHHS publication ; no. (PHS) 2000-1333) Cover title: Compensating for provider nonresponse using response propensities to form adjustment cells.
Includes bibliographical references. ISBN 0-8406-0574-9 1. Immunization of children—United States. 2. Health surveys—United
States—Methodology. I. Title: Compensating for provider nonresponse using response propensities to form adjustment cells. II. Smith, Philip J. (Philip James), 1951- III. National Center for Health Statistics (U.S.) IV. Series. V. Series: DHHS publication ; no. (PHS) 2001-1333
[DNLM: 1. Vaccination—utilization—Child—United States. 2. Data Collection—methods—United States. W2 A N148vb no. 133 2001] RA409.U45 no. 133 [RJ240] 362.1′07′23 s—dc21 [614.4′7′0830973] 2001044611
For sale by the U.S. Government Printing Office Superintendent of Documents Mail Stop: SSOP Washington, DC 20402-9328 Printed on acid-free paper.

National Center for Health Statistics
Edward J. Sondik, Ph.D., Director
Jack R. Anderson, Deputy Director
Jack R. Anderson, Acting Associate Director for International Statistics
Jennifer H. Madans, Ph.D., Associate Director for Science
Lawrence H. Cox, Ph.D., Associate Director for Research and Methodology
Jennifer H. Madans, Ph.D., Acting Associate Director for Analysis, Epidemiology, and Health Promotion
Edward L. Hunter, Associate Director for Planning, Budget, and Legislation
Jennifer H. Madans, Ph.D., Acting Associate Director for Vital and Health Statistics Systems
Douglas L. Zinn, Acting Associate Director for Management
Charles J. Rothwell, Associate Director for Information Technology and Services
Office of Research and Methodology
Lawrence H. Cox, Ph.D., Associate Director
Trena M. Ezzati-Rice, Chief, Survey Design Staff
P. Douglas Williams, Acting Chief, Statistical Methods Staff
Jimmie D. Givens, Acting Chief, Statistical Technology Staff
Kenneth W. Harris, Acting Chief, Cognitive Methods Staff

Contents
Abstract . . . . . . . . . . . . . . . . . . . . . . . . . . . . . . . . . . . . . . . . . . . . . . . . . . . . . . . . . . . . . . . . . . . . . . . . . . . . . . . . . . . . . . . . . . . . . . . . . 1
1. Introduction . . . . . . . . . . . . . . . . . . . . . . . . . . . . . . . . . . . . . . . . . . . . . . . . . . . . . . . . . . . . . . . . . . . . . . . . . . . . . . . . . . . . . . . . . . . 1
2. Background and Outline of Report . . . . . . . . . . . . . . . . . . . . . . . . . . . . . . . . . . . . . . . . . . . . . . . . . . . . . . . . . . . . . . . . . . . . . . . . 2
3. Summary of NIS Sample Design . . . . . . . . . . . . . . . . . . . . . . . . . . . . . . . . . . . . . . . . . . . . . . . . . . . . . . . . . . . . . . . . . . . . . . . . . . 3
4. Original NIS Estimation Methodology . . . . . . . . . . . . . . . . . . . . . . . . . . . . . . . . . . . . . . . . . . . . . . . . . . . . . . . . . . . . . . . . . . . . . . 3 4.1 RDD Phase Sampling Weights . . . . . . . . . . . . . . . . . . . . . . . . . . . . . . . . . . . . . . . . . . . . . . . . . . . . . . . . . . . . . . . . . . . . . . . 3 4.2 Nonresponse Adjustment for Second Phase of Sampling—Original Method Used Before 1998 . . . . . . . . . . . . . . . . . . . 4
5. Adjustment for Provider Vaccination History Nonresponse Using Adjustment Cells . . . . . . . . . . . . . . . . . . . . . . . . . . . . . . . . . 5 5.1 Model Development . . . . . . . . . . . . . . . . . . . . . . . . . . . . . . . . . . . . . . . . . . . . . . . . . . . . . . . . . . . . . . . . . . . . . . . . . . . . . . . . 5 5.2 A Sequential Method for Choosing ‘‘Optimal’’ Number of Adjustment Cells . . . . . . . . . . . . . . . . . . . . . . . . . . . . . . . . . . 6 5.3 Raking to Control Bias . . . . . . . . . . . . . . . . . . . . . . . . . . . . . . . . . . . . . . . . . . . . . . . . . . . . . . . . . . . . . . . . . . . . . . . . . . . . . 7 5.4 Estimators for Vaccination Coverage of a Subpopulation and Its Variance . . . . . . . . . . . . . . . . . . . . . . . . . . . . . . . . . . . . 7
6. Illustration and Evaluation of the Methods . . . . . . . . . . . . . . . . . . . . . . . . . . . . . . . . . . . . . . . . . . . . . . . . . . . . . . . . . . . . . . . . . . 8 6.1 Illustration of Sequential Method to Determine ‘‘Optimal’’ Number of Adjustment Cells and to Evaluate Provider-
Verified Vaccination History Nonresponse Bias . . . . . . . . . . . . . . . . . . . . . . . . . . . . . . . . . . . . . . . . . . . . . . . . . . . . . . . . . . 8 6.2 Evaluation of Difference in Bias Reduction Obtained Using ‘‘Optimal’’ Choice for Number of Adjustment Cells,
Compared With Using Five Adjustment Cells Within Each Stratum . . . . . . . . . . . . . . . . . . . . . . . . . . . . . . . . . . . . . . . . . 8 6.3 Comparison of 4:3:1:3 Coverage Estimates Obtained Using the New NIS Methodology . . . . . . . . . . . . . . . . . . . . . . . . . 8
7. Summary . . . . . . . . . . . . . . . . . . . . . . . . . . . . . . . . . . . . . . . . . . . . . . . . . . . . . . . . . . . . . . . . . . . . . . . . . . . . . . . . . . . . . . . . . . . . . 8
References . . . . . . . . . . . . . . . . . . . . . . . . . . . . . . . . . . . . . . . . . . . . . . . . . . . . . . . . . . . . . . . . . . . . . . . . . . . . . . . . . . . . . . . . . . . . . . 9
Figure
Difference in State-specific coverage rates using new and old estimation methods: National Immunization Survey, 1998 . . . . . . . . . . . . . . . . . . . . . . . . . . . . . . . . . . . . . . . . . . . . . . . . . . . . . . . . . . . . . . . . . . . . . . . . . . . . . . . . . . . . . . . . . . . . . 5
Detailed Tables
1. Percent of children with selected characteristics by provider data status: National Immunization Survey, 1998 . . . . . . . . . 11 2. Variables in the model selection for the response propensity model: National Immunization Survey, 1998 . . . . . . . . . . . . 11 3. Results of the stepwise variable selection procedure for the response propensity model . . . . . . . . . . . . . . . . . . . . . . . . . . . . 12 4. Estimated log-odds and associated standard errors of the predictors selected in the stepwise procedure for the final
model: National Immunization Survey, 1998 . . . . . . . . . . . . . . . . . . . . . . . . . . . . . . . . . . . . . . . . . . . . . . . . . . . . . . . . . . . . . . 13 5. Variables used for raking the response propensity adjusted weights of children with provider data: National
Immunization Survey, 1998 . . . . . . . . . . . . . . . . . . . . . . . . . . . . . . . . . . . . . . . . . . . . . . . . . . . . . . . . . . . . . . . . . . . . . . . . . . . . 14 6. Illustration of method for determining optimal number of adjustment cells for Illinois-Rest of State: National
Immunization Survey, 1998 . . . . . . . . . . . . . . . . . . . . . . . . . . . . . . . . . . . . . . . . . . . . . . . . . . . . . . . . . . . . . . . . . . . . . . . . . . . . 14 7. Summary of nonresponse-adjusted estimates of 4:3:1:3 coverage and estimated bias reduction obtained by using
optimal number of adjustment cells: National Immunization Survey, 1998 . . . . . . . . . . . . . . . . . . . . . . . . . . . . . . . . . . . . . . 15 8. Statistical significance of the estimated difference in nonresponse-adjusted estimates of 4:3:1:3 coverage obtained by
using optimal choice of k compared with using five adjustment cells in each IAP area: National Immunization Survey, 1998 . . . . . . . . . . . . . . . . . . . . . . . . . . . . . . . . . . . . . . . . . . . . . . . . . . . . . . . . . . . . . . . . . . . . . . . . . . . . . . . . . . . . . . . . 17
iii

Compensating for Provider Nonresponse Using ResponsePropensities to Form AdjustmentCells: The National Immunization Survey Philip J. Smith, Ph.D., Centers for Disease Control; J.N.K. Rao, Ph.D., Carleton University; Michael P. Battaglia, M.A., Abt Associates; Trena M. Ezzati-Rice, M.S., Centers for Disease Control; Danni Daniels, M.S., Centers for Disease Control; and Meena Khare, M.S., Centers for Disease Control
Objectives The National Immunization Survey
(NIS) uses two phases of data collection to obtain vaccination information from a sample of young children: a random-digit-dialing (RDD) survey for identifying households with children 19–35 months of age, followed by a mail survey for obtaining provider-reported vaccination histories about these children. Vaccination histories are used to estimate vaccination coverage rates.
In 1998, provider-reported vaccination histories were not obtained for 32.9% of children with a completed RDD interview. This report describes the statistical methods adopted in 1998 to reduce the bias in vaccination coverage estimates that could result from ‘‘vaccination history nonresponse,’’ that is, differences between children for whom provider data was obtained and those for whom it was not obtained.
Methods In the methods adopted in 1998,
children with completed NIS RDD interviews are grouped into adjustment cells defined by their propensity to have adequate provider data. Sampling weights of children with adequate provider data are divided by the cell-specific weighted response rate to allow these children to represent all children in the cell.
Results Using an ‘‘optimal’’ number of cells, the
overall extent of bias reduction was 0.5%, suggesting that provider nonresponse bias was small. Authoritative literature suggests using five cells. No statistically significant differences were observed in vaccination coverage estimates when comparing estimates based on the ‘‘optimal’’ number of cells with five cells. Thus, five adjustment cells are used to reduce provider nonresponse bias in the NIS vaccination coverage estimates. No substantively important differences were observed between estimates based on the methodology used prior to 1998 and the methodology adopted in 1998.
Keywords: Adjustment cell c National Immunization Survey c nonresponse bias c response propensity.
1. Introduction
ne goal of the Childhood Immunization Initiative (1) is to O achieve an immunization or
vaccination coverage rate of 90% for four critical vaccines—diphtheria and tetanus toxoids and pertussis (DTP), poliovirus (polio), measles-mumps-rubella (MMR), and Haemophilus Influenzae type B (Hib).
The National Immunization Survey (NIS) was initiated in April 1994 to monitor progress toward achieving the vaccination coverage goals; to monitor national, State, and local vaccination coverage rates in the United States on an ongoing basis; and to assist the Centers for Disease Control (CDC) in directing resources. The NIS covers 78 Immunization Action Plan (IAP) areas that include the 50 States and 28 urban areas, including the District of Columbia. Each IAP area represents a stratum of the sampling design within which households are independently sampled. Within each IAP area, the design of the NIS includes two phases of data collection: a list-assisted random-digit-dialing (RDD) telephone survey to eligible households followed by a mail survey of vaccination providers of eligible sampled children. The mail survey is administered only to
those providers for whom verbal consent is obtained from the responding parent or guardian.
In the RDD sampling phase of the NIS, the most knowledgeable respondent in each sampled household with eligible children is asked to provide vaccination history information for all the eligible children in the household. Also, demographic and socioeconomic characteristics of the household are obtained.
When the NIS began in 1994, the intention was to estimate vaccination coverage rates using household reportedvaccination histories. In late 1994,preliminary results from the 1994 National Immunization Provider Record Check Study (2) revealed a low correlation between household-reported vaccination histories and vaccination histories reported by children’s vaccination providers. The provider histories were thought to be more reliable, particularly for households in which no written vaccination histories were kept. As a result, in late 1994 the NIS began to ask RDD respondents for verbal consent to contact eligible children’s vaccination providers to obtain provider-reported vaccination histories. This practice still continues.
If verbal consent is obtained, the vaccination providers are mailed a questionnaire from which vaccination histories are obtained. Ezzati-Rice et
Page 1
Page 2 [ Series 2, No. 133
al. (3) and Zell et al. (4) give a more detailed description about the survey of vaccination providers. Because consent is not obtained from the parents/ guardians of all age-eligible children and not all providers respond or provide adequate vaccination information, potential nonresponse bias in the survey estimates could be incurred if coverage estimates were prepared only from children with adequate provider data and without adjusting for differences between these children and children for whom inadequate or no vaccination provider histories were obtained.
This report describes the statistical methodology adopted in 1998 to adjust NIS sampling weights to compensate for failure to obtain adequate provider data from all children for whom completed random-digit-dialing (RDD) interviews are obtained. Estimates of the extent of the bias that would be incurred by not compensating for nonresponse are also included. Lastly, comparisons are made of the new methods that have been used since 1998 with the methods that were used before 1998 to obtain estimates of vaccination coverage.
2. Background and Outline of the Report
n 1998, 83.4% of respondents in RDD sampled households gave consent to NIS personnel to contact
their children’s vaccination providers. Among households giving consent and reporting provider name and address information, immunization history questionnaires were obtained for 95.0% of the vaccination providers receiving the NIS mail survey. Overall, adequate vaccination histories were obtained for 67.1% of age-eligible children with completed RDD interviews.
Data obtained from responding providers include information on whether sampled children received a sufficient number of doses to be considered up-to-date with vaccination recommendations for DTP, polio, MMR, and Hib. A child is said to be ‘‘4:3:1:3’’ up-to-date provided he/she has received four or more doses of DTP, three or
I
more doses of polio, one or more doses of MMR, and three or more doses of Hib.
Empirical results suggest that sampled children for whom vaccination histories are obtained have characteristics that are associated with a greater likelihood of being up-to-date for the 4:3:1:3 vaccination series, as compared with sampled children for whom vaccination histories are not obtained. Table 1 lists characteristics that distinguish these groups of children for the 1998 NIS. All differences in these tables are statistically significant at the p=0.05 level for each variable listed. Children whose providers give adequate information are more likely to live in households that have higher total incomes, more likely to have a white non-Hispanic mother, and more likely to live outside of a central city of a metropolitan statistical area. These factors are also known to be associated with higher vaccination rates. Also, children with adequate vaccination information are more likely to live in the same State as the one in which they were born and more likely to come from a household where the respondent could locate a written record (i.e., a shot card) of the child’s vaccination history.
As a consequence, estimates of vaccination coverage that are not adjusted for these differences may be too high and may mislead immunization program managers about the success of their efforts to increase vaccination coverage rates. This report describes the statistical methods used in the NIS to adjust vaccination coverage rates for this potential ‘‘vaccination history nonresponse’’ bias.
The sampling design of the NIS is described in Section 3, and a synopsis of methods used to obtain estimates of vaccination coverage rates prior to 1998 is provided in Section 4. This has been described by Zell et al. (5). The method was based on adjusting for vaccination history nonresponse using a variant of the stratified two-phase estimation method described by Cochran (6). Section 4 includes a description of how first phase sampling weights are obtained and gives a synopsis of methods used to obtain estimates of vaccination coverage before 1998. It
also gives reasons why there was interest and opportunity to improve the original estimation methodology.
Section 5 describes a methodology that adjusts the first phase sampling weights to obtain coverage estimates with reduced ‘‘vaccination history nonresponse’’ bias. This method is based on grouping sampled children into adjustment cells according to the similarity of their response propensities to have a provider-reported vaccination history. The first phase sampling weight for children with adequate provider data is divided by the cell-specific weighted response rate. There have been previous discussions and applications of response propensities to adjust for nonresponse. In an econometric application, David et al. (7) describe the use of adjustment cells based on the use of response propensities. Little (8) describes how using response propensities to form adjustment cells can reduce nonresponse bias. Also, Yansaneh and Eltinge (9) and Eltinge and Yansaneh (10) described methods for determining the ‘‘optimal’’ number of adjustment cells that should be used in each stratum using response propensities. This section also describes the methods of Eltinge and Yansaneh in detail. It also describes the ratio estimators used within the context of the adjustment cell methodology to obtain estimates of vaccination coverage and their estimated standard errors.
In Section 6, these methods are applied to data from the 1998 NIS. Specifically, Section 6.1 includes demonstrations of the extent to which unadjusted estimates may be biased for the NIS coverage rate and how these rates’ bias may be reduced using an ‘‘optimal’’ choice for the number of adjustment cells within each stratum. In Section 6.2, differences are evaluated in the bias reduction obtained using the ‘‘optimal’’ choice for the number of adjustment cells compared with using five adjustment cells within each stratum. Section 6.3 includes comparisons of the estimates obtained using five adjustment cells within each stratum with the original NIS methodology. The report concludes with a discussion of the findings and recommendations.

Series 2, No. 133 [ Page 3
3. Summary of the NIS Sample Design
T he NIS uses two phases of data collection to obtain vaccination information for a large national
probability sample of young children. In the first phase of data collection, a random-digit-dialing (RDD) sample of telephone numbers is drawn. The NIS RDD design uses independent samples of telephone numbers in each of the 78 IAP areas for each calendar quarter. The quarterly samples make it possible to combine four consecutive quarters to form four-quarter estimates of vaccination coverage. The RDD sample in each IAP area is used to screen for households with one or more children age 19–35 months. In 1998, the target number of completed interviews for a quarter was 110 per IAP area. With an average sample size of 440 interviews for a four-quarter period, the total number of interviews for a four-quarter period is around 34,300.
The main goals of the sample design are: a) to ensure that a probability sample of telephone numbers is selected for each IAP area, b) to ensure that the desired target number of interviews is achieved in each IAP area, c) to minimize in a cost-effective manner the number of age-eligible children excluded from the sample frame, and d) to maintain an up-to-date sampling frame of telephone numbers.
To accomplish these goals, the NIS uses the list-assisted method of random-digit-dialing (11). This method is used to select a random sample of telephone numbers from banks of 100 consecutive telephone numbers (e.g., 617-495-0000 to 617-495-0099) in an IAP area that contain one or more directory-listed residential telephone numbers. When the IAP area is a city, county, or combination of counties, some prefix areas (e.g., 781-347) may cover part of the IAP area and part of an adjacent IAP area. In such situations, the NIS applies a ‘‘majority’’ rule that specifies that if at least 50% of the directory-listed households in a prefix area fall inside the IAP area, the prefix area is assigned to that IAP area. The
sampling frame of prefix areas is updated each quarter to account for newly created prefix areas.
The selection of a quarterly probability sample of telephone numbers to meet the target number of completed interviews with age-eligible children in an IAP area presents some challenges because the 78 IAP areas differ considerably along several dimensions. For example, they differ on a) the percent of telephone numbers that are working residential numbers, b) the likelihood of contacting a person among residential numbers, c) the percent of contacted households willing to complete the screener interview, d) the percent of households with an age-eligible child, and e) the willingness of parents to complete the telephone interview. These factors lead to considerable variation in the total sample size of telephone numbers needed to achieve a target sample size of completed interviews per IAP area.
Three design tools are used to address these issues. First, an automated procedure is used to eliminate a portion of the nonworking and business telephone numbers in the sample before it is dialed by the interviewers (12). Second, a statistical model to predict the number of sample telephone numbers needed in each IAP area for a given quarter of interviewing has been developed. Third, after drawing the required sample size of telephone numbers for an IAP area, that sample is divided into random subsamples called replicates. By administering the sample release on a replicate-by-replicate basis, the total number of interviews obtained is controlled and the interviews for each IAP area are spread evenly across the entire calendar quarter.
In the second phase of data collection, each child interviewed in the NIS is eligible for inclusion in the provider record-check survey. Permission to contact vaccination providers is requested from the respondent. The information collected from a child’s vaccination providers is used to determine whether a child is up-to-date on his or her vaccinations. Written requests for vaccination histories are mailed to the providers to obtain reports of vaccinations from medical
records. Providers have the option of responding via mail or facsimile. Postcard reminders and telephone followup are used to encourage nonresponding providers to participate in the study.
4. Original NIS Estimation Methodology
4.1 RDD Phase Sampling Weights
For children ages 19–35 months sampled in the 1998 random-digit-dialing (RDD) phase of the NIS (N = 32,511 completed interviews), RDD sampling weights were developed for each child for whom an interview was completed. These weights account for:
+ the probability of selection of a telephone number within an IAP area,
+ unit nonresponse arising from sample telephone numbers with an unresolved residential status,
+ unit nonresponse arising from residential sample telephone numbers where the presence of age-eligible children is not determined,
+ unit nonresponse attributable to incomplete and partial household interviews among eligible households, and
+ multiple telephone numbers within eligible households.
To ensure that the final sampling weights for each child when aggregated represent all children 19–35 months (i.e., those in both telephone and nontelephone households), an adjustment for households without telephones was made. In particular, using data from the National Health Interview Survey (NHIS), the RDD phase sampling weights have been adjusted to account for expected differences in vaccination coverage levels of eligible children living in households with and without telephones.

Page 4 [ Series 2, No. 133
Frankel et al. (13), Hoaglin and Battaglia (14), Battaglia et al. (15) give the details of this specific adjustment.
A poststratification ratio adjustment was also carried out within each IAP area using race/ethnicity of the mother, educational status of the mother, and age in months of the eligible child. The initial population controls were obtained from the NCHS natality file. However, special adjustments to the natality file population counts were made within each IAP area. The special adjustments account for a) infant mortality, b) foreign births, and c) geographic mobility among IAP areas. Further details on the original NIS RDD weighting methodology can be found in Smith et al. (16), Ezzati-Rice et al. (3), and Zell et al. (4).
In this report, these weights are referred to as the RDD phase sampling weights.
4.2 Nonresponse Adjustment for Second Phase of Sampling— Original Method Used Before 1998
In surveys like the NIS in which there are two phases of sampling and there is nonresponse at the second phase of sampling, it is necessary to adjust for any potential bias introduced by nonresponse at the second stage. Prior to 1998, a two-phase sampling estimation procedure described by Cochran (6) was used. This estimation methodology was adapted from that used in NIPRCS, the study that demonstrated that household reporting of vaccination status introduced an unacceptable level of response error. Initially there were no plans by CDC to release an NIS public use data file that would have required a single weight for each child with provider data. Over time, however, plans for release of NIS public use data files were made, and a different estimation strategy was needed because calculating single weights for children with provider data create a complication for the two-phase estimation procedure. A description of how the NIS estimation methodology was implemented to obtain vaccination coverage rates before 1998
is in this section. Within an IAP area, each eligible
child sampled was categorized into one of five strata depending upon whether the household respondent reported that the child was up-to-date on the 4:3:1:3 series and whether a shot card was used during the household interview. These were:
Stratum 1: household respondent had a shot card during the RDD interview and reported the eligible child as being 4:3:1:3 up-to-date,
Stratum 2: household respondent had a shot card during the RDD interview and reported the eligible child as not being 4:3:1:3 up-to-date,
Stratum 3: household respondent did not have a shot card during the RDD interview, but reported from memory/recall the eligible child as being 4:3:1:3 up-to-date,
Stratum 4: household respondent did not have a shot card during the RDD interview and reported from memory/recall the eligible child as not being 4:3:1:3 up-to-date, and
Stratum 5: missing information on 4:3:1:3 up-to-date status and/or shot card use.
Children belonging to stratum 1 were said to belong to the ‘‘top row.’’ These children were 4:3:1:3 up-to-date according to their shot card written record. Approximately 30% of the NIS children with completed household interviews belonged to the top row in 1998. Special treatment of top-row children is described below.
Let p 1,ij denote the estimated weighted proportion of children in IAP area i who are found to belong to stratum j, j = 1, . . . , 5, according to data obtained in the first phase of data collection. Also, let p 2,ij denote the estimated weighted proportion of children in IAP area i belonging to stratum j that are determined to be 4:3:1:3 up-to-date according to data obtained from the provider-verified vaccination history information in the second phase of data collection. Then, the stratified two-phase sampling estimator of children who are 4:3:1:3 up-to-date in IAP area i is
5
πi = ∑ p 1, ij p 2, ij (1) j=1
However, the NIS implementation of the two-phase sampling estimation methodology involved a special modification two-phase sampling estimator (1). Specifically, weighted data from the entire national sample of all children belonging to stratum 1 (i.e., the top row) whose vaccination providers responded were used to estimate p2,ij for every IAP area. This variant of two-phase sampling estimator was referred to as the ‘‘provider-adjusted top-row’’ estimator and was used in NIS before 1998. It was used to account for IAP areas in which a substantial proportion of top-row children were not 4:3:1:3 up-to-date according to provider data. This was thought to be caused primarily by incomplete provider records of vaccinations received by some children. A further description of this NIS estimation methodology used before 1998 can be found in Zell et al. (4).
One disadvantage of the provider-adjusted top-row estimator is that it tends to produce a slightly biased estimate of IAP area vaccination coverage rates. By using national data to estimate p2,ij, coverage level estimates for IAP areas will tend to be biased toward the national figure.
An additional disadvantage of the two-phase sampling approach to account for provider-reported vaccination history nonresponse is that there are few methods tailored for statistical analyses of data from two-phase sampling designs when the analysis calls for more complicated models. For example, in epidemiologic analyses of complex survey data, logistic regression is routinely required. However, there are no standard statistical methods for logistic regression that have been developed and made accessible to analysts through commonly available commercial software that account for a two-phase sampling design. Therefore, although weighted estimates reflecting both phases of data collection can be produced, limitations exist for more complex epidemiologic analysis and for release of data on public use files.
Because of these disadvantages, a new enhanced statistical estimation methodology was implemented in 1998. The new estimation methodology adopted in 1998 is described in Section 5.

Series 2, No. 133 [ Page 5
5. Adjustment for Provider Vaccination History Nonresponse Using Adjustment Cells
T o adjust coverage estimates for ‘‘provider vaccination history nonresponse bias,’’ adjustment
cells can be formed using response propensities obtained from a logistic regression model with a binary response variable indicating whether or not a child has adequate provider data.
Within each IAP area, sampled children can be grouped into adjustment cells according to the similarity of their response propensities to have a provider-reported vaccination history. A group of children who have similar response propensities will also be similar with respect to variables that are strongly associated with the probability of having a provider-reported vaccination history. In this important respect, children within each adjustment cell are comparable. Because of this, all sampled children in the cell may be represented by the sampled children within the cell who have adequate provider-reported immunization histories. In particular, by dividing the RDD phase sampling weights of children with adequate provider data by the cell’s weighted response rate, these children’s weights are adjusted to represent all of the children belonging to the cell. By doing this, the bias in estimated vaccination coverage rates attributable to differences between sampled children who have and do not have provider-reported immunization histories can be reduced. Within each adjustment cell, children without adequate provider-reported vaccination data are represented by children who are similar to them with respect to their response propensities and other associated variables.
Section 5.1 describes the variables that were found to be associated with their response propensities. Section 6 provides results that show how large the reduction in bias can be by using these
variables to estimate their response propensities.
5.1 Model Development As a first step in forming the
response propensity adjustment cells, a national response propensity model was developed using logistic regression. The response propensity is the probability that a sampled child has a provider-reported vaccination history.
Within each IAP area, the RDD phase sampling weights were first rescaled to add to the IAP area specific sample size. This was done by multiplying each sampling weight by the unweighted sample size within the IAP area and dividing by the sum of the weights within the IAP area. Inclusion of these rescaled weights as prior weights in the logistic regression ensures that as the sample size increases to the finite population size, the estimated logistic coefficients converge to the true finite population values. This property holds provided the logistic model and its linear predictors give a correct depiction for the target population of why provider vaccination histories are missing.
As candidates for predictors to the response propensity model, variables were used that have been found to be associated with immunization status in other research conducted by CDC (17) using the NIS. The variables used as candidates for the model are described in table 2. Forward stepwise logistic regression was used to select predictors among these candidates. S-PLUS 2000 (18) was used for all calculations.
At each step of the stepwise selection process, the logistic regression model examined all possible and allowable interactions between predictors. Also, at each step after adding regressors to the model, the model selection method reexamined each regressor included in the model to determine whether any predictor that entered at a previous step of the process could be dropped. Akaike’s (18) Information Criterion (AIC) statistic was used as the criterion by which the optimal set of candidate regressors was chosen or retained at each step of the process.
Results of the stepwise selection process applied to all 32,511 children for which completed RDD interviews were obtained in 1998 are given in table 3. Akaike’s statistic provides a measure of goodness of fit of a model, corrected for the number of parameters used in the model. Within this framework, a model with minimum AIC provides the best fit of the model to the data. Deviance provides a related measure of goodness of fit measured on the –2 x log likelihood scale. The asymptotic distribution of the difference of deviances for two nested models is known to have a chi-square distribution with degrees of freedom equal to the difference in the number of parameters indexing the two models. Table 3 lists the chi-square values and degrees of freedom associated with adding a predictor at each step of the stepwise model selection process. McCullagh and Nelder (20) provide a further discussion on the use of the deviance as a way of evaluating the statistical significance of predictors in a model.
Using a reference cell parameterization in which the first level of each variable in table 2 is the variable’s reference level, table 4 lists the estimated odds ratios, estimated log-odds, and associated standard errors of the predictors selected in the stepwise procedure. Twenty-nine predictors were selected in the stepwise procedure. Examining the estimated odds ratios in table 4, children were found to be less likely to have adequate provider data if the respondent does not know or indicates that the child is not up-to-date on his or her vaccinations. Children for whom a shot card was not used during the interview are less likely to have adequate provider data. If the respondent was not the mother, the child is also less likely to have adequate provider data. With respect to socioeconomic and demographic factors, children below poverty are less likely to have adequate provider data, and children with a non-Hispanic white mother are more likely to have adequate provider data. If the mother was living in a different State at the time the child was born, the child is

Page 6 [ Series 2, No. 133
�
less likely to have provider data, and children in households with more than one child are more likely to have adequate provider data.
Using the final national model obtained from the variable selection process, predicted response propensities were obtained for each sampled child within each IAP area, adjustment cells were formed, and the boundaries were defined by quantiles of the distribution of the predicted response propensities of children belonging to the IAP area. Within each IAP area, each sample child can be assigned to one of the IAP area-specific adjustment cells. The following subsection describes how an ‘‘optimal’’ choice for the number of adjustment cells can be determined.
5.2 A Sequential Method for Choosing the ‘‘Optimal’’ Number of Adjustment Cells
Yansaneh and Eltinge (9) and Eltinge and Yansaneh (10) have described methods for choosing the number of adjustment cells for the purposes of bias reduction for the case in which cells are constructed using response propensities. For the NIS data, this method proceeds in a sequence of stages within each IAP area.
At stage k, k =2, . . ., the estimated ^ vaccination coverage rate yk obtained
by using k adjustment cells is compared^ with the estimated rate yk–1 obtained
using k–1 adjustment cells. The estimated incremental bias reduction obtained by increasing the number of adjustment cells from k–1 to k is
^ ^ ^ ∆k = Yk – Yk–1
and the estimated standard error of the estimated bias is
^ ^ ^ ^ ^ ^ ^ ^ ^^ (�k) = [V(Yk) + V(Yk–1) – 2C(Yk,Yk–1)]1/2
This estimated standard error is calculated using a Taylor series linearization to the estimated variance (21).
^ Let Y1 denote the estimated
vaccination coverage rate that uses only
� �
one adjustment cell. This estimate is obtained by dividing the first phase sample weights of children with adequate provider data by the overall weighted response rate. By using only one adjustment cell, no attempt is made to group children together that are comparable for achieving bias reduction.
^ As a result, the estimate Y1 is referred to as the ‘‘unadjusted’’ estimate.
As discussed previously, estimates of vaccination coverage that are not adjusted for provider vaccination history may be too high. Because of this, there
^ is particular interest in estimates Yk that
^ yield negative values of ∆k that measures the extent to which the estimate corrects the positive bias by using one more adjustment cell. Because of this, one should compute 1-sided p-values
^ pk = � ( ^ (
� ^k
k))
to evaluate the significance of the incremental bias correction for each value of k. Here, Φ (z) denotes the standard normal cumulative distribution function. The ‘‘best ’’ value of k is defined as the smallest value k≠ such that pl <0.05 l = 2, . . ., k≠ and pk≠+1 >0.05. One method of choosing the number of adjustment cells in each stratum is to find the ‘‘optimal’’ value of k for each stratum.
In addition to evaluating the incremental reduction in bias from stage to stage, one can use the incremental change in mean squared error (MSE) to evaluate the trade-off between bias and
^ variance. Specifically, letting Vn denote the estimated variance of the coverage estimate at stage n,
^ ^ VnY = n ^ ^ ^
Vn–1 + (Yn –Yn–1)2
denotes the relative mean squared error using n adjustment cells compared to using n–1 adjustment cells.
5.3 Raking to Control Bias As discussed previously, by
dividing the RDD phase sampling weights of children who had
provider-reported immunization histories by their adjustment cell specific weighted response rate, these children should fairly represent all of the children in the cell as a whole. However, the revised weights may not match poststratification totals used to construct the RDD phase sampling weights. Also, the revised weights may not match the RDD phase sample weighted totals of variables that are known to be important predictors of being up-to-date.
To reduce bias attributable to these differences and to maintain the nonresponse bias adjustment, within each stratum, the revised weights are raked to match the poststratification totals and totals of a few other variables that are known to be associated with being up-to-date. Also, the adjustment cell specific RDD phase sampling weight totals are raked to maintain the effect of the nonresponse adjustment. Table 5 lists the poststratification and other variables used for raking.
5.4 Estimators for Vaccination Coverage of a Subpopulation and Its Variance
This section describes the estimators used for a ratio and its estimated variance for a subdomain of the target population when the sampling design corresponds to a stratified 1-stage cluster sampling design as is used in the NIS (i.e., households are sampled and all age-eligible children are selected).
Among households with eligible children with adequate provider data, let
Nh = the number of primary sampling units (PSUs, or households in the case of the NIS) in stratum h, h=1, . . ., L
nh = the number of PSUs sampled in stratum h, h=1, . . ., L
Mhi = the number of children in PSU i of stratum h belonging to the target population
mhi = the number of eligible children sampled in the ith PSU in stratum h

Series 2, No. 133 [ Page 7
Whij = the provider nonresponse adjusted sampling weight for the jth sampled child with adequate provider data sampled in the ith sampled PSU of stratum h
Yhij = 0 when child j with adequate provider data in PSU i in stratum h is not up-to-date on a specific vaccination, and Yhij=1 when the child is up-to-date
δhij = 1 when subject j with adequate provider data in PSU i in stratum h belongs to the domain of interest, and δhij=0 otherwise
Y≠hij = 0 when the jth sampled child with adequate provider data in the ith sampled PSU in stratum h is not up-to-date on a specific vaccination, and Y≠hij=1 when the child is up-to-date
δ≠hij = 1 when the jth sampled child with adequate provider data in the ith sampled PSU in stratum h belongs to the domain of
interest, and δhij ≠ =0, otherwise
Nh Mhhi
Letting Yh = ∑∑ δhij Yhij, i=1 j=1
Nh Mhhi
and Th = ∑∑ δhij , i=1 j=1
the true but unknown vaccination coverage rate is
L
∑Yh h=1
θ = L
∑Th h=1
nn mhi
^ ≠ ≠Let Yh = ∑∑ δhij Whij Yhig
i=1 j=1
nn mhi^ ≠and Th = ∑ ∑ δhij Whij . i=1 j=1
Then the combined ratio estimator of the vaccination coverage rate for the domain of interest is
L ^∑Yh
^ h=1θ =
L ^∑Th
h=1 (2)
To obtain an estimator of the variance of equation 2, a Taylor series approximation (21) is used. Letting
≠ ^ δhij Whij (Yhij – θ)Zhij = ^ Th
denote the linearized value of equation 2 and
nh
∑Zhi mhi
i=1 letting Zhi = ∑ Zhij , and Zh = nh
j=1
the Taylor series approximation for the ^ estimator of the variance of θ is
L nh nh^ VT (θ ) = ∑ nh–1 ∑ (Zhi –Zh)
2
h=1 i=1
6. Illustration and Evaluation of the Methods
6.1 Illustration of Sequential Method to Determine ‘‘Optimal’’ Number of Adjustment Cells and to Evaluate Provider-Verified Vaccination History Nonresponse Bias
Table 6 gives an example of the strategy of selecting the ‘‘optimal’’ value of k using the sequential method described in Section 5.3 for the 4:3:1:3 series for one IAP area—Illinois-Rest of State (that is, Illinois except for the city of Chicago). This table shows that a statistically significant reduction in bias can be accrued by using two adjustment cells and that no further significant reduction in bias is obtained by using
three or more adjustment cells. Overall, in going from no adjustment to two adjustment cells, bias is reduced by 0.5%. Also, table 6 shows the incremental change in relative
^efficiency, γk. This table shows that the the relative efficiency decreases modestly by 3% by using two adjustment cells.
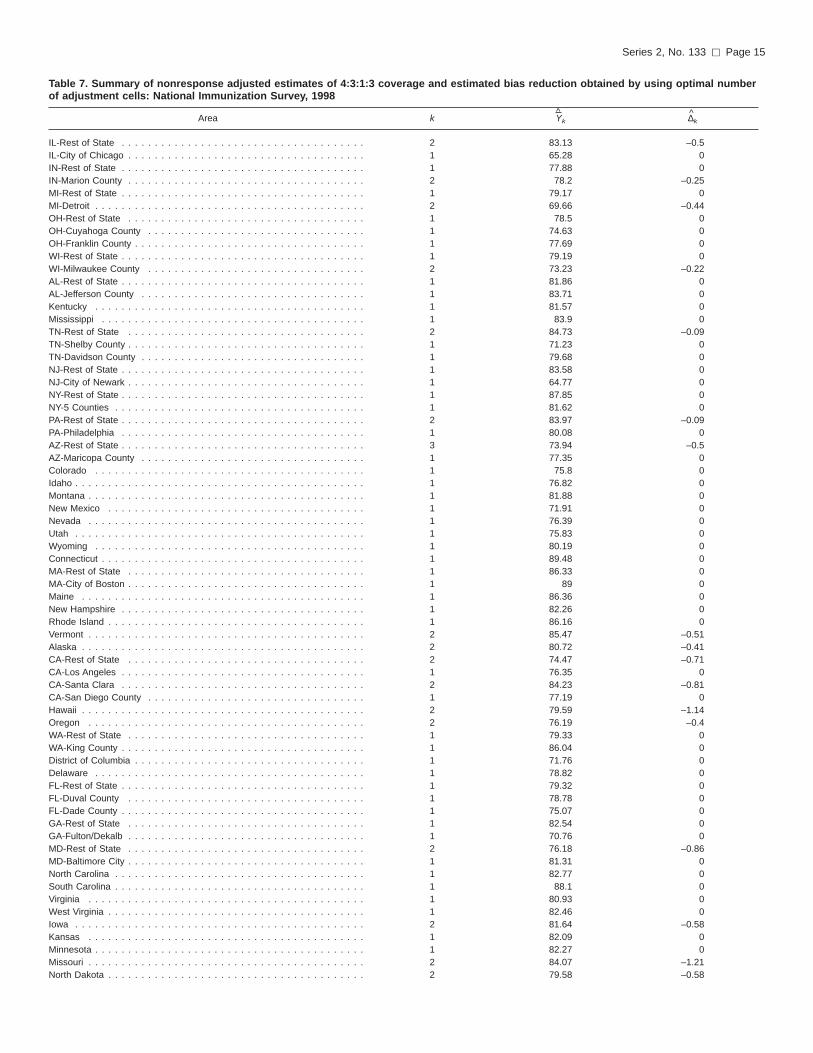
Table 7 summarizes the ‘‘optimal’’ choice of the k for each IAP area. This table shows that only two or three adjustment cells formed using response propensities are required when the ‘‘optimal’’ value of k > 1. Also, this table shows that the ‘‘optimal’’ value of k is equal to 1 for 57 of the 78 IAP areas. In 1998, 27% of all the children 19–35 months of age lived in the IAP areas in which more than one adjustment cell was designated as the ‘‘optimal’’ choice of k. Also, for the 1998 NIS, for IAP areas in which more than one adjustment cell is specified as the ‘‘optimal’’ value, the decrease in bias from the unadjusted value is on the order of 0.5%. This indicates that the extent to which bias can be reduced using adjustment cells formed using response propensities is small.
6.2 Evaluation of Difference in Bias Reduction Obtained Using ‘‘Optimal’’ Choice for Number of Adjustment Cells, Compared With Using Five Adjustment Cells Within Each Stratum
Cochran (22) published an influential paper describing the use of stratification to control bias in observational studies. Empirical results of his investigation indicated that approximately 90% of the bias is reduced by using five strata. As a result of this empirical finding, a ‘‘lore’’ has been developed among statistical practitioners that indicates that five is a good choice for the number of adjustment cells that should be used to reduce bias. Also, work
Page 8 [ Series 2, No. 133
-5 -4 -3 -2 -1 0 2 4
West Virginia
Iowa Alaska
Maryland District of Columbia
South Carolina Connecticut Maine New Hampshire Kentucky Missouri
New York New Jersey Michigan
Wyoming Virginia
Massachusetts
Minnesota
Mississippi
Washington
Pennsylvania
Vermont Nebraska North Carolina Georgia Louisiana
Texas
North Dakota Rhode Island
Illinois
Wisconsin Oregon
Ohio Delaware
South Dakota Tennessee
Montana Kansas
Alabama
Utah Arkansas
Florida Colorado
Indiana Idaho
New Mexico Oklahoma Arizona
California
Hawaii Nevada
Difference in percent
1 3
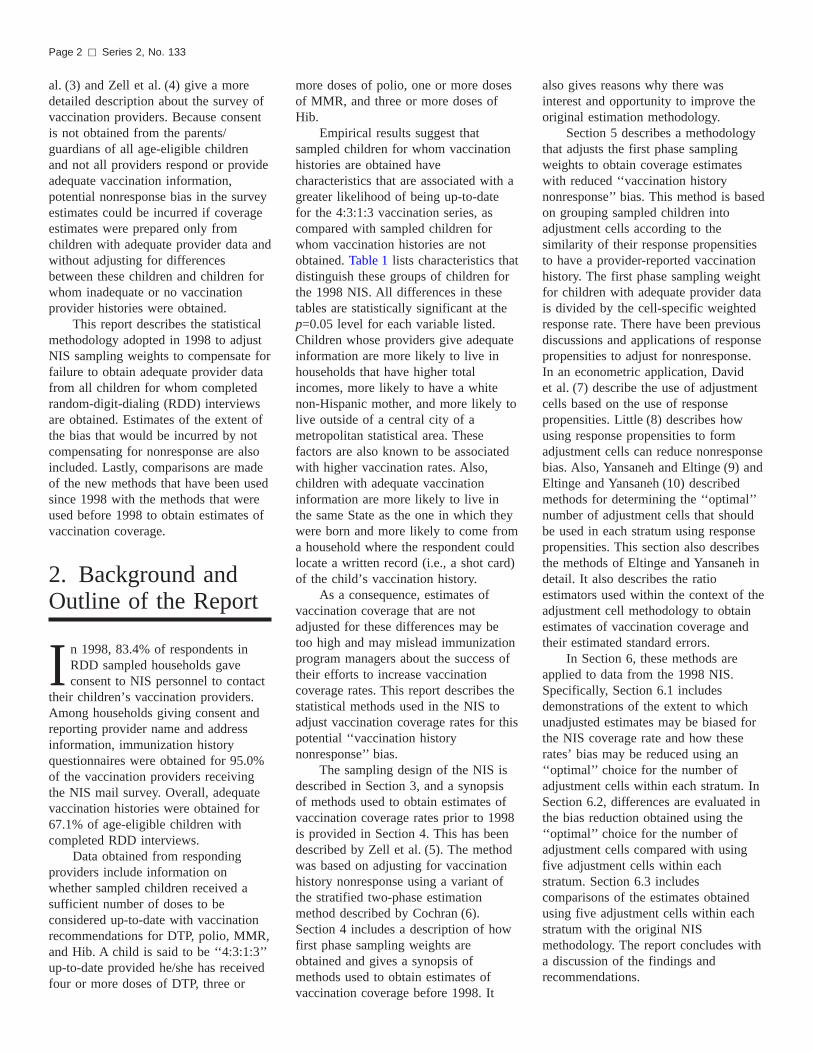
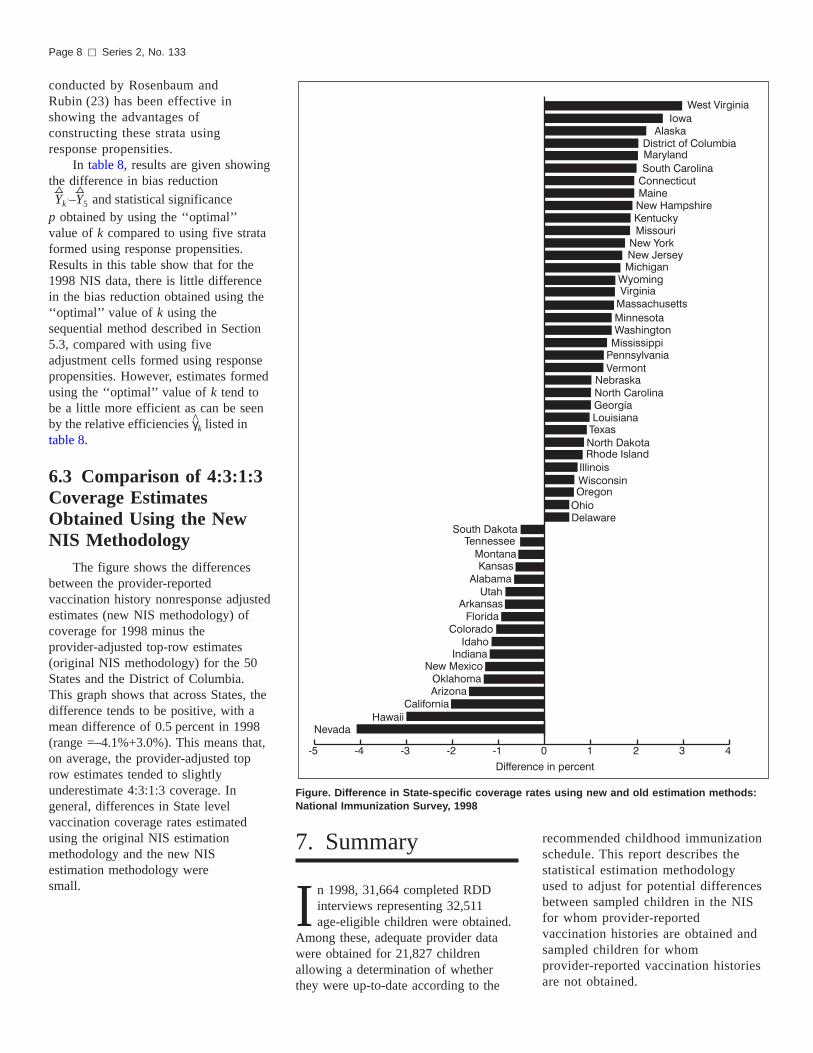
Figure. Difference in State-specific coverage rates using new and old estimation methods: National Immunization Survey, 1998
conducted by Rosenbaum and Rubin (23) has been effective in showing the advantages of constructing these strata using response propensities.
In table 8, results are given showing the difference in bias reduction ^ ^Yk≠–Y5 and statistical significance
p obtained by using the ‘‘optimal’’ value of k compared to using five strata formed using response propensities. Results in this table show that for the 1998 NIS data, there is little difference in the bias reduction obtained using the ‘‘optimal’’ value of k using the sequential method described in Section 5.3, compared with using five adjustment cells formed using response propensities. However, estimates formed using the ‘‘optimal’’ value of k tend to be a little more efficient as can be seen
^ by the relative efficiencies γk listed in table 8.
6.3 Comparison of 4:3:1:3 Coverage Estimates Obtained Using the New NIS Methodology
The figure shows the differences between the provider-reported vaccination history nonresponse adjusted estimates (new NIS methodology) of coverage for 1998 minus the provider-adjusted top-row estimates (original NIS methodology) for the 50 States and the District of Columbia. This graph shows that across States, the difference tends to be positive, with a mean difference of 0.5 percent in 1998 (range =–4.1%+3.0%). This means that, on average, the provider-adjusted top row estimates tended to slightly underestimate 4:3:1:3 coverage. In general, differences in State level vaccination coverage rates estimated using the original NIS estimation methodology and the new NIS estimation methodology were small.
7. Summary
I n 1998, 31,664 completed RDD interviews representing 32,511 age-eligible children were obtained.
Among these, adequate provider data were obtained for 21,827 children allowing a determination of whether they were up-to-date according to the
recommended childhood immunization schedule. This report describes the statistical estimation methodology used to adjust for potential differences between sampled children in the NIS for whom provider-reported vaccination histories are obtained and sampled children for whom provider-reported vaccination histories are not obtained.

Series 2, No. 133 [ Page 9
In the first step of the estimation methodology, a national logistic model of the propensity to have adequate provider data is obtained and estimated response propensities are obtained for all children with completed household RDD interviews. It is noted that the purpose of the logistic model is to rank children within each stratum with respect to their estimated response propensity. In this regard, a logistic model that includes stratum main effects would yield the same ranking within each stratum as a national model that does not include stratum main effects. Thus, a national model is sufficient to obtain this ranking provided there are no interactions of stratum effects with other variables that are predictive of the probability of having adequate provider data. Significant interactions with stratum effects were not detected in the analyses. Thus, a national model to estimate response propensities is suitable for obtaining a ranking of children within each stratum of the NIS sampling design.
In the second step of the estimation methodology, these ranked estimated response propensities were used to assign each sampled child to 1 of 5 adjustment cells formed using the quintiles of the distribution of estimated response propensities within each stratum. Next, within each adjustment cell in each stratum, sampling weights of children with adequate provider data were divided by the cell-specific weighted response rate to allow these children to represent all children in the adjustment cell. Finally, these adjusted sampling weights were raked to match the poststratification population control totals and totals of a few other variables that are known to be associated with being up-to-date.
Currently, official estimates of vaccination coverage rates are based on five adjustment cells within each stratum. To evaluate whether the use of five adjustment cells was sufficient to reduce bias attributable to differences between children with and without provider data, an investigation was conducted comparing the reduction in estimated bias obtained using five adjustment cells compared with an ‘‘optimal’’ number of cells in each
stratum. Using an ‘‘optimal’’ choice for the
number of adjustment cells within each stratum, results indicated that for the 1998 NIS, the overall bias reduction was 0.5 percent. These results indicate that in 1998, provider-vaccination history nonresponse bias was small. Also, no statistically significant differences were obtained in the vaccination coverage estimates by comparing estimates based on an ‘‘optimal’’ choice of the number of adjustment cells per stratum, compared with using five adjustment cells formed using the quintiles of the distribution of estimated response propensities within each stratum. Further, no important substantive differences were observed between estimates based on the methodology used prior to 1998 and the methodology adopted in 1998.
There are several methods to compensate for missing data and nonresponse in surveys. The level of nonresponse bias reduction may vary by the methodology used. The weighting adjustment procedure adopted in 1998 was selected, in part, to make the NIS estimation methodology as user-friendly as possible, thus permitting the use of commonly available and easy-to-use statistical software for the analysis of complex survey data. This was the primary motivation for adopting the new methodology.
In comparison with the two-phase estimation methodology used for the NIS before 1998, the approach described in this report offers several advantages. First, bias in NIS survey estimates attributable to using national information from top-row children in each State and IAP area estimates is reduced. However, it is noted that this bias was very small, in general. Secondly, compared with the two-phase sampling estimation approach, the method adopted in 1998 adjusts for provider nonresponse using a broad range of predictor variables. In the many strata in which only one adjustment cell is required, this feature makes no difference. However, for strata requiring more than one adjustment cell, this is important. These variables have been selected because they are highly predictive of the probability of provider nonresponse, the factor required to
adjust the sampling weights of children with adequate provider data so that they can represent the target population without incurring bias attributable to differences between children for whom adequate provider data were obtained and children for whom inadequate or no provider data were obtained.
The main conclusions of this report are that the vaccination coverage estimates based on the new estimation methodology are not that different from those based on the original methodology. In addition, little adjustment is required to account for differences between children for whom adequate provider data were obtained and children for whom inadequate or no provider data were obtained. Most importantly, however, the new methodology facilitates the preparation of analytical data files for use by analysts undertaking complex and important epidemiological analyses using available statistical software.
Philip J. Smith can be contacted at the Centers for Disease Control and Prevention, National Immunization Program, 1600 Clifton Road, NE, Mailstop E-62, Atlanta, Georgia 30333 USA. His telephone number is (404) 639–8729. His e-mail address is [email protected].
References
1. Ezzati-Rice TM, Zell ER, Massey JT, Nixon MG. Improving the assessment of vaccination coverage rates with the use of both household and medical provider data. Proceedings of the Section on Survey Research Methods of the American Statistical Association, 335–340. 1996.
2. Ezzati-Rice TM, Zell ER, Battaglia MP, et al. The design of the National Immunization Survey. Proceedings of the Section on Survey Research Methods of American Statistical Association, 668–672. 1995.
3. Zell ER, Ezzati-Rice TM, Battaglia MP, Wright RA. National Immunization Survey: The methodology of a vaccination surveillance system. Public Health Reports, 115(1):65–77. 2000.
4. Zell ER, Ezzati-Rice TM, Hoaglin DC, Massey JT. Adjusting for respondent bias on vaccination status in a

Page 10 [ Series 2, No. 133
telephone survey. Proceedings of the Section on Survey Research Methods of the American Statistical Association, 684–689. 1995.
5. Cochran WG. Sampling techniques, 3rd ed. John Wiley: New York. 1997.
6. David MH, Little RJA, Samuhel M, Triest R. Nonrandom nonresponse models based on the propensity to respond. Proceedings of the Business and Economics Section of the American Statistical Association. pp. 168–173. 1983.
7. Little RJA. Survey nonresponse adjustments for estimates of means. International statistical review. 54(2):139–157. 1986.
8. Yansaneh IS, Eltinge JL. Construction of adjustment cells based on surrogate items or estimated response propensities. Proceedings of the Section on Survey Research Methods of the American Statistical Association. pp. 538–543. 1993.
9. Eltinge JL, Yansaneh IS. Diagnostics for formulation of nonresponse adjustment cells with an application to income nonresponse in the U.S. Consumer Expenditure Survey. Survey methodology, 23(1):33–40. 1996.
10. Lepkowski JM. Telephone sampling methods in the United States. Telephone survey methodology. Groves RM, Biemer PP, Lysberg LE, et al. (eds.) John Wiley: New York. 1988.
11. Battaglia MP, Starer A, Oberkofler J, Zell ER. Pre-identification of nonworking and business telephone numbers in list-assisted random-digit-dialing samples. Proceedings of the Section on Survey Research Methods of the American Statistical Association, pp. 957–962. 1995.
12. Frankel MR, Srinath KP, Battaglia MP, et al. Reducing nontelephone bias in RDD surveys. Proceedings of the Section on Survey Research Methods of the American Statistical Association, pp. 934–939. 1999.
13. Hoaglin DC, Battaglia MP. A comparison of two methods of adjusting for noncoverage of nontelephone households in a telephone survey. Proceedings of the Section on Survey Research Methods of the American Statistical Association, pp. 497–501. 1996.
14. Battaglia MP, Malec DJ, Spencer BD, et al. Adjusting for noncoverage of nontelephone households in the National Immunization Survey. Proceedings of the Section on Survey Research Methods of the American Statistical Association, pp. 678–683. 1995.
15. Smith PJ, Battaglia MP, Huggins V, et al. Overview of the sampling design and the statistical methods used in the National Immunization Survey. Am J Prev Med, pp. 61–68. 2001.
16. Coronado VG, Maes EF, Rodewald LE, et al. Risk factors for underimmunization among 19–35-month-old children in the United States: National Immunization Survey, July 1996–June 1998. Unpublished manuscript, Centers for Disease Control and Prevention: Atlanta, GA. 2000.
17. S-PLUS 2000 user’s guide, Data Analysis Products Division, Mathsoft: Seattle, WA.
18. Akaike H. Information theory and an extension of the maximum likelihood principle. Petrov BN, Csaki F. (eds.), in Second International Symposium on Information Theory, Akademia Kiado, Budapest, Hungary, pp. 267–281. 1973.
19. McCullagh P, Nelder JA. Generalized linear models, 2nd ed. New York: Chapman and Hall. 1989.
20. Wolter K. Introduction to variance estimation. Springer-Verlag: New York. 1985.
21. Cochran WG. The planning of observational studies of human populations. J Royal Stat Society, 182:234–255. 1968.
22. Rosenbaum PR, Rubin DB. Reducing bias in observational studies using subclassification on the propensity score. J Am Stat Assoc, 79:516–524. 1983.

Series 2, No. 133 [ Page 1
Table 1. Percent of children with selected characteristics by provider data status: National Immunization Survey, 1998
Children Children with without
Characteristic provider data provider data
Percent
Above poverty, household income less than $75,000 . . . . . . . . . . . . . . . . . . . 56 47 Household used a shot card during RDD interview1 . . . . . . . . . . . . . . . . . . . . 51 38 Household respondent was the mother . . . . . . . . . . . . . . . . . . . . . . . . . . . . 88 81 Household moved out of State since child’s birth . . . . . . . . . . . . . . . . . . . . . . 8 14 Household is located in a central city . . . . . . . . . . . . . . . . . . . . . . . . . . . . . 43 46 Race of the mother is white, non-Hispanic . . . . . . . . . . . . . . . . . . . . . . . . . . 67 60
Number
Unweighted sample size . . . . . . . . . . . . . . . . . . . . . . . . . . . . . . . . . . . . . 21,827 10,684
1RDD is random-digit-dialing.
NOTE: All differences are statistically significant at the p = 0.05 level.
Table 2. Variables in the model selection for the response propensity model: National Immunization Survey, 1998
Name ofvariable Predictor description and factor levels
all4shot Household report of up-to-date on 4:3:1:3 (4+ DTP, 3+ POL, 1+ MCV, and 3+ Hib)
1 Yes — R
2 No 3 Don’t know, refused, missing
c5 Relationship of the household respondent to the child (mother, father, or other)
1 Mother (step, foster, adoptive) or female guardian — R 2 Father (step, foster, adoptive) or male guardian 3 Other 4 Missing
childnm Number of children under 18 years of age living in the household
1 1 child — R 2 2–3 children3 4 or more children
educ1 Educational status of the mother1 Less than 12 years — R2 12 years3 More than 12 years, noncollege graduate4 College graduate
full.cpo Household report of up-to-date on varicella1 Yes — R 2 No3 Missing
full.hep Household report of up-to-date on hepatitis1 Yes — R 2 No3 Missing
incpov1 Poverty status1 Above, $75,000 or more — R2 Above, less than $75,0003 Below4 Unknown
m.agegrp Maternal age group1 Less than 19 years — R2 20–29 years3 30 years and over
Name ofvariable Predictor description and factor levels
marital Marital status of the mother1 Widowed/divorced/separated — R2 Never married3 Married4 Deceased
mobil Mobility status1 Moved, different State — R2 Did not move from different State
MSA1 Household within central city MSA, suburban, or nonmetropolitan area
1 MSA, central city — R 2 MSA, noncentral city 3 Non-MSA
racekid Race of the child
1 Hispanic — R 2 White, non-Hispanic 3 Black, non-Hispanic 4 American Indian, non-Hispanic 5 Asian, non-Hispanic 6 Other, non-Hispanic
racemom Race of the mother 1 Hispanic — R 2 White, non-Hispanic 3 Black, non-Hispanic 4 American Indian, non-Hispanic 5 Asian, non-Hispanic 6 Other, non-Hispanic
sex Gender of the child 1 Male — R 2 Female
shotcard Household reported immunization status was obtained using a ‘‘shot’’ card
1 Shot card used during RDD interview — R 2 Shot card not used during RDD interview
1MSA
is metropolitan statistical area.
NOTE: R identifies reference level.

123456789
10
Page 12 [ Series 2, No. 133
Table 3. Results of the stepwise variable selection procedure for the response propensity model
Akaike’s Variable Degrees of information
Step added freedom Chi-square criterion
36,909 + incpov1 + shotcard + c5 + mobil + msa + full.hep + racemom + educ1 + childnm
11 + m.agegrp 12 + full.cpo 13 + all4shot 14 + sex
3 581.8 36,333 1 431.9 35,903 3 248.7 35,660 1 155.0 35,507 2 109.2 35,402 2 57.6 35,349 5 52.8 35,306 3 27.3 35,284 2 19.1 35,269 2 15.7 35,258 2 12.0 35,250 2 11.4 35,242 1 2.6 35,242
NOTE: Final model for response variable y, indicating whether a sample child has adequate provider data: y = incpov1 + shotcard + c5 + mobil + msa + full.hep + racemom + educ1 + childnm + m.agegrp + full.cpo + all4shot + sex.

Series 2, No. 133 [ Page 13
Table 4. Estimated log-odds and associated standard errors of the predictors selected in the stepwise procedure for the final model: National Immunization Survey, 1998
Odds Log-odds Standard Variable ratio ratio error t-value p-value1
Intercept . . . . . . . . . . . . . . . . . . . . . . . . . . . . . . . . . . . . . . . . . . . . . . . . . 2.97 1.09 0.11 10.36 <0.01
Household report of up-to-date on 4:3:1:3
Yes . . . . . . . . . . . . . . . . . . . . . . . . . . . . . . . . . . . . . . . . . . . . . . . . . . . . 1.00 0.00 No . . . . . . . . . . . . . . . . . . . . . . . . . . . . . . . . . . . . . . . . . . . . . . . . . . . . 0.91 –0.09 0.03 –2.86 <0.01 Don’t know, refused, missing . . . . . . . . . . . . . . . . . . . . . . . . . . . . . . . . . . . . 0.85 –0.16 0.04 –3.65 <0.01
Relationship of the household respondent to the child
Mother . . . . . . . . . . . . . . . . . . . . . . . . . . . . . . . . . . . . . . . . . . . . . . . . . . 1.00 0.00 Father . . . . . . . . . . . . . . . . . . . . . . . . . . . . . . . . . . . . . . . . . . . . . . . . . . 0.74 –0.30 0.04 –7.45 <0.01 Other (neither father nor mother) . . . . . . . . . . . . . . . . . . . . . . . . . . . . . . . . . . 0.62 –0.48 0.07 –6.70 <0.01 Missing . . . . . . . . . . . . . . . . . . . . . . . . . . . . . . . . . . . . . . . . . . . . . . . . . 0.04 –3.18 0.43 –7.32 <0.01
Number of children under 18 years of age living in the household
1 child . . . . . . . . . . . . . . . . . . . . . . . . . . . . . . . . . . . . . . . . . . . . . . . . . . 1.00 0.00 2–3 children . . . . . . . . . . . . . . . . . . . . . . . . . . . . . . . . . . . . . . . . . . . . . . 1.16 0.15 0.03 4.97 <0.01 4 or more children . . . . . . . . . . . . . . . . . . . . . . . . . . . . . . . . . . . . . . . . . . . 1.09 0.09 0.05 1.94 0.05
Educational status of the mother
Less than 12 years . . . . . . . . . . . . . . . . . . . . . . . . . . . . . . . . . . . . . . . . . . 1.00 0.00 12 years . . . . . . . . . . . . . . . . . . . . . . . . . . . . . . . . . . . . . . . . . . . . . . . . . 0.84 –0.17 0.05 –3.80 <0.01 More than 12 years, noncollege graduate . . . . . . . . . . . . . . . . . . . . . . . . . . . . 0.85 –0.16 0.05 –3.31 <0.01 College graduate . . . . . . . . . . . . . . . . . . . . . . . . . . . . . . . . . . . . . . . . . . . 0.88 –0.13 0.05 –2.64 0.01
Household report of up-to-date on varicella
Yes . . . . . . . . . . . . . . . . . . . . . . . . . . . . . . . . . . . . . . . . . . . . . . . . . . . . 1.00 0.00 No . . . . . . . . . . . . . . . . . . . . . . . . . . . . . . . . . . . . . . . . . . . . . . . . . . . . 0.91 –0.09 0.03 –3.35 <0.01 Missing . . . . . . . . . . . . . . . . . . . . . . . . . . . . . . . . . . . . . . . . . . . . . . . . . 0.99 –0.01 0.05 –0.16 0.87
Household report of up-to-date on Hepatitis B
Yes . . . . . . . . . . . . . . . . . . . . . . . . . . . . . . . . . . . . . . . . . . . . . . . . . . . . 1.00 0.00 No . . . . . . . . . . . . . . . . . . . . . . . . . . . . . . . . . . . . . . . . . . . . . . . . . . . . 0.82 –0.20 0.03 –5.83 <0.01 Missing . . . . . . . . . . . . . . . . . . . . . . . . . . . . . . . . . . . . . . . . . . . . . . . . . 0.91 –0.10 0.05 –1.94 0.05
Poverty status
Above, $75,000 or more . . . . . . . . . . . . . . . . . . . . . . . . . . . . . . . . . . . . . . . 1.00 0.00 Above, less than $75,000 . . . . . . . . . . . . . . . . . . . . . . . . . . . . . . . . . . . . . . 0.94 –0.06 0.04 –1.31 0.19 Below poverty . . . . . . . . . . . . . . . . . . . . . . . . . . . . . . . . . . . . . . . . . . . . . 0.86 –0.15 0.05 –2.77 0.01 Unknown . . . . . . . . . . . . . . . . . . . . . . . . . . . . . . . . . . . . . . . . . . . . . . . . 0.44 –0.81 0.05 –15.60 <0.01
Maternal age group
19 years or younger . . . . . . . . . . . . . . . . . . . . . . . . . . . . . . . . . . . . . . . . . 1.00 0.00 20–29 years . . . . . . . . . . . . . . . . . . . . . . . . . . . . . . . . . . . . . . . . . . . . . . 0.80 –0.22 0.07 –3.02 <0.01 30 years and over . . . . . . . . . . . . . . . . . . . . . . . . . . . . . . . . . . . . . . . . . . . 0.77 –0.27 0.08 –3.52 <0.01
Mobility status
Moved from different State . . . . . . . . . . . . . . . . . . . . . . . . . . . . . . . . . . . . . 1.00 0.00 Did not move from different State . . . . . . . . . . . . . . . . . . . . . . . . . . . . . . . . . 1.67 0.51 0.04 12.18 <0.01
Household within central city MSA,2 suburban, or nonmetropolitan area
MSA,2 central city . . . . . . . . . . . . . . . . . . . . . . . . . . . . . . . . . . . . . . . . . . . 1.00 0.00 MSA,2 noncentral city . . . . . . . . . . . . . . . . . . . . . . . . . . . . . . . . . . . . . . . . 0.94 –0.06 0.03 –1.92 0.05 Non-MSA2 . . . . . . . . . . . . . . . . . . . . . . . . . . . . . . . . . . . . . . . . . . . . . . . 1.32 0.28 0.04 7.38 <0.01
Race of the mother
Hispanic . . . . . . . . . . . . . . . . . . . . . . . . . . . . . . . . . . . . . . . . . . . . . . . . . 1.00 0.00 White, non-Hispanic . . . . . . . . . . . . . . . . . . . . . . . . . . . . . . . . . . . . . . . . . 1.18 0.17 0.04 3.93 <0.01 Black, non-Hispanic . . . . . . . . . . . . . . . . . . . . . . . . . . . . . . . . . . . . . . . . . . 0.89 –0.12 0.05 –2.47 0.01 American Indian, non-Hispanic . . . . . . . . . . . . . . . . . . . . . . . . . . . . . . . . . . . 1.06 0.06 0.11 0.53 0.59 Asian, non-Hispanic . . . . . . . . . . . . . . . . . . . . . . . . . . . . . . . . . . . . . . . . . . 0.98 –0.02 0.07 –0.24 0.81 Other race, non-Hispanic . . . . . . . . . . . . . . . . . . . . . . . . . . . . . . . . . . . . . . 1.33 0.28 0.23 1.22 0.22
See footnotes at end of table.

Page 14 [ Series 2, No. 133
Table 4. Estimated log-odds and associated standard errors of the predictors selected in the stepwise procedure for the final model: National Immunization Survey, 1998—Con.
Odds Log-odds Standard Variable ratio ratio error t-value p-value1
Gender
Male . . . . . . . . . . . . . . . . . . . . . . . . . . . . . . . . . . . . . . . . . . . . . . . . . . . 1.00 0.00 Female . . . . . . . . . . . . . . . . . . . . . . . . . . . . . . . . . . . . . . . . . . . . . . . . . 0.96 –0.04 0.03 –1.74 0.08
Household reported immunization status was obtained using a ‘‘shot’’ card
Shot card used during RDD3 interview . . . . . . . . . . . . . . . . . . . . . . . . . . . . . . 1.00 0.00 Shot card not used during interview . . . . . . . . . . . . . . . . . . . . . . . . . . . . . . . . 0.67 –0.40 0.03 –12.46 <0.01
1p-values correspond to two-sided tests. 2MSA is metropolitan statistical area. 3RDD is random-digit-dialing.
Table 5. Variables used for raking the response propensity adjusted weights of children with provider data: National Immunization Survey,
Variable name Variable description
educ11 . . . . . . . . . . . . . . Educational status of the mother racekid1 . . . . . . . . . . . . . Race of the child agegrp1 . . . . . . . . . . . . . Age group of the child sex . . . . . . . . . . . . . . . . Gender of the child frstbrn . . . . . . . . . . . . . . First born status of the child adj.cell . . . . . . . . . . . . . . Response propensity adjustment cell to which each child belongs within each IAP area
1This variable was also used to provide a postratified adjustment to the random-digit-dialing phase sampling weights.
Table 6. Illustration of method for determining optimal number of adjustment cells for Illinois-Rest of State: National Immunization Survey,
k ^ Yk ∆k pk γk
2 . . . . . . . . . . . . . 83.13 –0.5 0.03 0.97 3 . . . . . . . . . . . . . 82.73 –0.4 0.13 0.92 4 . . . . . . . . . . . . . 82.87 0.14 0.76 1.03 5 . . . . . . . . . . . . . 82.84 –0.03 0.46 0.97
k is number of adjustment cells. ^ Y is nonresponse adjusted estimate of 4:3:1:3 coverage based on k cells. ^∆k is estimated bias reduction resulting from using k cells compared with k-1 cells, k = 2, . . .
pk is p-value of the null hypothesis H : ∆k = 0.^γk is estimated relative efficiency of using k cells, compared to k-1 cells, k = 2, . . .
1998
1998
Series 2, No. 133 [ Page 15
Table 7. Summary of nonresponse adjusted estimates of 4:3:1:3 coverage and estimated bias reduction obtained by using optimal number of adjustment cells: National Immunization Survey, 1998
^ ^ Area k Yk ∆k
IL-Rest of State . . . . . . . . . . . . . . . . . . . . . . . . . . . . . . . . . . . . . 2 83.13 –0.5 IL-City of Chicago . . . . . . . . . . . . . . . . . . . . . . . . . . . . . . . . . . . . 1 65.28 0 IN-Rest of State . . . . . . . . . . . . . . . . . . . . . . . . . . . . . . . . . . . . . 1 77.88 0 IN-Marion County . . . . . . . . . . . . . . . . . . . . . . . . . . . . . . . . . . . . 2 78.2 –0.25 MI-Rest of State . . . . . . . . . . . . . . . . . . . . . . . . . . . . . . . . . . . . . 1 79.17 0 MI-Detroit . . . . . . . . . . . . . . . . . . . . . . . . . . . . . . . . . . . . . . . . . 2 69.66 –0.44 OH-Rest of State . . . . . . . . . . . . . . . . . . . . . . . . . . . . . . . . . . . . 1 78.5 0 OH-Cuyahoga County . . . . . . . . . . . . . . . . . . . . . . . . . . . . . . . . . 1 74.63 0 OH-Franklin County . . . . . . . . . . . . . . . . . . . . . . . . . . . . . . . . . . . 1 77.69 0 WI-Rest of State . . . . . . . . . . . . . . . . . . . . . . . . . . . . . . . . . . . . . 1 79.19 0 WI-Milwaukee County . . . . . . . . . . . . . . . . . . . . . . . . . . . . . . . . . 2 73.23 –0.22 AL-Rest of State . . . . . . . . . . . . . . . . . . . . . . . . . . . . . . . . . . . . . 1 81.86 0 AL-Jefferson County . . . . . . . . . . . . . . . . . . . . . . . . . . . . . . . . . . 1 83.71 0 Kentucky . . . . . . . . . . . . . . . . . . . . . . . . . . . . . . . . . . . . . . . . . 1 81.57 0 Mississippi . . . . . . . . . . . . . . . . . . . . . . . . . . . . . . . . . . . . . . . . 1 83.9 0 TN-Rest of State . . . . . . . . . . . . . . . . . . . . . . . . . . . . . . . . . . . . 2 84.73 –0.09 TN-Shelby County . . . . . . . . . . . . . . . . . . . . . . . . . . . . . . . . . . . . 1 71.23 0 TN-Davidson County . . . . . . . . . . . . . . . . . . . . . . . . . . . . . . . . . . 1 79.68 0 NJ-Rest of State . . . . . . . . . . . . . . . . . . . . . . . . . . . . . . . . . . . . . 1 83.58 0 NJ-City of Newark . . . . . . . . . . . . . . . . . . . . . . . . . . . . . . . . . . . . 1 64.77 0 NY-Rest of State . . . . . . . . . . . . . . . . . . . . . . . . . . . . . . . . . . . . . 1 87.85 0 NY-5 Counties . . . . . . . . . . . . . . . . . . . . . . . . . . . . . . . . . . . . . . 1 81.62 0 PA-Rest of State . . . . . . . . . . . . . . . . . . . . . . . . . . . . . . . . . . . . . 2 83.97 –0.09 PA-Philadelphia . . . . . . . . . . . . . . . . . . . . . . . . . . . . . . . . . . . . . 1 80.08 0 AZ-Rest of State . . . . . . . . . . . . . . . . . . . . . . . . . . . . . . . . . . . . . 3 73.94 –0.5 AZ-Maricopa County . . . . . . . . . . . . . . . . . . . . . . . . . . . . . . . . . . 1 77.35 0 Colorado . . . . . . . . . . . . . . . . . . . . . . . . . . . . . . . . . . . . . . . . . 1 75.8 0 Idaho . . . . . . . . . . . . . . . . . . . . . . . . . . . . . . . . . . . . . . . . . . . . 1 76.82 0 Montana . . . . . . . . . . . . . . . . . . . . . . . . . . . . . . . . . . . . . . . . . . 1 81.88 0 New Mexico . . . . . . . . . . . . . . . . . . . . . . . . . . . . . . . . . . . . . . . 1 71.91 0 Nevada . . . . . . . . . . . . . . . . . . . . . . . . . . . . . . . . . . . . . . . . . . 1 76.39 0 Utah . . . . . . . . . . . . . . . . . . . . . . . . . . . . . . . . . . . . . . . . . . . . 1 75.83 0 Wyoming . . . . . . . . . . . . . . . . . . . . . . . . . . . . . . . . . . . . . . . . . 1 80.19 0 Connecticut . . . . . . . . . . . . . . . . . . . . . . . . . . . . . . . . . . . . . . . . 1 89.48 0 MA-Rest of State . . . . . . . . . . . . . . . . . . . . . . . . . . . . . . . . . . . . 1 86.33 0 MA-City of Boston . . . . . . . . . . . . . . . . . . . . . . . . . . . . . . . . . . . . 1 89 0 Maine . . . . . . . . . . . . . . . . . . . . . . . . . . . . . . . . . . . . . . . . . . . 1 86.36 0 New Hampshire . . . . . . . . . . . . . . . . . . . . . . . . . . . . . . . . . . . . . 1 82.26 0 Rhode Island . . . . . . . . . . . . . . . . . . . . . . . . . . . . . . . . . . . . . . . 1 86.16 0 Vermont . . . . . . . . . . . . . . . . . . . . . . . . . . . . . . . . . . . . . . . . . . 2 85.47 –0.51 Alaska . . . . . . . . . . . . . . . . . . . . . . . . . . . . . . . . . . . . . . . . . . . 2 80.72 –0.41 CA-Rest of State . . . . . . . . . . . . . . . . . . . . . . . . . . . . . . . . . . . . 2 74.47 –0.71 CA-Los Angeles . . . . . . . . . . . . . . . . . . . . . . . . . . . . . . . . . . . . . 1 76.35 0 CA-Santa Clara . . . . . . . . . . . . . . . . . . . . . . . . . . . . . . . . . . . . . 2 84.23 –0.81 CA-San Diego County . . . . . . . . . . . . . . . . . . . . . . . . . . . . . . . . . 1 77.19 0 Hawaii . . . . . . . . . . . . . . . . . . . . . . . . . . . . . . . . . . . . . . . . . . . 2 79.59 –1.14 Oregon . . . . . . . . . . . . . . . . . . . . . . . . . . . . . . . . . . . . . . . . . . 2 76.19 –0.4 WA-Rest of State . . . . . . . . . . . . . . . . . . . . . . . . . . . . . . . . . . . . 1 79.33 0 WA-King County . . . . . . . . . . . . . . . . . . . . . . . . . . . . . . . . . . . . . 1 86.04 0 District of Columbia . . . . . . . . . . . . . . . . . . . . . . . . . . . . . . . . . . . 1 71.76 0 Delaware . . . . . . . . . . . . . . . . . . . . . . . . . . . . . . . . . . . . . . . . . 1 78.82 0 FL-Rest of State . . . . . . . . . . . . . . . . . . . . . . . . . . . . . . . . . . . . . 1 79.32 0 FL-Duval County . . . . . . . . . . . . . . . . . . . . . . . . . . . . . . . . . . . . 1 78.78 0 FL-Dade County . . . . . . . . . . . . . . . . . . . . . . . . . . . . . . . . . . . . . 1 75.07 0 GA-Rest of State . . . . . . . . . . . . . . . . . . . . . . . . . . . . . . . . . . . . 1 82.54 0 GA-Fulton/Dekalb . . . . . . . . . . . . . . . . . . . . . . . . . . . . . . . . . . . . 1 70.76 0 MD-Rest of State . . . . . . . . . . . . . . . . . . . . . . . . . . . . . . . . . . . . 2 76.18 –0.86 MD-Baltimore City . . . . . . . . . . . . . . . . . . . . . . . . . . . . . . . . . . . . 1 81.31 0 North Carolina . . . . . . . . . . . . . . . . . . . . . . . . . . . . . . . . . . . . . . 1 82.77 0 South Carolina . . . . . . . . . . . . . . . . . . . . . . . . . . . . . . . . . . . . . . 1 88.1 0 Virginia . . . . . . . . . . . . . . . . . . . . . . . . . . . . . . . . . . . . . . . . . . 1 80.93 0 West Virginia . . . . . . . . . . . . . . . . . . . . . . . . . . . . . . . . . . . . . . . 1 82.46 0 Iowa . . . . . . . . . . . . . . . . . . . . . . . . . . . . . . . . . . . . . . . . . . . . 2 81.64 –0.58 Kansas . . . . . . . . . . . . . . . . . . . . . . . . . . . . . . . . . . . . . . . . . . 1 82.09 0 Minnesota . . . . . . . . . . . . . . . . . . . . . . . . . . . . . . . . . . . . . . . . . 1 82.27 0 Missouri . . . . . . . . . . . . . . . . . . . . . . . . . . . . . . . . . . . . . . . . . . 2 84.07 –1.21 North Dakota . . . . . . . . . . . . . . . . . . . . . . . . . . . . . . . . . . . . . . . 2 79.58 –0.58

Page 16 [ Series 2, No. 133
Table 7. Summary of nonresponse adjusted estimates of 4:3:1:3 coverage and estimated bias reduction obtained by using optimal number of adjustment cells: National Immunization Survey, 1998—Con.
^ ^ Area k Yk ∆k
Nebraska . . . . . . . . . . . . . . . . . . . . . . . . . . . . . . . . . . . . . . . . . 2 76.55 –0.41 South Dakota . . . . . . . . . . . . . . . . . . . . . . . . . . . . . . . . . . . . . . 1 73.52 0 Arkansas . . . . . . . . . . . . . . . . . . . . . . . . . . . . . . . . . . . . . . . . . 3 73.16 –0.8 LA-Rest of State . . . . . . . . . . . . . . . . . . . . . . . . . . . . . . . . . . . . . 1 78.86 0 LA-Orleans Parish . . . . . . . . . . . . . . . . . . . . . . . . . . . . . . . . . . . . 2 79.15 –0.42 Oklahoma . . . . . . . . . . . . . . . . . . . . . . . . . . . . . . . . . . . . . . . . . 1 77.15 0 TX-Rest of State . . . . . . . . . . . . . . . . . . . . . . . . . . . . . . . . . . . . . 1 77.52 0 TX-Dallas County . . . . . . . . . . . . . . . . . . . . . . . . . . . . . . . . . . . . 1 72.85 0 TX-El Paso County . . . . . . . . . . . . . . . . . . . . . . . . . . . . . . . . . . . 1 77.95 0 TX-City Houston . . . . . . . . . . . . . . . . . . . . . . . . . . . . . . . . . . . . . 3 60.56 –1.04 TX-Bexar County . . . . . . . . . . . . . . . . . . . . . . . . . . . . . . . . . . . . 1 78.91 0
k is number of adjustment cells. ^ Yk is nonresponse-adjusted estimate of 4:3:1:3 coverage based on k cells. ^∆k is estimated bias reduction resulting from using k cells compared with k-1 cells, k =2, . . .

Series 2, No. 133 [ Page 17
Table 8. Statistical significance of the estimated difference in nonresponse-adjusted estimates of 4:3:1:3 coverage obtained by using optimal choice of k compared with using five adjustment cells in each IAP area: National Immunization Survey, 1998
^ ^ ^ ^ State Yk ≠ Yk ≠ – Y5 p γk
National . . . . . . . . . . . . . . . . . . AK . . . . . . . . . . . . . . . . . . . . . AL . . . . . . . . . . . . . . . . . . . . . AR . . . . . . . . . . . . . . . . . . . . . AZ . . . . . . . . . . . . . . . . . . . . . CA . . . . . . . . . . . . . . . . . . . . . CO . . . . . . . . . . . . . . . . . . . . . CT . . . . . . . . . . . . . . . . . . . . . DC . . . . . . . . . . . . . . . . . . . . . DE . . . . . . . . . . . . . . . . . . . . . FL . . . . . . . . . . . . . . . . . . . . . GA . . . . . . . . . . . . . . . . . . . . . HI . . . . . . . . . . . . . . . . . . . . . . IA . . . . . . . . . . . . . . . . . . . . . . ID . . . . . . . . . . . . . . . . . . . . . . IL . . . . . . . . . . . . . . . . . . . . . . IN . . . . . . . . . . . . . . . . . . . . . . KS . . . . . . . . . . . . . . . . . . . . . KY . . . . . . . . . . . . . . . . . . . . . LA . . . . . . . . . . . . . . . . . . . . . MA . . . . . . . . . . . . . . . . . . . . . MD . . . . . . . . . . . . . . . . . . . . . ME . . . . . . . . . . . . . . . . . . . . . MI . . . . . . . . . . . . . . . . . . . . . MN . . . . . . . . . . . . . . . . . . . . . MO . . . . . . . . . . . . . . . . . . . . . MS . . . . . . . . . . . . . . . . . . . . . MT . . . . . . . . . . . . . . . . . . . . . NC . . . . . . . . . . . . . . . . . . . . . ND . . . . . . . . . . . . . . . . . . . . . NE . . . . . . . . . . . . . . . . . . . . . NH . . . . . . . . . . . . . . . . . . . . . NJ . . . . . . . . . . . . . . . . . . . . . NM . . . . . . . . . . . . . . . . . . . . . NV . . . . . . . . . . . . . . . . . . . . . NY . . . . . . . . . . . . . . . . . . . . . OH . . . . . . . . . . . . . . . . . . . . . OK . . . . . . . . . . . . . . . . . . . . . OR . . . . . . . . . . . . . . . . . . . . . PA . . . . . . . . . . . . . . . . . . . . . RI . . . . . . . . . . . . . . . . . . . . . . SC . . . . . . . . . . . . . . . . . . . . . SD . . . . . . . . . . . . . . . . . . . . . TN . . . . . . . . . . . . . . . . . . . . . TX . . . . . . . . . . . . . . . . . . . . . UT . . . . . . . . . . . . . . . . . . . . . VA . . . . . . . . . . . . . . . . . . . . . VT . . . . . . . . . . . . . . . . . . . . . WA . . . . . . . . . . . . . . . . . . . . . WI . . . . . . . . . . . . . . . . . . . . . WV . . . . . . . . . . . . . . . . . . . . . WY . . . . . . . . . . . . . . . . . . . . .
79.4 0.19 0.01 1.19 80.72 –0.58 0.1 1 82.14 0.02 0.95 1.03 73.16 0.03 0.91 1.01 76.04 0.19 0.55 1.04 75.77 –0.08 0.79 1.01 75.79 –0.04 0.9 1.01 89.47 –0.57 0.15 0.99 71.76 0.33 0.61 1.05 78.82 –0.12 0.69 1.01 78.56 –0.09 0.75 1 80.28 0.19 0.51 1.03 79.59 0.31 0.27 1.03 81.64 –0.02 0.84 1 76.82 0.38 0.25 1.05 77.97 0.46 0.13 1.11 77.93 0.43 0.23 1.08 82.09 0.33 0.12 1.05 81.56 0.01 0.97 1.01 78.89 0.53 0.17 1.11
86.6 –0.1 0.64 1 76.95 –0.07 0.8 1 86.36 0.02 0.95 1.02 77.96 0.23 0.61 1.06 82.27 0.11 0.74 1.03 84.07 –0.48 0.37 0.98 83.9 0.21 0.37 1.03
81.88 –0.04 0.81 1.01 82.77 –0.03 0.85 1 79.58 0.53 0.08 1.09 76.55 0.14 0.61 1.02 82.26 0.07 0.85 1.02 82.7 0.42 0.2 1.11
71.91 0.81 0.26 1.11 76.39 0.67 0.24 1.1 84.93 0.39 0.22 1.07 77.91 –0.12 0.82 1.04 77.15 1.88 0.02 1.51 76.19 0.66 0.17 1.1 83.36 0.19 0.23 1.03 86.16 –0.15 0.37 0.98 88.09 0.21 0.63 1.04 73.52 0.05 0.85 1.01 81.46 0.01 0.96 1 74.94 0.64 0.03 1.15 75.83 0.19 0.47 1.01 80.92 0.5 0.17 1.05 85.47 –0.29 0.3 0.94 81.18 0.34 0.36 1.06 77.83 0.09 0.51 1.01 82.46 0.08 0.77 1.03 80.2 0.27 0.42 1.04
^ Yk ≠ is nonresponse-adjusted estimate of 4:3:1:3 coverage based on k cells. ^ ^ Yk ≠–Y5 is difference in estimated bias in nonresponse-adjusted estimates of 4:3:1:3 coverage obtained by using optimal choice of k adjustment cells compared with using five adjustment cells.
pk ≠ is p-value of the null hypothesis H:Yk ≠–Y5 = 0. ^γk ≠ is estimated relative efficiency of using k≠ iscells, compared to five cells, k=2, . . .

Vital and Health Statistics series descriptions
SERIES 1. Programs and Collection Procedures—These reports describe the data collection programs of the National Center for Health Statistics. They include descriptions of the methods used to collect and process the data, definitions, and other material necessary for understanding the data.
SERIES 2. Data Evaluation and Methods Research—These reports are studies of new statistical methods and include analytical techniques, objective evaluations of reliability of collected data, and contributions to statistical theory. These studies also include experimental tests of new survey methods and comparisons of U.S. methodology with those of other countries.
SERIES 3. Analytical and Epidemiological Studies—These reports present analytical or interpretive studies based on vital and health statistics. These reports carry the analyses further than the expository types of reports in the other series.
SERIES 4. Documents and Committee Reports—These are final reports of major committees concerned with vital and health statistics and documents such as recommended model vital registration laws and revised birth and death certificates.
SERIES 5. International Vital and Health Statistics Reports—These reports are analytical or descriptive reports that compare U.S. vital and health statistics with those of other countries or present other international data of relevance to the health statistics system of the United States.
SERIES 6. Cognition and Survey Measurement—These reports are from the National Laboratory for Collaborative Research in Cognition and Survey Measurement. They use methods of cognitive science to design, evaluate, and test survey instruments.
SERIES 10. Data From the National Health Interview Survey—These reports contain statistics on illness; unintentional injuries; disability; use of hospital, medical, and other health services; and a wide range of special current health topics covering many aspects of health behaviors, health status, and health care utilization. They are based on data collected in a continuing national household interview survey.
SERIES 11. Data From the National Health Examination Survey, the National Health and Nutrition Examination Surveys, and the Hispanic Health and Nutrition Examination Survey— Data from direct examination, testing, and measurement on representative samples of the civilian noninstitutionalized population provide the basis for (1) medically defined total prevalence of specific diseases or conditions in the United States and the distributions of the population with respect to physical, physiological, and psychological characteristics, and (2) analyses of trends and relationships among various measurements and between survey periods.
SERIES 12. Data From the Institutionalized Population Surveys— Discontinued in 1975. Reports from these surveys are included in Series 13.
SERIES 13. Data From the National Health Care Survey—These reports contain statistics on health resources and the public’s use of health care resources including ambulatory, hospital, and long-term care services based on data collected directly from health care providers and provider records.
SERIES 14. Data on Health Resources: Manpower and Facilities— Discontinued in 1990. Reports on the numbers, geographic distribution, and characteristics of health resources are now included in Series 13.
SERIES 15. Data From Special Surveys—These reports contain statistics on health and health-related topics collected in special surveys that are not part of the continuing data systems of the National Center for Health Statistics.
SERIES 16. Compilations of Advance Data From Vital and Health Statistics—Advance Data Reports provide early release of information from the National Center for Health Statistics’ health and demographic surveys. They are compiled in the order in which they are published. Some of these releases may be followed by detailed reports in Series 10–13.
SERIES 20. Data on Mortality—These reports contain statistics on mortality that are not included in regular, annual, or monthly reports. Special analyses by cause of death, age, other demographic variables, and geographic and trend analyses are included.
SERIES 21. Data on Natality, Marriage, and Divorce—These reports contain statistics on natality, marriage, and divorce that are not included in regular, annual, or monthly reports. Special analyses by health and demographic variables and geographic and trend analyses are included.
SERIES 22. Data From the National Mortality and Natality Surveys— Discontinued in 1975. Reports from these sample surveys, based on vital records, are now published in Series 20 or 21.
SERIES 23. Data From the National Survey of Family Growth—These reports contain statistics on factors that affect birth rates, including contraception, infertility, cohabitation, marriage, divorce, and remarriage; adoption; use of medical care for family planning and infertility; and related maternal and infant health topics. These statistics are based on national surveys of women of childbearing age.
SERIES 24. Compilations of Data on Natality, Mortality, Marriage, Divorce, and Induced Terminations of Pregnancy— These include advance reports of births, deaths, marriages, and divorces based on final data from the National Vital Statistics System that were published as supplements to the Monthly Vital Statistics Report (MVSR). These reports provide highlights and summaries of detailed data subsequently published in Vital Statistics of the United States. Other supplements to the MVSR published here provide selected findings based on final data from the National Vital Statistics System and may be followed by detailed reports in Series 20 or 21.
For answers to questions about this report or for a list of reports published in these series, contact:
Data Dissemination Branch National Center for Health Statistics Centers for Disease Control and Prevention 6525 Belcrest Road, Room 1064 Hyattsville, MD 20782-2003
(301) 458–4636 E-mail: [email protected] Internet: www.cdc.gov/nchs/

FIRST CLASS POSTAGE & FEES PAID
CDC/NCHS PERMIT NO. G-284
DEPARTMENT OF HEALTH & HUMAN SERVICES
Centers for Disease Control and Prevention National Center for Health Statistics 6525 Belcrest Road Hyattsville, Maryland 20782-2003
OFFICIAL BUSINESS PENALTY FOR PRIVATE USE, $300
DHHS Publication No. (PHS) 2001-1333, Series 2, No. 133 01-0526 (10/01)