Transforming Capital Asset Utilization and Delivery - The Regents of

Asset Utilization Potential of Building a Trucking and Rail Intermodal Hub in the Saint Louis Region Final ReportJuly 2018
Sponsored byMidwest Transportation CenterU.S. Department of Transportation Office of the Assistant Secretary for Research and Technology

About MTCThe Midwest Transportation Center (MTC) is a regional University Transportation Center (UTC) sponsored by the U.S. Department of Transportation Office of the Assistant Secretary for Research and Technology (USDOT/OST-R). The mission of the UTC program is to advance U.S. technology and expertise in the many disciplines comprising transportation through the mechanisms of education, research, and technology transfer at university-based centers of excellence. Iowa State University, through its Institute for Transportation (InTrans), is the MTC lead institution.
About InTransThe mission of the Institute for Transportation (InTrans) at Iowa State University is to develop and implement innovative methods, materials, and technologies for improving transportation efficiency, safety, reliability, and sustainability while improving the learning environment of students, faculty, and staff in transportation-related fields.
ISU Non-Discrimination Statement Iowa State University does not discriminate on the basis of race, color, age, ethnicity, religion, national origin, pregnancy, sexual orientation, gender identity, genetic information, sex, marital status, disability, or status as a U.S. veteran. Inquiries regarding non-discrimination policies may be directed to Office of Equal Opportunity, 3410 Beardshear Hall, 515 Morrill Road, Ames, Iowa 50011, Tel. 515-294-7612, Hotline: 515-294-1222, email [email protected].
NoticeThe contents of this report reflect the views of the authors, who are responsible for the facts and the accuracy of the information presented herein. The opinions, findings and conclusions expressed in this publication are those of the authors and not necessarily those of the sponsors.
This document is disseminated under the sponsorship of the U.S. DOT UTC program in the interest of information exchange. The U.S. Government assumes no liability for the use of the information contained in this document. This report does not constitute a standard, specification, or regulation.
The U.S. Government does not endorse products or manufacturers. If trademarks or manufacturers’ names appear in this report, it is only because they are considered essential to the objective of the document.
Quality Assurance StatementThe Federal Highway Administration (FHWA) provides high-quality information to serve Government, industry, and the public in a manner that promotes public understanding. Standards and policies are used to ensure and maximize the quality, objectivity, utility, and integrity of its information. The FHWA periodically reviews quality issues and adjusts its programs and processes to ensure continuous quality improvement.
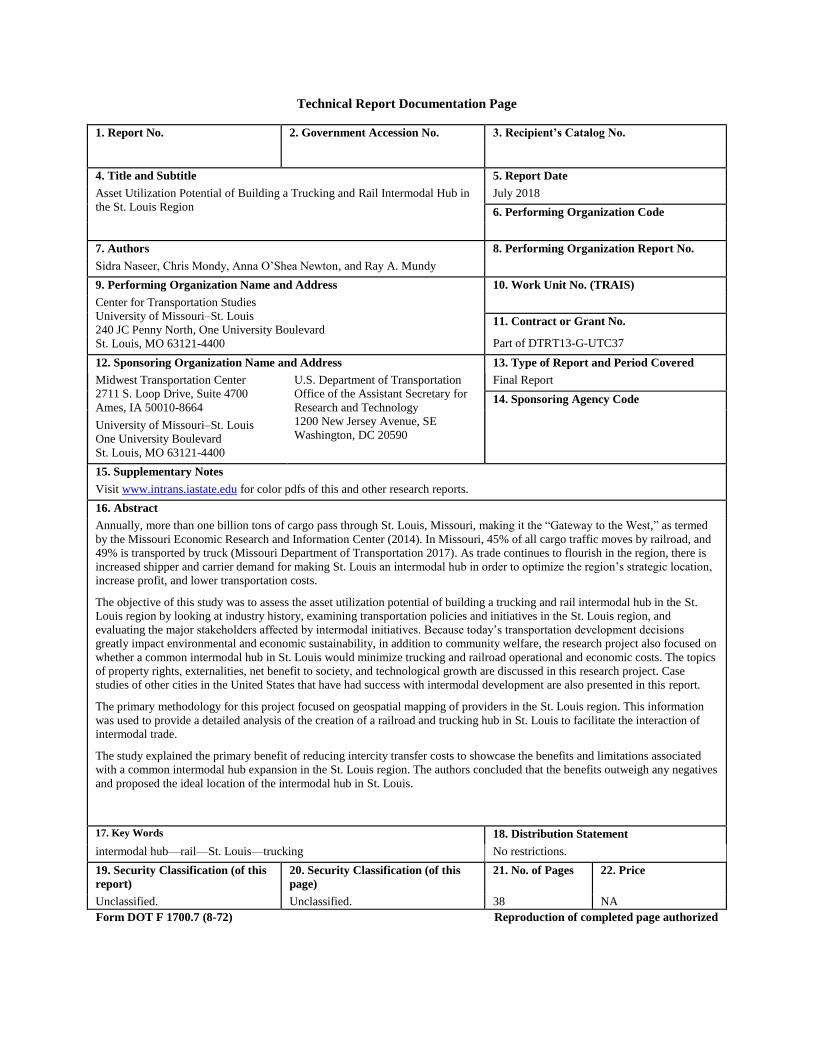
Technical Report Documentation Page
1. Report No. 2. Government Accession No. 3. Recipient’s Catalog No.
4. Title and Subtitle 5. Report Date
Asset Utilization Potential of Building a Trucking and Rail Intermodal Hub in
the St. Louis Region
July 2018
6. Performing Organization Code
7. Authors 8. Performing Organization Report No.
Sidra Naseer, Chris Mondy, Anna O’Shea Newton, and Ray A. Mundy
9. Performing Organization Name and Address 10. Work Unit No. (TRAIS)
Center for Transportation Studies
University of Missouri–St. Louis
240 JC Penny North, One University Boulevard
St. Louis, MO 63121-4400
11. Contract or Grant No.
Part of DTRT13-G-UTC37
12. Sponsoring Organization Name and Address 13. Type of Report and Period Covered
Midwest Transportation Center
2711 S. Loop Drive, Suite 4700
Ames, IA 50010-8664
University of Missouri–St. Louis
One University Boulevard
St. Louis, MO 63121-4400
U.S. Department of Transportation
Office of the Assistant Secretary for
Research and Technology
1200 New Jersey Avenue, SE
Washington, DC 20590
Final Report
14. Sponsoring Agency Code
15. Supplementary Notes
Visit www.intrans.iastate.edu for color pdfs of this and other research reports.
16. Abstract
Annually, more than one billion tons of cargo pass through St. Louis, Missouri, making it the “Gateway to the West,” as termed
by the Missouri Economic Research and Information Center (2014). In Missouri, 45% of all cargo traffic moves by railroad, and
49% is transported by truck (Missouri Department of Transportation 2017). As trade continues to flourish in the region, there is
increased shipper and carrier demand for making St. Louis an intermodal hub in order to optimize the region’s strategic location,
increase profit, and lower transportation costs.
The objective of this study was to assess the asset utilization potential of building a trucking and rail intermodal hub in the St.
Louis region by looking at industry history, examining transportation policies and initiatives in the St. Louis region, and
evaluating the major stakeholders affected by intermodal initiatives. Because today’s transportation development decisions
greatly impact environmental and economic sustainability, in addition to community welfare, the research project also focused on
whether a common intermodal hub in St. Louis would minimize trucking and railroad operational and economic costs. The topics
of property rights, externalities, net benefit to society, and technological growth are discussed in this research project. Case
studies of other cities in the United States that have had success with intermodal development are also presented in this report.
The primary methodology for this project focused on geospatial mapping of providers in the St. Louis region. This information
was used to provide a detailed analysis of the creation of a railroad and trucking hub in St. Louis to facilitate the interaction of
intermodal trade.
The study explained the primary benefit of reducing intercity transfer costs to showcase the benefits and limitations associated
with a common intermodal hub expansion in the St. Louis region. The authors concluded that the benefits outweigh any negatives
and proposed the ideal location of the intermodal hub in St. Louis.
17. Key Words 18. Distribution Statement
intermodal hub—rail—St. Louis—trucking No restrictions.
19. Security Classification (of this
report)
20. Security Classification (of this
page)
21. No. of Pages 22. Price
Unclassified. Unclassified. 38 NA
Form DOT F 1700.7 (8-72) Reproduction of completed page authorized


ASSET UTILIZATION POTENTIAL OF BUILDING
A TRUCKING AND RAIL INTERMODAL HUB IN
THE ST. LOUIS REGION
Final Report
July 2018
Principal Investigator
Ray A. Mundy, John Barriger III Professor for Transportation Studies and Director
Center for Transportation Studies, University of Missouri–St. Louis
Co-Principal Investigator
Daniel L. Rust, Assistant Director for Program Development
Center for Transportation Studies, University of Missouri–St. Louis
Research Assistant
Sidra Naseer, Chris Mondy, and Anna O’Shea Newton
Authors
Sidra Naseer, Chris Mondy, Anna O’Shea Newton, and Ray A. Mundy
Sponsored by
University of Missouri–St. Louis,
Midwest Transportation Center, and
U.S. Department of Transportation
Office of the Assistant Secretary for Research and Technology
A report from
Institute for Transportation
Iowa State University
2711 South Loop Drive, Suite 4700
Ames, IA 50010-8664
Phone: 515-294-8103 / Fax: 515-294-0467
www.intrans.iastate.edu


v
TABLE OF CONTENTS
ACKNOWLEDGMENTS ............................................................................................................ vii
INTRODUCTION ...........................................................................................................................1
Problem Statement ...............................................................................................................1 Literature Review.................................................................................................................1 Background ..........................................................................................................................2
BENEFITS OF INTERMODAL HUB CONSTRUCTION ............................................................6
Cost Savings of a St. Louis Mega Intermodal Rail Center ..................................................8
OPPOSITION TO COMMON INTERMODAL RAIL HUB IN ST. LOUIS...............................14
CASE STUDIES OF INTERMODAL RAIL DEVELOPMENT .................................................16
Case Study # 1: Kansas City SmartPort .............................................................................16 Case Study # 2: Ohio Rail Development Commission ......................................................20
Case Study # 3: International Port of Memphis .................................................................24
PROPOSED LOCATION FROM A CARRIER POINT OF VIEW .............................................27
CONCLUSION ..............................................................................................................................28
REFERENCES ..............................................................................................................................29

vi
LIST OF FIGURES
Figure 1. Commodity flows transported to Missouri in 2007 ..........................................................3 Figure 2. Commodity value destined for Missouri in 2007 .............................................................3
Figure 3. Major waterways in the US ..............................................................................................4 Figure 4. Four main railroad terminals in St. Louis .........................................................................5 Figure 5. Direct versus hub-based itineraries for a typical origin-destination pair .........................6 Figure 6. Primary areas of focus: St. Louis County and St. Louis City...........................................8 Figure 7. Top 10 zip codes with the most trucking establishments ...............................................12
Figure 8. Top 10 zip codes in the St. Louis region with the most transportation and
logistics establishments in 2011.........................................................................................13 Figure 9. Imports into St. Louis .....................................................................................................14 Figure 10. Exports out of St. Louis ................................................................................................15
Figure 11. Area where Norfolk Southern, UP, and BNSF merge together ...................................27
LIST OF TABLES
Table 1. Freight carried on major US waterways from 1990 to 2009, in millions of short
tons .......................................................................................................................................4 Table 2. Marginal external costs of container transport, in cents ....................................................7 Table 3. Transportation and warehousing establishments across Missouri, St. Louis
County, and St. Louis City (2006–2011) .............................................................................9
Table 4. Establishments by number of employees .........................................................................11

vii
ACKNOWLEDGMENTS
The authors would like to thank the University of Missouri–St. Louis, the Midwest
Transportation Center, and the U.S. Department of Transportation Office of the Assistant
Secretary for Research and Technology for sponsoring this research.

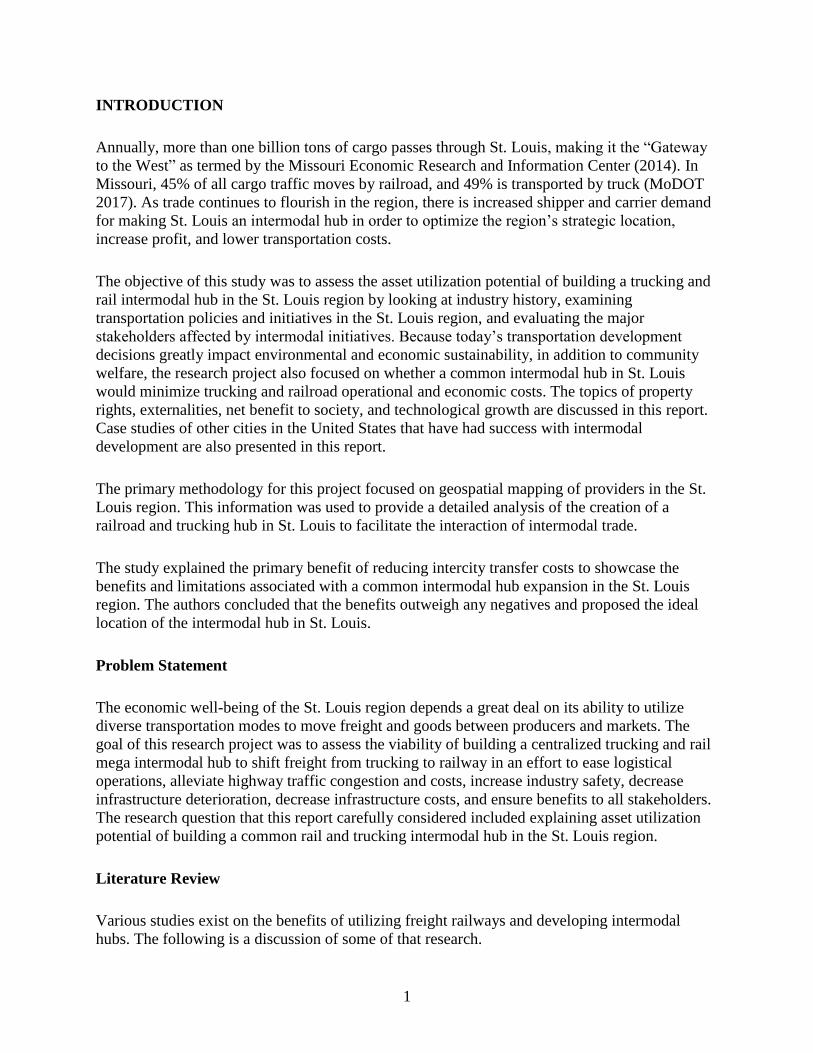
1
INTRODUCTION
Annually, more than one billion tons of cargo passes through St. Louis, making it the “Gateway
to the West” as termed by the Missouri Economic Research and Information Center (2014). In
Missouri, 45% of all cargo traffic moves by railroad, and 49% is transported by truck (MoDOT
2017). As trade continues to flourish in the region, there is increased shipper and carrier demand
for making St. Louis an intermodal hub in order to optimize the region’s strategic location,
increase profit, and lower transportation costs.
The objective of this study was to assess the asset utilization potential of building a trucking and
rail intermodal hub in the St. Louis region by looking at industry history, examining
transportation policies and initiatives in the St. Louis region, and evaluating the major
stakeholders affected by intermodal initiatives. Because today’s transportation development
decisions greatly impact environmental and economic sustainability, in addition to community
welfare, the research project also focused on whether a common intermodal hub in St. Louis
would minimize trucking and railroad operational and economic costs. The topics of property
rights, externalities, net benefit to society, and technological growth are discussed in this report.
Case studies of other cities in the United States that have had success with intermodal
development are also presented in this report.
The primary methodology for this project focused on geospatial mapping of providers in the St.
Louis region. This information was used to provide a detailed analysis of the creation of a
railroad and trucking hub in St. Louis to facilitate the interaction of intermodal trade.
The study explained the primary benefit of reducing intercity transfer costs to showcase the
benefits and limitations associated with a common intermodal hub expansion in the St. Louis
region. The authors concluded that the benefits outweigh any negatives and proposed the ideal
location of the intermodal hub in St. Louis.
Problem Statement
The economic well-being of the St. Louis region depends a great deal on its ability to utilize
diverse transportation modes to move freight and goods between producers and markets. The
goal of this research project was to assess the viability of building a centralized trucking and rail
mega intermodal hub to shift freight from trucking to railway in an effort to ease logistical
operations, alleviate highway traffic congestion and costs, increase industry safety, decrease
infrastructure deterioration, decrease infrastructure costs, and ensure benefits to all stakeholders.
The research question that this report carefully considered included explaining asset utilization
potential of building a common rail and trucking intermodal hub in the St. Louis region.
Literature Review
Various studies exist on the benefits of utilizing freight railways and developing intermodal
hubs. The following is a discussion of some of that research.

2
Association of American Railroads (2013)
Railroads offer substantial public benefits, including fuel efficiency, reduced greenhouse
gases, and less highway congestion. On average, railroads are four times more fuel efficient
than trucks. In 2012, railroads moved a ton of freight an average of 476 miles per gallon of
fuel. Because greenhouse gas emissions are directly related to fuel consumption, moving
freight by rail instead of truck reduces greenhouse gas emissions by 75%, on average.
Highway gridlock costs the US economy $121 billion per year in wasted fuel and time. Lost
productivity, cargo delays, and other costs add tens of billions of dollars to this tab.
U.S. Environmental Protection Agency (2013)
Transportation accounts for 27% of greenhouse gas emissions. Of that, medium- and heavy-
duty trucks account for 22% and railways account for less than 6%. Medium- and heavy-duty
trucks consume more than eight times the diesel fuel that railcars consume to move a ton of
freight.
Kenneally (1996)
Kansas City recognized that a significant part of the region’s well-being depended in large
part on its ability to reliably and efficiently move freight. To facilitate this movement and to
ensure that Kansas City remained a vital transportation hub, local, regional, and state
governments in 1994 launched a major study of the area’s intermodal resources, bringing
together various stakeholders to discuss intermodal freight strategies.
Seedah et al. (2014)
Texas recognized increased freight demands from population growth and economic success,
with little prospect of adding substantial capacity to the Texas Department of Transportation
(TxDOT) principal highway networks. The research project examined the feasibility of
utilizing railroads to offer competitive service and reduce truck volume on the highway
networks.
Background
An intermodal terminal is a railroad facility designed for the loading and unloading of containers
and trailers to and from flatcars for movement on the railroad and subsequent movement on the
street or highway (Intermodal Association of North America 2013). For the purpose of this
project, a centralized or common intermodal hub would work in a similar manner as a traditional,
individual intermodal terminal but would encompass multiple railroad carriers that run their
trains to a common location in order to capitalize on opportunities with various trucking carriers
to transfer cargo across both short-haul and long-haul distances.

3
Similar to Kansas City, the economic well-being of the St. Louis region depends largely on its
ability to utilize diverse transportation modes to move freight and goods between shippers and
markets. Taking 2007 commodity flow data from ArcGIS online, the maps in Figure 1 and
Figure 2 depict commodity flow traffic for Missouri in comparison to other states. Figure 1
shows that between $487 million and $636 million in commodity flows are directly transported
through Missouri, and Figure 2 shows that between $475 million and $629 million in commodity
value was destined for Missouri in 2007.
Map produced via https://hub.arcgis.com/items/95dfbd108adb48668c6a811b3140b846 with source data obtained
from Bureau of Transportation Statistics
Figure 1. Commodity flows transported to Missouri in 2007
Map produced via https://hub.arcgis.com/items/95dfbd108adb48668c6a811b3140b846 with source data obtained
from Bureau of Transportation Statistics
Figure 2. Commodity value destined for Missouri in 2007
The reason Missouri has more commodity flow compared to other Midwest states is partly
because of its accessibility to waterway systems (Figure 3). St. Louis is located in an ideal
location because it is near major waterways in the Mississippi River system, so it is able to take
advantage of freight being carried on those waterways.

4
https://kids.britannica.com/students/assembly/view/164961
© Encyclopedia Britannica, Inc.
Figure 3. Major waterways in the US
Table 1 shows data for waterway commerce, and despite the economic recession of the late-
2000s, the Mississippi River system continues to show consistency in that a significant portion of
cargo traffic travels down this waterway system. In addition, most US cities can be reached
either the same day or within two days by most transportation modes from St. Louis, and this
makes it an attractive area for shippers to use.
Table 1. Freight carried on major US waterways from 1990 to 2009, in millions of short
tons
Waterway 1990 1995 2000 2005 2006 2007 2008 2009
Atlantic intracoastal
waterway 4.2 3.5 3.1 2.7 2.6 2.5 2.9 2.5
Great Lakes 167.1 177.8 187.5 169.4 173.0 161.0 152.4 108.7
Gulf intracoastal waterway 115.4 118.0 113.8 116.1 122.6 125.1 115.9 108.1
Mississippi River system \ 1 659.1 707.2 715.5 678.0 702.1 699.0 681.6 622.1
Mississippi River main stem 475.3 520.3 515.6 464.6 497.7 500.5 486.8 447.7
Ohio River system \ 2 260.0 267.6 274.4 280.1 270.7 260.2 259.2 229.5
Columbia River 51.4 57.1 55.2 51.5 52.3 58.1 54.8 46.0
Snake River 4.8 6.8 6.7 5.3 5.2 5.4 3.7 4.4
Notes: 1 Main channels and the tributaries of the Mississippi, Illinois, Missouri, and Ohio rivers. 2 Main channels
and the navigable tributaries and embayments of the Ohio, Tennessee, and Cumberland rivers.
Source: U.S. Army Corps of Engineers (2011)
Currently, there are four main railroad terminals in the St. Louis-Illinois region, which are
operated by Burlington Northern Santa Fe (BNSF), CSX, Norfolk Southern, and Union Pacific
(UP). See the map in Figure 4 for the location of these rail terminals in relation to St. Louis
Lambert International Airport and major highways.

5
Figure 4. Four main railroad terminals in St. Louis

6
BENEFITS OF INTERMODAL HUB CONSTRUCTION
The primary environmental and economic argument for building a common intermodal hub in St.
Louis is that its hub-and-spoke type of network design reduces the impact of heavy trucks on the
road, which reduces congestion and transportation costs. In previous studies conducted on
intermodal transportation, findings show that most shipment movements occur at night, thereby
lessening delays during rush hours (Racunica and Wynter 2005).
A typical delivery not utilizing an intermodal hub results in many local transfers, which is known
as drayage, and becomes very costly. For example, instead of moving a container from its origin
to a warehouse and then to a rail terminal, the container would go directly from its origin to the
intermodal hub. Consequently, the intermodal hub eliminates intermediary transference costs as
well, which lowers transportation costs for both shippers and carriers. Such efficiencies help
society in the long run due to lower prices that consumers pay for goods and less adverse health
effects from pollution. Figure 5 shows that the hub-and-spoke design also allows for both direct
and indirect origin and destination routes.
Racunica and Wynter 2005. © 2004 Elsevier Ltd. All rights reserved. Used with permission.
Figure 5. Direct versus hub-based itineraries for a typical origin-destination pair
For the overall intermodal shipment to be more efficient for full truckload transportation, many
studies have found that the length of the linehaul must be long enough to offset the lower
efficiency of drayage and increased energy consumption of the rail network, which differs with
each trade lane (Groothedde et al. 2005). Groothedde et al. (2005) calculate that the CO2
emission intensity per lane is found by dividing the total CO2 emitted for the lane by the net ton
miles of cargo shipped. On average, lane intensity is 70 grams of CO2 per ton-mile, with a
standard deviation of 13 grams CO2 per ton-mile. The average truckload shipping intensity is
125 grams CO2 per ton-mile (Groothedde et al. 2005).
According to the Association of American Railroads, railroads are four times more fuel efficient
than trucks. In addition, moving freight by rail instead of truck reduces greenhouse gas emissions
by 75% and reduces highway gridlock costs in the US economy by $121 billion per year, which
are directly attributed to waste in both fuel and time.

7
The hub-and-spoke design of rail intermodal hubs allows freight to be sorted and aggregated in
the most efficient manner in order to reach full cargo-carrying capacity. Moreover, intermodal
hubs are lightly regulated, which allows free markets to work with each other. It is common for
rail carriers located within an intermodal hub to have contracts amongst themselves to carry
another rail carrier’s cargo if market conditions demand it (Meng and Wang 2011). Therefore,
intermodal hubs result in consolidating commodity flows so that economies of scale can be
obtained (Groothedde et al. 2005).
In addition, intermodal hubs allow companies to mediate the effects caused by volatility in fuel
prices by figuring out ways to transfer freight optimally without increasing transportation prices
(Macharis et al. 2010). Similarly, intermodal hubs result in fixed service schedules, which further
reduce variable costs. For instance, dedicated trade lanes, which are established to accommodate
cargo that has a recurring volume to and from the same destinations, would be more feasible
with aggregated freight at a large common intermodal terminal.
Currently, intermodal hubs are seen as a manifestation of technological progress, and they also
attract economic development and market expansion from both industry and government leaders
(Meng and Wang 2011). Most private rail companies will invest in the building of these hubs but
ask governmental regulatory agencies to serve as the liaison in interstate commerce. A recent
example is the success of CSX opening a large intermodal terminal in Toledo, OH.
While society benefits from these instrumental business partnerships, transportation development
also carries a variety of external costs to society, some of which include accidents, noise, air
pollution, climate change, and congestion (Macharis et al. 2010). One study compared the
marginal external costs of transporting full and empty containers exclusively through road and
rail transport and discovered that the development of an intermodal hub allows for optimal
transportation solutions (Iannone 2012). Table 2 shows findings from a study by Fedele Iannone
(2012) comparing the marginal external costs of transporting full and empty containers
exclusively via road and railroad transportation.
Table 2. Marginal external costs of container transport, in cents
Road transport Rail transport
Full
containers
Empty
containers
Full
containers
Empty
containers
Greenhouse gases 0.037 0.005 0.012 0.0017
Air pollution 0.142 0.020 0.020 0.0029
Noise 0.108 0.015 0.067 0.0095
Accidents 0.021 0.003 0.002 0.0002
Congestion 0.264 0.037 0.000 0.0000
Total 0.572 0.081 0.101 0.014
Source: Iannone 2012

8
Cost Savings of a St. Louis Mega Intermodal Rail Center
The primary research question of this study included whether intercity drayage costs could be
reduced based on the current location of major trucking and warehousing operations in St. Louis
and their distance to rail terminals. Through geospatial research methodologies, it can be
examined whether motor carriers in St. Louis would benefit from a common intermodal hub to
reduce those intercity costs. The primary area of focus for this geospatial project was St. Louis
County and St. Louis City, which are the areas inside the blue outline in Figure 6.
Figure 6. Primary areas of focus: St. Louis County and St. Louis City
The two current main rail terminals within those areas are BNSF and Norfolk Southern.
U.S. Census Bureau data for 2006 through 2011provide the total number of transportation and
warehousing establishments in Missouri, St. Louis County, and St. Louis City. The data takes
into account the North American Industry Classification System (NAICS) codes that federal
agencies use to classify business establishments for statistical reporting purposes, and for this
report, it focused on the NAICS code beginning with 48, which represents the transportation and
warehousing sector.
Table 3 shows that overall, from 2006 to 2011, there has been a reduction in transportation and
warehousing establishments across Missouri, St. Louis County, and St. Louis City, which is most
likely due to the recent recession.

9
Table 3. Transportation and warehousing establishments across Missouri, St. Louis County, and St. Louis City (2006–2011)
Total establishments
2006 –
Missouri
overall
2011 –
Missouri
overall
%
change
in
Missouri
2006–
2011
2006
St.
Louis
County
2011 St.
Louis
County
%
change
in St.
Louis
County
2006–
2011
2006
St.
Louis
City
2011 St.
Louis
County
%
change
in St.
Louis
City
2006–
2011
Transportation and
warehousing: NAICS
category 48
5,041 4,622 -8% 656 595 -9% 265 238 -10%
Truck transportation: NAICS
484
3,309 2,803 -15% 77 131 70% 58 17 -71%
Warehousing and storage:
NAICS 493
305 303 -1%
Source: U.S. Census Bureau 2014

10
Another change to note is that St. Louis County had a 70% gain in truck transportation
establishments compared to a 71% loss of such establishments in St. Louis City, which indicates
a shift of transportation providers relocating to St. Louis County.
Table 4 shows the number of transportation establishments in St. Louis County and St. Louis
City by the number of employees. Data on warehousing and storage establishments does not
exist for St. Louis County and St. Louis City.

11
Table 4. Establishments by number of employees
Establishments by Number of Employees
Zip
code City description
Transportation
and
warehousing
(48) total
establishments
2011
1–
4
5–
9
10–
19
20–
49
50–
99
100–
249
250–
499
500–
999
1,000
or
more County
63042 Hazelwood/Robertson/Vigus 43 12 7 8 10 5 1 0 0 0 St. Louis
County
63134 Berkeley/Edmondson/St.
Louis/Woodson Terrace
43 18 8 9 3 3 2 0 0 0 St. Louis
County
63147 St. Louis 43 12 5 5 8 6 6 1 0 0 St. Louis
City
63044 Bridgeton/Bridgeton
Terrace/Hazelwood
40 16 6 3 6 5 1 2 1 0 St. Louis
County
63045 Bridgeton/Earth
City/Hazelwood
34 7 7 4 8 2 4 1 0 1 St. Louis
County
63129 Mehlville/Oakville/St. Louis 34 26 1 3 3 1 0 0 0 0 St. Louis
County
63026 Fenton/Murphy 32 17 4 5 5 1 0 0 0 0 St. Louis
County
63005 Chesterfield/Clarkson
Valley/Gumbo/Wildwood
31 12 1 7 6 5 0 0 0 0 St. Louis
County
63114 Breckenridge
Hills/Charlack/Overland/Saint
John/St. Louis/Vinita Park
28 13 7 4 1 1 1 1 0 0 St. Louis
County
63017 Chesterfield/Clarkson Valley
and Town and Country
22 15 1 2 3 0 1 0 0 0 St. Louis
County
Source: U.S. Census Bureau 2014

12
Because the research project focuses on St. Louis City and St. Louis County, which make up the
St. Louis region, 2011 U.S. Census Bureau data on business patterns by zip code were
investigated to see if there were any major clusters of transportation and warehouse companies in
specific areas. A total of 93 zip codes encompass St. Louis County and St. Louis City, and the
transportation and warehousing establishments registered with the NAICS code of 48 were
researched by region. The top 10 zip codes with the most trucking establishments are highlighted
on orange in Figure 7.
U.S. Census Bureau 2014
Figure 7. Top 10 zip codes with the most trucking establishments
Nine out of the 10 zip codes located in the county collectively made up 52% of the St. Louis
County transportation and warehouse establishments in 2011.
Graphically represented on the map of the target area as shown in Figure 7, 5 of these top 10 zip
codes are adjacent to the St. Louis Lambert International Airport in the Bridgeton area. This area
also is close to major highways, specifically Interstates 64 and 70. Figure 8 depicts, using hashed
lines, the top 10 zip codes in the St. Louis region with the most transportation and logistics
establishments in 2011.

13
Figure 8. Top 10 zip codes in the St. Louis region with the most transportation and logistics
establishments in 2011
As shown on this map, there is a quite a bit of intercity distance between the two main rail
terminals serving St. Louis and where the majority of these transportation providers are currently
located. A centralized, common trucking and rail intermodal hub, if built near the zip codes with
the most transportation and warehousing establishments, would promote efficiency through
reducing truck short haul drayage costs. It would also result in environmental efficiency,
alleviate highway traffic congestion in these areas, increase safety, decrease infrastructure
deterioration, and ultimately decrease costs to the end intermodal costs and to consumers.
However, there would be resistance to establishing a new, common intermodal rail terminal in
St. Louis.

14
OPPOSITION TO COMMON INTERMODAL RAIL HUB IN ST. LOUIS
Opposition to the construction of an intermodal hub would come from several area interest
groups. The business argument is that a convenient intermodal hub will take business away from
the existing intermodal facilities that current rail officials feel are working just fine. In response
to this critique, economists would argue that the hub promotes efficiency.
Another business argument would be what to do with existing rail terminals. Since most of these
terminals have old infrastructure with limited capacity, the alternative of a less costly common
terminal may be attractive. It should also be noted that the land currently occupied by existing
intermodal faculties could be utilized for other development purposes or could be sold for
significant amounts. By participating in a common terminal, these rail companies could lessen
their capital and operating costs in much the same way as they do with a commonly owned city
railway line that transfers cars among all the rail lines located in the city.
Opponents might also argue that an intermodal hub in St. Louis would not be able to compete
successfully with the other surrounding Midwest intermodal hubs, primarily the nearby hubs in
Kansas City, Missouri; Chicago, Illinois; and Toledo, Ohio. The graphs in Figure 9 and Figure
10, which are based on data of transportation flows in Missouri taken from the Statistical
Abstract of the U.S., demonstrate that the St. Louis region is increasingly viable for intermodal
trade because it has a significant amount of imports coming into the region. Finally, most of this
import and export trade volume is moved as containerized cargo, which can also be transferred
via intermodal transportation.
Source: U.S. Census Bureau 2017
Figure 9. Imports into St. Louis

15
Source: U.S. Census Bureau 2017
Figure 10. Exports out of St. Louis

16
CASE STUDIES OF INTERMODAL RAIL DEVELOPMENT
For this project, three case studies of nearby intermodal rail hub developments were conducted.
The purpose of these case studies was to examine the asset utilization potential of intermodal
facilities and identify lessons that could be applied to the construction of a rail mega intermodal
hub in the St. Louis region for all rail carriers to jointly own and participate in. Individuals
involved in governing intermodal organizations were interviewed for each of these case studies.
The following individuals were interviewed:
Chris J.F. Gutierrez, president of Kansas City SmartPort
Matthew Dietrich, executive director of Ohio Rail Development Commission
James R. Richardson, executive director of International Port of Memphis
Among all three case studies, the interviewees largely agreed that for intermodal hub
construction, railroads must be present at the table, and partnerships between the public and
private sectors are essential. Since intermodal construction is dependent on the railroads’
infrastructure, if they don’t have a vested interest in the project, it will not work. In regard to
ownership of land, the interviewees concluded that large parcels of land in industrial parks must
be sold rather than small parts being leased out.
Traditionally, most railroads will not work together in the same facility but do participate in joint
ownership of railway terminals, so there is some grounds for cooperative intermodal rail
facilities. However, interviewees suggested several times during the case studies that cities must
set up a joint operation that forces cooperation among railroads within the metropolitan area in
order to be successful. Consequently, partnerships between public and private sectors are
essential to ensuring railroad cooperation. The public sector cannot create an intermodal facility
just because it wants one. It must be economically attractive to the shippers via tax abatements or
showing the economies of scale and attractiveness of proposed location.
The public sector acts as liaison between communities and industries. However, railroads must
work to get partner companies on board. A crucial suggestion from these case studies was the
need to create a separate economic entity to focus on freight-based economic development.
Fortunately, this has already been done in the St. Louis region with the creation of St. Louis
Regional Freightways, which develops public-private partnerships and provides the foundation
for planning, marketing, and advocacy of the bi-state region as a national freight hub. Lastly,
regarding the development of committees to study construction of these intermodal hubs, the
case studies suggest that the committee overseeing intermodal development should be kept
small.
Case Study # 1: Kansas City SmartPort
Kansas City has recently experienced phenomenal growth in imports and exports from the recent
construction and expansion of logistics parks. Chris Gutierrez, president of SmartPort, was

17
interviewed to discuss the construction of the Kansas intermodal logistics parks and factors
leading to their success.
Kansas City has always had an established rail infrastructure from the operations of UP, BNSF,
Kansas City Southern and Norfolk Southern. What sets Kansas City apart is that it has two
different types of facilities: intermodal facilities and intermodal logistics parks.
While the individual railroads maintain investments and commitments to the infrastructure of
their intermodal facilities, the intermodal logistics parks help connect the intermodal facilities
with the shippers so that their facilities can be located on site with the rail infrastructure.
Currently in Kansas City, there are about five intermodal facilities and three intermodal logistics
parks.
SmartPort is a unique organization that considers itself the virtual inland port that works with all
of the local freight-based economic developments and projects. This entity is not tied to one park
or one railroad. The railroads themselves came up with the idea to construct these logistics parks.
Gutierrez explains, “There are a lot of examples of communities that want an intermodal facility,
but those don’t come because you want them; they come because the railroad sees the
operational efficiencies to have them. Intermodal efforts must be supported by the industry.”
The railroads’ involvement in creating a successful intermodal hub is critical. Prior to the
construction of the recent intermodal logistics parks, SmartPort worked with the railroads on
location choice and held public meetings and private sector leadership meetings with all local
railroad companies about the plan, impact, and benefits and worked with the public sector groups
to support designation, permitting and zoning, and other necessities. As a result, SmartPort is
now very closely tied to both railroads and their real estate development partners attracting
companies to locate there.
On the construction side of the logistics parks, the rail infrastructure itself is paid for by the
railroads. The railroads sponsored a traffic study and hired engineering consultants and
environmental impact consultants to construct an understanding of the impact of this project.
They secured either outright acquisition of the land or the option to own development rights to
the land. Each railroad company worked with SmartPort to select a real estate development
partner and began pursuing the land they wanted. In both terminal location decisions, for BNSF
and KCS, the railroads took control of the land first and then started the process of forecasting
potential impacts.
SmartPort also worked with local communities to zone the logistics parks; facilitate development
agreements; and determine the financial impact, job impact, and infrastructure needs around it. In
the case of the BNSF logistics park, the land required annexation because it was within a county.
As these examples show, SmartPort assumes an advisor role, aligns itself with the shippers’
needs, and fosters comprehensive, social interest in disclosing optimal distribution,
manufacturing, and employment opportunities and the prosperity of the potential venture.

18
SmartPort is charged with recruiting freight-based economic development. Distribution,
warehousing, and manufacturing operations currently absent within its 18 counties are
encouraged to locate on its site versus other cities. Through this strategy, SmartPort markets to
two client bases. One is the shippers themselves through outreach marketing, event networking,
and direct solicitation. The second base is what’s called a site selection consultant. SmartPort
recruits industry consultants who possess active partnerships with shipper/client hires, who in
turn encourage clientele to choose a SmartPort facility.
Besides Gutierrez, at this time, there is one more employee working at SmartPort. Both are
Kansas City Area Development Council (KCADC) employees assigned to SmartPort. SmartPort
is a separate not-for-profit entity—separate board, separate financing—but is part of the KCADC
team, specifically of the KCADC brand, to go after freight contracts.
Kansas City is one of the very few cities that has created a separate entity focused on economic
freight development. Other cities mark these as initiatives, but responsibility usually falls to a
local chamber of commerce or regional group. As a result, SmartPort is born and funded by the
transportation industry, including all the railroads, all the trucking companies, third-party
logistics businesses, and various other companies. Ninety percent of its budget comes from the
private sector forging a consortium of transportation freight-oriented groups, in contrast to
publicly run, regional chamber of commerce or economic development groups.
Transportation companies see this synergy. The more SmartPort brings in terms of development
successes, the more efficient its processes, the more it keeps costs down. Traditional economic
development groups have so far failed to act on the benefits private alignment with freight-based
companies are accomplishing; rather they continue to enact antiquated labor force initiatives and
incentives.
SmartPort was a concept that came out of a mid-1990s study that the Kansas City council of
governments led and that led to earmark funding to analyze freight in the Kansas City market.
That study measured how much freight comes in to Kansas City and examined subsequent
commodity groups, transport modes, and destinations. The comprehensive freight study yielded a
number of recommendations. One was the need for an entity’s specific focus on this unique
industry growing in Kansas City, which led to SmartPort’s creation.
SmartPort was officially incorporated in 2000, and for 12 to 16 months, it struggled with the
question: “What is it that SmartPort does?” The regional planning group did freight planning and
infrastructure planning, and Kansas City had an economic development group and chamber of
commerce, but what role should SmartPort play? It was not until the Kansas City Southern
railroad invested its first check in SmartPort, and one of its team became chair of the board, that
Smart Port molded itself around economic development of freight and securing freight projects.
SmartPort initially didn’t have any funding but rather had to strategize how it could sell itself as
a brand to stakeholders and investors. In order to do that, SmartPort had to develop measurable
metrics that it would be held accountable for, and thus it set out to raise funds to support initial
operations.

19
Gutierrez says that the metrics and success of Smart Port is demonstrated by the focused effort of
the organization to attract companies to locate in Kansas City versus competitor cities,
specifically because of the private industry support of the SmartPort investor base. This
advantage made the location of prospective freight projects in Kansas City more attractive. These
freight projects produced some very early wins and illustrated how SmartPort was connected to
them, which allowed SmartPort to rise rapidly within the industry.
SmartPort diligently secured congressional delegation support, and through both the commerce
and transportation committees, received between $8 million and $9 million. A significant portion
of the funding was used to develop a global transportation management system (TMS) solution
for shippers to use when considering Kansas City as a potential manufacturing or warehousing
facility. SmartPort has also made efforts to build consensus and project opportunities with
Mexico, thereby extending the regional reach of Kansas City.
SmartPort looked at different locations for its intermodal port in Kansas City. There were
concerns within the surrounding communities regarding construction of an intermodal port,
specifically, increases in crime, congestion, and environmental impacts of diesel emissions. In
tackling the potential environmental impacts of the emissions, both railroads invested resources
to be environmentally friendly. In addition, all of the cranes used in the intermodal ports are
electric with strict idling and diesel emission rules. Finally, the project put forth by BSNF is a
state-of-the-art, green facility. Despite early concerns, both projects have proven to be a success
for the communities they are in.
On the public sector side, the city signed a development agreement with the railroad and real
estate developers to commit certain revenues back to the community. Most cities in the United
States generally incentivize construction of these massive infrastructures by providing 50%
property tax abatement for 10 years. For Everton, Missouri, the incentive was 75% property tax
abatement for 10 years, but the net value to the company is 50%. The remaining 25% property
tax abatement goes to development of infrastructure in the park, city permits, and city fees.
These incentives are similar throughout rest of the country. Their municipal economic benefit
comes from the other manufacturers and distribution centers that come to this location as a result
of the local intermodal and logistics facilities.
For St. Louis, or any other city undertaking an intermodal hub project, there are several key
points to consider. According to Gutierrez, railroads are the key drivers. Thus, they have to be
committed in starting and completing the project. If railroads do not see the operational
efficiencies or increase in productivity that an intermodal hub has to offer, the project will not
succeed. A case in point: SmartPort tried to convince UP officials of the merits of constructing
an intermodal hub in Kansas City. UP denied the proposal because it already had intermodal
facilities in Salt Lake City, Utah, and Dallas, Texas. In addition, there wasn’t a need for UP to
expand into the existing Kansas City intermodal hub. Various communities have toyed with the
idea of a consolidated rail infrastructure. Although seemingly ideal, officials within the railroad
industry are resistant to these proposals.

20
In Missouri, imports are increasing but exports have not been expanding at the same rate. This
can be improved. For example, SmartPort uses a variety of tactics besides incentives to
encourage more companies to export from the Kansas City region. Similar to St. Louis, Kansas
City has an active world trade center that is a lead group to work with the private sector in
international trade. In addition, Kansas City is also home to state trade promotion offices, an
international trade council, and a variety of organizations that are focused on the effort to grow
trade the same as St. Louis.
Based on observations on the railroads working together in their intermodal switching, they tend
to work well together with the terminal, but it is a forced cooperation. It’s not forced in a
regulatory sense. They know the benefits, but railroads traditionally don’t work extremely well
together. They are competitive, so it is natural for one to always want to have the expedited
switching advantage over the other. It is a challenging cooperation, but Kansas City has
performed well, despite being overseen by a separate, private entity while the line operations are
maintained by the short line railroad. It is done well, but it is still a contentious discussion.
Currently, the transportation community in Kansas City is attempting to support an intermodal
authority, which would give the city authority to make changes over the intermodal port. Such
authority was assist the railroads in overcoming natural competitive tendencies.
Case Study # 2: Ohio Rail Development Commission
Ohio has 13 main intermodal facilities, all overseen by the Ohio Rail Development Commission
(ORDC). Matthew Dietrich, executive director of the Ohio Rail Development Commission, was
interviewed to provide insight into the success of these intermodal facilities and ORDC
development. ORDC’s mission is to plan, promote, and implement the improved movement of
goods and people faster and safer on rail transportation. Statutory authority to conduct rail
planning in Ohio is assigned to the ORDC, an independent agency of the Ohio Department of
Transportation (ODOT). ORDC is the successor of the Ohio High Speed Rail Authority and the
Division of Rail Transportation of ODOT.
ORDC administers grade crossing safety funds from federal highway funds. However, the rail
commission doesn’t fit neatly into the mold of a state transportation agency because the ORDC
deals with private industries. That’s changing now with the emergence of multiple public-private
partnerships, but historically federal funds followed cradle-to-grave public infrastructure
projects. ORDC deals with transportation but also deals with private entities on a deal-by-deal
basis.
ORDC has one foot in the transportation world and one foot in the development world. Dietrich
is an employee and officer of the commission, but his email has an ODOT domain. Every state
entity is different. Currently, the rail commission works for the state of Ohio, as it has for 20
years. Other states accomplish substantially the same operations under the department of
transportation or state port authority structure.

21
ORDC mainly focuses on capital infrastructure development rather than business development.
As a state entity, ORDC has an Ohio Department of Transportation head and the state
Development Services Agency director on the board. ORDC administers all of the federal
highway grade crossing safety funds and provides direct assistance for freight projects in terms
of loans, grants, and special projects. For the most part with the Class 1 railroads, everything
ORDC does with the intermodals falls into its special projects.
According to Dietrich, of the 13 intermodal facilities, only one falls under the definition of an
intermodal hub: a CSX facility located in northwest Ohio. This facility has instituted more of an
airline-type system of using only intermodal containers. It’s one of the few rail facilities that is
designed for containers to sit on the ground. Dietrich said, “You can picture that as the O’Hare or
the Atlanta of the intermodal container world.” First, the trains’ long-hauls to the facility. Then,
the trains are blocked, and shuttles are used to transport the goods to nearby intermodal facilities.
It was one of the nodes on the National Gateway, which are all single-owner facilities.
According to Dietrich, it is unlikely that any of these nodes will be progressing to any type of a
shared ownership facility.
In the northwest Ohio container port, although it is a CSX facility, one can see BNSF and Union
Pacific trains running on those tracks. This is because BSNF and Union Pacific have an
agreement with CSX to interchange in Chicago or pass through on their tracks. When ORDC
first proposed Rickenbacker port as a general intermodal port, the railroad companies dismissed
the proposal. However, after many discussions, the railroad companies came to an agreement.
Buckeye Yard existed as an intermodal yard that CSX inherited in the Conrail split. Maple
Heights Yard was specifically Norfolk Southern-driven. Sharonville Yard had always been an
intermodal yard, and Norfolk Southern made improvements to it. As a result, it has become more
important to them with the development of Rickenbacker Yard.
The railroad companies brought proposals to the ORDC, and the ORDC provided tremendous
help to the railroad companies in facilitating the development of those intermodal facilities.
According to Dietrich, the ORDC analyzed the benefits of the proposal, i.e., fewer trucks on the
road resulting in the lessening of deteriorating infrastructure and economic development around
the intermodal yards and surrounding businesses were primary selling points.
Once the ORDC completed an analysis, and there was an agreement that construction of the
intermodal port was mutually beneficial to railroad companies, and the state of Ohio, plans began
to proceed to establish Rickenbacker as an intermodal hub. To get the process started, the ORDC
collaborated with West Virginia and helped fund the initial study on types of bridge clearances
that would be needed to provide the double-stacked route from the port of Norfolk to the
Rickenbacker intermodal facility. Once the study was completed, the ORDC helped the railroads
facilitate the discussions with the local development officials, state agencies, and the federal
government in terms of building a coalition to support that project.
In addition, ORDC worked closely to achieve stakeholder participation and interest. For
example, in the case of the North Baltimore (Ohio) terminal, an existing intermodal yard had

22
constrained capacity. ORDC met with the railroads’ representatives, who were interested in
getting more international freight into the Midwest. ORDC was not focusing specifically on the
Norfolk Southern system but rather trying to decipher how ORDC could secure more intermodal
containers into the Midwest and how it could replicate that success through the port of Virginia
and the West Virginia port authority.
Therefore, ORDC partnered with Norfolk Southern and began examining the Norfolk Southern
corridor to determine the ideal location for a double stack. This led to the established of the
Norfolk Southern Heartland Corridor. Through this process, ORDC identified many benefits to a
Midwest location and its high traffic volume. Dietrich explains, “You can’t build your
intermodal yards unless you have a double stack, but you can’t justify double stacking until you
have a destination to put it into that [also] has [adequate] capacity. In some ways these projects
were separate, but you can’t talk about one without mentioning the other. Our focus was on
developing the double stack corridor and securing public funds for that.” While ORDC focused
on the corridor, Norfolk Southern focused on Rickenbacker Yard.
The airport authority (Rickenbacker was an old military base) concurrently worked on other
capital improvements to enhance the intermodal yard: last-mile connections, development of
their industrial park, development of overweight/size local roads, and development of blanket
permits to transfer heavier trucks from container yards to the warehouses. The airport authority,
which owns the industrial development area, and the port of Virginia, all have been collaborating
in joint marketing efforts for the intermodal facility, in addition to the Norfolk Southern
Railroad.
The ORDC’s biggest contact in West Virginia was the state port authority during the
construction of the Heartland Corridor. The executive director of the ORDC at the time took a lot
of heat for supporting the Heartland Corridor because it was $800,000 in impediments to double
stack. All efforts were focused on it, and it was the Nick J. Rahall Institute at West Virginia’s
Marshall University that did the study for ORDC for the double stack clearances. Dietrich recalls
that due to what appeared to be studying tunnels and bridges in West Virginia, the ORDC was
criticized for spending Ohio taxpayer money in West Virginia; however, ORDC argues that
those studies were an efficient use of the $25,000 that was spent. That’s how Rickenbacker
developed. ORDC funded the study to find out what was needed and worked with the railroads
to identify stakeholders. The Columbus Airport Authority led the project as the landowner of the
future intermodal yard and worked with the railroad directly while the ORDC focused its
attentions on the corridor.
The percentages of intermodal freight going through the state versus how much is destined to or
originating in Ohio differ for each yard. ORDC ensured its analysis focuses on the economic
development of the origin-destination pair, meaning the destination or origin is in Ohio. The
ORDC recognizes that every intermodal train is 200 trucks that aren’t traveling through the state
on roadways. Aside from the freight destined for Ohio, the ORDC also sees opportunities in the
state’s geographic location, with a lot of “through” traffic with the I-75 and I-80 corridors. The
ORDC’s goal is to identify opportunities available to open the containers that would otherwise
just pass through the state. While opening containers costs railroads money, they can employ

23
value-added alternatives to help recoup some of that money. That’s been ORDC’s strategy with
intermodal.
When asked about the positive impacts of keeping trucks off the highway because of trains
coming in from the Heartland Corridor, Dietrich said a lot of it depends on the business and
economic development case, which is difficult to quantify. Despite an extensive working
relationship with the General Accountability Office, as well as the U.S. Department of
Transportation, ORDC has struggled to obtain proper metrics to measure the impact of the
intermodal yards beyond tax and employment.
Two of the biggest proponent states of developing the corridor at that time were Pennsylvania
and Ohio. Taking trucks off the state highways is a great goal but hard to quantify.
Consequently, it was the financial impact of employment in the intermodal yard, and the
economic development opportunity surrounding the yard that drove Ohio into leading the effort
for Rickenbacker Yard. Alternatively, Pennsylvania chose to lead the development of an
intermodal yard in Chambersburg Pa.
One of the lessons learned from the intermodal success is that the ORDC advocates for the
railroads to initiate or validate the discussion for intermodal development. Because of their
systems. They know where the customers are, and they know where the networks are. However,
local communities might be able to bring them opportunities that they might not otherwise know
about.
This is what happened in Toledo, Ohio with the development of Norfolk Sothern’s Airline Yard.
The community approached the railroad claiming the existing railroad yard was underutilized.
This led to the development of a consortium of community leaders and shippers along with the
railroad. Improvements and further development of the yard into an intermodal terminal yard
was successful in generating significantly more freight moving through this yard.
For metrics to measure the success of these intermodal facilities, especially with the National
Gateway, the ORDC looked at usage of those facilities. What kind of capacity is there? What’s
the delta between how many containers a railroad is running between single stack versus double
stack? Are the intermodal facilities recognizing the utilization rates that they thought they
would? For the success of the intermodal yards, the ORDC will look at companies served in
Ohio. ORDC will ask the railroads to identify the companies served and get them on board and
will use that as a proxy.
Dietrich mentioned that it’s important for these companies that are served to get on board, yet,
depending on the project, sometimes the railroad fails to cooperate or support the initiative. In
the case of northwest Ohio and the huge international gateway project, CSX took those on itself
with the help of the local economic development entity. Alternatively, in the case of
Rickenbacker, located in center of the state, Columbus, the owner of the neighboring industrial
park, the Airport Authority, began marketing the property with partnerships with the developers.
Dietrich explains, the “ORDC [has] two minds. It’s us having the transportation side saying
we’ve built this. What does it do to the road network?” The road network has been the focus of

24
its analyses. ORDC collects data from the railroads’ economic development analysis and relies
on state partners to validate the data, even though it does not factor in all indirect costs, such as
when trucks are off the road and the wear and tear on vehicles.
For the most part, motor carriers have been supportive. The rail carriers themselves have certain
relationships. Marion Intermodal Center, a private intermodal center that CSX serves, was driven
by Schneider Trucking. It was hook and haul for the railroads, and it was a direct boutique rail
center for Schneider. JB Hunt has a huge presence in Rickenbacker. CSX has its own trucking
firms it works with, and Norfolk Southern has its own. When the contracts are up, all that
changes. ORDC ensures that contract negotiations for any project include a big-picture focus and
consider public, economic, and transportation benefits.
Dietrich was also asked if anyone in the Ohio revenue department criticized the ORDC for
removing trucks off the highway and, with them, lost fuel tax revenue. Surprisingly, Dietrich
mentions that no one has criticized the ORDC for this issue. Ohio has been going through tax
reform and modernizing its tax code, so it’s been challenging to figure out.
Given what St. Louis is trying to do, Dietrich advised, “You can bring opportunities to the
railroads, but they need to validate it. At some points, the railroad needs to lead the effort;
otherwise, they just don’t have the vested interest to make it happen.”
Case Study # 3: International Port of Memphis
The International Port of Memphis is a major industrial port centrally located in North America.
The Memphis and Shelby County Port Commission manages the 15,000 acres of property in
southwest Memphis, Tennessee, along the Mississippi River that make up the international port,
with a focus on industrial, commercial, and environmental development. James R. Richardson,
executive director of International Port of Memphis, was interviewed to learn more about the
success of Memphis in intermodal development.
According to the about section of its website, The International Port of Memphis is the second
largest inland port on the shallow draft portion of the Mississippi River and the fourth largest
inland port in the United States. The International Port of Memphis covers the Tennessee and
Arkansas sides of the Mississippi River from river mile 725 to mile 740. Within this 15-mile
reach, there are 68 water-fronted facilities, 37 of which are terminal facilities moving products
such as petroleum, tar, asphalt, cement, steel, coal, salt, fertilizers, rock and gravel, and, of
course, grains. The International Port of Memphis is 400 river miles from St. Louis and 600 river
miles from New Orleans and is ice-free year-round.
The jurisdictional and statistical boundaries of the International Port of Memphis include the
McKeller Lake/President’s Island complex, the West Memphis Harbor, the Rivergate Harbor, the
Wolf River Harbor downtown, and Fullen dock and harbor north of downtown. At present, 95%
of the industries that are in the International Port of Memphis are located on President’s Island.
Inland ports are different than deep water ports because the deep water ports control all their

25
facilities. The railroads in their facilities are also partners. The railroads and ports in the inland
ports are separate from each other, particularly when it relates to intermodal facilities. The
Mississippi and Ohio Rivers currently have no container-on-barge movements. And, officials
there indicate this will probably remain the case for the near future.
There are five Class 1 railroads coming into Memphis. Prior to the evolution of significant
intermodal freight, most rail yards were rail freight yards with little space for trucks. Memphis
had many rail yards that were in urban areas surrounded by residential places. When
containerization became a big item in the 1980s and 1990s, Memphis shippers were running
container trucks through neighborhoods in large quantities. Previously, there had been only
freight cars, and there was no additional traffic to the neighborhood because it was all rail. Thus,
intermodal container traffic became a major concern to Memphis officials.
Memphis railroads started talking about moving their yard to build a larger intermodal facility.
The first major rail carrier to initiate a move was UP. They were talking about moving their new
facility to Marion, Arkansas, on the other side of the river. That got the attention of several
people at the local chamber of commerce, the City of Memphis, and Shelby County, worrying
that the next major industry movement among rail yards could be moving to larger, peripheral
locations that can be expanded without impacting neighborhoods. The idea was not to move the
freight yards but to move containers out of the freight yards and decrease traffic to allow for
room to grow.
The city and the chamber of commerce formed what was called the Super Terminal Committee,
tasked with trying to bring all of the Class 1 railroads together in a single location for optimal
service. At the time, the only option in Memphis of adequate size was a property just south of
Memphis called the Frank C. Pidgeon Industrial Park. Memphis started a $1.2 million process
trying to convince all five local railroads companies to funnel their individual railroad terminals
into one strategic location. It became an arduous task due to independent operation issues.
Nevertheless, after the discussions, UP still decided to go across the river to Marion. However,
the community, the port commission board, and the city and county administrations influenced
most of the railroads to build their new intermodal facilities in or near the Memphis metropolitan
area. BNSF stayed where it was, near Memphis, but with the help of the state, it acquired
additional land and built a new intermodal facility. Norfolk Southern went out east of Memphis
with its east lines, which terminate in Memphis. However, the International Port of Memphis,
ultimately successfully, reached an agreement with Canadian National (CN) and CSX to build a
joint facility in the Memphis industrial park, now called the Gateway Memphis Intermodal
Facility. That process consumed six to seven years to complete.
The industrial park is a levee-protected system with 5,500 acres within the levee that ties into a
bluff. Inside that area is about 3,500 to 4,000 developable acres. Memphis got a designated
industrial road into the park in the 1990s. The city and state spent $35 million to build the road
on top of the levee, which is now a designated corridor to allow access to the park. Part of the
local funds were used as an incentive for Birmingham Steel to construct a mill on the property,
which is now a special quality steel plant operated by Nucor Steel. Since then, business has

26
grown exponentially. The surrounding areas are now home to large facilities, including a
disposal facility and an intermodal yard for CSX and CN, with plans to expand and build
warehousing and distribution facilities over the next decade. The park is at capacity with
clientele.
The biggest issues for the railroads in a study the port conducted was travel times and
consistency for the railroads. That is, how much time and what was the reliability of this time in
getting from their main lines to proposed facility locations. This issue seemed to be equally as
important as operational control, because whenever a railroad had to switch to a competitor’s
railroad lines, it became subservient to the needs of that railroad’s owner. This led to significant
idle time and late shipments.
The International Port of Memphis determined that the forced cooperation between railroad
companies causes both management issues and operational issues among the industry and within
the intermodal port. Therefore, the Gateway Memphis Intermodal Facility has separate gates for
CSX and CN, a shared operator, and no shared data.
Despite state competition, Memphis does try to work jointly with stakeholders in Arkansas;
however, difficulties arise due to the proximity of the Mississippi River, which also acts as a
jurisdictional dividing line between federal agencies, like the U.S. Fish and Wildlife Service.
Development is driven by state governments and local communities that all compete for federal
funding.
The first lesson the International Port of Memphis learned in building intermodal facilities is to
keep the committee overseeing the project small. The International Port of Memphis ended up
having seven or eight committee members. It recommends maintaining a small committee to
minimize resistance to progress. Consequently, the second lesson is to make sure that the people
on the committee are key players and not just figureheads.

27
PROPOSED LOCATION FROM A CARRIER POINT OF VIEW
As shown by the examples above and the current locations of both shippers and existing railroad
facilities, the St. Louis region is a highly likely candidate to benefit greatly from a consolidated
mega intermodal terminal with ease of access and shared intermodal facility costs. Fortunately,
the Terminal Railroad Association of St. Louis (TRRA) has been closely involved in overseeing
railroad operations in the St. Louis metropolitan area. As a result, the TRRA is one of the
proponents in the region that has looked at building a major rail and trucking intermodal hub.
After considering geographic locations of shippers and rail facilities mentioned earlier in this
report, it is proposed that the area highlighted in green in the center circle of Figure 11, where
Norfolk Southern, UP, and BNSF merge, is one of the best-proposed sites for development of a
mega intermodal hub. It is close to existing port facilities, as well as a major distribution center
to the north of it.
© 2018 Google
Figure 11. Area where Norfolk Southern, UP, and BNSF merge together
While considerations of land availability and incentives would obviously require further study,
the supporting rationale for a mega intermodal rail terminal for St. Louis is supported by the
observations gained through the above case studies.

28
CONCLUSION
In conclusion, based on economic and environmental arguments to reduce intercity transfer
costs, which are supported by geospatial analysis, there is a need for the construction of an
intermodal hub in St. Louis that will promote efficient transportation development and minimize
cost for trucking carriers. Looking through both a macroeconomic and microeconomic lens, the
economic arguments suggest that intermodal hub development in the St. Louis region reduces
carbon emissions, creates positive externalities, maximizes net benefits, and leads to
technological progress. There are limited alternatives to the hub, and none of these provides the
optimal tradeoff. Overall, the opportunity cost to current and future generations is too high to not
pursue the construction of a rail and trucking intermodal hub in the St. Louis region.

29
REFERENCES
Association of American Railroads. 2013. The Economic Impact of America's Freight Railroads.
Association of American Railroads, Washington, DC.
https://www.aar.org/data/economic-impact-americas-freight-railroads/
Bureau of Transportation Statistics. n.d. U.S. DOT.
https://www.bts.gov/publications/commodity_flow_survey/
Groothedde, B. R., C. Ruijgrok, and L. Tavasszy. 2005. Towards Collaborative, Intermodal Hub
Networks: A Case Study in the Fast-Moving Consumer Goods Market. Transportation
Research Part E: Logistics and Transportation Review, Vol. 41, No. 6, pp. 567–583.
Iannone, F. 2012. The Private and Social Cost Efficiency of Port Hinterland Container
Distribution through a Regional Logistics System. Transportation Research Part A:
Policy and Practice, Vol. 46, No. 9, pp. 1424–1448.
Intermodal Association of North America. 2013. Intermodal Glossary. Intermodal Association of
North America, Calverton, MD. https://www.intermodal.org/information/glossary.php
Kenneally, M. 1996. The Process in Developing Intermodal Freight Strategies, Kansas City.
Semisequicentennial Transportation Conference Proceedings, Ames, IA, May 1996.
http://www.ctre.iastate.edu/pubs/semisesq/session5/kenneall/. Macharis, C. V., E. Van
Hoeck, E. Pekin, and T. van Lier. 2010. A Decision Analysis Framework for Intermodal
Transport: Comparing Fuel Price Increases and the Internalisation of External Costs.
Transportation Research Part A: Policy and Practice, Vol. 44, No. 7, pp. 550–561.
Meng, Q. and X. Wang. 2011. Intermodal Hub-and-Spoke Network Design: Incorporating
Multiple Stakeholders and Multi-type Containers. Transportation Research Part B:
Methodological, Vol. 45, No. 4, pp. 724–742.
Missouri Department of Transportation. 2017. Missouri State Freight Plan. Missouri DOT,
Jefferson City, MO. http://www.modot.org/othertransportation/freight/FreightPlan.htm
Missouri Economic Research and Information Center. (2014). Missouri Freight Transportation.
Missouri Economic Research and Information Center, Jefferson City, MO.
http://www.missourieconomy.org/industry/freight.stm.
Racunica, I. and L. Wynter. 2005. Optimal Location of Intermodal Freight Hubs. Transportation
Research Part B: Methodological, Vol. 39, No. 5, pp. 453–477.
Seedah, D., T. Owens, C. Bhat, and R. Harrison. 2014. Evaluating Truck and Rail Movements
along Competitive Multimodal Corridors. FHWA/TX-13/0-6692-1. Center for
Transportation Research, University of Texas–Austin, Austin, TX.
http://library.ctr.utexas.edu/ctr-publications/0-6692-1.pdf.
U.S. Army Corps of Engineers. 2011. Table 1084: Freight Carried on Major U.S. Waterways:
1990–2009. In Statistical Abstract of the United States (131st Edition). U.S. Census
Bureau, Suitland, MD.
https://www2.census.gov/library/publications/2011/compendia/statab/131ed/tables/12s10
84.pdf
U.S. Census Bureau. 2014. ZIP Code Business Patterns by Employment Size Class: 2012
Business Patterns. Table CB1200CZ21, using American FactFinder.
https://factfinder.census.gov.

30
U.S. Census Bureau. 2017. Table 1320: U.S. Exports and General Imports of Merchandise by
Customs District: 2005 to 2016. In ProQuest Statistical Abstract of the United States
(2018 Online Edition). ProQuest, Ann Arbor, MI.
https://statabs.proquest.com/sa/docview.html?table-no=1320&acc-no=C7095-
1.28&year=2018&z=86F779CD46468C6BED40921C2B4071950AEC92A5
U.S. Environmental Protection Agency. 2013. Fast Facts US Transportation Sector Greenhouse
Gas Emissions 1990-2011. U.S. Environmental Protection Agency.
https://www.epa.gov/greenvehicles/archives-fast-facts-us-transportation-sector-
greenhouse-gas-emissions

Visit www.InTrans.iastate.edu for color pdfs of this and other research reports.
THE INSTITUTE FOR TRANSPORTATION IS THE FOCAL POINT FOR TRANSPORTATION AT IOWA STATE UNIVERSITY.
InTrans centers and programs perform transportation research and provide technology transfer services for government agencies and private companies;
InTrans manages its own education program for transportation students and provides K-12 resources; and
InTrans conducts local, regional, and national transportation services and continuing education programs.


![TRUCKING INDUSTRY - truck.net.au · [ 6 ] TRUCKING INDUSTRY ENVIRONMENTAL BEST PRACTICE GUIDE ThE AUSTRALIAN TRUCKING ASSOCIATION The Australian Trucking Association (ATA) is the](https://static.fdocuments.net/doc/165x107/5e04335e0db1961dcb6e14ec/trucking-industry-trucknetau-6-trucking-industry-environmental-best-practice.jpg)