Asset Ownership: Statistical Data on Rig Utilization
21
Asset Ownership: Statistical Data on Rig Utilization 2019 Data Analytics Presented By Directorate of Planning, Research and Statistics (PRS) November 23, 2019 www.ncdmb.gov.ng 1
Transcript of Asset Ownership: Statistical Data on Rig Utilization

Asset Ownership: Statistical Data on Rig Utilization
2019 Data Analytics
Presented By
Directorate of Planning, Research and Statistics (PRS)
November 23, 2019 www.ncdmb.gov.ng 1

November 23, 2019(c) Copyright of NCDMB
www.ncdmb.gov.ng2
05
23
21
3 Data Analytics
4 Recommendation
5 Recommendation
042 Research Methodology
Outline
1 Introduction 03
4 Challenges 20
6. Description of rigs

Introduction
The NCDMB Research and Statistics Framework has been developed, to provide clear procedure for data collection,compilation, analytics, dissemination, utilization and archiving. The framework provides that periodic data analytics willbe presented for Assets utilised in the oil and gas industry with focus on Rigs and Marine Vessels. Pursuant to theapproved framework, we hereby present data analytics on Rig utilization. The description of data is summarized below:
1. What to measure:
a. Rig utilization in the industry by types and terrain deployed
b. Cost of Rig acquisition
c. Potential income from Rig utilisation
d. spend distribution tied to deployment of Rigs and inherent supply chain opportunities
2. Data sources:
a. Department for Petroleum Resources (DPR) Annual Report 2017
b. Drilling Rig business fundamentals from selected drilling companies
c. Desk top research
d. Oral interviews with NAPIMS staff
3. Data covered :
a. Rig Count for the period 2015-2018
b. Projected Rig count for 2019
c. Rig day rates as @ 2018
d. Quantitative analysis of supply chain opportunities
e. Collation date- January 2019
4. Limitations of the research:
a. Data on actual number of days Rigs were deployed were not available from DPR annual report, as such dataon industry spend represent potential spend and not actual spend. Potential spend is however credible forthe purpose of this statistical analysis
b. 5 year Rig demand data has not yet been obtained. However data for 2019 forecast adequately describedthe supply chain opportunities inherent in deployment of Rigs
www.ncdmb.gov.ng 3

4
Research Methodology
Data Gathering Analytics Policy Recommendation
1. Rig utilization data gathered from
DPR 2017 annual report
2. Rig day rates obtained from
NAPIMS and Drilling contractors
3. Drilling Rig Business Considerations
including cost of Rigs from ODENL
4. Desktop research on supply chain
opportunities from deployment of
Rigs
1. Descriptive analysis
2. Diagnostics analysis
3. Prescriptive analysis
4. Predictive analysis
1. Promote and sustain growth in
indigenous ownership of Rigs
2. Enforce utilization of local content
compliant Rigs by Operators
3. Develop capacity of local shipyards
to build, service & maintain Rigs of
various sizes
4. Develop and maintain a healthy
pipeline of local service providers ,
to maximise local content value
from supply chain opportunities
connected to deployment of Rigs

Rig Utilization Analytics: Trend by Rig Count
Diagnostics:
1. The Rig count of 29 in 2015 is the highest over the 4 year period 2015-2018 when compared to 12 Rigs in 2016, 16 Rigs in2017 and 33 Rigs that operated in Nigeria in 2018
2. The over 50% drop in Rig count recorded in 2016 and 2017 when compared to 2015 Rig count was attributed to decline inglobal price of crude during the period, while the 100% increase in Rig count in 2018 when compared to 2017 Rig Count isdue to rebound in the price of crude oil during the period.
3. This trend has established a nexus between oil price and demand for Rigs for various operations in the oil and gasindustry
Source: 1) DPR 2017 Oil and Gas Annual Report2) Drilling Rig Business Fundamentals
0
2
4
6
8
10
12
14
16
18
2015 2016 2017 2018
15
5
10
18
6
43
12
8
3 3 3
Annaul Rig Count Trend 2015-2018
LAND/ SWAMP SHALLOW OFFSHORE DEEP OFFSHORE
29 12 16 33

52%21%
27%
2015
LAND/SWAMP
SHALLOWOFFSHORE
DEEPOFFSHORE
Rig Utilization Analytics: Trend by Rig Type
Diagnostics:
1. Over the 4 year period 2015-2018 Land & swamp Rigs accounted for 50.5% of the Rig Count
2. Shallow water Rigs accounted for 29% of Rigs utilized.
3. Deep offshore Rigs accounted for 20.5% of Rigs utilized.
4. The trend shows that over the 4 year period 2015-2018 land & swamp operations accounted for the
highest Rig count compared to other terrains, indicating higher demand for land and swamp Rigs for
onshore operations compared to offshore operations. The trend is consistent in periods of high and low
Rig counts,.
42%
33%
25%
2016
LAND/SWAMP
SHALLOWOFFSHORE
DEEPOFFSHORE
62%19%
19%
2017
LAND/SWAMP
SHALLOWOFFSHORE
DEEPOFFSHORE
55%36%
9%
2018
LAND/SWAMP
SHALLOWOFFSHORE
DEEPOFFSHORE
Annual Rig Utilization Trend by Type of Rig
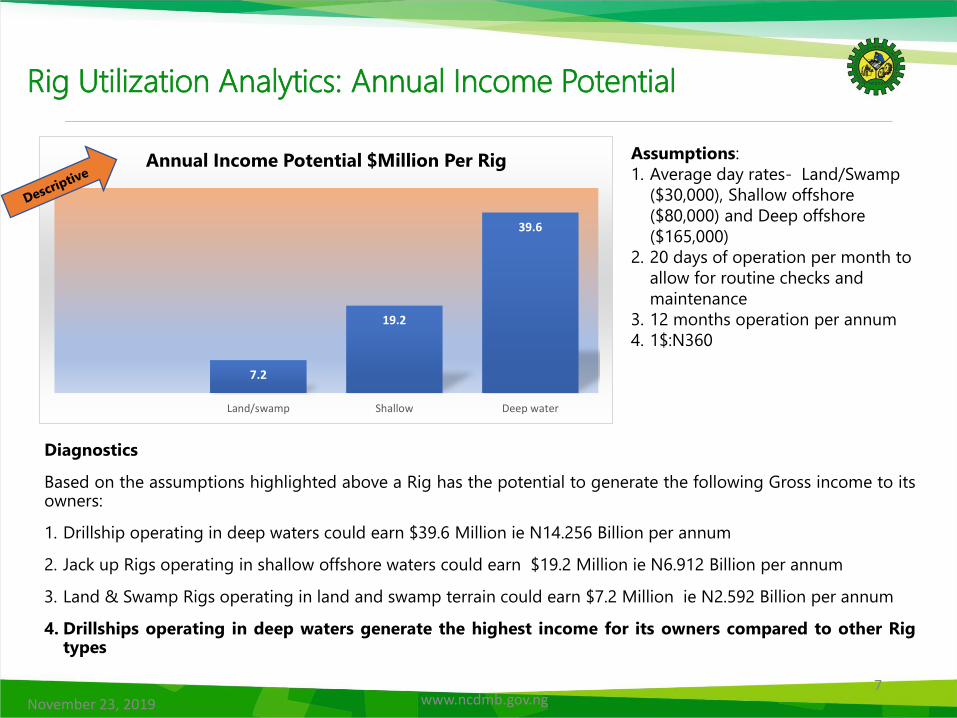
Rig Utilization Analytics: Annual Income Potential
Diagnostics
Based on the assumptions highlighted above a Rig has the potential to generate the following Gross income to itsowners:
1. Drillship operating in deep waters could earn $39.6 Million ie N14.256 Billion per annum
2. Jack up Rigs operating in shallow offshore waters could earn $19.2 Million ie N6.912 Billion per annum
3. Land & Swamp Rigs operating in land and swamp terrain could earn $7.2 Million ie N2.592 Billion per annum
4. Drillships operating in deep waters generate the highest income for its owners compared to other Rigtypes
November 23, 2019 www.ncdmb.gov.ng7
7.2
19.2
39.6
Land/swamp Shallow Deep water
Annual Income Potential $Million Per Rig Assumptions:
1. Average day rates- Land/Swamp
($30,000), Shallow offshore
($80,000) and Deep offshore
($165,000)
2. 20 days of operation per month to
allow for routine checks and
maintenance
3. 12 months operation per annum
4. 1$:N360

Rig Utilization Analytics: Annual Income Potential based on Rig Count
November 23, 2019 www.ncdmb.gov.ng8
Diagnostics
1. The estimated value of contracts awarded for Rig Utilisation, measured by the factors of Rig count and average
day rates for the periods 2015-2018 amounted to $1.50 Billion (N540 Billion).
2. Deep-water Rig with the lowest Rig count during the period (20.5%) accounted for the highest spend at $673.2
Million (N242.4 Billion) or 45% of spend on Rigs
3. Shallow water Rigs with Rig count of 29% during the period accounted for 32% of Rig spend ie $480 Million
(N172.80 Billion)
4. Land and swamp Rig recorded circa earnings of $345.6 Million (N124.4 Billion) representing 23% of spend while it
accounted for 50.5% of Rig count during the period
5. The trend indicates that Rigs operating in shallow and deep waters create more income compared to land
Rigs & swamp , even though land & swamp Rigs account for the highest Rig count
108
36
72
129.6
115.2 76.8
57.6
230.4
316.8
118.8 118.8118.8
0
50
100
150
200
250
300
350
2015 2016 2017 2018
Trend in Annual Contracts (M$) 2015-2018
Land/Swamp Shallow water Deep Water
345.6
480
673.2
1498.8
TOTAL
(M$)
Land/Swamp Shallow water
Deep Water Total

Rig Acquisition Analytics: Comparing Acquisition cost and Rig Operating Margin over Rig Life
November 23, 2019(c) Copyright of NCDMB
www.ncdmb.gov.ng
9
Assumptions-
1. Acquisition cost:
a. Land Rig- $8-25 Million
b. Swamp Rig -$65-90 Million
c. Shallow water- $100-200 Million d. Deep offshore -$400-750 Million
2. Benchmark life span of Rig @ 25
years
3. Operating margin @ 30% of
ongoing Rig rates
0
100
200
300
400
500
600
0 5 10 15 20 25 30
VA
LUES
IN $
M
YEARS
INCOME PROJECTION OVER RIG LIFE SPAN
Land Swamp shallow Deep water
Diagnostics1. Break even point for Land rigs with acquisition cost of $25 Million is 12 years, Swamp Rig with acquisition cost
of $90 Million is 16 years,
2. Break even point for Shallow water with acquisition cost of $200 Million and Deepwater Rig with acquisition
cost of $750 Million is more than 25 years
3. The trend indicates that investment in Rig is a long term venture, requiring special financing model under the
NCIF and other interventions

Predictive Analytics: Rig Utilization Opportunities in 2019
November 23, 2019 www.ncdmb.gov.ng10
Diagnostics
1. Based on the assumption above the demand for Rigs in 2019 is valued at $494M (N177.8 Billion)
2. Supply chain activities provide significant opportunity for local content development
Assumptions-
Rig utilization for 2019 based on
current market information and
ongoing tenders:
1. Land & swamp -18 Rigs
2. Shallow water- 10 Rigs
3. Deep offshore -4 Rigs
4. Total 34 Rigs
0
200
400
600
800
1000
Rate
144
192
158.4
494.4
Contract Opportunities in 2019($M)
Land/Swamp Shallow water Deep water Total

Rig Deployment Analytics: Distribution of OPEX
November 23, 2019 www.ncdmb.gov.ng11
Diagnostics
Analysis of Rig spend distribution reveal that about 60% of OPEX is attributed to 4 activities namely:
1. Personnel expenses account for highest spend @33% of total OPEX
2. Services which comprise vessel charter, JV expenditure account for 21% of OPEX
3. Repairs and maintenance account for 9% of OPEX
4. Catering services account for 4% of OPEX
5. Deliberate capacity building interventions is compelling, to build requisite capabilities and retain spend
associated with these transactions
Personnel Expenses33%
Personnel transportation & accommodation
3%
Catering4%
Freight3%Repair & maintenance
9%
Lubricants1%
Mobilisation armotization
3%Insurance
1%
Misc Regulatory levies and deductions
4%
Communications/IT Maintenance costs
1%
Regulatory Inspections
1%
Services21%
Warehouse costs2%
Office Expenses5%
Depreciation2%
Interest expenses3% Others
3%

Rig Ownership Analytics: Rig Deployment Cycle
November 23, 2019 www.ncdmb.gov.ng12
1) RIG ACQUISITION
ACQUISITIONFinancial services (100%)Legal Services (50%)Insurance services Technical: Marine vessel inspector CMID or OVID
MOBILIZATIONManning Clearing Agents PilotageSupply of safety gear/Mgt (45%)
OPERATIONSea trialsBunkering (60%)Marine lubricantsCatering (100%)Manning (55-60%)Safety audit Waste water treatment (65%)Waste disposal (100%)Lubricants Fresh water Logistics support (30%)
DEMOBILIZATIONTank CleaningClearing agentsPilotage
Rig acquisition is typically a one-off activity while other phases are continuous
50%
30%

Rig Utilization Analytics: Value Chain Opportunities for 2019
• Capital retention in
financial institutions
• Paid up insurance
premium and Tax
revenue to Govt.
$494.4
• Rig construction
• Rig maintenance &
overhaul
• Rig Repairs
• Rig inspection &
certification
$32.2M
• Computer
hardware
• Software • Systems - Power
system, Hoisting
system etc
$3.5
Job types include:
• Roustabout
• Roughnecks and
other
• personnel Salaries
and wages
$113.9M
Category of
lubricants include:
• Gear Oil
• Engine oil
• Hydraulic oil
>$4.8M
Opportunities
include:
• Catering
Services
• Raw food supply
• Quality control
$13.5
Revenue Maintenance,
repair & overhaul IT & Telephony Jobs Lubricants
Offshore
catering
(c) Copyright of NCDMB www.ncdmb.gov.ng
Assume 70% of $494.4 Million is for OPEX ie $346 Million or N124.5 Billion
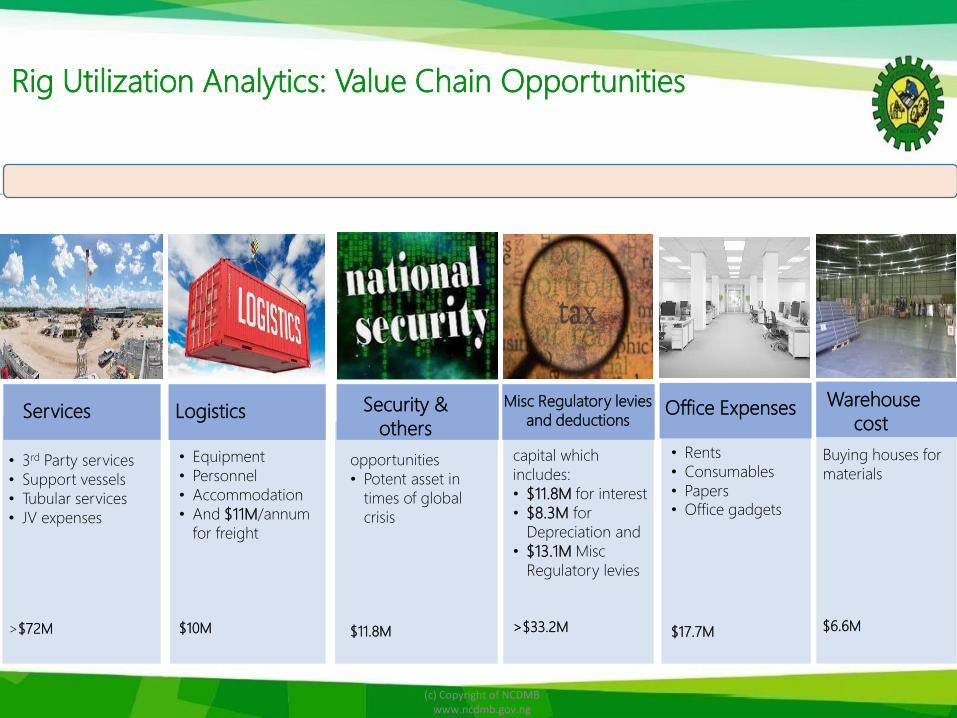
Rig Utilization Analytics: Value Chain Opportunities
• 3rd Party services
• Support vessels
• Tubular services
• JV expenses
>$72M
• Equipment
• Personnel
• Accommodation
• And $11M/annum
for freight
$10M
opportunities
• Potent asset in
times of global
crisis
$11.8M
capital which
includes:
• $11.8M for interest
• $8.3M for
Depreciation and
• $13.1M Misc
Regulatory levies
>$33.2M
• Rents
• Consumables
• Papers• Office gadgets
$17.7M
Buying houses for
materials
$6.6M
Services Security &
others
Misc Regulatory levies
and deductionsOffice Expenses Warehouse
cost
(c) Copyright of NCDMB www.ncdmb.gov.ng
Logistics

November 23, 2019
(c) Copyright of NCDMB www.ncdmb.gov.ng
15
Prescriptive Analytics
Prescriptive analytics will apply the statistical data in recommending policy
actions that will assist the Board in meeting its aspirations for Rig acquisition
and Rig utilization, namely:
1. Promote and sustain growth in indigenous ownership of Rigs
2. Enforce utilization of local content compliant Rigs by Operators
3. Develop capacity of local shipyards to build, service & maintain Rigs of
various sizes
4. Develop and maintain a healthy pipeline of local service providers , to
maximise local content value from supply chain opportunities connected
to deployment of Rigs

November 23, 2019
(c) Copyright of NCDMB www.ncdmb.gov.ng
16
S/no Policy action Responsibility Date
1 Asset financing:
a. Rig count diagnostics reveals that land & swamp Rigs account for 50.5% , shallow water
Rigs 29% while 20.5% of Rig count were Deep water Rigs.
b. Acquisition of Rigs followed the trend of land $25 Million, swamp Rig $90 Million jack up
Rigs $200 Million and Drillships $750 Million
c. Investment in acquisition of land and swamp Rigs can be recouped in year 12 and 16
respectively while jack up and Drillships breakeven point is over 25 years
In order to promote ownership of Rigs, Rig financing products under the NCIF should be
structured as follows:
a. Land Rigs should be structured with a tenor of 10 years
b. Other types of Rigs should be structured with longer tenors above 10 years and through
syndicated financing with other development finance institutions and the capital market
NCDMB (DFPM)
BOI
Q2 2019
2 Contract tenor:
Given the high acquisition cost for Rigs, it is important to have contract arrangements that will
provide comfort to financiers of Rigs. However the practice today is that most Rig contracts are
2years + 1 year option. In some cases contracts are 1 year + multiple 1 year options. The
seemingly short term nature of contracts makes access to finance for Rig acquisition very
difficult, thereby limiting indigenous ownership of Rigs
NCDMB and NAPIMS may consider a review of contract tenors for Nigerian content compliant
Rigs along the following considerations:
a. Land and swamp-2 years + multiple of 1 year contracts
b. Shallow waters (Jackup)- 3 years + multiple of 1 year
c. Deep water (Drillship) - 5 years+ multiple of 2 year
GM PCAD
NAPIMS
Continuous
3 Dissemination of Rig demand data
The data on Rig demand and supply chain opportunities being generated by PRS on an
ongoing basis should form part of data that will be shared to the industry under the NOGOF
platform, to facilitate informed investment decision making
DPRS Q1 2019
Prescriptive Analytics: Promote and Sustain Growth in
Indigenous Ownership of Rigs

November 23, 2019(c) Copyright of NCDMB
www.ncdmb.gov.ng17
S/no Policy action Responsibility Date
1 Categorization of Rig owners
Typical Contracting Process for Rigs takes an average of 18 months – 36 months. This
impacts steady cash flow and discourage investments.
From the analytics on Rig acquisition cost vs Return on Investment, it has been
established that acquisition of high end Rigs require special intervention. Accordingly we
recommend a scheme for categorization of Rigs based on several criteria including
ownership profile, maintenance history, sources of support services etc.
In this regard, ownership profile should be main criteria for land & swamp Rigs while
maintenance history and source of services should be the main criteria for categorizing
Jack up Rig and Drillship
A data base of pre-qualified Nigerian content compliant Rigs that can be referenced by
all operators will shorten the contracting cycle, accelerate contract opportunities and
stimulate new investments.
NCDMB-CB,
PCAD
Q3 2019
2 Rig sharing policy:
Rig count analytics had established a nexus between oil price and demand for Rigs for
various operations in the oil and gas industry. In periods of low crude price, high cost of
hiring Rig and Rig scarcity, some Operators are unable to hire Rigs. Rig sharing concept
has evolved as a veritable model for hiring Rigs under the scenarios highlighted above .
Rig sharing model will require establishment of Rig club by Operators with membership
drawn from Nigerian content complaint Rig owners. The proposed model seeks to confer
the following advantages- optimized Rig schedule/utilization, shared services, cost
reduction and improved production efficiency
We recommend that the Rig sharing model be discussed with Operators and Rig owners
as one of the strategies to deepen all time Rig utilization in the oil and gas industry
NCDMB-CB &
PCAD
OPTS
NAPIMS
Continuous
Prescriptive Analytics: Enforce Utilization of Local Content Compliant Rigs by Operators

November 23, 2019(c) Copyright of NCDMB
www.ncdmb.gov.ng18
S/no Policy action Responsibility Date
1 Rig Maintenance, Inspection & Classification -:
Rigs are required to undergo scheduled maintenance for optimal performance. Available data
indicate that 9% of Rig OPEX is channelled to Rig maintenance, which translates to estimated
$31M (N11 Billion) in 2019. However available data also indicate that dry-docking facilities for
offshore Rigs is limited and exist only in Nigerdock yard Snake Island Lagos.
Based on the forgoing, we hereby propose the following policy actions to maximise local
content value from Rig maintenance:
1. Shipyard upgrade: Shipyard upgrade program anchored by NIMASA should take into
consideration the requirement to establish in-country capacity to construct, integrate,
maintain, repair, inspect and certify Rigs along the following considerations:
a. Land & swamp operations- capacity to fully construct, integrate, maintain, repair,
inspect and certify land & swamp Rigs
b. Shallow water operations - capacity to integrate components of Jack Up Rigs and
capacity to maintain, repair, inspect and certify Jack up Rigs
c. Deepwater operations - capacity to maintain, repair, inspect and certify Drillships
2. Rig Inspection and Certification: Every 5 year cycle, Rigs are required to perform a dry
dock survey, intermediate survey and carry out any identified remedial actions in order to
remain in the design class category-(ABS or DNV). Accordingly we recommend the
following actions:
a. Carry out enumeration of available in-country capacity for Rig inspection and
certification
b. Amplify and promote opportunities for Rig inspection and certification, to attract
and sustain investment to the sector
NIMASA
GM CB
Continuous
Prescriptive Analytics: Develop Capacity of Local Shipyards to Build, Service and Maintain Rigs of Various Sizes

November 23, 2019
(c) Copyright of NCDMB www.ncdmb.gov.ng
19
S/no Policy action Responsibility Date
1 Personnel
33% of Rig OPEX is on personnel expenses. Nigerian manning of Rigs is therefore an avenue to
retain significant industry spend estimated at $114M in 2019
Manpower Development programs and establishment of Training Centres of Excellence under
the industry skills development programs should include training & certification for the various
job categories, namely Ratings, Roustabout/roughnecks, welders/mechanics, rig operators/
Drillers, Engineers, safety and medical personnel
NCDMB- CB
OGTAN
Continuous
2 Catering
Catering services account for 4% of OPEX ie $14 Million opportunity in 2019. The following
actions are required to retain spend in this sector:
1. Carry out enumeration of catering companies and level of participation of Nigerian
companies
2. Develop supplier development program for raw food production, storage, processing and
supply to catering companies in the oil and gas industry. This intervention should focus on
community contractors
NCDMB CB Continuous
3 Services
Services account for 21% of OPEX ie $73 Million opportunity in 2019 . It includes provision of
support vessels, equipment, JV services etc. The following actions are required to retain spend in
this sector
1. Ownership of drilling units and tools by Nigerian companies
2. Attract and protect local manufacturing or assembly of drilling equipment and tools
3. Enforce utilization of Nigerian owned support vessels
NCDMB CB Continuous
Prescriptive Analytics: Develop and Maintain a Healthy Pipeline of Local Service Providers, to Maximise Local Content Value from Supply Chain Opportunities Connected to Deployment of Rigs

November 23, 2019 20
Description of Rigs
Jack-ups
Submersible Rig
DrillShips
Operate at water depth 12,000ft
Operate at water depth 10,000ftOperate at water depth 500ft
Drilling Barge
Operate in Shallow water

November 23, 2019(c) Copyright of NCDMB
www.ncdmb.gov.ng21
The analysis was carried out by:
Abdulmalik Halilu
Ajimijaye Silas
Adeola Omole
Lilly Warri
Arikewuyo Umar Kayode


![[THE] OWNERSHIP OF JOINT HOUSING ACT, 2054 B.S. (1997)...9. Ownership and Utilization of Apartments: (1) Upon making full payment to a promoter by an apartment owner pursuant to this](https://static.fdocuments.net/doc/165x107/61165d54bfac634fb05b2382/the-ownership-of-joint-housing-act-2054-bs-1997-9-ownership-and-utilization.jpg)