Asset management presentation at owea collections conference
39
THE IMPORTANCE AND MECHANICS OF ASSET MANAGEMENT FOR COLLECTION SYSTEMS: The Operator’s Perspective OWEA Collection Systems Workshop Presented by Dr. Steven D. Sanders, P.E.
-
Upload
stevendsanders -
Category
Documents
-
view
202 -
download
0
Transcript of Asset management presentation at owea collections conference

THE IMPORTANCE AND MECHANICS OF ASSET MANAGEMENT
FOR COLLECTION SYSTEMS:
The Operator’s Perspective
OWEA Collection Systems Workshop
Presented byDr. Steven D. Sanders, P.E.

The Objectives of the Presentation
Why is asset management so critcal today?
Why is asset management so important in communicating the condition of the collection system and securing funding?
What is the “Bottom-Up Approach” to asset management and how does it benefit frontline employees?

Setting the Scene
Aging infrastructure that needs more intensive repair and replacement
Continuing regulatory challenges, including the need to often balance priorities among multiple compliance endpoints
Workforce challenges, including aging workforce and difficulties in recruiting and retaining qualified staff
Uncertainty about future federal funding Competing local priorities and the dwindling resource
base in many communities

What is Asset Management?
“The process of decision-making, planning, control over the acquisition, use, safeguarding, and disposal of assets to maximize their service delivery potential and benefits, and to minimize their related risks and costs over their entire life.”
How you manage
your stuff!!

The Collection System Stuff

The 7 ½ Questions of Asset Management
1. What do we own and where is it?
2. What are these assets worth?
3. What is its remaining service life?
4. What condition is it in?
5. What do we spend and what should we spend/invest?
6. What is the gap?
7. How do we get sustainable infrastructure? ½ How resilient is our infrastructure?

GIS BASEDINTEGRATED
ASSETMANAGEMENT
SYSTEM
PRIORITIZEYOUR
FUTUREANALYSIS
MAINTAINREPAIR
REHABILITATEREPLACE
DECISIONMAKING
INSPECTION DATA
COLLECTION
CONDITIONASSESSMENT
DETERIORATIONMODEL
The 7 ½ Questions of Asset Management

The Benefits of an Asset Management Approach
Better communication – good, bad and ugly Better coordination – street department and
collection systems Better cooperation – community and political
interaction and awareness Better decision-making – rehabilitation versus
new Better performance management – transparency Better use of public funds – monitoring and
accountability

The Asset Management Enablers
Field Operations
Processes
Information

The Bottom Up Approach
How long will it last?
What condition is it in?
What do we have and where is it?
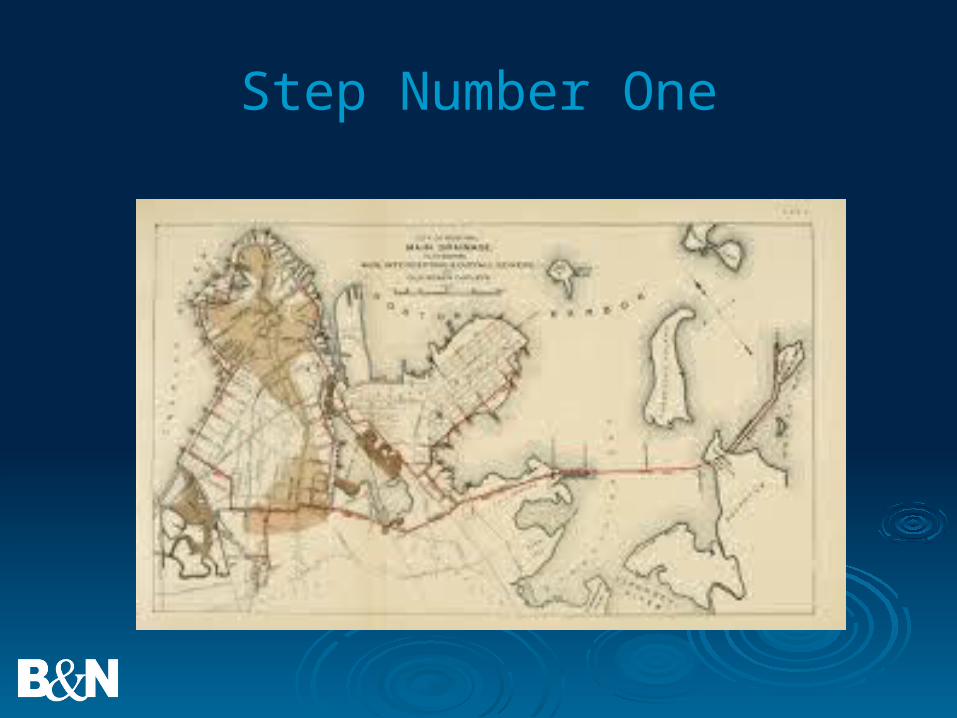
Step Number One

Where Is My Stuff?

Consequence of Not Knowing
“In some cases, the infrastructure in New York is so old we don’t even know where it is under the street . . . There can be a water main break in lower Manhattan and our engineers won’t be able to find it.”

The Risk of Not Knowing
Better communication, coordination, and cooperation

Step Number Two

Ass
et
Per
form
ance
Creation
Rehabilitation
Renewal
Expected Useful Life Extended Life
MinimumPerformance
O&M
What Condition Is It In?Benefit

The Three Conditions of an Asset
The physical condition of an existing asset in the state of that physical infrastructure that allows it to meet the intended service level based on is original functional and demand criteria.
The functional condition of an asset is the state of the design of the physical infrastructure to meet the intended service level as compared to current functional design criteria.
The demand condition of an existing asset is the ability for the capacity of the physical infrastructure to meet the service level required.

Asset Management and 1912 Fenway Park
The Physical Condition
The Functional Condition
The Demand
Condition

The View Up North

Seeing the Condition Trends and Patterns, but . . .
Type Rating 2004 2005 2006 2007 2010
Physical
Good 80% 80% 76% 76% 78%
Fair 14% 13% 17% 17% 16%
Poor 6% 7% 7% 7% 6%
Functional
Good 85% 80% 82% 82% 91%
Fair 11% 16% 15% 15% 7%
Poor 4% 4% 3% 3% 2%
Demand
Good 87% 85% 84% 84% 91%
Fair 8% 10% 13% 13% 7%
Poor 9% 5% 3% 3% 2%

The numbers behind asset management versus . . .
Team Stat Comparison
1st Downs 23 17
3rd down efficiency 11-18 7-15
4th down efficiency 0-1 1-2
Total Yards 418 431
Passing 253 309
Comp-Att 24-31 21-34
Yards per pass 8.2 9.1
Rushing 165 122
Rushing Attempts 46 31
Yards per rush 3.6 3.9
Penalties 4-26 6-56
Turnovers 0 3
Fumbles lost 0 1
Interceptions thrown 0 2
Possession 32:27 27:33

. . . the visual and mapping advantages embedded within asset management

Moving from Codes to English, and . . .
NASSCO Code and Grade
FL 3
D 5
HVV 5
JS 2
SSS 2
MCU 4
Grade Description
Excellent No noticeable defects
Good Only minor deterioration or defects are evident
Fair Some deterioration but function is not impacted
Marginal Moderate deterioration and function is adequate
Poor Serious deterioration and function is inadequate.
Very Poor Extensive deterioration and barely functional.
Failed No longer functions.

. . . moving from English to Maps and Graphics to Information and Patterns
English
Excellent
Good
Fair
Marginal
Poor
Very Poor
Failed

“I didn’t realize my sewer was rated poor.”
English
Excellent
Good
Fair
Marginal
Poor
Very Poor
Failed

Aids in communication, awareness, and support
of collection system asset management.

Investing Over Time
100%
80%
60%
40%
20%
0%
Very Poor Fair Very Good
Poor Good
2015 2016 2017 2018 2019
Strategic Investments

Step Number Three

How Long Will It Last?
Pipe Material Estimated Years to First Failure
Average Years of Remaining Life
Average Years of Total Life
Vitrified Clay 20 100 120
Concrete 20 60 80
PVC 20 80 100
Asbestos Cement 20 60 80
Brick 20 60 80
Ductile Iron 20 60 80
Cast Iron 20 60 80
Corrugated Metal 20 40 60
Lining 20 30 50

The Experience of Field Operations versus the Engineering of Engineers

CONDITION
Very good
Good
Fair
Poor
Very Poor
RemainingUseful Life
Deterioration under routine maintenance
Assessed condition
Expected Useful LifePremature failure under poor cycle-management regime
TIME
Why Asset Management Makes Your Life Easier

Future Directions
RIM Analysis – Rehab,
Inspect, or Mitigate

Closing Thoughts

The Best Outcome – Bottom Up Asset Inventory Registry
1. Unique Asset ID
2. Material
3. Year Installed
4. Anticipated Useful Life
5. Replacement Cost
6. Relative Condition

CA
PA
BIL
ITIE
S
TIME / MONEY
This Is Not Asset Management
Platforms versus 3-ring
Binders

CA
PA
BIL
ITIE
S
TIME / MONEY
This Is Asset Management
Collecting the right information for the rightreasons at the right time to make the right decisions

Why do I have all this information?
How long will it last?
What condition is it in?
What do we have and where is it?
To Make Better Decisions

Where We Want to Get To
Physical Condition Demand Condition
Age
Material
Risk and Consequence RankingMaintenance History
CIP Ranking and Priority
Accurate Mapping
Estimated Design Life
Utility Conflicts
Pump Information

Thank You!
Contact Information – Dr. Steven D. Sanders, P.E.
E-mail – [email protected]
Phone – 972-620-1255