
Asset Management - Goldman Sachs · Global scale across full spectrum of asset classes World-class...
25
0 Asset Management January 29, 2020 Tim O’Neill and Julian Salisbury
Transcript of Asset Management - Goldman Sachs · Global scale across full spectrum of asset classes World-class...

00
Asset Management
January 29, 2020
Tim O’Neill and Julian Salisbury

11
What Drives Our Success
Global scale across full spectrum of asset classes
World-class active asset
manager providing holistic
solutions to a wide
array of investors
Power of Goldman Sachssourcing and distribution
Strong investment performance track record
Ability to leveragebalance sheet

22
Global Scale Across Traditional and Alternatives
$2.3 Trillion Firmwide Investment Platform1,2
Rank3:
Gap to
Leader3: ~$300bn ~$1 trillion ~$800bn ~$200bn NM
#4 #4 #10 #4 NM
Liquidity Fixed Income Equity Brokerage
~$460bn ~$790bn ~$420bn ~$320bn1 ~$280bn2
Complete offering from money markets to private assets
Alternatives
33
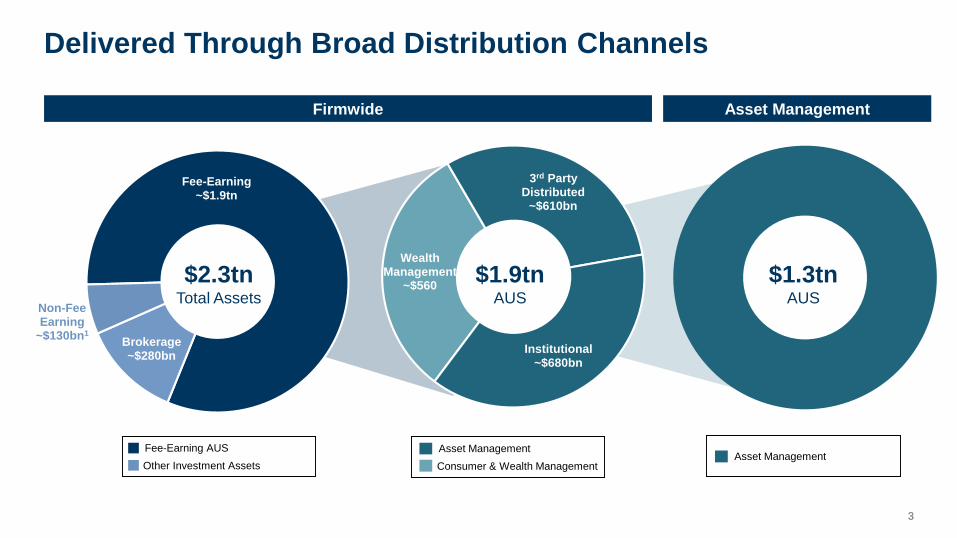
Delivered Through Broad Distribution Channels
Asset ManagementFirmwide
$2.3tnTotal Assets
$1.9tnAUS
$1.3tnAUS
Consumer & Wealth Management
Asset Management
Other Investment Assets
Fee-Earning AUSAsset Management
Fee-Earning~$1.9tn
Brokerage~$280bn
Non-Fee Earning
~$130bn1
WealthManagement
~$560
3rd PartyDistributed
~$610bn
Institutional~$680bn
44
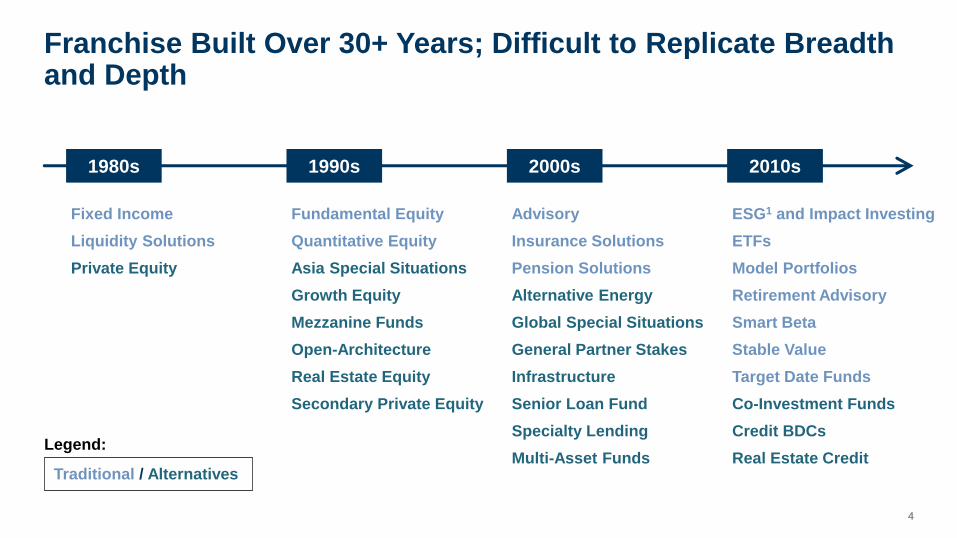
Franchise Built Over 30+ Years; Difficult to Replicate Breadth and Depth
1980s
Fixed Income
Liquidity Solutions
Private Equity
Fundamental Equity
Quantitative Equity
Asia Special Situations
Growth Equity
Mezzanine Funds
Open-Architecture
Real Estate Equity
Secondary Private Equity
Advisory
Insurance Solutions
Pension Solutions
Alternative Energy
Global Special Situations
General Partner Stakes
Infrastructure
Senior Loan Fund
Specialty Lending
Multi-Asset Funds
ESG1 and Impact Investing
ETFs
Model Portfolios
Retirement Advisory
Smart Beta
Stable Value
Target Date Funds
Co-Investment Funds
Credit BDCs
Real Estate Credit
1990s 2000s 2010s
Traditional / Alternatives
Legend:

55
Average Partner tenure of ~19 years
Global Presence Driving Unique Opportunities
~800Investment Professionals
~200Investment Professionals
~200Investment Professionals
• 76% of firmwide AUS1
• Investing since 1980s
• 15% of firmwide AUS1
• Investing since 1990s
• 9% of firmwide AUS1
• Investing since 1990s
Americas EMEA APAC

66
Track Record of Generating Strong Investment Returns: Traditional
Portion of Goldman Sachs Mutual Fund AUS Performing in the Top 50% of Morningstar Funds1
3-Years 5-Years
65%
10-Years
Consistent and persistent track record across traditional investment products
62% 66% 61%
EquityFixed
IncomeQuantitative
Total Funds
69%
52% 73% 79%
EquityFixed
IncomeQuantitative
Total Funds
83%
72% 88% 89%
EquityFixed
IncomeQuantitative
Total Funds

77
7.8%
11.0%
14.4%
MSCI World Net IRR Gross IRR
Track Record of Generating Strong Investment Returns: Alternatives (Principal Strategies)
Corporate Equity 1,2,3
Real Estate Credit 1,2,5
Corporate Credit 1,2,4
5.4%
15.5%
21.1%
MSCI World Net IRR Gross IRR
7.5%8.9%
13.0%
4.9%
9.8%
13.3%
S&P Leveraged Loan +BAML US High Yield
Net IRR Gross IRR
Since Inception Post-Crisis
5.0%
9.8%
13.6%
3.3%
10.7%
14.4%
Bloomberg BarclaysCMBS Index
Net IRR Gross IRR
Since Inception Post-Crisis
Open Architecture Private Assets 2,6
Note: Past performance does not guarantee future results, which may vary.

88
22%
18%
12%
7%
6%
4%
4%
-2%
-4%
-4%
-9%
Goldman Sachs
JPMorgan
BlackRock
Alliance Bernstein
Allianz (PIMCO)
T.Rowe
Morgan Stanley
Legg Mason
Federated
UBS
Invesco
Significant Firmwide AUS Growth Over the Past 5 Years$ in billions
Active LTFB Organic Growth2 (2014 - 2019)
Represents
Top 10 Public
Active Managers
Resulting in Significant Asset Growth as We DeepenClient Relationships
1
$1,178
$1,859
$198
$179
$102
$202
2014AUS
LTFBGrowth
Liquidity 2019AUS
Net Inflows
Acquisitions
Appreciation
$681
$502

99
One Goldman Sachs: Power of our Investment Sourcing Network
Global
Markets
Consumer
& Wealth
Management
Asset
Management
Investment
Banking
Access to Capital
Goldman Sachs
UHNW Clients
Institutional Clients
Intellectual Capital
Operational Expertise
Market Insights
Exit Strategies
Investment Sourcing
Partnering with Clients
Global Footprint
Corporate Relationships
1010
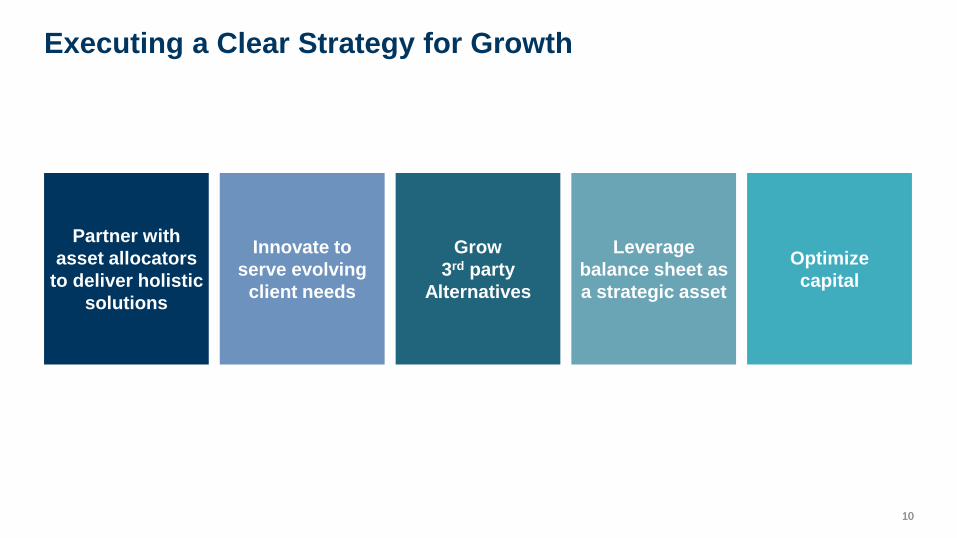
Executing a Clear Strategy for Growth
Partner with
asset allocators
to deliver holistic
solutions
Innovate to
serve evolving
client needs
Grow
3rd party
Alternatives
Leverage
balance sheet as
a strategic asset
Optimize
capital

1111
$1,178
$1,859
~$2.2 trillion2
$681
$250 $100
2014AUS
5-YearGrowth
2019AUS
TraditionalNet Inflows
AlternativesNet Inflows
Longer-termAUS
Split across
Private Equity, Credit,
Real Estate and
Open Architecture
Clear path to continued growthSignificant asset growth achieved
Continuing to Deliver for Our Clients, Fueling Continued AUS Growth
+$350net inflows1
Firmwide View
$ in billions, unless otherwise noted
1212
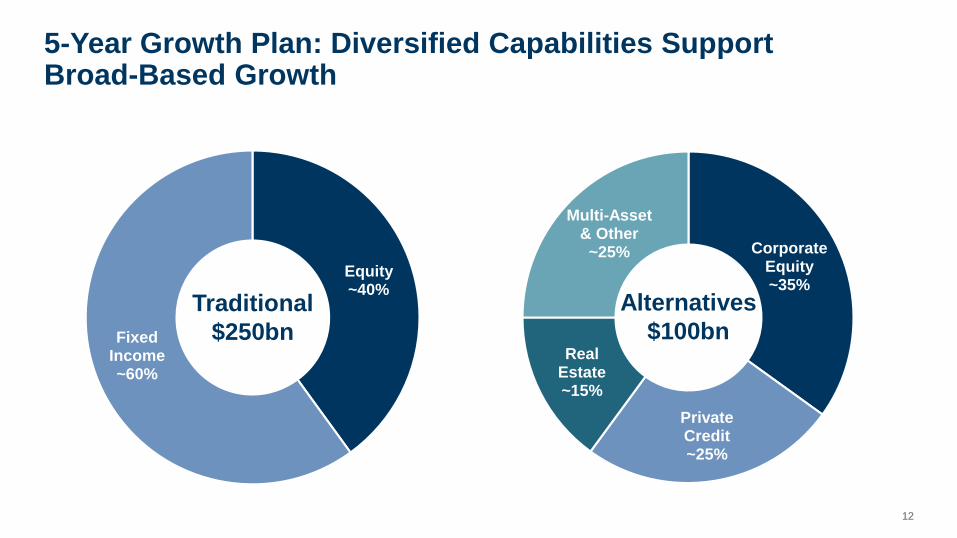
5-Year Growth Plan: Diversified Capabilities SupportBroad-Based Growth
Equity~40%
FixedIncome~60%
Traditional
$250bn
Alternatives
$100bn
CorporateEquity~35%
PrivateCredit~25%
RealEstate~15%
Multi-Asset& Other~25%

1313Capabilities
Partnering with Asset Allocators to Deliver Holistic Solutions
Market
Views
Asset
Allocation
Hedging
Risk
Mgmt.
Asset
Liability
Mgmt.
Outsourced
CIO
Holistic
Advice
Corporates
Financial
Intermediaries
Endowments
& Foundations
Insurers
Pensions
Sovereign Wealth
Funds
1414
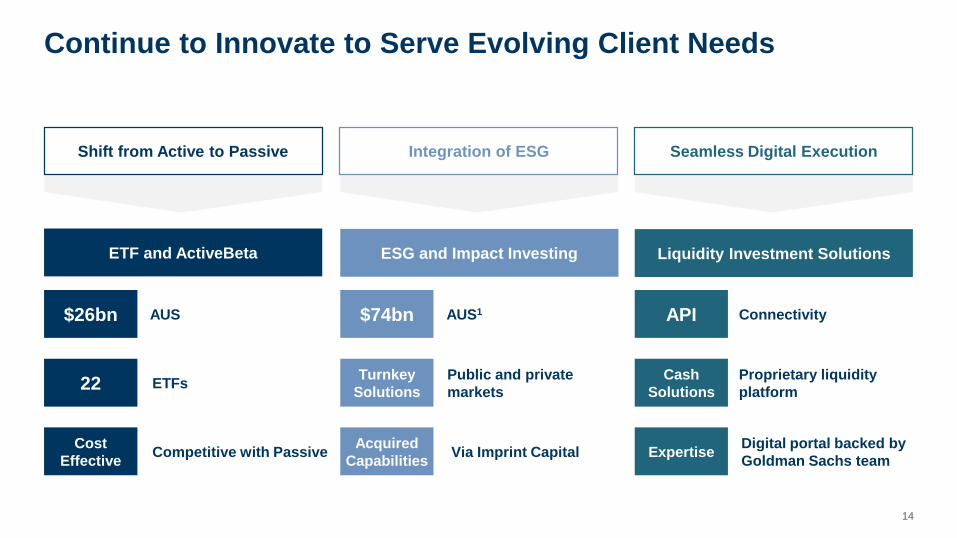
Shift from Active to Passive
ETF and ActiveBeta
$26bn AUS
22 ETFs
Cost
EffectiveCompetitive with Passive
Integration of ESG
ESG and Impact Investing
$74bn AUS1
Turnkey
Solutions
Public and private
markets
Acquired
CapabilitiesVia Imprint Capital
Seamless Digital Execution
Liquidity Investment Solutions
API Connectivity
Cash
Solutions
Proprietary liquidity
platform
ExpertiseDigital portal backed by
Goldman Sachs team
Continue to Innovate to Serve Evolving Client Needs
1515
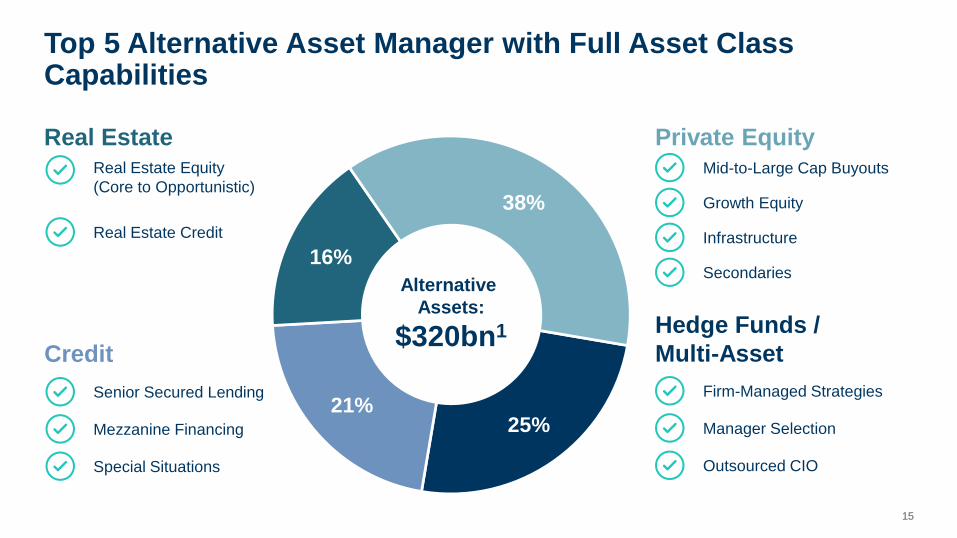
Real Estate Equity
(Core to Opportunistic)
Hedge Funds /
Multi-Asset
Private Equity
Credit
Real Estate
Real Estate Credit
Senior Secured Lending
Mezzanine Financing
Special Situations
Mid-to-Large Cap Buyouts
Growth Equity
Infrastructure
Secondaries
Firm-Managed Strategies
Manager Selection
Outsourced CIO
Alternative
Assets:
$320bn1
Top 5 Alternative Asset Manager with Full Asset Class Capabilities
25%21%
16%
38%

1616
Benefitting Our Clients
Aligned Interests
Investment Sourcing
Benefitting Our Shareholders
Incubation of New Strategies
Meaningful Revenue Contribution
Diversified Across Various Dimensions
Total Portfolio ($62bn)1 Equity Portfolio excluding CIEs ($22bn)2
Asset Class Investments Geography Vintage
~1,000
Investments
Prudently Leveraging Our Balance Sheet
Private Equity27%
Other2%
Credit31%
RE Credit 19%
RE Equity21%
2012 or Earlier
29%
2013 - 201531%
2016 -Present
40%
EMEA17%
APAC33%
Americas
50%
1717
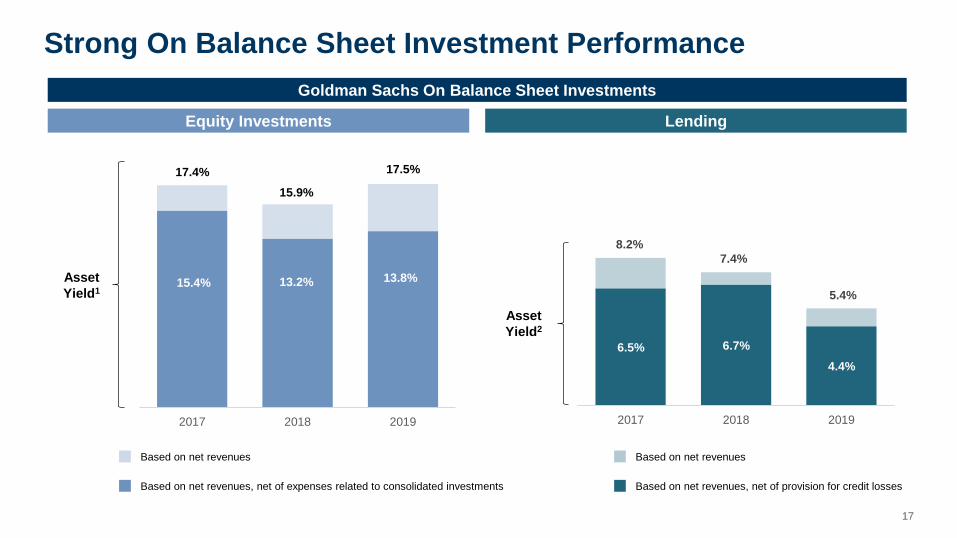
Strong On Balance Sheet Investment Performance
Equity Investments
Asset
Yield1
Lending
Asset
Yield2
Goldman Sachs On Balance Sheet Investments
6.5% 6.7%
4.4%
8.2%
7.4%
5.4%
2017 2018 2019
15.4% 13.2% 13.8%
17.4%
15.9%
17.5%
2017 2018 2019
Based on net revenues
Based on net revenues, net of expenses related to consolidated investments
Based on net revenues
Based on net revenues, net of provision for credit losses

1818
Growth in
3rd Party
Funds
Balance
Sheet
Remix
Current (2019)1
~$1.9tnFee-Earning AUS
(Firmwide)
~$6.3bnManagement and Other
Fees and Incentive Fees
(Firmwide)
~$22bnAttributed
Common Equity
(Asset Management)
~$6.2bnOn-Balance Sheet
Revenues
(Asset Management)
Longer-term
~$2.4tnFee-Earning
AUS
New Capacity
for Growth
Improved
Revenue
Durability
5-Year Growth Plan
+2%Annual Mkt.
Appreciation
+$350bnOrganic AUS
Growth
+$1.6bnAssuming Stable Fee Rate
(32bps) and Incentive Fees
-$4bn
Capital Reduction
Remix Equity to CreditLower Revenues and Risk
3rd Party Growth and Balance Sheet Remix Opportunity(Pro Forma Simulation)
1919
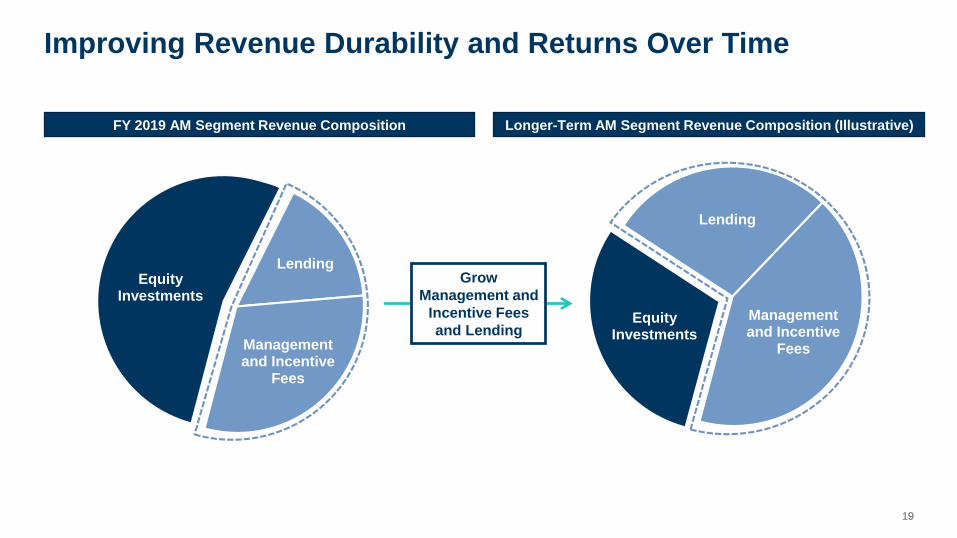
EquityInvestments
Lending
Managementand Incentive
Fees
EquityInvestments
Lending
Management and Incentive
Fees
Improving Revenue Durability and Returns Over Time
Grow
Management and
Incentive Fees
and Lending
FY 2019 AM Segment Revenue Composition Longer-Term AM Segment Revenue Composition (Illustrative)

Asset Management
Tim O’Neill and Julian Salisbury
January 29, 2020

2121
End Notes
These notes refer to the financial metrics and/or defined term presented on:
Slide 2:
Note: Values reflect firmwide investment assets, including assets in Asset Management and Consumer & Wealth segments
1. Includes non-fee-earning assets in Alternatives of ~$130bn, which are not included in reported Assets Under Supervision
2. Includes brokerage assets of ~$280bn, which are not included in reported Assets Under Supervision
3. Data as of 3Q19. Competitor data compiled from publicly available Quarterly Earnings Releases and Supplements, eVestment database, and Morningstar Direct. Where product classification (e.g. fixed income vs. alternatives) and portfolio management style (passive vs. active) were not explicit in competitors’ publicly available data, GS applied certain assumptions for purposes of making comparisons. Peer population represents key competitors tracked internally by product classification and portfolio management style
Slide 3:
1. Non-fee earning assets of ~$130bn includes Goldman Sachs balance sheet investments, employee funds, leverage, cost vs. fair value on Alternatives funds, and unfunded capital
commitments
Slide 4:
1. ESG refers to Environmental, Social, and Governance
Slide 5:
1. Regional AUS includes Asset Management and Consumer & Wealth Management segments, excluding brokerage and non-fee earning assets
Slide 6:
Note, past performance does not guarantee future results, which may vary
1. Represents global funds. Source: Morningstar. Data of December 31, 2019
2222
End Notes
These notes refer to the financial metrics and/or defined term presented on:
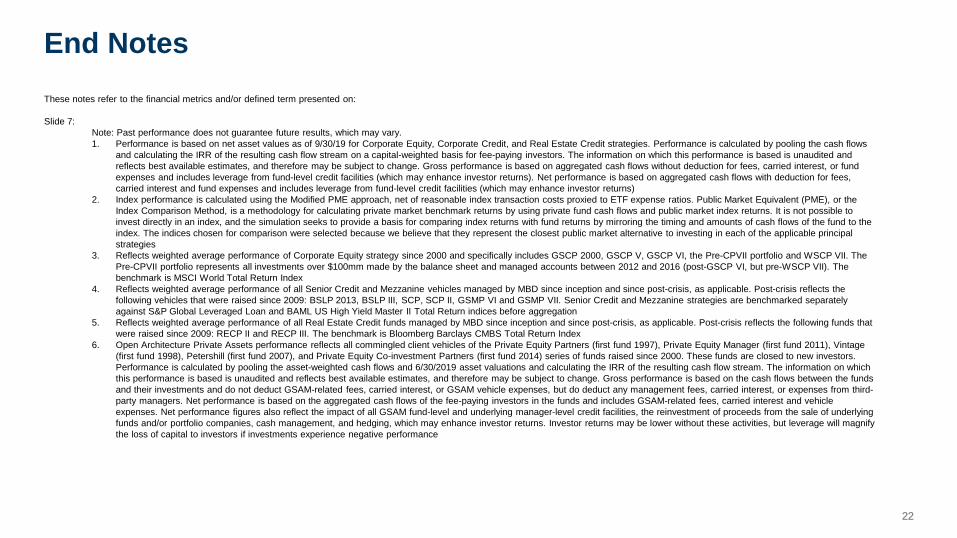
Slide 7:
Note: Past performance does not guarantee future results, which may vary.
1. Performance is based on net asset values as of 9/30/19 for Corporate Equity, Corporate Credit, and Real Estate Credit strategies. Performance is calculated by pooling the cash flows
and calculating the IRR of the resulting cash flow stream on a capital-weighted basis for fee-paying investors. The information on which this performance is based is unaudited and
reflects best available estimates, and therefore may be subject to change. Gross performance is based on aggregated cash flows without deduction for fees, carried interest, or fund
expenses and includes leverage from fund-level credit facilities (which may enhance investor returns). Net performance is based on aggregated cash flows with deduction for fees,
carried interest and fund expenses and includes leverage from fund-level credit facilities (which may enhance investor returns)
2. Index performance is calculated using the Modified PME approach, net of reasonable index transaction costs proxied to ETF expense ratios. Public Market Equivalent (PME), or the
Index Comparison Method, is a methodology for calculating private market benchmark returns by using private fund cash flows and public market index returns. It is not possible to
invest directly in an index, and the simulation seeks to provide a basis for comparing index returns with fund returns by mirroring the timing and amounts of cash flows of the fund to the
index. The indices chosen for comparison were selected because we believe that they represent the closest public market alternative to investing in each of the applicable principal
strategies
3. Reflects weighted average performance of Corporate Equity strategy since 2000 and specifically includes GSCP 2000, GSCP V, GSCP VI, the Pre-CPVII portfolio and WSCP VII. The
Pre-CPVII portfolio represents all investments over $100mm made by the balance sheet and managed accounts between 2012 and 2016 (post-GSCP VI, but pre-WSCP VII). The
benchmark is MSCI World Total Return Index
4. Reflects weighted average performance of all Senior Credit and Mezzanine vehicles managed by MBD since inception and since post-crisis, as applicable. Post-crisis reflects the
following vehicles that were raised since 2009: BSLP 2013, BSLP III, SCP, SCP II, GSMP VI and GSMP VII. Senior Credit and Mezzanine strategies are benchmarked separately
against S&P Global Leveraged Loan and BAML US High Yield Master II Total Return indices before aggregation
5. Reflects weighted average performance of all Real Estate Credit funds managed by MBD since inception and since post-crisis, as applicable. Post-crisis reflects the following funds that
were raised since 2009: RECP II and RECP III. The benchmark is Bloomberg Barclays CMBS Total Return Index
6. Open Architecture Private Assets performance reflects all commingled client vehicles of the Private Equity Partners (first fund 1997), Private Equity Manager (first fund 2011), Vintage
(first fund 1998), Petershill (first fund 2007), and Private Equity Co-investment Partners (first fund 2014) series of funds raised since 2000. These funds are closed to new investors.
Performance is calculated by pooling the asset-weighted cash flows and 6/30/2019 asset valuations and calculating the IRR of the resulting cash flow stream. The information on which
this performance is based is unaudited and reflects best available estimates, and therefore may be subject to change. Gross performance is based on the cash flows between the funds
and their investments and do not deduct GSAM-related fees, carried interest, or GSAM vehicle expenses, but do deduct any management fees, carried interest, or expenses from third-
party managers. Net performance is based on the aggregated cash flows of the fee-paying investors in the funds and includes GSAM-related fees, carried interest and vehicle
expenses. Net performance figures also reflect the impact of all GSAM fund-level and underlying manager-level credit facilities, the reinvestment of proceeds from the sale of underlying
funds and/or portfolio companies, cash management, and hedging, which may enhance investor returns. Investor returns may be lower without these activities, but leverage will magnify
the loss of capital to investors if investments experience negative performance
2323
End Notes
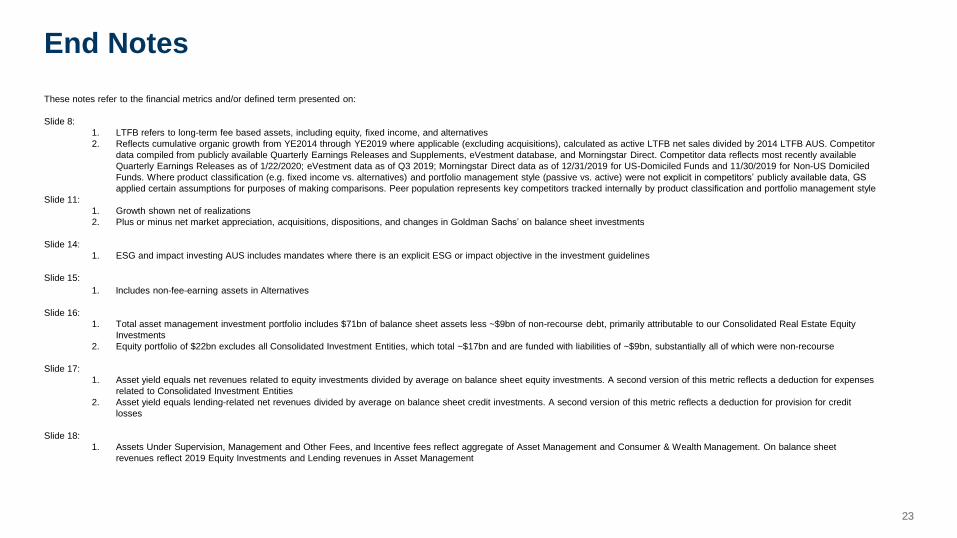
These notes refer to the financial metrics and/or defined term presented on:
Slide 8:
1. LTFB refers to long-term fee based assets, including equity, fixed income, and alternatives
2. Reflects cumulative organic growth from YE2014 through YE2019 where applicable (excluding acquisitions), calculated as active LTFB net sales divided by 2014 LTFB AUS. Competitor
data compiled from publicly available Quarterly Earnings Releases and Supplements, eVestment database, and Morningstar Direct. Competitor data reflects most recently available
Quarterly Earnings Releases as of 1/22/2020; eVestment data as of Q3 2019; Morningstar Direct data as of 12/31/2019 for US-Domiciled Funds and 11/30/2019 for Non-US Domiciled
Funds. Where product classification (e.g. fixed income vs. alternatives) and portfolio management style (passive vs. active) were not explicit in competitors’ publicly available data, GS
applied certain assumptions for purposes of making comparisons. Peer population represents key competitors tracked internally by product classification and portfolio management style
Slide 11:
1. Growth shown net of realizations
2. Plus or minus net market appreciation, acquisitions, dispositions, and changes in Goldman Sachs’ on balance sheet investments
Slide 14:
1. ESG and impact investing AUS includes mandates where there is an explicit ESG or impact objective in the investment guidelines
Slide 15:
1. Includes non-fee-earning assets in Alternatives
Slide 16:
1. Total asset management investment portfolio includes $71bn of balance sheet assets less ~$9bn of non-recourse debt, primarily attributable to our Consolidated Real Estate Equity
Investments
2. Equity portfolio of $22bn excludes all Consolidated Investment Entities, which total ~$17bn and are funded with liabilities of ~$9bn, substantially all of which were non-recourse
Slide 17:
1. Asset yield equals net revenues related to equity investments divided by average on balance sheet equity investments. A second version of this metric reflects a deduction for expenses
related to Consolidated Investment Entities
2. Asset yield equals lending-related net revenues divided by average on balance sheet credit investments. A second version of this metric reflects a deduction for provision for credit
losses
Slide 18:
1. Assets Under Supervision, Management and Other Fees, and Incentive fees reflect aggregate of Asset Management and Consumer & Wealth Management. On balance sheet
revenues reflect 2019 Equity Investments and Lending revenues in Asset Management
2424
Statements about the firm’s target metrics, including its target ROE, ROTE, efficiency ratio and CET1 capital ratios, and how they can be achieved, and statements about future
operating expense (including future litigation expense), amount and composition of future Assets under Supervision, planned debt issuances, growth of deposits and associated
interest expense savings, future geographic location of its employees, and the timing and profitability of its business initiatives, including its launch of new businesses or new
activities, its ability to increase its market share in incumbent businesses and its ability to achieve more durable revenues and higher returns from these initiatives, are forward-
looking statements, and it is possible that the firm’s actual results may differ, possibly materially, from the targeted results indicated in these statements.
Forward looking statements, including those about the firm’s target ROE, ROTE, efficiency ratio, and expense savings, and how they can be achieved, are based on the firm’s
current expectations regarding its business prospects and are subject to the risk that the firm may be unable to achieve its targets due to, among other things, changes in the firm’s
business mix, lower profitability of new business initiatives, increases in technology and other costs to launch and bring new business initiatives to scale, and increases in liquidity
requirements. Statements about the firm’s target ROE, ROTE and CET1 capital ratios, and how they can be achieved, are based on the firm’s current expectations regarding the
capital requirements applicable to the firm and are subject to the risk that the firm’s actual capital requirements may be higher than currently anticipated because of, among other
factors, changes in the regulatory capital requirements applicable to the firm resulting from changes in regulations or the interpretation or application of existing regulations or
changes in the nature and composition of the firm’s activities. Statements about the timing and benefits of business and expense savings initiatives, the level and composition of
more durable revenues and increases in market share are based on the firm’s current expectations regarding its ability to implement these initiatives and may change, possibly
materially, from what is currently expected. Due to the inherent uncertainty in these forward-looking statements, investors should not place undue reliance on the firm’s ability to
achieve these results.
For a discussion of some of the risks and important factors that could affect the firm’s future business, results and financial condition, see “Risk Factors” in our Annual Report on
Form 10-K for the year ended December 31, 2018. You should also read the cautionary notes on forward-looking statements in our Form 10-Q for the period ended September 30,
2019 and Earnings Results Presentation for the Full Year and Fourth Quarter 2019. For more information regarding non-GAAP financial measures such as ROTE, refer to the
footnotes in the Earnings Release and Earnings Presentation for the Full Year and Fourth Quarter 2019 and information on the calculation of non-GAAP financial measures that is
posted on the Investor Relations portion of our website: www.goldmansachs.com.
The statements in the presentation are current only as of January 29, 2020 and the firm does not undertake to update forward-looking statements to reflect the impact of
subsequent events or circumstances.
Cautionary Note on Forward-Looking Statements