Asset Management: A Guide For Water and Wastewater Systems Asset... · asset management. The...
91
2006 Edition Asset Management: A Guide For Water and Wastewater Systems 2006 Edition Prepared by: Environmental Finance Center New Mexico Tech
Transcript of Asset Management: A Guide For Water and Wastewater Systems Asset... · asset management. The...

2006 Edition
Asset Management: A GuideFor Water and Wastewater
Systems
2006 Edition
Prepared by:Environmental Finance Center
New Mexico Tech

2006 Edition i
Acknowledgements
The information presented in this document has been compiled from variou s sources.The overall basis for asset management presented in this document is the approach ofAustralia and New Zealand as presented in the International Infrastructure ManagementManual – Version 2.0, 2002. This information was supplemented with infor mationincluded in EPA’s Advanced Asset Management Training program which is conductedby EPA and GHD Inc. This training program is based on the Australia/New Zealandmethodology that has been tailored for the United States.
Additional information for th is manual was gained through site visits and interviews thatthe EFC Director held with many individuals involved with asset management inAustralia and New Zealand. These interviews were held with asset managementpersonnel connected with utilities, gove rnmental entities, consulting firms, associations,users groups, and elected officials. The specific focus of the interviews was how totailor the asset management principles from larger systems to smaller systems.Information gathered from these interv iews and discussions has been incorporated intothis document.
Lastly, the NM EFC has been providing asset management training to water andwastewater utilities across the state and in several other states and has been workingdirectly with three small water systems in New Mexico to develop asset managementplans. The experiences gained from working directly with systems and fromdiscussions at the training sessions has also been incorporated into this document.

2006 Edition ii
Purpose and Need for Guide
New Mexico’s drinking water and wastewater systems will need to implement newadministrative systems and management tools to allow them to adapt to the increasedregulatory requirements and environmental complexities they face. These new tools willallow the systems to operate on a “business model” for long term sustainability to helpaddress the issues of: new and stricter regulatory requirements, growing populations,increased service demands, limited water supplies, a highly variable climate, aginginfrastructure, and limited state and federal funding.
Cost estimates for water and wastewater system needs in New Mexico are severalbillion dollars, while the existing state and federal funding sources can only meet afraction of this need. These sources of fundin g are not expected to increase, and inmany cases, are declining. Therefore, approaches to reducing the gap between what isneeded and what funds are available will need to be adopted. In addition, funders wantassurance that the investments they make in water and wastewater infrastructure will beadequately managed and maintained to ensure long term sustainability and security.This assurance will require water and wastewater systems to present convincingevidence that they possess adequate financial, t echnical, and managerial capacity toprovide the service that their customers expect, to maintain the infrastructure necessaryto provide that service, and to manage the organization technically and financiallythroughout the life expectancy of the improve ments being financed.
To address these significant challenges, the 2005 New Mexico Legislature passedHJM86, which called for the State Engineer, in collaboration with the New MexicoEnvironment Department and other agencies, to “develop criteria for wat er systemplanning, performance and conservation as a condition of funding.” The results of theHJM86 efforts indicated that requiring specific standards related to water andwastewater system operation, management, and planning is the best way to ensure thatthe millions of dollars in annual state and federal funding is invested in the mostappropriate and cost-effective projects and is provided to systems that have adequatecapacity to protect that investment. The report developed in response to HJM86recommended that systems adopt a “business model” for managing the delivery ofservices that includes:
a five-year financial plan with a fully allocated rate structure; an asset management plan; a water accounting system with full metering; full compliance with the Safe Drinking Water Act (SDWA), the Clean
Water Act (CWA), and all of the regulations of the Office of the StateEngineer and the New Mexico Environment Department;
a governance structure adequate for proper management and oversight;and
participation in regional efforts to collaborate on long term solutions.

2006 Edition iii
In 2006, three Technical Assistance Providers 1 and the State of New Mexico teamed -upto develop guidebooks to help water and wastewater systems better manage their waterresources and plan for their future. The guidebooks are titled:
---Water Use Auditing: A Guide to Accurately Measure Water Use and Water Loss---Financial Planning: A Guide for Water and Wastewater Systems; and---Asset Management: A Guide for Water and Wastewater Sys tems.
These guidebooks address core issues regarding water system sustainability: auditingwater use to reduce water losses and increase system efficiency, financial planning andmanagement to ensure sufficient revenues to sustain operations, and assetmanagement to allow the system to provide a sustained level of service at the lowestlife cycle cost. Water and wastewater system owners, operators, managers, and boardmembers will find that these guidebooks are useful tools for assessing the currentstatus of their operations and for developing strategic plans for sustainable water andwastewater service.
These guidebooks are intended to be used together as integrated tools for efficientmanagement to enable the system to meet future service demands and regulatoryrequirements and to provide for long -term sustainability. For example, assetmanagement is a fundamental step in determining financial resources needed tooperate the system and pay for system improvements, expansions, or replacements.The water auditing program can tie to asset management by providing informationabout the condition of some of the buried assets. The water auditing process also tiesto water conservation and rate setting. Because of these ties, water and wastewatersystem personnel are encouraged to examine all three manuals before beginning theirsystem evaluation. However, the guides can be used independently, allowing a wateror wastewater system to implement the “business model” incrementally, starting with thesystem’s most pressing needs or starting with the easiest success. No matter how thesystem implements the practices, the ultimate goal should be incorporating all three ofthese tools into the system’s standard management practices.
Once initial assessments are complete, findings can and should be used by keydecision makers to guide the future of the water or wastewater system. These are not“one time” activities; it will be important to reevaluate and update this informationannually or whenever the system’s needs change. Over time, the use of the tools canbe increased and enhanced to support more complex and sophisticated operations.
Providing safe and dependable supplies of drinking water and protecting water qualitythrough adequate wastewater treatment is critical to maintaining New Mexico’seconomic vitality and quality of life. These guidebooks should provide the tools neededby water and wastewater systems to actively and consistently analyze currentoperations and future needs in order to develop r obust management systems and well -designed infrastructure to meet these growing challenges.
1 Three technical assistance providers contributed to this project. They are the Environmental Finance Center, NewMexico Rural Water Association, and Rural Community Assistance Corporation.

2006 Edition iv
Table of Contents
Section 1: Introduction
1.1 What is Asset Management1.2 Benefits of Asset Management1.3 Intended Audience1.4 Core Components of Asset Management1.5 Applicability of Asset Management1.6 Updating the Manual Over Time
Section 2: Asset Management: The Way To Do Business
Section 3: Asset Inventory
3.1 Introduction3.2 What Do I Own3.3 Where Are My Assets3.4 What is the Condition of My Assets3.5 What is the Remaining Life of My Assets3.6 What is the Value of the Assets3.7 Organizing the Asset Inventory3.7 Summary
Section 4: Level of Service
4.1 Introduction4.2 What is in the Level of Service Agreement4.3 How Should the Public Be Involved in the Level of Service
Section 5: Critical Assets
5.1 Introduction5.2 Determining criticality
Section 6: Life-Cycle Costing
Section 7: Long-term funding Strategy
7.1 Introduction7.2 Funding Source Available7.3 Rates and Asset Management7.4 Other Sources of Assistance/Information for Long -Term Funding

2006 Edition v
Section 8: Implementation
8.1 The “Just Do It” Philosophy8.2 The Never Ending Process8.3 The Asset Management Plan
Appendix 1: Inventory ResourcesAppendix 2: Level of Service ResourcesAppendix 3: Critical Assets ResourcesAppendix 4: Life Cycle Costing ResourcesAppendix 5: Long-term funding Strategy

2006 Edition 1
Section 1Introduction
1.1 What is Asset Management
All water and wastewater systems are made up of assets, so me that are buried assetsand some that are visible. These are the physical components of the system and caninclude: pipe, valves, tanks, pumps, wells, hydrants, treatment facilities, and any othercomponents that make up the system. The assets that mak e up a water or wastewatersystem generally lose value over time as the system ages and deteriorates. Along withthis deterioration, it may be more difficult to deliver the type of service that the utility’scustomers want. Costs of operation and mainten ance will increase as the assets age.Then, the utility may be faced with excessive costs that it can no longer afford.
There is an approach to managing the assets of the system that can assist the utilitywith making better decisions on managing these aging assets. This approach is calledasset management. The techniques involved in asset management have been refinedby the international community, particularly in Australia and New Zealand.
The International Infrastructure Management Manual defines t he goal of assetmanagement as meeting a required level of service in the most cost -effective waythrough the creation, acquisition, operation, maintenance, rehabilitation, and disposal ofassets to provide for present and future customers. A community, water or wastewaterutility should care about managing its assets in a cost effective manner for severalreasons 1) these types of assets represent a major public or private investment; 2) well -run infrastructure is important in economic development; 3) pr oper operation andmaintenance of a utility is essential for public health and safety; 4) utility assets providean essential customer service; and 5) asset management promotes efficiency andinnovation in the operation of the system.
The intent of asset management is to ensure the long -term sustainability of the water orwastewater utility. By helping a utility manager make better decisions on when it ismost appropriate to repair, replace, or rehabilitate particular assets and by developing along-term funding strategy, the utility can ensure its ability to deliver the required level ofservice perpetually.
1.2 Benefits of Asset Management
There are many positive benefits of asset management. Systems that fully embraceasset management principals ma y achieve many or all of these benefits. However,systems may receive some of these benefits just by starting asset management. Thebenefits of asset management include, but are not limited to, the following:
Better operational decisions Improved emergency response Greater ability to plan and pay for future repairs and replacements

2006 Edition 2
Increased knowledge of the location of the assets Increased knowledge of what assets are critical to the utility and which
ones aren’t More efficient operation Better communication with customers Rates based on sound operational information Increased acceptance of rates Capital improvement projects that meet the true needs of the system
Systems should strive to achieve as many benefits as they can with their assetmanagement program.
1.3 Intended Audience
This guide to asset management is intended for any water and wastewater system, butit is intended to be a starting point for systems. For systems that wish to have a morerobust asset management program, there are many gui des and resources that can helpachieve a higher-level program. In addition, systems with greater economic resourcesmay wish to seek out consultants specializing in asset management to aid them indeveloping a more detailed asset management program.
This manual contains all the basic elements of asset management, but does not go intoextreme depth on any of the topic areas. The manual is structured for systems that willnot be able to handle extremely sophisticated asset management techniques at thistime. Over time, however, systems will be able to improve their asset managementprograms and will be able to increase the sophistication of the programs. Somesystems may form cooperative arrangements with other systems that would allow themto eventually achieve an even higher level of sophistication.
1.4 Core Components of Asset Management
There are five core components of asset management. This manual will discuss eachof these components in greater depth. A general discussion of the component can befound in Sections 3 through 7. There is also an appendix for each of these componentsthat provides resource information and specific details regarding options for conductingeach component.
Asset Inventory Level of Service Critical Assets Life Cycle Costing Long-term Funding Strategy

2006 Edition 3
1.5 Updating this Manual Over Time
Asset management is a core business principle that will underlie everything a water orwastewater system does. As such, it is not a “side activity” that can be completed. Itbecomes the way a system does business and therefore is always ongoing to someextent. Therefore, systems will be continuously updating and improving their assetmanagement programs. Thus, this asset management manual needs to be updated tokeep pace with the systems using it. As utilities move forward with asset management,it may become apparent that portions of the document need to be revised or newsections need to be added. This document will be revised over time to include newinformation, new techniques, or greater clarification.

2006 Edition 4
Section 2Asset Management: The Way To Do Business
One of the most important aspects of asset management is that it cannot be somethingthe utility does on the side as one of its many activities, rather it must be the w ay theutility does business. Asset management thinking must underlie every activity, everyaction, and every decision that the utility undertakes.
Having asset management underlie all of the utilities activities means that there must be“buy in” of the asset management concepts at all levels of the utility from the leastsenior employee all the way through the highest elected official or manager. Every levelof employee must be convinced that asset management is important to the overallfunction of the utility. If there is insufficient acceptance of asset management, the planwill be much less successful and may not succeed at all.
One way to obtain acceptance of asset management is to explain to each employee orvolunteer working with the system t he overall goal of the system’s asset managementstrategy and how that particular employee will input into the process. When assetmanagement is adopted as the way of doing business, each employee’s input,knowledge and expertise is important to the proce ss and all are critical to the successfulimplementation.
Each activity that is undertaken must have asset management thinking at its core. Forexample, when working on the water system to fix a break, the operator should have amap of the system and indicate on it the exact location of the break. The operatorshould note all pertinent information to the asset management program, such as:location of break, type of break, type of pipe, type of repair, length of time from report ofleak to response to scene, length of time to repair the pipe, materials used, anddifficulties encountered. This information can then be used in many ways. Did thesame pipe break multiple times? Has the system experienced more breaks on one typeof pipe than another? Did the operator respond in a timely manner? Did the repair getfixed in a timely manner? By tracking this type of data a utility manager can begin todevelop a picture of the overall system and its operation.
Another example is a customer complaint. When the utility receives a customercomplaint, it should track various items such as: What routine maintenance oroperational activities were taking place in the time frame before the complaint? Is thereany unusual condition that would cause this type of pro blem? Has this complaint beenmade before? Is there a pattern of complaints of this type (same area, same source,etc.)? Has an operator been dispatched to check out this type of complaint? How longdid it take to respond?
Throughout the entire utility – whether it has 3 employees or 300 – everyone should beconsidering how their activities impact the overall operation of the utility and how theiractivities fit within the broader structure of the asset management plan.

2006 Edition 5
One of the best approaches to re ceiving buy-in or acceptability of the assetmanagement program at all levels of the water or wastewater system, is to demonstratesuccesses using the asset management techniques. There are many small successesthat the program may demonstrate over time t hat can be used to convince evenreluctant employees or volunteers that the efforts will benefit the utility. As an example,producing a map showing the system’s assets in a visual format can be of great benefitto the system, especially if there has neve r been a good map showing these assets.

2006 Edition 6
Section 3Asset Inventory
3.1 Introduction
The first core component of asset management is the asset inventory. This componentis probably the most straightforward of all. It is also, arguably, the most impor tant as itunderlies all other aspects of asset management. Some asset managers of systems inAustralia and New Zealand believe that this step is absolutely critical for a water orwastewater utility and feel that completing this component alone can great ly improve asystem’s management.
The types of questions that the utility will ask themselves in this component are: Whatdo I own? Where is it? What condition is it in? What is its remaining useful life? What isits value? Each of these facets is discu ssed in more detail below.
3.2 What do I own?
The most fundamental question a utility owner, manager, or operator can ask, is whatassets do I have? It is absolutely critical for a utility to understand what it owns. It ispretty hard to manage something effectively if you don’t know what that “something”consists of.
Although “what do I own” is a seemingly straightforward question, it is not always easyto answer. The difficulties arise from several factors: some of the assets areunderground and can’t be seen; assets generally are put in at different times over a longperiod of time; records regarding what assets have been installed may be old,incomplete, inaccurate, or missing; and staff turnover in operations and managementmay limit the historical knowledge of system assets. Given these difficulties it willprobably not be possible to form a complete asset inventory the first time the systemattempts to do so. It is important to recognize that the system is only trying to form thebest inventory it can and develop an approach to adding to or improve the databaseover time.
To develop the initial inventory, several approaches can be used and these are listedbelow. However, the utility should be as creative as possible with other approaches t oobtaining this information.
Determine who was operating, managing and/or owning the system at thetime of the major construction periods (when a large number of assetswere put in.) Interview these individuals and gather as much informationas possible regarding their recollections of what assets were installed andwhere they were installed. If there are maps of the system, these can beused during the discussions.
Examining any as-built or other engineering drawings of the system

2006 Edition 7
Visual observations of above-ground or visible assets (e.g., hydrants,pumps, manholes, treatment works)
Interviewing community residents who may have lived in the area duringconstruction and who are familiar with the construction activities(especially helpful in very small to wns in which the residents were activelyinvolved in developing the utility)
Estimates on buried assets using above ground assets as a guide (e.g.,using manholes to estimate locations, size, and type of pipe between themanholes; using isolation valve loc ations to estimate buried water pipelocations)
Several approaches may be necessary to get a good start on the asset inventory. Autility should use as many approaches as it deems necessary to get the best initialinventory of assets.
3.3 Where are my assets?
The next question in inventorying the assets is where are they? Once you know whatyou have, it is important to know where they are. This component involves two steps: 1)mapping the assets and 2) putting a location in the inventory. In terms of mapping, themost important factor is to have a visual picture of the asset locations, especially theburied assets. The map can be as simple (hand drawn) or as complex (GeographicInformation System) as the system is capable of. The most important fact or is that it isuseable to track any changes to the asset inventory and can be used to track assetfailures. Several different approaches to mapping are discussed in Appendix 1.
The second aspect involves putting a location in the asset inventory indica ting wherethe asset is located. Generally, this would be a street name, street address, or buildinglocation such as pump house or treatment building. The addresses should be asspecific as possible. That way, assets can be grouped together based on th eir location.It is important to be able to group assets by their category (i.e., all valves, all hydrants)and by their location (all assets on main street.) In this manner, the system can answervarious questions about their system, such as, “If I repl ace the pipe on main street, whatother assets are associated with that pipe that will also have to be replaced?” “If Ireplace a component in the treatment building, what other assets might be impacted?”
The location of the asset should be included al ong with the other inventory data to allowthe types of querying discussed above. Methods of including data in an inventory arediscussed further in Section 3.7 below.
3.4 What is the condition of my assets?
After the assets are determined and located on a map, it is important to know thecondition of the assets. A condition assessment can be completed in many differentways, depending on the capability and resources of the system. In terms of thesimplest approach, the system can gather people who h ave current or historical

2006 Edition 8
knowledge of the system in a room. The group can then select a condition rankingapproach (0 through 5, A through F, Excellent through unacceptable, etc.) and ask thegroup to look at the list of assets and rate each asset using the selected methodology.This approach uses the best information available but does not require systems togather additional data in order to rate the assets.
As a higher level approach or as a next step after the initial ratings of the assets,systems can gather data on asset condition through more sophisticated means and re -rate the assets. As an example, a sewer can be televised to determine the interior pipecondition. Water pipes can be evaluated using leak detection technology. A rankingsystem as described above may still be used with this higher -level data, or a moresophisticated numbering system can be used. Examples of these types of rankingsystems are included in Appendix 1.
3.5 What is the remaining life of my assets?
All assets will eventually reach the end of their useful life. Some assets will reach thispoint sooner than other assets. In addition, depending on the type of asset, it will eitherreach that point through amount of use or length of service. For example, a pump willwear out sooner if it is used more and will last longer if it is used less. The actual ageof the pump is not as important as the amount of work the pump has done. On theother hand, pipe assets wear out based more on the length of time in the ground. If apipe is in the ground for decades it has had considerable time to contact the soil aroundit and the water within it and may start to corrode.
There are many additional factors that will affect how much life a given asset has.Factors such as poor installation, defective materials, poor maintenance, and corrosiveenvironment will shorten an asset’s life, while factors such as good installationpractices, high quality materials, proper routine and preventative maintenance, and non -corrosive environment will tend to lengthen an asset’s life. Because of these site -specific characteristics, asset life must be viewed within the local context and theparticular conditions of that utility. Cast Iron pipe may last 100 years at one facility and30 years at another. It is best to make judgments on asset life based on pastexperience, system knowledge, existing and future conditions, prior and future operationand maintenance, and similar factors in determining useful life. In the absence of anybetter information, a system can use standard default values as a starting point.However, over time, the system should use its own experiences to refine the usefullives.
As an example, if a given water utility routinely replaced its chlorinator every 5 yearsbecause that was as long as that asset lasted, then 5 years should be used aschlorinator life, not a standard default value. However, if the system only had its pipe inthe ground for 20 years and had no knowledge of how long it could be expected to last,it could use a standard default value of between 50 to 75 years. However, as time goeson, if the system did not notice any reduction in the integrity of the pipe after 40 years,the useful life could be increased from 50 years to say 75 to 100 years. If the system

2006 Edition 9
started seeing a reduction in the pipe integrity (lots of breaks due to corrosion) at 40years, it would keep the useful life closer to 50.
Additional information regarding useful lives is contained in Appendix 1.
3.6 What is the Value of the Assets?
Generally, when utilities consider the value of assets, they think about the cost ofinitially installing the assets. This cost has no other importance than historicalinformation or it can be used by a system that depreciates the costs of asse ts over time.However, the installation cost does not have a direct bearing on what it will cost toreplace that asset when it has reached the end of its useful life. The asset may not bereplaced by the same type of asset (e.g., cast iron pipe may be re placed by PVC pipe)or it may be replaced by a different technology entirely (e.g., a chlorination systemreplaced by an ultraviolet disinfection facility). Furthermore, costs of various assets maychange drastically over time, such that the cost of insta lling pipe in 1956 in no wayreflects the costs of installing pipe 50 years later in 2006. Some prices may increase,such as materials, while technological advances may decrease other costs.
The real value of the assets is the cost it would be to repla ce the assets using thetechnology the system would employ to replace them. If the system has asbestoscement pipe now, but would replace the system with PVC pipe, the real value of theassets is the cost of replacement using PVC and the installation cost associated withPVC.
Although the idea behind an asset value is relatively simple, obtaining costs for theasset replacement is not as easy. Small utilities may not have the expertise to estimatereplacement costs. In these cases, the utility should either estimate in the best mannerpossible or leave this portion of the inventory blank for the initial stages of the assetmanagement strategy. This information can be added later as the system gathersadditional information or expertise.
If estimation is done, the possible approaches include:
If the system has had recent improvements, such as pipe replacement,information regarding the cost per linear foot can be used.
If a neighboring system that is similar has had work done, costs obtainedin their project may be used.
Organizations that complete a large number of construction projects peryear may be able to provide estimates, such as New Mexico EnvironmentDepartment’s Construction Programs Bureau, Rural Development or NewMexico Finance Authori ty.
Some organizations, such as the City of Albuquerque, periodically publishunit costs for construction. These costs can be used as a starting pointand revised as necessary to cover costs in other areas. If costs are

2006 Edition 10
typically higher in a particular a rea than Albuquerque, they can be raised,if costs are typically lower, the prices can be decreased.
Over time, as more systems begin completing asset management strategies, a usersgroup can be formed that will allow water or wastewater utilities to shar e information,such as unit costs/replacement costs with each other.
3.7 Organizing the Asset Inventory
There are many options regarding how to manage the asset inventory data. Specificoptions include:
Commercially available software for asset inven tory Generic database software Spreadsheet software Hand written inventory
These options are discussed in greater detail in Appendix 1. The best option is aspecifically designed asset management software program. This type of programprovides the greatest level of flexibility in terms of use and is already programmed tocontain asset inventory data. However, this type of program is expensive and mayrequire a robust computer system to make it accessible to all operational andmanagement personnel.
The next option, generic database software, is much less expensive but will require atime commitment on the part of someone within the utility to set up the database andinput the data. This option will, however, allow the system to sort the information a ndwill allow the information to be useable. This option is the recommended option forsmaller systems that cannot afford commercial software. If the system cannot initiallydevelop a database for their asset inventory, they should develop a plan for how theywill get a database in the future. For example, if they need to purchase a computer orsoftware, they should begin setting aside funds for that purpose.
The other options available, spreadsheets and handwritten inventories, should only beconsidered temporary solutions until the system can obtain a database of some type(the first two options.) Neither of these approaches allows the system to easilycategorize information and both are very cumbersome to use. Neither approach allowsthe type of querying that an asset management database needs. For example, adatabase can answer the question, “Provide me a list of all pipes installed in 1950 thatare cast iron that have had at least 1 break in the last 10 years.” This list can beobtained in a matter of moments with a database. However, with a handwritten list or aspreadsheet, answering a question like this would be an extremely tedious and time -consuming activity.

2006 Edition 11
The key with the inventory is to structure it to provide the information the system needsin an easy to retrieve fashion. If the data is not easily obtainable, the system will notuse it and the inventory ceases to have value or as much value as it can.
3.8 Summary
It is critical for systems to understand that they do not need t o worry about the dataquality initially. The most important step is to develop at least a rudimentary assetinventory with all of the characteristics discussed above. The data quality can beincreased over time as the system gathers more information and becomes morecomfortable with the concept of asset management.
Systems should also be careful to not let themselves get “bogged down” in this step.This step is important but it should not be all consuming. The system should completethis step to the extent possible and then move on to the other steps.
In taking a long-term view of asset management, systems should consider ways inwhich they can make the inventory more sophisticated. As an example, a system maywant to develop a GIS map and datab ase within 10 years. The system could beginsaving money for this approach now so that in 10 years sufficient funds are available.Systems can also work with neighboring systems to share GIS equipment or GISspecialists to reduce the costs for all partic ipants. A group of systems could contractwith a local university or community college or consulting firm that has a GIS employee,student or professor to get them to manage the GIS software for all participants. Thisperson could provide updates or prin t outs of information to the system.

2006 Edition 12
Section 4Level of Service
4.1 Introduction
A Level of Service Agreement (LOS) defines the way in which the utility owners,managers, and operators want the system to perform over the long term. The LOS caninclude any technical, managerial, or financial components the system wishes, as longas all regulatory requirements are met. The LOS will become a fundamental part ofhow the system is operated.
4.2 Why a Level of Service Agreement?
There are two key facets to asset management – defining the level of service thesystem will strive to provide its customers over the long term and determining the mostefficient and economical way to deliver that service (the least cost approach).Therefore, determining and de tailing the level of service that the system is going toprovide is a key step in the overall process.
The Level of Service Agreement – the document that will spell out the service thesystem wishes to provide – is a multi-faceted tool that can fulfill a wide array ofpurposes as described below. Further explanation regarding each of these itemsfolllows.
Communicate the system’s operation to the customers (residential,industrial, or commercial)
Determine critical assets Provide a means of assessing ove rall system performance Provide a direct link between costs and service Serve as an internal guide for system management and operations staff Provide information for system annual report or annual meeting
presentation Reduce system costs through customer i nvolvement
Customer CommunicationIt is important for a water or wastewater utility to communicate with its customers toavoid confusion, bad feelings, accusations of improper operation, and to make clearwhat the customer’s expectations should be. This need for communication isparticularly important for smaller, rural systems, but it is important for all.
As an example, consider a system that has periodic water outages. The system is fedby wells or springs that periodically stop producing water or p roduce less water.However, not all sources are depleted at once, so the system can serve somecustomers but not others. The system may have a plan to deal with this situation bymoving water around the system so that different areas are without water on any given

2006 Edition 13
day or portion of a day. However, it is critical that this plan be communicated with thecustomers so that they will understand the approach the system is taking to address thesituation. One way the system can achieve this communication is to have theirapproach be part of the LOS. The LOS could say, “In the event of an outage, thesystem will move water around so that no area is without water for more than 1 day.The rotation of water movement will be posted in a public area so that custome rs knowwhen they will be with and without water.”
Determine Critical AssetsThe LOS can be one factor in determining critical assets. Further considerations incriticality are discussed in the next section. An example of how the LOS can impactcriticality is where a system’s LOS includes the factor “water will be delivered tocustomers 99% of the time.” If the system has only one water source, the source willbe a critical asset for the system. It must keep the source operational at all times inorder to meet this criteria.
Provide a Means for Assessing Overall System PerformanceIf at least some of the LOS factors include measurable items, the system can keepinformation regarding how well they are meeting these criteria and use that as onemeasure in assessing the overall operation. For example, consider a system thatincludes the following measures in its LOS:
Breaks will be repaired within 6 hours of initiation of repair 95% of thetime.
Customer complaints will be responded to within 24 ho urs, Mondaythrough Friday.
Losses will be kept to less than 15% as measured by gallons pumpedeach month – gallons sold each month.
System will meet all state and federal regulations.
All of these items are measurable if the system collects the appropria te data. Assumethe system has the following data from its past year of operation.
250 breaks occurred, 230 were fixed in less than 6 hours 30 complaints were received, all 30 responded to within 24 hours Losses over the year as follows: January 12%, Feb ruary 10%, March
19%, April 14%, May 9%, June 13%, July 9%, August 10%, September12%, October 9%, November 10%, December 12%
System met all regulations; no violations
Based on this data, the system met some, but not all of its LOS factors. The followingitems were met: The customer complaints were responded to on time and the systemmet all the state and federal regulations. The following items were not met: breaks werenot repaired within 6 hours and the losses were not kept to less than 15% in all mon ths.The system can look at these results and determine the items that it needs to workharder on in order to meet the level of service requirements.
2006 Edition 14
Provide a Direct Link Between Costs and ServiceThere is a direct link between the Level of Service pr ovided and the cost to thecustomer. When a higher LOS is provided, the costs to the customers will likelyincrease. This relationship provides an opportunity for the water system to have anopen dialogue with its customers regarding the LOS desired and the amount thecustomers are willing to pay for this level of service or increased services. For example,customers may complain about aesthetic contaminants in the water – thosecontaminants that cause taste, odor, or color issues in the water, but not h ealthconcerns – and wish to have these contaminants removed. The water system caninstall treatment to remove these contaminants but it will cost each customer more fortheir water each month. The water system can have a dialogue with the customers toexplain what the treatment would entail, what the finished water quality would be, andhow much it would cost the customers. Following the discussions, the customers coulddecide whether or not they were willing to pay for the additional treatment. In thi s way,the LOS sets desired services and provides information to the customers regardingwhat the costs of their LOS will be.
Serve as an Internal Guide to System Operation and ManagementIt is much easier to operate or manage a system when the operations and maintenancestaff as well as the management staff understand the goals of the operation. Definingthe LOS sets these goals for the system. These goals allow the operations staff to havea better understanding of what is desired from them and the man agement has a betterunderstanding of how to use staff and other resources more efficiently and effectively.Checking how well the system is meeting LOS also allows the management to shiftresources if need be from one task to another to meet all the goal s more effectively.
Provide Information for Annual Report or MeetingIf the system tracks information regarding how well it is meeting the LOS criteria on aweekly or monthly basis, it can use this information to prepare an annual reportregarding how well the system met these criteria over the course of a year. Thisinformation can be presented to the customers at an annual meeting so that customersare aware of how well the system met the overall goals for the operations of the system.This meeting would also be an opportunity to discuss any changes needed in the LOS,based on the operations data. Perhaps some of the LOS conditions are not possible tobe met given the current staff or resources. If that is the case, the system will eitherhave to reduce the LOS provided or increase staff or other resources in order to meetthe current LOS. The decision to increase staff or other resources or decrease LOS willdirectly impact customers, so it is important to use the opportunity of the annual meetingto discuss the potential options with them.
Alternatively, the system may decide that some criteria are very easily met and may notbe stringent enough. The system may find that it can increase the LOS for particularcriteria without impacting costs and may wish to discuss the changes with thecustomers at the annual meeting.

2006 Edition 15
Savings Due to Customer InvolvementMany water systems believe they have a good understanding of what their customerswant, although they may never have directly asked their custome rs. One systembelieved their customers wanted breaks fixed within 4 hours of initiation of repair.However, it was expensive to operate in this mode, and the system wished to determineif they could cut costs by increasing the amount of time required to make a repair. Thequestion was whether or not the customers would be amenable to a change in theamount of time to make a repair. They decided to hold a series of meetings withcustomers to ask them if they were okay with the change to a longer time to repairbreaks. The customers indicated that the amount of time was not their biggest concern;the biggest issue was receiving advanced notification that the water would be shut offfor a period of time. They wished to receive a minimum of 15 minutes not ice that thewater would be shut off, but once this notice was received, they were not concerned ifthe repair took longer than 4 hours to complete. In this manner, the system was able tosave money and actually provide more of the type of service the cus tomers wanted.
4.3 What is the Minimum Starting Point for the LOS?
All systems must operate within the state and federal regulations and requirements.These regulations are generally specified in the Safe Drinking Water Act for watersystems and the Clean Water Act for wastewater systems, but there are additional rulesand regulations at the state and federal level. All systems should already be aware ofthese rules and should already be following them. Because there are many elements tothe regulations, it is not necessary to spell out conformance with each and everyregulation in the LOS. Instead, the LOS could contain a basic statement indicating that“the system will conform to all applicable state and federal regulations.” Alternatively,the LOS may include statements that describe categories of compliance such as, “willconform to all water quality requirements,” “will conform to all operator certificationrequirements,” or “will meet all requirements of the open meetings act.” In this case,the LOS may also need a summary statement to the effect that “the system will conformto all other applicable federal and state regulations” to ensure that nothing has been leftout.
Although the state and federal regulations set bare minimum standards o f operation inthe LOS, these standards do not adequately address all areas of operation and shouldnot be the sole components of the LOS. Without adding additional elements, the LOSwill not fulfill the range of purposes described in the preceding sectio n. Systems shouldinclude many other components to spell out important areas of the system’s operation.
4.4 What else should be included in the LOS?
The maximum level of the LOS is defined by the maximum capabilities of the assets. Asystem cannot include something within a LOS that the system is not capable of doing.As an example, if the system wishes to include the provision of fire flow in its LOS, but itonly has 2 and 4 inch lines with no fire hydrants, there is no way the system can providefire flow. The system may wish to include the provision of fire flow in its long -range

2006 Edition 16
Capital Improvement Plan and seek funding for a system upgrade to provide this, butuntil the assets for fire flow are in place, fire flow provision should not be included in theLOS.
Within the range of the minimum (regulations) and maximum (capabilities of assets)there are numerous items a system could include within its LOS. Items may beincluded so the system can: communicate its intentions with its customers, measur e itsperformance, and determine critical assets.
Examples of items that can be included in the Level of Service include, but are notlimited to the following:
Number of breaks per mile that are acceptable Length of time from report of a leak or break until repair Amount of notification (and method) prior to a scheduled shut down Amount of notification (and method) prior to a non -scheduled but non-
emergency shutdown Quantity of unplanned interruptions in service verses planned interruptions Number of hours to fix the pipe break once on site System losses maintained at less than X% overall Maximum system flow will be X gpd No detection of TC or EC at the source Water pressure will be maintained throughout the system at X psi Rates will be raised annually to avoid rate shock in the system Rates will be reviewed annually Storage capacity will be maintained at X gallons total No water outage will be longer than X hours total Customers will be notified of planned system outages at least X hours or X
days before the interruption Customers will be notified at least X minutes prior to shut down for an
emergency condition, unless life threatening conditions cause a need forimmediate shut down
Water conservation will be instituted to reduce average daily use by Xpercent in Y years
The LOS does not have to be lengthy; it can concentrate on a few key items the systemreally wishes to focus on. It can also start out with a few items and grow from there toinclude additional items as the system gains more experience with asset management.Examples of a few LOS Agreements are presented in Appendix B.
4.3 How can the public be involved in the LOS?
Ideally, the public or customers of the utility would be actively involved in thedevelopment of the LOS. This involveme nt could be done through focus groupmeetings, surveys, public meetings, or other means. In a practical sense, it is difficult to

2006 Edition 17
get the customers to attend meetings or complete surveys and it can be difficult forthem to understand certain components of the LOS. For example, customers may notunderstand how many breaks per mile may be acceptable prior to pipe replacement.
Rather, the best-case scenario may be to ask for specific input on items that directlyaffect the customers and for which they would have a reasonable understanding of thesocial and economic costs associated with the item. An example may be the length ofnotice prior to a schedule or non -emergency, unscheduled shut down. In this case, it isimportant to understand how much notice the customers would want and in which way itwould be best to notify them. The customers are in the best position to indicate howand when to be notified. They may indicate they want door hangers, or mailings orpostings in public places. The utility can indicate to the customers the impactfinancially of each of these options to inform the decision -making process.
4.4 Can the LOS be Changed Over Time?
Similar to the overall Asset Management Program that will change and adjust over time,the LOS may need to be adjusted from time to time. This adjustment may be requiredbecause the system may discover that it is too costly to operate the system at the levelspreviously defined. Or the adjustment may be necessary due to new rules orregulations that require a change. Additionally, the customers may feel that they desirea different level of service. For example, the system may not be providing fire flow to allcustomers. The customers may decide that they are willing to pay for the upgrades tothe system to provide fire protection. In this case, the LOS may need to be revised toreflect the fact that “all customers are to receive fire protection.” Another example maybe a system that includes a statement in the LOS that “repairs will be completed within4 hours from the start of the repair 90% of the time. “ If the system monitors itsperformance over time, it may find out that it cannot achieve this time frame withoutadditional staff or additional equipment. The choice then becomes whether the systemwishes to add the staff or purchase the equipment and keep the LOS the same orwhether it wishes to reduce the LOS to a more realistic time frame for the current staffand resources. The LOS may change to completing repairs in 6 or 8 hours instead of 4.

2006 Edition 18
Section 5Critical Assets
5.1 Introduction
Not all assets are equally important to the system’s operation; some assets are highlycritical to operations and others are not critical at all. Furthermore, critical assets arecompletely system specific. Certain assets or types of assets may be critical in onelocation but not critical in another. For example, one system may believe theirchlorinator is a critical asset because they lack redundancy and have been known tohave total coliform in their source. Another system may feel their chlorinator is not acritical asset because they have a redundant system and adequate spare parts to fix thebroken chlorinator quickly. A system must examine its own assets very carefully todetermine which assets are c ritical and why.
5.2 Determining criticality
In determining criticality, two questions are important. The first is how likely the asset isto fail and the second is the consequence if the asset does fail. Criticality has severalimportant functions, such as allowing a system to manage its risk and aiding indetermining where to spend operation and maintenance dollars and capitalexpenditures.
As a first step in determining criticality, a system needs to look at what it knows aboutthe likelihood that a given asset is going to fail. The data available to assist in thisdetermination is: asset age, condition assessment, failure history, historical knowledge,experiences with that type of asset in general, and knowledge regarding how that typeof asset is likely to fail. An asset may be highly likely to fail if it is old, has a long historyof failure, has a known failure record in other locations, and has a poor condition rating.An asset may be much less likely to fail if it is newer, is highly reli able, has little to nohistory of failure and has a good to excellent condition rating.
The following paragraphs describe each of the components that can go into adetermination of likelihood of failure. Any additional information or resources that asystem has to supplement these components should be considered also.
Asset Age: The asset’s age can be a factor in determining likelihood offailure, but should not be a sole factor. Over time, assets deteriorate,either from use or from physical condit ions such as interaction with wateror soil, and are more likely to fail. There is no “magic age” at which anasset can be expected to fail. An asset’s useful life is highly related to theconditions of use, the amount of maintenance, the original const ructiontechniques, and the type of material it is constructed out of. A piece ofductile iron or cast iron pipe may last 75 to 100 years in one application,150 years in another, and 50 years in yet another. Rather than being a

2006 Edition 19
sole predictor of likelihood of failure, age should be supplemental to otherinformation. For example, given the same set of factors: poor conditionrating, 3 failures in the past 5 years, poor construction techniques for twodifferent ages 5 years and 50 years old, the asset t hat is 50 years oldwould probably be given a higher likelihood of failure than the one that is 5years old.
If there are no other issues with an asset than its age, the likelihood offailure can still be relatively low even if the asset is quite old. Forexample, if the system has a cast iron pipe in the ground that was installedwell, using good materials and it has never had a history of failure, eventhough it is 75 years old, it does not need to have a high likelihood offailure.
Asset Condition: One of the most important factors in determining anasset’s likelihood of failure is the condition of the asset. As the asset’scondition deteriorates, it will become much more likely to fail. It isimportant, therefore, to make the best attempt possi ble to give the assetsa reasonable condition assessment. The condition assessment shouldalso be updated over time, so that criticality can likewise be updated.
Assets given a poor or fair condition rating are more likely to fail thanthose given an excellent or good rating. When the asset condition iscombined with other factors, the utility can begin to make predictionsregarding the likelihood of a given asset failing.
Failure History: It is important to monitor when assets fail and record thetype of failure that occurred. This information should be as specific aspossible to assist the system in understanding its failure modes. Systemsshould track when the asset failed (or at least when the failure wasdiscovered), how the failure was determi ned (customer report, operatorobservation, lack of service in that part of the system, etc.), type of failure(rupture, mechanical failure, small leak), specific location of failure, andany field observations that may help explain the failure (lack of be ddingsand, subsidence of soil, overheating, etc.) Systems should track failurehistory on all of the asset categories.
Past failure is not a complete predictor of future failure, but it can providesome indication of the likelihood of future failure, especially if detailedinformation on the failures is collected and reviewed. If the asset failedbecause its construction was poor or the pipe was severely corroded, it islikely to fail again unless some action was taken to correct the problem. Ifthe asset failed because a construction crew ruptured the pipe, it is notlikely to fail again if this is the only failure the pipe had once construction inthe area is completed. If a pipe has failed several times in the past few

2006 Edition 20
years, it would be more likely to fail. If the pipe had never failed, it wouldbe less likely to fail.
Historical Knowledge: If the system has any additional knowledgeregarding the asset, it should be considered in the analysis of likelihood offailure. The type of information m ay include, knowledge of constructionpractices used in the system at the time the system was constructed orknowledge of materials used in the system.
General Experiences with the Asset: Although likelihood of failure issite specific, some guidance reg arding likelihood of failure can be gainedby examining experience with that type of asset in general. For example,if there is a history of a certain type of pump failing frequently after 2 yearsof use, and a system has that type of pump and it is curre ntly 18 monthsof age, the asset may be given a higher likelihood of failure than it wouldbe if there was no general experience of this type.
Knowledge of How the Asset is Likely to Fail: John Moubray definesfailure as follows: “Failure is defined as th e inability of an asset to do whatits users want it to do.” In that regard, asset failure can be any time theasset is not able to meet the level of service the system wants. Forexample, a meter may be reading, but reading 25% less than what itshould be reading. If the LOS states, “all meters will read within a 10%accuracy range” then this meter reading 25% less has failed, even thoughit is still operational. This is not a failure in the classical sense – i.e., ameter leak or a plugged meter – but it is failure in the sense that it is notmeeting the operational expectations.
Failure in the more classical sense depends on the type of asset. Passiveassets (such as pipes) decay over time and active assets (pumps, motors)decay with use. Passive and active assets do not fail in the same mannerso they must be considered differently.
In the case of passive assets, the types of considerations in failuremechanism include: soil characteristics, groundwater level andcharacteristics, physical loads, bedding conditions, pipe attributes, internalcorrosion, and temperature conditions. A system must examine itsindividual circumstances to see which of these mechanisms may be likelyto be at work in its particular case. If the system is subjected to se vereweather extremes, pipes may break due to freezing. If the system wasinstalled with poor construction techniques, the pipe may fail due to poorsoil support beneath the pipe or due to inadequate bedding allowing rockto contact the pipe. If the soil s are highly corrosive for the pipe, thefailures may be due to corrosion of the pipe wall creating holes in the pipe.Once a system understands how its assets fail when they do fail, it candetermine how likely others may be to fail.

2006 Edition 21
In the case of active assets, failure mechanisms can be related to hours ofuse, amount or lack of preventative maintenance, climatic conditions,replacement of wear parts, improper alignment, and the amount oflubrication or cooling of parts. Active assets, such as pumps, may failbecause they are not given proper maintenance or lubrication.
The factors discussed above can be taken together to predict how likely an asset is tofail. The rating can be a simple rating on a scale from 1 to 5 or 1 to 10 or may be moresophisticated. The ability to produce a more sophisticated failure rating is dependent onthe amount and quality of data available. It may be necessary to start with a more basicanalysis and then increase the sophistication over time as the system managers andoperators gain more knowledge and experience regarding what information should begathered and evaluated.
In terms of the consequence of failure, it is important to consider all of the possiblecosts of failure. The costs include: cost of repair, social cost associated with the loss ofthe asset, repair/replacement costs related to collateral damage caused by the failure,legal costs related to additional damage caused by the failure, environmental costscreated by the failure, and any other associated c osts or asset losses. Theconsequence of failure can be high if any of these costs are significant or if there areseveral of these costs that will occur with a failure. Further discussion of each of thesefactors is presented below.
Cost of Repair: When an asset fails, it will be necessary to fix the asset insome way. Depending on the type of the asset and the extent of thefailure, repair may be simple or extensive. A small leak in a pipe can berepaired with a clamp. A chlorine pump can be replace d with a sparepump or perhaps the diaphragm can be replaced inside the pump. Afailure of a well may be much more involved and may require much moreextensive repair efforts. The cost of the repair of the failed asset shouldbe considered in the analysis of the consequence of failure. If the assetcan be repaired easily and without a tremendous cost, then there is alower consequence. If the cost of repair is higher, then the consequenceof the failure is also greater.
Social Costs Related to the Lo ss of the Asset: When an asset fails,there may be an inconvenience to the customer. In some cases, thisinconvenience may be minor, while in other cases, the social costs maybe much higher. If a pipe must be repaired in a residential area, theremay be a few customers who are out of water for a short period of time.This outage would constitute an inconvenience, but would not be a severesituation. On the other hand, if the system has very few isolation valvesso that any repair on the system require s the whole system to be shutdown, the inconvenience to the customers is much greater. In the firstexample (simple repair in residential area that shuts off a few customers),

2006 Edition 22
the cost of the consequence of failure related to the social cost is low. Inthe second case where the whole system must be shut down to make anyrepair, the cost of consequences related to social costs is much higher.
Repair/Replacement Costs Related to Collateral Damage Caused bythe Failure: When an asset fails, in some cases damage may be causedto other assets unrelated to the water or wastewater system. Examples ofthis type of damage include the following: a water line fails causing asinkhole which then causes damage to the foundation of a building or ahouse or causes major sections of a road to collapse. In addition, carsmay be damaged in the sinkhole. The damage from the pipe failurewithout the sinkhole would be fairly minimal. With the sinkhole, there iscollateral damage including the road, the building or house, or cars.Another example would be a sewer pipe leak that leaks sewage into ahome or yard or onto a schoolyard or playground. In this type of case, asignificant amount of cleaning will be required to restore the building,house or property. The utilit y will be held responsible for this collateraldamage, so the costs related to this type of failure need to be consideredin the assessment of costs of the consequence of failure.
Legal Costs Related to Additional Damage Caused by Failure: Insome cases, individuals or businesses may sue the utility for damages orinjuries caused by an asset failure. These costs would be in addition to thecosts of repairing and replacing damaged property or other assets. Forexample, if a driver is driving down the road and a water line fails causinga sinkhole that the driver then falls into causing an injury, the driver maysue the utility to cover the costs associated with the injury and loss of worktime.
Environmental Costs Related to the Failure: Some types of assetfailures can cause environmental impacts. The costs related to theseimpacts may not always be easy to assess in monetary terms. However,some attempt should be made to establish some type of monetary valueto the environmental consequences. An ex ample of an environmentalcost related to a failure would be a sewer pipe that leaked sewage into awaterway or onto land. A value, either monetarily or qualitatively, wouldneed to be placed on this type of consequence. A failure that could resultin raw sewage being discharged into a major waterway could be given ahigher consequence than a failure that would have the potential to cause amore limited environmental impact.
Reduction in Level of Service The assets must be in working order todeliver the level of service desired by the water system and its customers.If the assets fail, the ability to deliver the desired level of service may becompromised. An asset that has a major impact on the ability to meet the

2006 Edition 23
LOS would be considered more critical to the system than an asset whosefailure would not have a significant impact on the LOS.
Other Costs Associated with Failure or Loss of Asset: The costs inthis category are any other costs that can be associated with an assetfailure that are not adequately defined within the categories above. Someexamples of a cost that may be included in this type of category are a costassociated with loss of confidence in the water or wastewater system orloss of the system’s image. Certain types of failures ma y negativelyimpact the public’s confidence in the water or wastewater system and thismay have a cost to the system. Other examples include: loss of incomerelated to the inability to provide service for a period of time, loss of theservice itself, or health impacts to workers or customers.
In assessing the consequence or cost associated with the asset failure, the systemshould consider all the costs associated with all of the categories above. Theassessment can be a simplistic ranking of the consequ ences from 1 to 5 or 1 to 10. Inthis type of structure, the assets would be ranked against each other, but a specificmonetary amount would not be calculated for the failure of each asset. For example, amajor distribution line that has the potential to cause major failures and social, collateraldamage, and legal consequences could be ranked “5” while a small valve serving aresidential area that has low costs of repair, essentially little to no social orenvironmental consequence would be given a ranki ng of “1.” In this way, there is aqualitative assessment of which assets have a greater consequence than others, but nospecific quantitative assessment is performed.
A more robust analysis can be performed that would assign costs of consequences ineach category to each asset (or to at least the major assets) and then compare theassets with actual costs of consequences. Some of the costs would be known, such asthe cost of a repair, while others would need to be estimated using the best informationavailable, such as the cost of legal action. Past experience or experience from otherutilities could be used to help estimate costs.
A system can start out with the simpler estimate of consequence of failure and move toa more robust analysis over time .
5.3 Assessing Criticality
Assessing criticality requires an examination of the likelihood of failure and theconsequence of failure as discussed above. The assets that have the greatestlikelihood of failure and the greatest consequences associated with the failure will bethe assets that are the most critical. The next most critical assets will fall into threemain categories:
Assets that have a very high likelihood of failure with low consequence Assets that have a very high consequence with a low likelihood

2006 Edition 24
Assets that have a medium likelihood and medium consequence
The remaining assets that have low consequence and low likelihood will be the leastcritical assets.
A technique such as a ranking table as presented below can be a good place t o start inassessing criticality. Appendix C contains copies of this table for use in the criticalityanalysis.
Consequence (Cost)of FailureMultiplied
1 2 3 4 51 1 2 3 4 52 2 4 6 8 103 3 6 9 12 154 4 8 12 16 20
Probability ofFailure
5 5 10 15 20 25
1 Very Low 4 High2 Low 5 Very High3 Moderate
To use this table, estimate the probability of failure from 1 to 5 with 5 being very highprobability of failure and 1 being a very low probability of failure. Then assess theconsequence of failure from 1 to 5 in the same manner. Using the number forprobability of failure, move across the row until the column associated with the numberfor consequence of failure is reached. Alternatively, move down the column for theconsequence of failure until the row for probability of failure is reached. Locate thenumber that is in the box where the row and column intersect. That is the number forcriticality for that asset.
As an example, look at the following scenario.
Asset: 10 inch Cast I ron pipe; constructed in 1950, so 56 years oldService History: Numerous breaks in the past 5 yearsService Area: Serves 3 major subdivisions, but there are loop lines available andonly residential customers
Likelihood of failure: 4 – pipe has broken many times, but when repaired it wasstill in reasonable condition

2006 Edition 25
Consequence of failure: 2 – There are loop lines so not all customers will be outof water. Repair costs are moderate. Line isn’t in a critical roadway so repair isrelatively easy.
Using the chart, move across the row for 4, until the column for 2 is reached.The number in the box is 8. Therefore, 8 is the criticality factor for this asset.(See the table below.)
Consequence (Cost)of FailureMultiplied
1 2 3 4 51 1 2 3 4 52 2 4 6 8 103 3 6 9 12 154 4 8 12 16 20
Probability ofFailure
5 5 10 15 20 25
As another example, look at the following scenario.
Asset: Chlorine pumpSystem uses hypochlorite so chlorine pump pumps liquid chlorine solution intothe system for disinfectionSystem has both spare parts and a spare pumpChlorine pump has failed due to many factors several times in the past 10 yearsChlorine is checked once per week
Likelihood of failure: 4 – pump has failed many times
Consequence of failure: 4 – A failure in a chlorine pump has the potential to be amajor consequence. However, the consequence is mitigated by the presence ofa spare pump and spare parts. Because the pump may fail for a significantperiod of time before the failure is known (up to 1 week because the levels areonly checked once per week), the consequence is not substantially reduced bythe spare parts and pump.
Using the chart, move across the row for 4, until the column for 4 is reached.The number in the box is 16. Therefore, 16 is the criticality factor for this asset.(See the table below.)

2006 Edition 26
Consequence (Cost)of FailureMultiplied
1 2 3 4 51 1 2 3 4 52 2 4 6 8 103 3 6 9 12 154 4 8 12 16 20
Probability ofFailure
5 5 10 15 20 25
In looking at the two asse ts, the chlorinator is much more critical than the piece of pipe.If all assets are viewed in this way, an analysis can be done to determine the criticalitynumber for each one and then the results can be compared to see which assets aremore critical than others.
Once an analysis of this type is done, the results can be reviewed to determine if theymake sense to the utility. If the utility does not believe the results for a particular assetmake sense (i.e., the asset seems to have the wrong relative r anking), a re-evaluationcan be completed to achieve reasonable results.
5.3 Criticality Analysis Over Time
The condition of the asset will change over time as will the consequences related tofailure. Costs of repair may go up, the community may gr ow, new roads may be built orsimilar factors may occur that cause the consequence of failure to change. Therefore, itis necessary to periodically review the criticality analysis and make adjustments toaccount for changes in the likelihood of failure an d the consequence of failure.
The criticality analysis must be kept up to date to ensure that the utility is spending itstime and resources on the appropriate assets as discussed in the next section. Also,the analysis must incorporate replacement of assets. If an asset that was criticalprimarily due to its likelihood of failure fails and is replaced with a new asset, thecriticality number will go down since the likelihood of failure is much less.

2006 Edition 27
Section 6Life Cycle Costing
6.1 Introduction
This component is one of the most complex of all of the components of assetmanagement. It is difficult for a small system to gather all of the data necessary for asophisticated analysis of life cycle costing. There are several components ofdeveloping a lifecycle strategy for asset management plans. Most small communitiescan easily begin with one or two of these components.
Lifecycle Asset Management focuses on management options and strategiesconsidering all relevant economic and physical conseq uences, from initial planningthrough to disposal. The Lifecycle components include:
Asset Planning Asset Creation/Acquisition/Design Financial Management Asset Operation and Maintenance Asset Condition and Performance Monitoring Asset Rehabilitation/Renewal Asset Disposal Asset Audit and Review
As communities begin to develop their Asset Management plans, these componentscan seem overwhelming. It does not make sense to try to begin with all eightcomponents at once. Therefore, this manual will guide c ommunities through the basicsof the components that can easily be started.
6.2 Options for Dealing with Assets Over Time
There are four basic options for dealing with the actual assets over time:
Operate and maintain the existing assets Repair the assets as they fail Rehabilitate the assets Replace the assets
These options are intimately connected to each other. Choosing to do more or less ofone impacts how much of the others is done, whether or not the other is done at all, orthe time frame in which one of the others is done. For example, choosing to spendmore on operating and maintaining assets will decrease the need to repair the assetand will increase the amount of time until the asset is replaced. Choosing to rehabilitatean asset will eliminate the need to replace the asset in the short term and will increasethe amount of time until the asset ultimately needs to be replaced. The rehabilitation

2006 Edition 28
will also reduce the amount of operation and maintenance that needs to be done andreduce the need for repairs.
Each of these options has its own costs and considerations. The expenditure of fundsbecomes a balance between monies spent in each of these four categories. Thepurpose of asset management is to try to determine the optimal way to spread themoney between each of these categories, while maintaining the LOS desired.
Generally, the most expensive option is replacement of the assets. Therefore, keepingthe assets in service longer, while still meeting LOS conditions, will usually be the m osteconomical for the utility over the long term. The three other options: maintenance ofthe asset, repair of the asset, and rehabilitation are options that can be used to keep theasset in service longer. Each of the options is discussed further in th e sections below.
6.3 Asset Operation and Maintenance
Operation and maintenance (O&M) functions relate to the day -to-day running andupkeep of assets and are particularly relevant to short -lived dynamic assets (such aspumps) where deterioration through lack of regular maintenance may result in rapidfailure.
Properly operating and maintaining assets is critical to the success of the overallprogram. Operation and maintenance is directly linked to Level of Service and CriticalComponents. In the July 2006 AWWA Journal Current Issues article by Eugene Nelms,the importance and process of establishing O&M procedures is discussed in detail.Following are some key points from the article. Establishing standardized O&Mprocedures achieves maximum asset life and reduces O&M costs. Standardizing O&Mprocedures helps utility personnel to operate all assets within acceptable operationallevels and ensures that each person is following the same routines. By standardizingthe operations of all assets, maximum ass et life can be obtained (assuming thatperiodic maintenance is performed as required).
O&M procedures can be categorized as operational, maintenance and (whereapplicable) laboratory.
Operational procedures can be classified as: Standard Operating Procedure: most common, typically used during normal
operations, day-to-day Alternate Operating Procedure: Used when operational conditions require that
an asset or process be modified or taken off -line, scheduled, periodic Emergency Operating Procedure: used in emergency conditions, incorporated
into overall emergency plan developed for facility
Maintenance procedures can be classified as: Corrective Maintenance Procedures: used by field technicians for the breakdown
and repair of assets that are malfun ctioning (e.g., replace broken bearing)

2006 Edition 29
Preventative Maintenance Procedures: developed to prevent breakdown andprolong asset life (lubrication or overhaul)
Reliability-centered Maintenance Procedures: developed to assist maintenancemanagers in predicting asset failures and lessening effects on facilities (assetcondition monitoring or failure modes and effects analyses)
Laboratory procedures can be classified as: Equipment-related Procedures: developed on the basis of how to operate the
equipment and what maintenance and/or calibration the equipment requires Sampling-related Procedures: developed around sampling routines and specify
to the laboratory technician when, where, and how samples should be taken
Several choices exist for who develops O&M pr ocedures. New facilities or assets: engineering firm or designer, supply vendors, contract
professional technical writer Existing facilities or assets: existing staff, technical writer
In order to develop O&M procedures the reference materials must be located.Reference materials include O&M Manuals, process and instrumentation drawings,vendor submittals, specifications, pictures, design data, design drawings, as -builtdrawings, and interviews with experienced staff.
Developing operational procedure s includes: Titling the procedure appropriately, so it is easily identified. (e.g., “Shutdown of
Alum Feeder Number 4”) Introduction: lists associated information such as the reason for the procedure,
responsible parties, desired outcomes, safety procedu res, special equipmentrequirements and notification requirements
Steps and/or Activities: Step 1, Shut power off at the breaker located on thesouth wall labeled Alum Pump
Note any cautions or hazardous conditions with each step or activity before theactivity is performed
Maintenance procedures are generally developed using vendor -supplied information.Using a template with fields for the vendor to complete, such as the Work MaintenanceManagement System (WMMS), has proven successful for many utilities .
Two factors can adversely affect the development of procedures. Costs. The costs of developing procedures in a new facility are typically covered
in the capital improvement plan (CIP) budget. If this budget is limited, facilitymanagers must determine which procedures are critical and work with their staffand an outside source, if needed, to develop the critical procedures first.Remaining procedures can then be spread out over time to minimize budgetaryeffects.
Time. The other key factor is time . For an existing facility where staff mayalready be stretched thin, it becomes impractical to include the development of

2006 Edition 30
O&M procedures into daily routines. The use of a third -party O&M group, oreven a dedicated staff member can reduce the time requir ements on the O&Mstaff while developing procedures.
The benefits of developing and implementing effective and useful O&M procedures faroutweigh the effects on the facility and staff. If standard procedures are notimplemented system wide, O&M procedu res will be created on an ad -hoc basis, whichcan lead to fluctuations in process efficiencies, discord between operations andmaintenance, increased asset downtime, wasting of chemicals and energy, and othersimilar problems.
The greatest reward for developing O&M procedures is that all operations activities,maintenance activities, and laboratory activities are backed by management andstandardized across all shifts by all personnel. This ensures management consistencyof personnel activities, product quality, and O&M costs. The application of standardizedmaintenance procedures can reduce asset downtime and ensure lifetime productivity.The application of standardized laboratory procedures is essential for a good quality -assurance/quality-control program.
6.3.1 Operation and Maintenance and Critical Assets
One of the purposes for identifying critical assets is to allow the utility to make moreinformed decisions regarding the use of its operation and maintenance dollars. Asdiscussed previously, the most critical assets are those assets that are likely to fail andhave a significant consequence if they do fail. Therefore, it is most advantageous to theutility to spend the greatest portion of its operation and maintenance budget on assetsthat are critical to the overall operation of the utility. These assets have the greatestchance of costing the utility money if they fail.
Figure 6-1 below shows the relationship between likelihood of failure and consequenceof failure for assets. The letter s A through D represent different categories of assets.Assets in category A have a low likelihood of failure and a low consequence of failure,while those in category D would have a high likelihood of failure and a highconsequence if they do fail. The expenditures on operation and maintenance, or O&M,would vary for these various categories of assets. Those in category A should havelower expenditures on O&M and less investment into condition assessment, while thosein category D should have much more expenditure on O&M and more investment intocondition assessment. Table 6 -1 contains a summary of this information.

2006 Edition 31
Figure 6-1: Relationship Between Likelihood of Failure andConsequence of Failure
Table 6-1: Summary of O&M Expenditures and Criticality
Letterfrom
Graph6-1
Likelihoodof Failure
Consequenceof Failure
RelativeAmountSpent on
O&M
RelativeAmountSpent onCondition
Assessment
Exampleof anAsset thatCould bein thisCategory
A Low Low Low Low
4 year oldPVC pipein aresidentialarea
B High Low Moderate Moderate
60 year oldsteel pipein aresidentialarea
C Low High Moderate Moderate
Encasedpipe undera railroadtrack
D High High High High
60 year oldsteel pipeunder amajorarterialroad
Consequences of Failure
Like
lihoo
d of
Failu
re
High
High
Low
A
B
C
D

2006 Edition 32
In deciding how to spend O&M and condition monitoring dollars, the system shouldperform an assessment similar to the one above, putting specific types of assets orasset categories in the boxes instead of A through D. Then the O&M program andcondition monitoring program can be structured so that expenditures are made on themost appropriate assets. An example of a table such as 6 -1 for a water distributionsystem is contained in Appendix D.
Thought of another way, if the system had $100 dollars to spend on Operation andmaintenance and the only assets were A, B, C, and D as shown on Figure 6 -1, themoney should be spent in a manner similar to Table 6 -2 below.
Table 6-2: Operation and Maintenance Expenditure by Criticality
Asset O&M DollarsOut of a $100 dollar
Expenditure
Percentage ofthe Total
ExpenditureA $5 5%B $15 15%C $30 30%D $50 50%
The table shows how the money is spent between the different categories of assets.The most money is spent on the assets with the greatest failure potential and greates tconsequence.
6.4 Repair of Assets
In addition to operating and maintaining the assets, systems will need to plan for therepair of assets as they fail. Systems need to consider how long they will keep an assetin service prior to replacement of the asset. To some extent, these two items – repairand replacement - are off-setting. If more resources (personnel and money) are spenton repair, there will be a decreased need for replacement. On the other hand, if greaterresources are applied to replac ing the assets, fewer resources will be applied to repair.There is a balance between how much to spend in each category: maintenance, repair,and replacement to achieve the most efficient system.
As an example, consider a car. If a new car is purcha sed every year, the car’s ownerwill probably spend little to nothing on repair but will have an extremely high cost ofpurchase. If another owner decides to keep his car and repair everything that breaks onthe car in order to keep it running, this owner will have a very low bill for replacementcost but will have a very high repair bill. Most likely, the repair bill will significantlyincrease over time as the car ages. Neither of these extremes would be the most costeffective approach to owning and o perating a car. In the first case, the replacementcost is too high and in the second case, the repair costs are too high. The most efficient

2006 Edition 33
approach would lie in between these extremes, with repair taking place until costs areprohibitive at which poin t the asset – the car – would be replaced.
In developing a water or wastewater system repair schedule, the utility must determineits own approach to repairing verses replacing assets. The utility will need to decidewhen it is spending more money (inclu ding personnel hours) to repair the asset than itwould cost to replace the asset.
In comparing U.S. utilities to utilities in Australia and New Zealand, it has been observedthat U.S. utilities generally replace assets much sooner than utilities in Aus tralia andNew Zealand who have fully implemented asset management. The asset managementanalysis these utilities have done, has shown them that it is generally more efficient torepair assets longer than to replace them.
6.5 Rehabilitation of Assets
When an asset fails, or approaches failure, the typical thought process is that ofreplacing the asset with a new asset. There is another option for some water orwastewater system assets; assets may be rehabilitated rather than an outrightreplacement. Rehabilitation brings the assets back to a useable condition withoutactually replacing them. In many cases, it may be cheaper to rehabilitate the assetrather than replacing it, it may extend the life span of the asset considerably and mayreduce other impacts related to asset replacement. An example of a rehabilitationapproach is slip lining a wastewater pipe that is nearing the end of its useful life. Thepipe can be lined without having to dig the original pipe out of the ground, thus possiblyreducing the costs of installation and the inconvenience of the construction.
6.6 Replacement of Assets
Eventually, all assets will need to be replaced. There will reach a point where the assetcan no longer be kept in service through maintenance or repair or where the asset is nolonger capable of meeting the LOS, either economically or at all. At that point, the assetwill need to be replaced. Replaced assets can either be part of a replacement scheduleor a capital improvement plan.
In both cases, the assets are replaced. The main difference is that the replacementschedule includes those items that are routinely replaced, smaller dollar replacements,and items replaced using the water or wastewater system revenues or reserve funds.The capital improvement plan indicates items that are major expenditures that do notroutinely occur and that generally require outside funding for at least a portion of theproject. Further information regarding each of these types of replacements is presentedbelow.

2006 Edition 34
6.6.1 Replacement Schedule
A replacement schedule should be developed that indicates those assets that will bereplaced within the next 20 years that will be funded out of system revenues. Theschedule will contain assets that are smaller dollar amount or routinely recurring andshould include assets that will be paid for out of system revenues. A couple ofexamples of these types of assets are: water meters and chlorine pumps. Additionalassets, such as small diameter water distribution piping, valve s, and hydrants can alsobe included.
This schedule can also be expanded to include programmed maintenance or repair,making it a Repair and Replacement Schedule. The types of activities that can beincluded here are major, programmed repair elements, su ch as a storage tankinspection annually and a tank overhaul (repaint, structural testing, cleaning) or leakdetection every 3 years. This Schedule does not replace the operation andmaintenance schedules discussed above. It merely reflects those element s that aremajor budget items and that will occur routinely, but much less often than daily, weekly,or monthly. These are generally items that are annually or greater in schedule and thatconstitute a major budget expenditure.
The schedule should include all of the recurring and non -recurring items for a 20 yearperiod. The Repair and Replacement Schedule should be updated annually so that it isalways 20 years long.
The type of information to include on a Repair and Replacement Schedule includes:
Year Item Description Estimated Cost Method of Estimation One time or Recurring Time Period of Reoccurrence
Appendix D contains an example table for a Repair and Replacement Schedule.
It is absolutely critical that the items in the Repair and Replacement Schedule beentered into the rate setting process. These items must be funded out of systemrevenues, so they must be accounted for in the annual budget and in the rates. TheSchedule will probably not be uniform from year to year in terms of amount ofexpenditure. To address this issue, the system may wish to set an annual annuitypayment to cover the Repair and Replacement Schedule expenses over the long term.Some years, the payment would be greater than that year’s expenses, so money wouldgo into a Repair and Replacement Reserve. Other times, the amount collected wouldbe less than required so the additional funds would come from the reserve account.The annual annuity set would have to be sufficient to cover all of the expenses over the

2006 Edition 35
20 year period. It may need to be increased over time if expenses increase and it canbe decreased if it turns out too much money was dedicated to this purpose.
6.6.2 Capital Improvement Planning
A long-term capital improvement plan should look at the utility’ s needs for the future.Ideally, the planning period would be at least 20 years, with a minimum of 5 years. It isunderstood that the specific expenditures and needs of the utility in the latter years, say15 to 20 years, are more speculative than the ne eds for the first 5 to 10 years,particularly the first 5 years. However, the inclusion of the needs for this longer timeperiod will provide a better opportunity for the water system to plan for its capital needs.
There are several categories of capital improvements that must be considered. Thecategories are listed below.
Capital Needs Related to Future/Upcoming Regulations: The stateand federal regulatory agencies periodically issue new rules andregulations that may require water or wastewater sys tems to invest in newtechnologies to meet the requirements. For example, when the arsenicstandard was reduced from 50 parts per billion to 10 parts per billion,many water systems in New Mexico were required to consider capitalneeds to meet this standard. The capital needs may be related totreatment facilities, distribution system changes, connections with othersources, development of new sources, or any other type of capital projectto meet the standard. Systems ought to be aware of upcomingregulations and consider the costs that may be associated withcompliance so that money can be set aside to help pay the costs.
Capital Needs Related to Major Asset Replacement: Some assets canbe repaired within the repair and replacement schedule, while other s willbe major expenditures that will have to be replaced under the capitalimprovements program. Assets such as storage tanks, treatmentfacilities, and major portions of the distribution or collection system couldfall into this category.
Capital Needs Related to System Expansion: Over time, the systemmay expand due to growth in the area or through serving customers whowere previously on private wells or septic tanks. This type of expansionmay involve new distribution or collection pipes, additiona l storage,additional water source, or additional treatment.
Capital Needs Related to System Consolidation or Regionalization:Some systems may find it advantageous to consolidate or regionalize withother nearby systems. In some cases, this type of reg ionalization may

2006 Edition 36
involve additional assets, such as sources, pipes, storage or treatmentfacilities.
Capital Needs Related to Improved Technology: Systems may wish toreplace assets because the technology of the assets originally installed isout of date and needs to be modernized or because technologyimprovements will allow improved customer service or enhancedefficiencies. An example of this type of capital needs is a SCADA systemthat electronically controls the system’s operations.
System managers need to consider all of these types of needs when developing a longterm Capital Improvement Plan or CIP. Each item needed by the system for each of theapplicable categories for a 20 year time horizon needs to be identified. At a minimum,the following information should be identified for each item.
Description of the project Brief statement regarding the need for the project Year project needed Is the year needed flexible or absolute Estimate of project cost How costs were estimated Funding source(s) considered/available for this type of project Changes in overall operations that may occur as a result of the project
(include operator requirements, additional O&M costs, regulatory changes,any efficiencies that may be gained, etc.)
Impact of the project on LOS
As stated previously, the CIP should cover a 20 year period. It should be updated eachyear so that it always shows 20 years of needs. If there are no needs in a particularyear, the CIP can reflect this. Appendix D contains an example table t hat can be usedto develop the CIP.
Some of the expenses related to capital improvements may be funded out of thesystem’s revenues rather than solely outside sources. If system revenues are to beused either to offset costs or as a debt repayment stream , the budgets and rates mustreflect the costs.
6.7 Annual Review of Asset Replacement Projects
Asset replacement projects will be included in the Repair and Replacement Scheduleand the Capital Improvement Plan. It is a good idea to review both of thes e documentson an annual basis to determine if all of the listed projects are indeed necessary.Sometimes another look at the project list may reveal that some projects can safely bepushed back for several years or may not be needed due to changing condi tions. Theprojects were projected out several years in advance, so conditions may have changedeliminating or reducing the need for the project. Alternatively, the projects may also

2006 Edition 37
have changed in terms of specifically what technology or approach is be st. As anexample, the system may have anticipated growth in a certain area and budgeted forline extensions into that area 10 years into the future. However, over time, it may turnout that development did not occur or the patterns were different than e xpected. Theextension project can then be eliminated from the budget.
The types of questions to examine in the completion of this type of review include thefollowing:
Is the reason/need for the project still valid? Have the costs changed since origi nally projected? Is there a better approach or a better technology that can be used to address
the need? Can the project be safely delayed? Does the project need to be completed sooner? Is there a method of rehabilitation that could be used rather than rep lacement
to save costs? Would it be more reasonable to reduce the LOS than increase the asset’s
capability? Will funding be available for the project?
Each year the overall Repair and Replacement Schedule and Capital Improvement Planmust be revised to reflect completion of the current years projects or the new schedulefor those projects if they were not completed, any changes to the projects on the list,and to add the additional year at the end of the project period to keep the list at 20years.

2006 Edition 38
Section 7Long-Term Funding Strategy
7.1 Introduction
The first four components of the asset management strategy lead a system to discoverwhat actions are most appropriate to take to manage the system at the desired level ofservice at the lowest life cycle cost. The final factor in the asset management strategyis determining the best manner in which to fund the operation and maintenance, repair,rehabilitation, and replacement of assets. There are several sources of fundingavailable to a system, so it i s important to evaluate the item needing funding and thevarious options.
7.2 Funding Sources Available
The sources of funding for the overall operation and maintenance of a water orwastewater system, including asset repair, replacement, and rehabilita tion include thefollowing:
System revenues from:User feesHook up feesStand-by feesLate feesPenaltiesReconnect chargesDeveloper impact fees
System reserve fundsEmergency reservesCapital improvement reservesDebt reserves
System generated replacement funds:BondsTaxes
Non-System revenues:State grantsState loansFederal grantsFederal loansState or federal loan/grant combinations
Appendix E contains a further discussion of funding sources and a link to the uniformfunding application.

2006 Edition 39
7.3 Rates and Asset Management
System revenues are a major component of an asset management plan. The systemrevenues will fund the operation and maintenance of the system; there generally are nooutside funding sources for routine operation and maintenance of a water or wastewaterutility. In addition, the rates will need to fund reserve accounts for emergencies, repairs,and debt coverage (for any loans.)
A well developed rate structure will take into account needs for the water system for thecurrent year as well as needs for the water system in future years, through reserveaccounts. For example, if the water system is anticipating a new regulation that willrequire additional treatment, the system should be collecting money through the rates tohelp pay for the needed equipment.
The rate structure should also anticipate routine replacements of parts, particularlythose parts that wear out regularly. For example, if the system replaces its chlorinatorevery 5 years, the rates should cover this expense, rather than seeking state or federalfunding to cover these types of needs.
If a system engages in asset management as it sets rates, the rates may increase asthe system moves from traditionally being underfunded (i.e., collecting insufficientrevenues to cover all expenses) to being properly funded. However, rates that are setbased on sound asset management principles are very defensible to the public. Assetmanagement brings transparency to the process so that it is clear what the rate isbased on. The more clearly the rate can be defended, the more likely it is to beaccepted by the public.
There are many sources of rate setting assistance, including trainings and free ratesetting programs. Any approach that includes all costs of operation, co nsiders the long-term view, includes reserve accounts, and considers conservation or other utility goalsis acceptable.
7.4 Long-Term Funding Plan
The Rural Community Assistance Corporation developed a manual regarding 5 yearfunding strategies. This document should be consulted as a resource in thedevelopment of the long-term funding strategy needed for the asset management plan.

2006 Edition 40
Section 8Implementation
8.1 The “Just Do It” Philosophy
The asset management program described in this document is based on the “just do itphilosophy.” A system should be able to jump right into asset management and startdoing it without a tremendous amount of preparation or resources. Over time, a systemwill increasingly improve its asset management program and will i ncrease its knowledgebase and the quality of its data. A system may wish to increase its level ofsophistication and may input a greater degree of resources – personnel or money – as itimproves over time. However, the most important thing is for a syst em to get started ona more systematic manner of operating its utility.
Asset management is firmly rooted in common sense and good business practices. Assuch, any activities the system undertakes in the area of asset management willimprove the system’s overall operation. The more sophisticated and cohesive theprogram, the more improvement, but improvement will occur even at a lower level ofasset management activity.
Utilities do not need to worry about making mistakes with asset management. Assetmanagement is meant to be on -going and improved over time. If the program is notworking properly or needs to be changed, the system can change it.
8.2 The Sustainable Process
As stated in the Section 2 of this manual, asset management needs to become the wayyou do business. As such, as long as the system is operational, the system should beengaged in asset management. The system must view this process as never ending.The asset management program should improve and change over time, as the system’ sneeds change but it will never be something that is “complete” and should not bethought of in that way.
8.3 The Asset Management Plan
The system may wish to compile its approaches to asset management into a singledocument discussing each element and how that is handled. The document, however,must be flexible and should contain an explanation of how the system is doing eachcomponent, not the actual data obtained from each component. The actual data shouldbe in a format that is continually changeab le (e.g., computer data base, map that can bedrawn on, etc.)
The Asset Management Plan should be thought of as a “road map” to explain how thesystem is going to do each component and how the system will continue with assetmanagement over the long-term, but should not be thought of as “the answer.”

2006 Edition 41
The Asset Management Plan should also be written in such a way that all levels of theorganization can make use of it. It should be readily available to all members of theorganization and distributed free ly. It can also be made available on the web tocustomers of the organization. It should not be thought of as a secretive document thatonly employees or volunteers should have. The document provides information to thecustomers on exactly how the syste m is being run and creates more confidence in theproper operation of the system and the applicability of the rates that are charged.
The data that is part of the Asset Management Plan should be updated continually asthe system performs its operational d uties (e.g., as breaks are repaired information isgathered.) This type of updating should not require the overall plan to be revised. TheAsset Management Plan should be periodically reviewed (annually or biannually orperhaps every 3 years) to determin e if the overall methodology used for eachcomponent has changed in any way. If so, the document should be revised andredistributed. If not, the document can be left in its current status until the next review.
The Asset Management Plan document does n ot need to be lengthy. The goal is tomake it easy to understand and useable by the employees or volunteer workers for theutility.
8.4 Asset Management Plan Review
If Asset Management becomes a requirement of funding or an activity that can provideadditional points towards the application or a higher ranking for a particular project,funding agencies may wish to review the asset management plans to determine if itcontains all the required elements. A checklist that can be used for this purpose isprovided in Appendix F. Appendix F also contains an example of a checklist filled outon a fictitious water system.

2006 Edition 42
Section 9Asset Management Resources/References
9.1 Introduction
As asset management programs have been implemented around the world, seve ralresources and reference articles have been published, ranging from simple, briefoverviews, to complex, thorough documents. Listed below are some of the additionalresources available with brief descriptions.
A manual written specifically for asset management, outlining all steps and experiencelevels. Most widely recognized manual
International Infrastructure Management Manual . (2006).
Asset management guide provides a brief overview of asset management for smallwater and wastewater systems and a list of recommended resources for implementingan asset management program:
Ward, Melissa. (2005). A Guide to Asset Management for Small Water Systems.National Environmental Services Center
Four page article with practical applications and examples of the benefits of assetmanagement, along with references to other sources of information:
Falvey, Cathleen. (2006). Asset Management: A New Frontier for Utilities. Ontap. 6(2), 26-29.
Website with many short, informative articles about asset management a nd links togood references
Brown and Caldwell Asset Management Website. URL:http://www.bcwaternews.com/assetmgt/
A free asset management software for small communities developed for MicrosoftOffice Suite 97 or later.
Total Electronic Asset Management System . URL: www.mcet.org orhttp://www.mcet.org/am/index.html
Train-the-Trainer Toolkit: Asset Management Guide f or Wastewater Utilities .URL: www.mcet.org or http://www.mcet.org/am/am/Presentations/toolkit2.html
Handbook designed to help owners and operators of small water systems .Asset Management: A Handbook for Small Water Systems . (2003). UnitedStates Environmental Protection Agency
Asset Management: A Handbook for Small Water Systems. URL:http://www.epa.gov/safewater/smallsys/pdfs/guide_smallsystems_asset_mgmnt.pdf

2006 Edition 43
Handbook developed by the EPA Office of Water for very small systems such asmanufactured home communities and homeowners’ associations.
Taking Stock of Your Water System . (2004). United States EnvironmentalProtection Agency
Taking Stock of Your Water System . URL:http://www.epa.gov/safewater/smallsys/pdfs/final_asset_inventory_for_small_systems.pdf
The American Public Works Association (APWA) has several resources available forpurchase through their bookstore, including The Managing Infrastructure Assets –Knowledge Product and Getting The Most Out of Your Infrastructure Assets.
Bridging the Gap is a ground -breaking on-line video designed to helpelected officials and water and wastewater managers make smart choicesas they address water and wastewater infrastructure issues.
Bridging the Gap. URL:https://courses.worldcampus.psu.edu/public/buried_assets/

2006 Edition 44
Section 10Document References
International Infrastructure Management Manual . (2006).
Moubray, John. “Reliability-centered Maintenance.” Industrial Press, Inc. 1997
Nelms, Eugene E. (2006). Establishing O&M Procedures for a Water Treatment Plant.AWWA Journal. 98(7), 38-40.
US EPA Advanced Asset Management Workshop materials, prepared by Steve Allbe e,US EPA, Duncan Rose and Roger Byrne, GHD.
Information in this manual has also been obtained through personal communication withasset managers in Australia and New Zealand.

2006 Edition
Appendix AAsset Inventory

2006 Edition A-1
A.1 Asset Mapping Resources
As mentioned in section 3, an asset inventory helps water systems identify whatthey own, where assets are located, and consider what the condition of thesystem is. Therefore, creating or obtaining a map of your water system is animportant step in preparing an a sset inventory. An asset inventory map can helpoperators and managers conceptualize the water system as whole. The mapshould show everything that the water system owns, and identify where theassets are located. It is best to start with any maps you m ay have readilyavailable, and work with your operator to determine what you know about thesystem. A good starting point is to take a look at the maps the water systemcurrently owns, such as engineering “as built”, community planning maps, etc. Ifyour water system has ever contracted with an engineering firm to conduct anassessment or design improvements, chances are you may already have a mapof your water system. For most projects engineering firms will includeengineering drawings of the water sys tem that includes a description of the pipesand where they are located. Others may just include a map known as an “asbuilt” that will depict the part of the system where work has been done. If youhave several “as-builts,” as a result of several projec ts over a period of time, youmay want to consider obtaining copies and creating your own mosaic map byfitting and taping the “as-builts” together to create a large map of the watersystem.
If the water system does not have a regular map or “as -built” map available, analternative would be to contact your local County Government Office, RegionalCouncil of Governments, or local public library. If you have a computer andInternet connection you may try creating a map yourself using mapping WebSites. The following are some pointers and some examples of Web Sites to useto get started.
There are a few basic concepts to keep in mind when dealing with sizing a map.Understanding what map scale is appropriate for the project is crucial because,(1) you want the map to display as much of the detailed information as possible,and (2) you want to make sure that your assets, such as pipe lengths, areaccurately displayed on the map. In dealing with scale there are two things tokeep in mind. One, the term sm all scale refers to maps with a scale that is1:100,000, which means that every length unit on the map represents 100,000 ofthe same unit on the ground. Typically, the most common length unit used isinches so there is some converting involved, 100,000 i nches equalsapproximately 1.58 miles. Secondly, the large scale refers to maps with a scaleof 1:24,000 or less. Large scale maps typically, cover less area then a smallscale map but the land features are displayed in greater detail. A map with ascale of 1:24,000 easily converts to 1 inch on the map equals 2,000 feet on theground. The 7.5 minute USGS topographic maps have a scale of 1:24,000. Thisis useful because starting with a map scale of 1:24,000 one can enlarge the mapinto smaller units. For example, knowing that 1:24,000 is equivalent to 1 inch

2006 Edition A-2
equals 2,000 feet, if you double or enlarge the size of the map by 200 percentyour map scale will change to 1 inch equals 1,000 feet. Conversely, if youenlarge or quadruple your map by 400 percen t your map scale will be 1 inchequals 500 feet. In addition, most maps should have a scale bar at the bottom ofthe map, which is useful because it subdivides the length unit into smaller unitsfor easier estimates of shorter distances. The following is a typical example of ascale bar; (image)
Source: ArcGIS, a geographic information system software package.
There are several map resources available on the Internet for both public andcommercial use. Identifying which map type and size type that is right for yourwater system can seem overwhelming. One thing to keep in mind when startingan asset inventory project is that your map does not have to be fancy. Mostimportantly, you just need a map to start with.
Depending on how big your wa ter system is will depend on the type, size andscale of your map. There are three, easy -to-use, mapping Web Sites on theInternet and they are Yahoo Maps, Google Maps, and MapQuest. It is easier touse these Web Site to accommodate a smaller water syste m, systems that coveran area less than 1 square mile, than larger systems. However, the mappingsites are so easy to use that a person can print out large -scale sections of theirwater system and create a mosaic map. A person can create a mosaic map byprinting out and taping together enlarged sections of the water system. MappingWeb Sites, such as Google Maps, has a feature that allows the user to viewaerial photographs in addition to street maps called “hybrid.” The quality andextent of aerial photographs available does vary, and for some parts of rural NewMexico recent aerial photography may not be available from the mapping sites.Depending on the size of the water system, creating a mosaic can be a timelyprocess. Unfortunately, Google Map do es not allow the user to print aerialphotographs using the print feature. Instead, it is recommended to accessTerraServer-USA, mentioned later in this section, for free aerial photographs,also known as digital orthophotography, that are easy to print f rom your homecomputer. The following are web address to the three Web Sites that are usefulviewing and printing small area street maps:
(1) Googlehttp://maps.google.com/
(2) MapQuesthttp://www.mapquest.com/
(3) Yahoohttp://maps.yahoo.com/

2006 Edition A-3
The United States Geological Survey (USGS) is a reliable and inexpensivesource for finding maps. The USGS does not sell maps directly to the public;instead, the USGS has established business partners in various cities to sell mapproducts to the general public. Typically, these business partners are sportinggoods, surveying and travel stores. The New Mexico Bureau of Geology andMineral Resources at New Mexico Tech in Socorro is another source to obtainand purchase USGS topographic maps. The best type of US GS topographicmap to use for an asset inventory is the 7.5 -minute topographic map. The 7.5 -minute topographic map is smallest (large scale) map available. Each 7.5 -minute topographic map is given a quadrangle name (also referred to as a quadname), and is required in order to track down a map of your specific area. Thereare index maps available through the USGS and its business partners to helpdetermine which maps are needed to cover your area. There are also resourceson the Internet that will help you locate the maps you need by using latitude andlongitude coordinates, or place name. The only drawback in using USGStopographic maps is that rural areas are not updated as regularly as growingurban areas. However, the maps are a useful starting poi nt in creating an assetinventory because they contain useful information such as the scale bar, contourlines, and latitude and longitude coordinates. Also, depending on how old yourwater system is, the USGS may have already mapped the water tank or wat erwell, since the USGS would typically document manmade features on their mapsas markers in the field. You can also order aerial photographs from USGS bycontacting one of the business partners that were mentioned before. There arealso data information research companies who specialize in researching aerialsphotographs, which will charge a research fee and the cost of the photographs.You could also do the research and ordering yourself by using the following WebSites.
(1) TerraServer-USA http://terraserver.microsoft.com/(2) NM Bureau of Geology andMineral Resources http://geoinfo.nmt.edu/publications/maps/topographic/home.html
(3) TerraServer®.com http://www.terraserver.com/(4) TopoZone.com http://www.topozone.com(5) USGS Earth ResourcesObservation and Science(EROS)
http://edc.usgs.gov/
If you have experience using a geographical information systems softwarepackage, such as ArcGIS, then you may already be familiar with gathering mapdata from online sources data such as;
(1) http://www.webgis.com/ (2) http://www.esri.com/ (3) http://rgis.unm.edu/
One of the drawbacks in downloading digital maps from the Internet is the datafile size. Most high quality digital maps available online are several megabits infile size and require a high speed Internet connection to download successfully.

2006 Edition A-4
Example of Yahoo Maps:
Example of a map from MapQuest:

2006 Edition A-5
Example of Google Maps
Example of an aerial map from Google Maps.

2006 Edition A-6
Hybrid map using Google Map’s road and aerial photograph featu re.
Example of a topographic map from TerraServer -USA

2006 Edition A-7
Example of an aerial photograph from TerraServer -USA
Example of GIS map using ArcGIS software

2006 Edition A-8
A.2 Asset Condition
It is critical that utilities have a clear knowledge of the condition of their assetsand how they are performing. All management decisions regardingmaintenance, rehabilitation, and renewal revolve around these two aspects. Notknowing the current condition or performance level of an asset may lead to thepremature failure of the asset, which leaves the utility with only one option: toreplace the asset (generally the most expensive option).
There are many ways to assess the condition of the assets. For example, someassets can be visually assessed, water lines can be pr essure tested, or leaktested, buildings can be monitored for energy efficiency, etc. Sometimes the onlysuitable way to assess an asset is to compare its performance (repair history) toits expected life. Below is a table that shows ways to monitor asse ts and whichassets those monitoring systems apply to.

2006 Edition A-9
Suitability of some Condition Monitoring Systems for a Range of AssetTypes
Con
ditio
nM
onito
ring
Syst
ems
AssetGroups Vi
brat
ion
Tem
pera
ture
Oil
Usa
ge/L
evel
/Con
tam
inan
ts
Effic
ienc
y C
hang
e (H
ead
Loss
)
Infra
Red
The
rmog
raph
y, G
roun
d Pe
netra
ting
Rad
arH
ours
Run
Pow
er U
sage
Mon
itorin
g
Con
cret
e D
ecom
posi
tion
Test
ing
and
Cor
eSa
mpl
ing
X-ra
y
Rem
ote
Con
trol T
elev
isio
n In
spec
tion
Pres
sure
Tes
ting
Smok
e Te
stin
g
Cap
acity
Mod
elin
g (fo
r fai
lure
)
Leak
Tes
ting
Inte
lligen
t Pig
s
Prot
ectio
n (P
aint
) Thi
ckne
ss
Man
ual I
nspe
ctio
n (O
pera
tors
)
Alar
ms/
Auto
Shu
tdow
n/S
hutd
own
Tele
met
ryPr
otec
tion
Life
Exp
ecta
ncy
Rev
iew
Visu
al A
sses
smen
ts
Lase
r Pro
filin
g/R
ough
ness
Met
ers
Pave
men
t Stre
ngth
Tes
ters
Skid
Res
ista
nce
Test
ers
DynamicMechanicalPlant Instruments ControlSystems PassiveRoads Structures
Concrete Earthen
Buildings Pipelines
Gravity Pressure
ElectricalPoles Wires
Once the assets have been monitored, a condition grading should beimplemented and each asset should be rated based on this grading. The utilityshould determine what type of grading system works best for the s pecific utility.Below are some examples of grading systems that can be implemented.

2006 Edition A-10
Condition Rating ModelRank Description of Condition
1 Very Good ConditionOnly normal maintenance required
2 Minor Defects OnlyMinor maintenance required (5%)
3 Maintenance Required to Return to Accepted Level of ServiceSignificant maintenance required (10 -20%)
4 Requires RenewalSignificant renewal/upgrade required (20 -40%)
5 Asset UnserviceableOver 50% of asset requires replacement
Intermediate Condition Rating ModelRank Description of Condition3.0 Minor3.4 Average3.8
Level of Service MaintenanceSignificant
4.0 Minor4.2 Average4.4 Medium4.6 Substantial4.8
Requires Major Upgrade
Significant5.0 Minor5.2 Average5.4 Medium5.6 Substantial5.8
Asset Basically Unserviceable
Significant
Sophisticated Condition Assessment ModelBase
RankingRoads(0-100)
Drains –Sewers(0-200)
WaterMains(0-500)
Buildings(0-10)
Parks(0-125)
Plant(0-
100)1 0-200 0-40 0-100 0-2 0-25 0-202 200-400 40-80 100-150 2-4 25-50 20-403 400-600 80-120 150-200 4-6 50-75 40-604 600-800 120-160 200-300 6-8 75-100 60-805 800-
1000160-200 300-500 8-10 100-
12580-100

2006 Edition A-11
Letter Based Ranking SystemRank Condition Description
A Very GoodB GoodC FairD PoorE Very PoorF Failing, needs replacement
Life Remaining Ranking SystemRank Life Remaining
5 New or nearly new4 10-20 years3 5-10 years2 2-5 years1 1-2 years0 0 years

2006 Edition A-12
A.3 Resources for Assessing Useful Life
There are publications that discuss the projected useful life for many types ofassets. The utility operator should know the system better than any projection.For example, a water distribution system operator may know that the ductile ironpipe in the system was buried too shallow and has a risk of freezing every winter.The useful life of the ductile iron pipe for this community would be significantlylower than the published projections. However, published projections are usefulto have as a starting place. The foll owing table is one such example.

2006 Edition A-13
Typical Useful Life for Selected Infrastructure AssetsSample Useful Live (years) Sample Useful Live (years)
Roads: Wastewater:Pavement Substructure 50-100 Gravity Sewer Lines 80-100Wearing Surfaces 10-20 Manholes 20-50Curb and Gutter 50-80 Pumping Station
Structures50
Footpaths 15-50 Pumping Station Electrical 15Bridges 30-80 Risers 25Culverts 50-80 Treatment Plant
Structures50
Roadside furniture orsignage
10 Treatment Plant Electrical 15-25
Bus shelters 20 Parks:Bike paths 50 Parks & Gardens *Street lighting 20 Fields *Traffic Signals 10 Swimming Pools 50Unsealed roads - Plant Nurseries 20Drainage: Fountains 50Drains (underground) 50-80 Cemeteries *Culverts 50-80 Public Barbecues 10Manholes 20-50 Fences 25Detention Basins 50-100 Play Equipment 25Pumping Station Structures 50 Buildings:Pumping Station Electrical 25 Chambers/offices/halls 50-100Water Supply Toilet blocks 50-100Storage tanks 50-80 Houses 50-100Treatment Plant Structures 60-70 Sports Clubs 50Treatment Plant Electrical 15-25 Waste FacilitiesWater lines 65-95 Landfills Depends
on fill ratePumping Station Structures 60-70 Transfer Stations 20Pumping Station Electrical 25 Garbage collection
vehicles6
Corporate:Work depots 50Vehicles 5Office Equipment 5-10*Consider each component separately

2006 Edition A-14
A.4 Asset Inventory and Recordkeeping
Once you have determined what you own, and where it is, its time to catalog thatdata in some format. There are many ways in which this can be done.
Commercially Available Asset Management DatabaseFor larger systems with a planning budget and dedicated personnel, a softwarepackage written specifically for the purpose of Asset Management can be used.There are many types of Asset Management software available. A simpleinternet search with a search engine such as Google for “Utility AssetManagement Database” will point you in the right direction.
Since this software is written specifically for Asset Ma nagement, it is designed toallow the input data to be searched and printed, has pre -designed reports, cantrack budgets, and do many other things. This type of software is manufacturedby a company that understands the many needs of utilities and provide scustomer support.
Database SoftwareIdeally, all systems would have a database to manage their asset inventory. Ifthe software created specifically for Asset Management is not realistic, a generaldatabase software is the next best option. Many man ufacturers producedatabase software, some are available for purchase at office goods andcomputer stores, some are available for purchase and download, some areavailable for free.
Creating a database is not typically self -explanatory. However, there are coursesavailable for learning about databases at most colleges and some high schools,that are relatively short and inexpensive. Also, many communities may have astudent or someone with database knowledge that would be willing to assist withthis project. Once the database is created and tested, maintaining and updatingthe data can be accomplished by any member of the utility.
Some examples of database software that are readily available include, MySQL,Microsoft Access, Oracle, FoxPro, and Open OfficeBase.
Spreadsheet SoftwareAnother method of creating an inventory, is to create a spreadsheet that listsevery asset in the utility’s inventory. Spreadsheet software is standard on mostcomputers. However, there are many disadvantages to using a spreadsheet.Spreadsheets have very limited searching capabilities. Creating a spreadsheetinventory will essentially create a list of assets that can be printed. It is not asdynamic as a database and is not recommended.

2006 Edition A-15
HandwrittenIf software and computers are not readily available, the utility should have awritten inventory of all the assets they own. This handwritten list should beedited as the system grows and changes. A handwritten inventory is even lessdesirable than a spreadsheet inve ntory, but is better than no inventory at all.
Below is an example of a report generated from an Asset Inventory created usingMicrosoft Access.

2006 Edition
Appendix BLevel of Service

2006 Edition B-1
B.1 Level Of Service Examples
A system is bounded in its Level of Service by two criteria: the system can notgo below the requirements of state and federal regulations (the minimum level ofservice a system can provide) and the system can not go above the maximumcapabilities of the assets (the maximum a system c an provide.) Between thesetwo boundaries, the system can set any Level of Service it deems appropriate,acceptable to the public, management, and elected officials and that is affordableto the system.
There are no standards regarding the number of item s to include in a level ofservice. The system can decide for itself what to include in the LOS. Someexamples of LOS Agreements are presented in this Appendix. These examplesare based on actual systems, but have been adapted and adjusted for use here.

2006 Edition B-2
Level of Service AgreementExample 1
Water System
All federal and state water quality regulations will be met
Water Losses should be less than 10%
The system will maintain a minimum pressure of 40 psi.
There will be fire flow available for 100% of the customers within the system.
No adverse event, not related to electrical failure or severe weather condition, willcause the customer to be without water for more than 8 hours at a time.
EPA’s secondary standards related to aesthetics shall be met b y the system.
Rates will be reviewed on an annual basis and raised as needed to ensure fullcost recovery.
The source shall be monitored on a bi -monthly basis, by the water system andthere shall be no E. coli detected in the source waters.
All customer complaints will be investigated within 2 business days of reportingthe complaint.

2006 Edition B-3
Level of Service AgreementExample 2
Water System
System will meet all state and federal regulatory standards.
Two days of storage will be maintained at all times in the system.
Source water pumps will be functional 99% of the time. Spare parts will bemaintained to the extent possible to repair source water pumps quickly.
All customer complaints regarding water quality will be responded to within 90minutes of the complaint 95% of the time.
Water losses will be maintained below 12%.
Unscheduled water supply interruptions will be reduced 5% per year until a 25%reduction has been achieved.
Breaks will be repaired within 6 hours from the initiation of repair 95% of the time.

2006 Edition B-4
Level of Service AgreementExample 3
Water System
System will meet all state and federal regulatory standards.
System will strive to reduce complaints to fewer than 5 complaints per month.
Complaints will be addressed within 24 hours of receipt 95% of the time.
Under normal conditions, pressures will be maintained between 30 and 70 psi.
Drought restrictions will be enacted whenever the source cannot meet dailydemands. If drought restrictions must be enacted more than 20% of the year, thesystem will investigate additional or alternative sources.
Customers will receive written notice 24 hours in advance of any plannedinterruption in service.
Planned interruptions will occur during the hours of 9 am and 4 pm Mondaythrough Friday 90% of the time.
For unplanned interruptions, 15 minutes of notice prior to shut down will beprovided, unless there is a critical emergency situation.
Service will be restored within 6 hours of shut down 90% of the time.
Customers will be notified of how well the system meets the LOS criteria on anannual basis.

2006 Edition
Appendix CCritical Assets

2006 Edition C-1
C.1 Critical Assets
A detailed discussion of assessing critical assets is presented in Section 5. Insummary, the assessment should examine the probabi lity of a failure occurringand the consequences of the failure if it were to occur.
In the determination of the criticality of the assets, the water system should askitself questions similar to the following:
What happens if the asset fails? What are the chances of the asset failing? If this asset fails, how much of the community is affected? If this asset fails, how much would it cost to repair it? If this asset fails, how many other assets could potentially be damaged? If this asset fails, how is the community’s opinion of the water system
affected? If this asset fails, are there public health consequences?
The worksheet on the following page can be used to determine the criticality ofeach of the assets. The value of probability of failure can be entered on the rowsand the value of consequence can be entered on the columns. Where the rowsand columns intersect, is the value for criticality of that asset.
This criticality assessment is a simplistic approach that constitutes a reasonablestart for a water or wastewater system. Over time, the criticality analysis can bemore robust. Or if a system has sufficient data and resources to assess criticalityin a more sophisticated way initially, it can start at a higher level than thisapproach.

2006 Edition C-2
Asset:Date:Circle the row and column that matches the ranking for bothprobability and consequence.Where the two intersect becomes your risk.
Consequence (Cost)of FailureMultiplied
1 2 3 4 51 1 2 3 4 52 2 4 6 8 103 3 6 9 12 154 4 8 12 16 20
Probabilityof
Failure5 5 10 15 20 25
1 Very Low2 Low3 Moderate4 High5 Very
High
Risk = Consequence x Probability =

2006 Edition
Appendix DLife Cycle Costing Resources

2006 Edition D-1
D.1 Example of O&M Expenditures for A Water Distribut ion System
Table D-1 below presents an example of how the expenditures on O&M andcondition assessment can be addressed for a water distribution system. Similartables can be completed for other categories of assets, such as treatmentfacilities, sources, and storage facilities. This table presents general activitiesthat could be completed on the assets, and provides an example of costs thatwould be spent on an annual basis on each of these assets. The costs aremeant for illustrative purposes only to show the relative difference betweenexpenditures on various levels of critical assets. These costs are not meant tobe “real” costs for any specific utility. The O&M activities are also just examples;individual utilities should develop their own O&M s chedule of activities for eachasset.
Table D-1: Summary of O&M Expenditures and Criticality
AssetCategory
Likelihoodof Failure
Consequenceof Failure
O&MActivities
ConditionAssessment
Activities0-30 year old
PVCdistributionpipe and
associatedappurtenancesin Residential
area
Low Low
Flush lines1/year
Exercise valves1/year$500/yr
Track breaklocations and
break information(type, repair, size,
etc) based onfield activity and
work orders$500/yr
30-50 year oldPVC
distributionpipe and
associatedappurtenancesin residential
area
Medium Low
Flush lines1/year
Exercise valves1/year$500/yr
Track breaklocations and
break information(type, repair, size,
etc) based onfield activity and
work orders$500/yr
Greater than50 year old
PVCdistributionpipe and
associatedappurtenancesin residential
area
High Low
Flush lines1/year
Exercise valves1/year
Replace pipesthat have
multiple failures.Program inpipes for
replacement inthe repair andreplacement
program$50,000
Track breaklocations and
break informationbased on field
activity.
$1,500/yr

2006 Edition D-2
AssetCategory
Likelihoodof Failure
Consequenceof Failure
O&MActivities
ConditionAssessment
Activities
0-30 year oldPVC pipe in
major arterialsLow Medium - High
Flush lines1/year
Exercise valves1/year$500/yr
Track breaklocations and
break informationbased on field
activity.Perform some
proactivecondition
assessments onthe pipe, such as
leak detection$2,000/yr
30-50 year oldPVC pipe in
major arterialsMedium Medium - High
Flush lines1/year
Exercise valves1/year
Pipes that havepoor condition
based oncondition
assessmentshould bereplaced
$150,000/yr
Track breaklocations and
break informationbased on field
activity.Perform proactive
conditionassessments onthe pipe, such as
leak detection$5,000/yr
Greater than50 year oldPVC pipe in
major arterials
High High
Flush lines1/year
Exercise valves1/year
Pipes that havepoor condition
based oncondition
assessmentshould bereplaced
$250,000/yr
Track breaklocations and
break informationbased on field
activity.Perform
significantproactivecondition
assessments onthe pipe, such as
leak detectionand othermethods
$10,000/yr

2006 Edition D-3
Table D-2: Repair and Replacement Schedule
Year Item BriefDescription
EstimatedCost
Method ofEstimation
One Time orRecurring
Time Period ofReoccurrence

2006 Edition D-4
Table D-3: Repair and Replacement Schedule Example
Year Item Brief Description EstimatedCost Method of Estimation One Time or
RecurringTime Period ofReoccurrence
2007 Meters Replace 1/5 ofmeters $10,000
Knowledge of metercosts from previouspurchases
Recurring Every 5 Years
2008
2009 Chlorine Pump Replace chlorinepump $2,000 Based on previous
purchase RecurringEvery 8 yearsbased on pastexperience
2010 Tank 1Maintenance
Tank Cleaning,Repair, Painting,Inspection
$50,000 Cost for neighboringsystem with similar tank Recurring Every 10 years
2011
2012 Meters Replace 1/5 ofmeters $10,000
Knowledge of metercosts from previouspurchases
Recurring Every 5 Years
2013
2014
2015
2016
Meters Replace 1/5 ofmeters $10,000
Knowledge of metercosts from previouspurchases
Recurring Every 5 Years
2017
Chlorine Pump Replace chlorinepump $2,000 Based on previous
purchase RecurringEvery 8 yearsbased on pastexperience

2006 Edition D-5
Year Item Brief Description EstimatedCost Method of Estimation One Time or
RecurringTime Period ofReoccurrence
2018
2019
2020 Tank 1Maintenance
Tank Cleaning,Repair, Painting,Inspection
$50,000 Cost for neighboringsystem with similar tank Recurring Every 10 years
2021
2022 Meters Replace 1/5 ofmeters $10,000
Knowledge of metercosts from previouspurchases
Recurring Every 5 Years
2023
2024
2025 Chlorine Pump Replace chlorinepump $2,000 Based on previous
purchase RecurringEvery 8 yearsbased on pastexperience
2026
The table above indicates the routine replacements that this system will undertake for the next 20 years. Some yearshave multiple items, while some years have no projects.
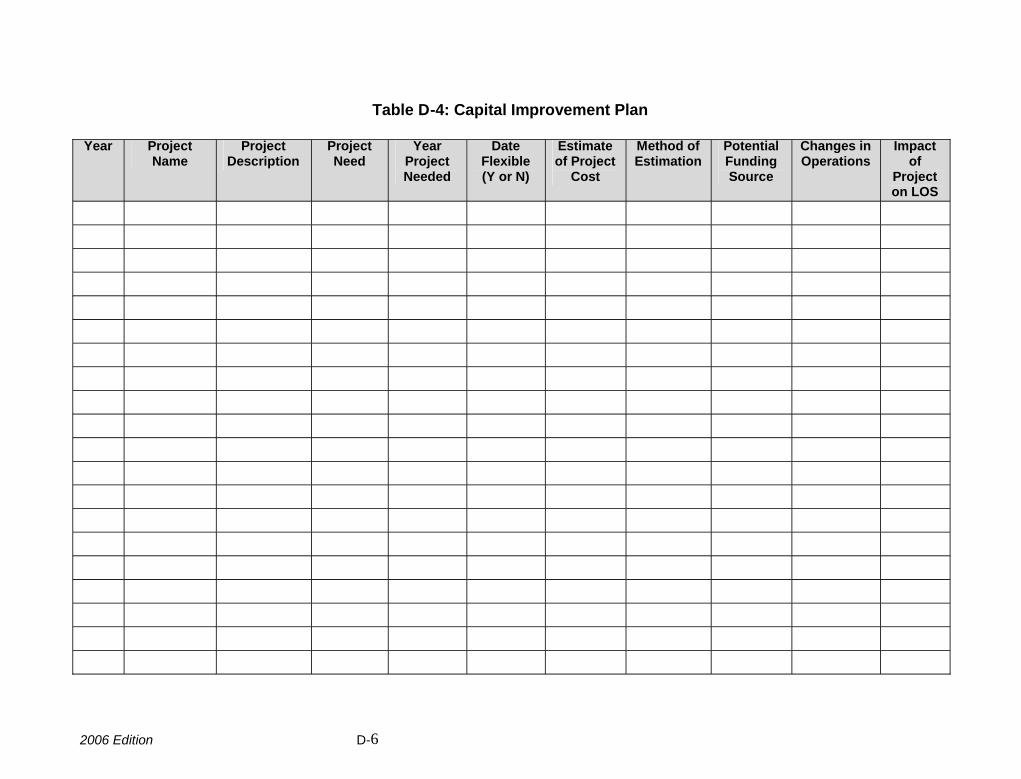
2006 Edition D-6
Table D-4: Capital Improvement Plan
Year ProjectName
ProjectDescription
ProjectNeed
YearProjectNeeded
DateFlexible(Y or N)
Estimateof Project
Cost
Method ofEstimation
PotentialFundingSource
Changes inOperations
Impactof
Projecton LOS

2006 Edition D-7
Table D-4: Capital Improvement Plan Example
YearDesired
ProjectName
ProjectDescription
Project Need DateFlexible(Y or N)
Estimateof
ProjectCost
Method ofEstimation
PotentialFundingSource
Changes inOperations
Impact ofProject on
LOS
2007Main StreetLineExtension
Extend MainStreet 6”PVC pipe toserve 20customerscurrently onindividualwells
The 20customersare facingsignificantchallengeswith theirindividualwells andmust beadded towater system
Yes, couldpotentiallybe delayedup to 2 years
$150,000
Based onpreviouslineextensioncost;increased5% tocoverinflation
25%connectionfees; 25%CDBG;25% RIPLoan
None
Will be able toprovideadditionalcustomers withwater
2008 NoneNeeded
ArsenicRemovalFacility
Add ArsenicAdsorptionSystem withbuilding andall neededequipment
Source watercan not meetnewregulatoryrequirementof 10 ppb
N, mustmeet dateforregulatoryrequirements
$300,000 Engineer’sEstimate
RequestingLegislativeGrant; SRFloan
Requireshigher leveloperator,requiresreplacementand disposalof media,O&M costssignificantlyhigher
Will allowsystem to meetLOSrequirement tobe incompliancewith regulatorystandards
2009
2nd StreetLineReplacement
Replacementof 2nd StreetLine withnew pipe
Line failuresare sonumerous,LOS can notbe met
Y, but needsreplacedwithin 1 to 2years
$250,000Based onpreviouscosts
30% fromreserves;RDloan/grant
None
Will allow thesystem to meetLOSrequirements
2010 None

2006 Edition D-8
YearDesired
ProjectName
ProjectDescription
Project Need DateFlexible(Y or N)
Estimateof
ProjectCost
Method ofEstimation
PotentialFundingSource
Changes inOperations
Impact ofProject on
LOS
2011
Replace 4miles of 6”PVCDistributionPipe
It isanticipatedthat 4 milesof pipe willneed to bereplaced dueto currentconditionassessmentandestimateduseful life
Needed tokeep thesystem ingoodoperatingorder
Y $1.5million
Engineer’sEstimate
SRF loanor RDloan/grant
None
Reducenumber ofunplannedoutages
2012
2013
2014ReplaceStorageTank 3
ReplaceStorageTank #3 witha new, largertank
Storage tankhas been wellmaintainedbut isreaching theend of itsuseful life,further rehabdifficult; also,size of tankneeds to beincreased
Y $500,000
Costseveralneighboringsystemspaid for asimilar tank
Need 50%grant, 50%fromrevenuesor loansources
Increasesystempressuresand wateravailability;may requiresomechanges inthe amountof time wellsare pumped.
Would improvesystems overallquantity ofstorage, wouldincrease fireflow potential,would improvesystempressure
2015
2016
2017
2018

2006 Edition D-9
YearDesired
ProjectName
ProjectDescription
Project Need DateFlexible(Y or N)
Estimateof
ProjectCost
Method ofEstimation
PotentialFundingSource
Changes inOperations
Impact ofProject on
LOS
2019
2020 Replace Well#7
Drill a newwell to takethe place ofWell #7
Well #7 hasbeendeclining inquantity formany years.It isanticipatedthat it willneedreplaced by2020.
N $15,000 Driller’sEstimate
50%existingrevenuesandreservefunds; 50%loan funds
May requirechanges inthe currentpumpingsystem
Will improveoverall wateravailability tothe communityand thesystems abilityto providewatercontinuously
2021
2022
2023
2024
2025
2026
As the table shows, multiple projects can be done in the same year by adding another row to the table. Some y ears canremain blank with no projects if there is no anticipated need for a project in that year.

2006 Edition
Appendix ELong-Term Funding Strategy

2006 Edition E-1
E.1 Long-term Funding Strategy
The objective in preparing long -term financial forecasts is to outline th eorganization’s future financial requirements based on all information relating toasset creation, maintenance, renewal/rehabilitation and disposals.
Three questions must be answered when preparing the strategy: What funds are needed to acquire, operat e, maintain and renew the
asset? When will the funds be required? How do these types of funds affect the utilities rates?
There are five types of expenditures that a utility needs to plan for. Each type ofexpenditure has a typical funding source associ ated with it as well.
Expenditures and FundingExpenditure
TypeDescription Funding
SourceOperational Activities which have no effect on asset
condition but are necessary to keep theasset utilized appropriately (i.e. powercosts, overhead costs, etc.).
AnnualBudget, Rates,Revenue
Maintenance The ongoing day-to-day work required tokeep assets operating at required servicelevels (i.e. repairs, minor replacements).
AnnualBudget, Rates,Revenue
Renewal Significant work that restores or replacesan existing asset towards its original size,condition or capacity.
AnnualBudget, Rates,Revenue,Grants, Loans
New Work,Development,
Capital Projects
Works to create a new asset, or to upgradeor improve an existing asset beyond itsoriginal capacity or performance, inresponse to changes in usage, customerexpectations, or anticipated future need.
AnnualBudget, Rates,Revenue,Grants, Loans
Disposal Any costs associated with the disposal of adecommissioned asset.
AnnualBudget, Rates,Revenue
It is worth noting that many funding agencies have a Uniform FundingApplication. In an effort to reduce the time spent and expense that localgovernments incur when applying to multiple agencies for financial assistance,the New Mexico Environment Department/Cons truction Programs Bureau (CPB)along with the New Mexico Finance Authority, Department of Finance/LocalGovernment Division and USDA Rural Development signed a memorandum ofunderstanding in December of 2003 whereby each of the agencies agreed uponthe use of a Uniform Funding Application. Once completed, the application can

2006 Edition E-2
be copied and submitted to any of the funding programs described. Each agencymay have additional requirements, unique to a particular program.
You may download the application in PD F format or a Word Document from:http://www.nmenv.state.nm.us/cpb/cpbtop.html#UNIFORMFUNDINGAPP

2006 Edition
Appendix FChecklist for Asset Management Reviews

2006 Edition F-1
Asset Management ComponentsChecklist
System Name: ______________________________________________________
Water or Wastewater System (circle one)
Componentof Asset
Management
Specific Item CompletedY or N
Method ofCompletion
Comments
List of AssetsMap of Assets
Asset ConditionAssessment
Remaining UsefulLife of the Assets
AssetInventory
Asset Value(Optional)
Level ofService
Level of ServiceAgreement
CriticalAssets
CriticalityAnalysis
Operation andMaintenance
ProgramRepair
ReplacementSchedule
Life CycleCosting
CapitalImprovement
Plan (CIP)5 Year Financial
PlanFunding Strategy
for Repair andReplacement
Schedule
Long-TermFundingStrategy
Funding Strategyfor CIP
Overall Assessment:

2006 Edition F-2
EXAMPLE
Asset Management ComponentsChecklist
System Name: ____H2O Water System _____________________________________
Water or Wastewater System (circle one)
Componentof Asset
Management
Specific Item CompletedY or N
Method ofCompletion
Comments
List of Assets Y HandwrittenMap of Assets
YGoogle Mapwith Hand-
drawn assetsAsset Condition
AssessmentY
Ranked from 0to 5
Many assetsranked as 1, may
underestimatecondition
RemainingUseful Life of the
AssetsY
Provided yearsof life left
AssetInventory
Asset Value(Optional)
N
Level ofService
Level of ServiceAgreement Y
Agreementprovided tocustomers
Includes 8elements
CriticalAssets
CriticalityAnalysis
N
Operation andMaintenance
Program Y
Notebook ofeach piece of
equipment andmaintenance
required
Very thoroughprogram
RepairReplacement
ScheduleN
Life CycleCosting
CapitalImprovement
Plan (CIP)Y
5 Year CIP

2006 Edition F-3
Componentof Asset
Management
Specific Item CompletedY or N
Method ofCompletion
Comments
5 Year FinancialPlan
YFollowed
RCAC GuideRate Structure
YUsed Computerprogram to set
rates
Rates coverexpenses
Funding Strategyfor Repair andReplacement
Schedule
N
Didn’t have repairreplacement
schedule
Long-TermFundingStrategy
Funding Strategyfor CIP
Y
Table indicatingpotential
funding sourcesfor each CIP
element
Overall Assessment: This is a small water system. Their asset management strategycontains most of the required elements. For the size system, they did a good job gatheringinformation and completing the required items.