Asset Allocation
226
Asset Allocation Principles A Resource for Private Investors 2002–2003
-
Upload
gujingjing -
Category
Documents
-
view
166 -
download
2
Transcript of Asset Allocation
Asset Allocation PrinciplesA Resource for Private Investors
2002–2003
Letter to Investors
To our investing clients:
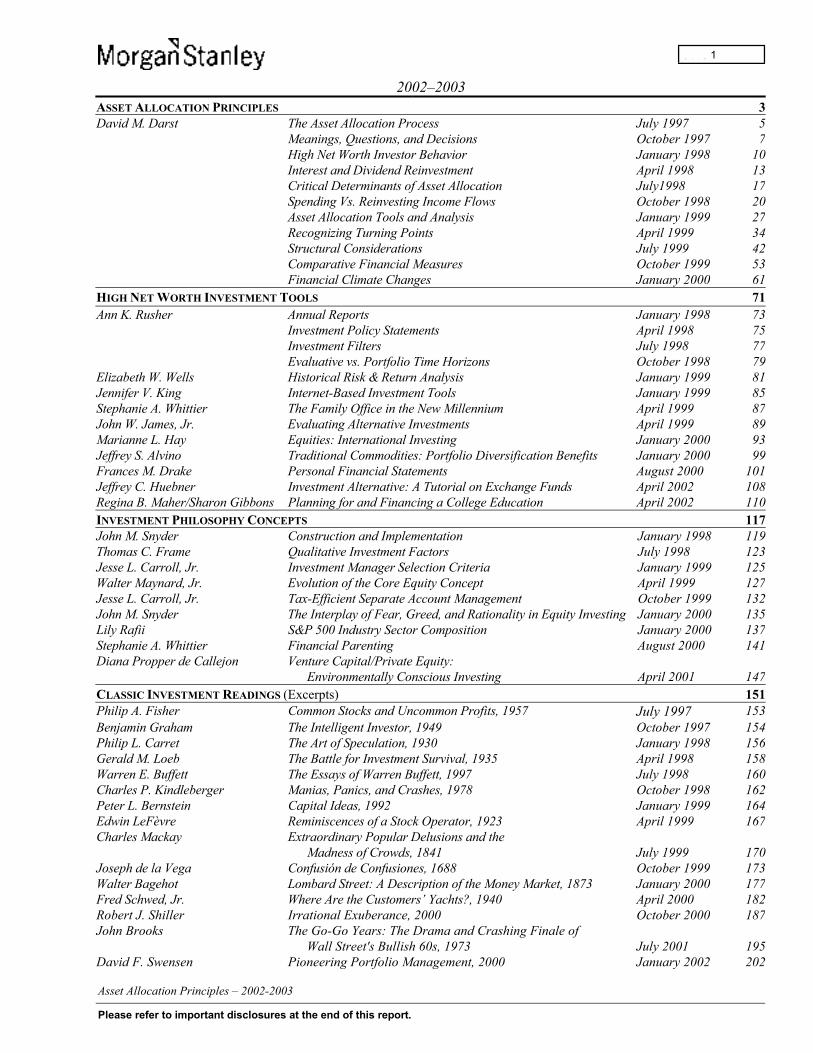
We are pleased to present the enclosed selection of Asset Allocation Principles, High Net Worth Investment Tools,Investment Philosophy Concepts, and summaries of Classic Investment Readings. These essays are excerpted from thetwenty-one previously published issues of Financial Management Review and Outlook, a joint publication of MorganStanley Investment Management; the Morgan Stanley Individual Investor Group, including Investor Advisory Services andPrivate Wealth Management; and Morgan Stanley Investment Research.
Academic studies have shown that approximately 75% to 91% of the variance in returns from investing activity derivesfrom the asset allocation decision. Asset allocation has been a core discipline and an area of firmwide focus since thefounding of Morgan Stanley Investment Management (MSIM) over 20 years ago. In recent years, we have extendedthis emphasis to the investment needs, goals, and specific circumstances of affluent and High Net Worth family groups,private foundations, closely-held corporations, and related private investors.
Throughout this publication, our aim is to provide analysis, tools, and concepts of value to sophisticated investorsfacing important asset allocation decisions.
We want to emphasize our commitment to providing excellent service, superior quality investment advice, andfinancial solutions that meet the needs of substantial private investors.
We greatly appreciate the feedback from, and dialogue with, our private investing clients that these writings haveengendered.
BARTON M. BIGGSCHAIRMAN
MORGAN STANLEYINVESTMENT MANAGEMENT
MITCHELL M. MERINPRESIDENT AND CHIEF OPERATING OFFICER
MORGAN STANLEYINVESTMENT MANAGEMENT
JOHN H. SCHAEFERPRESIDENT AND CHIEF OPERATING OFFICER
MORGAN STANLEYINDIVIDUAL INVESTOR GROUP
MAYREE C. CLARKGLOBAL DIRECTORMORGAN STANLEY
PRIVATE WEALTH MANAGEMENT
-

2002–2003ASSET ALLOCATION PRINCIPLES 3David M. Darst The Asset Allocation Process July 1997 5
Meanings, Questions, and Decisions October 1997 7High Net Worth Investor Behavior January 1998 10Interest and Dividend Reinvestment April 1998 13Critical Determinants of Asset Allocation July1998 17Spending Vs. Reinvesting Income Flows October 1998 20Asset Allocation Tools and Analysis January 1999 27Recognizing Turning Points April 1999 34Structural Considerations July 1999 42Comparative Financial Measures October 1999 53Financial Climate Changes January 2000 61
HIGH NET WORTH INVESTMENT TOOLS 71Ann K. Rusher Annual Reports January 1998 73
Investment Policy Statements April 1998 75Investment Filters July 1998 77Evaluative vs. Portfolio Time Horizons October 1998 79
Elizabeth W. Wells Historical Risk & Return Analysis January 1999 81Jennifer V. King Internet-Based Investment Tools January 1999 85Stephanie A. Whittier The Family Office in the New Millennium April 1999 87John W. James, Jr. Evaluating Alternative Investments April 1999 89Marianne L. Hay Equities: International Investing January 2000 93Jeffrey S. Alvino Traditional Commodities: Portfolio Diversification Benefits January 2000 99Frances M. Drake Personal Financial Statements August 2000 101Jeffrey C. Huebner Investment Alternative: A Tutorial on Exchange Funds April 2002 108Regina B. Maher/Sharon Gibbons Planning for and Financing a College Education April 2002 110INVESTMENT PHILOSOPHY CONCEPTS 117John M. Snyder Construction and Implementation January 1998 119Thomas C. Frame Qualitative Investment Factors July 1998 123Jesse L. Carroll, Jr. Investment Manager Selection Criteria January 1999 125Walter Maynard, Jr. Evolution of the Core Equity Concept April 1999 127Jesse L. Carroll, Jr. Tax-Efficient Separate Account Management October 1999 132John M. Snyder The Interplay of Fear, Greed, and Rationality in Equity Investing January 2000 135Lily Rafii S&P 500 Industry Sector Composition January 2000 137Stephanie A. Whittier Financial Parenting August 2000 141Diana Propper de Callejon Venture Capital/Private Equity:
Environmentally Conscious Investing April 2001 147CLASSIC INVESTMENT READINGS (Excerpts) 151Philip A. Fisher Common Stocks and Uncommon Profits, 1957 July 1997 153Benjamin Graham The Intelligent Investor, 1949 October 1997 154Philip L. Carret The Art of Speculation, 1930 January 1998 156Gerald M. Loeb The Battle for Investment Survival, 1935 April 1998 158Warren E. Buffett The Essays of Warren Buffett, 1997 July 1998 160Charles P. Kindleberger Manias, Panics, and Crashes, 1978 October 1998 162Peter L. Bernstein Capital Ideas, 1992 January 1999 164Edwin LeFèvre Reminiscences of a Stock Operator, 1923 April 1999 167Charles Mackay Extraordinary Popular Delusions and the
Madness of Crowds, 1841 July 1999 170Joseph de la Vega Confusión de Confusiones, 1688 October 1999 173Walter Bagehot Lombard Street: A Description of the Money Market, 1873 January 2000 177Fred Schwed, Jr. Where Are the Customers’ Yachts?, 1940 April 2000 182Robert J. Shiller Irrational Exuberance, 2000 October 2000 187John Brooks The Go-Go Years: The Drama and Crashing Finale of
Wall Street's Bullish 60s, 1973 July 2001 195David F. Swensen Pioneering Portfolio Management, 2000 January 2002 202
-
1

The Asset Allocation Process 5
Meanings, Questions, and Decisions 7
High Net Worth Investor Behavior 10
Interest and Dividend Reinvestment 13
Critical Determinants of Asset Allocation 17
Spending Versus. Reinvesting Income Flows 20
Asset Allocation Tools and Analysis 27
Recognizing Turning Points 34
Structural Considerations 42
Comparative Financial Measures 53
Financial Climate Changes 61
-
3


Asset Allocation Principles: The Asset Allocation Process David M. Darst
Asset allocation means different things to differentinvestor groups. For many institutional investors, assetallocation means: (i) calculating the rates of return from,standard deviations on, and correlations between, variousasset classes; (ii) running these variables through amean-variance optimization program to produce aselection of asset mixes having different risk-rewardprofiles; and (iii) analyzing and implementing someversion of the desired asset allocation in light of theinstitution’s goals, history, preferences, constraints, andother factors.
For High Net Worth private investors, asset allocationmay or may not include these formalized actions. In ourview, most important for private investors is the need topursue asset allocation with special attention to: (i) thetax status and after-tax implications of investments in agiven asset class; and (ii) the investor’s individualmotivations, personal circumstances, and cyclical andsecular market outlook.
Some, but by no means all, of the strategic issuesaffecting wealthy private investors’ asset allocationdecisions include: the timing and magnitude ofintergenerational income requirements; the ability tomeasure, withstand, and be adequately compensated forbearing risk or loss; absolute and relative performancegoals and benchmarks for measuring returns; theinfluence of one or more dominant investment positionsor significant non-tracked asset categories, such as art,
jewelry, or collectibles; and meaningful financialliabilities such as mortgage debt or margin borrowing.
After a thorough review of the High Net Worthinvestor’s financial profile and objectives, the assetallocation process can proceed in a multi-step process.First, assumptions need to be examined and then spelledout about future expected returns, risk, and thecorrelation of future returns between asset classes.Second, the investor and his or her advisor should selectthose asset classes which are appropriate in view of theinvestor’s profile and objectives and which have themaximum expected return for a given level of risk or,stated another way, the minimum risk for a given level ofreturn.
Next, the investor should establish a long-term assetallocation policy (the “Strategic Asset Allocation”)which reflects the optimal long-term benchmark aroundwhich future asset mixes might be expected to vary.Fourth, the investor should implement Tactical AssetAllocation decisions against the broad guidelines of theStrategic Asset Allocation. Fifth, the portfolio of assetsshould be periodically rebalanced, with sensitivity to thetax consequences of such rebalancing, to take account ofthe Strategic Asset Allocation framework. Last, theinvestor should review the Strategic Asset Allocationitself, from time to time, to ensure overallappropriateness given his or her circumstances, frame ofmind, the outlook for each of the respective asset classes,and the financial markets overall.
Quantitative and Qualitative Decision Framework
SpecifyAssumptions
Re: Asset Classes
ConductOngoingReview
SelectOptimum Asset
Classes
EstablishStrategic
Asset Allocation
ImplementTactical
Asset Allocation
RebalanceStrategic
Asset Allocation
-
5
Asset Allocation Principles: The Asset Allocation Process (cont.) David M. Darst
The history of wealthy individual investors’ focus onasset allocation can be divided into three broad phases.Traditionally, most U.S. private investors deployed theirportfolios according to overall perceived-wisdomguidelines reflecting the investment ethos of the age. Inthe 1930s, one version of these guidelines specified 60%in U.S. domestic bonds and 40% in U.S. stocks. A morerecent version of this standard asset mix, which prevailedfor quite some time, recommended 60% in stocks, 30%in bonds, and 10% in cash.
Beginning in the mid- to late 1980s, inspired by theactivities of certain institutional investors, a smallerproportion of wealthy individuals and family groupsbegan to shift some of their assets into venture capital,real estate, LBOs, oil and gas investments, andinternational and emerging markets equity and debt.
The third phase of private investors’ evolution in assetallocation has included exposure, generally throughfunds or managed accounts, to a variety of sophisticatedinvestment strategies known as market-neutral orabsolute-return strategies. In the equity realm, thesestrategies include warrant and convertible arbitrage,hedged closed-end fund and cross ownership arbitrage,synthetic security arbitrage, and other techniquesinvolving derivative instruments. In the fixed incomeworld, these strategies include futures, swaparrangements, credit risk and yield curve shapemispricings, and embedded and explicit optionstechniques.
It is important for individual investors to recognize thedistinctions among, and the valuation dynamicsunderlying, the three major super categories of assets, onwhich Robert J. Greer elaborated in a Winter 1997Journal of Portfolio Management article. The first assetgrouping consists of Capital Assets, such as equities andfixed income securities. Valuations of these assets aredetermined by the capitalization of cash flows fromprojected dividend, interest, and terminal valuepayments. The values of the second asset grouping,Consumable or Tradable Assets, such as oil, grains, andother commodities, are determined by the classical forcesof supply and demand. The valuations for the third assetgrouping, Store of Value Assets, such as art orcurrencies, are a function of what someone is willing topay for them. Some assets, such as real estate or gold, fitinto more than one of these groupings. Being aware ofthe distinctions between the value drivers in each assetgrouping, and the occasional tendency for markets tomisclassify assets (for example, treating stocks asConsumable Assets, or as Store of Value Assets) canhelp private investors in establishing a Strategic AssetAllocation framework, in implementing tactical assetallocation decisions, and even in selecting specificinvestments.
For further insights on the importance and mechanics of asset allocation,investors are referred to The Asset Allocation Process, by Barton M. Biggs,dated October 17, 1996.
-
6
Asset Allocation Principles: Meanings, Questions, and Decisions David M. Darst
For the tax-sensitive private investor, asset allocation hasseveral deeper meanings beyond the mathematicaloptimization of returns, standard deviations, andcorrelations. Very importantly, asset allocation is about(1) blending the underlying characteristics of a selectedset of asset classes to produce, in effect, a financial alloypossessing a more favorable risk/reward profile than anyof its component elements. Further, asset allocation isabout (2) recognizing and balancing trade-offs, chiefamong them being time horizon, protection goals, andexpected sources of return.
Asset allocation is also about (3) setting minimumand maximum percentages to ensure sufficientrepresentation, but not overconcentration, of investmentalternatives. Finally, asset allocation is centrally about(4) diversification, with the objective of aligning theexpected risk profile of the investor’s portfolio with hisor her own risk profile. Rather than attempting to timethe market in a limited number of asset classes, assetallocation seeks, through diversification, to providehigher returns with lower risk over a sufficiently longtime frame and appropriately compensate the investor forbearing nondiversifiable volatility.
Private investors face several critical questions anddecisions in the process of asset allocation. Theseinclude: (i) the ultimate length of the time horizon for theportfolio as a whole; (ii) the degree of volatility or valueimpairment the investor can withstand, in the aggregateand for specific investment categories; (iii) the desiredextent of principal protection versus purchasing powerprotection; (iv) the role and amount of core and non-coreasset classes; (v) the degree of patience and convictionthat can be maintained in the face of overall portfoliounderperformance relative to the performance of one ortwo asset classes; and, not to be minimized, (vi) theinvestor’s confidence level in the specific return, risk,and correlation projections on which asset allocationdecisions are based.
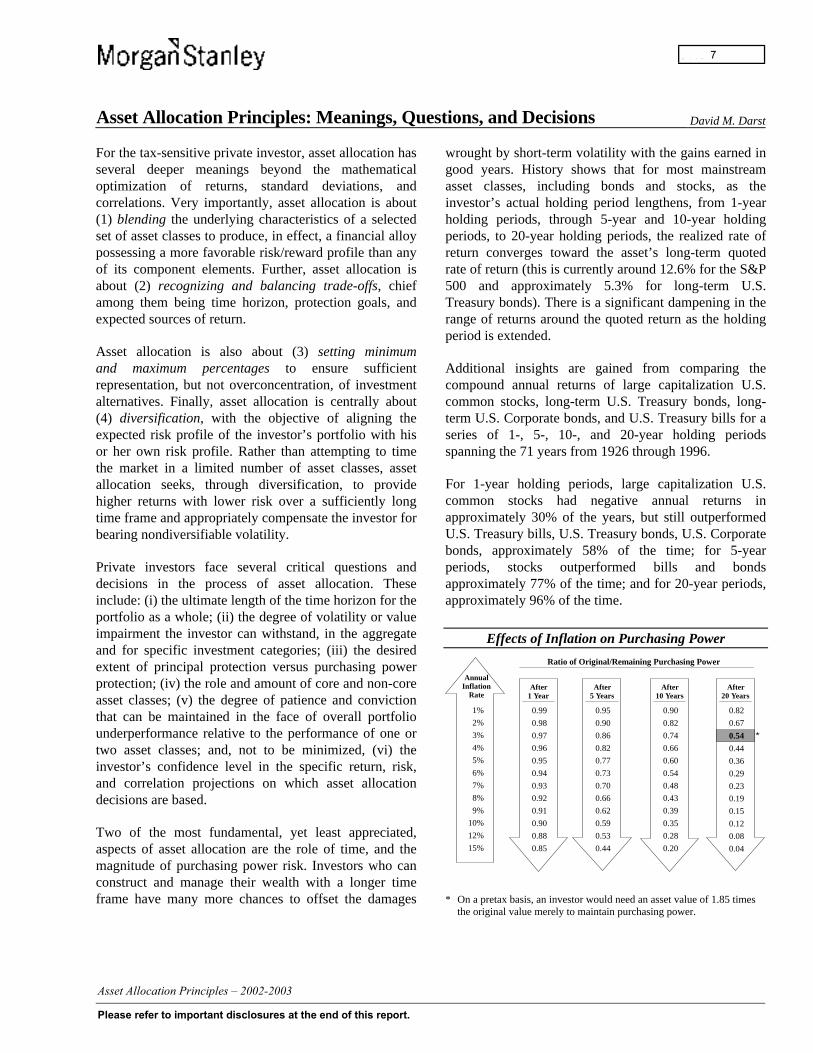
Two of the most fundamental, yet least appreciated,aspects of asset allocation are the role of time, and themagnitude of purchasing power risk. Investors who canconstruct and manage their wealth with a longer timeframe have many more chances to offset the damages
wrought by short-term volatility with the gains earned ingood years. History shows that for most mainstreamasset classes, including bonds and stocks, as theinvestor’s actual holding period lengthens, from 1-yearholding periods, through 5-year and 10-year holdingperiods, to 20-year holding periods, the realized rate ofreturn converges toward the asset’s long-term quotedrate of return (this is currently around 12.6% for the S&P500 and approximately 5.3% for long-term U.S.Treasury bonds). There is a significant dampening in therange of returns around the quoted return as the holdingperiod is extended.
Additional insights are gained from comparing thecompound annual returns of large capitalization U.S.common stocks, long-term U.S. Treasury bonds, long-term U.S. Corporate bonds, and U.S. Treasury bills for aseries of 1-, 5-, 10-, and 20-year holding periodsspanning the 71 years from 1926 through 1996.
For 1-year holding periods, large capitalization U.S.common stocks had negative annual returns inapproximately 30% of the years, but still outperformedU.S. Treasury bills, U.S. Treasury bonds, U.S. Corporatebonds, approximately 58% of the time; for 5-yearperiods, stocks outperformed bills and bondsapproximately 77% of the time; and for 20-year periods,approximately 96% of the time.
Effects of Inflation on Purchasing Power
1%
2%
3%
4%
5%
6%
7%
8%
9%
10%
12%
15%
AnnualInflation
Rate
0.99
0.98
0.97
0.96
0.95
0.94
0.93
0.92
0.91
0.90
0.88
0.85
After1 Year
0.95
0.90
0.86
0.82
0.77
0.73
0.70
0.66
0.62
0.59
0.53
0.44
After5 Years
0.90
0.82
0.74
0.66
0.60
0.54
0.48
0.43
0.39
0.35
0.28
0.20
After10 Years
After20 Years
Ratio of Original/Remaining Purchasing Power
0.82
0.67
0.54
0.44
0.36
0.29
0.23
0.19
0.15
0.12
0.08
0.04
*
* On a pretax basis, an investor would need an asset value of 1.85 timesthe original value merely to maintain purchasing power.
-
7
Asset Allocation Principles: Meanings, Questions, and Decisions (cont.) David M. Darst
Furthermore, the miracle of compound interest dependson the passage of time. For instance, of the increase inthe value of a 10%-compounding portfolio held for 20years, 11% of the total gain occurs in the first five years,17% in the second five years, 28% in the third five years,and fully 46% occurs in the final five years. Even atrelatively modest annual rates of inflation, over a 20-yeartime period, the effective loss in an investment’spurchasing power can be debilitating. As shown in thechart above, at an annual inflation rate of 3%, after 20years, the investor has lost 46% (1.00 minus 0.54) of hisor her original purchasing power on an investmentwhose principal value remains unchanged. Under such ascenario, the investor would need an asset value of 1.85times its original value merely to maintain purchasingpower. If taxes had to be paid, the required growthwould be even larger.
While there is no assurance that the annual inflation ratewill always average out to be a certain positive levelover long stretches of time, based on the experience ofthe modern era, purchasing power erosion has in the pastbeen a fact of life and is a significant risk that theinvestor should address squarely and prepare for.
For long-term investors, purchasing power risk is at leastas important, if not more so, as multi-period market pricevolatility risk. For short-term investors who do not havethe opportunity for good and bad years of investmentperformance to offset one another, market price volatilityrisk is usually more important than purchasing powerrisk.
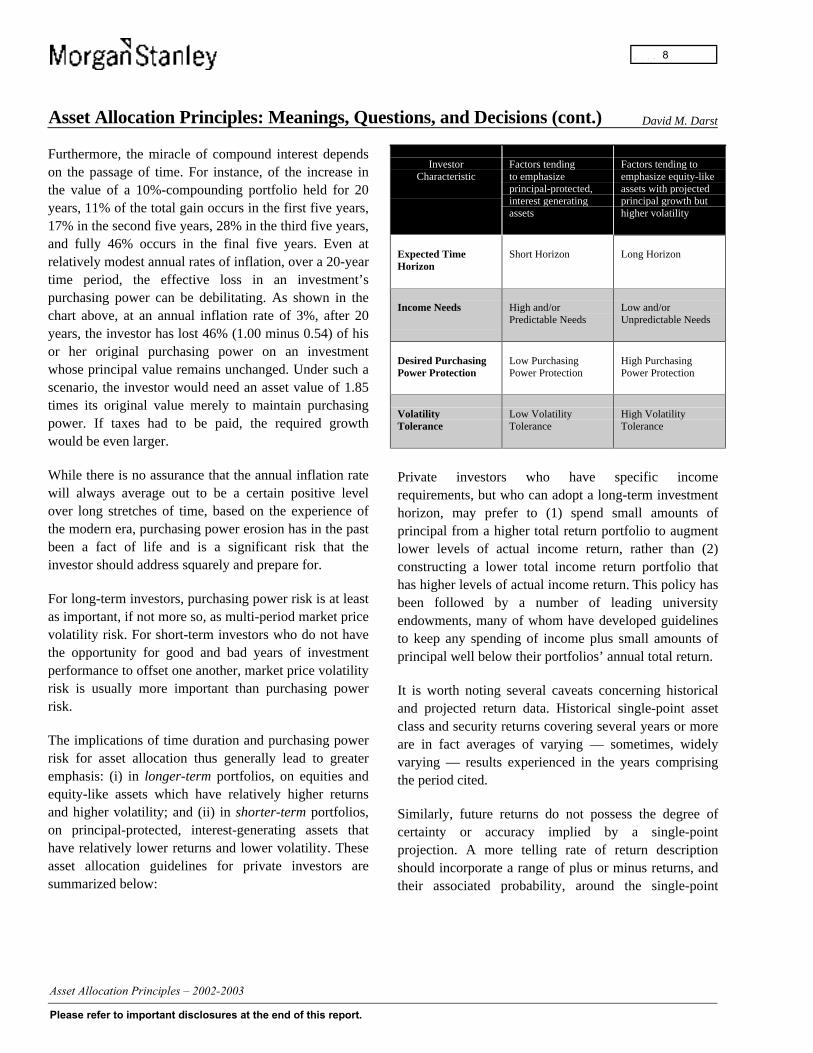
The implications of time duration and purchasing powerrisk for asset allocation thus generally lead to greateremphasis: (i) in longer-term portfolios, on equities andequity-like assets which have relatively higher returnsand higher volatility; and (ii) in shorter-term portfolios,on principal-protected, interest-generating assets thathave relatively lower returns and lower volatility. Theseasset allocation guidelines for private investors aresummarized below:
InvestorCharacteristic
Factors tendingto emphasizeprincipal-protected,interest generatingassets
Factors tending toemphasize equity-likeassets with projectedprincipal growth buthigher volatility
Expected TimeHorizon
Short Horizon Long Horizon
Income Needs High and/orPredictable Needs
Low and/orUnpredictable Needs
Desired PurchasingPower Protection
Low PurchasingPower Protection
High PurchasingPower Protection
VolatilityTolerance
Low VolatilityTolerance
High VolatilityTolerance
Private investors who have specific incomerequirements, but who can adopt a long-term investmenthorizon, may prefer to (1) spend small amounts ofprincipal from a higher total return portfolio to augmentlower levels of actual income return, rather than (2)constructing a lower total income return portfolio thathas higher levels of actual income return. This policy hasbeen followed by a number of leading universityendowments, many of whom have developed guidelinesto keep any spending of income plus small amounts ofprincipal well below their portfolios’ annual total return.
It is worth noting several caveats concerning historicaland projected return data. Historical single-point assetclass and security returns covering several years or moreare in fact averages of varying — sometimes, widelyvarying — results experienced in the years comprisingthe period cited.
Similarly, future returns do not possess the degree ofcertainty or accuracy implied by a single-pointprojection. A more telling rate of return descriptionshould incorporate a range of plus or minus returns, andtheir associated probability, around the single-point
-
8
Asset Allocation Principles: Meanings, Questions, and Decisions (cont.) David M. Darst
projection. A similar set of product usage warningsapplies to asset class correlation statistics. Correlationsmeasure the tendency of the returns from a given assetclass or investment to move in the same direction asanother asset class or investment, but not the magnitudeof such movement. Covariance and tracking error dataare needed to specify the magnitude of an investment’smovement relative to another.1
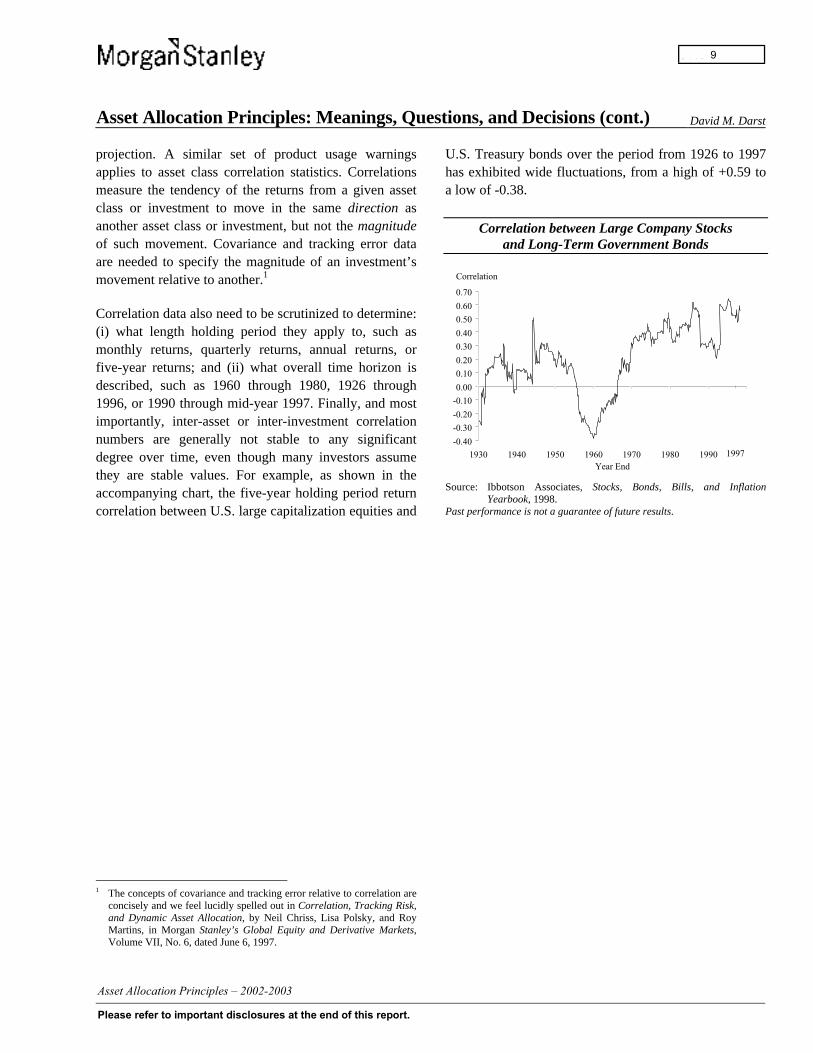
Correlation data also need to be scrutinized to determine:(i) what length holding period they apply to, such asmonthly returns, quarterly returns, annual returns, orfive-year returns; and (ii) what overall time horizon isdescribed, such as 1960 through 1980, 1926 through1996, or 1990 through mid-year 1997. Finally, and mostimportantly, inter-asset or inter-investment correlationnumbers are generally not stable to any significantdegree over time, even though many investors assumethey are stable values. For example, as shown in theaccompanying chart, the five-year holding period returncorrelation between U.S. large capitalization equities and
1 The concepts of covariance and tracking error relative to correlation are
concisely and we feel lucidly spelled out in Correlation, Tracking Risk,and Dynamic Asset Allocation, by Neil Chriss, Lisa Polsky, and RoyMartins, in Morgan Stanley’s Global Equity and Derivative Markets,Volume VII, No. 6, dated June 6, 1997.
U.S. Treasury bonds over the period from 1926 to 1997has exhibited wide fluctuations, from a high of +0.59 toa low of -0.38.
Correlation between Large Company Stocksand Long-Term Government Bonds
-0.40
-0.30
-0.20
-0.10
0.00
0.10
0.20
0.30
0.40
0.50
0.60
0.70
1930 1940 1950 1960 1970 1980 1990Year End
Correlation
1997
Source: Ibbotson Associates, Stocks, Bonds, Bills, and InflationYearbook, 1998.
Past performance is not a guarantee of future results.
-
9
Asset Allocation Principles: High Net Worth Investor Behavior David M. Darst
Asset allocation principles explore what it is about thenature, behavior, hopes, and fears of High Net Worth(HNW) investors that equips them well and/or poorly forthe crucial and challenging task of asset allocation.
Much has been made of the competitive disadvantage ofHNW investors in a global financial marketplacedominated by institutions. In the asset allocation process,it is commonly believed that institutional investors willoutperform HNW individuals due to institutions’superior access to investment research, corporatemanagements, trading media, quantitative tools, and, notleast, each other.
At the same time, High Net Worth private investorsappear to have several factors working in their favor.First, many HNW individuals are deeply grounded inknowledge of the business world — they know cycles ofcrops, of energy costs, of final-product prices; theyexperience companies as groups of people rather thanabstractions, as employees, suppliers, and customers; andthey possess an innate sense of corporate welfare andvalues, as a result of having to meet a payroll, expandmarket share, and maintain the viability of their ownenterprise.
Second, HNW investors are generally not answerable toartificial quarterly or annual demarcations of time, nor tothe dictates of committee-based thinking. If the privateinvestor so desires, he or she can withdraw from an assetclass altogether, or alternatively, ride through thevicissitudes of markets and leave valuable core long-term holdings undisturbed.
Third, individual investors are eminently capable —although not all HNW investors display these traits in theinvestment realm — of distance, objectivity, perspective,perception, independence, and clear thinking. Perhapsbecause it is their own funds that are at stake, HNWinvestors tend to experience the pain of losses moredeeply than they experience the pleasure of gains. Forsome, this can clarify; for others, this can cloud reason.
Fourth, HNW investors have essentially equal accesswith institutions to the great financial leveler: soundjudgment. In the asset allocation and investmentselection process, the characteristic that is most in shortsupply is not intelligence, data, or technology resources,it is judgment. Because individual investors andprofessional money managers may be gifted with, or
bereft of, good judgment, it is critical for the HNWinvestor to assess candidly whether or not he or she hasgood judgment; if not, an individual should not rest untila person possessed of good judgment can be found toprovide asset allocation advice.
A powerful testament to the force, effect, and success ofprivate individual investment was demonstrated in theworld of art on November 10, 1997, when the collectionof Victor and Sally Ganz was auctioned at Christie’s for$206.5 million. This total established the record for asingle-owner sale of art, surpassing the 1989 sale bySotheby’s of impressionist and modern paintingsbelonging to John Dorrance, Jr., for $123.4 million.
The Ganz couple’s holdings generated extraordinarilyhigh returns that are rare and difficult to achieve in anyasset class, but in the process, they left a legacy ofvaluable lessons for any serious investor. They (i) hadpassion and commitment to collecting art; (ii)concentrated and focused their efforts in a definedsphere; (iii) came to know their field of endeavor in greatdepth; (iv) bought with care, reflection, and analysis; and(v) exercised patience, letting time and longevity workfor them. Mr. Ganz’s first acquisition, Picasso’s Dream,was purchased in 1941 for $7,000 and sold at auction for$48.4 million. Over its 56-year holding period, thispainting generated a compound annual return of 17.1%before commissions and expenses,l an astoundingly highgrowth rate over such a long time frame. Anotherpainting by Picasso, Woman Seated in an Armchair(Eva), was bought in 1967 for $200,000 and auctioned30 years later for $24.7 million, producing an equallyuncommon and lofty compound annual return of 17.4%before commissions and expenses.1
In their asset allocation activity, HNW investors exhibitcertain behavior, often unwittingly, that can influence therealization of their investment goals. Since many of thesetraits derive from deep-seated human impulses, what isimportant in controlling and/or altering them is first and
1 After deduction of the auction house’s commission, which is 15% of the
first $50,000 and 10% of the remainder, the compound annual growthrate for Dream was 16.9%, and for Eva was 17.0%, before any annualexpenses for insurance and other carrying costs, which were notdisclosed.
-
10
Asset Allocation Principles: High Net Worth Investor Behavior (cont.) David M. Darst
foremost, the recognition of their potential existence. Anumber of these characteristics, some of which arecontradictory yet still encountered in the same investor,are set forth in the points below:
• Underestimate time horizons. Many privateinvestors specify a three- or five-year investmenttime horizon and invest with a short-termorientation, when in fact the investment time frameis 15 to 20 years or more.
• Attach too much significance to short-termresults. One key goal of asset allocation is todampen volatility and reduce risk through asset classdiversification. The benefits of such a program,which are usually purchased at the cost of loweroverall returns than the best-performing assetclasses, should be assessed over a sufficiently longperiod of time.
• Overemphasize volatility risk vs. purchasingpower risk. Particularly when the investor’s horizonextends to ten years or more, the erosion ofpurchasing power due to inflation can be significantin asset classes that maintain their nominal value.HNW investors need to address the risks of inflationvs. deflation and factor these considerations intotheir asset allocation strategy.
• Adopt a loss-averse mentality rather than a risk-averse mentality. Due to an antipathy toward losingmoney, many private investors will accept a“smooth” return of 10% (with low or no losses) overa series of market cycles, rather than a “bumpy”return of 15% (with occasional periods of testing,sometimes severe, in down years). After 15 years,
• the latter portfolio would be worth approximatelytwice the value of the former portfolio, but manyinvestors are not willing to stomach the volatility.
• Overestimate the ability to tolerate risk and/orilliquidity. In glaring contradiction to their loss-averse nature, a number of HNW investorscommonly forecast their loss-withstanding thresholdat a much higher level than the profound level ofdistress they feel when such losses — realized orunrealized — are actually experienced.
• Think in nominal terms rather than real terms.Assuming no change in interest rates and a 3%inflation rate, a private investor who placed $1million in tax-exempt bonds, and spent the interestincome each year, would have only $633,251 in realpurchasing power at the end of 15 years, eventhough the $1 million value remained whole innominal terms.
• Allow income needs to tilt the portfolio towarddividend/interest yield rather than total return.Wealth creation is a product of the compounding ofcapital over an appropriate time span; HNWinvestors with high current income needs shouldlook at the total return from an asset allocation mix,not merely the current yield level.
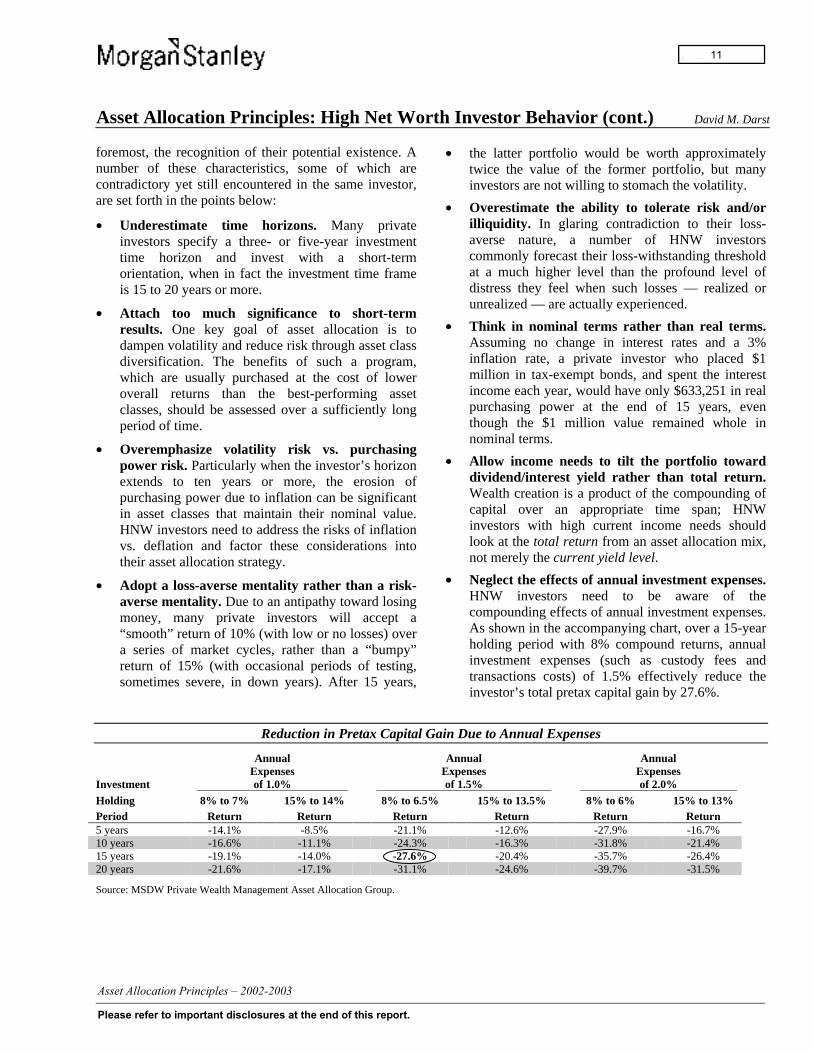
• Neglect the effects of annual investment expenses.HNW investors need to be aware of thecompounding effects of annual investment expenses.As shown in the accompanying chart, over a 15-yearholding period with 8% compound returns, annualinvestment expenses (such as custody fees andtransactions costs) of 1.5% effectively reduce theinvestor’s total pretax capital gain by 27.6%.
Reduction in Pretax Capital Gain Due to Annual Expenses
Investment
AnnualExpensesof 1.0%
AnnualExpensesof 1.5%
AnnualExpensesof 2.0%
Holding 8% to 7% 15% to 14% 8% to 6.5% 15% to 13.5% 8% to 6% 15% to 13%Period Return Return Return Return Return Return5 years -14.1% -8.5% -21.1% -12.6% -27.9% -16.7%10 years -16.6% -11.1% -24.3% -16.3% -31.8% -21.4%15 years -19.1% -14.0% -27.6% -20.4% -35.7% -26.4%20 years -21.6% -17.1% -31.1% -24.6% -39.7% -31.5%
Source: MSDW Private Wealth Management Asset Allocation Group.
-
11
Asset Allocation Principles: High Net Worth Investor Behavior (cont.) David M. Darst
• Desire insurance protection without facing thepremium costs of such protection. Privateinvestors need to recognize, and be willing to pay for(in the form of dampened overall return on theupside and the downside), asset classes which areincluded in a strategic asset allocation framework fordefensive, hedging, or insurance purposes.
• Project the most recent asset class returns andmeasure against the best-performingbenchmarks. Particularly after a series of successful(or unsuccessful) years of investment returns,individuals tend to expect such performance tocontinue indefinitely. At the same time, HNWinvestors want returns that match or exceed the top-performing indices or asset classes. In part, thesedesires, and the relative outperformance of the S&P500 index vs. a substantial majority of mutual fundsduring many years of the early- and mid-1990s, havefueled the dramatic expansion of assets in stock andbond index funds, from $2.1 billion in 1987 to$140.6 billion at the end of the third quarter in 1997.
• Experience wide swings in sentiment, confidence,and patience. Throughout recorded history, this ishuman nature. Over time, successful asset allocationcomes from the ability to distinguish cyclical andsecular movements, and act accordingly.
• Ignore asset allocation trade-offs. HNW privateinvestors should recognize the virtual impossibilityof finding an asset class that simultaneously meetsall the desired criteria: deep liquidity; stable,guaranteed principal values; high current yields; andcapital growth that consistently and substantiallyoutperforms inflation, taxes, and the popular indices.
Taking into account the special strengths of HNWinvestors, as well as their behavioral tendenciesenumerated above, it is possible to draw someconclusions about the requisite skills for successful assetallocation over time.
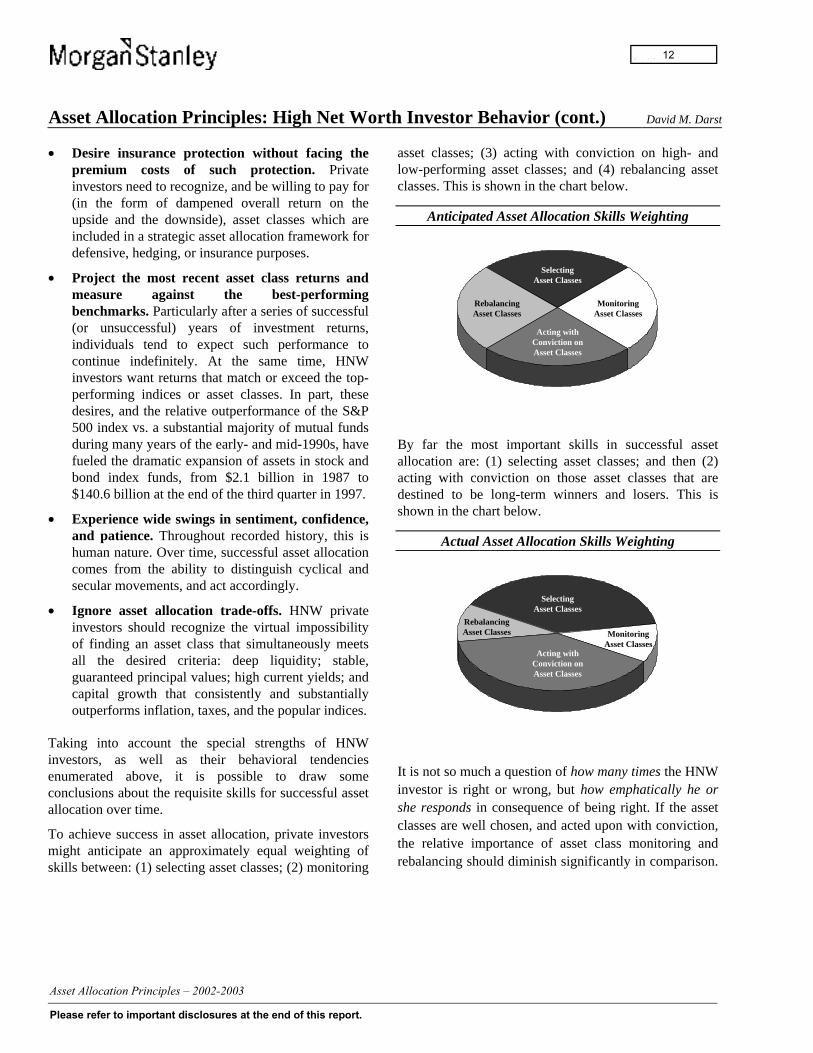
To achieve success in asset allocation, private investorsmight anticipate an approximately equal weighting ofskills between: (1) selecting asset classes; (2) monitoring
asset classes; (3) acting with conviction on high- andlow-performing asset classes; and (4) rebalancing assetclasses. This is shown in the chart below.
Anticipated Asset Allocation Skills Weighting
MonitoringAsset Classes
RebalancingAsset Classes
SelectingAsset Classes
Acting withConviction onAsset Classes
By far the most important skills in successful assetallocation are: (1) selecting asset classes; and then (2)acting with conviction on those asset classes that aredestined to be long-term winners and losers. This isshown in the chart below.
Actual Asset Allocation Skills Weighting
MonitoringAsset Classes
RebalancingAsset Classes
SelectingAsset Classes
Acting withConviction onAsset Classes
It is not so much a question of how many times the HNWinvestor is right or wrong, but how emphatically he orshe responds in consequence of being right. If the assetclasses are well chosen, and acted upon with conviction,the relative importance of asset class monitoring andrebalancing should diminish significantly in comparison.
-
12

Asset Allocation Principles: Interest and Dividend Reinvestment David M. Darst
One of the most important, yet least appreciated, aspectsof investing in specific asset classes is the concept ofinterest and dividend reinvestment. For compounding towork its highly beneficial effects on portfolio valuesover time, attention must be paid to the necessity, theconsequences, and the challenges of investing couponpayments or dividends at sufficiently high rates of return.Spending such income flows, using them to pay taxes, orreinvesting them at low returns can significantly reducethe Realized Compound Yield and thus the total long-term asset value of a portfolio.
For High Net Worth investors, the reinvestment ofcoupon and dividend payments, in as tax-advantaged amanner as possible, is of vital importance in actuallyachieving the long-term quoted returns from debt orequity securities. This is particularly true, the longer theinvestment holding period and the higher the expectedcompound rates of return.
Coupon Reinvestment in Fixed Income Securities
The proportion of a fixed income security’s return that isrepresented by the reinvestment of interest couponsincreases: (i) the higher the coupon; (ii) the higher theinitial yield to maturity; and (iii) the longer the maturityof the instrument. For sufficiently high-coupon, longmaturity bonds, purchased at sufficiently high initialyields to maturity, the assumed reinvestment of interestcoupons, assumed to be at that same, high initial yield tomaturity, can account for a dramatically large share ofthe total funds received from an investment.
The Importance of Interest on Interest10% Annual Coupon Bond, 30-Year Maturity, 10% Yield to Maturity
5 Years 10 Years 20 Years 30 Years
$2,000
$6,000
10,000
14,000
18,000
$3,000 = 30 coupons x $100/coupon
$1,000 = Principal Repayment
30-year total = $17,449.40
Total FundsReceived
$13,444.40 = Reinvestment of Interest Coupons
Maturity
Source: MSDW Private Wealth Management Asset Allocation Group.
For example, as shown in the accompanying chart, for a$1,000 par value, 30-year, 10% annual coupon bond,purchased at a 10% yield to maturity, the total fundsreceived over the life of the bond amount to $17,449.40.Of this total, $1,000, or 5.7%, represents the repaymentof principal; $3,000, or 17.2%, represents 30 years’payment of $100 annual coupons; and $13,449.40, orfully 77.1%, represents the aggregate total generated bythe reinvestment of each $100 annual1 coupon at aninterest rate of exactly 10%.
Source of Funds Amount Percent of TotalPrincipal $1,000.00 5.7%Coupons $3,000.00 17.2%Coupon Reinvestment $13,449.40 77.1%Total $17,449.40 100.0%
As a percent of the total funds received from a 10%annual coupon bond purchased at a beginning yield levelof 10%, the importance of coupon reinvestment, alsoknown as interest on interest, ranges from 77.1% on a30-year bond, to 55.4% on a 20-year bond, to 22.8% on a10-year bond, to 6.9% on a 5-year bond. This is shownin the table below:
Annual Coupon Bonds Purchased at 10%and 5% Yields to Maturity
$1,000 Par Value Bonds
Percentage of Total Funds Received
Coupon
InitialYield to
MaturityYears toMaturity
Repaymentof
PrincipalInterestCoupons
Reinvestmentof InterestCoupons
TotalFunds
Received
10% 10% 5 62.1% 31.0% 6.9% $1,610.5110% 10% 10 38.6% 38.6% 22.8% 2,593.7410% 10% 20 14.9% 29.7% 55.4% 6,727.5010% 10% 30 5.7% 17.2% 77.1% 17,449.40
5% 5% 5 78.3% 19.6% 2.1% $1,276.285% 5% 10 61.4% 30.7% 7.9% 1,628.895% 5% 20 37.7% 37.7% 24.6% 2,653.305% 5% 30 23.1% 34.7% 42.2% 4,321.94
Source: MSDW Private Wealth Management Asset Allocation Group.
The table also demonstrates the diminished importanceof coupon reinvestment at lower coupon rates and initialyield levels. For instance, for a 30-year, 5% annualcoupon bond, purchased at a 5% initial yield to maturity,the reinvestment of interest coupons represents 42.2%, or$1,821.94, of the $4,321.94 in total funds received by theinvestor.
1 For the sake of simplicity, annual, rather than semiannual, coupons are
used in this analysis. For a $1,000 par value, 10% bond, with 60semiannual coupons of 5%, the total funds received amount to$18,679.19, of which $14,679.19, or 78.6%, represents the reinvestmentof interest coupons at an assumed rate of 10%.
-
13
Asset Allocation Principles: Interest and Dividend Reinvestment (cont.) David M. Darst
For short-maturity bonds, the importance of couponreinvestment is modest, regardless of coupon andbeginning yield level. For 5-year, 10% coupon bonds,purchased at a 10% yield to maturity, the reinvestment ofinterest coupons represents 6.9% of total funds received,and for 5-year, 5% coupon bonds, purchased at a 5%yield to maturity, the reinvestment of interest couponsrepresents only 2.1% of total funds received.
In practice, interest rates do not remain stable for theentire life of a 30-year bond, much less a bond of 20, 10,or even 5 years’ maturity. Investors are thus subject toone key form of reinvestment risk, or the chance thatcoupons (or principal) will not be able to be invested at arate equal to the bond’s original yield to maturity. Afurther complication for High Net Worth Investors stemsfrom the annual taxability of interest and dividendincome.
In response to these tax considerations, High Net Worthinvestors have sought, whenever possible, to own anysecurities that have a meaningful degree of reinvestmentrisk in tax-advantaged structures, such as a Foundationor a 401(k) plan. A tax-advantaged structure is especiallyimportant in the case of zero coupon bonds, whichotherwise incur taxes on the phantom interest incomethat is not paid in cash but which is considered by the taxauthorities to accrete each year.
Zero Coupon Bonds
Zero coupon bonds eliminate coupon reinvestment riskby means of the annual internal compounding of capitalvalues, to a final value for the bond (usually its $1,000par value). Zeros have been popular with low-tax or tax-advantaged investors seeking to lock in a specificcompounding rate of interest at the time of the bond’spurchase. In addition, some investors seek out zerocoupon bonds due to their high degree of capital valueresponsiveness in reaction to interest rate changes.
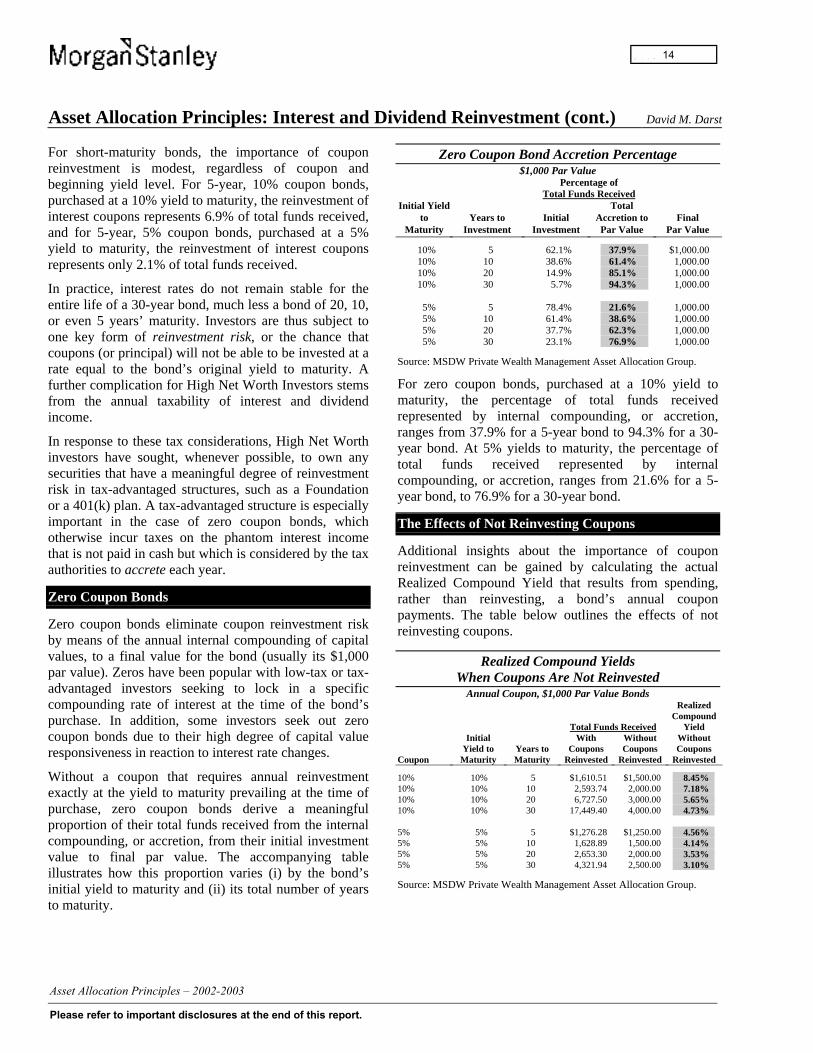
Without a coupon that requires annual reinvestmentexactly at the yield to maturity prevailing at the time ofpurchase, zero coupon bonds derive a meaningfulproportion of their total funds received from the internalcompounding, or accretion, from their initial investmentvalue to final par value. The accompanying tableillustrates how this proportion varies (i) by the bond’sinitial yield to maturity and (ii) its total number of yearsto maturity.
Zero Coupon Bond Accretion Percentage$1,000 Par Value
Percentage ofTotal Funds Received
Initial Yieldto
MaturityYears to
InvestmentInitial
Investment
TotalAccretion toPar Value
FinalPar Value
10% 5 62.1% 37.9% $1,000.0010% 10 38.6% 61.4% 1,000.0010% 20 14.9% 85.1% 1,000.0010% 30 5.7% 94.3% 1,000.00
5% 5 78.4% 21.6% 1,000.005% 10 61.4% 38.6% 1,000.005% 20 37.7% 62.3% 1,000.005% 30 23.1% 76.9% 1,000.00
Source: MSDW Private Wealth Management Asset Allocation Group.
For zero coupon bonds, purchased at a 10% yield tomaturity, the percentage of total funds receivedrepresented by internal compounding, or accretion,ranges from 37.9% for a 5-year bond to 94.3% for a 30-year bond. At 5% yields to maturity, the percentage oftotal funds received represented by internalcompounding, or accretion, ranges from 21.6% for a 5-year bond, to 76.9% for a 30-year bond.
The Effects of Not Reinvesting Coupons
Additional insights about the importance of couponreinvestment can be gained by calculating the actualRealized Compound Yield that results from spending,rather than reinvesting, a bond’s annual couponpayments. The table below outlines the effects of notreinvesting coupons.
Realized Compound YieldsWhen Coupons Are Not Reinvested
Annual Coupon, $1,000 Par Value Bonds
Total Funds Received
RealizedCompound
Yield
Coupon
InitialYield to
MaturityYears toMaturity
WithCoupons
Reinvested
WithoutCoupons
Reinvested
WithoutCoupons
Reinvested
10% 10% 5 $1,610.51 $1,500.00 8.45%10% 10% 10 2,593.74 2,000.00 7.18%10% 10% 20 6,727.50 3,000.00 5.65%10% 10% 30 17,449.40 4,000.00 4.73%
5% 5% 5 $1,276.28 $1,250.00 4.56%5% 5% 10 1,628.89 1,500.00 4.14%5% 5% 20 2,653.30 2,000.00 3.53%5% 5% 30 4,321.94 2,500.00 3.10%
Source: MSDW Private Wealth Management Asset Allocation Group.
-
14
Asset Allocation Principles: Interest and Dividend Reinvestment (cont.) David M. Darst
For 10% coupon bonds, purchased at a 10% yield tomaturity, not reinvesting the coupons lowers theeffective Realized Compound Yield from 10% to 8.45%for a 5-year bond, and from 10% to 4.73% for a 30-yearbond. For 5% coupon bonds purchased at a 5% yield tomaturity, not reinvesting the coupons lowers theeffective Realized Compound Yield from 5% to 4.56%for a 5-year bond, and from 5% to 3.10% for a 30-yearbond.
The proportion of Realized Compound Yield representedby the reinvestment of interest coupons increases withhigher coupon rates, higher yield levels, and longermaturities. A comparison of: (i) the proportion of totalfunds received represented by the reinvestment ofinterest coupons; to (ii) the proportion of total RealizedCompound Yield represented by the reinvestment ofinterest coupons is set forth below:1
Coupon Reinvestment As a Proportion o f TotalFunds Received and Realized Compound Yield
Annual Coupon, $1,000 Par Value BondsReinvestment of Interest Coupons
Coupon
InitialYield to
MaturityYears toMaturity
Proportionof Total
Funds Received
Proportion ofTotal Realized
Compound Yield
10% 10% 5 6.9% 15.5%10% 10% 10 22.8% 28.2%10% 10% 20 55.4% 43.5%10% 10% 30 77.1% 52.7%
5% 5% 5 2.1% 8.8%5% 5% 10 7.9% 17.2%5% 5% 20 24.6% 29.4%5% 5% 30 42.2% 38.0%
Source: MSDW Private Wealth Management Asset Allocation Group.
For 10% bonds, purchased at a 10% yield to maturity,the proportion of total Realized Compound Yieldaccounted for by the reinvestment of interest couponsranges from 15.5% for a 5-year bond, to 52.7% for a 30-year bond. For 5% bonds, purchased at a 5% yield tomaturity, the proportion of total Realized CompoundYield accounted for by the reinvestment of interestcoupons ranges from 8.8% for a 5-year bond, to 38.0%for a 30-year bond.
1 The Standard & Poor’s 500 Index was originally the Standard and
Poor’s 90 Index: it became the Standard & Poor’s 500 Index on March4, 1957.
Dividend Reinvestment in Equities
Dividend reinvestment plays the same equally crucialrole in the long-term results achieved from investment inequities that coupon reinvestment plays in fixed incomeinvesting. At the same time, investors, regulators, andcorporations often pay insufficient attention to thisimportant component of equity investing and assetallocation.
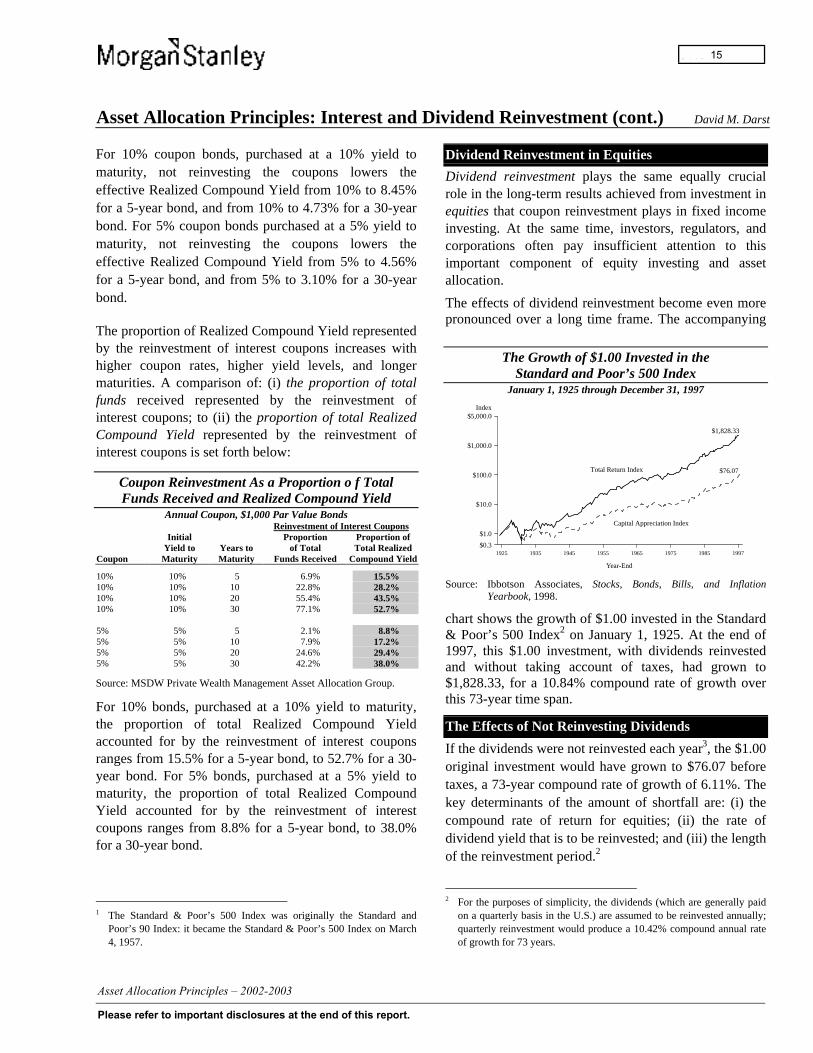
The effects of dividend reinvestment become even morepronounced over a long time frame. The accompanying
The Growth of $1.00 Invested in theStandard and Poor’s 500 Index
January 1, 1925 through December 31, 1997
1925 1935 1945 1955 1965 1975 1985 1997$0.3
$1.0
$10.0
$100.0
1000.0
5000.0Index
Year-End
$1,828.33
$76.07Total Return Index
Capital Appreciation Index
$5,000.0
$1,000.0
Source: Ibbotson Associates, Stocks, Bonds, Bills, and InflationYearbook, 1998.
chart shows the growth of $1.00 invested in the Standard& Poor’s 500 Index2 on January 1, 1925. At the end of1997, this $1.00 investment, with dividends reinvestedand without taking account of taxes, had grown to$1,828.33, for a 10.84% compound rate of growth overthis 73-year time span.
The Effects of Not Reinvesting Dividends
If the dividends were not reinvested each year3, the $1.00original investment would have grown to $76.07 beforetaxes, a 73-year compound rate of growth of 6.11%. Thekey determinants of the amount of shortfall are: (i) thecompound rate of return for equities; (ii) the rate ofdividend yield that is to be reinvested; and (iii) the lengthof the reinvestment period.2
2 For the purposes of simplicity, the dividends (which are generally paid
on a quarterly basis in the U.S.) are assumed to be reinvested annually;quarterly reinvestment would produce a 10.42% compound annual rateof growth for 73 years.
-
15
Asset Allocation Principles: Interest and Dividend Reinvestment (cont.) David M. Darst
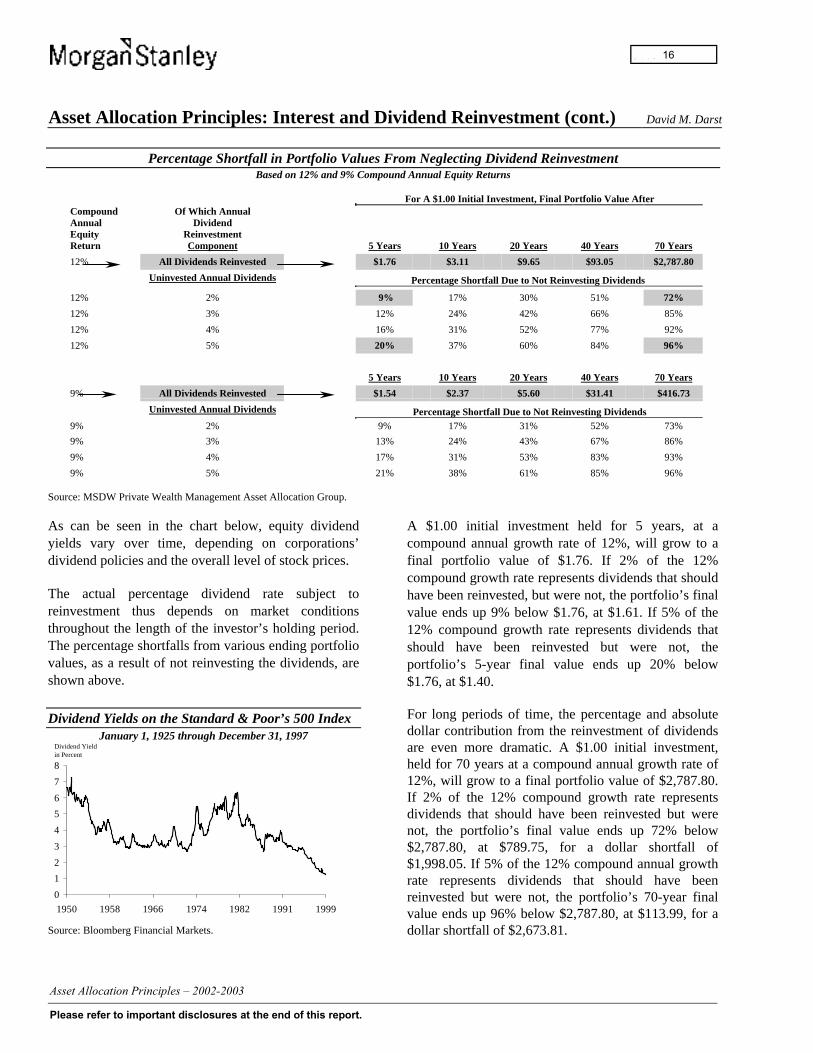
Percentage Shortfall in Portfolio Values From Neglecting Dividend ReinvestmentBased on 12% and 9% Compound Annual Equity Returns
For A $1.00 Initial Investment, Final Portfolio Value AfterCompoundAnnualEquityReturn
Of Which AnnualDividend
ReinvestmentComponent 5 Years 10 Years 20 Years 40 Years 70 Years
12% All Dividends Reinvested $1.76 $3.11 $9.65 $93.05 $2,787.80
Uninvested Annual Dividends Percentage Shortfall Due to Not Reinvesting Dividends
12% 2% 9% 17% 30% 51% 72%
12% 3% 12% 24% 42% 66% 85%
12% 4% 16% 31% 52% 77% 92%
12% 5% 20% 37% 60% 84% 96%
5 Years 10 Years 20 Years 40 Years 70 Years
9% All Dividends Reinvested $1.54 $2.37 $5.60 $31.41 $416.73
Uninvested Annual Dividends Percentage Shortfall Due to Not Reinvesting Dividends9% 2% 9% 17% 31% 52% 73%
9% 3% 13% 24% 43% 67% 86%
9% 4% 17% 31% 53% 83% 93%
9% 5% 21% 38% 61% 85% 96%
Source: MSDW Private Wealth Management Asset Allocation Group.
As can be seen in the chart below, equity dividendyields vary over time, depending on corporations’dividend policies and the overall level of stock prices.
The actual percentage dividend rate subject toreinvestment thus depends on market conditionsthroughout the length of the investor’s holding period.The percentage shortfalls from various ending portfoliovalues, as a result of not reinvesting the dividends, areshown above.
Dividend Yields on the Standard & Poor’s 500 IndexJanuary 1, 1925 through December 31, 1997
0
1
2
3
4
5
6
7
8
1950 1958 1966 1974 1982 1991 1999
Dividend Yieldin Percent
Source: Bloomberg Financial Markets.
A $1.00 initial investment held for 5 years, at acompound annual growth rate of 12%, will grow to afinal portfolio value of $1.76. If 2% of the 12%compound growth rate represents dividends that shouldhave been reinvested, but were not, the portfolio’s finalvalue ends up 9% below $1.76, at $1.61. If 5% of the12% compound growth rate represents dividends thatshould have been reinvested but were not, theportfolio’s 5-year final value ends up 20% below$1.76, at $1.40.
For long periods of time, the percentage and absolutedollar contribution from the reinvestment of dividendsare even more dramatic. A $1.00 initial investment,held for 70 years at a compound annual growth rate of12%, will grow to a final portfolio value of $2,787.80.If 2% of the 12% compound growth rate representsdividends that should have been reinvested but werenot, the portfolio’s final value ends up 72% below$2,787.80, at $789.75, for a dollar shortfall of$1,998.05. If 5% of the 12% compound annual growthrate represents dividends that should have beenreinvested but were not, the portfolio’s 70-year finalvalue ends up 96% below $2,787.80, at $113.99, for adollar shortfall of $2,673.81.
-
16
Asset Allocation Principles: Critical Determinants of Asset Allocation David M. Darst
Distilled to its purest form, asset allocation for High NetWorth investors is intended, among other objectives, tohelp answer four fundamental questions: (i) What is theproper mix between equities, fixed income securities,alternative investments, and cash equivalentinstruments? (ii) What is the proper mix betweendomestic and non-domestic securities? (iii) What is theproper reference currency, and the proper degree of non-reference currency exposure? and (iv) What is the properdivision of assets between publicly-traded and privateinvestments?
Critical Determinants of Asset Allocation
In developing an appropriate response to each of thesequestions, High Net Worth investors need to carefullyassess the critical determinants of asset allocation. Thesecritical determinants can be grouped under a few broadrubrics, analogous in some sense to the investor’s ownhighly individualized set of income statement factors,balance sheet factors, and off-balance sheet factors.
Each investor’s history, current situation, andexpectations for the future will shape the degree ofemphasis to be placed on these asset allocationdeterminants, as set forth below:
Income Statement Factors
• Tolerance for bearing risk or loss. An investor’sability to withstand losses in a given investmentposition or asset class is influenced by the severityof the loss in percentage and absolute terms, theduration of the loss, whether it is realized orunrealized, expected future price action, the pricebehavior of other investment instruments, generaleconomic conditions, and not least, the investor’sown emotional, financial, and psychological profile.
• Cyclical and secular market outlook. A highlyimportant influence on strategic and tactical assetallocation is the investor’s qualitatively- andquantitatively-driven sense of where markets aregoing, how long they will take to reach their pricetargets, and the pattern of price movements —stairstep, continuous, highly volatile, or an extendedwaiting period, followed by a sharp upward ordownward move.
• Confidence level in projections. One of the greatseparators of highly successful investors or asset
• allocators from less fortunate ones is the age-olddecision between conviction and flexibility.Investors who know they are right have the courageof their convictions; at the same time, investors whodiscover flaws in their own thinking must have theflexibility to face facts and reverse course ifnecessary.
• Investor’s and assets’ tax status. The High NetWorth investor's tax status — federal, state, local,and cross-border; income, capital gains, and estate;current and future — brings a crucial set of variablesto bear in structuring an optimal allocation of assets,as does the tax treatment of all the capital andincome flows from an investment.
Balance Sheet Factors
• Individual motivations and circumstances. It isworthwhile for the HNW investor to reflect on theultimate goals and objectives of the assets beingallocated — for whose benefit are the assets beinginvested? What do these assets mean in the contextof the beneficiaries’ other circumstances? In whatblocks of time does the investor reckon? Whatplanned commitments and unforeseen developmentsshould be allowed for?
• Influence of dominant investment positions. Assetallocation for High Net Worth investors should takeaccount of large existing or contractually-expectedinvestment positions, capital flows, options, andrestricted securities. At the same time, objectivityand rigorous analysis are required to weigh themerits and costs of retaining dominant investmentpositions vs. diversification of all or a portion ofthese positions into other asset classes.
• Financial requirements, liabilities, andcontingencies. Planned annual expenditure levels,margin debt, mortgages, and other liabilities affectthe asset allocation decision because the certainty ofsuch outlays often leads to the selection of assetclasses and investments having predictable paymentstreams to meet these obligations.
• Significant non-tracked assets. Many High NetWorth investors have a considerable portion of theiroverall wealth tied up in asset categories that are notincluded in conventional asset allocationframeworks. Such assets include: (i) royalty streamsfrom media-related, oil, gas, forestry, and mining
-
17
Asset Allocation Principles: Critical Determinants of Asset Allocation (cont.) David M. Darst
interests; (ii) art, collectibles, antiques, and jewelry;and (iii) ownership positions in family businesses,undeveloped land, and other real property.
Off-Balance Sheet Factors
• Ability to recognize and evaluate trade-offs. Webelieve the entire asset allocation process hinges onthe investor’s skill at recognizing and judging aseries of financial factors. How important is one setof factors compared with another set of factors? Forany given tradeoff, how much of the costs andbenefits of one variable has to be foregone in orderto obtain a more favorable cost-benefit profile inanother variable? Several of the most frequently-encountered asset allocation tradeoffs are listed inthe table below:
Asset Allocation Tradeoffs
Characteristic
Tending towardlower risk,
lower return vs.
Tending towardhigher risk,
higher return
Time Frame Short-term vs. Long-TermAsset Allocation Strategy Diversification vs. ConcentrationHarvesting/Consumption
of Returns Current vs. DeferredForm of Returns Income vs. Change in Capital ValuePattern of Returns Predictable vs. VariableAccess/Convertibility Liquid Investments vs. Illiquid Investments
• Goals and benchmarks for returns. We believeanother crucial determinant of a High Net Worthinvestor’s asset allocation is the universe of goalsthat his or her investment activity is intended toachieve, and the relative importance assigned toeach. These goals include safety of principal,protection of purchasing power, and specified levelsof annual pretax or after-tax returns. Prudence andrealism are essential in the selection of anappropriate absolute benchmark, or the constructionof a blended benchmark, against which theinvestor’s results are to be measured.
• Timing, nature, and size of portfolio outflows.When and in what form capital is to be returned tothe ultimate beneficiaries of the portfolio can causemeaningful shifts in asset allocation.
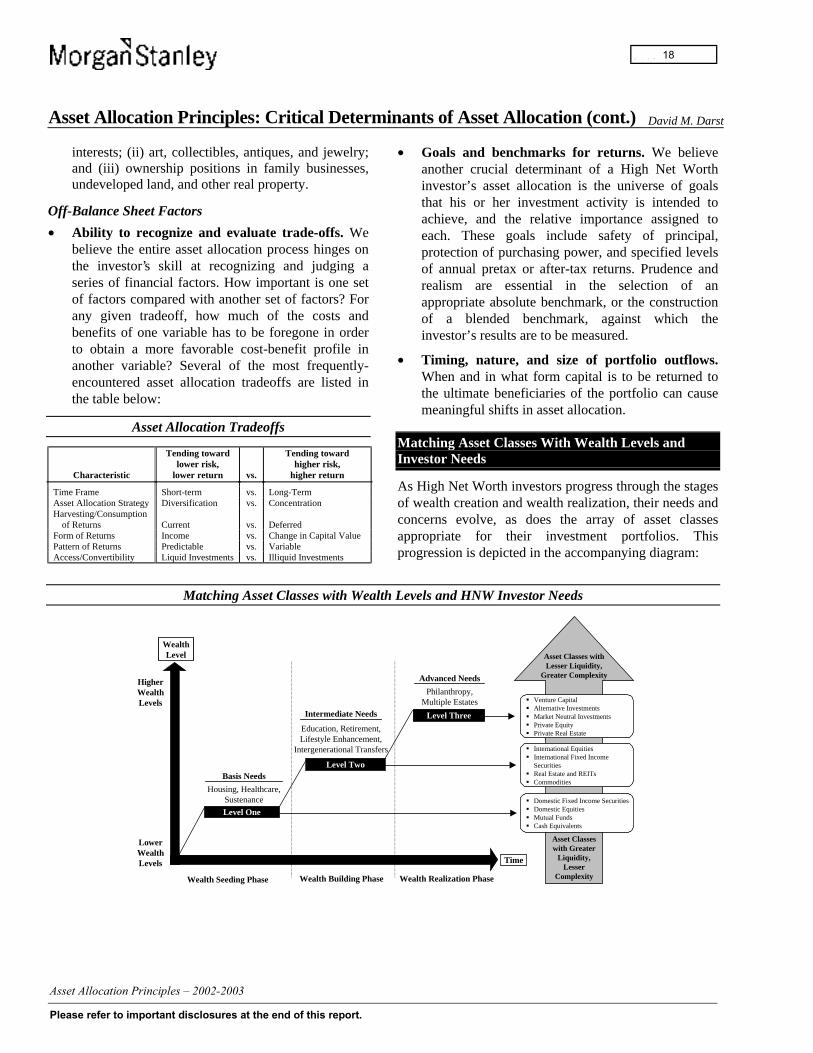
Matching Asset Classes With Wealth Levels andInvestor Needs
As High Net Worth investors progress through the stagesof wealth creation and wealth realization, their needs andconcerns evolve, as does the array of asset classesappropriate for their investment portfolios. Thisprogression is depicted in the accompanying diagram:
Matching Asset Classes with Wealth Levels and HNW Investor Needs
Wealth Seeding Phase Wealth Building Phase Wealth Realization Phase
LowerWealthLevels
HigherWealthLevels
Basis Needs
Intermediate Needs
Advanced Needs
Philanthropy,Multiple Estates
Education, Retirement,Lifestyle Enhancement,
Intergenerational Transfers
Housing, Healthcare,Sustenance
WealthLevel
Time
� Venture Capital� Alternative Investments� Market Neutral Investments� Private Equity� Private Real Estate
� International Equities� International Fixed Income
Securities� Real Estate and REITs� Commodities
� Domestic Fixed Income Securities� Domestic Equities� Mutual Funds� Cash Equivalents
Level One
Level Two
Level Three
Asset Classes withLesser Liquidity,
Greater Complexity
Asset Classeswith Greater
Liquidity,Lesser
Complexity
-
18
Asset Allocation Principles: Critical Determinants of Asset Allocation (cont.) David M. Darst
Wealth Seeding PhaseFor those individuals who are in the beginning — orwealth seeding — part of their wealth creation activity,basic needs are paramount and include: housing,healthcare, food, clothing, and insurance. If surpluscapital is available for investments, HNW investorsshould consider asset classes that are characterized by areasonable degree of liquidity and understandability.These asset classes generally include domestic equities,domestic fixed income securities, and cash equivalents,either directly or in mutual fund or partnership form.
Wealth Building PhaseAs individuals progress through the growth — or wealthbuilding — phase of their wealth creation activity, theirneeds expand, to include education, lifestyleenhancement, retirement, and intergenerational transfers.At the same time, although not in all cases, their range ofinvestible asset classes expands to include not only theabovementioned asset classes, but also internationalequities, international fixed income securities, real estateand REITs, and commodities.
Wealth Realization PhaseWhen individuals acquire significant wealth — in thewealth realization phase — through a liquidity eventsuch as a merger or acquisition, a securities offering, orinheritance, the circle of their needs may expand yetagain, to include philanthropy and the maintenance ofmultiple estates. In this phase, High Net Worth investorscan and should encompass an even broader range ofasset classes in addition to those considered byindividuals in the wealth seeding and wealth buildingphases. These more advanced asset classes may also becharacterized by a lower level of liquidity and asomewhat greater degree of complexity, and includeventure capital, alternative investments, market neutralinvestments, private equity, and private real estate.
Effects of Financial Market Environments on AssetAllocation and Investor Behavior
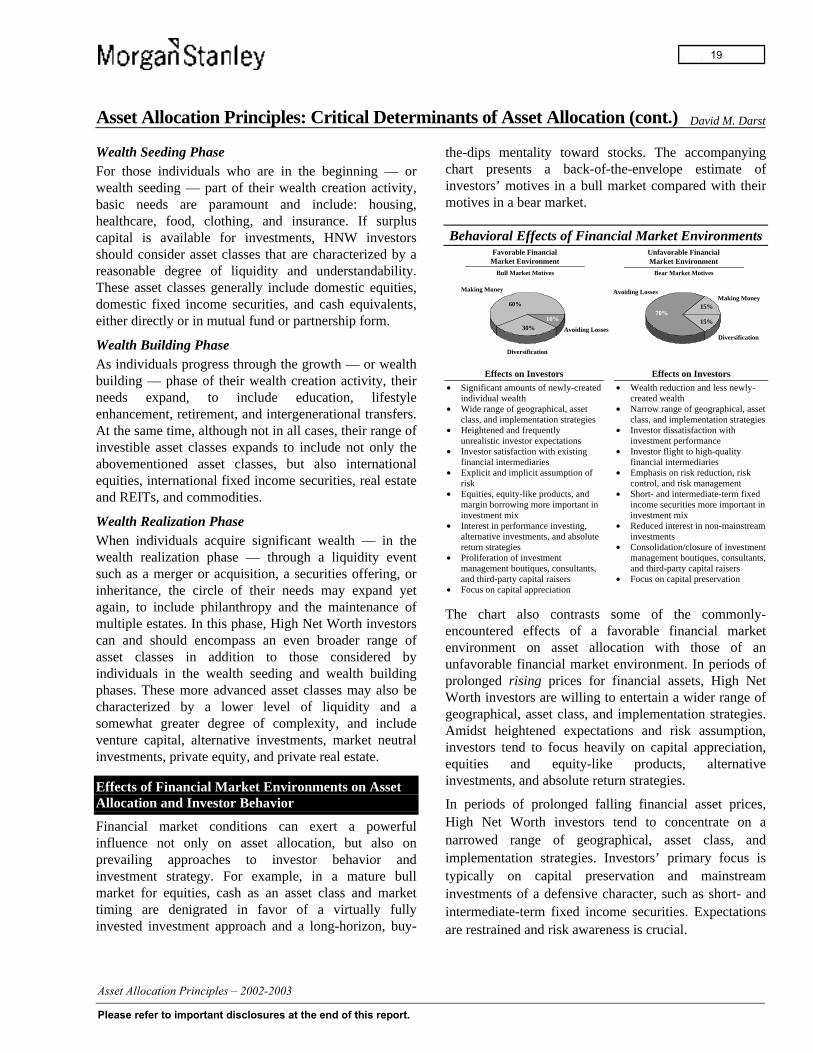
Financial market conditions can exert a powerfulinfluence not only on asset allocation, but also onprevailing approaches to investor behavior andinvestment strategy. For example, in a mature bullmarket for equities, cash as an asset class and markettiming are denigrated in favor of a virtually fullyinvested investment approach and a long-horizon, buy-
the-dips mentality toward stocks. The accompanyingchart presents a back-of-the-envelope estimate ofinvestors’ motives in a bull market compared with theirmotives in a bear market.
Behavioral Effects of Financial Market Environments
70%15%
15%
10%
60%
30%
Favorable FinancialMarket Environment
Unfavorable FinancialMarket Environment
Making Money
Diversification
Avoiding Losses
Avoiding Losses
Diversification
Making Money
Bull Market Motives Bear Market Motives
Effects on Investors
• Significant amounts of newly-createdindividual wealth
• Wide range of geographical, assetclass, and implementation strategies
• Heightened and frequentlyunrealistic investor expectations
• Investor satisfaction with existingfinancial intermediaries
• Explicit and implicit assumption ofrisk
• Equities, equity-like products, andmargin borrowing more important ininvestment mix
• Interest in performance investing,alternative investments, and absolutereturn strategies
• Proliferation of investmentmanagement boutiques, consultants,and third-party capital raisers
• Focus on capital appreciation
Effects on Investors
• Wealth reduction and less newly-created wealth
• Narrow range of geographical, assetclass, and implementation strategies
• Investor dissatisfaction withinvestment performance
• Investor flight to high-qualityfinancial intermediaries
• Emphasis on risk reduction, riskcontrol, and risk management
• Short- and intermediate-term fixedincome securities more important ininvestment mix
• Reduced interest in non-mainstreaminvestments
• Consolidation/closure of investmentmanagement boutiques, consultants,and third-party capital raisers
• Focus on capital preservation
The chart also contrasts some of the commonly-encountered effects of a favorable financial marketenvironment on asset allocation with those of anunfavorable financial market environment. In periods ofprolonged rising prices for financial assets, High NetWorth investors are willing to entertain a wider range ofgeographical, asset class, and implementation strategies.Amidst heightened expectations and risk assumption,investors tend to focus heavily on capital appreciation,equities and equity-like products, alternativeinvestments, and absolute return strategies.
In periods of prolonged falling financial asset prices,High Net Worth investors tend to concentrate on anarrowed range of geographical, asset class, andimplementation strategies. Investors’ primary focus istypically on capital preservation and mainstreaminvestments of a defensive character, such as short- andintermediate-term fixed income securities. Expectationsare restrained and risk awareness is crucial.
-
19
Asset Allocation Principles: Spending Versus Reinvesting Income Flows David M. Darst
A frequently encountered and highly important issue inthe asset allocation process revolves around theinvestor’s decision to spend, or alternatively to reinvest,some portion or all of the annual returns from aninvestment. The answer to this question is shaped in partby the investor’s own preferences and the timing of hisor her required capital flows, and in part by the level,pattern, and longevity of returns from a given asset class.
Consciously or unconsciously, investors often evaluatespending now versus in the future, not only in financiallyquantifiable terms, but also according to hard-to-definemeasures such as utility or enjoyment. In doing so,investors need to take account of the effects ofcompounding, inflation and deflation in the general pricelevel, and not least, psychological and highlyindividualized attitudes toward current and postponedgratification.
It is worthwhile to analyze the overall effect onintermediate cash flows — including those funds whichare spent, and the terminal value of a portfolio — of: (i)spending annual investment returns immediately afterthey have been earned; or (ii) reinvesting these returns atthe overall rate of return of the portfolio. The annualinvestment returns can be in the form of dividend orinterest income accrued or received, realized orunrealized capital gains, or some combination thereof.
The Effects of Spending vs. Reinvestment as aFunction of the Rate of Return
20-Year Investment Horizon, 20% Annual Returns
The first accompanying table shows the effects ofspending vs. reinvestment, of varying proportions ofannual returns for a $1,000 initial investment held for aperiod of 20 years with annual returns of 20%. It shouldbe pointed out that generating 20% returns for 20 years,while it has been achieved by some investors in certainasset categories, is an extraordinary accomplishment.Such rates of return, for so long, are relatively rare, evenfor performance-oriented investors in equities or fixed-income securities, much less for asset managers in lessefficient markets such as private equity or venturecapital. In the two immediately following sections, asimilar analysis has been carried out for 20-yearinvestment horizons using annual returns of 10% and5%, respectively.
Several simplifying assumptions have been made inorder to highlight some of the important principles whichderive from this analysis. For example, it is assumed, buthighly unlikely, that the investor can reinvest the annualreturns from his or her investments at exactly the samerate as the investment’s original rate of return — 20% inthe first table displayed here, 10% in the second table,and 5% in the third table. In addition, income taxes,capital gains taxes, inflation and deflation, andtransaction costs are not considered here. Any one ofthese factors can introduce meaningful subtleties into theconclusions.
-
20
Asset Allocation Principles: Spending Versus Reinvesting Income Flows (cont.) David M. Darst
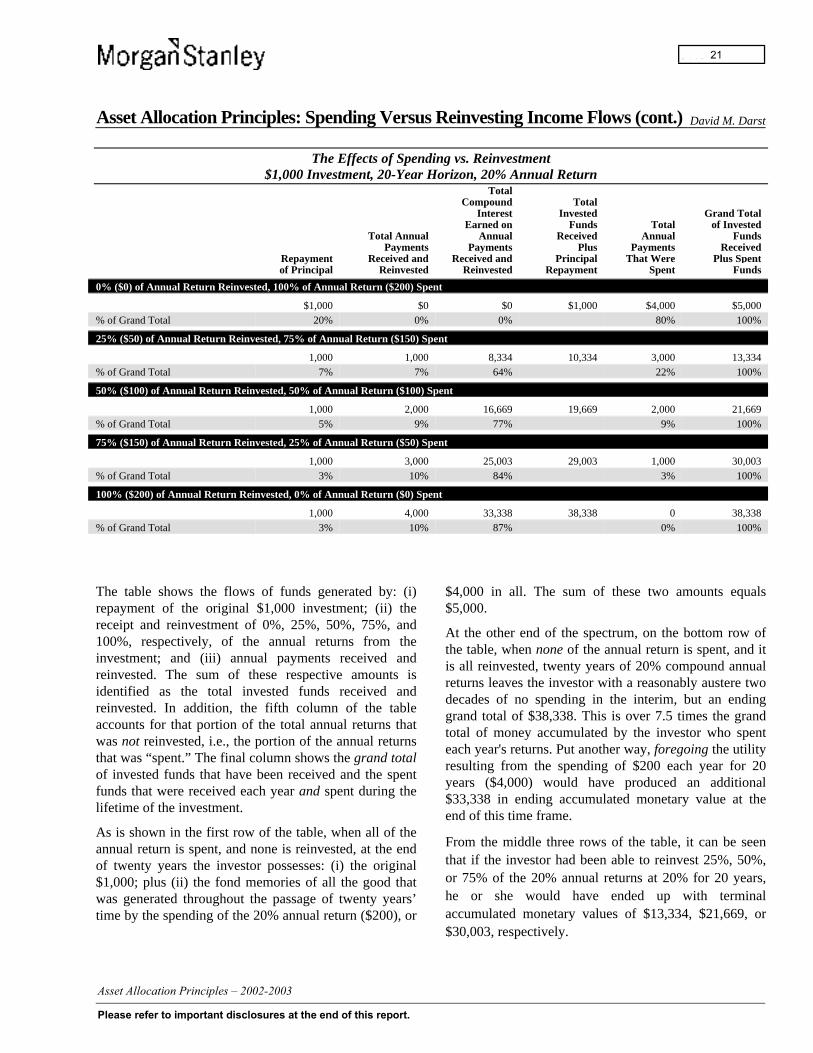
The Effects of Spending vs. Reinvestment$1,000 Investment, 20-Year Horizon, 20% Annual Return
TotalCompound Total
Interest Invested Grand TotalEarned on Funds Total of Invested
Total Annual Annual Received Annual FundsPayments Payments Plus Payments Received
Repayment Received and Received and Principal That Were Plus Spentof Principal Reinvested Reinvested Repayment Spent Funds
0% ($0) of Annual Return Reinvested, 100% of Annual Return ($200) Spent
$1,000 $0 $0 $1,000 $4,000 $5,000% of Grand Total 20% 0% 0% 80% 100%
25% ($50) of Annual Return Reinvested, 75% of Annual Return ($150) Spent
1,000 1,000 8,334 10,334 3,000 13,334% of Grand Total 7% 7% 64% 22% 100%
50% ($100) of Annual Return Reinvested, 50% of Annual Return ($100) Spent
1,000 2,000 16,669 19,669 2,000 21,669% of Grand Total 5% 9% 77% 9% 100%
75% ($150) of Annual Return Reinvested, 25% of Annual Return ($50) Spent
1,000 3,000 25,003 29,003 1,000 30,003% of Grand Total 3% 10% 84% 3% 100%
100% ($200) of Annual Return Reinvested, 0% of Annual Return ($0) Spent
1,000 4,000 33,338 38,338 0 38,338% of Grand Total 3% 10% 87% 0% 100%
The table shows the flows of funds generated by: (i)repayment of the original $1,000 investment; (ii) thereceipt and reinvestment of 0%, 25%, 50%, 75%, and100%, respectively, of the annual returns from theinvestment; and (iii) annual payments received andreinvested. The sum of these respective amounts isidentified as the total invested funds received andreinvested. In addition, the fifth column of the tableaccounts for that portion of the total annual returns thatwas not reinvested, i.e., the portion of the annual returnsthat was “spent.” The final column shows the grand totalof invested funds that have been received and the spentfunds that were received each year and spent during thelifetime of the investment.
As is shown in the first row of the table, when all of theannual return is spent, and none is reinvested, at the endof twenty years the investor possesses: (i) the original$1,000; plus (ii) the fond memories of all the good thatwas generated throughout the passage of twenty years’time by the spending of the 20% annual return ($200), or
$4,000 in all. The sum of these two amounts equals$5,000.
At the other end of the spectrum, on the bottom row ofthe table, when none of the annual return is spent, and itis all reinvested, twenty years of 20% compound annualreturns leaves the investor with a reasonably austere twodecades of no spending in the interim, but an endinggrand total of $38,338. This is over 7.5 times the grandtotal of money accumulated by the investor who spenteach year's returns. Put another way, foregoing the utilityresulting from the spending of $200 each year for 20years ($4,000) would have produced an additional$33,338 in ending accumulated monetary value at theend of this time frame.
From the middle three rows of the table, it can be seenthat if the investor had been able to reinvest 25%, 50%,or 75% of the 20% annual returns at 20% for 20 years,he or she would have ended up with terminalaccumulated monetary values of $13,334, $21,669, or$30,003, respectively.
-
21
Asset Allocation Principles: Spending Versus Reinvesting Income Flows (cont.) David M. Darst
The Effects of Spending vs. Reinvestment$1,000 Investment, 20-Year Horizon, 10% Annual Return
TotalCompound Total
Interest Invested Grand TotalEarned on Funds Total of Invested
Total Annual Annual Received Annual FundsPayments Payments Plus Payments Received
Repayment Received and Received and Principal That Were Plus Spentof Principal Reinvested Reinvested Repayment Spent Funds
0% ($0) of Annual Return Reinvested, 100% of Annual Return ($100) Spent
$1,000 $0 $0 $1,000 $2,000 $3,000% of Grand Total 33% 0% 0% 67% 100%
25% ($25) of Annual Return Reinvested, 75% of Annual Return ($75) Spent
1,000 500 932 2,432 1,500 3,932% of Grand Total 25% 13% 24% 38% 100%
50% ($50) of Annual Return Reinvested, 50% of Annual Return ($50) Spent
1,000 1,000 1,864 3,864 1,000 4,864% of Grand Total 21% 21% 37% 21% 100%
75% ($75) of Annual Return Reinvested, 25% of Annual Return ($25) Spent
1,000 1,500 2,796 5,296 500 5,796% of Grand Total 17% 26% 48% 9% 100%
100% ($100) of Annual Return Reinvested, 0% of Annual Return ($0) Spent
1,000 2,000 3,727 6,727 0 6,727% of Grand Total 15% 30% 55% 0% 100%
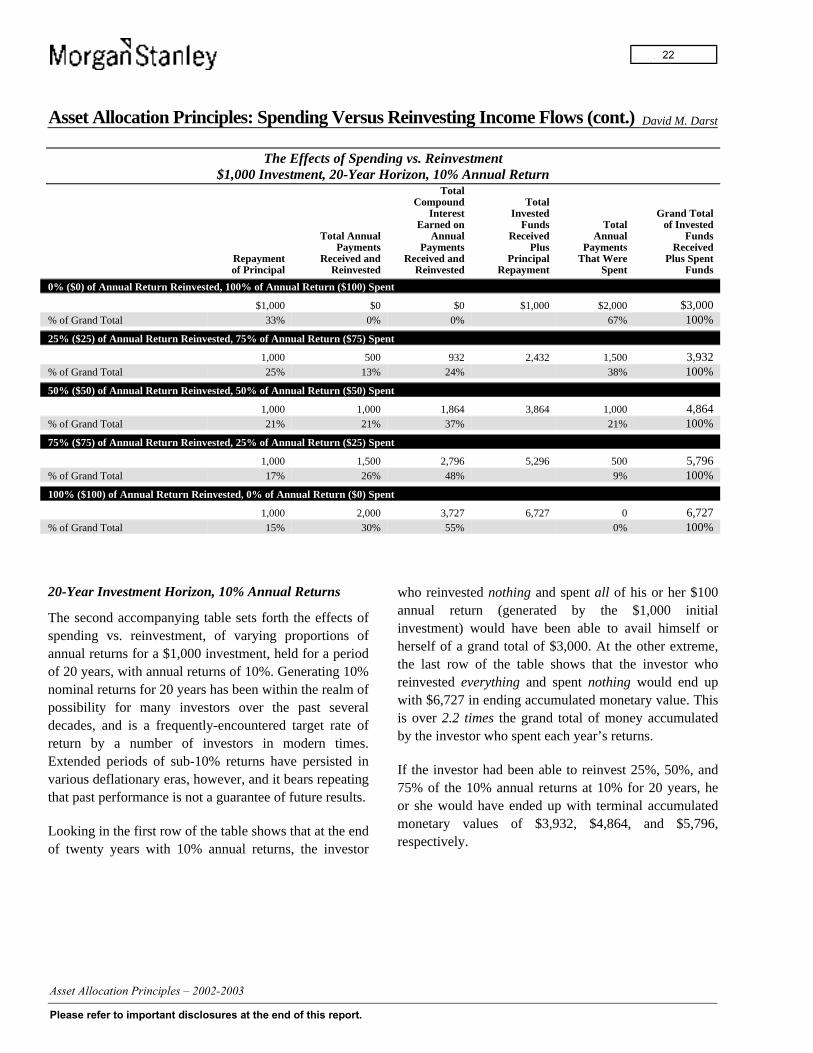
20-Year Investment Horizon, 10% Annual Returns
The second accompanying table sets forth the effects ofspending vs. reinvestment, of varying proportions ofannual returns for a $1,000 investment, held for a periodof 20 years, with annual returns of 10%. Generating 10%nominal returns for 20 years has been within the realm ofpossibility for many investors over the past severaldecades, and is a frequently-encountered target rate ofreturn by a number of investors in modern times.Extended periods of sub-10% returns have persisted invarious deflationary eras, however, and it bears repeatingthat past performance is not a guarantee of future results.
Looking in the first row of the table shows that at the endof twenty years with 10% annual returns, the investor
who reinvested nothing and spent all of his or her $100annual return (generated by the $1,000 initialinvestment) would have been able to avail himself orherself of a grand total of $3,000. At the other extreme,the last row of the table shows that the investor whoreinvested everything and spent nothing would end upwith $6,727 in ending accumulated monetary value. Thisis over 2.2 times the grand total of money accumulatedby the investor who spent each year’s returns.
If the investor had been able to reinvest 25%, 50%, and75% of the 10% annual returns at 10% for 20 years, heor she would have ended up with terminal accumulatedmonetary values of $3,932, $4,864, and $5,796,respectively.
-
22
Asset Allocation Principles: Spending Versus Reinvesting Income Flows (cont.) David M. Darst
The Effects of Spending vs. Reinvestment$1,000 Investment, 20-year Horizon, 5% Annual Return
TotalCompound Total
Interest Invested Grand TotalEarned on Funds Total of Invested
Total Annual Annual Received Annual FundsPayments Payments Plus Payments Received
Repayment Received and Received and Principal That Were Plus Spentof Principal Reinvested Reinvested Repayment Spent Funds
0% ($0) of Annual Return Reinvested, 100% of Annual Return ($50) Spent
$1,000 $0 $0 $1,000 $2,000 $2,000% of Grand Total 50% 0% 0% 50% 100%
25% ($12.50) of Annual Return Reinvested, 75% of Annual Return ($37.50) Spent
1,000 250 163 1,413 750 2,163% of Grand Total 45% 12% 8% 35% 100%
50% ($25) of Annual Return Reinvested, 50% of Annual Return ($25) Spent
1,000 500 327 1,827 500 2,327% of Grand Total 43% 21% 15% 21% 100%
75% ($37.50) of Annual Return Reinvested, 25% of Annual Return ($12.50) Spent
1,000 750 490 2,240 250 2,490% of Grand Total 40% 30% 20% 10% 100%
100% ($50) of Annual Return Reinvested, 0% of Annual Return ($0) Spent
1,000 2,000 653 2,653 0 2,653% of Grand Total 38% 38% 24% 0% 100%
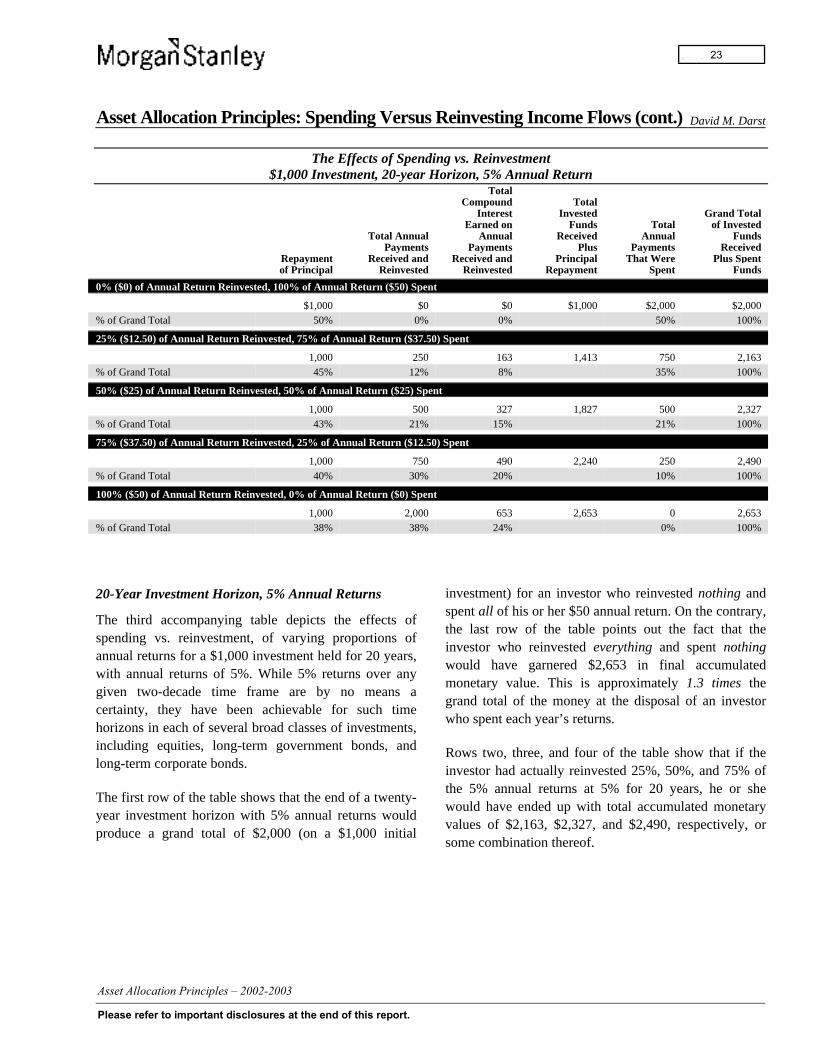
20-Year Investment Horizon, 5% Annual Returns
The third accompanying table depicts the effects ofspending vs. reinvestment, of varying proportions ofannual returns for a $1,000 investment held for 20 years,with annual returns of 5%. While 5% returns over anygiven two-decade time frame are by no means acertainty, they have been achievable for such timehorizons in each of several broad classes of investments,including equities, long-term government bonds, andlong-term corporate bonds.
The first row of the table shows that the end of a twenty-year investment horizon with 5% annual returns wouldproduce a grand total of $2,000 (on a $1,000 initial
investment) for an investor who reinvested nothing andspent all of his or her $50 annual return. On the contrary,the last row of the table points out the fact that theinvestor who reinvested everything and spent nothingwould have garnered $2,653 in final accumulatedmonetary value. This is approximately 1.3 times thegrand total of the money at the disposal of an investorwho spent each year’s returns.
Rows two, three, and four of the table show that if theinvestor had actually reinvested 25%, 50%, and 75% ofthe 5% annual returns at 5% for 20 years, he or shewould have ended up with total accumulated monetaryvalues of $2,163, $2,327, and $2,490, respectively, orsome combination thereof.
-
23

Asset Allocation Principles: Spending Versus Reinvesting Income Flows (cont.) David M. Darst
The Effects of Spending vs. Reinvestment$1,000 Investment, 10-year Horizon, 20% Annual Return
TotalCompound Total
Interest Invested Grand TotalEarned on Funds Total of Invested
Total Annual Annual Received Annual FundsPayments Payments Plus Payments Received
Repayment Received and Received and Principal That Were Plus Spentof Principal Reinvested Reinvested Repayment Spent Funds
0% ($0) of Annual Return Reinvested, 100% of Annual Return ($200) Spent
$1,000 $0 $0 $1,000 $2,000 $3,000% of Grand Total 33% 0% 0% 67% 100%
25% ($50.00) of Annual Return Reinvested, 75% of Annual Return ($150) Spent
1,000 500 798 2,298 1,500 3,798% of Grand Total 26% 13% 22% 39% 100%
50% ($100) of Annual Return Reinvested, 50% of Annual Return ($100) Spent
1,000 1,000 1,596 3,596 1,000 4,596% of Grand Total 22% 22% 34% 22% 100%
75% ($150) of Annual Return Reinvested, 25% of Annual Return ($50) Spent
1,000 1,500 2,394 4,894 500 5,394% of Grand Total 19% 28% 44% 9% 100%
100% ($200) of Annual Return Reinvested, 0% of Annual Return ($0) Spent
1,000 2,000 3,192 6,192 0 6,192% of Grand Total 16% 32% 52% 0% 100%
The Effects of Spending vs. Reinvestment as aFunction of the Investment Time Horizon
The fourth accompanying table shows the effects ofspending vs. reinvestment of varying proportions ofannual returns for a $1,000 investment, held for a periodof 10 years rather than 20 years, with annual returns of20%. It is worth repeating that 20% annual returns areextraordinarily high, and achieving such investmentperformance is rare, even if only for one decade, not two.
At the end of 10 years with 20% annual returns, theinvestor who reinvested nothing and spent all of his orher $200 annual return would have been able to availhimself or herself of a grand total of $3,000. Theinvestor who reinvested everything and spent nothingwould own $6,192 in ending accumulated monetaryvalue. This is just over 2 times the grand total of moneyat the disposal of an investor who spent each year’sreturns.
If the investor had reinvested 25%, 50% and 75% of the20% annual returns at 20% for 10 years, he or she wouldown ending accumulated monetary sums equal to$3,798, $4,596, and $5,394, respectively.
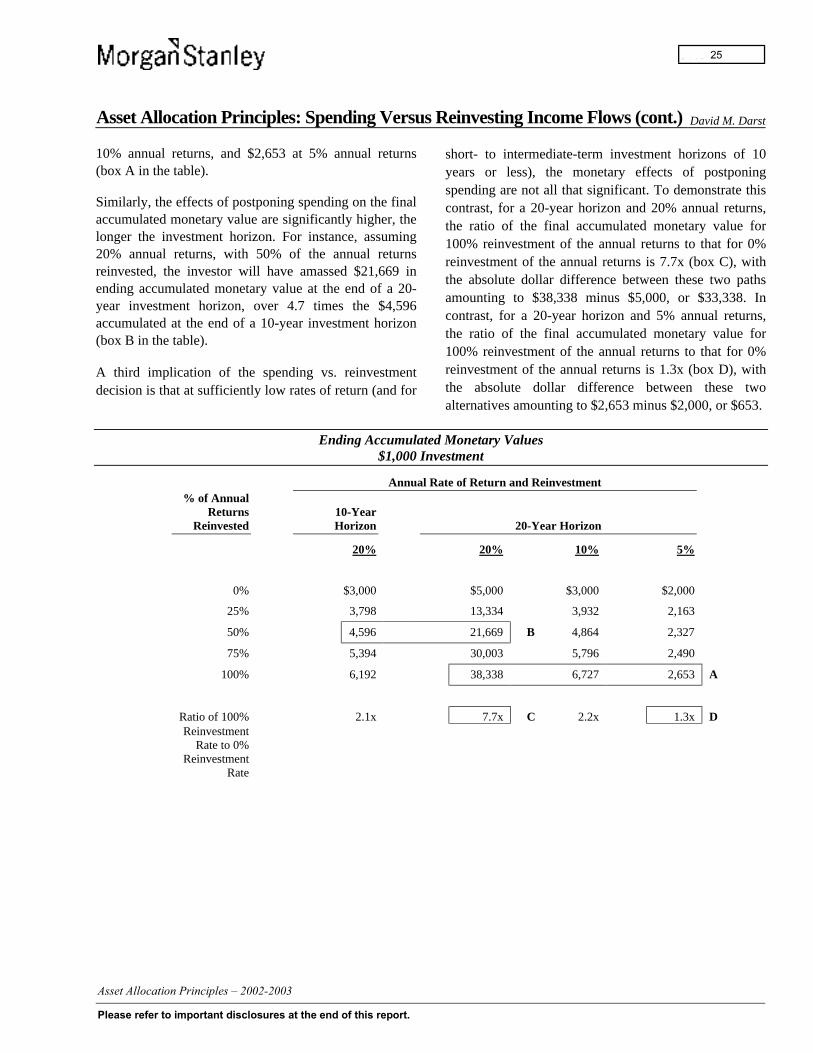
Implications of Spending vs. Reinvestment
To illuminate some of the implications of the spendingvs. reinvestment decision, the fifth accompanying tablesets forth data drawn from the 20-year investments with20%, 10%, and 5% annual returns, and for comparison,the 10-year investment with 20% annual returns.
One key implication of the spending vs. reinvestmentdecision is that the final accumulated effects ofpostponing spending are dramatically higher, the higherthe reinvestment rate. For example, given a 20-yearinvestment horizon, with 100% of annual returnsreinvested, the final accumulated monetary valueamounts to $38,338 at 20% annual returns, $6,727 at
-
24
Asset Allocation Principles: Spending Versus Reinvesting Income Flows (cont.) David M. Darst
10% annual returns, and $2,653 at 5% annual returns(box A in the table).
Similarly, the effects of postponing spending on the finalaccumulated monetary value are significantly higher, thelonger the investment horizon. For instance, assuming20% annual returns, with 50% of the annual returnsreinvested, the investor will have amassed $21,669 inending accumulated monetary value at the end of a 20-year investment horizon, over 4.7 times the $4,596accumulated at the end of a 10-year investment horizon(box B in the table).
A third implication of the spending vs. reinvestmentdecision is that at sufficiently low rates of return (and for
short- to intermediate-term investment horizons of 10years or less), the monetary effects of postponingspending are not all that significant. To demonstrate thiscontrast, for a 20-year horizon and 20% annual returns,the ratio of the final accumulated monetary value for100% reinvestment of the annual returns to that for 0%reinvestment of the annual returns is 7.7x (box C), withthe absolute dollar difference between these two pathsamounting to $38,338 minus $5,000, or $33,338. Incontrast, for a 20-year horizon and 5% annual returns,the ratio of the final accumulated monetary value for100% reinvestment of the annual returns to that for 0%reinvestment of the annual returns is 1.3x (box D), withthe absolute dollar difference between these twoalternatives amounting to $2,653 minus $2,000, or $653.
Ending Accumulated Monetary Values$1,000 Investment
Annual Rate of Return and Reinvestment% of Annual
ReturnsReinvested
10-YearHorizon 20-Year Horizon
20% 20% 10% 5%
0% $3,000 $5,000 $3,000 $2,000
25% 3,798 13,334 3,932 2,163
50% 4,596 21,669 B 4,864 2,327
75% 5,394 30,003 5,796 2,490
100% 6,192 38,338 6,727 2,653 A
Ratio of 100% 2.1x 7.7x C 2.2x 1.3x DReinvestment
Rate to 0%Reinvestment
Rate
-
25
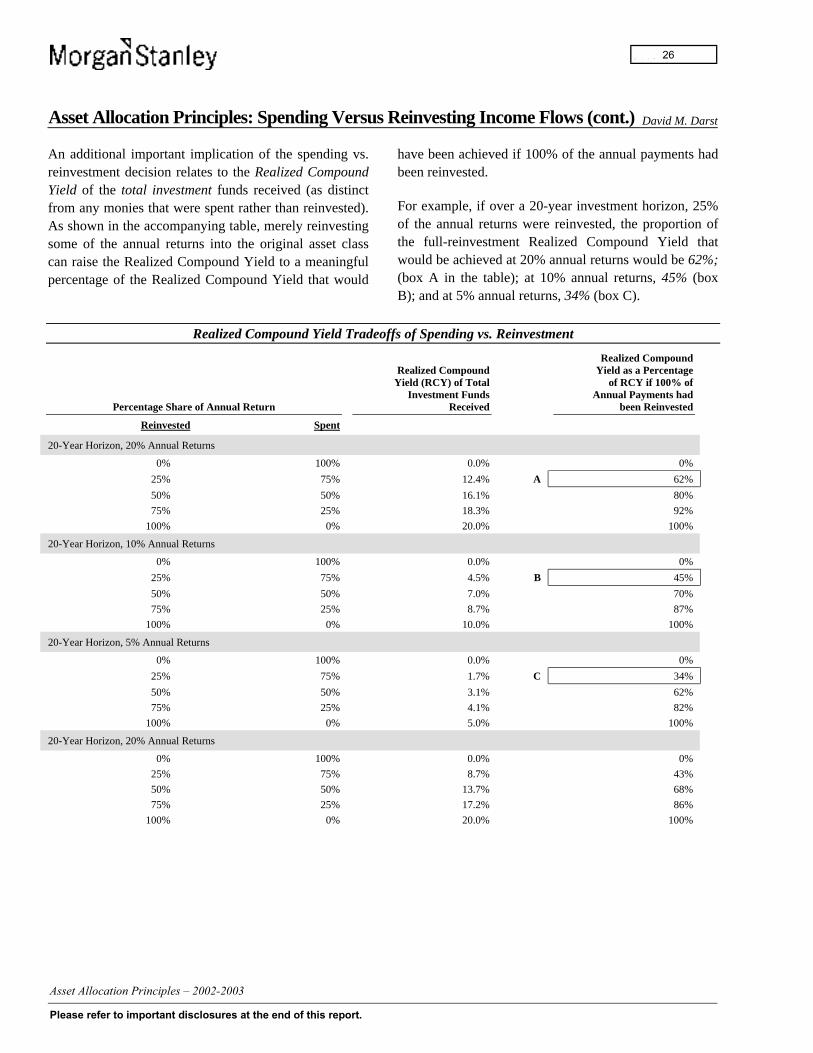
Asset Allocation Principles: Spending Versus Reinvesting Income Flows (cont.) David M. Darst
An additional important implication of the spending vs.reinvestment decision relates to the Realized CompoundYield of the total investment funds received (as distinctfrom any monies that were spent rather than reinvested).As shown in the accompanying table, merely reinvestingsome of the annual returns into the original asset classcan raise the Realized Compound Yield to a meaningfulpercentage of the Realized Compound Yield that would
have been achieved if 100% of the annual payments hadbeen reinvested.
For example, if over a 20-year investment horizon, 25%of the annual returns were reinvested, the proportion ofthe full-reinvestment Realized Compound Yield thatwould be achieved at 20% annual returns would be 62%;(box A in the table); at 10% annual returns, 45% (boxB); and at 5% annual returns, 34% (box C).
Realized Compound Yield Tradeoffs of Spending vs. Reinvestment
Percentage Share of Annual Return
Realized CompoundYield (RCY) of Total
Investment FundsReceived
Realized CompoundYield as a Percentage
of RCY if 100% ofAnnual Payments had
been Reinvested
Reinvested Spent
20-Year Horizon, 20% Annual Returns
0% 100% 0.0% 0%
25% 75% 12.4% A 62%
50% 50% 16.1% 80%
75% 25% 18.3% 92%
100% 0% 20.0% 100%
20-Year Horizon, 10% Annual Returns
0% 100% 0.0% 0%
25% 75% 4.5% B 45%
50% 50% 7.0% 70%
75% 25% 8.7% 87%
100% 0% 10.0% 100%
20-Year Horizon, 5% Annual Returns
0% 100% 0.0% 0%
25% 75% 1.7% C 34%
50% 50% 3.1% 62%
75% 25% 4.1% 82%
100% 0% 5.0% 100%
20-Year Horizon, 20% Annual Returns
0% 100% 0.0% 0%
25% 75% 8.7% 43%
50% 50% 13.7% 68%
75% 25% 17.2% 86%
100% 0% 20.0% 100%
-
26
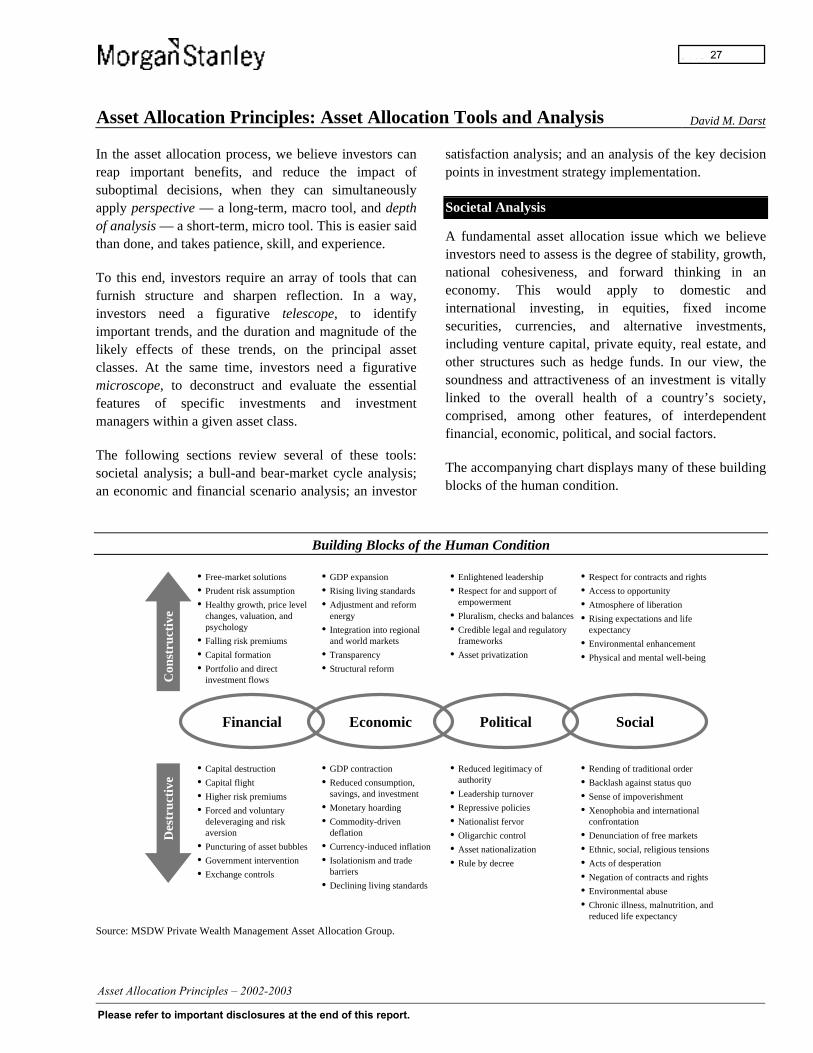
Asset Allocation Principles: Asset Allocation Tools and Analysis David M. Darst
In the asset allocation process, we believe investors canreap important benefits, and reduce the impact ofsuboptimal decisions, when they can simultaneouslyapply perspective — a long-term, macro tool, and depthof analysis — a short-term, micro tool. This is easier saidthan done, and takes patience, skill, and experience.
To this end, investors require an array of tools that canfurnish structure and sharpen reflection. In a way,investors need a figurative telescope, to identifyimportant trends, and the duration and magnitude of thelikely effects of these trends, on the principal assetclasses. At the same time, investors need a figurativemicroscope, to deconstruct and evaluate the essentialfeatures of specific investments and investmentmanagers within a given asset class.
The following sections review several of these tools:societal analysis; a bull-and bear-market cycle analysis;an economic and financial scenario analysis; an investor
satisfaction analysis; and an analysis of the key decisionpoints in investment strategy implementation.
Societal Analysis
A fundamental asset allocation issue which we believeinvestors need to assess is the degree of stability, growth,national cohesiveness, and forward thinking in aneconomy. This would apply to domestic andinternational investing, in equities, fixed incomesecurities, currencies, and alternative investments,including venture capital, private equity, real estate, andother structures such as hedge funds. In our view, thesoundness and attractiveness of an investment is vitallylinked to the overall health of a country’s society,comprised, among other features, of interdependentfinancial, economic, political, and social factors.
The accompanying chart displays many of these buildingblocks of the human condition.
Building Blocks of the Human Condition
� Free-market solutions
� Prudent risk assumption
� Healthy growth, price levelchanges, valuation, andpsychology
� Falling risk premiums
� Capital formation
� Portfolio and directinvestment flows
� GDP expansion
� Rising living standards
� Adjustment and reformenergy
� Integration into regionaland world markets
� Transparency
� Structural reform
� Enlightened leadership
� Respect for and support ofempowerment
� Pluralism, checks and balances
� Credible legal and regulatoryframeworks
� Asset privatization
� Respect for contracts and rights
� Access to opportunity
� Atmosphere of liberation
� Rising expectations and lifeexpectancy
� Environmental enhancement
� Physical and mental well-being
� Capital destruction
� Capital flight
� Higher risk premiums
� Forced and voluntarydeleveraging and riskaversion
� Puncturing of asset bubbles
� Government intervention
� Exchange controls
� GDP contraction
� Reduced consumption,savings, and investment
� Monetary hoarding
� Commodity-drivendeflation
� Currency-induced inflation
� Isolationism and tradebarriers
� Declining living standards
� Reduced legitimacy ofauthority
� Leadership turnover
� Repressive policies
� Nationalist fervor
� Oligarchic control
� Asset nationalization
� Rule by decree
� Rending of traditional order
� Backlash against status quo
� Sense of impoverishment
� Xenophobia and internationalconfrontation
� Denunciation of free markets
� Ethnic, social, religious tensions
� Acts of desperation
� Negation of contracts and rights
� Environmental abuse
� Chronic illness, malnutrition, andreduced life expectancy
Financial Economic Political Social
Con
stru
ctiv
eD
estr
ucti
ve
Source: MSDW Private Wealth Management Asset Allocation Group.
-
27
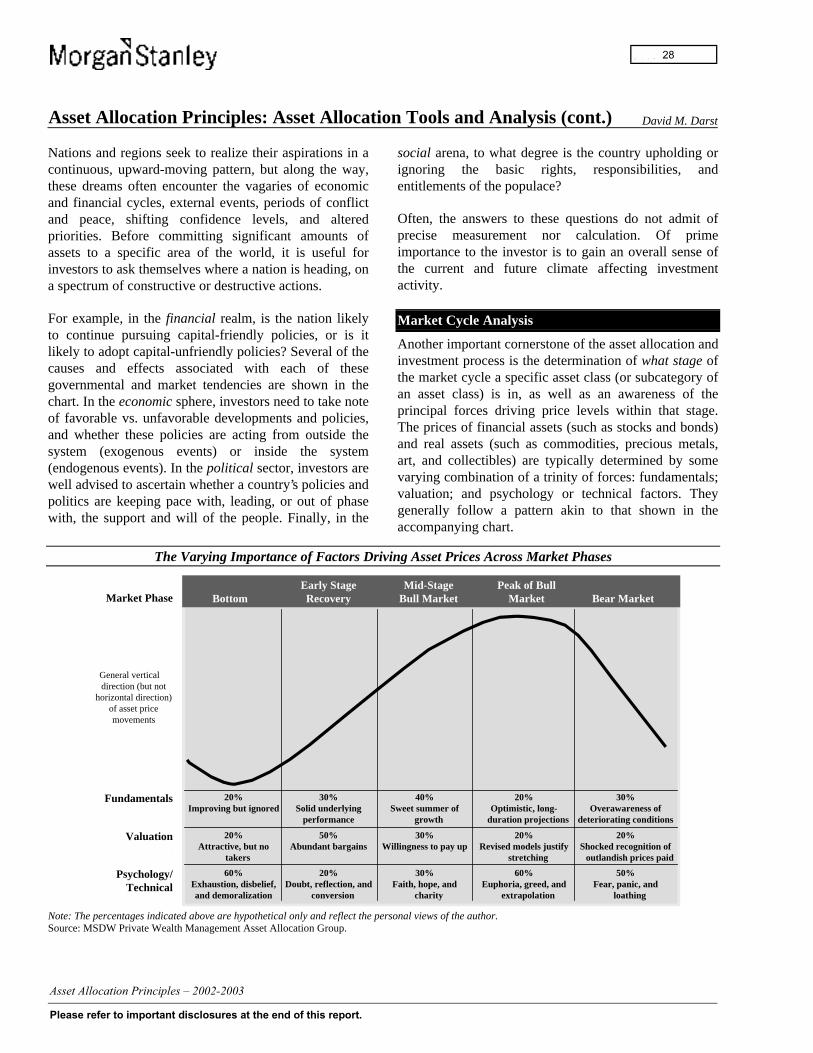
Asset Allocation Principles: Asset Allocation Tools and Analysis (cont.) David M. Darst
Nations and regions seek to realize their aspirations in acontinuous, upward-moving pattern, but along the way,these dreams often encounter the vagaries of economicand financial cycles, external events, periods of conflictand peace, shifting confidence levels, and alteredpriorities. Before committing significant amounts ofassets to a specific area of the world, it is useful forinvestors to ask themselves where a nation is heading, ona spectrum of constructive or destructive actions.
For example, in the financial realm, is the nation likelyto continue pursuing capital-friendly policies, or is itlikely to adopt capital-unfriendly policies? Several of thecauses and effects associated with each of thesegovernmental and market tendencies are shown in thechart. In the economic sphere, investors need to take noteof favorable vs. unfavorable developments and policies,and whether these policies are acting from outside thesystem (exogenous events) or inside the system(endogenous events). In the political sector, investors arewell advised to ascertain whether a country’s policies andpolitics are keeping pace with, leading, or out of phasewith, the support and will of the people. Finally, in the
social arena, to what degree is the country upholding orignoring the basic rights, responsibilities, andentitlements of the populace?
Often, the answers to these questions do not admit ofprecise measurement nor calculation. Of primeimportance to the investor is to gain an overall sense ofthe current and future climate affecting investmentactivity.
Market Cycle Analysis
Another important cornerstone of the asset allocation andinvestment process is the determination of what stage ofthe market cycle a specific asset class (or subcategory ofan asset class) is in, as well as an awareness of theprincipal forces driving price levels within that stage.The prices of financial assets (such as stocks and bonds)and real assets (such as commodities, precious metals,art, and collectibles) are typically determined by somevarying combination of a trinity of forces: fundamentals;valuation; and psychology or technical factors. Theygenerally follow a pattern akin to that shown in theaccompanying chart.
The Varying Importance of Factors Driving Asset Prices Across Market Phases
General verticaldirection (but not
horizontal direction)of asset pricemovements
Market Phase
Fundamentals
Valuation(etc.)
Psychology/Technical
BottomEarly StageRecovery
Mid-StageBull Market
Peak of BullMarket Bear Market
20%Improving but ignored
20%Attractive, but no
takers
60%Exhaustion, disbelief,and demoralization
30%Solid underlying
performance
50%Abundant bargains
20%Doubt, reflection, and
conversion
40%Sweet summer of
growth
30%Willingness to pay up
30%Faith, hope, and
charity
20%Optimistic, long-
duration projections
20%Revised models justify
stretching
60%Euphoria, greed, and
extrapolation
30%Overawareness of
deteriorating conditions
20%Shocked recognition of
outlandish prices paid
50%Fear, panic, and
loathing
Note: The percentages indicated above are hypothetical only and reflect the personal views of the author.Source: MSDW Private Wealth Management Asset Allocation Group.
-
28

Asset Allocation Principles: Asset Allocation Tools and Analysis (cont.) David M. Darst
In simplified form, these assets’ prices, subject toreversals, to different degrees of magnitude, andespecially, duration in time, can be said to progressthrough five major phases. These phases include: (i) abottoming phase, in which depressed prices generatelittle or no investor enthusiasm; (ii) an early-stagerecovery phase, in which bargain prices begin toconvince investors of their underlying merits; (iii) a mid-stage bull market phase, in which fundamental measuresof worth succeed in attracting greater numbers ofinvestors; (iv) a peak bull market phase, in whichinvestors’ increasing enthusiasm for the asset classpushes prices to extreme levels; and, (v) a bear marketphase, in which swelling ranks of investors abandon theirenthusiasm for the asset and willingly offer it for sale.
The chart also displays the varying degree of importanceof the three key driving forces across the five phasesexperienced in a classical market cycle. Fundamentals(including those characteristics which define the inherentattractiveness, utility, or purpose of the asset) tend toplay only a small role in influencing price movements atthe bottom, and at the top, of a market cycle.Fundamentals generally come to the fore in thedetermination of prices during the middle stage of a bullmarket, when investors usually exhibit their mostrational behavior.
Valuation (which takes into account the pattern, timing,and present worth of an asset’s cash flows and terminalvalue, both relative to itself and to other kinds of assets)tends to exert its greatest influence in the early stages ofa bull market. During such phases, very attractive valuesoften convert investors from disbeliveers to believers. Inother phases of a market cycle, values are more alagging, rather than a leading, instigator of investoraction.
Psychological and technical factors play a veryimportant role in pushing asset prices to extremelyelevated or depressed levels at the peaks or troughs ofmarket cycles. Psychological forces span the gamut of
human emotion and include mania, greed, euphoria,gullibility, doubt, fear, panic, regret, and even loathing ofothers and self. Technical forces encompass the liquidityof an asset, the origins and destinations of investors’funds flows, and the attractiveness or unattractiveness ofa given asset relative to other assets. Taken together,psychological and technical factors may very well andoften do dominate fundamental and valuation influencesat market extremes.
Scenario Analysis
After the investor has given thought to societalinfluences, and to the prevailing phase and associatedforces of the market cycle for an asset class (or subclass),he or she could profitably devote thought and resourcesto a hypothetical economic and financial scenarioanalysis. The chief value of such an analysis derivesfrom: (i) the relative completeness of the range ofscenarios considered, from optimistic to pessimistic; (ii)the rough translation of forecasted economic results intotheir resultant effects on various asset classes; (iii) theneed to assign probabilities to each of the scenarios; and(iv) the construction of a tactical (usually having a one-year time horizon) asset allocation appropriate for theinvestor in question.
Several caveats should be kept in mind whenconstructing and evaluating a series of scenarios andtheir anticipated effects on financial markets andportfolio construction. Forecasts, and especially theirassociated probabilities, are purely predictions, notactual circumstances. They rarely come to pass in asinternally consistent a manner and to the degree that theyare expected to happen. Moreover, economic andfinancial history is filled with many outcomes that werenot originally part of the forecasting vernacular, and thuswere totally unpredicted.
The accompanying chart contains a matrix constructed toanalyze the likely effects of various economic andfinancial scenarios in the U.S.
-
29

Asset Allocation Principles: Asset Allocation Tools and Analysis (cont.) David M. Darst
Hypothetical Economic and Financial Scenario Analysis
Scenario1
Scenario2
Scenario3
Scenario4
Scenario5
Scenario6
Projected OutlookHigh Growth,Low Inflation
High Growth,Increasing Inflation
Lower Growth,Increasing Inflation
Zero Growth,Some Inflation Disinflation Deflation
EconomicU.S. GDP
CPI Inflation Rate
U.S. Corporate Profits
Other VariablesWorld GDP
Japanese Yen/US Dollar
Capital Markets
ST Interest RatesLT Interest Rates
U.S. Equity Total ReturnU.S. Bond Total Return
Probabilities
Moderate HNW Tactical Asset MixEquities
Bonds (Duration Yield-Dependent)
Alternative InvestmentsCash
+ 3.5%
+ 2.5%
+ 12.0%
+ 2.8%
150
5.5%
6.0%
+ 15.0%
– 11.2%
10%
60%
25%
10%
5%
+ 3.5%
+ 4.5%
+ 10.0%
+ 2.0%
150
6.5%
6.5%
+ 8.0%
– 17.2%
10%
60%
20%
10%
10%
+ 2.0%
+ 5.0%
+ 5.0%
+ 1.5%
170
6.5%
7.0%
+ 2.0%
– 22.6%
20%
50%
25%
10%
15%
0.0%
+ 2.0%
– 5.0%
+ 1.0%
180
4.0%
4.5%
– 10.0%
+ 9.3%
35%
45%
35%
10%
10%
0.0%
+ 0.5%
– 8.0%
0.0%
200
3.5%
4.0%
– 15.0%
+ 17.2%
15%
40%
40%
8%
12%
– 1.0%
– 2.0%
– 12.0%
– 1.0%
225
3.0%
3.0%
– 25.0%
+ 35.0%
10%
30%
50%
5%
15%
Note: The percentages indicated above are hypothetical only and reflect the personal views of the author.
Source: MSDW Private Wealth Management Asset Allocation Group.
In the chart, which covers the time frame for the twelvemonths looking forward from the date of the analysis,Scenario 1 calls for a period of high real economicgrowth (+3.5%), accompanied by reasonably subduedconsumer price inflation (+2.5%), and increasing U.S.corporate profits (+12.0%). Other variables associatedwith such an outcome would include rising real worldGDP (+2.8%), and an end-of-period currency exchangerate of 150 Japanese yen per U.S. dollar. In suchcircumstances, 3-month U.S. Treasury bill rates areprojected to end the period at 5.5% and the 30-year U.S.Treasury bond is projected to yield 6.0%. As a result,broad-based U.S. equity indices are projected to providea total return (including dividends) of +15.0%, and the30-year U.S. Treasury bond is projected to provide atotal return (including coupons) of -11.2%, assuming thatlong Treasury rates began the twelve-month period at5.0%.
In this hypothetical example, a probability of only 10%is assigned to Scenario 1. Should the High Net Worth
investor feel strongly that Scenario 1 will come to pass,he or she may adopt a tactical (one-year) asset allocationconsisting of 60% equities, 25% bonds (with thematurity and coupon dependent on the degree of theinvestor’s conviction about the interest rate outlook),10% alternative investments, and 5% in cash equivalentinstruments.
At the other end of the spectrum, Scenario 6 predicts aperiod of deflation, in which real economic activitycontracts by 1.0%, consumer prices fall 2.0%, and U.S.corporate profits decline 12.0%. Other variablesassociated with such an outcome would include anoutright decline in world GDP of 1.0%, and an end-of-period currency exchange rate of 225 Japanese yen perU.S. dollar. In such an environment, 3-month U.S.Treasury bill rates are projected to end the period at3.0% and the 30-year U.S. Treasury bond is projected toyield 3.0%. As a result, broad-based U.S. equity indicesare projected to provide a total return (includingdividends) of -25.0%, and the 30-year U.S. Treasury
-
30
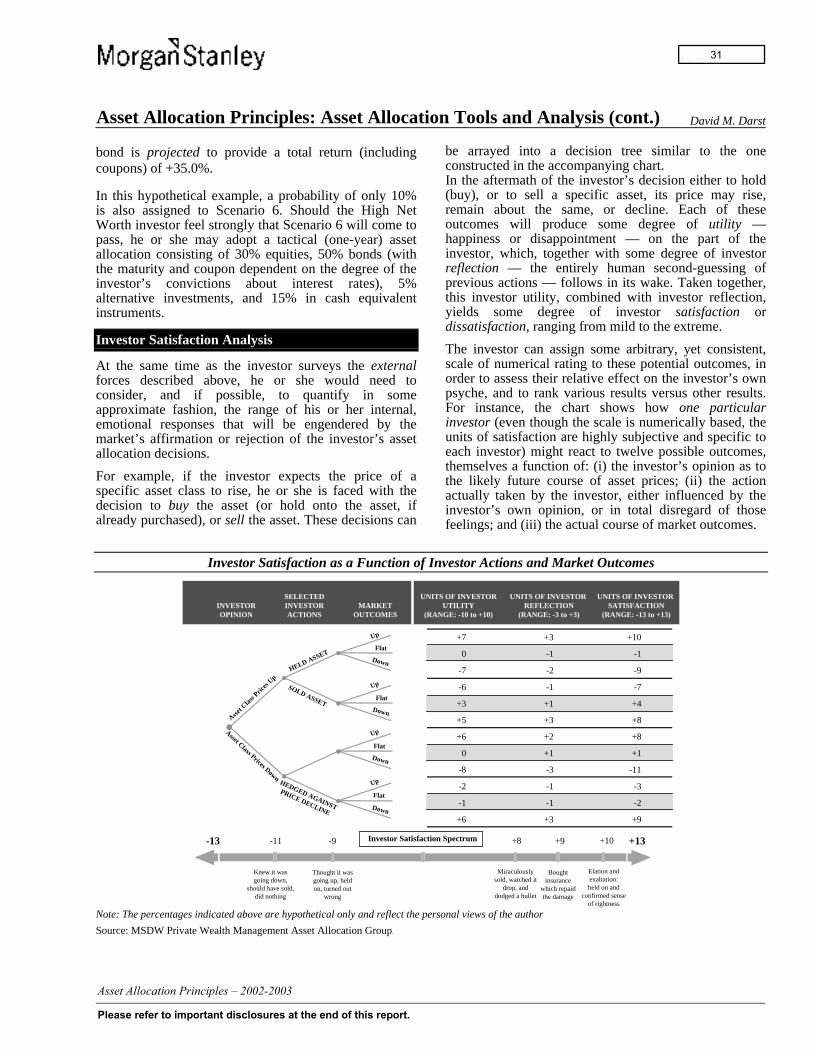
Asset Allocation Principles: Asset Allocation Tools and Analysis (cont.) David M. Darst
bond is projected to provide a total return (includingcoupons) of +35.0%.
In this hypothetical example, a probability of only 10%is also assigned to Scenario 6. Should the High NetWorth investor feel strongly that Scenario 6 will come topass, he or she may adopt a tactical (one-year) assetallocation consisting of 30% equities, 50% bonds (withthe maturity and coupon dependent on the degree of theinvestor’s convictions about interest rates), 5%alternative investments, and 15% in cash equivalentinstruments.
Investor Satisfaction Analysis
At the same time as the investor surveys the externalforces described above, he or she would need toconsider, and if possible, to quantify in someapproximate fashion, the range of his or her internal,emotional responses that will be engendered by themarket’s affirmation or rejection of the investor’s assetallocation decisions.
For example, if the investor expects the price of aspecific asset class to rise, he or she is faced with thedecision to buy the asset (or hold onto the asset, ifalready purchased), or sell the asset. These decisions can
be arrayed into a decision tree similar to the oneconstructed in the accompanying chart.In the aftermath of the investor’s decision either to hold(buy), or to sell a specific asset, its price may rise,remain about the same, or decline. Each of theseoutcomes will produce some degree of utility —happiness or disappointment — on the part of theinvestor, which, together with some degree of investorreflection — the entirely human second-guessing ofprevious actions — follows in its wake. Taken together,this investor utility, combined with investor reflection,yields some degree of investor satisfaction ordissatisfaction, ranging from mild to the extreme.
The investor can assign some arbitrary, yet consistent,scale of numerical rating to these potential outcomes, inorder to assess their relative effect on the investor’s ownpsyche, and to rank various results versus other results.For instance, the chart shows how one particularinvestor (even though the scale is numerically based, theunits of satisfaction are highly subjective and specific toeach investor) might react to twelve possible outcomes,themselves a function of: (i) the investor’s opinion as tothe likely future course of asset prices; (ii) the actionactually taken by the investor, either influenced by theinvestor’s own opinion, or in total disregard of thosefeelings; and (iii) the actual course of market outcomes.
Investor Satisfaction as a Function of Investor Actions and Market Outcomes
INVESTOROPINION
SELECTEDINVESTORACTIONS
MARKETOUTCOMES
UNITS OF INVESTORUTILITY
(RANGE: -10 to +10)
UNITS OF INVESTOR REFLECTION
(RANGE: -3 to +3)
Asset C
lass P
rices
Up
Asset Class Prices DownHEDGED AGAINST
PRICE DECLINE
Knew it wasgoing down,
should have sold,did nothing
Thought it wasgoing up, heldon, turned out
wrong
Miraculouslysold, watched it
drop, anddodged a bullet
Boughtinsurance
which repaidthe damage
Up
Flat
Down
Flat
Up
Flat
Up
Flat
Up
UNITS OF INVESTOR SATISFACTION
(RANGE: -13 to +13)
Elation andexaltation:held on and
confirmed senseof rightness
HELD ASSET
SOLD ASSET
-13 -11 -9 +8 +9 +13Investor Satisfaction Spectrum +10
+7 +3 +10
0 -1 -1
-7 -2 -9
-6 -1 -7
+3 +1 +4
+5 +3 +8
+6 +2 +8
0 +1 +1
-8 -3 -11
-2 -1 -3
-1 -1 -2
+6 +3 +9
Down
Down
Down
Note: The percentages indicated above are hypothetical only and reflect the personal views of the author
Source: MSDW Private Wealth Management Asset Allocation Group.
-
31
Asset Allocation Principles: Asset Allocation Tools and Analysis (cont.) David M. Darst
For example, following the topmost branch, at each ofthe three nodes on the decision tree on the previous page,signifies that the investor thought the prices of the assetclass were going to rise; the investor held (or purchased)the asset; and in fact, prices did go up. In turn, for thisparticular investor, such a sequence of events produced+7 units of investor utility (on a subjectively set scale of+10 units to -10 units), which, taken together with +3units of investor reflection (also on a subjectively setscale of +3 units to -3 units), produced +10 units ofoverall investor satisfaction (on a combined potentialscale of +13 units to -13 units).
As shown in the Investor Satisfaction Spectrum at thebottom of the chart on the previous page, (i) theinvestor’s conviction that prices were going to rise; (ii)his or her holding onto the asset; and (iii) the actual factof the price rise led, in this instance, to a highly positiveset of emotions, including a sense of rightness aboutinvestment outcomes, and elation over the investor’sown feelings of mastery and financial acumen.
At the opposite end of the spectrum, is the range offeelings brought about by: (i) the investor’s belief thatthe prices of the asset class were going to decline; (ii) theinvestor’s holding onto the asset rather than selling it;and (iii) prices experiencing a downturn. For a giveninvestor, this sequence of events produced -8 units ofinvestor utility, which, taken together with -3 units ofinvestor reflection, produced -11 units of overall investorsatisfaction. In such an instance, the investor had astrong feeling that prices were going down, and shouldhave sold, but did not. On the Investor SatisfactionSpectrum, the actual experience of the price declinetends to lead to a complex and unsatisfactory set ofemotions, possibly including self-recrimination, and theconstant playing out in the investor’s mind of a series ofwhat-if scenarios.
The investor satisfaction analysis described here hasmany shortcomings, not the least of which is its attemptat placing numerical values on what are often variableand highly personalized feelings. On the other hand, oneof the chief contributions of such an exercise is tostimulate and organize the investor’s thinking aboutpotential outcomes and their emotional effects, prior totaking investment action.
Strategy Implementation Analysis
As the asset allocation process proceeds, investors arefaced with a series of choices about how to implement aninvestment strategy that is consistent with and reflectiveof their asset allocation goals. Surrounding each of thesechoices is a series of factors that helps determine whichalternative is most appropriate for the investor. Severalof these decision points, and a limited number of thepossibilities available to the investor at each decisionpoint, are set forth in the chart on the next page.
The choices along the continuum, from left to right onthe chart, start with large-scale issues, such as the macroasset class selection decision. This analysis assumes thatthe investor has chosen the equity branch of the decisiontree; many of the same principles and choices discussedhere are applicable, with some modification, in otherasset classes such as debt securities or alternativeinvestments. Given the choice of equities, a number ofmore detailed alternatives present themselves.
For example, an investor who decides to invest inequities needs to determine whether large capitalizationor small capitalization issues are more appropriate.Among the factors — and there are more than thoseenumerated here — that will help determine the mostappropriate course are: (i) the position of large-capversus small-cap issues in their respective market cycles;and (ii) the relative valuation of these two equitygroupings, compared with their respective historicvaluation ranges and with each other.
Similarly, the growth equity versus value equity decisionhinges in part on whether the marketplace as a whole is,and/or is likely to become, focused primarily on incomestatement items, such as margins and growth rates inrevenues, cash flow, and earnings. Such an environmentmay indicate a decided popularity tilt toward growthequities. Alternatively, the market as a whole may be,and/or may be likely to become, focused primarily onbalance sheet items, such as cash levels, debt-to-equityratios, contingent liabilities, and book values. Such anenvironment may indicate that value equities are in favorwith investors.
-
32
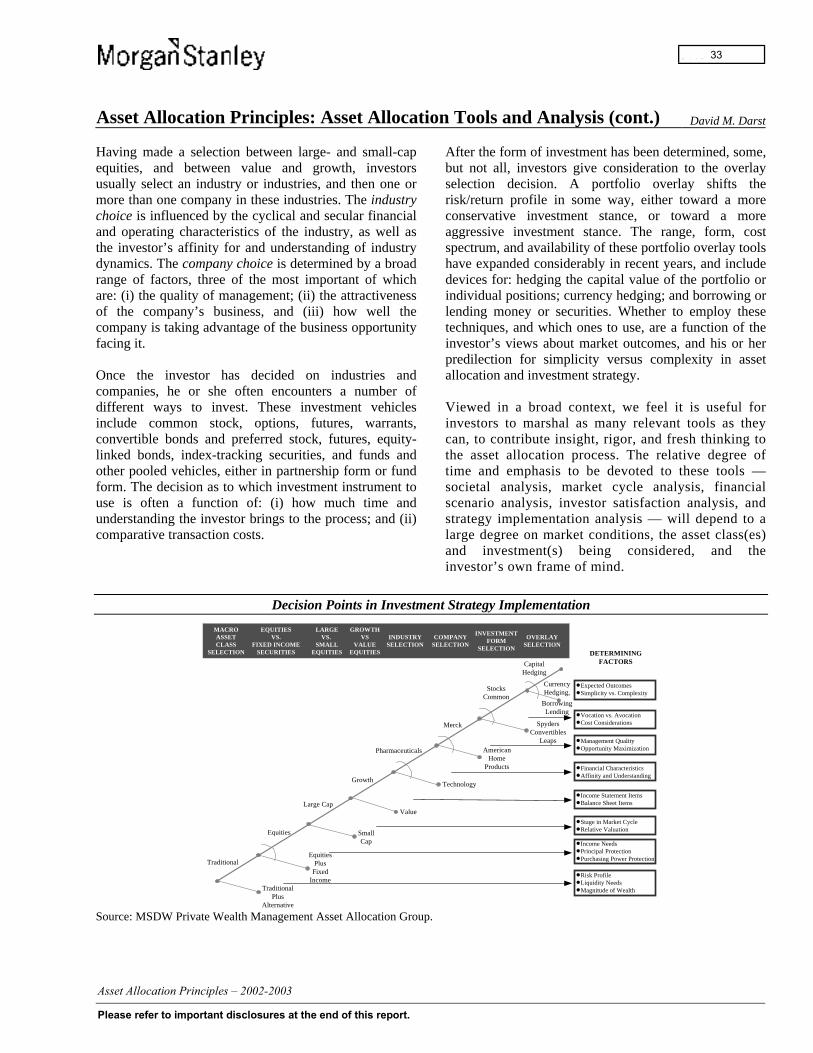
Asset Allocation Principles: Asset Allocation Tools and Analysis (cont.) David M. Darst
Having made a selection between large- and small-capequities, and between value and growth, investorsusually select an industry or industries, and then one ormore than one company in these industries. The industrychoice is influenced by the cyclical and secular financialand operating characteristics of the industry, as well asthe investor’s affinity for and understanding of industrydynamics. The company choice is determined by a broadrange of factors, three of the most important of whichare: (i) the quality of management; (ii) the attractivenessof the company’s business, and (iii) how well thecompany is taking advantage of the business opportunityfacing it.
Once the investor has decided on industries andcompanies, he or she often encounters a number ofdifferent ways to invest. These investment vehiclesinclude common stock, options, futures, warrants,convertible bonds and preferred stock, futures, equity-linked bonds, index-tracking securities, and funds andother pooled vehicles, either in partnership form or fundform. The decision as to which investment instrument touse is often a function of: (i) how much time andunderstanding the investor brings to the process; and (ii)comparative transaction costs.
After the form of investment has been determined, some,but not all, investors give consideration to the overlayselection decision. A portfolio overlay shifts therisk/return profile in some way, either toward a moreconservative investment stance, or toward a moreaggressive investment stance. The range, form, costspectrum, and availability of these portfolio overlay toolshave expanded considerably in recent years, and includedevices for: hedging the capital value of the portfolio orindividual positions; currency hedging; and borrowing orlending money or securities. Whether to employ thesetechniques, and which ones to use, are a function of theinvestor’s views about market outcomes, and his or herpredilection for simplicity versus complexity in assetallocation and investment strategy.
Viewed in a broad context, we feel it is useful forinvestors to marshal as many relevant tools as theycan, to contribute insight, rigor, and fresh thinking tothe asset allocation process. The relative degree oftime and emphasis to be devoted to these tools —societal analysis, market cycle analysis, financialscenario analysis, investor satisfaction analysis, andstrategy implementation analysis — will depend to alarge degree on market conditions, the asset class(es)and investment(s) being considered, and theinvestor’s own frame of mind.
Decision Points in Investment Strategy Implementation
MACROASSETCLASS
SELECTION
EQUITIESVS.
FIXED INCOMESECURITIES
LARGEVS.
SMALLEQUITIES
GROWTHVS
VALUEEQUITIES
INDUSTRYSELECTION
COMPANYSELECTION
INVESTMENTFORM
SELECTION
OVERLAYSELECTION
DETERMININGFACTORS
Traditional
TraditionalPlus
Alternative
EquitiesPlus
FixedIncome
Equities
Large Cap
SmallCap
StocksCommon
SpydersConvertibles
Leaps
Growth
Value
Pharmaceuticals
Technology
Merck
AmericanHome
Products
CapitalHedging
CurrencyHedging,
BorrowingLending
�Expected Outcomes�Simplicity vs. Complexity
�Vocation vs. Avocation�Cost Considerations
�Management Quality�Opportunity Maximization
�Financial Characteristics�Affinity and Understanding
� Income Statement Items�Balance Sheet Items
�Stage in Market Cycle�Relative Valuation
� Income Needs�Principal Protection�Purchasing Power Protection
�Risk Profile�Liquidity Needs�Magnitude of Wealth
Source: MSDW Private Wealth Management Asset Allocation Group.
-
33
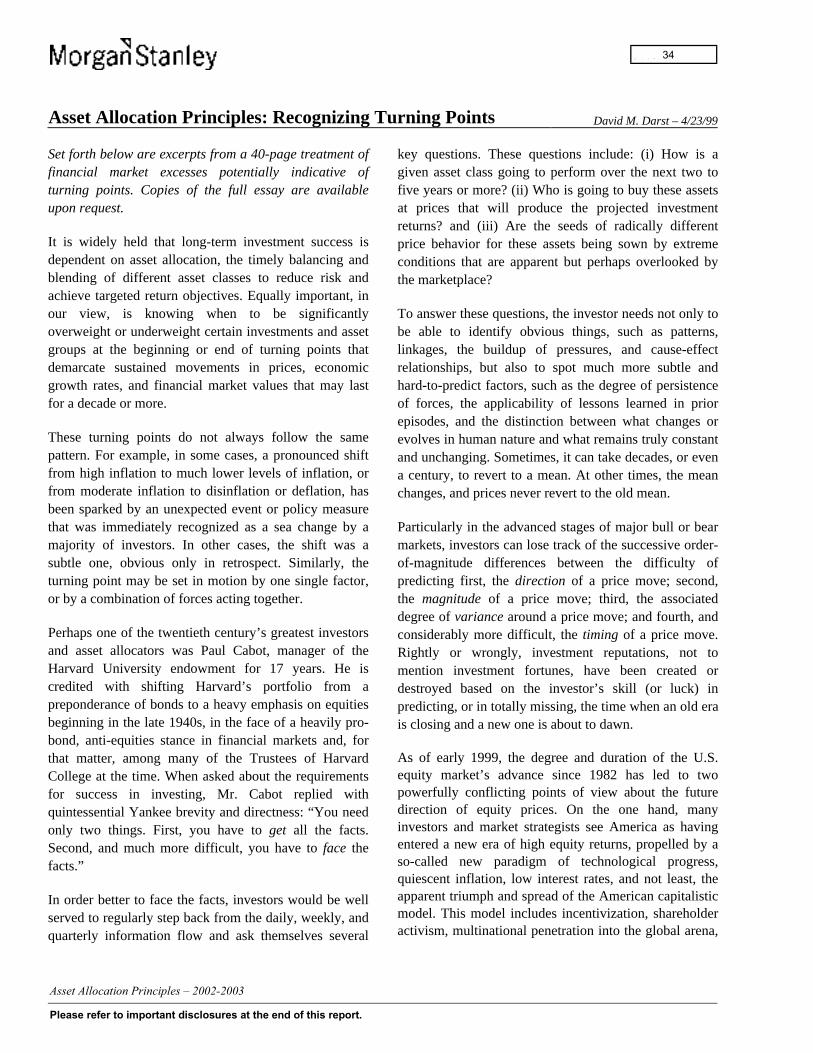
Asset Allocation Principles: Recognizing Turning Points David M. Darst – 4/23/99
Set forth below are excerpts from a 40-page treatment offinancial market excesses potentially indicative ofturning points. Copies of the full essay are availableupon request.
It is widely held that long-term investment success isdependent on asset allocation, the timely balancing andblending of different asset classes to reduce risk andachieve targeted return objectives. Equally important, inour view, is knowing when to be significantlyoverweight or underweight certain investments and assetgroups at the beginning or end of turning points thatdemarcate sustained movements in prices, economicgrowth rates, and financial market values that may lastfor a decade or more.
These turning points do not always follow the samepattern. For example, in some cases, a pronounced shiftfrom high inflation to much lower levels of inflation, orfrom moderate inflation to disinflation or deflation, hasbeen sparked by an unexpected event or policy measurethat was immediately recognized as a sea change by amajority of investors. In other cases, the shift was asubtle one, obvious only in retrospect. Similarly, theturning point may be set in motion by one single factor,or by a combination of forces acting together.
Perhaps one of the twentieth century’s greatest investorsand asset allocators was Paul Cabot, manager of theHarvard University endowment for 17 years. He iscredited with shifting Harvard’s portfolio from apreponderance of bonds to a heavy emphasis on equitiesbeginning in the late 1940s, in the face of a heavily pro-bond, anti-equities stance in financial markets and, forthat matter, among many of the Trustees of HarvardCollege at the time. When asked about the requirementsfor success in investing, Mr. Cabot replied withquintessential Yankee brevity and directness: “You needonly two things. First, you have to get all the facts.Second, and much more difficult, you have to face thefacts.”
In order better to face the facts, investors would be wellserved to regularly step back from the daily, weekly, andquarterly information flow and ask themselves several
key questions. These questions include: (i) How is agiven asset class going to perform over the next two tofive years or more? (ii) Who is going to buy these assetsat prices that will produce the projected investmentreturns? and (iii) Are the seeds of radically differentprice behavior for these assets being sown by extremeconditions that are apparent but perhaps overlooked bythe marketplace?
To answer these questions, the investor needs not only tobe able to identify obvious things, such as patterns,linkages, the buildup of pressures, and cause-effectrelationships, but also to spot much more subtle andhard-to-predict factors, such as the degree of persistenceof forces, the applicability of lessons learned in priorepisodes, and the distinction between what changes orevolves in human nature and what remains truly constantand unchanging. Sometimes, it can take decades, or evena century, to revert to a mean. At other times, the meanchanges, and prices never revert to the old mean.
Particularly in the advanced stages of major bull or bearmarkets, investors can lose track of the successive order-of-magnitude differences between the difficulty ofpredicting first, the direction of a price move; second,the magnitude of a price move; third, the associateddegree of variance around a price move; and fourth, andconsiderably more difficult, the timing of a price move.Rightly or wrongly, investment reputations, not tomention investment fortunes, have been created ordestroyed based on the investor’s skill (or luck) inpredicting, or in totally missing, the time when an old erais closing and a new one is about to dawn.
As of early 1999, the degree and duration of the U.S.equity market’s advance since 1982 has led to twopowerfully conflicting points of view about the futuredirection of equity prices. On the one hand, manyinvestors and market strategists see America as havingentered a new era of high equity returns, propelled by aso-called new paradigm of technological progress,quiescent inflation, low interest rates, and not least, theapparent triumph and spread of the American capitalisticmodel. This model includes incentivization, shareholderactivism, multinational penetration into the global arena,
-
34

Asset Allocation Principles: Recognizing Turning Points (cont.) David M. Darst
deregulation, flexible product and labor markets,corporate restructuring, free trade, rising livingstandards, innovation, and risk-taking. U.S. equities areviewed by this group as a good short-term speculationand an excellent long-term investment, with bonds seenat best as a passable short-term investment and more of along-term speculation. A subgroup of the new-era, new-paradigm investors believes that even if they areincorrect, and equity prices move downward, they willnevertheless be able to: (i) sell out at or near the market’speak; or (ii) protect themselves through the nimble use ofhedging maneuvers such as the sale of stock indexfutures or the purchase of put options.
On the other hand, a considerably smaller proportion ofthe investment population possesses a no less firmlydefended sense that the U.S. equity markets are nearingextreme points of valuation, euphoria, investorparticipation, and narrowness of equity price advance. Inthe view of this group, the very high equity returns of thelatter five and ten years of the 1982–1999 bull run heraldmeaningfully lower, not higher, equity returns over theearly years of the new century, particularly when viewedagainst the backdrop of longer-term societal trends suchas low savings rates, wide income inequalities, and anerosion in the quality of the public elementary and highschool educational infrastructure.
Regardless of the investor’s own view, he or she shouldrigorously and discerningly scan the horizon for signs ofexcess, signs that, appropriately interpreted in time, may
give indication of an important and impending turningpoint in the returns generated by a given asset class.
There is no lack of signs of topsy-turviness to the1999 investment climate. First, a growing body ofevidence suggests that value is undervalued, whileexcessively high valuations are prized. Second, inmany instances, financial markets, not central banks,are considered by some observers to set monetarypolicy for nations, through the medium of currencyvalues and interest rates. Third, the outcome of thereal economy is felt to be dependent on the financialsector, rather than financial sector outcomesreflecting developments in the real economy. Fourth,things that were once considered to be linked are seento be delinking — such as the U.S. economy fromthat of large portions of the rest of the world, andannual price changes in the service sector from thosein commodities or the manufacturing sector. Fifth,things that were once considered to be loosely linkedare seen to be linking — such as equity marketcorrelations around the globe, not to mention thecircular connection between the stock market, theeconomy, and wealth-, income-, and leverage-drivenconsumer spending. Finally, the traditional market-influencing forces of corporate profitability, earningsprogress, and growth in book values have beenaugmented and/or entirely supplanted by powerfulnew forces, including financial television, theInternet, equity mutual fund flows, and indexing.
Table 1: The Effects of Investment Opinions and Actions
Short-Term, Cyclical Opinionsand Actions
Long-Term, SecularOpinions and Actions Effects
Correct Incorrect The investor’s transient, short-term success may be seriouslyvitiated or wiped out as long-term trends overtake short-termtrends.
Incorrect Incorrect The investor may experience highly unfavorable and perhapsdestructive investment results.
Incorrect Correct The investor may be able to survive, and eventually prosper,depending upon the form and amount of realized and unrealizedlosses vs. gains.
Correct Correct The investor may compound investment capital at advantageousrates of return.
Source: MSDW Private Wealth Management Asset Allocation Group.
-
35
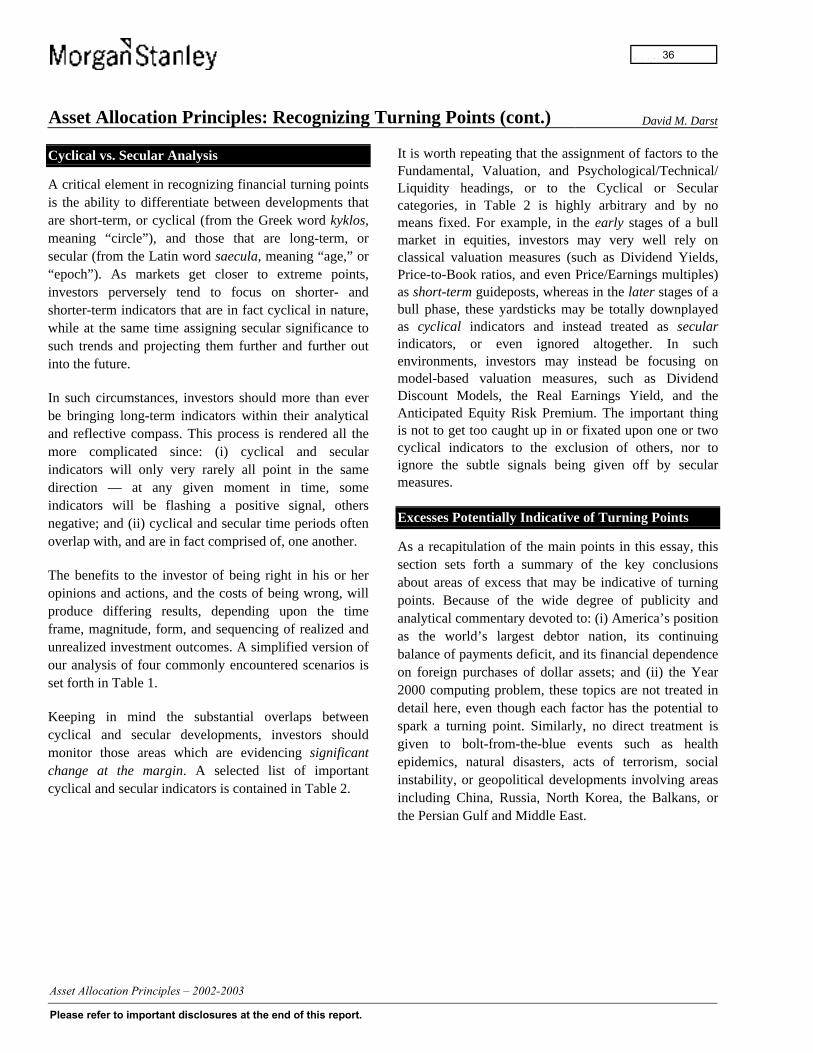
Asset Allocation Principles: Recognizing Turning Points (cont.) David M. Darst
Cyclical vs. Secular Analysis
A critical element in recognizing financial turning pointsis the ability to differentiate between developments thatare short-term, or cyclical (from the Greek word kyklos,meaning “circle”), and those that are long-term, orsecular (from the Latin word saecula, meaning “age,” or“epoch”). As markets get closer to extreme points,investors perversely tend to focus on shorter- andshorter-term indicators that are in fact cyclical in nature,while at the same time assigning secular significance tosuch trends and projecting them further and further outinto the future.
In such circumstances, investors should more than everbe bringing long-term indicators within their analyticaland reflective compass. This process is rendered all themore complicated since: (i) cyclical and secularindicators will only very rarely all point in the samedirection — at any given moment in time, someindicators will be flashing a positive signal, othersnegative; and (ii) cyclical and secular time periods oftenoverlap with, and are in fact comprised of, one another.
The benefits to the investor of being right in his or heropinions and actions, and the costs of being wrong, willproduce differing results, depending upon the timeframe, magnitude, form, and sequencing of realized andunrealized investment outcomes. A simplified version ofour analysis of four commonly encountered scenarios isset forth in Table 1.
Keeping in mind the substantial overlaps betweencyclical and secular developments, investors shouldmonitor those areas which are evidencing significantchange at the margin. A selected list of importantcyclical and secular indicators is contained in Table 2.
It is worth repeating that the assignment of factors to theFundamental, Valuation, and Psychological/Technical/Liquidity headings, or to the Cyclical or Secularcategories, in Table 2 is highly arbitrary and by nomeans fixed. For example, in the early stages of a bullmarket in equities, investors may very well rely onclassical valuation measures (such as Dividend Yields,Price-to-Book ratios, and even Price/Earnings multiples)as short-term guideposts, whereas in the later stages of abull phase, these yardsticks may be totally downplayedas cyclical indicators and instead treated as secularindicators, or even ignored altogether. In suchenvironments, investors may instead be focusing onmodel-based valuation measures, such as DividendDiscount Models, the Real Earnings Yield, and theAnticipated Equity Risk Premium. The important thingis not to get too caught up in or fixated upon one or twocyclical indicators to the exclusion of others, nor toignore the subtle signals being given off by secularmeasures.
Excesses Potentially Indicative of Turning Points
As a recapitulation of the main points in this essay, thissection sets forth a summary of the key conclusionsabout areas of excess that may be indicative of turningpoints. Because of the wide degree of publicity andanalytical commentary devoted to: (i) America’s positionas the world’s largest debtor nation, its continuingbalance of payments deficit, and its financial dependenceon foreign purchases of dollar assets; and (ii) the Year2000 computing problem, these topics are not treated indetail here, even though each factor has the potential tospark a turning point. Similarly, no direct treatment isgiven to bolt-from-the-blue events such as healthepidemics, natural disasters, acts of terrorism, socialinstability, or geopolitical developments involving areasincluding China, Russia, North Korea, the Balkans, orthe Persian Gulf and Middle East.
-
36
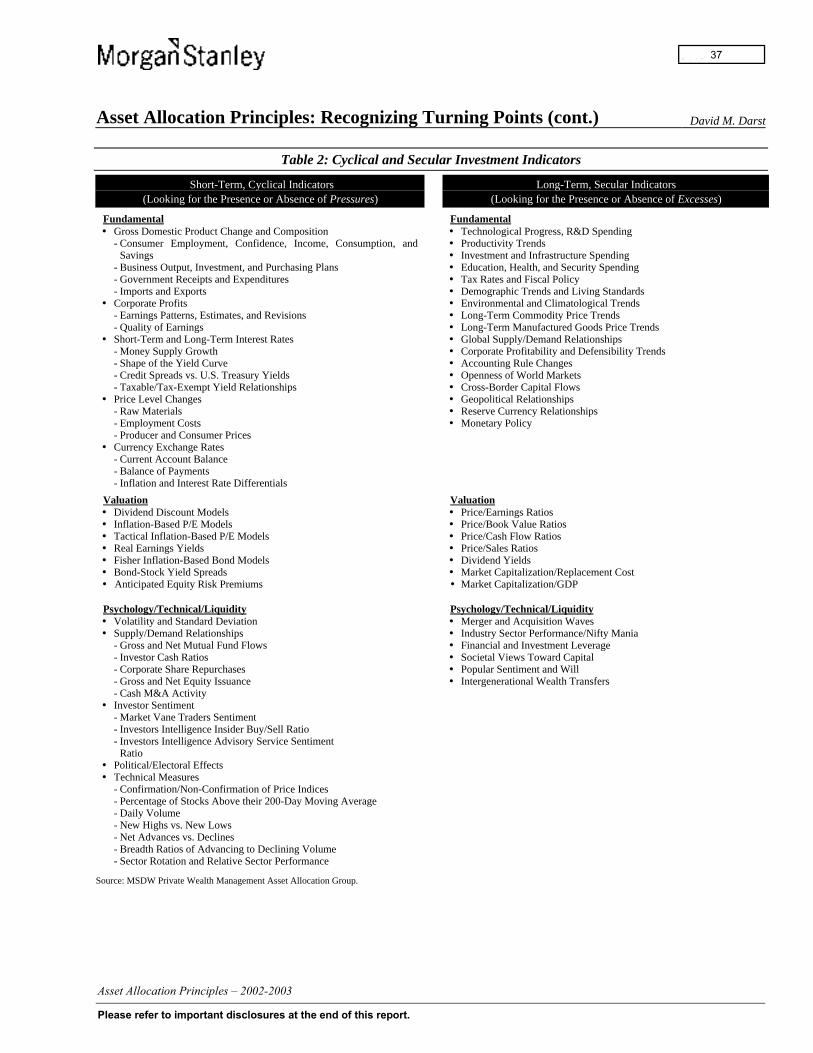
Asset Allocation Principles: Recognizing Turning Points (cont.) David M. Darst
Table 2: Cyclical and Secular Investment Indicators
Short-Term, Cyclical Indicators(Looking for the Presence or Absence of Pressures)
Long-Term, Secular Indicators(Looking for the Presence or Absence of Excesses)
Fundamental Fundamental� Gross Domestic Product Change and Composition
- Consumer Employment, Confidence, Income, Consumption, andSavings
- Business Output, Investment, and Purchasing Plans- Government Receipts and Expenditures- Imports and Exports
� Corporate Profits- Earnings Patterns, Estimates, and Revisions- Quality of Earnings
� Short-Term and Long-Term Interest Rates- Money Supply Growth- Shape of the Yield Curve- Credit Spreads vs. U.S. Treasury Yields- Taxable/Tax-Exempt Yield Relationships
� Price Level Changes- Raw Materials- Employment Costs- Producer and Consumer Prices
� Currency Exchange Rates- Current Account Balance- Balance of Payments- Inflation and Interest Rate Differentials
� Technological Progress, R&D Spending� Productivity Trends� Investment and Infrastructure Spending� Education, Health, and Security Spending� Tax Rates and Fiscal Policy� Demographic Trends and Living Standards� Environmental and Climatological Trends� Long-Term Commodity Price Trends� Long-Term Manufactured Goods Price Trends� Global Supply/Demand Relationships� Corporate Profitability and Defensibility Trends� Accounting Rule Changes� Openness of World Markets� Cross-Border Capital Flows� Geopolitical Relationships� Reserve Currency Relationships� Monetary Policy
Valuation Valuation� Dividend Discount Models� Inflation-Based P/E Models� Tactical Inflation-Based P/E Models� Real Earnings Yields� Fisher Inflation-Based Bond Models� Bond-Stock Yield Spreads� Anticipated Equity Risk Premiums
� Price/Earnings Ratios� Price/Book Value Ratios� Price/Cash Flow Ratios� Price/Sales Ratios� Dividend Yields� Market Capitalization/Replacement Cost� Market Capitalization/GDP
Psychology/Technical/Liquidity Psychology/Technical/Liquidity� Volatility and Standard Deviation� Supply/Demand Relationships
- Gross and Net Mutual Fund Flows- Investor Cash Ratios- Corporate Share Repurchases- Gross and Net Equity Issuance- Cash M&A Activity
� Investor Sentiment- Market Vane Traders Sentiment- Investors Intelligence Insider Buy/Sell Ratio- Investors Intelligence Advisory Service Sentiment
Ratio� Political/Electoral Effects� Technical Measures
- Confirmation/Non-Confirmation of Price Indices- Percentage of Stocks Above their 200-Day Moving Average- Daily Volume- New Highs vs. New Lows- Net Advances vs. Declines- Breadth Ratios of Advancing to Declining Volume- Sector Rotation and Relative Sector Performance
� Merger and Acquisition Waves� Industry Sector Performance/Nifty Mania� Financial and Investment Leverage� Societal Views Toward Capital� Popular Sentiment and Will� Intergenerational Wealth Transfers
Source: MSDW Private Wealth Management Asset Allocation Group.
-
37
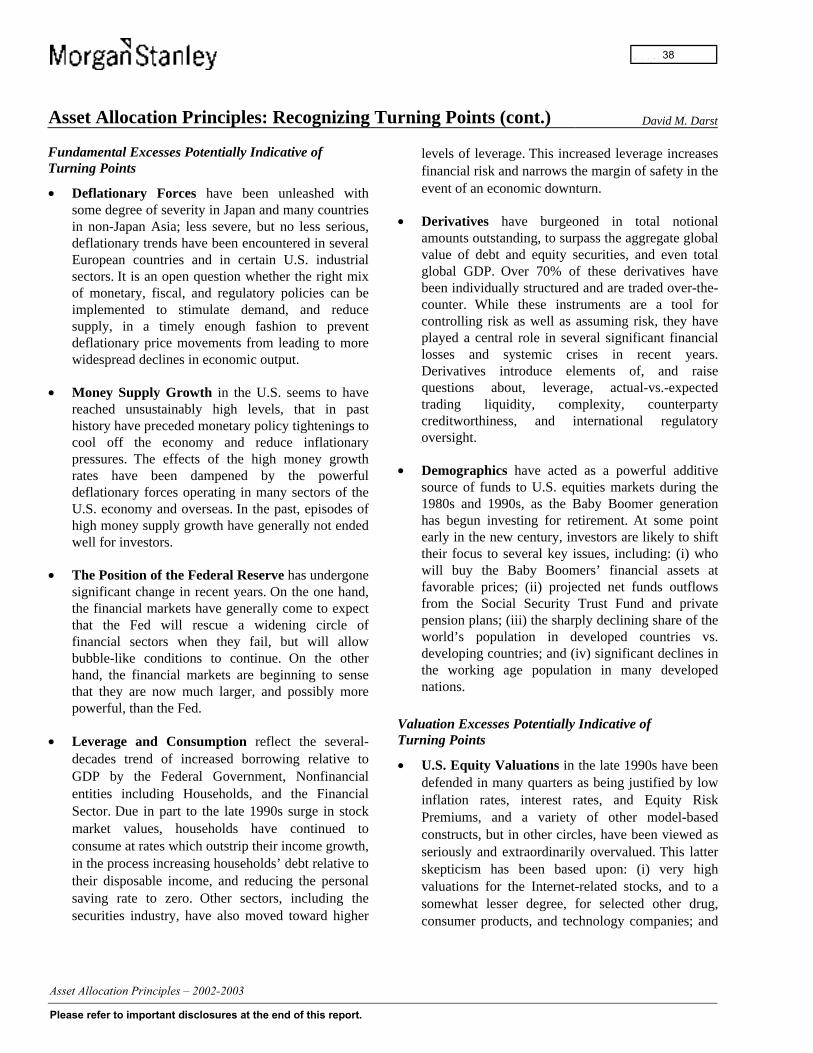
Asset Allocation Principles: Recognizing Turning Points (cont.) David M. Darst
Fundamental Excesses Potentially Indicative ofTurning Points
• Deflationary Forces have been unleashed withsome degree of severity in Japan and many countriesin non-Japan Asia; less severe, but no less serious,deflationary trends have been encountered in severalEuropean countries and in certain U.S. industrialsectors. It is an open question whether the right mixof monetary, fiscal, and regulatory policies can beimplemented to stimulate demand, and reducesupply, in a timely enough fashion to preventdeflationary price movements from leading to morewidespread declines in economic output.
• Money Supply Growth in the U.S. seems to havereached unsustainably high levels, that in pasthistory have preceded monetary policy tightenings tocool off the economy and reduce inflationarypressures. The effects of the high money growthrates have been dampened by the powerfuldeflationary forces operating in many sectors of theU.S. economy and overseas. In the past, episodes ofhigh money supply growth have generally not endedwell for investors.
• The Position of the Federal Reserve has undergonesignificant change in recent years. On the one hand,the financial markets have generally come to expectthat the Fed will rescue a widening circle offinancial sectors when they fail, but will allowbubble-like conditions to continue. On the otherhand, the financial markets are beginning to sensethat they are now much larger, and possibly morepowerful, than the Fed.
• Leverage and Consumption reflect the several-decades trend of increased borrowing relative toGDP by the Federal Government, Nonfinancialentities including Households, and the FinancialSector. Due in part to the late 1990s surge in stockmarket values, households have continued toconsume at rates which outstrip their income growth,in the process increasing households’ debt relative totheir disposable income, and reducing the personalsaving rate to zero. Other sectors, including thesecurities industry, have also moved toward higher
levels of leverage. This increased leverage increasesfinancial risk and narrows the margin of safety in theevent of an economic downturn.
• Derivatives have burgeoned in total notionalamounts outstanding, to surpass the aggregate globalvalue of debt and equity securities, and even totalglobal GDP. Over 70% of these derivatives havebeen individually structured and are traded over-the-counter. While these instruments are a tool forcontrolling risk as well as assuming risk, they haveplayed a central role in several significant financiallosses and systemic crises in recent years.Derivatives introduce elements of, and raisequestions about, leverage, actual-vs.-expectedtrading liquidity, complexity, counterpartycreditworthiness, and international regulatoryoversight.
• Demographics have acted as a powerful additivesource of funds to U.S. equities markets during the1980s and 1990s, as the Baby Boomer generationhas begun investing for retirement. At some pointearly in the new century, investors are likely to shifttheir focus to several key issues, including: (i) whowill buy the Baby Boomers’ financial assets atfavorable prices; (ii) projected net funds outflowsfrom the Social Security Trust Fund and privatepension plans; (iii) the sharply declining share of theworld’s population in developed countries vs.developing countries; and (iv) significant declines inthe working age population in many developednations.
Valuation Excesses Potentially Indicative ofTurning Points
• U.S. Equity Valuations in the late 1990s have beendefended in many quarters as being justified by lowinflation rates, interest rates, and Equity RiskPremiums, and a variety of other model-basedconstructs, but in other circles, have been viewed asseriously and extraordinarily overvalued. This latterskepticism has been based upon: (i) very highvaluations for the Internet-related stocks, and to asomewhat lesser degree, for selected other drug,consumer products, and technology companies; and
-
38
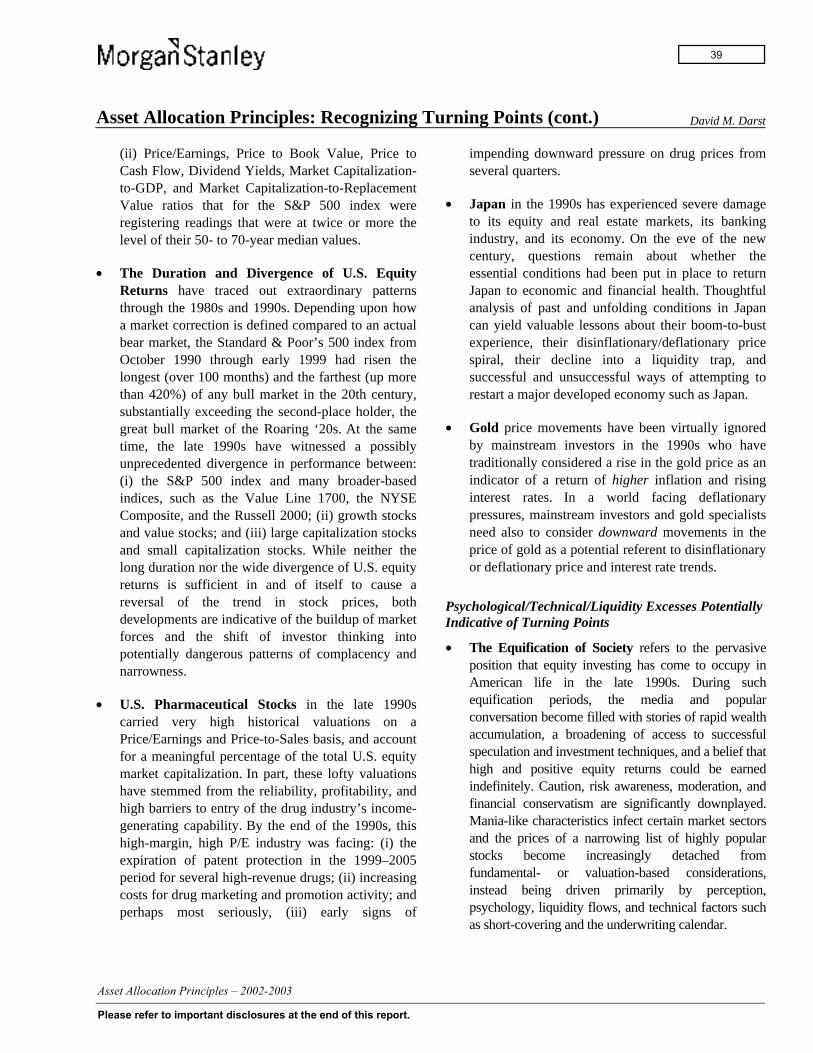
Asset Allocation Principles: Recognizing Turning Points (cont.) David M. Darst
(ii) Price/Earnings, Price to Book Value, Price toCash Flow, Dividend Yields, Market Capitalization-to-GDP, and Market Capitalization-to-ReplacementValue ratios that for the S&P 500 index wereregistering readings that were at twice or more thelevel of their 50- to 70-year median values.
• The Duration and Divergence of U.S. EquityReturns have traced out extraordinary patternsthrough the 1980s and 1990s. Depending upon howa market correction is defined compared to an actualbear market, the Standard & Poor’s 500 index fromOctober 1990 through early 1999 had risen thelongest (over 100 months) and the farthest (up morethan 420%) of any bull market in the 20th century,substantially exceeding the second-place holder, thegreat bull market of the Roaring ‘20s. At the sametime, the late 1990s have witnessed a possiblyunprecedented divergence in performance between:(i) the S&P 500 index and many broader-basedindices, such as the Value Line 1700, the NYSEComposite, and the Russell 2000; (ii) growth stocksand value stocks; and (iii) large capitalization stocksand small capitalization stocks. While neither thelong duration nor the wide divergence of U.S. equityreturns is sufficient in and of itself to cause areversal of the trend in stock prices, bothdevelopments are indicative of the buildup of marketforces and the shift of investor thinking intopotentially dangerous patterns of complacency andnarrowness.
• U.S. Pharmaceutical Stocks in the late 1990scarried very high historical valuations on aPrice/Earnings and Price-to-Sales basis, and accountfor a meaningful percentage of the total U.S. equitymarket capitalization. In part, these lofty valuationshave stemmed from the reliability, profitability, andhigh barriers to entry of the drug industry’s income-generating capability. By the end of the 1990s, thishigh-margin, high P/E industry was facing: (i) theexpiration of patent protection in the 1999–2005period for several high-revenue drugs; (ii) increasingcosts for drug marketing and promotion activity; andperhaps most seriously, (iii) early signs of
impending downward pressure on drug prices fromseveral quarters.
• Japan in the 1990s has experienced severe damageto its equity and real estate markets, its bankingindustry, and its economy. On the eve of the newcentury, questions remain about whether theessential conditions had been put in place to returnJapan to economic and financial health. Thoughtfulanalysis of past and unfolding conditions in Japancan yield valuable lessons about their boom-to-bustexperience, their disinflationary/deflationary pricespiral, their decline into a liquidity trap, andsuccessful and unsuccessful ways of attempting torestart a major developed economy such as Japan.
• Gold price movements have been virtually ignoredby mainstream investors in the 1990s who havetraditionally considered a rise in the gold price as anindicator of a return of higher inflation and risinginterest rates. In a world facing deflationarypressures, mainstream investors and gold specialistsneed also to consider downward movements in theprice of gold as a potential referent to disinflationaryor deflationary price and interest rate trends.
Psychological/Technical/Liquidity Excesses PotentiallyIndicative of Turning Points
• The Equification of Society refers to the pervasiveposition that equity investing has come to occupy inAmerican life in the late 1990s. During suchequification periods, the media and popularconversation become filled with stories of rapid wealthaccumulation, a broadening of access to successfulspeculation and investment techniques, and a belief thathigh and positive equity returns could be earnedindefinitely. Caution, risk awareness, moderation, andfinancial conservatism are significantly downplayed.Mania-like characteristics infect certain market sectorsand the prices of a narrowing list of highly popularstocks become increasingly detached fromfundamental- or valuation-based considerations,instead being driven primarily by perception,psychology, liquidity flows, and technical factors suchas short-covering and the underwriting calendar.
-
39
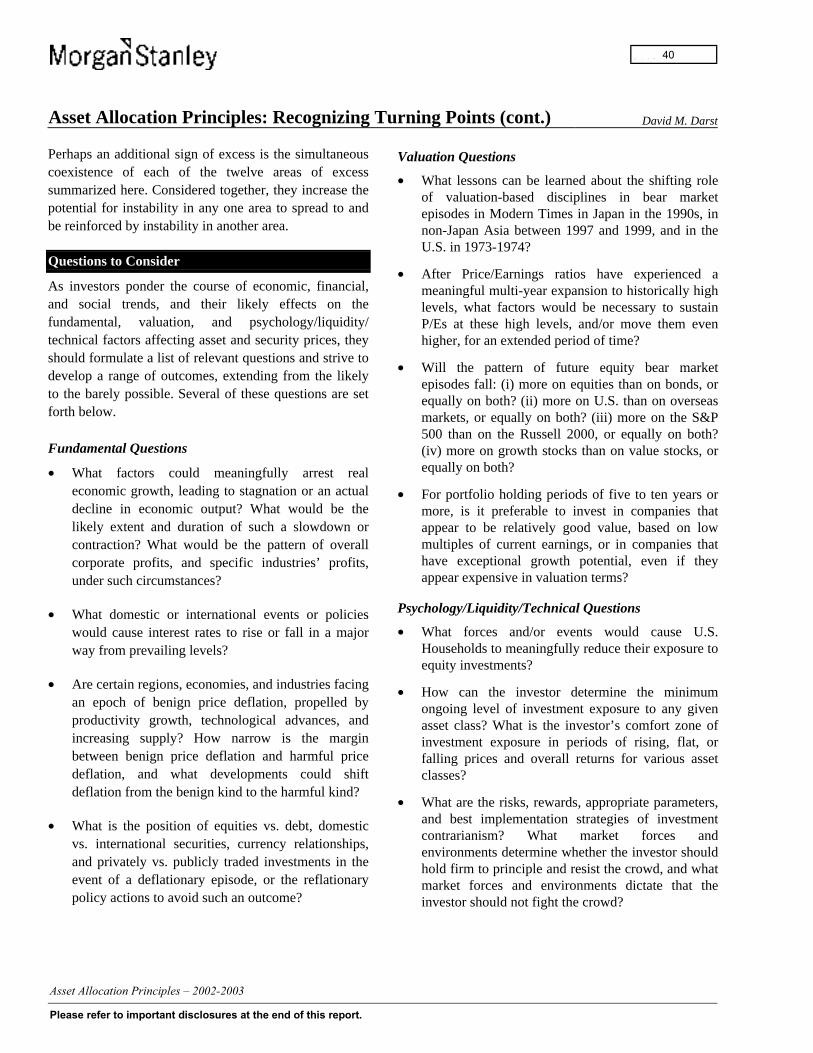
Asset Allocation Principles: Recognizing Turning Points (cont.) David M. Darst
Perhaps an additional sign of excess is the simultaneouscoexistence of each of the twelve areas of excesssummarized here. Considered together, they increase thepotential for instability in any one area to spread to andbe reinforced by instability in another area.
Questions to Consider
As investors ponder the course of economic, financial,and social trends, and their likely effects on thefundamental, valuation, and psychology/liquidity/technical factors affecting asset and security prices, theyshould formulate a list of relevant questions and strive todevelop a range of outcomes, extending from the likelyto the barely possible. Several of these questions are setforth below.
Fundamental Questions
• What factors could meaningfully arrest realeconomic growth, leading to stagnation or an actualdecline in economic output? What would be thelikely extent and duration of such a slowdown orcontraction? What would be the pattern of overallcorporate profits, and specific industries’ profits,under such circumstances?
• What domestic or international events or policieswould cause interest rates to rise or fall in a majorway from prevailing levels?
• Are certain regions, economies, and industries facingan epoch of benign price deflation, propelled byproductivity growth, technological advances, andincreasing supply? How narrow is the marginbetween benign price deflation and harmful pricedeflation, and what developments could shiftdeflation from the benign kind to the harmful kind?
• What is the position of equities vs. debt, domesticvs. international securities, currency relationships,and privately vs. publicly traded investments in theevent of a deflationary episode, or the reflationarypolicy actions to avoid such an outcome?
Valuation Questions
• What lessons can be learned about the shifting roleof valuation-based disciplines in bear marketepisodes in Modern Times in Japan in the 1990s, innon-Japan Asia between 1997 and 1999, and in theU.S. in 1973-1974?
• After Price/Earnings ratios have experienced ameaningful multi-year expansion to historically highlevels, what factors would be necessary to sustainP/Es at these high levels, and/or move them evenhigher, for an extended period of time?
• Will the pattern of future equity bear marketepisodes fall: (i) more on equities than on bonds, orequally on both? (ii) more on U.S. than on overseasmarkets, or equally on both? (iii) more on the S&P500 than on the Russell 2000, or equally on both?(iv) more on growth stocks than on value stocks, orequally on both?
• For portfolio holding periods of five to ten years ormore, is it preferable to invest in companies thatappear to be relatively good value, based on lowmultiples of current earnings, or in companies thathave exceptional growth potential, even if theyappear expensive in valuation terms?
Psychology/Liquidity/Technical Questions
• What forces and/or events would cause U.S.Households to meaningfully reduce their exposure toequity investments?
• How can the investor determine the minimumongoing level of investment exposure to any givenasset class? What is the investor’s comfort zone ofinvestment exposure in periods of rising, flat, orfalling prices and overall returns for various assetclasses?
• What are the risks, rewards, appropriate parameters,and best implementation strategies of investmentcontrarianism? What market forces andenvironments determine whether the investor shouldhold firm to principle and resist the crowd, and whatmarket forces and environments dictate that theinvestor should not fight the crowd?
-
40

Asset Allocation Principles: Recognizing Turning Points (cont.) David M. Darst
Closely related to the consideration of these and otherquestions is the concept of Scenario Analysis, which isthe consideration of the consequences and investmentimplications should various events, trends, and/orpolicies come to pass. A number of potential scenariosare treated in the following section.
Scenario Analysis
In looking for potential excesses that foretell majorturning points in financial markets, investors should keepin mind that the temporal length and percentage changeof an index price movement, in and of themselves, arenot sufficient to spark a reversal in trend. As a generalprinciple, a long upward or downward price movementcan be interrupted and perhaps sent in an new directionin one of three major ways: (i) through one or moremajor external shocks to the economic system orprevailing confidence levels; (ii) through the buildup andeventual denouement of significant internal imbalanceswithin an economy; and/or (iii) through monetary, fiscal,
trade, or other policy errors that have deleteriousconsequences for key sectors of a country’s, a region’s,or the worldwide economy.
Table 3 sets forth a number of potential scenarios,grouped into the categories of External Shocks, InternalImbalances, and Policy Errors.
It should be pointed out that the potential scenariosshown in Table 3 are by no means a complete listing ofpossible developments. We believe the usefulness ofsuch a list of possible scenarios stems from the advancereflection that an investor can devote to: (i) theanticipated effects of one or more of these (or other)outcomes on the short-term and long-term price behaviorof equities, fixed income securities, alternativeinvestments, cash, and currencies; and especiallyimportant, (ii) the likely response of central banks,regulators, governments, investors, and other financialmarket participants to a given scenario.
Table 3: Scenarios with Potentially Serious Consequences
External Shocks
• Debt rescheduling talks areinitiated and/or default is declaredby a major international borrower.
• Foreign investors execute large-scale sales of U.S. dollar-denominated financial assets.
• Tensions escalate toward widerarmed conflict in troubled regions.
• Confrontation spreads betweengovernments and financialmarkets.
• An export battle breaks outbetween China and other Asiancountries.
• Y2K problems and/or cyber-basedcomputer viruses disruptInformation Technology resources.
Internal Imbalances
• Large-scale losses are revealed inthe lending and/or derivativesmarkets.
• One or more large financialinstitutions declares insolvency.
• Highly valued equity marketsectors (such as Internet stocks)experience significant pricedeclines.
• Economic recovery fails to takehold in Japan, Russia, Brazil, orother important economies.
• Bad bank loans, amounting to 30–40% of GDP, lead to a bankingcrisis in China.
Policy Errors
• Excessive monetary liquidity isinjected (or suddenly withdrawn)worldwide, leading to significantasset price inflation (or deflation),and/or general price level inflation(or deflation).
• Major currency instability developsin the Yen, Euro, U.S. dollar,and/or other currencies.
• Governments adopt protectionistpolicies that restrict the flow ofgoods and/or capital.
Source: MSDW Private Wealth Management Asset Allocation Group.
-
41

Asset Allocation Principles: Structural Considerations David M. Darst
An often overlooked aspect of the asset allocationprocess concerns the form and structure in which theHigh Net Worth investor owns, controls, and ultimatelydisposes of his or her assets. For individual investors,how the assets are owned, conserved, should be asimportant as what assets are owned, what riskmanagement actions are taken, and what overallinvestment strategy is pursued. These structural concernsseem of greater consequence than ever before in atechnologically-advanced world that places a premiumon finding sound counsel, wise judgment, and prudentfinancial conduct. These qualities become more highlyprized as investors seek greater choice through openfinancial services architecture, greater conveniencethrough multiple access channels, and greater controlover expenses through unbundling and ease ofcomparison pricing. In general, it is to the investor’sbenefit to have assets compound: (i) over as long a timeas possible; (ii) in as tax-advantaged a format aspossible; and (iii) keeping investment-related expensesas constrained as possible.
The comments and guidelines contained in the followingparagraphs relative to tax and legal matters are intendedas background information. Morgan Stanley Dean Witterdoes not provide tax or other legal advice. Investorsshould consult with their own tax and legal advisors forany such advice.
Structural Considerations
To achieve their financial goals, and to build wealth, inthe last two decades, individual investors haveincreasingly embraced a number of tax-advantaged andother structures, including Individual RetirementAccounts, 401(k) plans, deferred compensationarrangements, fixed and variable annuities, custodialaccounts under the Uniform Gifts to Minors Act(UGMA) or the Uniform Transfer to Minors Act(UTMA), Educational IRAs, Series EE Savings Bonds,
and state-sponsored college tuition savings programsalso known as Section 529 Plans). In addition, to achievediversification and professional management, individualinvestors have utilized so-called consulting or wrapaccounts, which combine investor risk and returnobjective profiling, and asset allocation, with managerselection and monitoring. This process usually involvesan asset-based fee. More recently, taxable investors havebegun to pay attention to the tax advantages of: (i)purchasing securities directly, or having their assetsmanaged on a separate-account basis, rather than throughmutual funds; (ii) investing in mutual funds with so-called high tax-efficiency ratings (the percentage of amutual fund’s total returns that it retains after taxes); and(iii) owning special tax-managed mutual funds, whichseek to minimize fund holders’ tax bills. According toMorningstar Research, as of mid-1999, there were 56tax-managed mutual funds, with $18 billion in assets, upfrom only one such fund in 1988.
Tax-managed funds’ investment tactics, as well as thoseof tax-conscious separate-account managers andindividual equity investors, include: (i) a low-turnover,long-term buy-and-hold approach to investmentholdings; (ii) an orientation toward companies whoseannual returns are mainly in the form of capital gainsrather than dividends; and (iii) where appropriate, theoffsetting of realized capital gains through the judiciousrealization of capital losses within the same tax year.
Evolution of Individual Focus
It may be asserted that in recent times, many individualinvestors are in the process of, or are contemplating, animportant expansion in their financial thinking. Thistransformation follows in similar fashion the significantbroadening of individual investors’ earlier scope, from afocus purely on equity diversification, to a wider focus,encompassing asset allocation. This process is depictedin Exhibit 1.
-
42
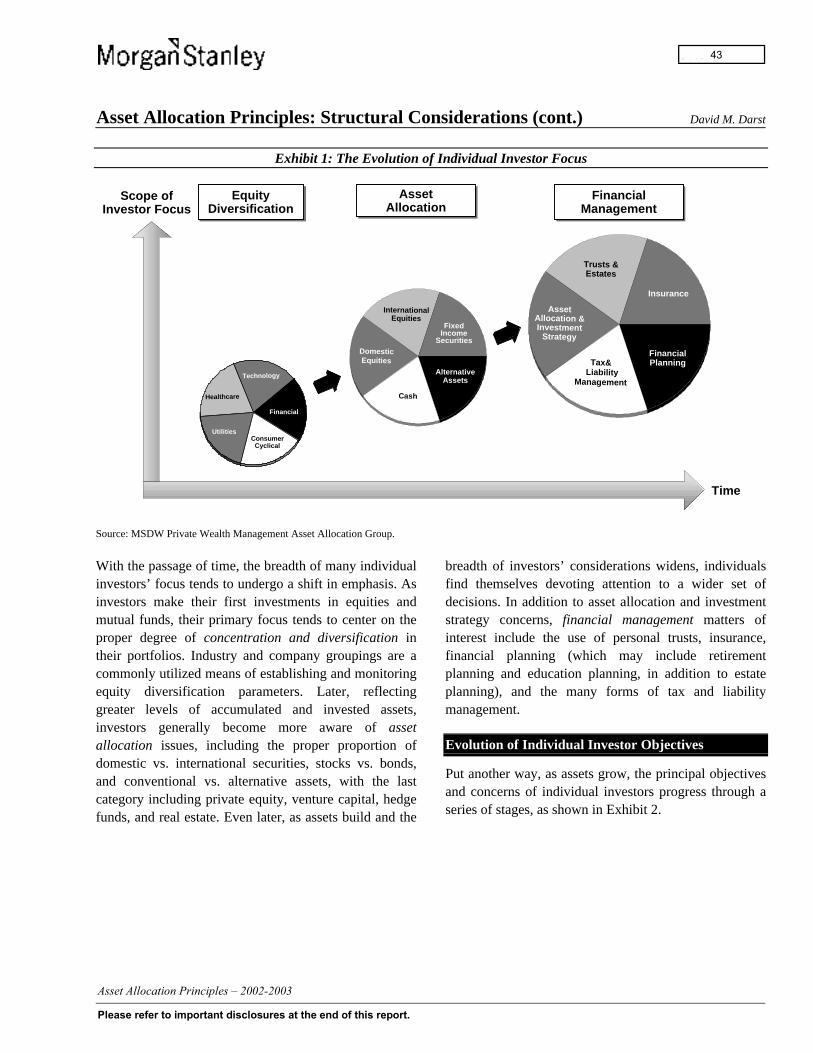
Asset Allocation Principles: Structural Considerations (cont.) David M. Darst
Exhibit 1: The Evolution of Individual Investor Focus
Scope ofInvestor Focus
Time
InternationalEquities
FixedIncome
Securities
AlternativeAssets
DomesticEquities
Cash
Trusts &Estates
Insurance
FinancialPlanning
AssetAllocation &Investment
Strategy
Tax& Liability
Management
EquityDiversification
EquityDiversification
FinancialManagement
FinancialManagement
AssetAllocation
AssetAllocation
Technology
ConsumerCyclical
Healthcare
Utilities
Financial
Source: MSDW Private Wealth Management Asset Allocation Group.
With the passage of time, the breadth of many individualinvestors’ focus tends to undergo a shift in emphasis. Asinvestors make their first investments in equities andmutual funds, their primary focus tends to center on theproper degree of concentration and diversification intheir portfolios. Industry and company groupings are acommonly utilized means of establishing and monitoringequity diversification parameters. Later, reflectinggreater levels of accumulated and invested assets,investors generally become more aware of assetallocation issues, including the proper proportion ofdomestic vs. international securities, stocks vs. bonds,and conventional vs. alternative assets, with the lastcategory including private equity, venture capital, hedgefunds, and real estate. Even later, as assets build and the
breadth of investors’ considerations widens, individualsfind themselves devoting attention to a wider set ofdecisions. In addition to asset allocation and investmentstrategy concerns, financial management matters ofinterest include the use of personal trusts, insurance,financial planning (which may include retirementplanning and education planning, in addition to estateplanning), and the many forms of tax and liabilitymanagement.
Evolution of Individual Investor Objectives
Put another way, as assets grow, the principal objectivesand concerns of individual investors progress through aseries of stages, as shown in Exhibit 2.
-
43
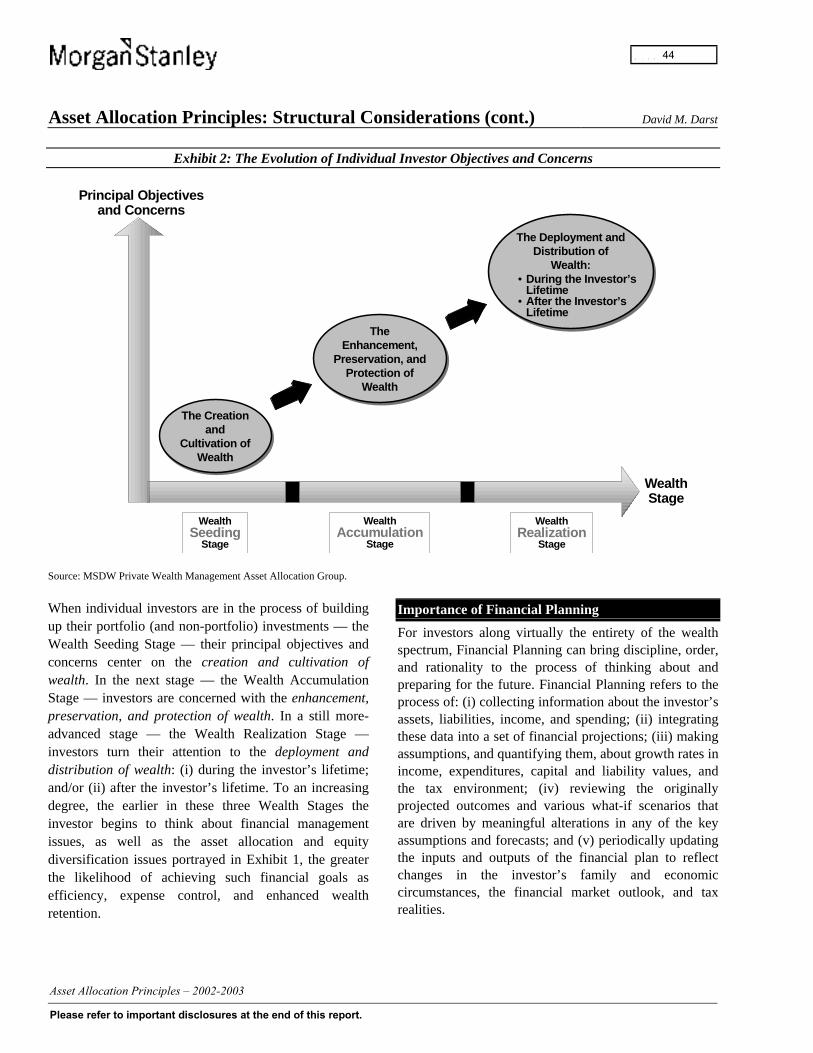
Asset Allocation Principles: Structural Considerations (cont.) David M. Darst
Exhibit 2: The Evolution of Individual Investor Objectives and Concerns
Principal Objectivesand Concerns
WealthStage
TheEnhancement,
Preservation, andProtection of
Wealth
TheEnhancement,
Preservation, andProtection of
Wealth
WealthAccumulation
Stage
The Deployment andDistribution of
Wealth:
The Deployment andDistribution of
Wealth:• During the Investor’s
Lifetime• After the Investor’s
Lifetime
WealthRealization
Stage
WealthSeeding
Stage
The Creationand
Cultivation ofWealth
The Creationand
Cultivation ofWealth
Source: MSDW Private Wealth Management Asset Allocation Group.
When individual investors are in the process of buildingup their portfolio (and non-portfolio) investments — theWealth Seeding Stage — their principal objectives andconcerns center on the creation and cultivation ofwealth. In the next stage — the Wealth AccumulationStage — investors are concerned with the enhancement,preservation, and protection of wealth. In a still more-advanced stage — the Wealth Realization Stage —investors turn their attention to the deployment anddistribution of wealth: (i) during the investor’s lifetime;and/or (ii) after the investor’s lifetime. To an increasingdegree, the earlier in these three Wealth Stages theinvestor begins to think about financial managementissues, as well as the asset allocation and equitydiversification issues portrayed in Exhibit 1, the greaterthe likelihood of achieving such financial goals asefficiency, expense control, and enhanced wealthretention.
Importance of Financial Planning
For investors along virtually the entirety of the wealthspectrum, Financial Planning can bring discipline, order,and rationality to the process of thinking about andpreparing for the future. Financial Planning refers to theprocess of: (i) collecting information about the investor’sassets, liabilities, income, and spending; (ii) integratingthese data into a set of financial projections; (iii) makingassumptions, and quantifying them, about growth rates inincome, expenditures, capital and liability values, andthe tax environment; (iv) reviewing the originallyprojected outcomes and various what-if scenarios thatare driven by meaningful alterations in any of the keyassumptions and forecasts; and (v) periodically updatingthe inputs and outputs of the financial plan to reflectchanges in the investor’s family and economiccircumstances, the financial market outlook, and taxrealities.
-
44
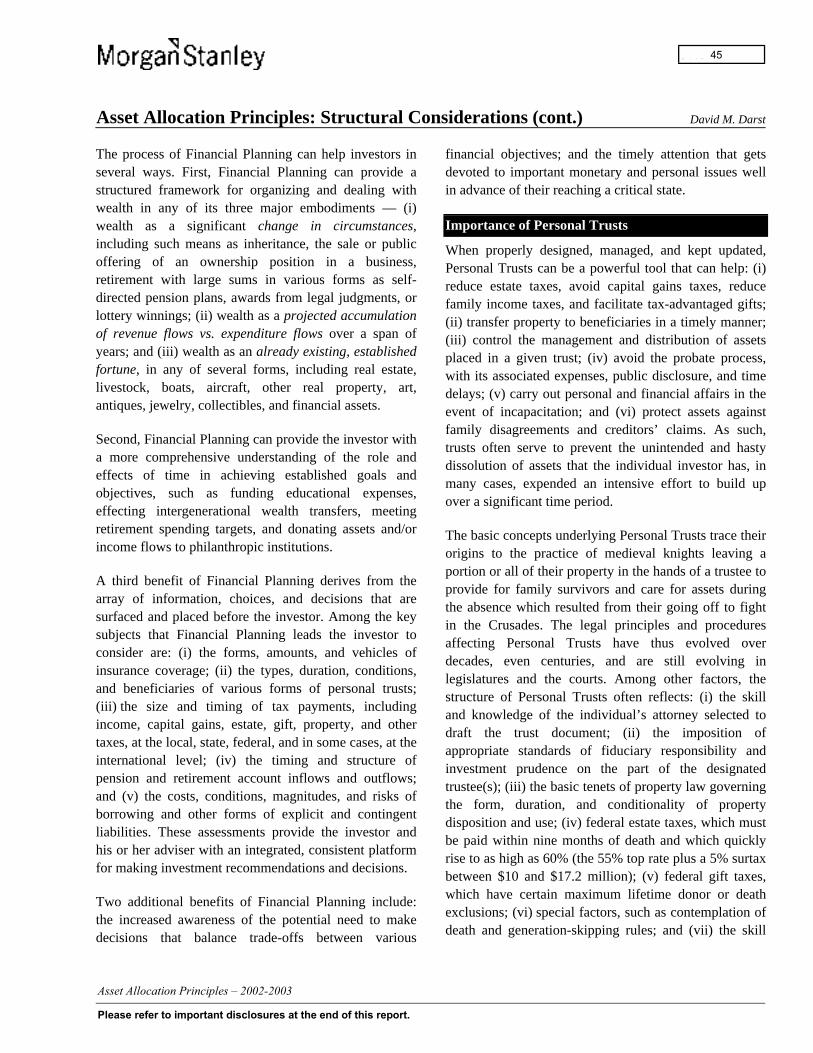
Asset Allocation Principles: Structural Considerations (cont.) David M. Darst
The process of Financial Planning can help investors inseveral ways. First, Financial Planning can provide astructured framework for organizing and dealing withwealth in any of its three major embodiments — (i)wealth as a significant change in circumstances,including such means as inheritance, the sale or publicoffering of an ownership position in a business,retirement with large sums in various forms as self-directed pension plans, awards from legal judgments, orlottery winnings; (ii) wealth as a projected accumulationof revenue flows vs. expenditure flows over a span ofyears; and (iii) wealth as an already existing, establishedfortune, in any of several forms, including real estate,livestock, boats, aircraft, other real property, art,antiques, jewelry, collectibles, and financial assets.
Second, Financial Planning can provide the investor witha more comprehensive understanding of the role andeffects of time in achieving established goals andobjectives, such as funding educational expenses,effecting intergenerational wealth transfers, meetingretirement spending targets, and donating assets and/orincome flows to philanthropic institutions.
A third benefit of Financial Planning derives from thearray of information, choices, and decisions that aresurfaced and placed before the investor. Among the keysubjects that Financial Planning leads the investor toconsider are: (i) the forms, amounts, and vehicles ofinsurance coverage; (ii) the types, duration, conditions,and beneficiaries of various forms of personal trusts;(iii) the size and timing of tax payments, includingincome, capital gains, estate, gift, property, and othertaxes, at the local, state, federal, and in some cases, at theinternational level; (iv) the timing and structure ofpension and retirement account inflows and outflows;and (v) the costs, conditions, magnitudes, and risks ofborrowing and other forms of explicit and contingentliabilities. These assessments provide the investor andhis or her adviser with an integrated, consistent platformfor making investment recommendations and decisions.
Two additional benefits of Financial Planning include:the increased awareness of the potential need to makedecisions that balance trade-offs between various
financial objectives; and the timely attention that getsdevoted to important monetary and personal issues wellin advance of their reaching a critical state.
Importance of Personal Trusts
When properly designed, managed, and kept updated,Personal Trusts can be a powerful tool that can help: (i)reduce estate taxes, avoid capital gains taxes, reducefamily income taxes, and facilitate tax-advantaged gifts;(ii) transfer property to beneficiaries in a timely manner;(iii) control the management and distribution of assetsplaced in a given trust; (iv) avoid the probate process,with its associated expenses, public disclosure, and timedelays; (v) carry out personal and financial affairs in theevent of incapacitation; and (vi) protect assets againstfamily disagreements and creditors’ claims. As such,trusts often serve to prevent the unintended and hastydissolution of assets that the individual investor has, inmany cases, expended an intensive effort to build upover a significant time period.
The basic concepts underlying Personal Trusts trace theirorigins to the practice of medieval knights leaving aportion or all of their property in the hands of a trustee toprovide for family survivors and care for assets duringthe absence which resulted from their going off to fightin the Crusades. The legal principles and proceduresaffecting Personal Trusts have thus evolved overdecades, even centuries, and are still evolving inlegislatures and the courts. Among other factors, thestructure of Personal Trusts often reflects: (i) the skilland knowledge of the individual’s attorney selected todraft the trust document; (ii) the imposition ofappropriate standards of fiduciary responsibility andinvestment prudence on the part of the designatedtrustee(s); (iii) the basic tenets of property law governingthe form, duration, and conditionality of propertydisposition and use; (iv) federal estate taxes, which mustbe paid within nine months of death and which quicklyrise to as high as 60% (the 55% top rate plus a 5% surtaxbetween $10 and $17.2 million); (v) federal gift taxes,which have certain maximum lifetime donor or deathexclusions; (vi) special factors, such as contemplation ofdeath and generation-skipping rules; and (vii) the skill
-
45

Asset Allocation Principles: Structural Considerations (cont.) David M. Darst
and capabilities of the trustee(s) chosen to administerand invest the trust.
Personal Trusts can be divided into two groups: (i) livingtrusts, created during the individual’s lifetime; and (ii)testamentary trusts, created under the individual’s willand which take effect only upon his or her death. Inaddition, Personal Trusts can be: (i) revocable trusts,which allow individuals to transfer property to a trust,modify the terms of the trust, change the beneficiaries orthe trust+ee of the trust, and even revoke the terms of thetrust at any time while they are alive; or (ii) irrevocabletrusts, which do not allow the terms of the trust to bechanged nor its assets returned to the donor once thetrust has been established. Individuals who useirrevocable trusts are generally willing to accept someloss of control of assets in order to take advantage of gift
tax exclusions and to avoid, reduce, or defer federalestate taxes.
A selection of types and uses of Personal Trusts is setforth in Exhibit 3.
It is worth noting that the brief descriptions of certainfeatures, types, and uses of the trusts in Exhibit 3 �Charitable Trusts; Grantor Retained Trusts; Dynasty,Crummy, and Life Insurance Trusts; Marital and CreditShelter Trusts; and Children’s and Special Needs Trusts����������������� ������������������������������all, of the ways in which they can be and have been usedby individuals in tax planning, estate planning, andcharitable giving. Investors should consult their ownattorney for specific advice in the proper uses ofPersonal Trusts within their estate or financial plan.
Exhibit 3: Selected Types and Uses of Personal Trusts
• Similar to a Charitable RemainderTrust, except the charity receives theannual income, and other individualbeneficiaries receive the assets.
• Trust receives charitable deductioneach year for its distributions tocharity.
Charitable TrustsCharitable Trusts
Charitable Remainder Trust(CRT)
• Tax-exempt irrevocable trust.• Highly appreciated assets may be
sold by the trustee free of capital gainstaxes.
• Beneficiary receives annual payment,charity receives the assets at the endof the trust's term.
• Assets transferred to a CRT areentitled to a current year tax deductionand reduce the donor's net estate.
Charitable Lead Trust(CLT)
Charitable RemainderAnnuity Trust (CRAT)
Charitable Remainder Unitrust(CRUT)
Net Income Makeup CharitableRemainder Unitrust (NIMCRUT)
Grantor RetainedTrusts
Grantor RetainedTrusts
Grantor Retained Annuity Trust(GRAT)
• Payments from the trust asset goesto designated recipients for aspecified time period.
• Unlike a CRT, all assets eventuallytransfer to beneficiaries.
• Trust freezes the value of the assetsfor tax purposes at their worthwhen the trust is established.
• Securities or other assets that arelikely to appreciate are often usedto fund a GRAT.
• Can reduce estate taxes if donorsurvives the term of the trust and iftrust assets appreciate at a rategreater than IRS projections.
Grantor Retained Unitrust(GRUT)
• Similar to a GRAT, except theannual payments are set as afixed percentage of the year-endmarket value revalued annuallyrather than as a fixed percentageof the initial market value at thetime the trust was funded.
Dynasty, Crummy, andLife Insurance Trusts
Dynasty, Crummy, andLife Insurance Trusts
Life Insurance Trust
• A Crummy Trust thatpurchases life insurance onthe grantor’s life. In aproperly structured trust, thelife insurance death benefitpasses income and estate taxfree to the beneficiaries.
• Existing life insurancepolicies can be gifted to a lifeinsurance trust in order toremove the death proceedsfrom the owner’s estate.
Credit Shelter Trust
• Assets placed in this trust areusually equal to the applicablefederal credit amount.
• Enables the trust grantor and hisor her spouse to maximize thefederal applicable exclusionavailable to each party.
• Upon the death of the survivingspouse, designated beneficiariescan continue to receive incomepayments or the trust's assetsoutright.
Marital and Credit ShelterTrusts
Marital and Credit ShelterTrusts
Qualified Terminal InterestProperty Trust (QTIP)
• Allows the grantor to providelifetime income for his or hersurviving spouse and control theultimate distribution of the trust'sassets for selected beneficiaries.
• Often used to ensure that if thesurviving spouse remarries, he/shecannot disinherit the children fromthe first marriage.
Qualified Personal ResidenceTrust (QPRT)
Children’s andSpecial Needs Trusts
Children’s andSpecial Needs Trusts
2503(b) Trust
• Trust income must be paidto the child and cannot beaccumulated.
• Principal passes to the childat a future date specified inthe trust.
• Often funded with $10,000gifts exempted from gift taxby the annual exclusion.
Special Needs Trust
• Allows a disabled child orfamily member to receivefinancial supportspecifically earmarked tosupplement, rather thansupplant, governmentassistance programs.
• Properly utilized, thebeneficiary can still qualifyfor SSI disability benefits.
• The annual payments from this CRTare equal to a fixed percentage of thetrust assets when established.
• The annual payments from this CRTare equal to a percentage of trustassets revalued annually.
• The annual payments from this CRTare equal to the lesser of the trust netincome or a percentage of assetsrevalued annually.
Qualified Domestic Trust
• Gifts to the trust for a non-residentalien spouse qualify for the estatetax marital deduction and upondeath of NRA spouse, the assetsgo to other beneficiaries.
2503(c) Trust
• Similar to the 2503(b) trustexcept that income may beaccumulated.
• In return for this right, thechild must have access to theprincipal when he/she turnsage 21.
Dynasty Trust
• An irrevocable trust designed topass wealth to multiplegenerations while removing theassets from future estate andgeneration-skipping taxes.
• Dynasty trust provisions can beadded to many kinds of trustsincluding Credit Shelter,Crummy, and Life InsuranceTrusts.
Crummy Trust
• An irrevocable trust designedto allow grantors to takeadvantage of the annual$10,000 per recipient gift taxexclusion.
• Most attractive to marriedcouples with manybeneficiaries.
• Trust holds title to the grantor’shome or vacation home for aselected number of rent-free years,after which the trust terminates andthe home is transferred to thebeneficiaries.
• Grantor can continue to live in thehome if rent is paid.
• Enables the grantor to make a giftof a valuable asset at a substantialdiscount in gift taxes.
Source: MSDW Private Wealth Management Asset Allocation Group.
-
46
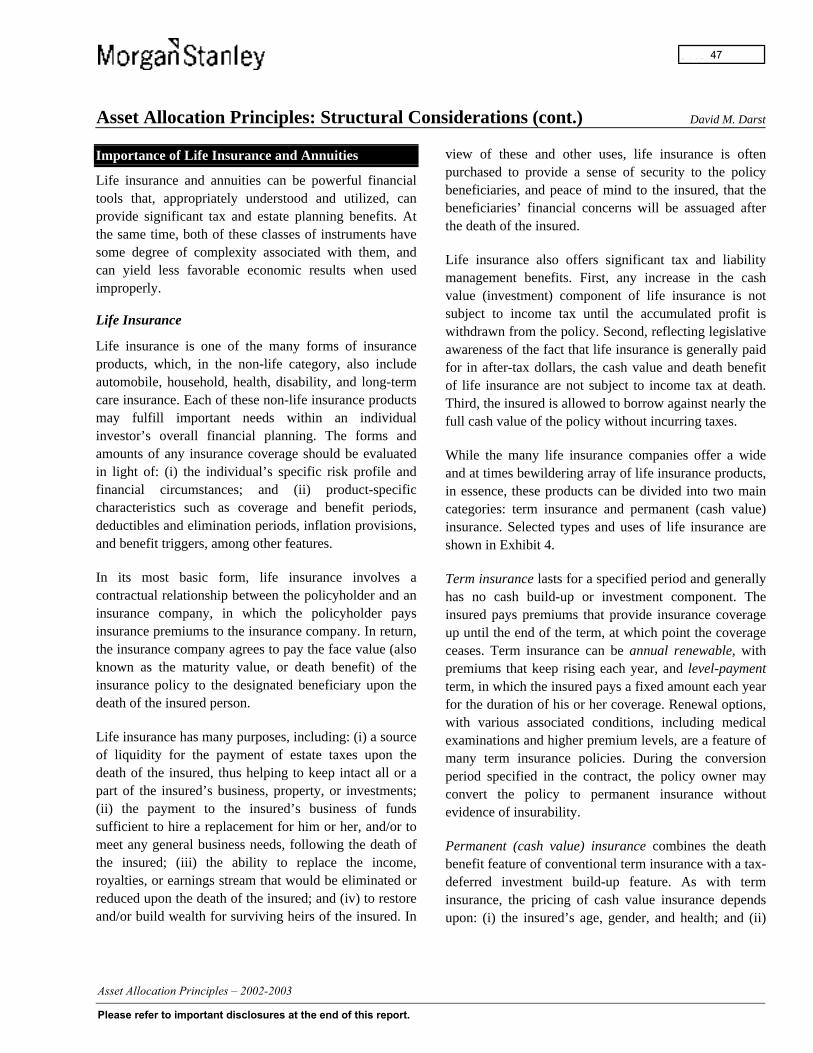
Asset Allocation Principles: Structural Considerations (cont.) David M. Darst
Importance of Life Insurance and Annuities
Life insurance and annuities can be powerful financialtools that, appropriately understood and utilized, canprovide significant tax and estate planning benefits. Atthe same time, both of these classes of instruments havesome degree of complexity associated with them, andcan yield less favorable economic results when usedimproperly.
Life Insurance
Life insurance is one of the many forms of insuranceproducts, which, in the non-life category, also includeautomobile, household, health, disability, and long-termcare insurance. Each of these non-life insurance productsmay fulfill important needs within an individualinvestor’s overall financial planning. The forms andamounts of any insurance coverage should be evaluatedin light of: (i) the individual’s specific risk profile andfinancial circumstances; and (ii) product-specificcharacteristics such as coverage and benefit periods,deductibles and elimination periods, inflation provisions,and benefit triggers, among other features.
In its most basic form, life insurance involves acontractual relationship between the policyholder and aninsurance company, in which the policyholder paysinsurance premiums to the insurance company. In return,the insurance company agrees to pay the face value (alsoknown as the maturity value, or death benefit) of theinsurance policy to the designated beneficiary upon thedeath of the insured person.
Life insurance has many purposes, including: (i) a sourceof liquidity for the payment of estate taxes upon thedeath of the insured, thus helping to keep intact all or apart of the insured’s business, property, or investments;(ii) the payment to the insured’s business of fundssufficient to hire a replacement for him or her, and/or tomeet any general business needs, following the death ofthe insured; (iii) the ability to replace the income,royalties, or earnings stream that would be eliminated orreduced upon the death of the insured; and (iv) to restoreand/or build wealth for surviving heirs of the insured. In
view of these and other uses, life insurance is oftenpurchased to provide a sense of security to the policybeneficiaries, and peace of mind to the insured, that thebeneficiaries’ financial concerns will be assuaged afterthe death of the insured.
Life insurance also offers significant tax and liabilitymanagement benefits. First, any increase in the cashvalue (investment) component of life insurance is notsubject to income tax until the accumulated profit iswithdrawn from the policy. Second, reflecting legislativeawareness of the fact that life insurance is generally paidfor in after-tax dollars, the cash value and death benefitof life insurance are not subject to income tax at death.Third, the insured is allowed to borrow against nearly thefull cash value of the policy without incurring taxes.
While the many life insurance companies offer a wideand at times bewildering array of life insurance products,in essence, these products can be divided into two maincategories: term insurance and permanent (cash value)insurance. Selected types and uses of life insurance areshown in Exhibit 4.
Term insurance lasts for a specified period and generallyhas no cash build-up or investment component. Theinsured pays premiums that provide insurance coverageup until the end of the term, at which point the coverageceases. Term insurance can be annual renewable, withpremiums that keep rising each year, and level-paymentterm, in which the insured pays a fixed amount each yearfor the duration of his or her coverage. Renewal options,with various associated conditions, including medicalexaminations and higher premium levels, are a feature ofmany term insurance policies. During the conversionperiod specified in the contract, the policy owner mayconvert the policy to permanent insurance withoutevidence of insurability.
Permanent (cash value) insurance combines the deathbenefit feature of conventional term insurance with a tax-deferred investment build-up feature. As with terminsurance, the pricing of cash value insurance dependsupon: (i) the insured’s age, gender, and health; and (ii)
-
47
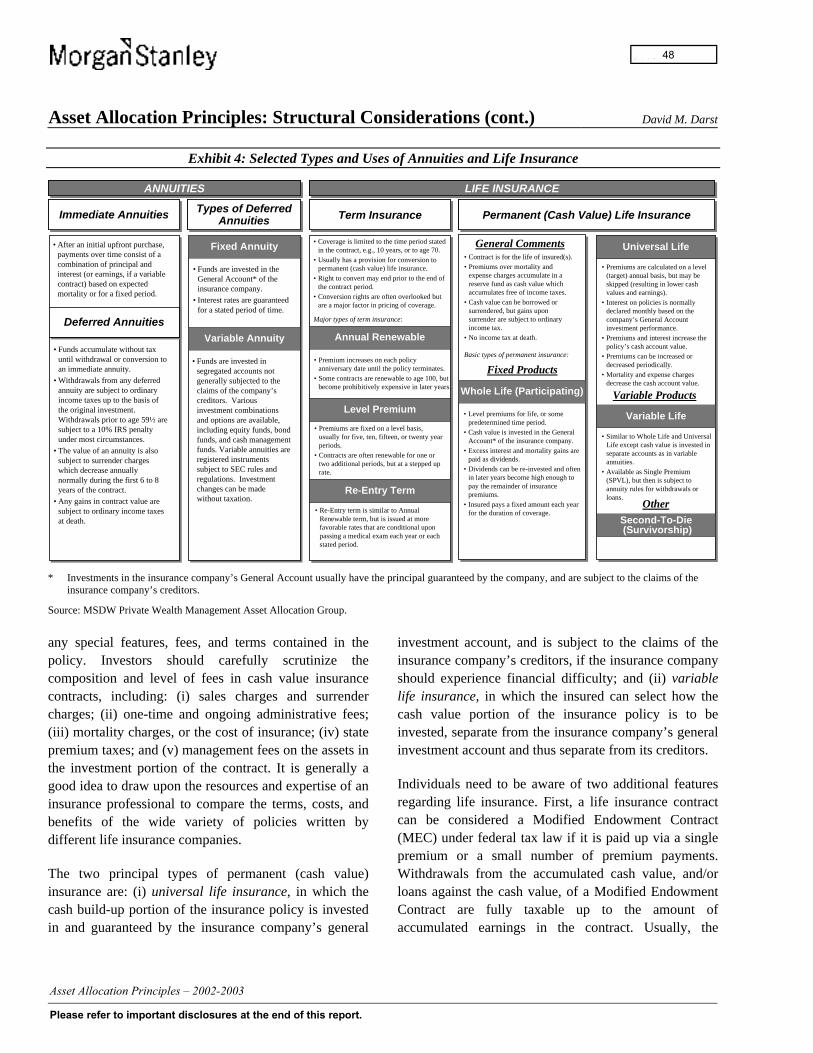
Asset Allocation Principles: Structural Considerations (cont.) David M. Darst
Exhibit 4: Selected Types and Uses of Annuities and Life Insurance
• Funds are invested in theGeneral Account* of theinsurance company.
• Interest rates are guaranteedfor a stated period of time.
• Funds accumulate without taxuntil withdrawal or conversion toan immediate annuity.
• Withdrawals from any deferredannuity are subject to ordinaryincome taxes up to the basis ofthe original investment.Withdrawals prior to age 59½ aresubject to a 10% IRS penaltyunder most circumstances.
• The value of an annuity is alsosubject to surrender chargeswhich decrease annuallynormally during the first 6 to 8years of the contract.
• Any gains in contract value aresubject to ordinary income taxesat death.
• After an initial upfront purchase,payments over time consist of acombination of principal andinterest (or earnings, if a variablecontract) based on expectedmortality or for a fixed period.
Term InsuranceTerm Insurance
Annual Renewable
Level Premium
Re-Entry Term
Permanent (Cash Value) Life InsurancePermanent (Cash Value) Life Insurance
Universal Life
Immediate AnnuitiesImmediate Annuities
Deferred AnnuitiesDeferred Annuities
LIFE INSURANCELIFE INSURANCEANNUITIESANNUITIES
Types of DeferredAnnuities
Types of DeferredAnnuities
General Comments
Term InsuranceTerm Insurance
Annual Renewable
• Premium increases on each policyanniversary date until the policy terminates.
• Some contracts are renewable to age 100, butbecome prohibitively expensive in later years.
Level Premium
Re-Entry Term
Permanent (Cash Value) Life InsurancePermanent (Cash Value) Life Insurance
Whole Life (Participating)
• Level premiums for life, or somepredetermined time period.
• Cash value is invested in the GeneralAccount* of the insurance company.
• Excess interest and mortality gains arepaid as dividends.
• Dividends can be re-invested and oftenin later years become high enough topay the remainder of insurancepremiums.
• Insured pays a fixed amount each yearfor the duration of coverage.
Universal Life
• Premiums are calculated on a level(target) annual basis, but may beskipped (resulting in lower cashvalues and earnings).
• Interest on policies is normallydeclared monthly based on thecompany’s General Accountinvestment performance.
• Premiums and interest increase thepolicy’s cash account value.
• Premiums can be increased ordecreased periodically.
• Mortality and expense chargesdecrease the cash account value.
Immediate AnnuitiesImmediate Annuities
Variable Life
• Similar to Whole Life and UniversalLife except cash value is invested inseparate accounts as in variableannuities.
• Available as Single Premium(SPVL), but then is subject toannuity rules for withdrawals orloans.
Second-To-Die (Survivorship)
Deferred AnnuitiesVariable Annuity
LIFE INSURANCELIFE INSURANCE
• Premiums are fixed on a level basis,usually for five, ten, fifteen, or twenty yearperiods.
• Contracts are often renewable for one ortwo additional periods, but at a stepped uprate.
ANNUITIESANNUITIES
• Funds are invested insegregated accounts notgenerally subjected to theclaims of the company’screditors. Variousinvestment combinationsand options are available,including equity funds, bondfunds, and cash managementfunds. Variable annuities areregistered instrumentssubject to SEC rules andregulations. Investmentchanges can be madewithout taxation.
Fixed Annuity • Coverage is limited to the time period statedin the contract, e.g., 10 years, or to age 70.
• Usually has a provision for conversion topermanent (cash value) life insurance.
• Right to convert may end prior to the end ofthe contract period.
• Conversion rights are often overlooked butare a major factor in pricing of coverage.
Major types of term insurance:
• Re-Entry term is similar to AnnualRenewable term, but is issued at morefavorable rates that are conditional uponpassing a medical exam each year or eachstated period.
• Contract is for the life of insured(s).• Premiums over mortality and
expense charges accumulate in areserve fund as cash value whichaccumulates free of income taxes.
• Cash value can be borrowed orsurrendered, but gains uponsurrender are subject to ordinaryincome tax.
• No income tax at death.
Basic types of permanent insurance:
Variable Products
Other
Types of DeferredAnnuities
Types of DeferredAnnuities
Fixed Products
* Investments in the insurance company’s General Account usually have the principal guaranteed by the company, and are subject to the claims of theinsurance company’s creditors.
Source: MSDW Private Wealth Management Asset Allocation Group.
any special features, fees, and terms contained in thepolicy. Investors should carefully scrutinize thecomposition and level of fees in cash value insurancecontracts, including: (i) sales charges and surrendercharges; (ii) one-time and ongoing administrative fees;(iii) mortality charges, or the cost of insurance; (iv) statepremium taxes; and (v) management fees on the assets inthe investment portion of the contract. It is generally agood idea to draw upon the resources and expertise of aninsurance professional to compare the terms, costs, andbenefits of the wide variety of policies written bydifferent life insurance companies.
The two principal types of permanent (cash value)insurance are: (i) universal life insurance, in which thecash build-up portion of the insurance policy is investedin and guaranteed by the insurance company’s general
investment account, and is subject to the claims of theinsurance company’s creditors, if the insurance companyshould experience financial difficulty; and (ii) variablelife insurance, in which the insured can select how thecash value portion of the insurance policy is to beinvested, separate from the insurance company’s generalinvestment account and thus separate from its creditors.
Individuals need to be aware of two additional featuresregarding life insurance. First, a life insurance contractcan be considered a Modified Endowment Contract(MEC) under federal tax law if it is paid up via a singlepremium or a small number of premium payments.Withdrawals from the accumulated cash value, and/orloans against the cash value, of a Modified EndowmentContract are fully taxable up to the amount ofaccumulated earnings in the contract. Usually, the
-
48
Asset Allocation Principles: Structural Considerations (cont.) David M. Darst
insured needs to reach paid-up status in no shorter a timeperiod than a certain number of years (determined byvarious complex calculation methodologies), in order toavoid having his or her life insurance policy classified asan MEC.
Second, the life insurance proceeds (the net deathbenefit) will be included in the insured’s estate: (i) if theestate is named as the life insurance beneficiary; (ii) ifthe death benefit is earmarked through documents, suchas a trust, to pay off a liability otherwise payable by theestate, including estate taxes; or (iii) if the insured holdsat death or within three years of death the right to receiveor control the economic benefits of the life insurancepolicy, its proceeds, or its cash value (known as incidentsof ownership).
Annuities
An annuity is defined as either a fixed and/or a variablestream of payments at specified time intervals, inconsideration of a stipulated premium paid either in priorinstallment payments or in a single payment. Annuitiescan be classified as either immediate or deferred.Immediate annuities are those that begin annuitypayments currently or immediately. Deferred annuities,offered primarily by life insurance companies: (i) allowthe tax-deferred compounding of the underlyinginvestment, with a 10 percent IRS penalty forwithdrawals of earnings before age 59½ (with exceptionsfor death, disability, and lifetime level payments); and(ii) generally carry a death benefit, which reimburse anannuity owner’s beneficiaries for the account value ofthe annuity contract should the annuity owner die duringthe term of the annuity.
Fixed annuities pay a set percentage of the investment,determined by yield levels prevailing at the time theannuity contract is purchased. Variable annuities’ returnsvary according to the annuity buyer’s investmentselections, ranging from equity funds, to bond funds, tomoney market funds, and known as subaccounts. Tax-free switching is allowed for variable annuity ownerswho wish to shift their investments from one subaccount
to another. Some of the features of fixed and variableannuities are shown in Exhibit 4.
Variable annuities’ tax-deferred status has made them apopular investment vehicle for individual investors in thesecond half of the 1990s. In deciding whether to takeadvantage of annuities’ tax-deferred compoundingbenefits, investors should analyze the potential taxsavings offered by annuities compared with the variousfees and restrictions placed on annuities. Annuities maycarry surrender charges, which require investors to payto the insurer a percentage of their annuity investment ifthey decide to surrender the annuity, generally within thefirst six to ten years of buying it. For a seven-yearsurrender charge structure, the surrender charge isusually 7% in the first year, declining by a percentagepoint each year to zero percent by the eighth year.
Sales expenses, or loads, can be either back-end or front-end, as with mutual funds, but these charges generallytend to be higher than sales charges on mutual funds.The relatively high expense levels associated withannuities imply that their tax deferral benefits areworthwhile if the investor holds on to the annuity for along enough time to defray the surrender charges andother expenses. In short, the investor should investigateand quantify the trade-off between (i) the deferral ofcapital gains and ordinary income taxes; and (ii) theannuity’s surrender charges, other contract expenses, andany taxes and penalties imposed on early withdrawals.
Variable annuities often offer enhanced death benefitsand, in some cases, living benefits. Most variableannuities guarantee a minimum death benefit equal to theaccount value or the original principal, whichever ishigher. This basic death benefit is often supplemented bya guarantee that locks in the highest anniversary valueand/or 5% minimum annual increase. The guaranteeddeath benefit ensures heirs of a minimum returnregardless of market performances.
Annuity owners can also enjoy living benefits. Thesebenefits take the form of a guaranteed income base or anoutright return of principal guarantee. The minimumincome base is usually calculated using the highest
-
49

Asset Allocation Principles: Structural Considerations (cont.) David M. Darst
anniversary value of fixed annual increase, similar to anenhanced death benefit. Living benefits protect theindividual’s future income from a severe market declinewhile preserving upside potential.
Importance of Tax and Liability Management
Tax Management
Tax management refers to the importance of taking intoaccount the federal, state, local, and internationalincome, capital gains, withholding, estate, gift, andproperty tax implications of investment actions andinvestment structures. For example, investors shouldkeep in mind the Alternative Minimum Tax (AMT),which has been designed to make sure that taxpayers paya minimum level of federal income tax, without regard tohow many credits and deductions they may be allowed totake. Each year, taxpayers who may be subject to theAMT carry out the following two steps: (i) they add backto ordinary income certain deductions (such as real estatetaxes and state and local income taxes) and preferenceitems (such as accelerated depreciation, passive lossesfrom partnerships, and interest income from privateactivity municipal bonds issued after August 7, 1986);and (ii) they undertake a tax computation that is parallelto their normal tax calculation. If the AMT amount isless than or equal to the regular tax, the taxpayer paysonly the regular tax. Because the AMT exemptionamounts are not indexed for inflation, with the passageof time, an increasing number of taxpayers are becomingsubject to AMT taxation.
In addition to Alternative Minimum Tax considerations,investors’ asset allocations, investment policies, and taxmanagement strategies should reflect some or all of thefollowing tax-related decisions, among others:
• Type of Security Owned (e.g., the interest incomefrom U.S. Government and certain Federal Agencysecurities is exempt from state and local governmentincome taxes, and the interest from most state andlocal government securities is exempt from federalincome taxes);
• Timing of Investment Actions (e.g., in periods ofbroad securities price appreciation, it may beadvantageous for the investor to make IRAcontributions or charitable gifts of assets at thebeginning, rather than at the end, of the investor’stax year);
• Capital Gains Tactics (e.g., assets held longer thana year and a day qualify for more favorable long-term capital gains tax rates rather than short-termcapital gains, which are taxed at ordinary income taxrates; other tactics include the offsetting of short-term capital gains with short-term capital losses, andthe identification of specific lots of securities whenthey are to be sold, rather than adoption of the first-in, first-out (FIFO) cost basis);
• Type of Account for Asset Ownership (e.g.,certain amounts and/or types of assets might be moreappropriately held in a child’s account rather than aparent’s, or in a conventional account rather than inan IRA/Roth IRA account); and
• Employer Securities (e.g., an investorcontemplating a lump sum distribution includingemployer securities might elect to apply the NetUnrealized Appreciation rules, thus allowing capitalgains rather than ordinary income tax treatment onthe price appreciation of the employer securities;other measures may be taken to avoid triggeringcapital gains when an employee decides to exercisehis or her incentive stock options).
It is worth reiterating that: (i) the tax managementstratagems discussed here are by no means a completelisting of potential tax management actions, nor are theyfully described; (ii) just as investors should not ignoretax considerations in their financial managementactivities, so should they not allow taxes to become theprimary driver of their investment actions, to thedetriment of other factors; and (iii) investors shouldconsult with their own tax and legal advisors for tax orother legal advice.
-
50
Asset Allocation Principles: Structural Considerations (cont.) David M. Darst
Liability Management
In the investor’s quest to achieve his or her financialgoals, liability management can be as important as assetmanagement. The investor’s liability managementdecisions include the type, amount, cost, maturity, andterms of borrowings, as well as the tax-deductibility ofinterest payments. It is important for investors to consulttheir tax advisors regarding the deductibility of interestbefore taking any tax-related borrowing actions, and toutilize their own and/or others’ resources to performpayment and amortization comparisons across variousdebt products and alternatives.
Three of the most common forms of borrowing byindividuals include: (i) margin borrowing, with some orall of the investor’s securities holdings used as collateralfor the margin loans; (ii) mortgage and home equityloans and lines of credit; and (iii) credit card debt.Borrowing may be undertaken for a variety of purposes,including: the desire to raise funds without liquidatingassets; the purchase of a new home, the improvement ofan existing home, or the refinancing of an already-outstanding first mortgage; to expand the investor’s ownbusiness or to pay educational expenses; or to effectimproved cash flow management through debtconsolidation.
For mortgage and home equity loans and lines of credit,the investor’s choices encompass: whether paymentsshould be interest-plus-principal or interest only; thepercentage of the asset’s value to be financed; whether tohave a fixed- or adjustable-rate loan, and if the latter, theindex on which the rate is based, the interest rateadjustment period, any interest rate floor or ceilingoptions, and conversion features allowing a switch fromadjustable to fixed rate; and the use of eligible securitiesas collateral in lieu of a cash down payment.
Credit card borrowings are another widely-utilizedsource of debt financing by individuals. The interest paidon consumer borrowing debt is not tax deductible, butinterest payments on home mortgages and/or homeequity loans and home equity lines of credit generallyare. Differentiating characteristics of credit card debtinclude interest rates, penalty charges, annual fees, cashrebates, discounts on goods and services purchased,
expense management and tracking systems, and airlinemileage rewards based on charge volume.
Phases and Cycles in Asset Allocation andInvestment Management
It is important to realize that investors face a series ofphases and cycles in the structuring, allocation, andinvestment management of their assets. A schematicdepiction of these phases and cycles is set forth inExhibit 5. The time periods shown along the bottom ofthe Exhibit are not fixed for all investors, nor even forthe average investor, but are included to give arepresentative idea of the time that may be devoted toeach major phase of an investor’s experience, shownhere to last between 20 years (2000–2020) and 40 years(2000–2040).
The first phase for the asset allocation and investmentmanagement process may be called the engagementphase, generally lasting two to five years, in which theinvestor acquires and learns asset allocation andinvestment management skills. In this phase, the investorshould find out what investment areas he or she has anaffinity for, while studying and learning from the greatbody of investment wisdom and knowledge.
The next phase of the asset allocation and investmentmanagement process may be termed the growth phase,generally lasting four to ten years, in which the investorbroadens and deepens his or her asset allocation andinvestment management skills. In this phase, the investorapplies an increasing degree of acumen andunderstanding to asset allocation and investmentmanagement styles, techniques, and resources.
The third phase of the asset allocation and investmentmanagement process may be called the realizationphase, generally lasting six to fifteen years, in which theinvestor leverages and demonstrates mastery in theinvestment realm. In this phase, the investor takesadvantage of the tools, experience, relationships, andknow-how that he or she has built up through a variety offinancial market environments and the changing personalfinancial circumstances that are an adjunct of life’snormal progress.
-
51
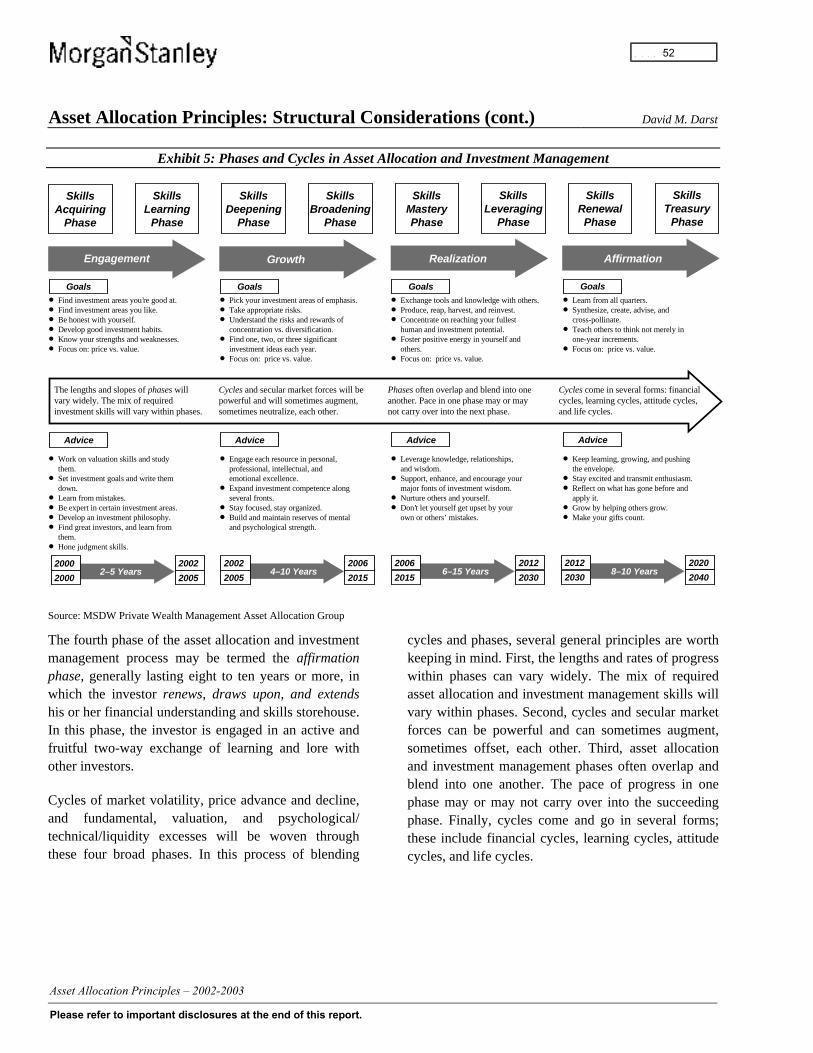
Asset Allocation Principles: Structural Considerations (cont.) David M. Darst
Exhibit 5: Phases and Cycles in Asset Allocation and Investment Management
2–5 Years 4–10 Years 6–15 Years 8–10 Years
The lengths and slopes of phases willvary widely. The mix of requiredinvestment skills will vary within phases.
Cycles and secular market forces will bepowerful and will sometimes augment,sometimes neutralize, each other.
Phases often overlap and blend into oneanother. Pace in one phase may or maynot carry over into the next phase.
Cycles come in several forms: financial cycles, learning cycles, attitude cycles,and life cycles.
SkillsAcquiring
Phase
SkillsLearning
Phase
SkillsDeepening
Phase
SkillsBroadening
Phase
SkillsMasteryPhase
SkillsLeveraging
Phase
SkillsRenewalPhase
SkillsTreasury
Phase
Engagement Growth Realization Affirmation
Goals Goals Goals Goals
Advice Advice Advice Advice
2000
2000
2002
2005
2002
2005
2006
2015
2006
2015
2012
2030
2012
2030
2020
2040
� Find investment areas you’re good at.� Find investment areas you like.� Be honest with yourself.� Develop good investment habits.� Know your strengths and weaknesses.� Focus on: price vs. value.
� Work on valuation skills and studythem.
� Set investment goals and write themdown.
� Learn from mistakes.� Be expert in certain investment areas.� Develop an investment philosophy.� Find great investors, and learn from
them.� Hone judgment skills.
� Pick your investment areas of emphasis.� Take appropriate risks.� Understand the risks and rewards of
concentration vs. diversification.� Find one, two, or three significant
investment ideas each year.� Focus on: price vs. value.
� Engage each resource in personal,professional, intellectual, andemotional excellence.
� Expand investment competence alongseveral fronts.
� Stay focused, stay organized.� Build and maintain reserves of mental
and psychological strength.
� Exchange tools and knowledge with others.� Produce, reap, harvest, and reinvest.� Concentrate on reaching your fullest
human and investment potential.� Foster positive energy in yourself and
others.� Focus on: price vs. value.
� Leverage knowledge, relationships,and wisdom.
� Support, enhance, and encourage yourmajor fonts of investment wisdom.
� Nurture others and yourself.� Don’t let yourself get upset by your
own or others’ mistakes.
� Learn from all quarters.� Synthesize, create, advise, and
cross-pollinate.� Teach others to think not merely in
one-year increments.� Focus on: price vs. value.
� Keep learning, growing, and pushingthe envelope.
� Stay excited and transmit enthusiasm.� Reflect on what has gone before and
apply it.� Grow by helping others grow.� Make your gifts count.
Source: MSDW Private Wealth Management Asset Allocation Group
The fourth phase of the asset allocation and investmentmanagement process may be termed the affirmationphase, generally lasting eight to ten years or more, inwhich the investor renews, draws upon, and extendshis or her financial understanding and skills storehouse.In this phase, the investor is engaged in an active andfruitful two-way exchange of learning and lore withother investors.
Cycles of market volatility, price advance and decline,and fundamental, valuation, and psychological/technical/liquidity excesses will be woven throughthese four broad phases. In this process of blending
cycles and phases, several general principles are worthkeeping in mind. First, the lengths and rates of progresswithin phases can vary widely. The mix of requiredasset allocation and investment management skills willvary within phases. Second, cycles and secular marketforces can be powerful and can sometimes augment,sometimes offset, each other. Third, asset allocationand investment management phases often overlap andblend into one another. The pace of progress in onephase may or may not carry over into the succeedingphase. Finally, cycles come and go in several forms;these include financial cycles, learning cycles, attitudecycles, and life cycles.
-
52
Asset Allocation Principles: Comparative Financial Measures David M. Darst
Over time, success in asset allocation and investmentstrategy is highly dependent on the investor’s skill inevaluating price-versus-value relationships, between andwithin asset classes, specific investments, and currencies.Based upon this knowledge and acumen, successfulinvestors are able to identify and purchase superior-performing investments and asset classes, and equallyimportant, they are able to avoid inferior-performinginvestments and asset classes.
At its heart, the entire investment banking andinvestment management realm revolves around assessingthe true value of something compared to its price. Theinvestment research and asset management disciplines,the public and private equities and debt trading, capitalmarkets, and underwriting functions, as well as merger,acquisition, restructuring and divestiture activity, allhinge upon the cardinal question: Is the value of a givenasset greater than, equal to, or less than its price?
Significant effort, and a great many quantitative andqualitative tools and techniques, have been brought to bearon the question of how to determine the value of afinancial asset, not to mention the value of real assets suchas art, property, collectibles, livestock, and jewelry. Manyinvestors are of the opinion that the value of an asset isdetermined by what someone will pay for it at a particularmoment in time. Other investors use various discountedcash flow (DCF) models and similar constructs that takeinto account the timing, magnitude, and riskiness of theincome streams and terminal price of an asset. Still othersrely on the market-clearing prices of comparable assetsthat have recently been bought and sold.
Common sense, perceptiveness, honest and rigorousanalysis, and good judgment are tools that are potentiallyat the disposal of most investors. With a modest degreeof effort, it is possible to assemble relevant data aboutcomparable investments in an identified asset class.Within reason, and when applied with a dose of healthyskepticism, this information can often be a resource inhelping to identify investments that are substantiallyovervalued or undervalued.
To demonstrate the application of this approach, thefollowing paragraphs focus on one asset class, publicly-traded equities. A similar approach — that of assembling,comparing, and reflecting upon the resultant investmentimplications — can be followed in a number of other assetclasses, ranging from high grade, high yield, convertible, oremerging markets debt, to mutual funds, hedge funds, orunit trusts, to various forms of private equity, oil and gas,venture capital, or real estate investments. It can be safelystated that each of these asset classes or sub-asset classeshas certain characteristics that are unique, and thus worthyof special analytical methodologies. At the same time,many of the underlying goals and principles apply broadlyacross asset classes. These guidelines include: (i)consistency of calculation; (ii) selection of an appropriateanalytical time frame; (iii) creativity and soundness incomparing data; (iv) restraint in drawing unrealisticconclusions; and (v) and conviction and patience in waitingfor prices to come back into line with value.
Profitability, Protection, and Plowback
Within the publicly-traded equities asset class, oneapproach to generating outstanding long-term investmentperformance has been to identify great businesses, investin them at reasonable prices, and hold onto them for longperiods of time. In this way, the favorable fundamentaleconomics of the company, the power of compoundedreturns, and the relative tax advantages and reducedexpenses of a low-turnover approach can generally bereflected in superior investment results, eventuallyovercoming short-term fluctuations in securities prices.
A critical ingredient in this approach to common stockinvesting is the ability to identify companies that have: (i)true long-term economic attractiveness; (ii) the ability todefend their money-making characteristics fromcompetitive and/or governmental inroads; and (iii)sufficient opportunities to reinvest their retained profits athigh rates of return. These three qualities may be describedas Profitability, Protection, and Plowback, respectively. It isequally important to the effectiveness of this approach toselect appropriate measures of these traits that can bemeasured across a number of years and that are reasonablycomparable across companies and industries.
-
53
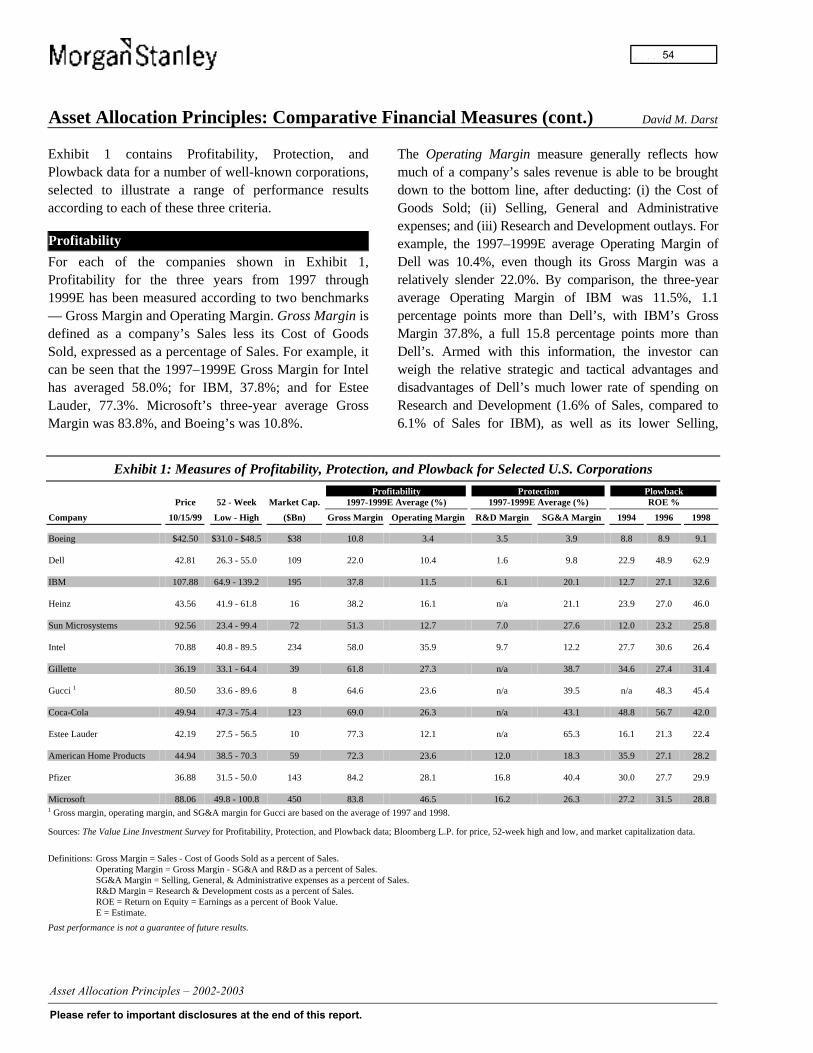
Asset Allocation Principles: Comparative Financial Measures (cont.) David M. Darst
Exhibit 1 contains Profitability, Protection, andPlowback data for a number of well-known corporations,selected to illustrate a range of performance resultsaccording to each of these three criteria.
Profitability
For each of the companies shown in Exhibit 1,Profitability for the three years from 1997 through1999E has been measured according to two benchmarks— Gross Margin and Operating Margin. Gross Margin isdefined as a company’s Sales less its Cost of GoodsSold, expressed as a percentage of Sales. For example, itcan be seen that the 1997–1999E Gross Margin for Intelhas averaged 58.0%; for IBM, 37.8%; and for EsteeLauder, 77.3%. Microsoft’s three-year average GrossMargin was 83.8%, and Boeing’s was 10.8%.
The Operating Margin measure generally reflects howmuch of a company’s sales revenue is able to be broughtdown to the bottom line, after deducting: (i) the Cost ofGoods Sold; (ii) Selling, General and Administrativeexpenses; and (iii) Research and Development outlays. Forexample, the 1997–1999E average Operating Margin ofDell was 10.4%, even though its Gross Margin was arelatively slender 22.0%. By comparison, the three-yearaverage Operating Margin of IBM was 11.5%, 1.1percentage points more than Dell’s, with IBM’s GrossMargin 37.8%, a full 15.8 percentage points more thanDell’s. Armed with this information, the investor canweigh the relative strategic and tactical advantages anddisadvantages of Dell’s much lower rate of spending onResearch and Development (1.6% of Sales, compared to6.1% of Sales for IBM), as well as its lower Selling,
Exhibit 1: Measures of Profitability, Protection, and Plowback for Selected U.S. Corporations
Profitability Protection PlowbackPrice 52 - Week Market Cap. 1997-1999E Average (%) 1997-1999E Average (%) ROE %
Company 10/15/99 Low - High ($Bn) Gross Margin Operating Margin R&D Margin SG&A Margin 1994 1996 1998
Boeing $42.50 $31.0 - $48.5 $38 10.8 3.4 3.5 3.9 8.8 8.9 9.1
Dell 42.81 26.3 - 55.0 109 22.0 10.4 1.6 9.8 22.9 48.9 62.9
IBM 107.88 64.9 - 139.2 195 37.8 11.5 6.1 20.1 12.7 27.1 32.6
Heinz 43.56 41.9 - 61.8 16 38.2 16.1 n/a 21.1 23.9 27.0 46.0
Sun Microsystems 92.56 23.4 - 99.4 72 51.3 12.7 7.0 27.6 12.0 23.2 25.8
Intel 70.88 40.8 - 89.5 234 58.0 35.9 9.7 12.2 27.7 30.6 26.4
Gillette 36.19 33.1 - 64.4 39 61.8 27.3 n/a 38.7 34.6 27.4 31.4
Gucci 1 80.50 33.6 - 89.6 8 64.6 23.6 n/a 39.5 n/a 48.3 45.4
Coca-Cola 49.94 47.3 - 75.4 123 69.0 26.3 n/a 43.1 48.8 56.7 42.0
Estee Lauder 42.19 27.5 - 56.5 10 77.3 12.1 n/a 65.3 16.1 21.3 22.4
American Home Products 44.94 38.5 - 70.3 59 72.3 23.6 12.0 18.3 35.9 27.1 28.2
Pfizer 36.88 31.5 - 50.0 143 84.2 28.1 16.8 40.4 30.0 27.7 29.9
Microsoft 88.06 49.8 - 100.8 450 83.8 46.5 16.2 26.3 27.2 31.5 28.81 Gross margin, operating margin, and SG&A margin for Gucci are based on the average of 1997 and 1998.
Sources: The Value Line Investment Survey for Profitability, Protection, and Plowback data; Bloomberg L.P. for price, 52-week high and low, and market capitalization data.
Definitions: Gross Margin = Sales - Cost of Goods Sold as a percent of Sales.Operating Margin = Gross Margin - SG&A and R&D as a percent of Sales.SG&A Margin = Selling, General, & Administrative expenses as a percent of Sales.R&D Margin = Research & Development costs as a percent of Sales.ROE = Return on Equity = Earnings as a percent of Book Value.E = Estimate.
Past performance is not a guarantee of future results.
-
54
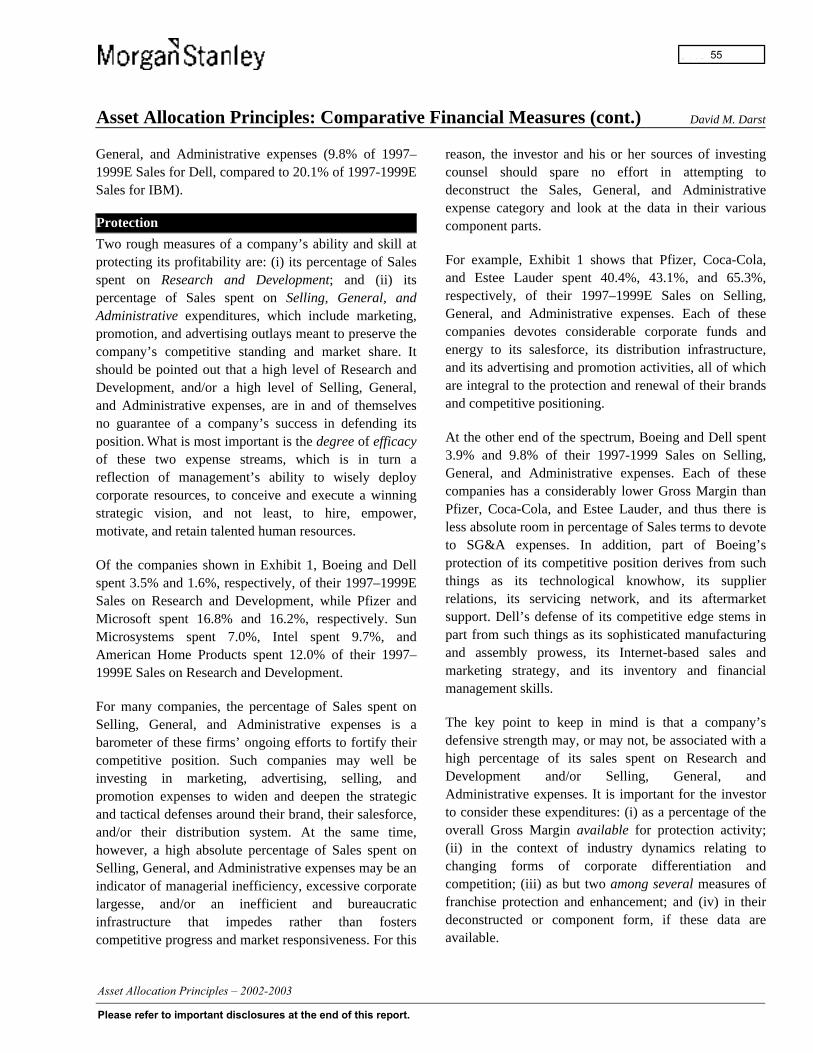
Asset Allocation Principles: Comparative Financial Measures (cont.) David M. Darst
General, and Administrative expenses (9.8% of 1997–1999E Sales for Dell, compared to 20.1% of 1997-1999ESales for IBM).
Protection
Two rough measures of a company’s ability and skill atprotecting its profitability are: (i) its percentage of Salesspent on Research and Development; and (ii) itspercentage of Sales spent on Selling, General, andAdministrative expenditures, which include marketing,promotion, and advertising outlays meant to preserve thecompany’s competitive standing and market share. Itshould be pointed out that a high level of Research andDevelopment, and/or a high level of Selling, General,and Administrative expenses, are in and of themselvesno guarantee of a company’s success in defending itsposition. What is most important is the degree of efficacyof these two expense streams, which is in turn areflection of management’s ability to wisely deploycorporate resources, to conceive and execute a winningstrategic vision, and not least, to hire, empower,motivate, and retain talented human resources.
Of the companies shown in Exhibit 1, Boeing and Dellspent 3.5% and 1.6%, respectively, of their 1997–1999ESales on Research and Development, while Pfizer andMicrosoft spent 16.8% and 16.2%, respectively. SunMicrosystems spent 7.0%, Intel spent 9.7%, andAmerican Home Products spent 12.0% of their 1997–1999E Sales on Research and Development.
For many companies, the percentage of Sales spent onSelling, General, and Administrative expenses is abarometer of these firms’ ongoing efforts to fortify theircompetitive position. Such companies may well beinvesting in marketing, advertising, selling, andpromotion expenses to widen and deepen the strategicand tactical defenses around their brand, their salesforce,and/or their distribution system. At the same time,however, a high absolute percentage of Sales spent onSelling, General, and Administrative expenses may be anindicator of managerial inefficiency, excessive corporatelargesse, and/or an inefficient and bureaucraticinfrastructure that impedes rather than fosterscompetitive progress and market responsiveness. For this
reason, the investor and his or her sources of investingcounsel should spare no effort in attempting todeconstruct the Sales, General, and Administrativeexpense category and look at the data in their variouscomponent parts.
For example, Exhibit 1 shows that Pfizer, Coca-Cola,and Estee Lauder spent 40.4%, 43.1%, and 65.3%,respectively, of their 1997–1999E Sales on Selling,General, and Administrative expenses. Each of thesecompanies devotes considerable corporate funds andenergy to its salesforce, its distribution infrastructure,and its advertising and promotion activities, all of whichare integral to the protection and renewal of their brandsand competitive positioning.
At the other end of the spectrum, Boeing and Dell spent3.9% and 9.8% of their 1997-1999 Sales on Selling,General, and Administrative expenses. Each of thesecompanies has a considerably lower Gross Margin thanPfizer, Coca-Cola, and Estee Lauder, and thus there isless absolute room in percentage of Sales terms to devoteto SG&A expenses. In addition, part of Boeing’sprotection of its competitive position derives from suchthings as its technological knowhow, its supplierrelations, its servicing network, and its aftermarketsupport. Dell’s defense of its competitive edge stems inpart from such things as its sophisticated manufacturingand assembly prowess, its Internet-based sales andmarketing strategy, and its inventory and financialmanagement skills.
The key point to keep in mind is that a company’sdefensive strength may, or may not, be associated with ahigh percentage of its sales spent on Research andDevelopment and/or Selling, General, andAdministrative expenses. It is important for the investorto consider these expenditures: (i) as a percentage of theoverall Gross Margin available for protection activity;(ii) in the context of industry dynamics relating tochanging forms of corporate differentiation andcompetition; (iii) as but two among several measures offranchise protection and enhancement; and (iv) in theirdeconstructed or component form, if these data areavailable.
-
55
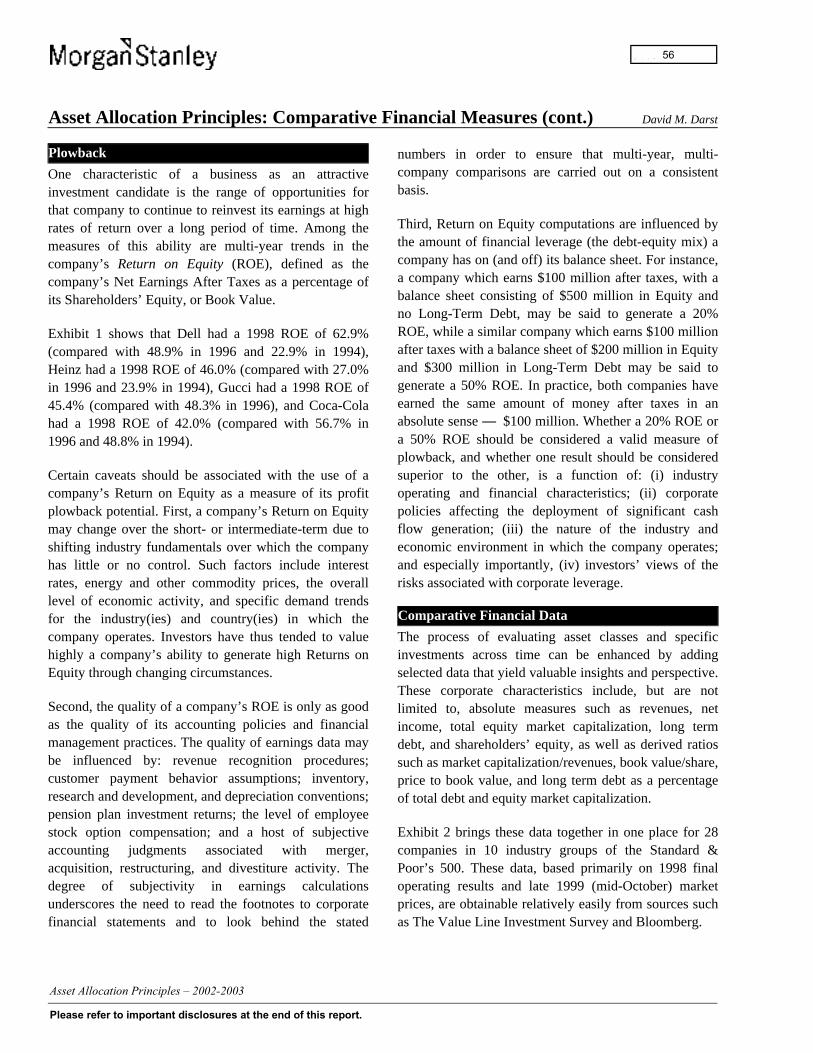
Asset Allocation Principles: Comparative Financial Measures (cont.) David M. Darst
Plowback
One characteristic of a business as an attractiveinvestment candidate is the range of opportunities forthat company to continue to reinvest its earnings at highrates of return over a long period of time. Among themeasures of this ability are multi-year trends in thecompany’s Return on Equity (ROE), defined as thecompany’s Net Earnings After Taxes as a percentage ofits Shareholders’ Equity, or Book Value.
Exhibit 1 shows that Dell had a 1998 ROE of 62.9%(compared with 48.9% in 1996 and 22.9% in 1994),Heinz had a 1998 ROE of 46.0% (compared with 27.0%in 1996 and 23.9% in 1994), Gucci had a 1998 ROE of45.4% (compared with 48.3% in 1996), and Coca-Colahad a 1998 ROE of 42.0% (compared with 56.7% in1996 and 48.8% in 1994).
Certain caveats should be associated with the use of acompany’s Return on Equity as a measure of its profitplowback potential. First, a company’s Return on Equitymay change over the short- or intermediate-term due toshifting industry fundamentals over which the companyhas little or no control. Such factors include interestrates, energy and other commodity prices, the overalllevel of economic activity, and specific demand trendsfor the industry(ies) and country(ies) in which thecompany operates. Investors have thus tended to valuehighly a company’s ability to generate high Returns onEquity through changing circumstances.
Second, the quality of a company’s ROE is only as goodas the quality of its accounting policies and financialmanagement practices. The quality of earnings data maybe influenced by: revenue recognition procedures;customer payment behavior assumptions; inventory,research and development, and depreciation conventions;pension plan investment returns; the level of employeestock option compensation; and a host of subjectiveaccounting judgments associated with merger,acquisition, restructuring, and divestiture activity. Thedegree of subjectivity in earnings calculationsunderscores the need to read the footnotes to corporatefinancial statements and to look behind the stated
numbers in order to ensure that multi-year, multi-company comparisons are carried out on a consistentbasis.
Third, Return on Equity computations are influenced bythe amount of financial leverage (the debt-equity mix) acompany has on (and off) its balance sheet. For instance,a company which earns $100 million after taxes, with abalance sheet consisting of $500 million in Equity andno Long-Term Debt, may be said to generate a 20%ROE, while a similar company which earns $100 millionafter taxes with a balance sheet of $200 million in Equityand $300 million in Long-Term Debt may be said togenerate a 50% ROE. In practice, both companies haveearned the same amount of money after taxes in anabsolute sense — $100 million. Whether a 20% ROE ora 50% ROE should be considered a valid measure ofplowback, and whether one result should be consideredsuperior to the other, is a function of: (i) industryoperating and financial characteristics; (ii) corporatepolicies affecting the deployment of significant cashflow generation; (iii) the nature of the industry andeconomic environment in which the company operates;and especially importantly, (iv) investors’ views of therisks associated with corporate leverage.
Comparative Financial Data
The process of evaluating asset classes and specificinvestments across time can be enhanced by addingselected data that yield valuable insights and perspective.These corporate characteristics include, but are notlimited to, absolute measures such as revenues, netincome, total equity market capitalization, long termdebt, and shareholders’ equity, as well as derived ratiossuch as market capitalization/revenues, book value/share,price to book value, and long term debt as a percentageof total debt and equity market capitalization.
Exhibit 2 brings these data together in one place for 28companies in 10 industry groups of the Standard &Poor’s 500. These data, based primarily on 1998 finaloperating results and late 1999 (mid-October) marketprices, are obtainable relatively easily from sources suchas The Value Line Investment Survey and Bloomberg.
-
56
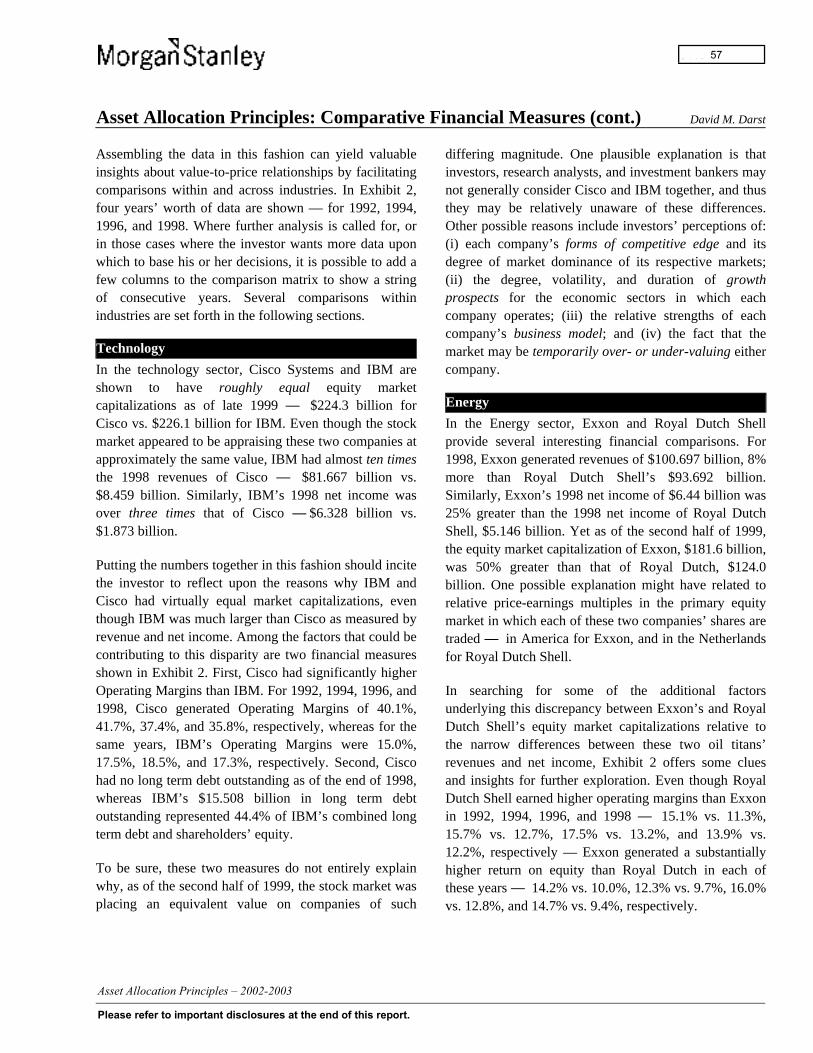
Asset Allocation Principles: Comparative Financial Measures (cont.) David M. Darst
Assembling the data in this fashion can yield valuableinsights about value-to-price relationships by facilitatingcomparisons within and across industries. In Exhibit 2,four years’ worth of data are shown — for 1992, 1994,1996, and 1998. Where further analysis is called for, orin those cases where the investor wants more data uponwhich to base his or her decisions, it is possible to add afew columns to the comparison matrix to show a stringof consecutive years. Several comparisons withinindustries are set forth in the following sections.
Technology
In the technology sector, Cisco Systems and IBM areshown to have roughly equal equity marketcapitalizations as of late 1999 — $224.3 billion forCisco vs. $226.1 billion for IBM. Even though the stockmarket appeared to be appraising these two companies atapproximately the same value, IBM had almost ten timesthe 1998 revenues of Cisco — $81.667 billion vs.$8.459 billion. Similarly, IBM’s 1998 net income wasover three times that of Cisco — $6.328 billion vs.$1.873 billion.
Putting the numbers together in this fashion should incitethe investor to reflect upon the reasons why IBM andCisco had virtually equal market capitalizations, eventhough IBM was much larger than Cisco as measured byrevenue and net income. Among the factors that could becontributing to this disparity are two financial measuresshown in Exhibit 2. First, Cisco had significantly higherOperating Margins than IBM. For 1992, 1994, 1996, and1998, Cisco generated Operating Margins of 40.1%,41.7%, 37.4%, and 35.8%, respectively, whereas for thesame years, IBM’s Operating Margins were 15.0%,17.5%, 18.5%, and 17.3%, respectively. Second, Ciscohad no long term debt outstanding as of the end of 1998,whereas IBM’s $15.508 billion in long term debtoutstanding represented 44.4% of IBM’s combined longterm debt and shareholders’ equity.
To be sure, these two measures do not entirely explainwhy, as of the second half of 1999, the stock market wasplacing an equivalent value on companies of such
differing magnitude. One plausible explanation is thatinvestors, research analysts, and investment bankers maynot generally consider Cisco and IBM together, and thusthey may be relatively unaware of these differences.Other possible reasons include investors’ perceptions of:(i) each company’s forms of competitive edge and itsdegree of market dominance of its respective markets;(ii) the degree, volatility, and duration of growthprospects for the economic sectors in which eachcompany operates; (iii) the relative strengths of eachcompany’s business model; and (iv) the fact that themarket may be temporarily over- or under-valuing eithercompany.
Energy
In the Energy sector, Exxon and Royal Dutch Shellprovide several interesting financial comparisons. For1998, Exxon generated revenues of $100.697 billion, 8%more than Royal Dutch Shell’s $93.692 billion.Similarly, Exxon’s 1998 net income of $6.44 billion was25% greater than the 1998 net income of Royal DutchShell, $5.146 billion. Yet as of the second half of 1999,the equity market capitalization of Exxon, $181.6 billion,was 50% greater than that of Royal Dutch, $124.0billion. One possible explanation might have related torelative price-earnings multiples in the primary equitymarket in which each of these two companies’ shares aretraded — in America for Exxon, and in the Netherlandsfor Royal Dutch Shell.
In searching for some of the additional factorsunderlying this discrepancy between Exxon’s and RoyalDutch Shell’s equity market capitalizations relative tothe narrow differences between these two oil titans’revenues and net income, Exhibit 2 offers some cluesand insights for further exploration. Even though RoyalDutch Shell earned higher operating margins than Exxonin 1992, 1994, 1996, and 1998 — 15.1% vs. 11.3%,15.7% vs. 12.7%, 17.5% vs. 13.2%, and 13.9% vs.12.2%, respectively — Exxon generated a substantiallyhigher return on equity than Royal Dutch in each ofthese years — 14.2% vs. 10.0%, 12.3% vs. 9.7%, 16.0%vs. 12.8%, and 14.7% vs. 9.4%, respectively.
-
57

Asset Allocation Principles: Comparative Financial Measures (cont.) David M. Darst
Stated another way, as of the second half of 1999, equityinvestors may have taken account of the fact that Exxonwas able to generate $6.44 billion in 1998 net income using$43.750 billion in shareholders’ equity, whereas RoyalDutch Shell produced $5.146 billion in net income —
$1.254 billion less than Exxon — while using $54.962billion in shareholders’ equity — $11.212 billion morethan Exxon. The disparity in the efficiency of theemployment of shareholders’ equity may reflect: (i)differing relative emphases of geographic regions in
Exhibit 2: Asset Allocation Principles: Comparative Financial Measures
Ticker Company Name
1998Revs($bil)
1998Net Inc.
($bil)
Mkt.Cap
($bil)
Mkt.Cap/Revs
ShrsO/S
(mil)
BookValue/Share
10/15/99Mkt.Price
Price/Book
Value
Capital GoodsBA Boeing 56.154 1.120 38.3 0.68 900 12.62 42.50 3.37GE General Electric 51.546 9.296 378.7 7.35 3271 11.89 115.75 9.74MMM Minnesota Mining and Manufacturing 15.021 1.526 36.0 2.40 403 14.77 89.38 6.05
TechnologyCSCO Cisco Systems 8.459 1.873 219.8 25.98 3271 4.55 67.19 14.77DELL Dell Computer 18.243 1.460 108.7 5.96 2540 0.92 42.81 46.54INTC Intel 26.273 6.178 234.5 8.92 3308 7.05 70.88 10.05IBM International Business Machines 81.667 6.328 226.1 2.77 1809 10.36 125.00 12.07MSFT Microsoft 14.484 4.786 449.9 31.06 5109 3.17 88.06 27.78
Basic MaterialsDD DuPont 24.767 2.861 70.5 2.85 1129 12.39 62.44 5.04IP International Paper 19.541 0.308 19.6 1.00 413 28.93 47.38 1.64
Precious MetalsHM Homestake Mining 0.803 0.257 2.5 3.14 260 3.23 9.69 3.00NEM Newmont Mining 1.454 0.069 4.4 3.01 168 8.61 26.13 3.03
EnergyXON Exxon 100.697 6.440 174.8 1.74 2428 17.98 72.00 4.00RD Royal Dutch Shell 93.692 5.146 123.8 1.32 2144 15.38 57.75 3.75SLB Schlumberger 11.816 1.394 29.8 2.52 548 14.86 54.38 3.66
Consumer Cyclical DurablesF Ford Motor 144.416 6.570 61.8 0.43 1222 20.36 50.56 2.48GM General Motors 161.315 2.956 40.1 0.25 645 22.87 62.13 2.72
Consumer Cyclical NondurablesDIS Walt Disney 22.976 1.871 49.8 2.17 2071 9.46 24.06 2.54EK Eastman Kodak 13.406 1.419 22.4 1.67 317 12.35 70.88 5.74PG Procter & Gamble 37.154 3.780 123.1 3.31 1320 7.79 93.31 11.98
Consumer StaplesKO Coca-Cola 18.813 3.533 123.3 6.55 2469 3.41 49.94 14.64MO Philip Morris 74.391 5.372 73.3 0.99 2398 6.66 30.56 4.59
HealthCareAHP American Home Products 13.463 2.715 58.8 4.37 1308 7.33 44.94 6.13JNJ Johnson & Johnson 23.657 3.678 125.4 5.30 1344 10.11 93.31 9.23MRK Merck 26.898 5.248 165.1 6.14 2350 5.42 70.25 12.96
FinanceCMB Chase Manhattan 32.379 4.016 55.4 1.71 832 26.90 66.50 2.47JPM J.P. Morgan 18.238 1.067 18.6 1.02 176 60.38 105.69 1.75MER Merrill Lynch 35.853 1.513 23.4 0.65 364 27.25 64.25 2.36
UtilitiesT AT&T 53.223 5.235 192.7 3.62 4461 9.70 43.19 4.45FON Sprint 17.134 0.889 50.0 2.92 781 14.19 64.00 4.51
Source: The Value Line Investment Survey and FactSet Research Systems, Inc.
Past performance is not a guarantee of future results.
-
58
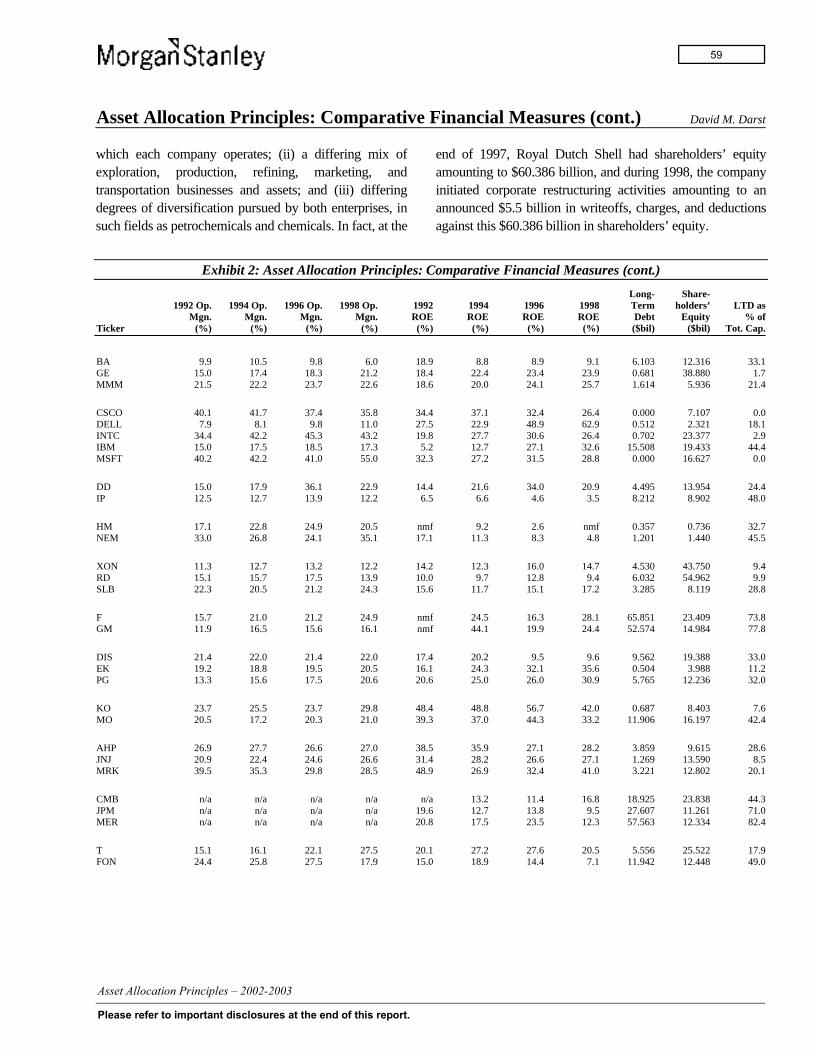
Asset Allocation Principles: Comparative Financial Measures (cont.) David M. Darst
which each company operates; (ii) a differing mix ofexploration, production, refining, marketing, andtransportation businesses and assets; and (iii) differingdegrees of diversification pursued by both enterprises, insuch fields as petrochemicals and chemicals. In fact, at the
end of 1997, Royal Dutch Shell had shareholders’ equityamounting to $60.386 billion, and during 1998, the companyinitiated corporate restructuring activities amounting to anannounced $5.5 billion in writeoffs, charges, and deductionsagainst this $60.386 billion in shareholders’ equity.
Exhibit 2: Asset Allocation Principles: Comparative Financial Measures (cont.)
Ticker
1992 Op.Mgn.
(%)
1994 Op.Mgn.
(%)
1996 Op.Mgn.
(%)
1998 Op.Mgn.
(%)
1992ROE
(%)
1994ROE
(%)
1996ROE
(%)
1998ROE
(%)
Long-TermDebt($bil)
Share-holders’
Equity($bil)
LTD as% of
Tot. Cap.
BA 9.9 10.5 9.8 6.0 18.9 8.8 8.9 9.1 6.103 12.316 33.1GE 15.0 17.4 18.3 21.2 18.4 22.4 23.4 23.9 0.681 38.880 1.7MMM 21.5 22.2 23.7 22.6 18.6 20.0 24.1 25.7 1.614 5.936 21.4
CSCO 40.1 41.7 37.4 35.8 34.4 37.1 32.4 26.4 0.000 7.107 0.0DELL 7.9 8.1 9.8 11.0 27.5 22.9 48.9 62.9 0.512 2.321 18.1INTC 34.4 42.2 45.3 43.2 19.8 27.7 30.6 26.4 0.702 23.377 2.9IBM 15.0 17.5 18.5 17.3 5.2 12.7 27.1 32.6 15.508 19.433 44.4MSFT 40.2 42.2 41.0 55.0 32.3 27.2 31.5 28.8 0.000 16.627 0.0
DD 15.0 17.9 36.1 22.9 14.4 21.6 34.0 20.9 4.495 13.954 24.4IP 12.5 12.7 13.9 12.2 6.5 6.6 4.6 3.5 8.212 8.902 48.0
HM 17.1 22.8 24.9 20.5 nmf 9.2 2.6 nmf 0.357 0.736 32.7NEM 33.0 26.8 24.1 35.1 17.1 11.3 8.3 4.8 1.201 1.440 45.5
XON 11.3 12.7 13.2 12.2 14.2 12.3 16.0 14.7 4.530 43.750 9.4RD 15.1 15.7 17.5 13.9 10.0 9.7 12.8 9.4 6.032 54.962 9.9SLB 22.3 20.5 21.2 24.3 15.6 11.7 15.1 17.2 3.285 8.119 28.8
F 15.7 21.0 21.2 24.9 nmf 24.5 16.3 28.1 65.851 23.409 73.8GM 11.9 16.5 15.6 16.1 nmf 44.1 19.9 24.4 52.574 14.984 77.8
DIS 21.4 22.0 21.4 22.0 17.4 20.2 9.5 9.6 9.562 19.388 33.0EK 19.2 18.8 19.5 20.5 16.1 24.3 32.1 35.6 0.504 3.988 11.2PG 13.3 15.6 17.5 20.6 20.6 25.0 26.0 30.9 5.765 12.236 32.0
KO 23.7 25.5 23.7 29.8 48.4 48.8 56.7 42.0 0.687 8.403 7.6MO 20.5 17.2 20.3 21.0 39.3 37.0 44.3 33.2 11.906 16.197 42.4
AHP 26.9 27.7 26.6 27.0 38.5 35.9 27.1 28.2 3.859 9.615 28.6JNJ 20.9 22.4 24.6 26.6 31.4 28.2 26.6 27.1 1.269 13.590 8.5MRK 39.5 35.3 29.8 28.5 48.9 26.9 32.4 41.0 3.221 12.802 20.1
CMB n/a n/a n/a n/a n/a 13.2 11.4 16.8 18.925 23.838 44.3JPM n/a n/a n/a n/a 19.6 12.7 13.8 9.5 27.607 11.261 71.0MER n/a n/a n/a n/a 20.8 17.5 23.5 12.3 57.563 12.334 82.4
T 15.1 16.1 22.1 27.5 20.1 27.2 27.6 20.5 5.556 25.522 17.9FON 24.4 25.8 27.5 17.9 15.0 18.9 14.4 7.1 11.942 12.448 49.0
-
59
Asset Allocation Principles: Comparative Financial Measures (cont.) David M. Darst
Consumer Cyclical Durables
An additional comparison involves two of the world’sleading automobile companies, Ford and General Motors.From Exhibit 2, it can be seen that Ford had 1998revenues that were 10% lower than General Motors’strike-penalized 1998 results, $144.416 billion vs.$161.315 billion. At the same time, perhaps owing todifferences in product mix and cost structure, Ford hadwider operating margins than General Motors in 1992,1994, 1996, and 1998 — 15.7% vs. 11.9%, 21% vs.16.5%, 21.2% vs. 15.6%, and 24.9% vs. 16.1%. Again,partly because of the UAW strike at GM, Ford earned115% more than General Motors in 1998 — $6.37 billionvs. $2.956 billion. Partly as a result, Ford’s equity marketcapitalization as of the second half of 1999 was 42% morethan General Motors’ — $56.7 billion vs. $40.0 billion.(The marketplace appeared to be taking little or no accountof GM’s stake in Hughes Electronics.)
It is also worth pointing out that comparing two or morecompanies’ profitability, protection, and plowbackresults and their financial data: (i) may or may notprovide insight as to which company was overvalued andwhich was undervalued, i.e., whether an appropriaterelationship between the two companies’ values wouldbe restored by an increase in the value of theundervalued company, or a decrease in the value of theovervalued company; (ii) may not yield a definitiveanswer as to whether perhaps both enterprises wereovervalued or undervalued; and (iii) may very well giveno indication as to the time frame over which morenormal value-to-price relationships might once againprevail. In applying these tools to asset allocation andinvestment strategy, the investor would be wise todevelop and bring to bear such time-tested qualities aspatience, rigor, creativity, common sense, and goodjudgement.
-
60

Asset Allocation Principles: Financial Climate Changes David M. Darst
One of the chief challenges in achieving successfulinvestment results over any meaningful time horizon isknowing how to recognize, anticipate, and respond tochanges in the financial climate, as distinguished fromchanges within the financial climate.
Assessing Changes in the Financial Climate
Major climatological shifts in the outlook for financialassets often call for profound reflection and a reorderingof asset allocation percentages. For example, the 1950sand 1960s were generally characterized by significanteconomic expansion in the United States and favored anasset allocation with an overweighting in equities andequity-like assets. By contrast, the 1970s witnessedrising inflation in the general price level (accompaniedby two OPEC-led increases in crude oil prices), risinginterest rates, a 14.7% decline in the S&P 500 index in1973 — followed by a 36.5% decline in 1974 — andgenerally unappealing returns for equities as an assetclass for the better part of 10 years.
Helped by heightened Federal Reserve resolve to bringdown inflation beginning in October 1979, long-livedeconomic and profit growth, and households’ directionof their retirement and investment plans into stocks andequity mutual funds, the 1980s and 1990s againrewarded an emphasis on equities and equity-like assetsin investors’ asset allocations. On the other hand, inJapan during the 1990s, a period of economicretrenchment and general price disinflation, the returnsfrom owning Japanese Government Bonds were two andone-half times greater than the returns from owningJapanese equities.
Entry into a new millennium presents investors withfresh opportunities for reflecting upon and assessing theclimate for financial markets and specific asset classes.Factors we see that argue in favor of a sustained highcommitment to equities and equity-like assets include: (i)robust economic growth and profitability in the U.S. andmost areas of the world; (ii) continued technologicalprogress and generally capitalism-friendly governments;and not least, (iii) reasonably benign prognoses for price
level changes, liquidity and capital flows, and monetaryand fiscal policies.
Factors we see that argue for a reduction in the assetallocation percentage devoted to equities and equity-likeassets include: (i) high historical equity valuationmeasures (such as price/earnings, price/book value, andprice/sales ratios); (ii) low U.S. personal savings ratesand current account deficits at the highest levels in 110years, depicted in Exhibit 1; (iii) the magnitude,complexity, and pervasiveness of various forms offinancial leverage, among them consumer and corporateborrowing, the dramatically expanded use of derivatives,and the proliferation of highly leveraged institutions; (iv)signs of technical deterioration and anomalous equitymarket price behavior, including wide divergences inequity prices, the increasing narrowness of equity sectorsexperiencing price advances, and divergent bond-stockprice movements; (v) one-year S&P 500 volatilityexpectations priced by options at levels reached onlytwice in the past 50 years — in 1974 and 1987, as shownin Exhibit 2; and (vi) evidence of late-cycle financialmarket conditions, including intensive equityunderwriting activity, record-high merger and acquisitionvolume, frenetic share turnover levels, and investmenteuphoria in many technology- and Internet-relatedstocks.
Exhibit 1: U.S. Current Account: 1889 – 1999
99E89796959493929190919001889
8
6
4
2
0
-2
-4
8
6
4
2
0
-2
-4
Percent of GDP
Source: Historical Statistics of the United States, Morgan Stanley DeanWitter Economics Research.
-
61
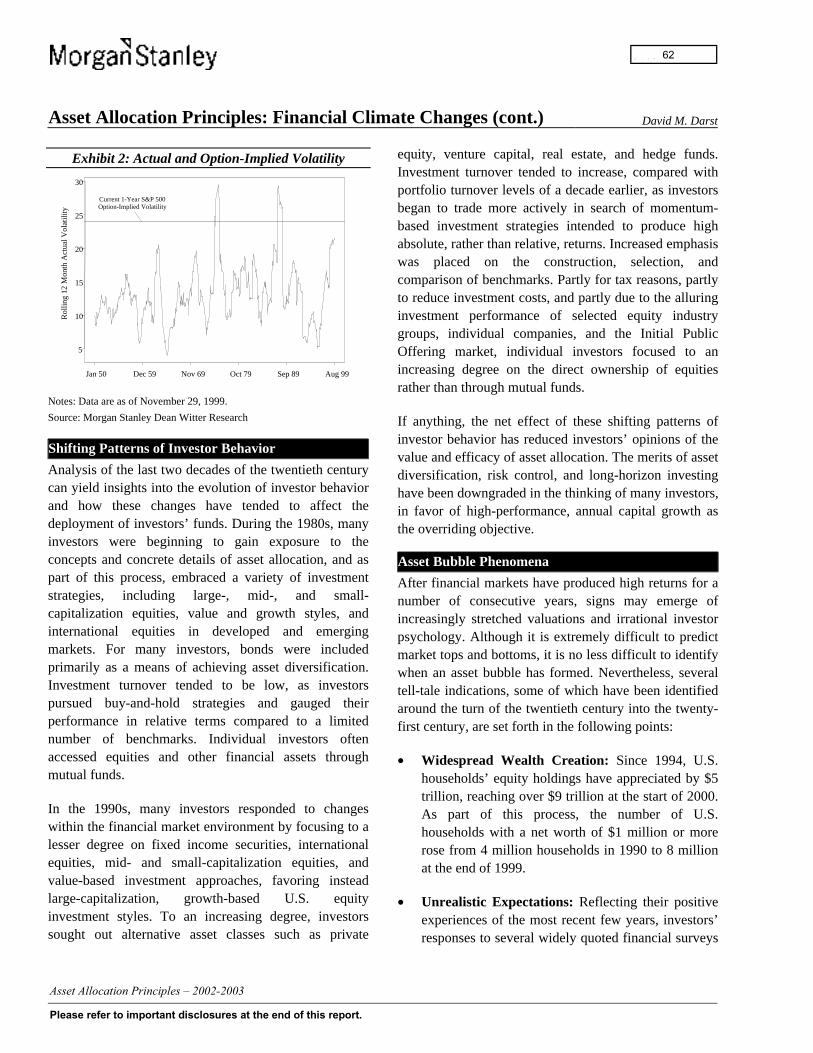
Asset Allocation Principles: Financial Climate Changes (cont.) David M. Darst
Exhibit 2: Actual and Option-Implied Volatility
Rol
ling
12 M
onth
Act
ual V
olat
ility
5
10
15
20
25
30
Jan 50 Dec 59 Nov 69 Oct 79 Sep 89 Aug 99
Current 1-Year S&P 500Option-Implied Volatility
Notes: Data are as of November 29, 1999.
Source: Morgan Stanley Dean Witter Research
Shifting Patterns of Investor Behavior
Analysis of the last two decades of the twentieth centurycan yield insights into the evolution of investor behaviorand how these changes have tended to affect thedeployment of investors’ funds. During the 1980s, manyinvestors were beginning to gain exposure to theconcepts and concrete details of asset allocation, and aspart of this process, embraced a variety of investmentstrategies, including large-, mid-, and small-capitalization equities, value and growth styles, andinternational equities in developed and emergingmarkets. For many investors, bonds were includedprimarily as a means of achieving asset diversification.Investment turnover tended to be low, as investorspursued buy-and-hold strategies and gauged theirperformance in relative terms compared to a limitednumber of benchmarks. Individual investors oftenaccessed equities and other financial assets throughmutual funds.
In the 1990s, many investors responded to changeswithin the financial market environment by focusing to alesser degree on fixed income securities, internationalequities, mid- and small-capitalization equities, andvalue-based investment approaches, favoring insteadlarge-capitalization, growth-based U.S. equityinvestment styles. To an increasing degree, investorssought out alternative asset classes such as private
equity, venture capital, real estate, and hedge funds.Investment turnover tended to increase, compared withportfolio turnover levels of a decade earlier, as investorsbegan to trade more actively in search of momentum-based investment strategies intended to produce highabsolute, rather than relative, returns. Increased emphasiswas placed on the construction, selection, andcomparison of benchmarks. Partly for tax reasons, partlyto reduce investment costs, and partly due to the alluringinvestment performance of selected equity industrygroups, individual companies, and the Initial PublicOffering market, individual investors focused to anincreasing degree on the direct ownership of equitiesrather than through mutual funds.
If anything, the net effect of these shifting patterns ofinvestor behavior has reduced investors’ opinions of thevalue and efficacy of asset allocation. The merits of assetdiversification, risk control, and long-horizon investinghave been downgraded in the thinking of many investors,in favor of high-performance, annual capital growth asthe overriding objective.
Asset Bubble Phenomena
After financial markets have produced high returns for anumber of consecutive years, signs may emerge ofincreasingly stretched valuations and irrational investorpsychology. Although it is extremely difficult to predictmarket tops and bottoms, it is no less difficult to identifywhen an asset bubble has formed. Nevertheless, severaltell-tale indications, some of which have been identifiedaround the turn of the twentieth century into the twenty-first century, are set forth in the following points:
• Widespread Wealth Creation: Since 1994, U.S.households’ equity holdings have appreciated by $5trillion, reaching over $9 trillion at the start of 2000.As part of this process, the number of U.S.households with a net worth of $1 million or morerose from 4 million households in 1990 to 8 millionat the end of 1999.
• Unrealistic Expectations: Reflecting their positiveexperiences of the most recent few years, investors’responses to several widely quoted financial surveys
-
62
Asset Allocation Principles: Financial Climate Changes (cont.) David M. Darst
indicated that: (i) they expected the returns fromequity ownership to persist at annual percentagerates of 15–20 percent or more for the indefinitefuture; (ii) the capital risks from equity ownershipare minimal; and (iii) asset diversificationencompassing meaningful levels of cash, fixedincome securities, commodities, and other non-equity-like assets makes little financial sense.
• Investor Complacency: Many investors arrive atthe conclusion that the risks of being out of theequity markets far outweigh the risks of remainingvirtually fully invested in equities; as a result, theseinvestors are devoted to a “buy the dips” mentality,and feel similarly strongly that it does not mattertrying to identity major cyclical and even secularturning points in equities prices.
• Financial Inadequacy: As they observe large newfortunes being created through the Initial PublicOffering and Merger and Acquisitions processes, anot inconsiderable number of well-off investors havefeelings that their fortunes are not large enough;these feelings are often exaggerated as a result ofsignificant perceived or actual disparities betweenthe comparors’ and comparees’ ages, depth ofbusiness experience, absolute wealth levels, and thefuture growth prospects of the assets comprisingtheir respective patrimonies.
• Disrespect for Money: In times of substantialinflation in the prices of financial assets, a growingportion of the investor population exhibits some ofthe same signs of disrespect for the value of moneythat individuals also display during periods of highinflation in the prices of goods and services; in otherwords, the psychological benefits of currentconsumption appear to outweigh the benefits ofdeferred consumption, and in the process,individuals effectively devalue the worth of moneyas a store of value compared with the utility ofmoney as a medium of exchange.
• Taxation Overawareness: In virtually all economicconditions, many investors allow tax considerationsto exert too strong an influence in their financialdecision-making, but this overawareness of theimportance of tax factors in investing tends toassume even larger scope in late-stage bull marketsas investors seek to keep as large a share as possibleof their capital gains from falling into the coffers ofthe fiscal authorities.
• Paper Riches, Purchasing Power Poverty: Due tolockup agreements, restrictions on sales by insidersand affiliates, and concerns over the signals thatsales by corporate officers and directors might sendto the financial marketplace, many individuals’equity wealth on paper is not able readily to beturned into spendable funds.
Financial Lessons
In the debate over the relevance and applicability of theOld vs. New paradigm in the economy, the proper levelof the Equity Risk Premium, and the effects of theInternet on commerce, financing, and investing, it isworth keeping in mind that over many centuries, if notmillennia, of recorded history, many aspects of humanreasoning, character, and behavior remain unchanged asthey relate to financial affairs. Individuals are driven byfear, confidence, greed, hindsight, uncertainty, hopes,dreams, regret, and attraction to grandiose schemes.Individuals are influenced by memory, self-doubt,despair, self-recrimination, envy, and pangs ofconscience. Individuals act out of noble motives andignoble motives.
As markets approach extreme levels of over- orundervaluation, a few of the timeless financial lessons toremember are enumerated in the precepts below.
• Lesson 1: Markets Don’t Go On Forever. Nomatter how euphoric or demoralized financial pricetrends may seem, at some point, conditions change,and the markets establish a decidedly new direction,
-
63
Asset Allocation Principles: Financial Climate Changes (cont.) David M. Darst
governed by the basic laws and principles ofeconomics, science, statistics, psychology, andcompound interest. In the words of WilliamShakespeare:
Thus sometimes hath the brightest day a cloud,And after summer evermore succeedsBarren winter with his wrathful, nipping cold;So cares and joys abound, as seasons fleet.
Henry VI Part 2, Act II, Scene iv
• Lesson 2: It Is Extremely Difficult to Time aMarket Top or Bottom. The financial arena islittered with the reputations, and in some cases, thefortunes, of investors and market strategists who at aparticular juncture in time came to the conclusionthat a major turning point had been reached. Eventhough the countervailing forces build up on anoscillating pendulum the higher that pendulumreaches, it is just as important to understand thestrength and duration of the forces that set thependulum in motion, so as to entertain the notionthat the pendulum’s path may endure yet longerbefore eventually reversing. So too with financialmarket conditions.
• Lesson 3: Markets Often Correct Through theMean. During a sustained market upswing ordownswing, one of the most discredited principles ofasset allocation is that of reversion to the mean. Bythis phrase, it is asserted that, over time, the returnsfrom owning a given asset class tend to gravitatetoward the long-term average for that asset category.When investors have been experiencing some yearsof abnormally high or low returns, not only do theybegin to believe that those returns will not likelyreturn to the long-term mean returns for that assetclass, they also generally lose sight of the fact thatthose long-term average returns imply that the assetwill produce returns as far (and as often) below themean as above the mean.
• Lesson 4: Relative Valuations Are Relative.Investors who purchase an asset because of itsattractive valuation relative to some other asset (e.g.,the purchase of U.S. pharmaceutical shares becausetheir price-earnings ratios appear attractive relativeto the price-earnings ratio of the S&P 500 index)should not forget the fact that if absolute valuationsdecline, relative valuations may (or may not)improve even as the investor experiences a loss incapital values.
• Lesson 5: Humans Are Fallible. In economists’parlance, one of the assertions of prospect theory isthat individuals ascribe too low a probability tolikely results and too high a probability to highlyunlikely results. As markets move for a long time inone direction, investors may very well findthemselves overestimating the likelihood that themarkets will continue indefinitely to move in theoriginal direction, while underestimating (orignoring altogether) the likelihood that the marketsmay at some stage reverse course and move againstthe prevailing market trend.
Asset Allocation Implications
If the investment lessons set forth in the previous sectionhave any relevance and validity, powerful arguments canbe made for painstaking attention to the selection of asound asset allocation policy reflecting: the investor’sgoals, risk tolerance, and other circumstances; projectedfinancial market conditions; and the usefulness ofdiversification among and within asset classes.
One of the main objectives of diversification is toimprove the risk-reward ratio of the investor’s overallasset mix. Stated another way, through diversification,the investor intends to: (i) lower the portfolio’s overallvolatility (one measure of risk) while accepting thetradeoff that this may lead to a lowering of theportfolio’s returns; or, to (ii) increase the portfolio’soverall returns without increasing portfolio risk by anequal proportion.
-
64
Asset Allocation Principles: Financial Climate Changes (cont.) David M. Darst
Perspective can be gained on this point by comparing themultiyear course of annual total returns (includingincome as well as capital gains or losses) for severalasset classes for which reliable data are available. Theasset classes and their relevant benchmarks selected forcomparison purposes include the following:
U.S. Equities
• Large-Capitalization Growth: S&P 500/BARRAGrowth Index of the 250 stocks in the S&P 500Index with the highest price-to-book value ratios.
• Large-Capitalization Value: S&P 500/BARRAValue Index of the 250 stocks in the S&P 500 Indexwith the lowest price-to-book value ratios.
• Mid-Capitalization: Russell Midcap Index of the800 smallest companies in the Russell 1000 index,as measured by total market capitalization.
• Small-Capitalization Growth: Russell 2000Growth Index of that portion of the 2000 companieswith higher price-to-book value and price/earningsratios than the other companies in the Russell 2000value Index.
• Small-Capitalization Value: Russell 2000 ValueIndex of that portion of the 2000 companies withlower price-to-book value and price/earnings ratiosthan the other companies in the Russell 2000 growthIndex.
International Equities
• International Equities: Morgan Stanley CapitalInternational EAFE index of more than 900companies in the developed stock markets ofEurope, Australasia, and the Far East.
Fixed Income Securities
• Intermediate-Term Bonds: Lehman BrothersIntermediate Government/Corporate Bond Index ofselected intermediate-term governmental andcorporate bonds with maturities of up to 10 years.
For the years 1979–1999, Exhibit 3 ranks each of theabove-mentioned asset classes in order of annualinvestment performance, thereby displaying the shiftingpattern of asset class returns covering more than twodecades.
Several important asset allocation implications emergefrom careful observation of these data. First, the fivesub-asset classes of the U.S. equity market have oftengenerated widely differing returns. For example, in theyears in which Small Capitalization Value equitiesranked first in investment performance (1981, 1982,1983, 1988, and 1992), Large-Capitalization Growthequities ranked much lower — seventh, fourth, sixth,sixth and sixth, respectively. Second, all the differentasset groups have ranked as the best or second-bestperforming asset class. Large-Capitalization Growthranked first or second nine times, Small-CapitalizationValue nine times, International Equities seven times,Large-Capitalization Value five times, Intermediate-Term Bonds four times, Mid-Capitalization three times,and Small-Capitalization Growth three times. Third,International Equities were the best performing assetclass for three years in a row (1985–1987), followed byfour years in a row (1989–1992) in which they were thepoorest performing among these seven asset groups,followed yet again by two years in a row (1993–1994) inwhich they were the best performing asset class.
While deeper analysis of Exhibit 3 can yield manyadditional class-to-class comparisons, two additionalpowerful overall insights relating to asset allocationstand out from these results. First is the difficulty theinvestor might very well experience in attempting toshift successfully each year (or even every two years)into the best-performing asset groups. It might thusfollow that a sensible investment strategy (which alsohas the benefit of reducing transaction costs) mightinvolve some healthy use of diversification, leavenedwith as much perspective as possible on how certainasset groups might be reasonably expected to perform ona multiyear basis. Second, and equally importantly, is theway asset groups rotate from the bottom to the top, orfrom the top to the bottom, of the performance rankings.
-
65
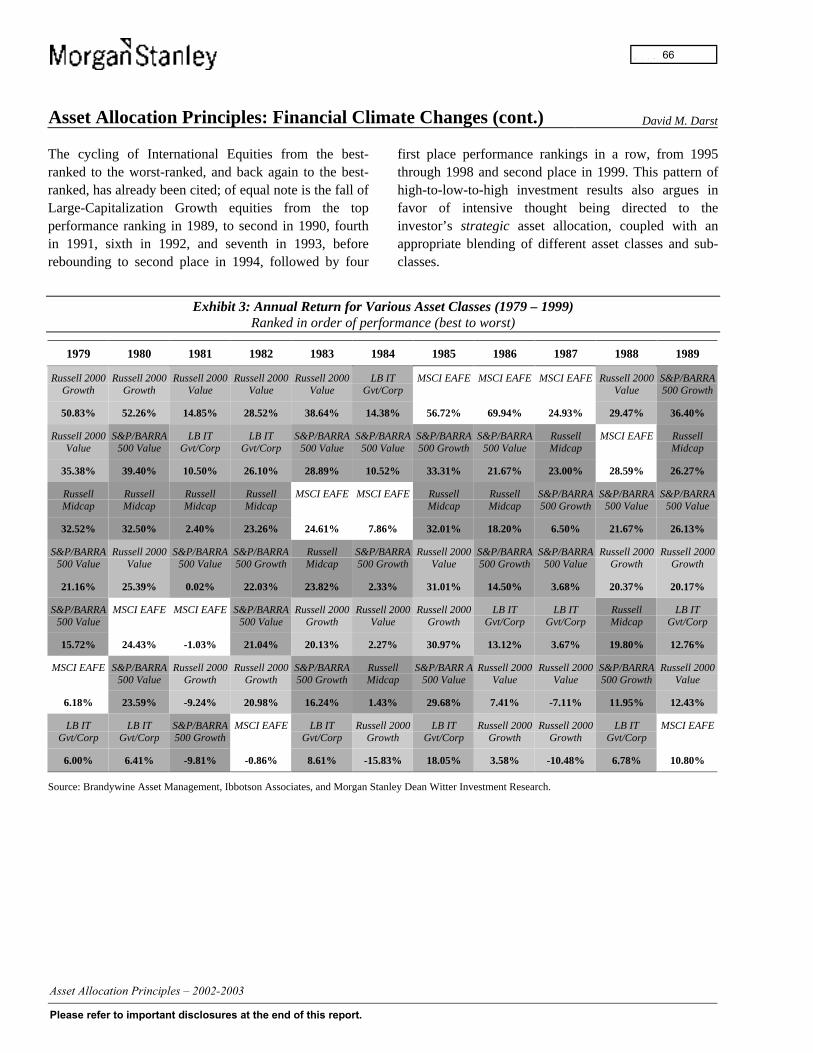
Asset Allocation Principles: Financial Climate Changes (cont.) David M. Darst
The cycling of International Equities from the best-ranked to the worst-ranked, and back again to the best-ranked, has already been cited; of equal note is the fall ofLarge-Capitalization Growth equities from the topperformance ranking in 1989, to second in 1990, fourthin 1991, sixth in 1992, and seventh in 1993, beforerebounding to second place in 1994, followed by four
first place performance rankings in a row, from 1995through 1998 and second place in 1999. This pattern ofhigh-to-low-to-high investment results also argues infavor of intensive thought being directed to theinvestor’s strategic asset allocation, coupled with anappropriate blending of different asset classes and sub-classes.
Exhibit 3: Annual Return for Various Asset Classes (1979 – 1999)Ranked in order of performance (best to worst)
1979 1980 1981 1982 1983 1984 1985 1986 1987 1988 1989
Russell 2000Growth
50.83%
Russell 2000Growth
52.26%
Russell 2000Value
14.85%
Russell 2000Value
28.52%
Russell 2000Value
38.64%
LB ITGvt/Corp
14.38%
MSCI EAFE
56.72%
MSCI EAFE
69.94%
MSCI EAFE
24.93%
Russell 2000Value
29.47%
S&P/BARRA500 Growth
36.40%
Russell 2000Value
35.38%
S&P/BARRA500 Value
39.40%
LB ITGvt/Corp
10.50%
LB ITGvt/Corp
26.10%
S&P/BARRA500 Value
28.89%
S&P/BARRA500 Value
10.52%
S&P/BARRA500 Growth
33.31%
S&P/BARRA500 Value
21.67%
RussellMidcap
23.00%
MSCI EAFE
28.59%
RussellMidcap
26.27%
RussellMidcap
32.52%
RussellMidcap
32.50%
RussellMidcap
2.40%
RussellMidcap
23.26%
MSCI EAFE
24.61%
MSCI EAFE
7.86%
RussellMidcap
32.01%
RussellMidcap
18.20%
S&P/BARRA500 Growth
6.50%
S&P/BARRA500 Value
21.67%
S&P/BARRA500 Value
26.13%
S&P/BARRA500 Value
21.16%
Russell 2000Value
25.39%
S&P/BARRA500 Value
0.02%
S&P/BARRA500 Growth
22.03%
RussellMidcap
23.82%
S&P/BARRA500 Growth
2.33%
Russell 2000Value
31.01%
S&P/BARRA500 Growth
14.50%
S&P/BARRA500 Value
3.68%
Russell 2000Growth
20.37%
Russell 2000Growth
20.17%
S&P/BARRA500 Value
15.72%
MSCI EAFE
24.43%
MSCI EAFE
-1.03%
S&P/BARRA500 Value
21.04%
Russell 2000Growth
20.13%
Russell 2000Value
2.27%
Russell 2000Growth
30.97%
LB ITGvt/Corp
13.12%
LB ITGvt/Corp
3.67%
RussellMidcap
19.80%
LB ITGvt/Corp
12.76%
MSCI EAFE
6.18%
S&P/BARRA500 Value
23.59%
Russell 2000Growth
-9.24%
Russell 2000Growth
20.98%
S&P/BARRA500 Growth
16.24%
RussellMidcap
1.43%
S&P/BARR A500 Value
29.68%
Russell 2000Value
7.41%
Russell 2000Value
-7.11%
S&P/BARRA500 Growth
11.95%
Russell 2000Value
12.43%
LB ITGvt/Corp
6.00%
LB ITGvt/Corp
6.41%
S&P/BARRA500 Growth
-9.81%
MSCI EAFE
-0.86%
LB ITGvt/Corp
8.61%
Russell 2000Growth
-15.83%
LB ITGvt/Corp
18.05%
Russell 2000Growth
3.58%
Russell 2000Growth
-10.48%
LB ITGvt/Corp
6.78%
MSCI EAFE
10.80%
Source: Brandywine Asset Management, Ibbotson Associates, and Morgan Stanley Dean Witter Investment Research.
-
66
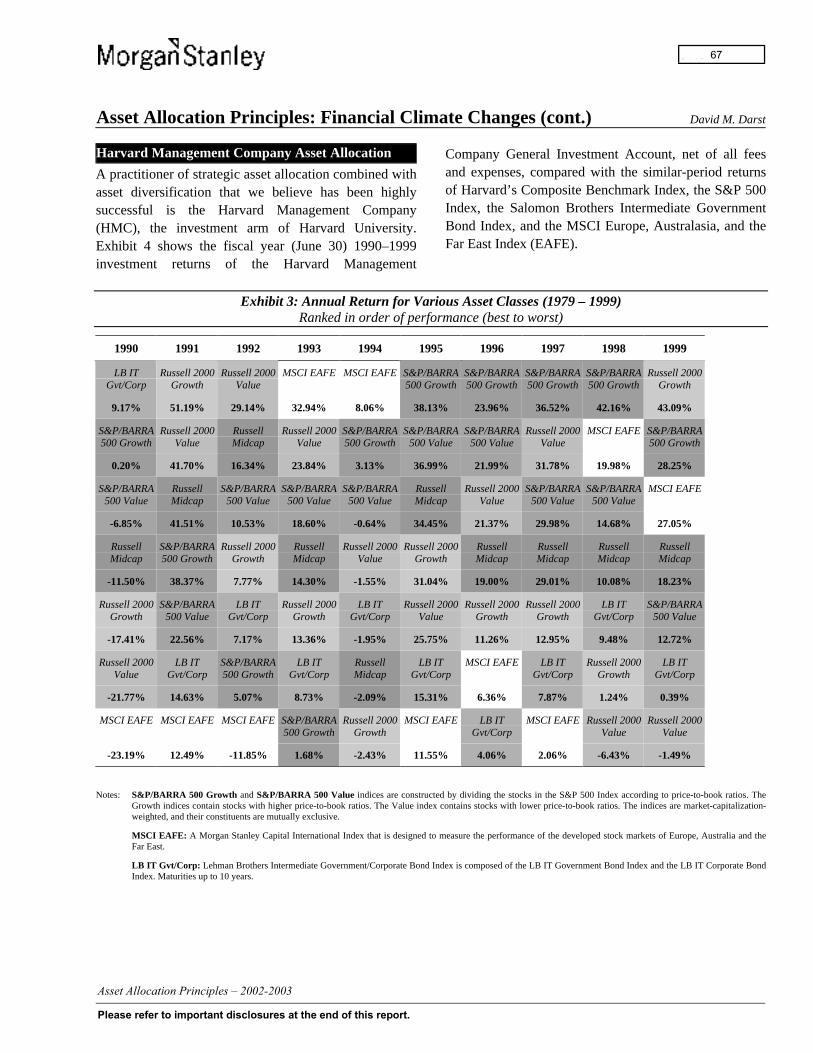
Asset Allocation Principles: Financial Climate Changes (cont.) David M. Darst
Harvard Management Company Asset Allocation
A practitioner of strategic asset allocation combined withasset diversification that we believe has been highlysuccessful is the Harvard Management Company(HMC), the investment arm of Harvard University.Exhibit 4 shows the fiscal year (June 30) 1990–1999investment returns of the Harvard Management
Company General Investment Account, net of all feesand expenses, compared with the similar-period returnsof Harvard’s Composite Benchmark Index, the S&P 500Index, the Salomon Brothers Intermediate GovernmentBond Index, and the MSCI Europe, Australasia, and theFar East Index (EAFE).
Exhibit 3: Annual Return for Various Asset Classes (1979 – 1999)Ranked in order of performance (best to worst)
1990 1991 1992 1993 1994 1995 1996 1997 1998 1999
LB ITGvt/Corp
9.17%
Russell 2000Growth
51.19%
Russell 2000Value
29.14%
MSCI EAFE
32.94%
MSCI EAFE
8.06%
S&P/BARRA500 Growth
38.13%
S&P/BARRA500 Growth
23.96%
S&P/BARRA500 Growth
36.52%
S&P/BARRA500 Growth
42.16%
Russell 2000Growth
43.09%
S&P/BARRA500 Growth
0.20%
Russell 2000Value
41.70%
RussellMidcap
16.34%
Russell 2000Value
23.84%
S&P/BARRA500 Growth
3.13%
S&P/BARRA500 Value
36.99%
S&P/BARRA500 Value
21.99%
Russell 2000Value
31.78%
MSCI EAFE
19.98%
S&P/BARRA500 Growth
28.25%
S&P/BARRA500 Value
-6.85%
RussellMidcap
41.51%
S&P/BARRA500 Value
10.53%
S&P/BARRA500 Value
18.60%
S&P/BARRA500 Value
-0.64%
RussellMidcap
34.45%
Russell 2000Value
21.37%
S&P/BARRA500 Value
29.98%
S&P/BARRA500 Value
14.68%
MSCI EAFE
27.05%
RussellMidcap
-11.50%
S&P/BARRA500 Growth
38.37%
Russell 2000Growth
7.77%
RussellMidcap
14.30%
Russell 2000Value
-1.55%
Russell 2000Growth
31.04%
RussellMidcap
19.00%
RussellMidcap
29.01%
RussellMidcap
10.08%
RussellMidcap
18.23%
Russell 2000Growth
-17.41%
S&P/BARRA500 Value
22.56%
LB ITGvt/Corp
7.17%
Russell 2000Growth
13.36%
LB ITGvt/Corp
-1.95%
Russell 2000Value
25.75%
Russell 2000Growth
11.26%
Russell 2000Growth
12.95%
LB ITGvt/Corp
9.48%
S&P/BARRA500 Value
12.72%
Russell 2000Value
-21.77%
LB ITGvt/Corp
14.63%
S&P/BARRA500 Growth
5.07%
LB ITGvt/Corp
8.73%
RussellMidcap
-2.09%
LB ITGvt/Corp
15.31%
MSCI EAFE
6.36%
LB ITGvt/Corp
7.87%
Russell 2000Growth
1.24%
LB ITGvt/Corp
0.39%
MSCI EAFE
-23.19%
MSCI EAFE
12.49%
MSCI EAFE
-11.85%
S&P/BARRA500 Growth
1.68%
Russell 2000Growth
-2.43%
MSCI EAFE
11.55%
LB ITGvt/Corp
4.06%
MSCI EAFE
2.06%
Russell 2000Value
-6.43%
Russell 2000Value
-1.49%
Notes: S&P/BARRA 500 Growth and S&P/BARRA 500 Value indices are constructed by dividing the stocks in the S&P 500 Index according to price-to-book ratios. TheGrowth indices contain stocks with higher price-to-book ratios. The Value index contains stocks with lower price-to-book ratios. The indices are market-capitalization-weighted, and their constituents are mutually exclusive.
MSCI EAFE: A Morgan Stanley Capital International Index that is designed to measure the performance of the developed stock markets of Europe, Australia and theFar East.
LB IT Gvt/Corp: Lehman Brothers Intermediate Government/Corporate Bond Index is composed of the LB IT Government Bond Index and the LB IT Corporate BondIndex. Maturities up to 10 years.
-
67
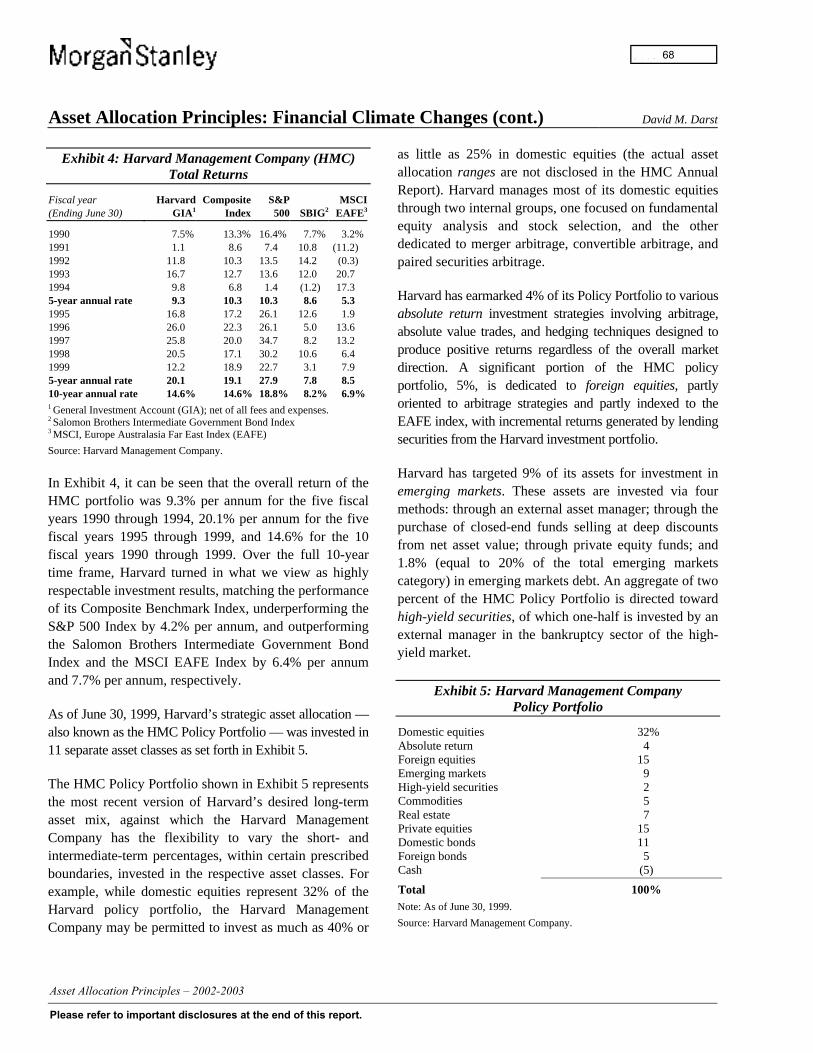
Asset Allocation Principles: Financial Climate Changes (cont.) David M. Darst
Exhibit 4: Harvard Management Company (HMC)Total Returns
Fiscal year(Ending June 30)
HarvardGIA1
CompositeIndex
S&P500 SBIG2
MSCIEAFE3
1990 7.5% 13.3% 16.4% 7.7% 3.2%1991 1.1 8.6 7.4 10.8 (11.2)1992 11.8 10.3 13.5 14.2 (0.3)1993 16.7 12.7 13.6 12.0 20.71994 9.8 6.8 1.4 (1.2) 17.35-year annual rate 9.3 10.3 10.3 8.6 5.31995 16.8 17.2 26.1 12.6 1.91996 26.0 22.3 26.1 5.0 13.61997 25.8 20.0 34.7 8.2 13.21998 20.5 17.1 30.2 10.6 6.41999 12.2 18.9 22.7 3.1 7.95-year annual rate 20.1 19.1 27.9 7.8 8.510-year annual rate 14.6% 14.6% 18.8% 8.2% 6.9%1 General Investment Account (GIA); net of all fees and expenses.2 Salomon Brothers Intermediate Government Bond Index3 MSCI, Europe Australasia Far East Index (EAFE)
Source: Harvard Management Company.
In Exhibit 4, it can be seen that the overall return of theHMC portfolio was 9.3% per annum for the five fiscalyears 1990 through 1994, 20.1% per annum for the fivefiscal years 1995 through 1999, and 14.6% for the 10fiscal years 1990 through 1999. Over the full 10-yeartime frame, Harvard turned in what we view as highlyrespectable investment results, matching the performanceof its Composite Benchmark Index, underperforming theS&P 500 Index by 4.2% per annum, and outperformingthe Salomon Brothers Intermediate Government BondIndex and the MSCI EAFE Index by 6.4% per annumand 7.7% per annum, respectively.
As of June 30, 1999, Harvard’s strategic asset allocation —also known as the HMC Policy Portfolio — was invested in11 separate asset classes as set forth in Exhibit 5.
The HMC Policy Portfolio shown in Exhibit 5 representsthe most recent version of Harvard’s desired long-termasset mix, against which the Harvard ManagementCompany has the flexibility to vary the short- andintermediate-term percentages, within certain prescribedboundaries, invested in the respective asset classes. Forexample, while domestic equities represent 32% of theHarvard policy portfolio, the Harvard ManagementCompany may be permitted to invest as much as 40% or
as little as 25% in domestic equities (the actual assetallocation ranges are not disclosed in the HMC AnnualReport). Harvard manages most of its domestic equitiesthrough two internal groups, one focused on fundamentalequity analysis and stock selection, and the otherdedicated to merger arbitrage, convertible arbitrage, andpaired securities arbitrage.
Harvard has earmarked 4% of its Policy Portfolio to variousabsolute return investment strategies involving arbitrage,absolute value trades, and hedging techniques designed toproduce positive returns regardless of the overall marketdirection. A significant portion of the HMC policyportfolio, 5%, is dedicated to foreign equities, partlyoriented to arbitrage strategies and partly indexed to theEAFE index, with incremental returns generated by lendingsecurities from the Harvard investment portfolio.
Harvard has targeted 9% of its assets for investment inemerging markets. These assets are invested via fourmethods: through an external asset manager; through thepurchase of closed-end funds selling at deep discountsfrom net asset value; through private equity funds; and1.8% (equal to 20% of the total emerging marketscategory) in emerging markets debt. An aggregate of twopercent of the HMC Policy Portfolio is directed towardhigh-yield securities, of which one-half is invested by anexternal manager in the bankruptcy sector of the high-yield market.
Exhibit 5: Harvard Management CompanyPolicy Portfolio
Domestic equities 32%Absolute return 4Foreign equities 15Emerging markets 9High-yield securities 2Commodities 5Real estate 7Private equities 15Domestic bonds 11Foreign bonds 5Cash (5)
Total 100%Note: As of June 30, 1999.
Source: Harvard Management Company.
-
68

Asset Allocation Principles: Financial Climate Changes (cont.) David M. Darst
In the commodity portion of Harvard’s asset allocation,consisting of 5% of the total Policy Portfolio, theprimary focus is on finding and exploiting mispricingsamong similar securities. A total of seven percent ofHarvard’s strategic asset allocation is invested in realestate, consisting of office buildings, residentialproperties, hotels, and retail projects, supplemented by10 externally managed real estate funds.
A significant portion, 15%, of the Harvard ManagementCompany Policy Portfolio is invested in private equities,made up of approximately 60 private equity partnershipsrun by external managers. Harvard has 11% of itsstrategic asset allocation devoted to domestic bonds, and5% devoted to foreign bonds, and in both sectors, itsinvestment approach is primarily oriented toward thearbitrage of virtually similar over- and undervalued fixedincome securities.
Harvard does not target cash as an asset class in itsPolicy Portfolio. In fact, in the course of its investing,hedging, and arbitrage activities, Harvard targets astrategic borrowing position (negative cash) representing5% of its total assets. With a relatively heavy emphasis
on international investments, arbitrage strategies, variousforms of private equity (including real estate) andborrowing and lending overlays, the HarvardManagement Company has been able to generaterespectable 5- and 10-year annual rates of return in itsGeneral Investment Account.
Summary
To be sure, not all investors have efficient access tointernal and external resources similar to those at thedisposal of Harvard University. At the same time, webelieve private investors can position themselves toimprove their risk-adjusted investment returns by: (i)adapting some of the Harvard Management Company’sapproaches — including the structuring of a targeted,diversified strategic asset allocation; (ii) assessingimportant changes in the financial climate; (iii)recognizing shifting patterns of investor behavior andsecular signs of excessive financial asset inflation; (iv)examining the investment performance of various assetclasses and sub-asset classes over time; and (v) beingmindful of and heeding time-honored investmentlessons.
-
69

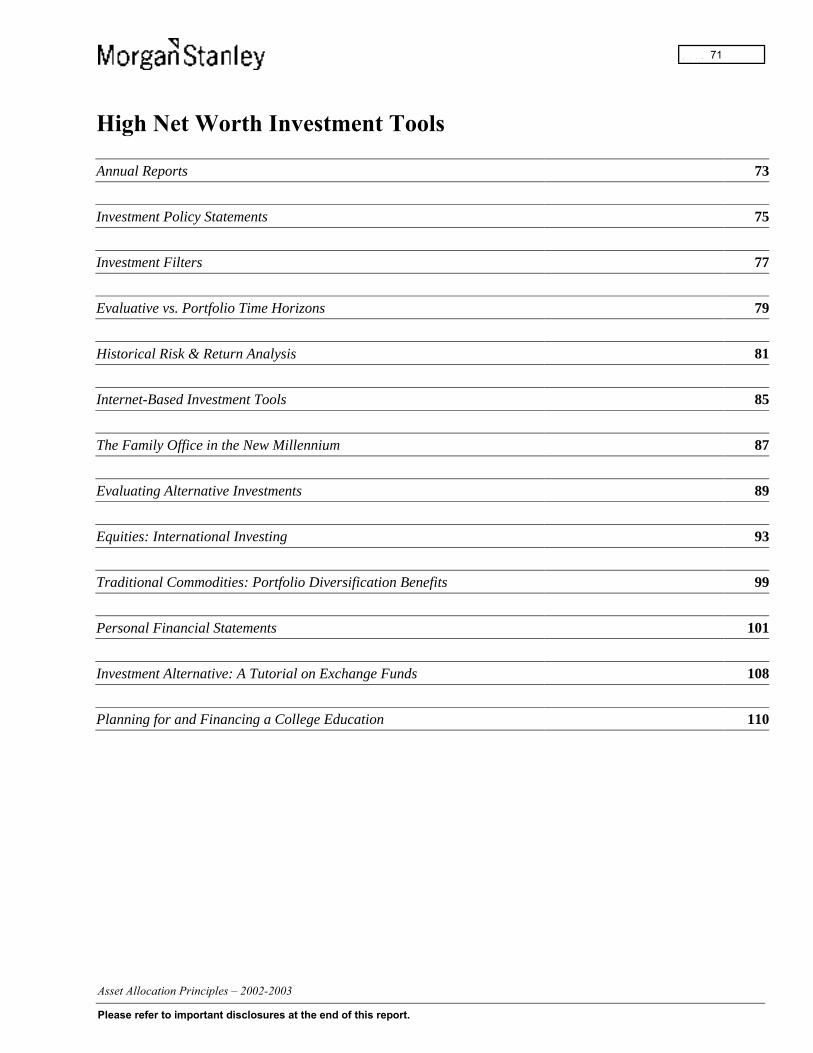
Annual Reports 73
Investment Policy Statements 75
Investment Filters 77
Evaluative vs. Portfolio Time Horizons 79
Historical Risk & Return Analysis 81
Internet-Based Investment Tools 85
The Family Office in the New Millennium 87
Evaluating Alternative Investments 89
Equities: International Investing 93
Traditional Commodities: Portfolio Diversification Benefits 99
Personal Financial Statements 101
Investment Alternative: A Tutorial on Exchange Funds 108
Planning for and Financing a College Education 110
-
71

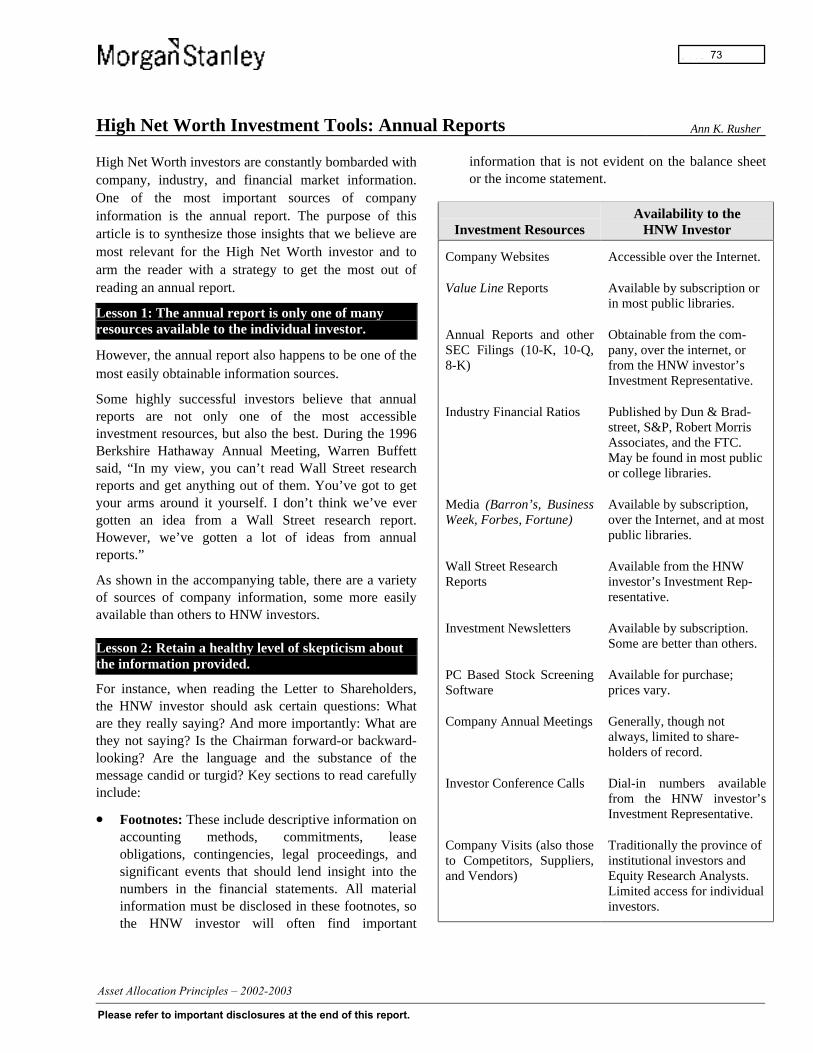
High Net Worth Investment Tools: Annual Reports Ann K. Rusher
High Net Worth investors are constantly bombarded withcompany, industry, and financial market information.One of the most important sources of companyinformation is the annual report. The purpose of thisarticle is to synthesize those insights that we believe aremost relevant for the High Net Worth investor and toarm the reader with a strategy to get the most out ofreading an annual report.
Lesson 1: The annual report is only one of manyresources available to the individual investor.
However, the annual report also happens to be one of themost easily obtainable information sources.
Some highly successful investors believe that annualreports are not only one of the most accessibleinvestment resources, but also the best. During the 1996Berkshire Hathaway Annual Meeting, Warren Buffettsaid, “In my view, you can’t read Wall Street researchreports and get anything out of them. You’ve got to getyour arms around it yourself. I don’t think we’ve evergotten an idea from a Wall Street research report.However, we’ve gotten a lot of ideas from annualreports.”
As shown in the accompanying table, there are a varietyof sources of company information, some more easilyavailable than others to HNW investors.
Lesson 2: Retain a healthy level of skepticism aboutthe information provided.
For instance, when reading the Letter to Shareholders,the HNW investor should ask certain questions: Whatare they really saying? And more importantly: What arethey not saying? Is the Chairman forward-or backward-looking? Are the language and the substance of themessage candid or turgid? Key sections to read carefullyinclude:
• Footnotes: These include descriptive information onaccounting methods, commitments, leaseobligations, contingencies, legal proceedings, andsignificant events that should lend insight into thenumbers in the financial statements. All materialinformation must be disclosed in these footnotes, sothe HNW investor will often find important
information that is not evident on the balance sheetor the income statement.
Investment ResourcesAvailability to the
HNW Investor
Company Websites Accessible over the Internet.
Value Line Reports Available by subscription orin most public libraries.
Annual Reports and otherSEC Filings (10-K, 10-Q,8-K)
Obtainable from the com-pany, over the internet, orfrom the HNW investor’sInvestment Representative.
Industry Financial Ratios Published by Dun & Brad-street, S&P, Robert MorrisAssociates, and the FTC.May be found in most publicor college libraries.
Media (Barron’s, BusinessWeek, Forbes, Fortune)
Available by subscription,over the Internet, and at mostpublic libraries.
Wall Street ResearchReports
Available from the HNWinvestor’s Investment Rep-resentative.
Investment Newsletters Available by subscription.Some are better than others.
PC Based Stock ScreeningSoftware
Available for purchase;prices vary.
Company Annual Meetings Generally, though notalways, limited to share-holders of record.
Investor Conference Calls Dial-in numbers availablefrom the HNW investor’sInvestment Representative.
Company Visits (also thoseto Competitors, Suppliers,and Vendors)
Traditionally the province ofinstitutional investors andEquity Research Analysts.Limited access for individualinvestors.
-
73
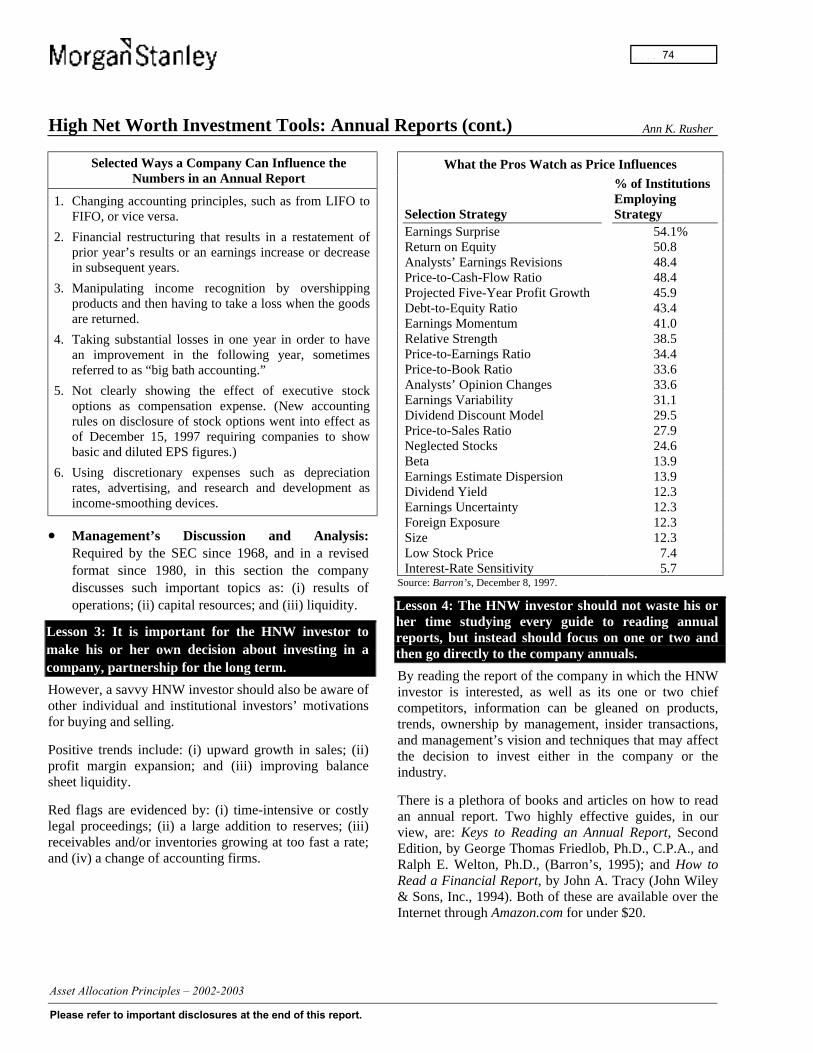
High Net Worth Investment Tools: Annual Reports (cont.) Ann K. Rusher
Selected Ways a Company Can Influence theNumbers in an Annual Report
1. Changing accounting principles, such as from LIFO toFIFO, or vice versa.
2. Financial restructuring that results in a restatement ofprior year’s results or an earnings increase or decreasein subsequent years.
3. Manipulating income recognition by overshippingproducts and then having to take a loss when the goodsare returned.
4. Taking substantial losses in one year in order to havean improvement in the following year, sometimesreferred to as “big bath accounting.”
5. Not clearly showing the effect of executive stockoptions as compensation expense. (New accountingrules on disclosure of stock options went into effect asof December 15, 1997 requiring companies to showbasic and diluted EPS figures.)
6. Using discretionary expenses such as depreciationrates, advertising, and research and development asincome-smoothing devices.
• Management’s Discussion and Analysis:Required by the SEC since 1968, and in a revisedformat since 1980, in this section the companydiscusses such important topics as: (i) results ofoperations; (ii) capital resources; and (iii) liquidity.
Lesson 3: It is important for the HNW investor tomake his or her own decision about investing in acompany, partnership for the long term.
However, a savvy HNW investor should also be aware ofother individual and institutional investors’ motivationsfor buying and selling.
Positive trends include: (i) upward growth in sales; (ii)profit margin expansion; and (iii) improving balancesheet liquidity.
Red flags are evidenced by: (i) time-intensive or costlylegal proceedings; (ii) a large addition to reserves; (iii)receivables and/or inventories growing at too fast a rate;and (iv) a change of accounting firms.
What the Pros Watch as Price Influences
Selection Strategy
% of InstitutionsEmployingStrategy
Earnings Surprise 54.1%Return on Equity 50.8Analysts’ Earnings Revisions 48.4Price-to-Cash-Flow Ratio 48.4Projected Five-Year Profit Growth 45.9Debt-to-Equity Ratio 43.4Earnings Momentum 41.0Relative Strength 38.5Price-to-Earnings Ratio 34.4Price-to-Book Ratio 33.6Analysts’ Opinion Changes 33.6Earnings Variability 31.1Dividend Discount Model 29.5Price-to-Sales Ratio 27.9Neglected Stocks 24.6Beta 13.9Earnings Estimate Dispersion 13.9Dividend Yield 12.3Earnings Uncertainty 12.3Foreign Exposure 12.3Size 12.3Low Stock Price 7.4Interest-Rate Sensitivity 5.7
Source: Barron’s, December 8, 1997.
Lesson 4: The HNW investor should not waste his orher time studying every guide to reading annualreports, but instead should focus on one or two andthen go directly to the company annuals.
By reading the report of the company in which the HNWinvestor is interested, as well as its one or two chiefcompetitors, information can be gleaned on products,trends, ownership by management, insider transactions,and management’s vision and techniques that may affectthe decision to invest either in the company or theindustry.
There is a plethora of books and articles on how to readan annual report. Two highly effective guides, in ourview, are: Keys to Reading an Annual Report, SecondEdition, by George Thomas Friedlob, Ph.D., C.P.A., andRalph E. Welton, Ph.D., (Barron’s, 1995); and How toRead a Financial Report, by John A. Tracy (John Wiley& Sons, Inc., 1994). Both of these are available over theInternet through Amazon.com for under $20.
-
74
High Net Worth Investment Tools: Investment Policy Statements Ann K. Rusher
A determining factor in structuring a High Net Worthinvestor’s asset allocation is the development of a formalinvestment policy. One key measure of the success of anasset allocation is whether it reflects the expectations ofthe investor, and the investment manager, as set forth inthe Investment Policy Statement.
An Investment Policy Statement is a set of guidelines.The purpose of a formal investment policy is to establisha sound investment framework that protects the portfoliofrom both the portfolio manager and the investor makingsubjective, tactical changes during distressing marketconditions that may deviate from the investor's long-terminvestment goals and focus. The more clearly theInvestment Policy Statement defines the investor’s goals,the more useful a tool it will be in managing not only theportfolio, but the overall investment managementrelationship.
“The misdemeanors of investment management arealmost all due to an inadequate advance understandingby an investor or portfolio manager (or both) of eitherthe internal realm of client objectives or the externalrealm of capital markets and investments, or both. If amajor decision is truly fiduciary in nature, it neverneeds to be done quickly. Time-urgent decisions arenever fiduciary. All too often, investment policy is bothvague and implicit, left to be resolved in haste, when itis easy to make the wrong decision at the wrong timefor the wrong reasons.”
Charles D. Ellis, Investment Policy, Second Edition, 1993.
The construction of an Investment Policy Statement for aHNW investor is often a self-discovery process for theinvestor, the investor’s family group or organization, andthe investment manager. Some questions that a HNWinvestor may want to start thinking about prior toembarking on the creation of a formal Investment PolicyStatement are outlined below. The process requiresintensive collaboration and interaction between theInvestment Representative, the HNW investor, and theappropriate asset allocation resources and generallyrequires several or more business days to complete. TheHNW investor has the central responsibility for defining,amending, and assuring implementation of his or herlong-term investment policy.
TEN QUESTIONS THAT A HIGH NET WORTHINVESTOR MIGHT THINK ABOUT
1. What do you want to accomplish with your life?2. How do you think about money and investments?3. What are some of your formative life and business
experiences?4. What causes your great moments of elation and
satisfaction?5. What person in your life has influenced you the most
and/or commanded your greatest respect and why?6. What are the ultimate whys for your investing
activity? Aside from increasing your after-tax risk-adjusted rate of return, are you planning to givemoney to your grandchildren, to a charity, or to analma mater?
7. Are there any areas of investing that you would liketo understand better? How much do you want tolearn about investments?
8. How do you cope with loss? Is there anything inyour life experience that has affected your ability totolerate risk?
9. What games of chance and skill do you play andwhy?
10. How would you describe your expectations of anideal investment management relationship?
Although Investment Policy Statements are specificallytailored to the needs of each HNW investor, theygenerally cover the following topics:
• The overall investment objective(s) of the assetsunder the supervision of the Investment Manager;
• The primary investment goal(s) and returnobjectives;
• The scope of asset purview of the InvestmentManager;
• The HNW investor’s estimated annual incomeneeds in nominal terms and how they shouldprimarily be met;
• The HNW investor’s portfolio investment timehorizon;
• The targeted long-term annual performanceobjective of the HNW investor on a pretax basis;
-
75

High Net Worth Investment Tools: Investment Policy Statements (cont.) Ann K. Rusher
• Tax, trust, and estate planning considerations andpurview;
• Investment turnover constraints in light of the taxstatus of the HNW investor’s portfolio;
• The Investment Manager’s proposed asset allocationframework to meet the HNW investor’s stated totalreturn requirements;
• General asset class weighting guidelines withincertain ranges stated as a percentage of total assets;
• Guidelines for liquidity events and changes inprojected rates of return;
• Targeted risk and volatility as indicated by theHNW investor's return objectives and investmenthorizon;
• Investor preferences for investing in certain assetclasses and investment positions;
• The liquidity needs of the HNW investor;
• The HNW investor’s projected combined effectiveFederal, state, and local tax rates;
• Portfolio investment quality standards andunderlying principles;
• Trading and settlement procedures as they relate tothe HNW investor’s portfolio;
• Custody arrangements for the assets in the HNWinvestor’s portfolio;
• Portfolio reporting objectives, needs, andconsiderations; and
• The extent of external manager selection,monitoring, trading, and settlement procedures.
Other important considerations relate directly to theHNW investor’s asset allocation decision. Thesequestions have been adapted from the StrategicInvestment Policy process described in the 1994 HarvardBusiness School case, The Harvard ManagementCompany, and are important for ensuring that the HNWinvestor and his or her Investment Representative havefully addressed the investor’s needs relating to liquidity,risk tolerance, benchmarks, and balance sheetconsiderations.
HIGH NET WORTH INVESTOR ASSETALLOCATION CONSIDERATIONS
Current vs. Future Needs: How should the High NetWorth investor think about providing for thisgeneration of beneficiaries versus future beneficiaries?
Income Requirements: Are the current income needsof this generation greater than average, and can greaterthan average spending levels be justified?
Asset Mix: What mix of assets, return assumptions,time horizon, and tax parameters is necessary toachieve targeted levels of real after-tax spending?Should the High Net Worth investor’s asset allocationand spending policies be coordinated, and if so, how?
Absolute vs. Relative Benchmarks: Should High NetWorth investors care about how their own assetallocation policies compare to those of similarly-situated investors, or should they invest only accordingto their own sense of appropriate direction?
Risk Tolerance: To what extent can High Net Worthinvestors make meaningful judgments about their ownability to tolerate portfolio risk?
Balance Sheet Considerations: To what extent shouldother major categories of the assets and liabilities ofHigh Net Worth investors, such as art, real estate, ormortgage debt, influence their overall asset allocationpolicies?
Finally, a systematic review of the investor’s investmentpolicy guidelines should be conducted with anappropriate degree of regularity in case the investor'scurrent income needs, long-term goals, and/orinvestment experience change in any meaningful way.
“Writing things down before you do them can keep youout of trouble. It can bring you peace of mind after youhave made your decision. It also gives you tangiblematerial for reference to evaluate the whys andwherefores of your profits or losses.”
Gerald M. Loeb, The Battle for Investment Survival, 1935.
-
76
High Net Worth Investment Tools: Investment Filters Ann K. Rusher
Past issues of the Asset Allocation Review and Outlookhave highlighted the texts of Philip A. Fisher, BenjaminGraham, Philip L. Carret, Gerald M. Loeb, and WarrenE. Buffett. Each of these five great investors have a setof filters specific to their own investment styles,disciplines, and expertise, to which they apply eachproposed investment.
In the August 1997 issue of the Outstanding InvestorDigest, a Berkshire Hathaway shareholder asked howWarren Buffett and Charlie Munger could substantiatethe claim that within five minutes they can tell whetheror not Berkshire might be interested in investing in acompany. Buffett answered that, in addition to beingalready familiar with virtually every company of any sizethat would be of interest to Berkshire, he and Charliehave a list of filters, developed over time, that help themisolate companies which they can understand and valueas investors. Buffett, later in a conversation with anothershareholder, reiterated that they can end 98% of theconversations with potential sellers in the middle of thefirst sentence by using their primary filters: (i) that theyunderstand the business; and (ii) that it has a sustainablecompetitive edge.
Investors, particularly High Net Worth individuals,should consider developing a list of investment filters. Infact, most investors innately use a number ofqualifications that they automatically look for beforepurchasing a security. Some require that the companymeet a minimum capitalization or that it has a productwith which they are familiar, while others have morespecific financial, operating, religious, environmental, oreven moral filters to which they apply potential newinvestments.
The process of creating a set of investment filters issimilar to the process of forming an investmentphilosophy, which entails a certain amount of experiencein investing and the study of the philosophies of severalgreat investors. One might start a list of filters byrecalling the companies in which he or she did or did notinvest and the reasoning behind each decision. Thosecircumstances or qualities that seem to be recurring ineach investment decision may, in fact, be an investmentfilter. As the investor begins to develop a set of filters, heor she may develop a greater level of confidence in eachinvestment decision.
The accompanying table sets forth many of theinvestment filters drawn from the writings of Fisher,Graham, Carret, Loeb, and Buffett. The HNW investormay adopt certain of these filters as his or her own or usethe chart as a worksheet when considering specific stockpurchases. In approaching each company, the HNWinvestor may want to qualify how many of theinvestment filters the company meets and which of thesefive great investors might have considered investing inthe security. If the worksheet is full of check marks, thenthe company might represent a sound investment. On theother hand, if there are relatively few check marks, theinvestor may decide not to purchase the security. TheHNW investor may find that those filters which apply totheir own investing may become the basis for theinvestor’s own customized list of filters.
In the same Outstanding Investor Digest article, WarrenBuffett makes the important point that if the companydoes not pass a sufficient number of the filters, the HNWinvestor has to be able to walk away from the potentialinvestment. He states, “You can’t buy a stock justbecause somebody else thinks it’s going to go up orbecause your friends made a lot of easy money lately, oranything of the sort.” A list of filters serves as asounding board and a consistency check for eachpotential equity investment.
To invest successfully over a lifetime does not requirea stratospheric IQ, unusual business insights, or insideinformation. What’s needed is a sound intellectualframework for making decisions and the ability to keepemotions from corroding that framework.
— Benjamin Graham, The Intelligent Investor
Readers should note that the table on the following page is based on thesources listed below:Philip A. Fisher, Common Stocks and Uncommon Profits, 1958.Benjamin Graham, The Intelligent Investor, 1949.Philip L. Carret, The Art of Speculation, 1930.Gerald M. Loeb, The Battle for Investment Survival, 1935.Lawrence A. Cunningham, The Essays of Warren Buffett: Lessons forCorporate America, 1997.
-
77

War
ren
E. B
uffe
tt
Fun
dam
enta
l/Val
ue I
nves
ting
Com
petit
ive
Pos
ition
�A
rel
ativ
ely
sim
ple
and
unde
r-st
anda
ble
busi
ness
that
is s
tabl
ein
cha
ract
er�
A b
usin
ess
that
is v
irtu
ally
cert
ain
to p
osse
ss e
norm
ous
com
petit
ive
stre
ngth
ten
ortw
enty
yea
rs fr
om n
ow
Man
agem
ent
�St
rong
man
agem
ent o
f su
peri
orqu
ality
and
inte
grity
�M
anag
emen
t tha
t con
sist
ently
real
izes
the
full
pote
ntia
l of
the
busi
ness
and
wis
ely
empl
oys
itsca
sh f
low
s, c
onsi
sten
tlych
anne
ling
the
rew
ards
fro
m th
ebu
sine
ss to
the
shar
ehol
ders
thro
ugh
com
poun
d gr
owth
rath
er th
an to
itse
lf
Fin
anci
al C
ondi
tion/
Tre
nds
�Fa
vora
ble
long
-ter
m e
cono
mic
char
acte
rist
ics
of th
e un
derl
ying
busi
ness
and
the
envi
ronm
ent i
nw
hich
the
busi
ness
is o
pera
ting
�Po
sitiv
e lo
ng-t
erm
bus
ines
spr
ospe
cts
for
the
spec
ific
com
pany
rat
her
than
for
the
stoc
k m
arke
t in
gene
ral
�L
arge
eno
ugh
size
: at l
east
$10
mill
ion
of a
fter
-tax
ear
ning
s�
Ear
ning
s th
at a
re v
irtu
ally
cert
ain
to b
e m
ater
ially
hig
her
five
, ten
, and
twen
ty y
ears
fro
mth
e pu
rcha
se d
ate
�A
n in
trin
sic
valu
e fo
r th
eco
mpa
ny th
at is
incr
easi
ng a
t asa
tisfa
ctor
y ra
te
Inve
stm
ent C
onsi
dera
tions
�A
n at
trac
tive
mar
ket p
rice
that
is a
t a la
rge
disc
ount
fro
m th
eun
derl
ying
bus
ines
s va
lue
�Pr
ojec
ted
aggr
egat
e af
ter-
tax
rece
ipts
fro
m a
n in
vest
men
t in
the
com
pany
(in
clud
ing
thos
ere
ceiv
ed o
n sa
le)
that
will
, ove
rth
e pr
ospe
ctiv
e ho
ldin
g pe
riod
,pr
ovid
e at
leas
t as
muc
h as
the
begi
nnin
g pu
rcha
sing
pow
er,
plus
a m
odes
t rat
e of
inte
rest
on
the
initi
al s
take
Ger
ald
M. L
oeb
Opp
ortu
nist
ic I
nves
ting
Man
agem
ent
�H
ighl
y co
mpe
tent
man
agem
ent,
mea
sure
d ag
ains
t oth
ers
in th
esa
me
indu
stry
�Se
nior
-lev
el m
anag
ers
who
ow
nva
st q
uant
ities
of
shar
es in
thei
row
n co
mpa
ny
Fin
anci
al C
ondi
tion/
Tre
nds
�E
noug
h ca
sh in
com
e to
fun
dpl
ant g
row
th, n
eede
d ex
pans
ion
in w
orki
ng c
apita
l, di
vide
nds,
or
othe
r ke
y ne
eds,
with
out
reso
rtin
g to
con
tinua
l new
fina
ncin
g�
Unl
ess
the
situ
atio
n is
mon
opol
istic
, fav
orab
le p
rofi
tm
argi
ns a
nd h
igh
fixe
d as
sets
,w
ith th
e ab
ility
to g
ener
ate
prof
itabl
e bu
sine
ss o
n sm
all
wor
king
cap
ital
Inve
stm
ent C
onsi
dera
tions
�A
n is
sue
that
is h
ard
to b
uy a
ndea
sy to
sel
l�
An
activ
e da
ily a
nd e
asily
acce
ssib
le p
rice
quo
te�
Con
side
rabl
e re
turn
fro
m c
apita
lap
prec
iatio
n (o
r de
prec
iatio
n)ra
ther
than
exc
lusi
vely
fro
m th
edi
vide
nd y
ield
�A
hig
h ex
pect
ed r
etur
nco
mbi
ned
from
inco
me
and
appr
ecia
tion
�Pr
ofit
poss
ibili
ties
that
are
larg
ean
d gr
eatly
out
wei
gh th
e vi
sibl
eri
sks
of in
vest
ing
in th
eco
mpa
ny—
so g
ood
that
pla
cing
a ra
ther
larg
e pr
opor
tion
ofon
e’s
tota
l fun
ds in
suc
h a
sing
le s
ituat
ion
will
not
see
mex
cess
ivel
y ri
sky
�A
n ad
vanc
ing
pric
e tr
end
Phi
lip L
. Car
ret
Opp
ortu
nist
ic I
nves
ting
Com
petit
ive
Pos
ition
�A
pos
itive
out
look
for
the
indu
stry
�G
ood
pros
pect
s fo
r th
e lo
ng-
rang
e gr
owth
of
the
com
pany
�A
str
ong
rela
tive
posi
tion
of th
eco
mpa
ny in
the
indu
stry
�L
arge
rel
ativ
e si
ze in
com
pari
son
with
indu
stry
com
petit
ors
�St
rong
rel
ativ
e ra
te o
f gr
owth
inco
mpa
riso
n w
ith c
ompe
titor
s
Man
agem
ent
�A
man
agem
ent t
eam
that
is a
lert
to c
onst
antly
cha
ngin
g m
etho
dsof
doi
ng b
usin
ess
and
adop
tsth
ose
whi
ch a
re im
prov
emen
tsov
er th
e ol
d m
etho
ds
Fin
anci
al C
ondi
tion/
Tre
nds
�Fa
vora
ble
pric
e m
ovem
ent o
fpr
inci
pal i
nput
s an
d ou
tput
sce
ntra
l to
the
com
pany
’spr
inci
pal b
usin
ess
�A
hea
lthy
cond
ition
of
the
com
pany
�A
str
ong
and
stab
le c
apita
lst
ruct
ure
�O
utst
andi
ng h
isto
rica
l rec
ord
ofea
rnin
gs a
nd a
pos
itive
ong
oing
tren
d�
Suff
icie
nt w
orki
ng c
apita
lpo
sitio
n an
d po
sitiv
e tr
end
�St
rong
pro
spec
ts f
or th
eim
med
iate
tren
d of
the
com
pany
’s p
rofi
ts�
Prof
it m
argi
n dy
nam
ics
that
do
not i
nvite
com
petit
ion
Inve
stm
ent C
onsi
dera
tions
�A
str
ong
belie
f th
at o
wni
ng th
est
ock
is p
refe
rabl
e to
buy
ing
any
of th
e th
ousa
nds
of o
ther
secu
ritie
s av
aila
ble
at th
e tim
e
Ben
jam
in G
raha
m
Val
ue I
nves
ting
Com
petit
ive
Pos
ition
�A
dequ
ate
size
of
the
ente
rpri
sere
lativ
e to
its
com
petit
ors
Fin
anci
al C
ondi
tion/
Tre
nds
�A
larg
e, p
rom
inen
t, an
dco
nser
vativ
ely
fina
nced
com
pany
�Su
ffic
ient
ly s
tron
g fi
nanc
ial
cond
ition
�C
urre
nt a
sset
s th
at a
re a
t lea
sttw
ice
curr
ent l
iabi
litie
s (a
so-
calle
d 2:
1 cu
rren
t rat
io)
�L
ong-
term
deb
t tha
t doe
s no
tex
ceed
110
% o
f ne
t cur
rent
asse
ts (
for
indu
stri
al c
ompa
nies
)�
An
unin
terr
upte
d re
cord
of
divi
dend
pay
men
ts f
or a
t lea
stth
e pa
st 2
0 ye
ars
�E
arni
ngs
stab
ility
, with
a r
ecor
dof
ear
ning
s fo
r at
leas
t ten
yea
rs�
Ear
ning
s gr
owth
of
at le
ast o
ne-
thir
d in
per
-sha
re e
arni
ngs
over
the
past
ten
year
s, u
sing
thre
e-ye
ar a
vera
ges
at th
e be
ginn
ing
and
the
end
�E
arni
ngs
that
will
sho
wpr
onou
nced
and
per
sist
ent
grow
th, t
hrou
gh p
ositi
vein
dust
ry s
uppl
y an
d de
man
dch
arac
teri
stic
s�
Prop
ortio
nate
ly la
rge
grow
th o
fin
vest
ed c
apita
l com
ing
from
rein
vest
ed p
rofi
ts
Inve
stm
ent C
onsi
dera
tions
�A
mod
erat
e pr
ice/
earn
ings
rat
io,
with
the
curr
ent p
rice
no
mor
eth
an 1
5 tim
es a
vera
ge e
arni
ngs
of th
e pa
st th
ree
year
s�
A p
rodu
ct o
f th
e pr
ice/
earn
ings
mul
tiple
tim
es th
e ra
tio o
f pr
ice-
to-b
ook
valu
e th
at d
oes
not
exce
ed 2
2.5
�E
stim
ated
fut
ure
earn
ings
mul
tiplie
d by
a f
acto
rap
prop
riat
e to
the
part
icul
aris
sue
resu
lting
in a
val
uesu
ffic
ient
ly a
bove
the
mar
ket
pric
e�
A p
rice
of
less
than
120
% o
f ne
tta
ngib
le a
sset
s
Phi
lip A
. Fis
her
Fun
dam
enta
l Inv
esti
ng
Com
petit
ive
Pos
ition
�Pr
oduc
t or s
ervi
ce o
ffer
ings
with
suff
icie
nt m
arke
t pot
entia
l to
achi
eve
a si
zeab
le in
crea
se in
sal
esfo
r at l
east
sev
eral
yea
rs�
Man
agem
ent d
eter
min
atio
n to
cont
inue
to d
evel
op p
rodu
cts
orpr
oces
ses
that
will
furt
her i
ncre
ase
tota
l sal
es p
oten
tial w
hen
the
grow
th o
f the
cur
rent
pro
duct
line
has
slow
ed�
Asp
ects
of t
he b
usin
ess
whi
chgi
ve im
port
ant c
lues
as
to h
owou
tsta
ndin
g th
e co
mpa
ny m
ay b
ein
rela
tion
to it
s co
mpe
titio
n�
A s
tron
g en
ough
cus
tom
eror
ient
atio
n to
reco
gniz
e ch
ange
sin
cus
tom
ers’
nee
ds a
nd in
tere
sts
and
then
to re
act p
rom
ptly
�E
ffec
tive
rese
arch
and
deve
lopm
ent e
ffor
ts in
rela
tion
toth
e si
ze o
f the
com
pany
Man
agem
ent
�M
anag
emen
t dep
th�
Man
agem
ent o
f unq
uest
iona
ble
inte
grity
�O
utst
andi
ng e
xecu
tive
rela
tions
with
labo
r and
per
sonn
el�
Man
agem
ent t
hat c
omm
unic
ates
free
ly to
inve
stor
s ab
out i
ts a
ffai
rsw
hen
thin
gs a
re g
oing
wel
l as
wel
las
whe
n di
sapp
oint
men
ts o
ccur
�M
anag
emen
t with
a lo
ng-r
ange
outlo
ok in
rega
rd to
pro
fit
�A
n en
trep
rene
uria
l spi
rit t
hat
perm
eate
s th
e or
gani
zatio
n
Fin
anci
al C
ondi
tion/
Tre
nds
�A
bove
ave
rage
sal
es�
A m
eani
ngfu
l pro
fit m
argi
n; th
elo
w-c
ost p
rodu
cer i
n th
e in
dust
ry�
A c
lear
pla
n to
mai
ntai
n or
impr
ove
prof
it m
argi
ns�
Rel
iabl
e co
st a
naly
sis
and
acco
untin
g co
ntro
ls�
A p
lan
for f
inan
cing
gro
wth
that
will
max
imiz
e ex
istin
gst
ockh
olde
rs’ b
enef
it fr
om th
ean
ticip
ated
gro
wth
-
78
High Net Worth Investment Tools:Evaluative vs. Portfolio Time Horizons Ann K. Rusher
When setting overall investment objectives and forminginvestment policy, High Net Worth investors need toconsider two separate, yet related, time frames over whichto assess investment performance: (i) the evaluative timehorizon; and (ii) the portfolio time horizon.
Evaluative Time Horizon: A High Net Worth investor’sevaluative time horizon is that defined period of timeduring which the investor will assess the intermediate-term operation of the portfolio. Over such a time frame,the High Net Worth investor monitors turnover and tax-efficiency, liquidity needs, and whether the investmentmanager is adhering to the stated investment objectives. Itis also the period over which the High Net Worth investorassesses investment strategies and decides whether theoriginal strategic plan should continue to be used orreplaced with one that more closely fits market realitiesand the stated portfolio objectives. The evaluative timehorizon may be as short as one year and as long as fiveyears, but is most commonly around three years, and mayor may not cover a full financial market cycle.
Portfolio Time Horizon: A High Net Worth investor’sportfolio time horizon is that long-term period over whichthe assets are being invested to fulfill the overall purposesof the portfolio and to meet the ultimate objectives of itsbeneficiaries. The portfolio time horizon may extend forfive, ten, or twenty years, or indefinitely (for instance, inthe case of a foundation or a private corporation).
Both the evaluative and portfolio time horizons play anintegral role in determining the risk profile, appropriateinvestment parameters, and asset allocation for a High NetWorth investment portfolio. For example, if an investor’sevaluative time horizon is three years and his or herportfolio time horizon is twenty years, then during that firstthree-year time period, he or she might appoint investmentmanagers to carry out intermediate-term objectives that aimtoward the ultimate goal of the assets over the twenty-yearportfolio time horizon. If a particular manager or strategydid not adhere to or fit the stated investment objectives bythe end of the three-year evaluative time horizon, then itwould be replaced. On the other hand, if each component ofthe portfolio was in fact meeting all of the investor’soriginal goals, the investor might keep the managers and/orstrategies in place and continue to monitor them oversucceeding three-year evaluative periods during the twenty-year portfolio time horizon.
An Investor’s Intended vs. Actual Time Horizon
In selecting an evaluative and a portfolio time horizon,the investor recognizes that the intended time horizonwill most probably not match the actual time horizon
over which the portfolio is assessed. This is exemplifiedin the practice of twenty-five year olds trading andmarking-to-market their 401(k) programs on a daily oreven hourly basis. It is also associated with theheightened media coverage of the financial markets thathas made even long-term investors acutely conscious oftheir investments on a minute-to-minute basis.
With the immense amount of real-time informationavailable about the global economies, and the profoundintertwining of the international financial markets, it isdifficult for a High Net Worth investor to makeinvestments and not monitor them with some degree offrequency during a five-, ten-, or even twenty-yearportfolio time horizon. Although the initial strategieschosen may, in fact, achieve the intended investmentobjectives at the end of the portfolio time horizon, thepsychological profile of High Net Worth investors doesnot necessarily warrant such a long lock-up period.Liquidity needs deriving from personal financialhardship, global economic events, or other changes inthe circumstances for the beneficiaries of the assets mayalso necessitate having an evaluative time horizon.
Short-Term Trading vs. Long-Term Investing
Another way to compare the portfolio time horizon andthe evaluative time horizon is by the types of assets andsecurities bought and used by the High Net Worthinvestor to meet the stated portfolio objectives over thesetwo time frames. Those assets and securities purchasedto meet portfolio objectives over the longer portfoliotime horizon should be considered as art — such as high-quality stocks that the High Net Worth investor can hangon the wall and keep in the portfolio for decades. Forexample, with impeccable-quality holdings, High NetWorth investors are more likely to reap the positivebenefits of compounding dividend reinvestment which isimportant in actually achieving the stated long-run ratesof return from equity ownership.
That portion of an investor’s portfolio which isassociated with the evaluative time horizon may besubject to some greater degree of tactical, short-termadjustment. This part of the assets may be considered ascomplementary to the long-term portfolio allocation andobjectives. In this context, the evaluative time horizonmay encompass the investor’s proclivity to takeadvantage of short-term price/value discrepancies withinvarious asset classes. For the fully-taxable High NetWorth investor, the ratio of time invested to totalcompound return for this trading portion of the portfoliomay be higher, and the resultant investment performanceless tax-efficient, due to higher turnover.
-
79

High Net Worth Investment Tools:Evaluative vs. Portfolio Time Horizons (cont.) Ann K. Rusher
Set forth in the diagram below is a summary of therelationship between a High Net Worth investor’sevaluative and portfolio time horizons. It can be used tohelp determine the relative degree of focus on each, giventhe investor’s portfolio constraints, goals, and objectives.
The Evaluative Time Horizon is a Function of:• The short-term outlook for the financial markets.
• The investor’s “Comfort/Concern Ratio” about:
(i) His or her own financial conditions;
(ii) His or her asset selection capability: and
(iii) His or her investment managers.
The Portfolio Time Horizon is a Function of:• The chronological age of the High Net Worth
investor.
• The long-term outlook for the capital markets.
• The stage of the High Net Worth investor’swealth accumulation.
• The ultimate purpose and disposition of theassets.
-
80
High Net Worth Investment Tools:Historical Risk & Return Analysis Elizabeth W. Wells
The asset allocation decision is driven by a host ofqualitative and personal factors, but it also needs ameaningful degree of quantitative grounding. For themost part, this quantitative grounding focuses on thereturns and risks of various potential combinations ofasset classes.
Appropriate usage of these quantitative tools depends ona number of factors, including the recognition that: (i)the future is never an exact duplicate of the past; and (ii)the further out into the future one looks, the greater thedegree of probability that returns will tend toward theirlong-term average.
A quantitatively-based approach can take many differentforms, including a pure Historical Analysis of differentasset classes and combinations of those asset classes. Inaddition, with an Optimization Model, the investor canuse historical or projected returns to create an assetallocation which is on the so-called efficient frontier.The efficient frontier is a concept from Modern PortfolioTheory, which, among other postulates, describescombinations of asset classes that will provide the mostreturn for a given level of risk.
Both the pure Historical Analysis and the OptimizationModel can be tailored to the preferences and profile ofthe investor, depending on a number of factors. There aremany decisions to be made when selecting the data toperform the analysis, including: which benchmarks touse for each asset class; the period of time underanalysis; and the length of each portfolio holding periodwithin the overall time frame being reviewed.
An example of this approach is shown in theaccompanying series of charts. The investment resultsdisplayed in these charts are commonly cited throughoutthe asset allocation literature to show the historicaloutperformance of stocks over bonds. In this case,portfolios have been constructed consisting of varyingweightings of stocks and bonds. Using historicalmonthly data series available for U.S. stocks, U.S.government bonds, and cash, the portfolios wereanalyzed from January 1950 to September 1998, overvarious one-, three-, five-, and ten-year portfolio holdingperiods.
Chart 1: U.S. Domestic Risk & Reward — One-Year Returns(1)(2)(3)
January 1950 — September 1998
- - - - -
Notes: (1) Rolling one year returns using monthly data.(2) Source: Ibbotson Associates, Inc.(3) Stocks: S&P 500 Total Return: Bonds: U.S. Long Term Government Total Return; Cash: U.S. 30 Day T-Bill Total Return.
Past performance is not indicative of future returns.
-35.2%
-32.1%
-29.1%
-25.8%
-22.6%
-19.1%
-15.6%
-11.9%
-12.3%
-14.5%
12.4%55.0%
11.7%52.2%
11.1%49.4%
10.4%46.4%
9.7%43.7%
8.9%42.6%
8.2%44.2%
7.4%45.8%
6.6%47.5%
5.8%49.0%
20.9%
19.7%
18.6%
17.3%
16.0%
14.7%
13.3%
11.9%
10.4%
8.9%
SingleYear
Ending9/98
-35.2%
-32.1%
-29.1%
-25.8%
-22.6%
-19.1%
-15.6%
-11.9%
-12.3%
-14.5%
WorstReturn
-7.0%
-6.4%
-5.5%
-4.6%
-4.1%
-3.7%
-3.4%
-3.3%
-3.3%
-3.5%
AvgLoss
12.4%
11.7%
11.1%
10.4%
9.7%
8.9%
8.2%
7.4%
6.6%
5.8%
AvgReturn
18.2%
16.6%
15.3%
14.0%
12.8%
11.6%
10.6%
9.9%
9.6%
9.8%
AvgGain
55.0%
52.2%
49.4%
46.4%
43.7%
42.6%
44.2%
45.8%
47.5%
49.0%
LargestReturn
19.3%
17.9%
17.2%
16.9%
16.0%
15.0%
15.2%
16.0%
20.2%
27.0%
%Neg
80.7%
82.1%
82.8%
83.1%
84.0%
85.0%
84.8%
84.0%
79.8%
73.0%
%Pos
10%
80%10%
10%
70%20%
10%
60%30%
10%
50%40%
10%
40%50%
10%
30%60%
10%
20%70%
10%
10%80%
10%
0%90%
Cash
StocksBonds
Cash
StocksBonds
Cash
StocksBonds
Cash
StocksBonds
Cash
StocksBonds
Cash
StocksBonds
Cash
StocksBonds
Cash
StocksBonds
Cash
StocksBonds
PortfolioMix:
One-Year Returns, 1950-1998Largest ReturnWorst Return Average Return
Cash
StocksBonds
10%
90%0%
-
81
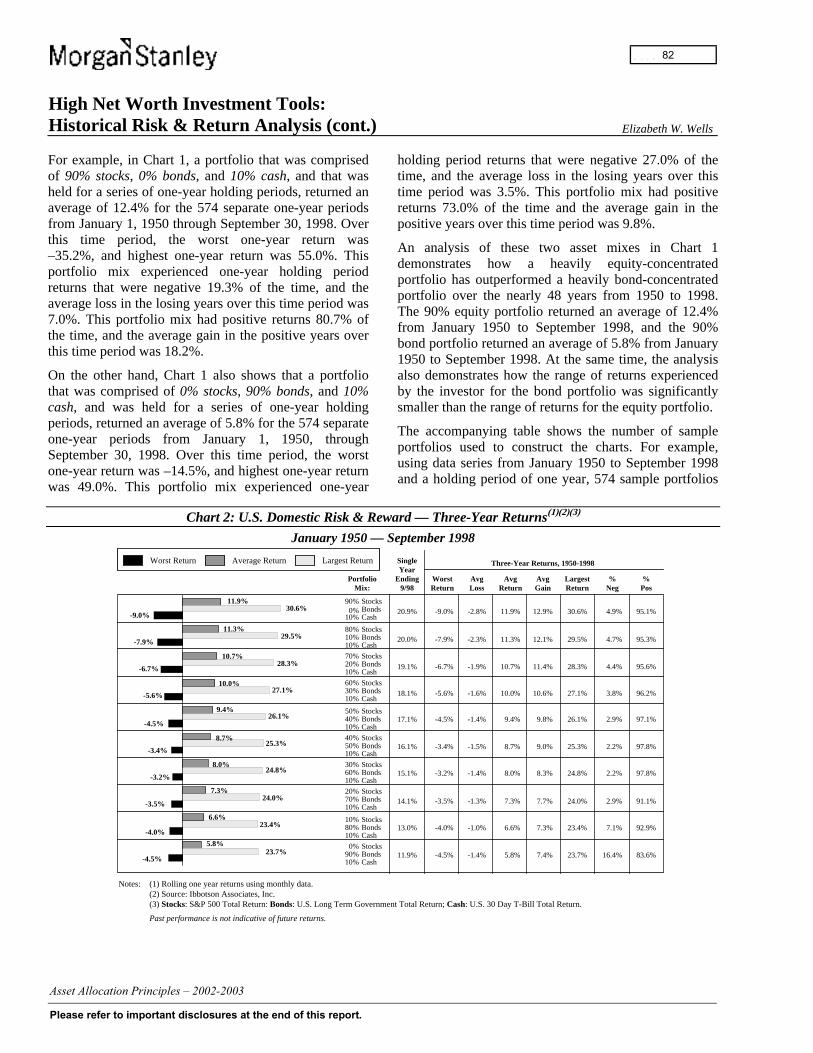
High Net Worth Investment Tools:Historical Risk & Return Analysis (cont.) Elizabeth W. Wells
For example, in Chart 1, a portfolio that was comprisedof 90% stocks, 0% bonds, and 10% cash, and that washeld for a series of one-year holding periods, returned anaverage of 12.4% for the 574 separate one-year periodsfrom January 1, 1950 through September 30, 1998. Overthis time period, the worst one-year return was–35.2%, and highest one-year return was 55.0%. Thisportfolio mix experienced one-year holding periodreturns that were negative 19.3% of the time, and theaverage loss in the losing years over this time period was7.0%. This portfolio mix had positive returns 80.7% ofthe time, and the average gain in the positive years overthis time period was 18.2%.
On the other hand, Chart 1 also shows that a portfoliothat was comprised of 0% stocks, 90% bonds, and 10%cash, and was held for a series of one-year holdingperiods, returned an average of 5.8% for the 574 separateone-year periods from January 1, 1950, throughSeptember 30, 1998. Over this time period, the worstone-year return was –14.5%, and highest one-year returnwas 49.0%. This portfolio mix experienced one-year
holding period returns that were negative 27.0% of thetime, and the average loss in the losing years over thistime period was 3.5%. This portfolio mix had positivereturns 73.0% of the time and the average gain in thepositive years over this time period was 9.8%.
An analysis of these two asset mixes in Chart 1demonstrates how a heavily equity-concentratedportfolio has outperformed a heavily bond-concentratedportfolio over the nearly 48 years from 1950 to 1998.The 90% equity portfolio returned an average of 12.4%from January 1950 to September 1998, and the 90%bond portfolio returned an average of 5.8% from January1950 to September 1998. At the same time, the analysisalso demonstrates how the range of returns experiencedby the investor for the bond portfolio was significantlysmaller than the range of returns for the equity portfolio.
The accompanying table shows the number of sampleportfolios used to construct the charts. For example,using data series from January 1950 to September 1998and a holding period of one year, 574 sample portfolios
Chart 2: U.S. Domestic Risk & Reward — Three-Year Returns(1)(2)(3)
January 1950 — September 1998
- -
-9.0%
-7.9%
-6.7%
-5.6%
-4.5%
-3.4%
-3.2%
-3.5%
-4.0%
-4.5%
11.9%30.6%
11.3%29.5%
10.7%28.3%
10.0%27.1%
9.4%26.1%
8.7%25.3%
8.0%24.8%
7.3%24.0%
6.6%23.4%
5.8%23.7%
20.9%
20.0%
19.1%
18.1%
17.1%
16.1%
15.1%
14.1%
13.0%
11.9%
SingleYear
Ending9/98
0% -9.0%
-7.9%
-6.7%
-5.6%
-4.5%
-3.4%
-3.2%
-3.5%
-4.0%
-4.5%
WorstReturn
-2.8%
-2.3%
-1.9%
-1.6%
-1.4%
-1.5%
-1.4%
-1.3%
-1.0%
-1.4%
AvgLoss
11.9%
11.3%
10.7%
10.0%
9.4%
8.7%
8.0%
7.3%
6.6%
5.8%
AvgReturn
12.9%
12.1%
11.4%
10.6%
9.8%
9.0%
8.3%
7.7%
7.3%
7.4%
AvgGain
30.6%
29.5%
28.3%
27.1%
26.1%
25.3%
24.8%
24.0%
23.4%
23.7%
LargestReturn
4.9%
4.7%
4.4%
3.8%
2.9%
2.2%
2.2%
2.9%
7.1%
16.4%
%Neg
95.1%
95.3%
95.6%
96.2%
97.1%
97.8%
97.8%
91.1%
92.9%
83.6%
%Pos
10%
80%10%
10%
70%20%
10%
60%30%
10%
50%40%
10%
40%50%
10%
30%60%
10%
20%70%
10%
10%80%
10%
0%90%
10%
90%
Cash
StocksBonds
Cash
StocksBonds
Cash
StocksBonds
Cash
StocksBonds
Cash
StocksBonds
Cash
StocksBonds
Cash
StocksBonds
Cash
StocksBonds
Cash
StocksBonds
Cash
StocksBonds
PortfolioMix:
Three-Year Returns, 1950-1998Largest ReturnWorst Return Average Return
Notes: (1) Rolling one year returns using monthly data.(2) Source: Ibbotson Associates, Inc.(3) Stocks: S&P 500 Total Return: Bonds: U.S. Long Term Government Total Return; Cash: U.S. 30 Day T-Bill Total Return.
Past performance is not indicative of future returns.
-
82
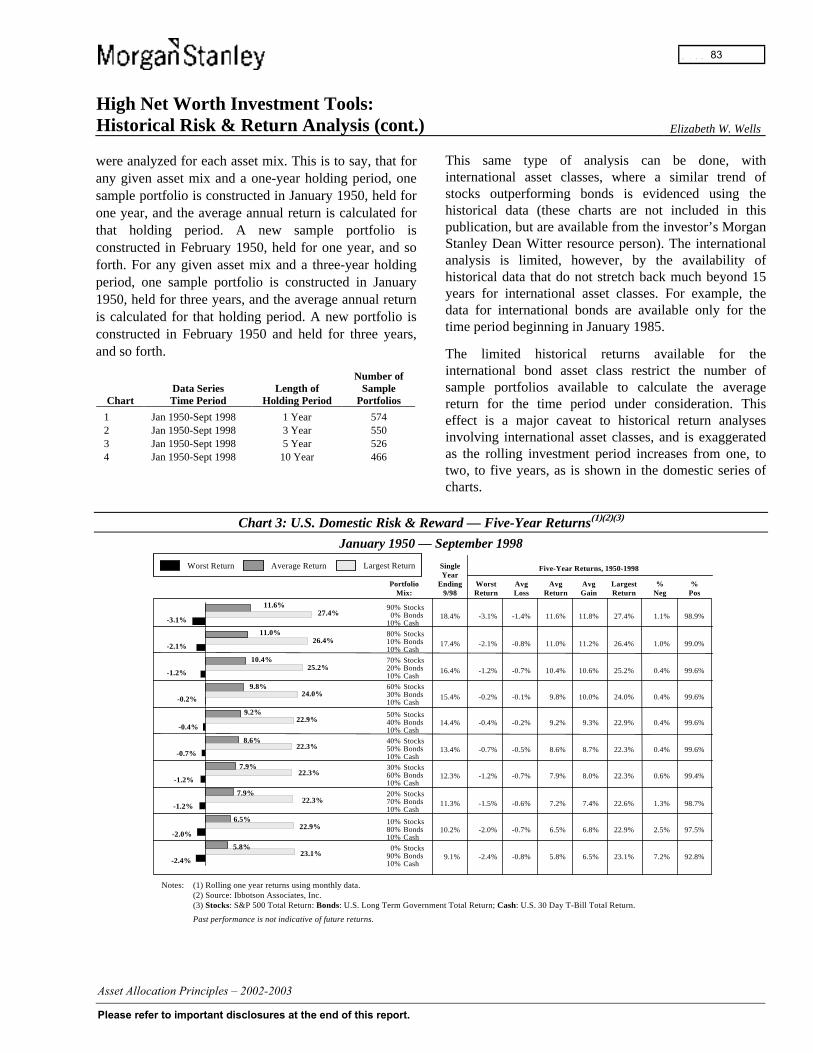
High Net Worth Investment Tools:Historical Risk & Return Analysis (cont.) Elizabeth W. Wells
were analyzed for each asset mix. This is to say, that forany given asset mix and a one-year holding period, onesample portfolio is constructed in January 1950, held forone year, and the average annual return is calculated forthat holding period. A new sample portfolio isconstructed in February 1950, held for one year, and soforth. For any given asset mix and a three-year holdingperiod, one sample portfolio is constructed in January1950, held for three years, and the average annual returnis calculated for that holding period. A new portfolio isconstructed in February 1950 and held for three years,and so forth.
ChartData SeriesTime Period
Length ofHolding Period
Number ofSample
Portfolios
1 Jan 1950-Sept 1998 1 Year 5742 Jan 1950-Sept 1998 3 Year 5503 Jan 1950-Sept 1998 5 Year 5264 Jan 1950-Sept 1998 10 Year 466
This same type of analysis can be done, withinternational asset classes, where a similar trend ofstocks outperforming bonds is evidenced using thehistorical data (these charts are not included in thispublication, but are available from the investor’s MorganStanley Dean Witter resource person). The internationalanalysis is limited, however, by the availability ofhistorical data that do not stretch back much beyond 15years for international asset classes. For example, thedata for international bonds are available only for thetime period beginning in January 1985.
The limited historical returns available for theinternational bond asset class restrict the number ofsample portfolios available to calculate the averagereturn for the time period under consideration. Thiseffect is a major caveat to historical return analysesinvolving international asset classes, and is exaggeratedas the rolling investment period increases from one, totwo, to five years, as is shown in the domestic series ofcharts.
Chart 3: U.S. Domestic Risk & Reward — Five-Year Returns(1)(2)(3)
January 1950 — September 1998
-
-3.1%
-2.1%
-1.2%
-0.2%
-0.4%
-0.7%
-1.2%
-1.2%
-2.0%
-2.4%
11.6%27.4%
11.0%26.4%
10.4%25.2%
9.8%24.0%
9.2%22.9%
8.6%22.3%
7.9%22.3%
7.9%22.3%
6.5%22.9%
5.8%23.1%
18.4%
17.4%
16.4%
15.4%
14.4%
13.4%
12.3%
11.3%
10.2%
9.1%
SingleYear
Ending9/98
10%
90%0% -3.1%
-2.1%
-1.2%
-0.2%
-0.4%
-0.7%
-1.2%
-1.5%
-2.0%
-2.4%
WorstReturn
-1.4%
-0.8%
-0.7%
-0.1%
-0.2%
-0.5%
-0.7%
-0.6%
-0.7%
-0.8%
AvgLoss
11.6%
11.0%
10.4%
9.8%
9.2%
8.6%
7.9%
7.2%
6.5%
5.8%
AvgReturn
11.8%
11.2%
10.6%
10.0%
9.3%
8.7%
8.0%
7.4%
6.8%
6.5%
AvgGain
27.4%
26.4%
25.2%
24.0%
22.9%
22.3%
22.3%
22.6%
22.9%
23.1%
LargestReturn
1.1%
1.0%
0.4%
0.4%
0.4%
0.4%
0.6%
1.3%
2.5%
7.2%
%Neg
98.9%
99.0%
99.6%
99.6%
99.6%
99.6%
99.4%
98.7%
97.5%
92.8%
%Pos
10%
80%10%
10%
70%20%
10%
60%30%
10%
50%40%
10%
40%50%
10%
30%60%
10%
20%70%
10%
10%80%
10%
0%90%
Cash
StocksBonds
Cash
StocksBonds
Cash
StocksBonds
Cash
StocksBonds
Cash
StocksBonds
Cash
StocksBonds
Cash
StocksBonds
Cash
StocksBonds
Cash
StocksBonds
Cash
StocksBonds
PortfolioMix:
Five-Year Returns, 1950-1998Largest ReturnWorst Return Average Return
Notes: (1) Rolling one year returns using monthly data.(2) Source: Ibbotson Associates, Inc.(3) Stocks: S&P 500 Total Return: Bonds: U.S. Long Term Government Total Return; Cash: U.S. 30 Day T-Bill Total Return.
Past performance is not indicative of future returns.
-
83
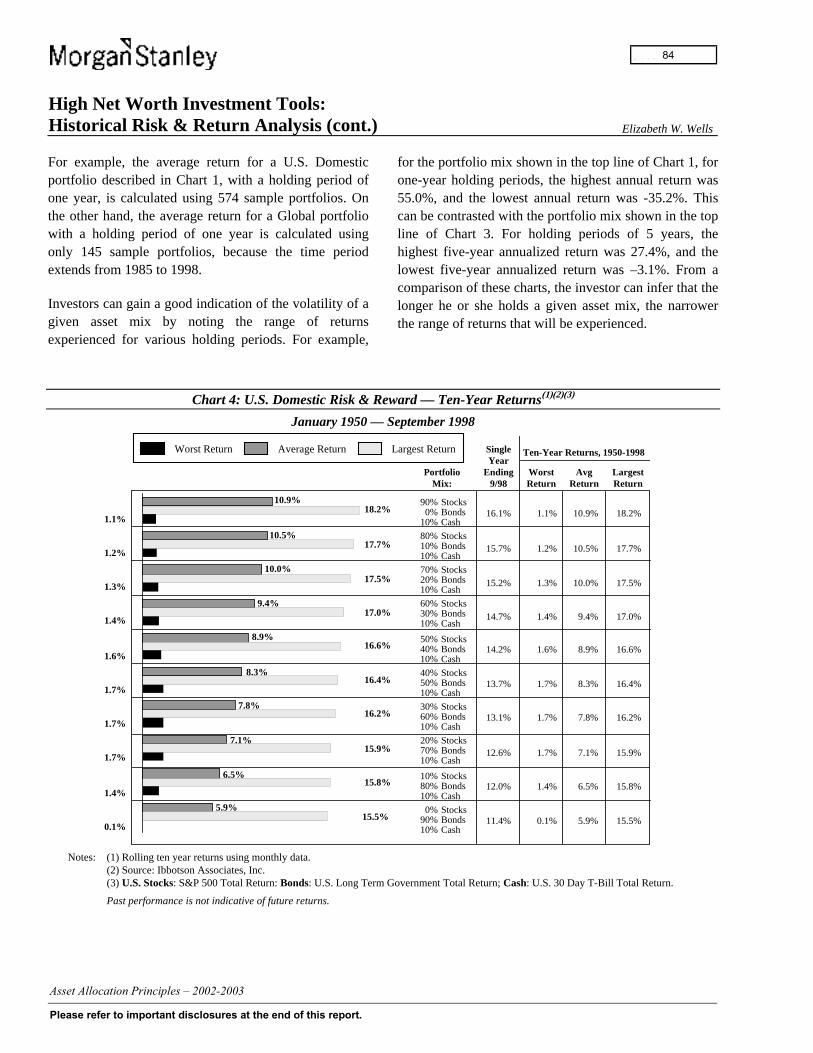
High Net Worth Investment Tools:Historical Risk & Return Analysis (cont.) Elizabeth W. Wells
For example, the average return for a U.S. Domesticportfolio described in Chart 1, with a holding period ofone year, is calculated using 574 sample portfolios. Onthe other hand, the average return for a Global portfoliowith a holding period of one year is calculated usingonly 145 sample portfolios, because the time periodextends from 1985 to 1998.
Investors can gain a good indication of the volatility of agiven asset mix by noting the range of returnsexperienced for various holding periods. For example,
for the portfolio mix shown in the top line of Chart 1, forone-year holding periods, the highest annual return was55.0%, and the lowest annual return was -35.2%. Thiscan be contrasted with the portfolio mix shown in the topline of Chart 3. For holding periods of 5 years, thehighest five-year annualized return was 27.4%, and thelowest five-year annualized return was –3.1%. From acomparison of these charts, the investor can infer that thelonger he or she holds a given asset mix, the narrowerthe range of returns that will be experienced.
Chart 4: U.S. Domestic Risk & Reward — Ten-Year Returns(1)(2)(3)
January 1950 — September 1998
1.1%
1.2%
1.3%
1.4%
1.6%
1.7%
1.7%
1.7%
1.4%
0.1%
10.9%18.2%
10.5%17.7%
10.0%17.5%
9.4%17.0%
8.9%16.6%
8.3%16.4%
7.8%16.2%
7.1%15.9%
6.5%15.8%
5.9%15.5%
16.1%
15.7%
15.2%
14.7%
14.2%
13.7%
13.1%
12.6%
12.0%
11.4%
SingleYear
Ending9/98
10%
90%0% 1.1%
1.2%
1.3%
1.4%
1.6%
1.7%
1.7%
1.7%
1.4%
0.1%
WorstReturn
10.9%
10.5%
10.0%
9.4%
8.9%
8.3%
7.8%
7.1%
6.5%
5.9%
AvgReturn
18.2%
17.7%
17.5%
17.0%
16.6%
16.4%
16.2%
15.9%
15.8%
15.5%
LargestReturn
10%
80%10%
10%
70%20%
10%
60%30%
10%
50%40%
10%
40%50%
10%
30%60%
10%
20%70%
10%
10%80%
10%
0%90%
Cash
StocksBonds
Cash
StocksBonds
Cash
StocksBonds
Cash
StocksBonds
Cash
StocksBonds
Cash
StocksBonds
Cash
StocksBonds
Cash
StocksBonds
Cash
StocksBonds
Cash
StocksBonds
PortfolioMix:
Ten-Year Returns, 1950-1998Largest ReturnWorst Return Average Return
Notes: (1) Rolling ten year returns using monthly data.(2) Source: Ibbotson Associates, Inc.(3) U.S. Stocks: S&P 500 Total Return: Bonds: U.S. Long Term Government Total Return; Cash: U.S. 30 Day T-Bill Total Return.
Past performance is not indicative of future returns.
-
84
High Net Worth Investment Tools:Internet-Based Investment Tools Jennifer V. King
The growth of the internet has realized and surpassedmany early forecasters’ predictions, in the breadth of itsadoption, in average daily online usage, and in range offunctionality. According to Morgan Stanley Dean Witterresearch analyst Mary Meeker, as of late 1998, it wasestimated that there were 82 million internet users, withthis total projected to grow to 400 million or more by theyear 2002.
To date, the internet has been viewed, first, as a researchtool, then, as a medium for advertising, and more recently,as a channel for the purchase of goods and services. Manyof the investment-related services available on the internethave been developed with a mass market in mind, butHigh Net Worth investors should consider which of thissuite of functions has applicability to their needs.
The investment-related internet sites discussed here rangefrom research sources to online trading services, and aredepicted in the diagram on the accompanying page.
Research Sources
Investors can access a wide range of internet-basedresources to quickly obtain company-specific information.Among such sources are: (i) the SEC, for 10-K, 10-Q, and8-K reports; (ii) company-specific sites, for annual reports,product information, and other corporate data; (iii) WallStreet firms, for general information, and, for qualifiedclients of a given firm, access to their “client-link” portalwhich allows rapid access to current data, company globalresearch publications, and reports; (iv) investor chatrooms, for investors’ shared comments, insights, andinternet access providers’ give-and-take about specificcompanies’ outlooks and results; and (v) price quoteservices, giving price data in a variety of formats anddelivery patterns.
On-line Trading
Since its inception a few years ago, on-line trading hasgrown in popularity at a rapid pace. Most of the on-linetrading websites available today are reliable and fast.However, as is the case with all websites on the internet,some problems still exist, such as busy signals and lost orslow connections. On-line trading allows an individual toperform his or her own research and conduct tradingactivities without the assistance of an investmentrepresentative. Most on-line trading sites provide a fullrange of products — stocks, options, mutual funds, andbonds, but some, such as www.treasurydirect.gov,specialize in only one area. As with every activity in theinvestment arena, trading on-line requires due diligence,research, and caution before moving ahead.
Economic Forecasts, Financial Advice, and MarketCommentary
The internet is host to a whole range of sites that provideeconomic forecasts and current data on various economicindicators, such as the unemployment rate, the consumerprice index, and stock and bond prices. Financial advice isalso readily available on-line. Almost all of the financialadvice sites provide a disclaimer stating that they cannotbe held liable for any advice that results in a loss for theinvestor. For a day-by-day, and in many cases, an intradayaccount of market activity, there are several sites thatprovide market commentary. These sites are set up bycompanies or independent operators with varying degreesof depth of coverage.
Investment Education
Investors can avail themselves of the fundamentals of anon-line investment education from leading investmentmanagement firms with websites, such as FidelityInvestments and The Vanguard Group. Most of theinformation provided on these firm-sponsored sites isavailable exclusively to the companies’ paying customers,and in some cases, a demonstration is provided forpotential customers.
Currently, a handful of websites provide portfolioreporting and tax software free of charge. The softwarecan be downloaded from the website, provided that theprogram is compatible with the investor’s PC operatingsystem. Among the portfolio tracking software packagesare: (i) MedVed’s Quote Tracker (www.medved.net),which can monitor an unlimited number of portfoliosdisplayed in a spreadsheet-like format; (ii) AlphaMicrosystems (www.alphaconnect.com), which sets upportfolios with mutual funds, U.S. and Canadian stocks, aswell as fixed-income securities; and (iii) StockTick(www.naconsulting.com), which contains several portfolioanalysis features.
Effective Use of Internet Investment Resources
Access to rapid and reliable connectivity is an importantelement in maximizing the effectiveness of the internet asan investment resource. A fast computer and a speedyhookup — either at work, at school, or in libraries, with ahigh-speed, T-1 connection — make a great deal ofdifference not only in the amount of time expended, but inthe quality of the search.
When choosing between pay-per-use vs. fee-basedpayment methods, paying for an investment researchvehicle or for an on-line trading service may be worth it,depending on how much time is spent conducting research
-
85
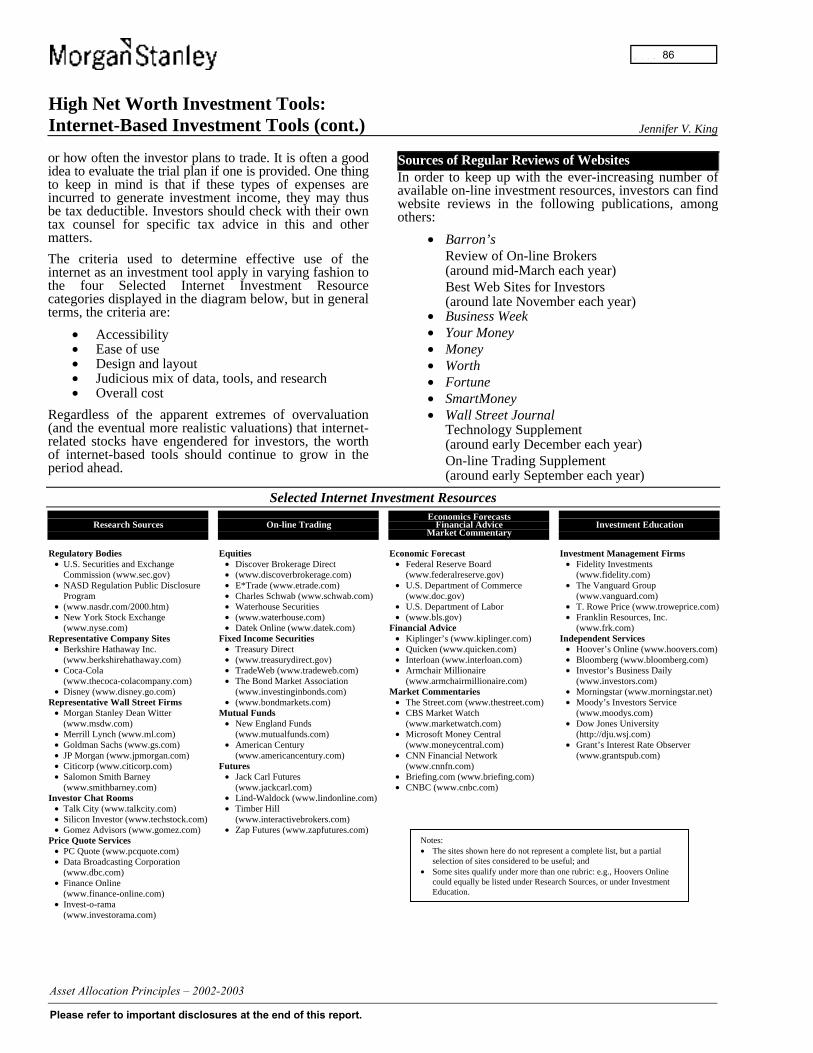
High Net Worth Investment Tools:Internet-Based Investment Tools (cont.) Jennifer V. King
or how often the investor plans to trade. It is often a goodidea to evaluate the trial plan if one is provided. One thingto keep in mind is that if these types of expenses areincurred to generate investment income, they may thusbe tax deductible. Investors should check with their owntax counsel for specific tax advice in this and othermatters.
The criteria used to determine effective use of theinternet as an investment tool apply in varying fashion tothe four Selected Internet Investment Resourcecategories displayed in the diagram below, but in generalterms, the criteria are:
• Accessibility• Ease of use• Design and layout• Judicious mix of data, tools, and research• Overall cost
Regardless of the apparent extremes of overvaluation(and the eventual more realistic valuations) that internet-related stocks have engendered for investors, the worthof internet-based tools should continue to grow in theperiod ahead.
Sources of Regular Reviews of WebsitesIn order to keep up with the ever-increasing number ofavailable on-line investment resources, investors can findwebsite reviews in the following publications, amongothers:
• Barron’sReview of On-line Brokers(around mid-March each year)Best Web Sites for Investors(around late November each year)
• Business Week• Your Money• Money• Worth• Fortune• SmartMoney• Wall Street Journal
Technology Supplement(around early December each year)On-line Trading Supplement(around early September each year)
Selected Internet Investment Resources
Research Sources On-line TradingEconomics Forecasts
Financial AdviceMarket Commentary
Investment Education
Regulatory Bodies• U.S. Securities and Exchange
Commission (www.sec.gov)• NASD Regulation Public Disclosure
Program• (www.nasdr.com/2000.htm)• New York Stock Exchange
(www.nyse.com)Representative Company Sites
• Berkshire Hathaway Inc.(www.berkshirehathaway.com)
• Coca-Cola(www.thecoca-colacompany.com)
• Disney (www.disney.go.com)Representative Wall Street Firms
• Morgan Stanley Dean Witter(www.msdw.com)
• Merrill Lynch (www.ml.com)• Goldman Sachs (www.gs.com)• JP Morgan (www.jpmorgan.com)• Citicorp (www.citicorp.com)• Salomon Smith Barney
(www.smithbarney.com)Investor Chat Rooms
• Talk City (www.talkcity.com)• Silicon Investor (www.techstock.com)• Gomez Advisors (www.gomez.com)
Price Quote Services• PC Quote (www.pcquote.com)• Data Broadcasting Corporation
(www.dbc.com)• Finance Online
(www.finance-online.com)• Invest-o-rama
(www.investorama.com)
Equities• Discover Brokerage Direct• (www.discoverbrokerage.com)• E*Trade (www.etrade.com)• Charles Schwab (www.schwab.com)• Waterhouse Securities• (www.waterhouse.com)• Datek Online (www.datek.com)
Fixed Income Securities• Treasury Direct• (www.treasurydirect.gov)• TradeWeb (www.tradeweb.com)• The Bond Market Association
(www.investinginbonds.com)• (www.bondmarkets.com)
Mutual Funds• New England Funds
(www.mutualfunds.com)• American Century
(www.americancentury.com)Futures
• Jack Carl Futures(www.jackcarl.com)
• Lind-Waldock (www.lindonline.com)• Timber Hill
(www.interactivebrokers.com)• Zap Futures (www.zapfutures.com)
Economic Forecast• Federal Reserve Board
(www.federalreserve.gov)• U.S. Department of Commerce
(www.doc.gov)• U.S. Department of Labor• (www.bls.gov)
Financial Advice• Kiplinger’s (www.kiplinger.com)• Quicken (www.quicken.com)• Interloan (www.interloan.com)• Armchair Millionaire
(www.armchairmillionaire.com)Market Commentaries
• The Street.com (www.thestreet.com)• CBS Market Watch
(www.marketwatch.com)• Microsoft Money Central
(www.moneycentral.com)• CNN Financial Network
(www.cnnfn.com)• Briefing.com (www.briefing.com)• CNBC (www.cnbc.com)
Investment Management Firms• Fidelity Investments
(www.fidelity.com)• The Vanguard Group
(www.vanguard.com)• T. Rowe Price (www.troweprice.com)• Franklin Resources, Inc.
(www.frk.com)Independent Services
• Hoover’s Online (www.hoovers.com)• Bloomberg (www.bloomberg.com)• Investor’s Business Daily
(www.investors.com)• Morningstar (www.morningstar.net)• Moody’s Investors Service
(www.moodys.com)• Dow Jones University
(http://dju.wsj.com)• Grant’s Interest Rate Observer
(www.grantspub.com)
Notes:• The sites shown here do not represent a complete list, but a partial
selection of sites considered to be useful; and• Some sites qualify under more than one rubric: e.g., Hoovers Online
could equally be listed under Research Sources, or under InvestmentEducation.
-
86

High Net Worth Investment Tools:The Family Office in the New Millennium Stephanie A. Whittier
Over the past decade or so, the family office has becomea financial market participant whose role, while stillvaluable, has not experienced the same growth andconsolidation as the other areas in the investing andfinancial services arena and therefore lacks many of theresources that it needs to be effective.
In Bill Gates’ recent book, Business @ The Speed ofThought: Using a Digital Nervous System, Gates assertsthat the 1980s were about quality, the 1990s aboutre-engineering, and the 2000s are about velocity. TheHNW investor should ask whether his or her familyoffice is equipped to handle the wealth generation tokeep pace with the velocity of the next 10 decades.Overestimating the impact of the next two years andunderestimating the impact of the next 20 years canhave a significant impact on financial and estateplanning goals.
As CEO of the family’s financial resources, the HNWinvestor’s strategy should be to develop the right vision andget the right people to execute it. Set forth below are someideas and insights gained from extensive exposure to andinvolvement with the family office decision process.
Critical Success Factors Affecting the Family Officein the New Millennium
1. Integrity, intelligence, and effectiveness in executionwith a bias toward preservation of capital and riskmanagement.
2. Superior quality investment insight, access toservice, and highly tailored solutions to complexfinancial, tax, and legal issues.
3. Reporting capabilities and technology that candeliver information that is immediate, constant (realtime), accurate, and understandable.
4. The ability to share knowledge about a wide varietyof top-quality investment managers.
5. Procedures for controlling excessive paperwork andpreserving the orderliness of custodied assets.
6. Demonstrated initiative in making specificrecommendations in anticipation of and/or inresponse to market conditions.
7. The simplification of the HNW investor’s financiallife.
Traditionally, the family office was thought of as aformal organization for creating, managing, andpreserving the substantial wealth of old-line families.Faced with the prospect of once-vast fortunesdissipating, descendants of the DuPonts, Vanderbilts,Rockefellers, and others used the family office as ameans to preserve and manage their collective wealth.Today, the expense of a full-service single-family officecan be considerable. The family office may not wish todedicate or have the resources to properly counsel,diversify, custody, and report on all assets efficientlyenough to justify the costs of doing so.
Morgan Stanley Dean Witter’s Wealth ManagementService, and similar services at a small number of otherfirms evolved out of the need for a cost-effective way toprovide the High Net Worth investor with services thatwere traditionally offered through the family office, andwere cost-effective only for the super-rich.
Family Office Decision Considerations
LifestyleDecisions
InvestmentUniverse
TailoredFamilyOffice
Structure
Family OfficeInvestment Process
Full-Time Investing
Family OfficeServices
Part-Time Investing
Other Business Interests
U.S. Only
Global
Non-U.S. Only
External GeneralistExternal Asset Class Specialists
Internal GeneralistExternal Asset Class Specialists
Internal GeneralistInternal Asset Class Specialists
Full Service
Hybrid
Specific Services
� Investment Experience
� Financial Markets Interest
� Additional Business Interests
Decision Making Considerations
� Existing Asset Base
� InvestmentObjectives
� Diversification
� Asset Correlations
� Risk Management
� Asset Class Preferences
� Implementation Preferences
� Assets Under Management
� Proximity
� Staffing
� Family Size andComplexity
� Financial ServiceNeeds
� Cost Constraints
� GenerationalIssues
Source: MSDW Private Wealth Management Asset Allocation Group.
-
87
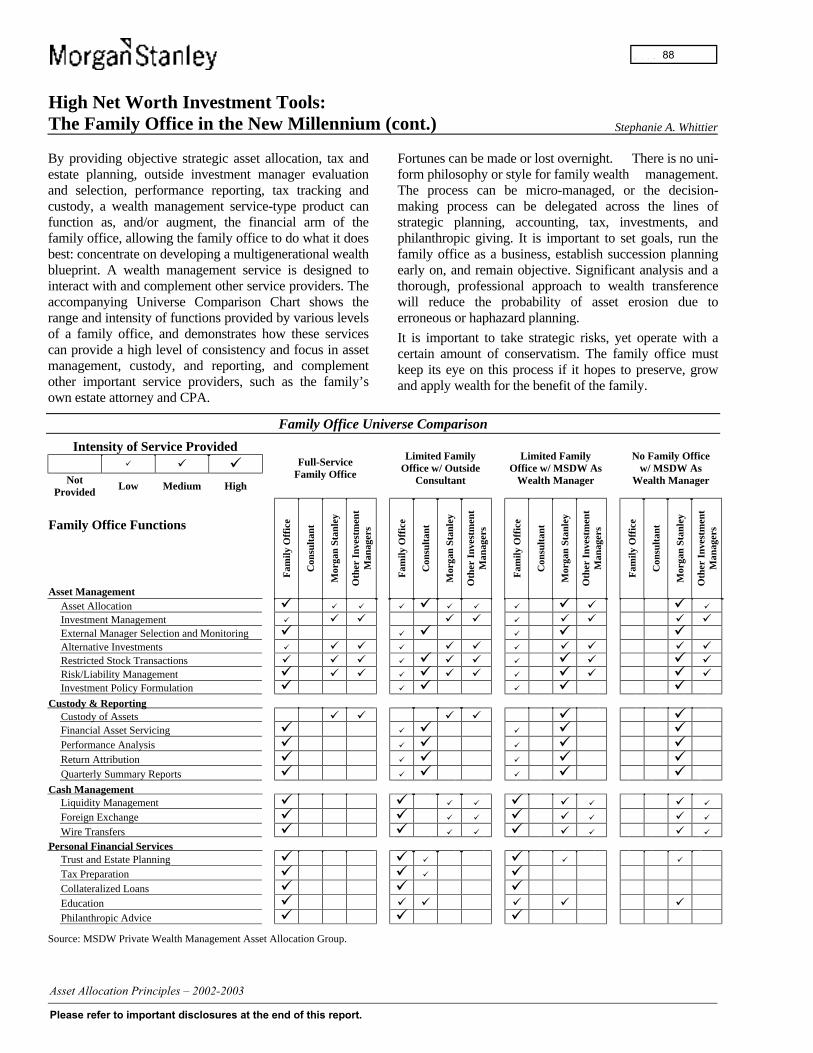
High Net Worth Investment Tools:The Family Office in the New Millennium (cont.) Stephanie A. Whittier
By providing objective strategic asset allocation, tax andestate planning, outside investment manager evaluationand selection, performance reporting, tax tracking andcustody, a wealth management service-type product canfunction as, and/or augment, the financial arm of thefamily office, allowing the family office to do what it doesbest: concentrate on developing a multigenerational wealthblueprint. A wealth management service is designed tointeract with and complement other service providers. Theaccompanying Universe Comparison Chart shows therange and intensity of functions provided by various levelsof a family office, and demonstrates how these servicescan provide a high level of consistency and focus in assetmanagement, custody, and reporting, and complementother important service providers, such as the family’sown estate attorney and CPA.
Fortunes can be made or lost overnight. There is no uni-form philosophy or style for family wealth management.The process can be micro-managed, or the decision-making process can be delegated across the lines ofstrategic planning, accounting, tax, investments, andphilanthropic giving. It is important to set goals, run thefamily office as a business, establish succession planningearly on, and remain objective. Significant analysis and athorough, professional approach to wealth transferencewill reduce the probability of asset erosion due toerroneous or haphazard planning.
It is important to take strategic risks, yet operate with acertain amount of conservatism. The family office mustkeep its eye on this process if it hopes to preserve, growand apply wealth for the benefit of the family.
Family Office Universe Comparison
Intensity of Service Provided� � �
NotProvided Low Medium High
Full-ServiceFamily Office
Limited FamilyOffice w/ Outside
Consultant
Limited FamilyOffice w/ MSDW As
Wealth Manager
No Family Officew/ MSDW As
Wealth Manager
Family Office Functions
Asset Management
Fam
ily O
ffic
e
Con
sult
ant
Mor
gan
Stan
ley
Oth
er I
nves
tmen
tM
anag
ers
Fam
ily O
ffic
e
Con
sult
ant
Mor
gan
Stan
ley
Oth
er I
nves
tmen
tM
anag
ers
Fam
ily O
ffic
e
Con
sult
ant
Mor
gan
Stan
ley
Oth
er I
nves
tmen
tM
anag
ers
Fam
ily O
ffic
e
Con
sult
ant
Mor
gan
Stan
ley
Oth
er I
nves
tmen
tM
anag
ers
Asset Allocation � � � � � � � � � � � �
Investment Management � � � � � � � � � �External Manager Selection and Monitoring � � � � � �Alternative Investments � � � � � � � � � � �Restricted Stock Transactions � � � � � � � � � � � �Risk/Liability Management � � � � � � � � � � � �Investment Policy Formulation � � � � � �
Custody & ReportingCustody of Assets � � � � � �Financial Asset Servicing � � � � � �Performance Analysis � � � � � �Return Attribution � � � � � �Quarterly Summary Reports � � � � � �
Cash ManagementLiquidity Management � � � � � � � � �
Foreign Exchange � � � � � � � � �
Wire Transfers � � � � � � � � �
Personal Financial ServicesTrust and Estate Planning � � � � � �
Tax Preparation � � � �Collateralized Loans � � �Education � � � � � �Philanthropic Advice � � �
Source: MSDW Private Wealth Management Asset Allocation Group.
-
88
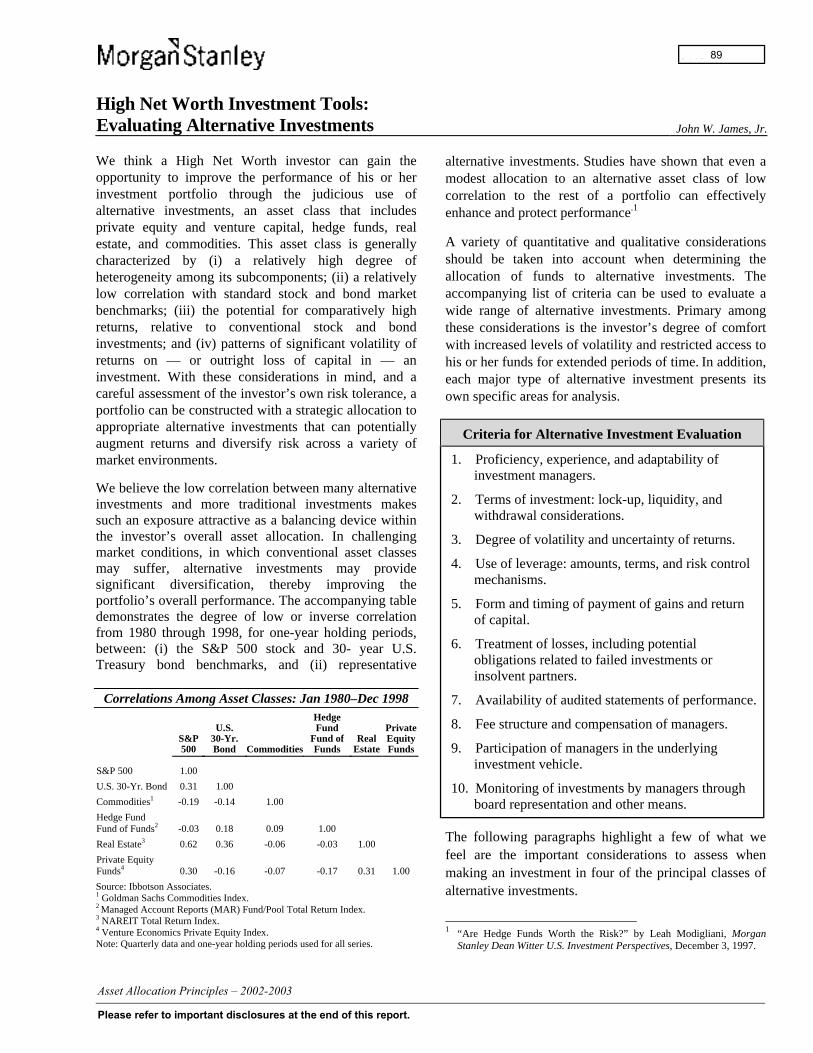
High Net Worth Investment Tools:Evaluating Alternative Investments John W. James, Jr.
We think a High Net Worth investor can gain theopportunity to improve the performance of his or herinvestment portfolio through the judicious use ofalternative investments, an asset class that includesprivate equity and venture capital, hedge funds, realestate, and commodities. This asset class is generallycharacterized by (i) a relatively high degree ofheterogeneity among its subcomponents; (ii) a relativelylow correlation with standard stock and bond marketbenchmarks; (iii) the potential for comparatively highreturns, relative to conventional stock and bondinvestments; and (iv) patterns of significant volatility ofreturns on — or outright loss of capital in — aninvestment. With these considerations in mind, and acareful assessment of the investor’s own risk tolerance, aportfolio can be constructed with a strategic allocation toappropriate alternative investments that can potentiallyaugment returns and diversify risk across a variety ofmarket environments.
We believe the low correlation between many alternativeinvestments and more traditional investments makessuch an exposure attractive as a balancing device withinthe investor’s overall asset allocation. In challengingmarket conditions, in which conventional asset classesmay suffer, alternative investments may providesignificant diversification, thereby improving theportfolio’s overall performance. The accompanying tabledemonstrates the degree of low or inverse correlationfrom 1980 through 1998, for one-year holding periods,between: (i) the S&P 500 stock and 30- year U.S.Treasury bond benchmarks, and (ii) representative
Correlations Among Asset Classes: Jan 1980–Dec 1998
S&P500
U.S.30-Yr.Bond Commodities
HedgeFund
Fund ofFunds
RealEstate
PrivateEquityFunds
S&P 500 1.00
U.S. 30-Yr. Bond 0.31 1.00
Commodities1 -0.19 -0.14 1.00
Hedge FundFund of Funds2 -0.03 0.18 0.09 1.00
Real Estate3 0.62 0.36 -0.06 -0.03 1.00
Private EquityFunds4 0.30 -0.16 -0.07 -0.17 0.31 1.00
Source: Ibbotson Associates.1 Goldman Sachs Commodities Index.2 Managed Account Reports (MAR) Fund/Pool Total Return Index.3 NAREIT Total Return Index.4 Venture Economics Private Equity Index.Note: Quarterly data and one-year holding periods used for all series.
alternative investments. Studies have shown that even amodest allocation to an alternative asset class of lowcorrelation to the rest of a portfolio can effectivelyenhance and protect performance.1
A variety of quantitative and qualitative considerationsshould be taken into account when determining theallocation of funds to alternative investments. Theaccompanying list of criteria can be used to evaluate awide range of alternative investments. Primary amongthese considerations is the investor’s degree of comfortwith increased levels of volatility and restricted access tohis or her funds for extended periods of time. In addition,each major type of alternative investment presents itsown specific areas for analysis.
Criteria for Alternative Investment Evaluation
1. Proficiency, experience, and adaptability ofinvestment managers.
2. Terms of investment: lock-up, liquidity, andwithdrawal considerations.
3. Degree of volatility and uncertainty of returns.
4. Use of leverage: amounts, terms, and risk controlmechanisms.
5. Form and timing of payment of gains and returnof capital.
6. Treatment of losses, including potentialobligations related to failed investments orinsolvent partners.
7. Availability of audited statements of performance.
8. Fee structure and compensation of managers.
9. Participation of managers in the underlyinginvestment vehicle.
10. Monitoring of investments by managers throughboard representation and other means.
The following paragraphs highlight a few of what wefeel are the important considerations to assess whenmaking an investment in four of the principal classes ofalternative investments.
1 “Are Hedge Funds Worth the Risk?” by Leah Modigliani, Morgan
Stanley Dean Witter U.S. Investment Perspectives, December 3, 1997.
-
89
High Net Worth Investment Tools:Evaluating Alternative Investments (cont.) John W. James, Jr.
Private Equity/Venture CapitalThrough the vehicles of private equity and venturecapital funds, High Net Worth investors can accessspecialized investment opportunities not readilyavailable to most investors. Over time, these types ofinvestments can result in significant gains, as one’spartial ownership in a growing business increases invalue, but such investments can also involve substantialrisks that an investor must evaluate carefully.
To begin, a High Net Worth investor must be preparedfor his or her allocation to such an investment to remainilliquid for the intermediate to long term. Private equityand venture capital funds typically require that theinvested capital remain in the partnership for a minimumof three years, sometimes significantly longer. Inaddition, during this extended time period, such aninvestment may experience a much greater degree ofvolatility and uncertainty of performance than exhibitedby more traditional investment classes. Often, theperformance of a venture capital investment is notmeasurable with any high degree of certainty for a periodof years.
While such illiquidity might dissuade some investors, forthose able to accommodate the risks, there can beadditional long-term rewards. Investing in non-efficientmarkets, where information is scarce and where specificbusiness expertise is essential, can work to a High NetWorth investor’s benefit and augment investmentreturns. David J. Swenson, the Chief Investment Officerfor the endowment of Yale University since 1985, hasregularly sought investment opportunities in lessefficient markets. Mr. Swenson has noted that, in recentyears, there has been a much greater differential betweenthe 25th and 75th percentile performance in illiquidinvestments than in traditional ones, suggesting that onecan produce incrementally better returns in alternativeinvestments through the careful selection of bettermanagers.2 Therefore, the evaluation of the experienceand abilities of a private equity or venture capital fundmanager becomes one of the most important criteria inselecting an investment fund.
Consider the role of the managers of a private equity orventure capital fund. As the investment-selection body
2 Harvard Business School case study: Yale University Investments
Office, Harvard Business School Publishing, Boston, 1995, p.4.
of the fund, these managers utilize the full measure oftheir experience to rigorously evaluate private equity andventure opportunities by identifying the potential andrisks of specialized business investments.
The business risks facing a fledgling company in whichthe fund might invest often range from the expected —such as the company struggling to retain its competitiveadvantage in an evolving business environment, and/oreffective management of the company’s growth — to theunexpected — such as the resignation of key companypersonnel or unanticipated litigation. It follows from thishigh degree of uncertainty that one of the most importantconsiderations a venture capital fund manager seeks inmaking an investment in a company, independent of thedetails of the particular venture, would be the reliability,leadership, and proven adaptability of the investeecompany’s management team.
A venture capital fund manager’s own experience insuccessfully managing a business can prove invaluableby enhancing his or her ability both to select promisingbusinesses for the fund’s portfolio and to provideeffective management guidance on portfolio companies’boards. Accordingly, a High Net Worth investor’sselection of a private equity or venture capital fundshould consider the fund management’s ability toidentify and resolve management and operationalchallenges facing its portfolio’s businesses and tocontribute to the strategic development of the fund’sportfolio companies.
In all cases, the investor should be fairly certain that hisor her investment interests can be defended in virtuallyall scenarios. He or she should understand in detail themechanics governing the distribution of profits fromsuccessful investments and the precautions taken toprotect his or her investment in the event of worst-casescenarios. The investor should ascertain whether he orshe could face drawdown or follow-on obligations in thecase of a failed investment or the default of anotherpartner in the fund. Ultimately, the investor should besatisfied with the degree of the fund’s contingencyplanning and the establishment of prudent exit strategies,where feasible.
One indication that an investment would receivepremium attention from the fund’s managers is themanagement team’s own substantial investment in thefund. A High Net Worth investor should look for this
-
90
High Net Worth Investment Tools:Evaluating Alternative Investments (cont.) John W. James, Jr.
level of commitment and involvement from privateequity and venture capital fund managers.
Real Estate
We believe investing in real estate, either through a fundof private investments or through the purchase of REITs,can augment portfolio performance through generallyless-correlated investments, effectively reducing the riskof an investor’s portfolio to fluctuations in the broadermarkets. This diversification benefit, however, maycome at the cost of liquidity and the assumption ofdifferent types of risk indigenous to the real estatebusiness. Among the important considerations wheninvesting in a real estate fund is the selection of effectivemanagers, both for their investment managementexperience and their proximity to deal flow, whichshould facilitate the identification of and successfulengagement in advantageous transactions.
While being in touch with sources of new real estateopportunities is essential, we believe it is the experienceand proficiency of the managers that determine thefund’s ability to make productive use of its resources andrelationships to secure auspicious investments. Aninvestor should understand the investment selectionprocess in detail, the level of the managers’ participationin structuring or investing in recent deals, and beconfident that the management of the fund is in aposition to command a leadership role in pursuing futureinvestments.
Investors in real estate must be prepared to accept thereduced liquidity and increased length of time that aninvestment in this asset class requires. In most cases,REITs offer greater liquidity than a direct investmentfund, but both investment approaches require planningfor the intermediate to longer term.
A real estate fund’s list of previously completed deals,and their performance, can give an indication of thefund’s success in the transactions with which it has beeninvolved, and what capacity its involvement hasassumed. For example, a fund which has regularly andsuccessfully been the majority holder or managingpartner in its investments may generally be considered tohave evidenced a leadership role.
An investor should have a thorough understanding ofexit strategies and any obligations in the event of a failedinvestment or a catastrophic loss. In addition, he or she
should be comfortable with the use of leverage, if any, inthe fund. Understanding the compensation structurewould also be important for a real estate fund, especiallywhere compensation based on appraised portfolio valuescould present a conflict of interest. As with privateequity and venture capital investments, managers’participation in the real estate investment vehicle is animportant indication of alignment with the interests ofoutside investors, in our view.
Hedge Fund Fund of Funds
High Net Worth investors have sought out hedge fundsto provide low correlation to the rest of a portfolio, withthe goal of providing positive returns regardless ofoverall market direction. Hedge funds have for manyyears been associated with large returns, andoccasionally, magnified losses. As a result of well-publicized negative performance during all or part of1998 by some hedge funds, investors have becomesignificantly more discerning in their approach to hedgefund investments. We found that one way to control riskin making hedge fund investments is through a hedgefund fund of funds, a structure which itself invests inseveral hedge funds, thus diversifying exposure to anyone hedge fund’s fortunes.
As with the private equity and real estate asset classes,the success of a strategy in the hedge fund fund of fundsasset class would depend heavily on the experience ofthe manager. An investor should determine the relevanceof the manager’s investment experience within the statedinvestment discipline(s), the strength of his or her trackrecord, and the clarity of his or her philosophy as ahedge fund strategist and investment manager. Alsovaluable in making a full assessment is a list of recentinvestments by the fund, their performance results, andan indication of the other types of investors in the fund.
While hedge funds have traditionally been known to bevery protective of their performance data, in recent years,hedge funds have placed an increased emphasis ontransparency of strategies and performancemeasurement. Investors should take advantage of thishigher degree of disclosure to understand more clearlyhow individual funds’ strategies work. The recentcompilation of 1998 hedge funds’, and hedge fund fundof funds’, performance in Barron’s shows a significantdifference in range of performance between hedge funds
-
91
High Net Worth Investment Tools:Evaluating Alternative Investments (cont.) John W. James, Jr.
and hedge fund fund of funds.3 Among hedge funds, theaverage performance of the 10 best-performing funds in1998 was +120.1%, while the 10 worst-performing fundslost an average of 56.9%. Such a wide range ofperformance among hedge funds argues fordiversification among hedge funds, thereby limitingexposure to any single fund’s strategy. Among hedgefund fund of funds, the average performance of the topand bottom 10 funds in 1998 was +21.4% and –25.1%, amuch narrower range.
The wide variance of hedge funds’ performanceunderscores the need for an investor to understand themeans by which a fund of funds manager constructs aportfolio of hedge fund investments to performeffectively as a diversified unit. In addition, an investorshould understand clearly the performance of the hedgefund as expressed by its investment returns, the volatilityof the returns, and the correlation of the returns tostandard industry benchmarks. In evaluating thediversification strategies and interpreting theperformance metrics of a hedge fund fund of funds, theexpert advice of a qualified fund evaluator may beuseful.
An investor should clearly understand the procedures ofthe hedge fund fund of funds for capital withdrawal. Heor she should determine what level of liquidity to expect,both in normal market conditions and in more distressedmarket situations. It should be clear to what extent thehedge fund fund of funds is constrained by the liquidityof individual funds in fulfilling withdrawal requests forinvestors. An investor should understand the use ofleverage in the funds’ strategies and be knowledgeableabout what market circumstances might result in acapital call or other financial obligation. Finally, aninvestor should determine the fee structure for the hedgefund fund of funds, making sure that the hedge fund fundof funds’ fee is comprehensive and includes allsubordinate funds’ management fees.
Commodities
While commodity investments are often regarded asvolatile, this volatility is frequently amplified by theassociated use of leverage by many commodityinvestors. An exposure to commodities can offer stabilityto a portfolio in times when other financial marketsexperience volatility. At the same time, commodities’
3 Barron’s, February 15, 1999.
sensitivities to a separate set of influences can workagainst the investor in an otherwise positive financialmarket environment, and commodity prices can shiftrapidly in the face of global political and economicevents.
As with the asset classes discussed earlier, theexperience of the managers managing a commoditiesportfolio may provide the best indication of aninvestment’s ability to execute a consistent and logicalinvestment discipline. An investor should ensure that themanager has a qualifying amount of relevant backgroundexperience in the commodities markets and ininvestment management.
The investor should understand the degree ofdiversification in the commodity fund and understand theinterplay and correlations between the various parts ofthe portfolio. The investor should also investigate howleverage and short-selling strategies may be applied toenhance portfolio returns, and should understand theextent of any potential magnification of losses due to theuse of these strategies in the event of unfavorable marketmoves. The investor should also be aware of anypotential financial obligations which could arise in anegative market environment. Finally, the investorshould confirm the dates and terms of the availability ofinvested funds for withdrawal and the process by whichdistributions on gains are paid.
Personal Investment Considerations
Once an investor has reviewed the merits of a potentialinvestment in an alternative investment class using theguidelines discussed above, it is important for theinvestor to consider the investment in the context of hisor her broader investment portfolio. After determining anappropriate allocation, taking into account the investor’stolerance for volatility and illiquidity, the investor shouldrequest and review a proposal for investment from a fundunder consideration. This information should includeaudited performance data, statements of strategies andinvestment disciplines, and the terms of investment.Applying the evaluation criteria listed at the beginning ofthis essay to the offering memorandum, and pursuing theother relevant analyses in each of the alternative assetclass subcategories described above, should help apotential investor in alternative assets in making better-informed investment decisions.
-
92
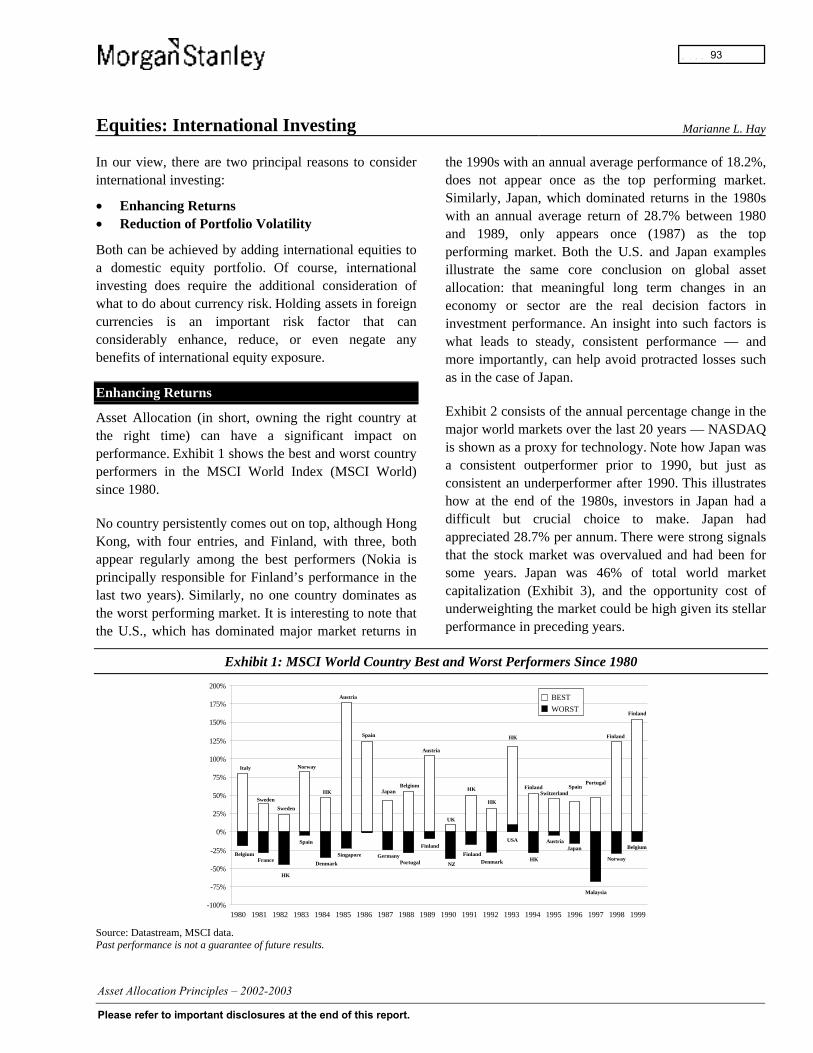
Equities: International Investing Marianne L. Hay
In our view, there are two principal reasons to considerinternational investing:
• Enhancing Returns• Reduction of Portfolio Volatility
Both can be achieved by adding international equities toa domestic equity portfolio. Of course, internationalinvesting does require the additional consideration ofwhat to do about currency risk. Holding assets in foreigncurrencies is an important risk factor that canconsiderably enhance, reduce, or even negate anybenefits of international equity exposure.
Enhancing Returns
Asset Allocation (in short, owning the right country atthe right time) can have a significant impact onperformance. Exhibit 1 shows the best and worst countryperformers in the MSCI World Index (MSCI World)since 1980.
No country persistently comes out on top, although HongKong, with four entries, and Finland, with three, bothappear regularly among the best performers (Nokia isprincipally responsible for Finland’s performance in thelast two years). Similarly, no one country dominates asthe worst performing market. It is interesting to note thatthe U.S., which has dominated major market returns in
the 1990s with an annual average performance of 18.2%,does not appear once as the top performing market.Similarly, Japan, which dominated returns in the 1980swith an annual average return of 28.7% between 1980and 1989, only appears once (1987) as the topperforming market. Both the U.S. and Japan examplesillustrate the same core conclusion on global assetallocation: that meaningful long term changes in aneconomy or sector are the real decision factors ininvestment performance. An insight into such factors iswhat leads to steady, consistent performance — andmore importantly, can help avoid protracted losses suchas in the case of Japan.
Exhibit 2 consists of the annual percentage change in themajor world markets over the last 20 years — NASDAQis shown as a proxy for technology. Note how Japan wasa consistent outperformer prior to 1990, but just asconsistent an underperformer after 1990. This illustrateshow at the end of the 1980s, investors in Japan had adifficult but crucial choice to make. Japan hadappreciated 28.7% per annum. There were strong signalsthat the stock market was overvalued and had been forsome years. Japan was 46% of total world marketcapitalization (Exhibit 3), and the opportunity cost ofunderweighting the market could be high given its stellarperformance in preceding years.
Exhibit 1: MSCI World Country Best and Worst Performers Since 1980
-100%
-75%
-50%
-25%
0%
25%
50%
75%
100%
125%
150%
175%
200%
1980 1981 1982 1983 1984 1985 1986 1987 1988 1989 1990 1991 1992 1993 1994 1995 1996 1997 1998 1999
Italy
Belgium
Sweden
France
HK
Sweden
Norway
Spain
Denmark
HK
Austria
Singapore
Spain
Japan
Germany
Belgium
Portugal
Finland
Austria
UK
HK
HK
NZ
FinlandDenmark
USA
HK
FinlandSwitzerland
SpainPortugal
Finland
Finland
HK
AustriaJapan
Malaysia
Norway
Belgium
BEST
WORST
Source: Datastream, MSCI data.Past performance is not a guarantee of future results.
-
93
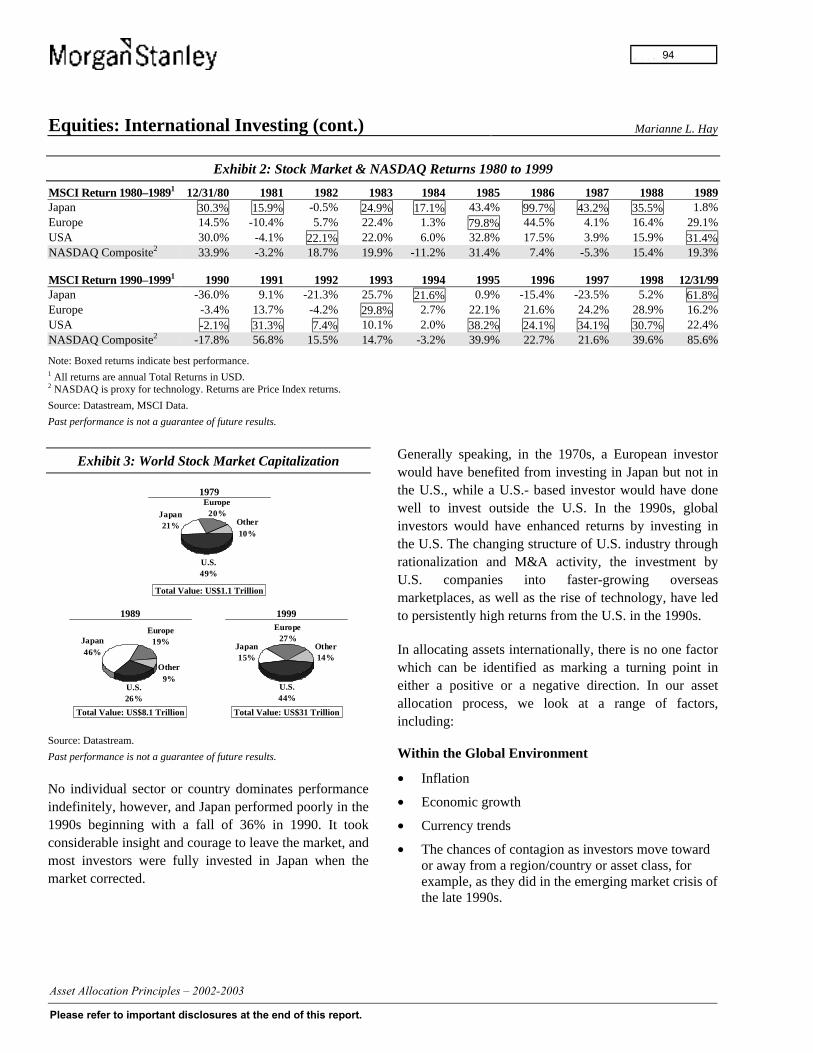
Equities: International Investing (cont.) Marianne L. Hay
Exhibit 2: Stock Market & NASDAQ Returns 1980 to 1999
MSCI Return 1980–19891 12/31/80 1981 1982 1983 1984 1985 1986 1987 1988 1989Japan 30.3% 15.9% -0.5% 24.9% 17.1% 43.4% 99.7% 43.2% 35.5% 1.8%Europe 14.5% -10.4% 5.7% 22.4% 1.3% 79.8% 44.5% 4.1% 16.4% 29.1%USA 30.0% -4.1% 22.1% 22.0% 6.0% 32.8% 17.5% 3.9% 15.9% 31.4%NASDAQ Composite2 33.9% -3.2% 18.7% 19.9% -11.2% 31.4% 7.4% -5.3% 15.4% 19.3%
MSCI Return 1990–19991 1990 1991 1992 1993 1994 1995 1996 1997 1998 12/31/99Japan -36.0% 9.1% -21.3% 25.7% 21.6% 0.9% -15.4% -23.5% 5.2% 61.8%Europe -3.4% 13.7% -4.2% 29.8% 2.7% 22.1% 21.6% 24.2% 28.9% 16.2%USA -2.1% 31.3% 7.4% 10.1% 2.0% 38.2% 24.1% 34.1% 30.7% 22.4%NASDAQ Composite2 -17.8% 56.8% 15.5% 14.7% -3.2% 39.9% 22.7% 21.6% 39.6% 85.6%
Note: Boxed returns indicate best performance.1 All returns are annual Total Returns in USD.2 NASDAQ is proxy for technology. Returns are Price Index returns.
Source: Datastream, MSCI Data.
Past performance is not a guarantee of future results.
Exhibit 3: World Stock Market Capitalization
Japan46%
Other9%
U.S.26%
Europe19%
Japan21% Other
10%
U.S.49%
Europe20%
1989 1999
1979
Total Value: US$1.1 Trillion
Total Value: US$8.1 Trillion Total Value: US$31 Trillion
Europe27%
U.S.44%
Other14%
Japan15%
Source: Datastream.
Past performance is not a guarantee of future results.
No individual sector or country dominates performanceindefinitely, however, and Japan performed poorly in the1990s beginning with a fall of 36% in 1990. It tookconsiderable insight and courage to leave the market, andmost investors were fully invested in Japan when themarket corrected.
Generally speaking, in the 1970s, a European investorwould have benefited from investing in Japan but not inthe U.S., while a U.S.- based investor would have donewell to invest outside the U.S. In the 1990s, globalinvestors would have enhanced returns by investing inthe U.S. The changing structure of U.S. industry throughrationalization and M&A activity, the investment byU.S. companies into faster-growing overseasmarketplaces, as well as the rise of technology, have ledto persistently high returns from the U.S. in the 1990s.
In allocating assets internationally, there is no one factorwhich can be identified as marking a turning point ineither a positive or a negative direction. In our assetallocation process, we look at a range of factors,including:
Within the Global Environment
• Inflation
• Economic growth
• Currency trends
• The chances of contagion as investors move towardor away from a region/country or asset class, forexample, as they did in the emerging market crisis ofthe late 1990s.
-
94
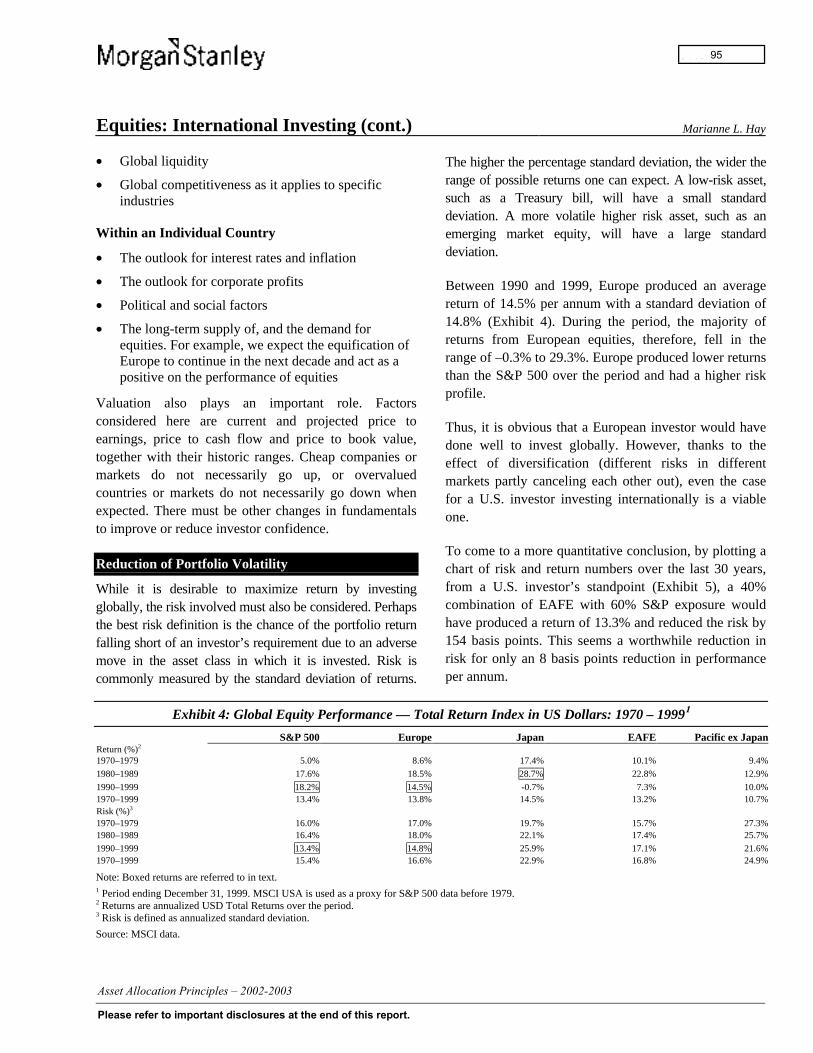
Equities: International Investing (cont.) Marianne L. Hay
• Global liquidity
• Global competitiveness as it applies to specificindustries
Within an Individual Country
• The outlook for interest rates and inflation
• The outlook for corporate profits
• Political and social factors
• The long-term supply of, and the demand forequities. For example, we expect the equification ofEurope to continue in the next decade and act as apositive on the performance of equities
Valuation also plays an important role. Factorsconsidered here are current and projected price toearnings, price to cash flow and price to book value,together with their historic ranges. Cheap companies ormarkets do not necessarily go up, or overvaluedcountries or markets do not necessarily go down whenexpected. There must be other changes in fundamentalsto improve or reduce investor confidence.
Reduction of Portfolio Volatility
While it is desirable to maximize return by investingglobally, the risk involved must also be considered. Perhapsthe best risk definition is the chance of the portfolio returnfalling short of an investor’s requirement due to an adversemove in the asset class in which it is invested. Risk iscommonly measured by the standard deviation of returns.
The higher the percentage standard deviation, the wider therange of possible returns one can expect. A low-risk asset,such as a Treasury bill, will have a small standarddeviation. A more volatile higher risk asset, such as anemerging market equity, will have a large standarddeviation.
Between 1990 and 1999, Europe produced an averagereturn of 14.5% per annum with a standard deviation of14.8% (Exhibit 4). During the period, the majority ofreturns from European equities, therefore, fell in therange of –0.3% to 29.3%. Europe produced lower returnsthan the S&P 500 over the period and had a higher riskprofile.
Thus, it is obvious that a European investor would havedone well to invest globally. However, thanks to theeffect of diversification (different risks in differentmarkets partly canceling each other out), even the casefor a U.S. investor investing internationally is a viableone.
To come to a more quantitative conclusion, by plotting achart of risk and return numbers over the last 30 years,from a U.S. investor’s standpoint (Exhibit 5), a 40%combination of EAFE with 60% S&P exposure wouldhave produced a return of 13.3% and reduced the risk by154 basis points. This seems a worthwhile reduction inrisk for only an 8 basis points reduction in performanceper annum.
Exhibit 4: Global Equity Performance — Total Return Index in US Dollars: 1970 – 19991
S&P 500 Europe Japan EAFE Pacific ex JapanReturn (%)2
1970–1979 5.0% 8.6% 17.4% 10.1% 9.4%
1980–1989 17.6% 18.5% 28.7% 22.8% 12.9%
1990–1999 18.2% 14.5% -0.7% 7.3% 10.0%1970–1999 13.4% 13.8% 14.5% 13.2% 10.7%Risk (%)3
1970–1979 16.0% 17.0% 19.7% 15.7% 27.3%1980–1989 16.4% 18.0% 22.1% 17.4% 25.7%
1990–1999 13.4% 14.8% 25.9% 17.1% 21.6%1970–1999 15.4% 16.6% 22.9% 16.8% 24.9%
Note: Boxed returns are referred to in text.1 Period ending December 31, 1999. MSCI USA is used as a proxy for S&P 500 data before 1979.2 Returns are annualized USD Total Returns over the period.3 Risk is defined as annualized standard deviation.
Source: MSCI data.
-
95

Equities: International Investing (cont.) Marianne L. Hay
Exhibit 5: International Diversification for U.S.Investors — Portfolio of S&P 500 and EAFE1
from 1970–1999, Risk-Reward Trade-Off
13.1%
13.2%
13.3%
13.4%
13% 14% 15% 16% 17%
% Risk
% R
etur
n S&P 500
EAFE
40%EAFE
Return RiskS&P 500 13.40% 15.4%EAFE 13.20% 16.8%Correlation 50%
1 EAFE: Europe, Australasia and the Far East.
Note: Priced as of December 31, 1999. MSCI USA is used as a proxyfor S&P 500 data before 1979. Returns are annualized USD TotalReturns over the period. Risk is defined as annualized standarddeviation.
Source: MSCI.
Past performance is not a guarantee of future results.
For European-based investors, international diversi-fication also makes sense from a risk standpoint(Exhibit 6). The optimal allocation was 40%international (World ex-Europe) and 60% domestic.This allocation returned 10.6% per annum compared to11.1% from a pure European portfolio, but reduced riskby 71 basis points.
Our Current Risk/Return Outlook
Carrying out the same exercise using our projectedreturns for different stock markets, we can evaluate therisk/return trade-off for different country allocations.This analysis leads us to a current geographicallocation for equities in an international portfolio asshown in Exhibit 7. We are currently positive on theoutlook for Europe because of the economic recovery,the likely continuance of M&A activity, and the bestearnings growth outlook in a long time. In addition, wefavor Japan where we see restructuring continuing anddomestic Japanese investors investing some of theirhigh level of savings in the stock market as returns intheir traditional investments — Post Office SavingsAccounts and bonds — seem poor. Emerging markets
are recovering and are in the best shape (in inflationterms) in decades, in our view.
Exhibit 6: International Diversification for EuropeanInvestors — Portfolio of Europe and World ex-
Europe from 1970–1999, Risk-Reward Trade-Off
9.8%10.0%10.2%10.4%10.6%10.8%11.0%11.2%
15.0% 15.5% 16.0% 16.5% 17.0% 17.5%
% Risk
Return RiskEurope 11.1% 16.1%World ex-Europe 9.9% 17.3%Correlation 71.6%
% R
etur
n
Europe
60% Europe
World Ex Europe
Note: Priced as of December 31, 1999. Returns are annualized EURTotal Returns over the period. Risk is defined as annualizedstandard deviation.
Source: MSCI.
Past performance is not a guarantee of future results.
Exhibit 7: International Investor Equity AllocationJanuary 11, 1999
CurrentAllocation Benchmark1
USA 40% 49%Europe 33% 30%Japan 17% 13%Asia 2% 3%Emerging Markets 8% 5%Global Equities 100% 100%1 95% MSCI World Index and 5% MSCI Emerging Market Free Index
(EMF).
Source: MSCI.
The country decision is an important part of assetallocation, but the question of sector should also beconsidered. Until two years ago, the averagecorrelation of countries and sectors (Exhibit 8) trackedeach other. Over the last 12 months, global sectorshave become less correlated, implying an increasingrole for sector selection in diversification (Exhibit 9).
-
96
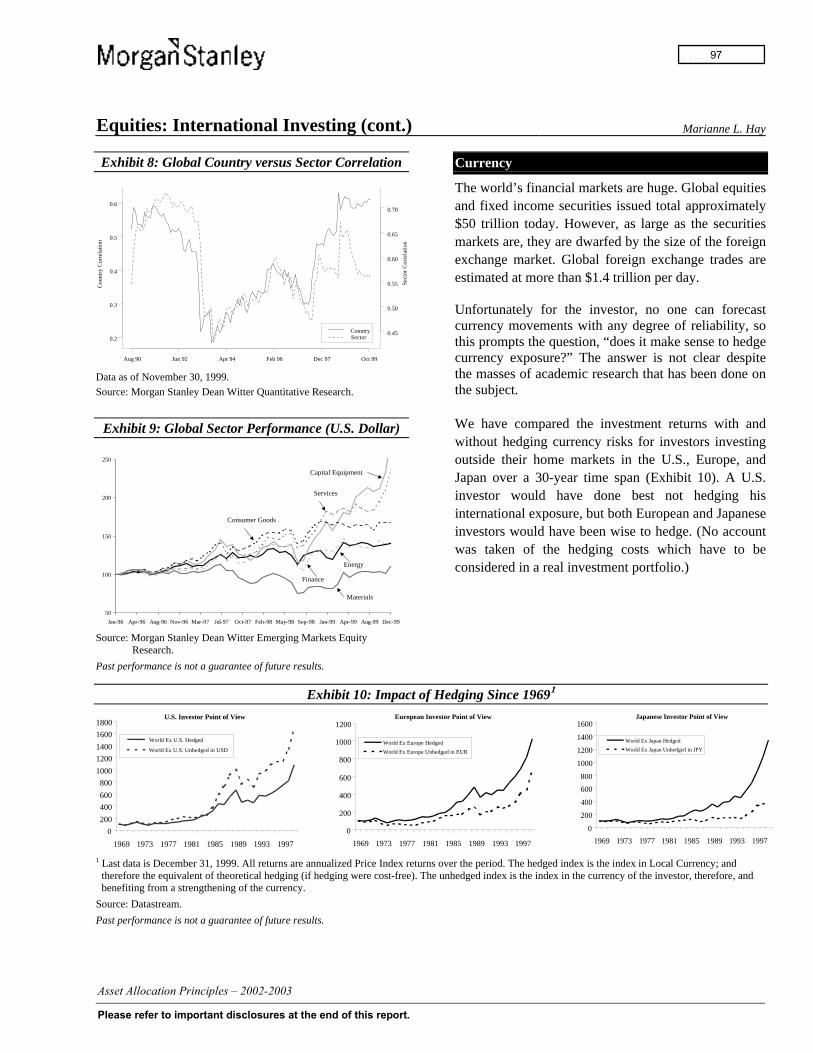
Equities: International Investing (cont.) Marianne L. Hay
Exhibit 8: Global Country versus Sector Correlation
Cou
ntry
Cor
rela
tion
0.2
0.3
0.4
0.5
0.6
Aug 90 Jun 92 Apr 94 Feb 96 Dec 97 Oct 99
CountrySector
0.45
0.50
0.55
0.60
0.65
0.70
Sect
or C
orre
lati
on
Data as of November 30, 1999.
Source: Morgan Stanley Dean Witter Quantitative Research.
Exhibit 9: Global Sector Performance (U.S. Dollar)
50
100
150
200
250
Jan-96 Apr-96 Aug-96 Nov-96 Mar-97 Jul-97 Oct-97 Feb-98 May-98 Sep-98 Jan-99 Apr-99 Aug-99 Dec-99
Capital Equipment
Services
Consumer Goods
Energy
Finance
Materials
Source: Morgan Stanley Dean Witter Emerging Markets EquityResearch.
Past performance is not a guarantee of future results.
Currency
The world’s financial markets are huge. Global equitiesand fixed income securities issued total approximately$50 trillion today. However, as large as the securitiesmarkets are, they are dwarfed by the size of the foreignexchange market. Global foreign exchange trades areestimated at more than $1.4 trillion per day.
Unfortunately for the investor, no one can forecastcurrency movements with any degree of reliability, sothis prompts the question, “does it make sense to hedgecurrency exposure?” The answer is not clear despitethe masses of academic research that has been done onthe subject.
We have compared the investment returns with andwithout hedging currency risks for investors investingoutside their home markets in the U.S., Europe, andJapan over a 30-year time span (Exhibit 10). A U.S.investor would have done best not hedging hisinternational exposure, but both European and Japaneseinvestors would have been wise to hedge. (No accountwas taken of the hedging costs which have to beconsidered in a real investment portfolio.)
Exhibit 10: Impact of Hedging Since 19691
0
200
400
600
800
1000
1200
1400
1600
1800
1969 1973 1977 1981 1985 1989 1993 1997
World Ex U.S. Hedged
World Ex U.S. Unhedged in USD
U.S. Investor Point of View
0
200
400
600
800
1000
1200
1969 1973 1977 1981 1985 1989 1993 1997
World Ex Europe Hedged
World Ex Europe Unhedged in EUR
European Investor Point of View
0
200
400
600
800
1000
1200
1400
1600
1969 1973 1977 1981 1985 1989 1993 1997
World Ex Japan Hedged
World Ex Japan Unhedged in JPY
Japanese Investor Point of View
1 Last data is December 31, 1999. All returns are annualized Price Index returns over the period. The hedged index is the index in Local Currency; andtherefore the equivalent of theoretical hedging (if hedging were cost-free). The unhedged index is the index in the currency of the investor, therefore, andbenefiting from a strengthening of the currency.
Source: Datastream.
Past performance is not a guarantee of future results.
-
97
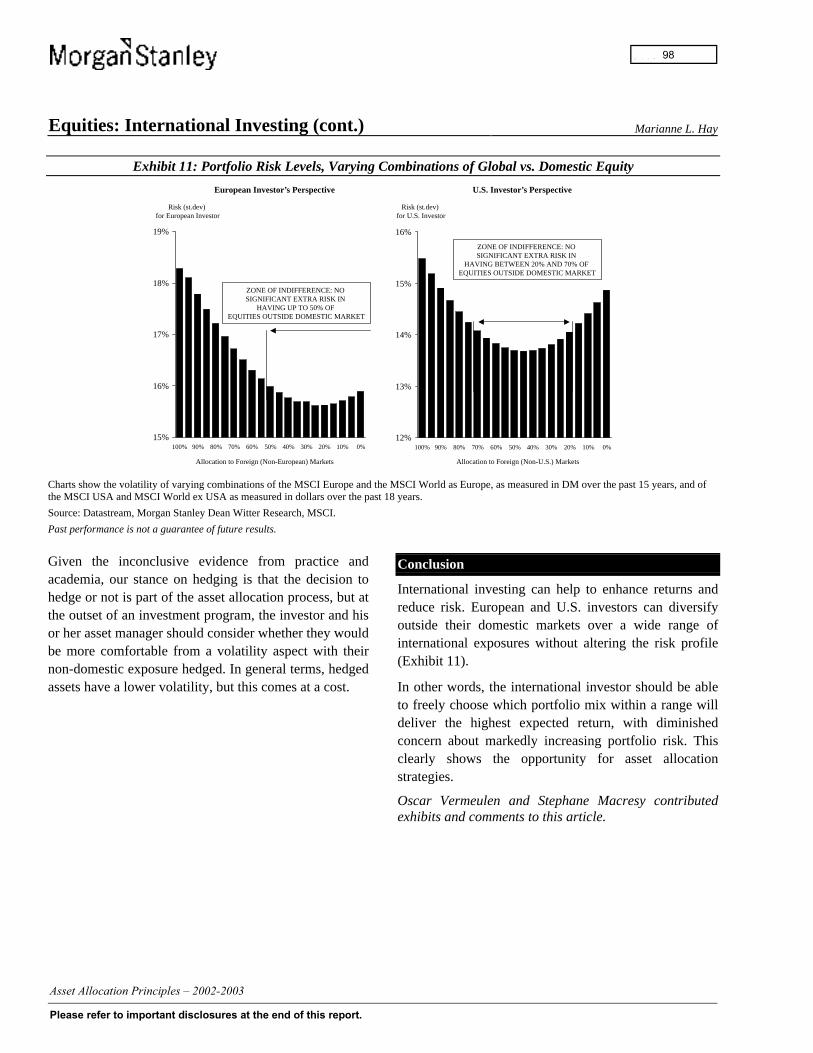
Equities: International Investing (cont.) Marianne L. Hay
Exhibit 11: Portfolio Risk Levels, Varying Combinations of Global vs. Domestic Equity
12%
13%
14%
15%
16%
100% 90% 80% 70% 60% 50% 40% 30% 20% 10% 0%
European Investor’s Perspective
15%
16%
17%
18%
19%
100% 90% 80% 70% 60% 50% 40% 30% 20% 10% 0%
Allocation to Foreign (Non-European) Markets
Risk (st.dev) for European Investor
U.S. Investor’s Perspective
Allocation to Foreign (Non-U.S.) Markets
Risk (st.dev) for U.S. Investor
ZONE OF INDIFFERENCE: NO SIGNIFICANT EXTRA RISK IN
HAVING UP TO 50% OF EQUITIES OUTSIDE DOMESTIC MARKET
ZONE OF INDIFFERENCE: NO SIGNIFICANT EXTRA RISK IN
HAVING BETWEEN 20% AND 70% OF EQUITIES OUTSIDE DOMESTIC MARKET
Charts show the volatility of varying combinations of the MSCI Europe and the MSCI World as Europe, as measured in DM over the past 15 years, and ofthe MSCI USA and MSCI World ex USA as measured in dollars over the past 18 years.
Source: Datastream, Morgan Stanley Dean Witter Research, MSCI.
Past performance is not a guarantee of future results.
Given the inconclusive evidence from practice andacademia, our stance on hedging is that the decision tohedge or not is part of the asset allocation process, but atthe outset of an investment program, the investor and hisor her asset manager should consider whether they wouldbe more comfortable from a volatility aspect with theirnon-domestic exposure hedged. In general terms, hedgedassets have a lower volatility, but this comes at a cost.
Conclusion
International investing can help to enhance returns andreduce risk. European and U.S. investors can diversifyoutside their domestic markets over a wide range ofinternational exposures without altering the risk profile(Exhibit 11).
In other words, the international investor should be ableto freely choose which portfolio mix within a range willdeliver the highest expected return, with diminishedconcern about markedly increasing portfolio risk. Thisclearly shows the opportunity for asset allocationstrategies.
Oscar Vermeulen and Stephane Macresy contributedexhibits and comments to this article.
-
98
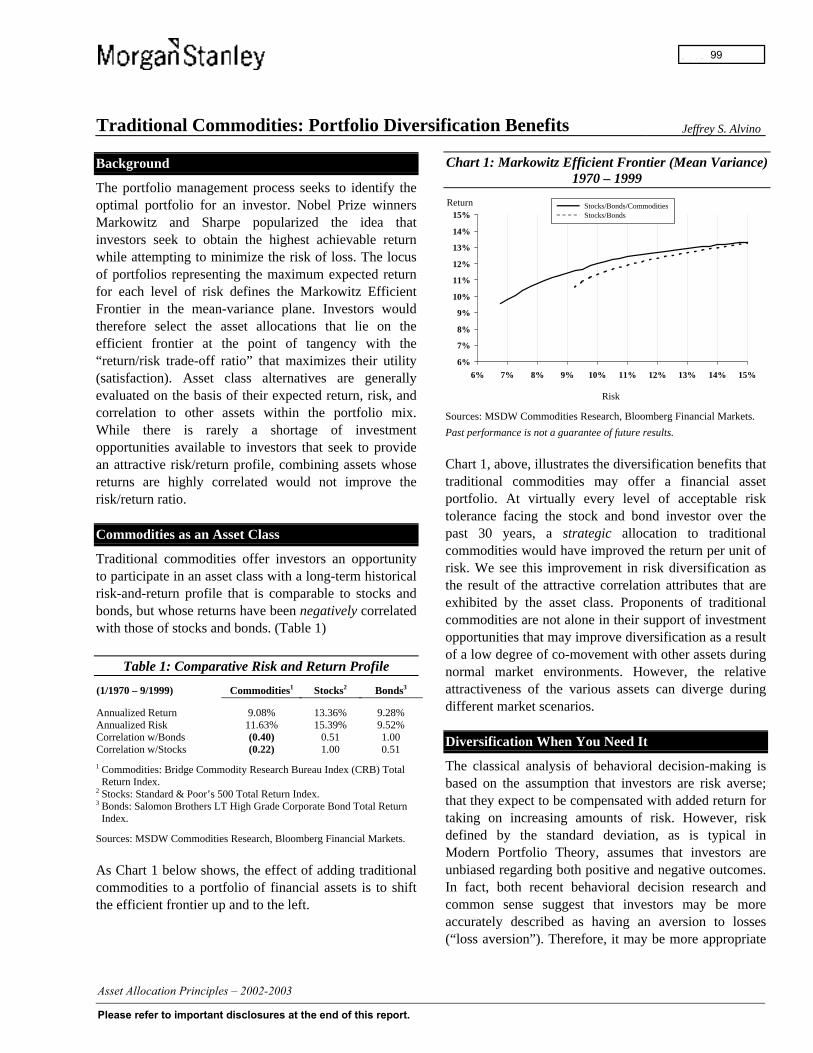
Traditional Commodities: Portfolio Diversification Benefits Jeffrey S. Alvino
Background
The portfolio management process seeks to identify theoptimal portfolio for an investor. Nobel Prize winnersMarkowitz and Sharpe popularized the idea thatinvestors seek to obtain the highest achievable returnwhile attempting to minimize the risk of loss. The locusof portfolios representing the maximum expected returnfor each level of risk defines the Markowitz EfficientFrontier in the mean-variance plane. Investors wouldtherefore select the asset allocations that lie on theefficient frontier at the point of tangency with the“return/risk trade-off ratio” that maximizes their utility(satisfaction). Asset class alternatives are generallyevaluated on the basis of their expected return, risk, andcorrelation to other assets within the portfolio mix.While there is rarely a shortage of investmentopportunities available to investors that seek to providean attractive risk/return profile, combining assets whosereturns are highly correlated would not improve therisk/return ratio.
Commodities as an Asset Class
Traditional commodities offer investors an opportunityto participate in an asset class with a long-term historicalrisk-and-return profile that is comparable to stocks andbonds, but whose returns have been negatively correlatedwith those of stocks and bonds. (Table 1)
Table 1: Comparative Risk and Return Profile
(1/1970 – 9/1999) Commodities1 Stocks2 Bonds3
Annualized Return 9.08% 13.36% 9.28%Annualized Risk 11.63% 15.39% 9.52%Correlation w/Bonds (0.40) 0.51 1.00Correlation w/Stocks (0.22) 1.00 0.51
1 Commodities: Bridge Commodity Research Bureau Index (CRB) TotalReturn Index.
2 Stocks: Standard & Poor’s 500 Total Return Index.3 Bonds: Salomon Brothers LT High Grade Corporate Bond Total Return
Index.
Sources: MSDW Commodities Research, Bloomberg Financial Markets.
As Chart 1 below shows, the effect of adding traditionalcommodities to a portfolio of financial assets is to shiftthe efficient frontier up and to the left.
Chart 1: Markowitz Efficient Frontier (Mean Variance)1970 – 1999
Risk
6%
7%
8%
9%
10%
11%
12%
13%
14%
15%
6% 7% 8% 9% 10% 11% 12% 13% 14% 15%
Return Stocks/Bonds/CommoditiesStocks/Bonds
Sources: MSDW Commodities Research, Bloomberg Financial Markets.
Past performance is not a guarantee of future results.
Chart 1, above, illustrates the diversification benefits thattraditional commodities may offer a financial assetportfolio. At virtually every level of acceptable risktolerance facing the stock and bond investor over thepast 30 years, a strategic allocation to traditionalcommodities would have improved the return per unit ofrisk. We see this improvement in risk diversification asthe result of the attractive correlation attributes that areexhibited by the asset class. Proponents of traditionalcommodities are not alone in their support of investmentopportunities that may improve diversification as a resultof a low degree of co-movement with other assets duringnormal market environments. However, the relativeattractiveness of the various assets can diverge duringdifferent market scenarios.
Diversification When You Need It
The classical analysis of behavioral decision-making isbased on the assumption that investors are risk averse;that they expect to be compensated with added return fortaking on increasing amounts of risk. However, riskdefined by the standard deviation, as is typical inModern Portfolio Theory, assumes that investors areunbiased regarding both positive and negative outcomes.In fact, both recent behavioral decision research andcommon sense suggest that investors may be moreaccurately described as having an aversion to losses(“loss aversion”). Therefore, it may be more appropriate
-
99
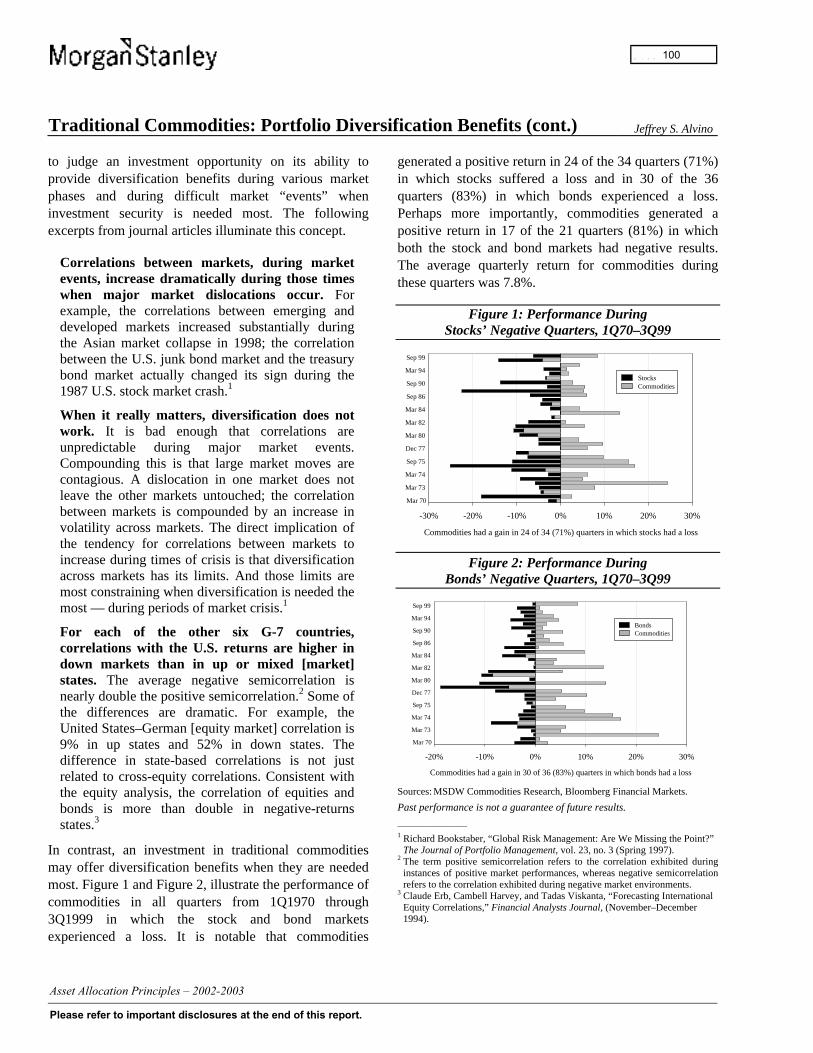
Traditional Commodities: Portfolio Diversification Benefits (cont.) Jeffrey S. Alvino
to judge an investment opportunity on its ability toprovide diversification benefits during various marketphases and during difficult market “events” wheninvestment security is needed most. The followingexcerpts from journal articles illuminate this concept.
Correlations between markets, during marketevents, increase dramatically during those timeswhen major market dislocations occur. Forexample, the correlations between emerging anddeveloped markets increased substantially duringthe Asian market collapse in 1998; the correlationbetween the U.S. junk bond market and the treasurybond market actually changed its sign during the1987 U.S. stock market crash.1
When it really matters, diversification does notwork. It is bad enough that correlations areunpredictable during major market events.Compounding this is that large market moves arecontagious. A dislocation in one market does notleave the other markets untouched; the correlationbetween markets is compounded by an increase involatility across markets. The direct implication ofthe tendency for correlations between markets toincrease during times of crisis is that diversificationacross markets has its limits. And those limits aremost constraining when diversification is needed themost — during periods of market crisis.1
For each of the other six G-7 countries,correlations with the U.S. returns are higher indown markets than in up or mixed [market]states. The average negative semicorrelation isnearly double the positive semicorrelation.2 Some ofthe differences are dramatic. For example, theUnited States–German [equity market] correlation is9% in up states and 52% in down states. Thedifference in state-based correlations is not justrelated to cross-equity correlations. Consistent withthe equity analysis, the correlation of equities andbonds is more than double in negative-returnsstates.3
In contrast, an investment in traditional commoditiesmay offer diversification benefits when they are neededmost. Figure 1 and Figure 2, illustrate the performance ofcommodities in all quarters from 1Q1970 through3Q1999 in which the stock and bond marketsexperienced a loss. It is notable that commodities
generated a positive return in 24 of the 34 quarters (71%)in which stocks suffered a loss and in 30 of the 36quarters (83%) in which bonds experienced a loss.Perhaps more importantly, commodities generated apositive return in 17 of the 21 quarters (81%) in whichboth the stock and bond markets had negative results.The average quarterly return for commodities duringthese quarters was 7.8%.
Figure 1: Performance DuringStocks’ Negative Quarters, 1Q70–3Q99
-30% -20% -10% 0% 10% 20% 30%
Sep 99
Commodities had a gain in 24 of 34 (71%) quarters in which stocks had a loss
Mar 94
Sep 90
Sep 86
Mar 84
Mar 82
Mar 80
Dec 77
Sep 75
Mar 74
Mar 73
Mar 70
StocksCommodities
Figure 2: Performance DuringBonds’ Negative Quarters, 1Q70–3Q99
-20% -10% 0% 10% 20% 30%
Sep 99
Commodities had a gain in 30 of 36 (83%) quarters in which bonds had a loss
Mar 94
Sep 90
Sep 86
Mar 84
Mar 82
Mar 80
Dec 77
Sep 75
Mar 74
Mar 73
Mar 70
BondsCommodities
Sources: MSDW Commodities Research, Bloomberg Financial Markets.
Past performance is not a guarantee of future results.
_____________________
1 Richard Bookstaber, “Global Risk Management: Are We Missing the Point?”The Journal of Portfolio Management, vol. 23, no. 3 (Spring 1997).
2 The term positive semicorrelation refers to the correlation exhibited duringinstances of positive market performances, whereas negative semicorrelationrefers to the correlation exhibited during negative market environments.
3 Claude Erb, Cambell Harvey, and Tadas Viskanta, “Forecasting InternationalEquity Correlations,” Financial Analysts Journal, (November–December1994).
-
100
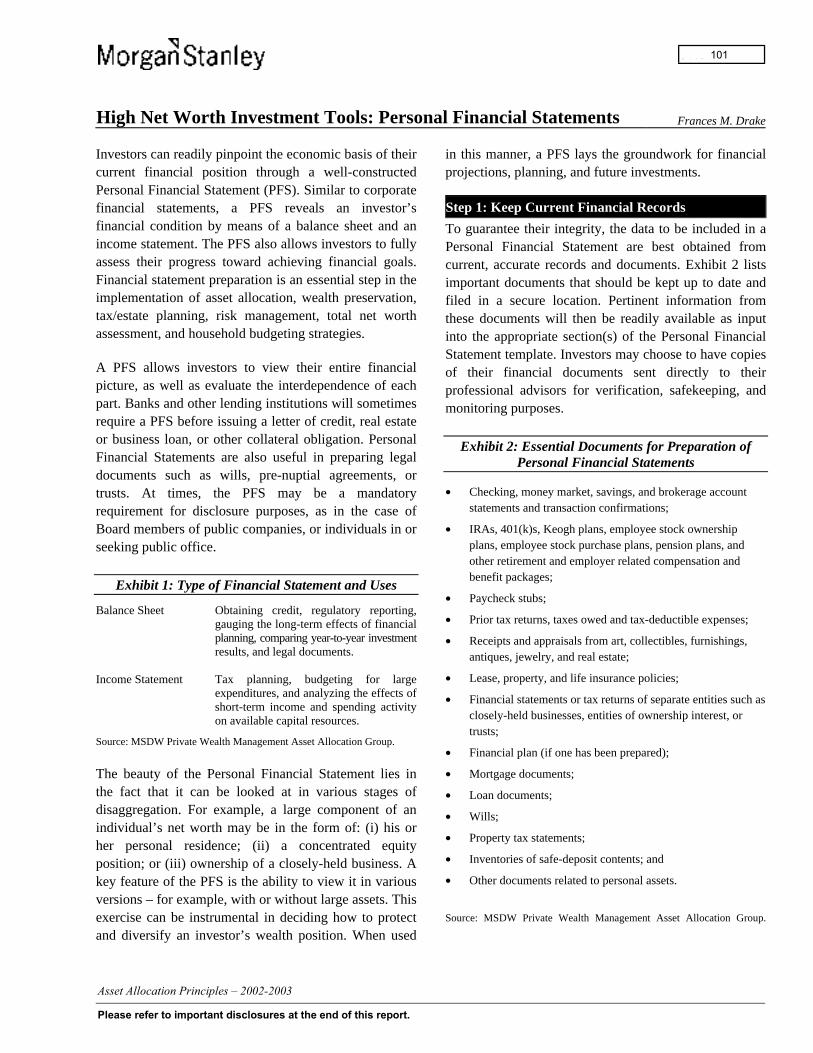
High Net Worth Investment Tools: Personal Financial Statements Frances M. Drake
Investors can readily pinpoint the economic basis of theircurrent financial position through a well-constructedPersonal Financial Statement (PFS). Similar to corporatefinancial statements, a PFS reveals an investor’sfinancial condition by means of a balance sheet and anincome statement. The PFS also allows investors to fullyassess their progress toward achieving financial goals.Financial statement preparation is an essential step in theimplementation of asset allocation, wealth preservation,tax/estate planning, risk management, total net worthassessment, and household budgeting strategies.
A PFS allows investors to view their entire financialpicture, as well as evaluate the interdependence of eachpart. Banks and other lending institutions will sometimesrequire a PFS before issuing a letter of credit, real estateor business loan, or other collateral obligation. PersonalFinancial Statements are also useful in preparing legaldocuments such as wills, pre-nuptial agreements, ortrusts. At times, the PFS may be a mandatoryrequirement for disclosure purposes, as in the case ofBoard members of public companies, or individuals in orseeking public office.
Exhibit 1: Type of Financial Statement and Uses
Balance Sheet Obtaining credit, regulatory reporting,gauging the long-term effects of financialplanning, comparing year-to-year investmentresults, and legal documents.
Income Statement Tax planning, budgeting for largeexpenditures, and analyzing the effects ofshort-term income and spending activityon available capital resources.
Source: MSDW Private Wealth Management Asset Allocation Group.
The beauty of the Personal Financial Statement lies inthe fact that it can be looked at in various stages ofdisaggregation. For example, a large component of anindividual’s net worth may be in the form of: (i) his orher personal residence; (ii) a concentrated equityposition; or (iii) ownership of a closely-held business. Akey feature of the PFS is the ability to view it in variousversions – for example, with or without large assets. Thisexercise can be instrumental in deciding how to protectand diversify an investor’s wealth position. When used
in this manner, a PFS lays the groundwork for financialprojections, planning, and future investments.
Step 1: Keep Current Financial Records
To guarantee their integrity, the data to be included in aPersonal Financial Statement are best obtained fromcurrent, accurate records and documents. Exhibit 2 listsimportant documents that should be kept up to date andfiled in a secure location. Pertinent information fromthese documents will then be readily available as inputinto the appropriate section(s) of the Personal FinancialStatement template. Investors may choose to have copiesof their financial documents sent directly to theirprofessional advisors for verification, safekeeping, andmonitoring purposes.
Exhibit 2: Essential Documents for Preparation ofPersonal Financial Statements
• Checking, money market, savings, and brokerage accountstatements and transaction confirmations;
• IRAs, 401(k)s, Keogh plans, employee stock ownershipplans, employee stock purchase plans, pension plans, andother retirement and employer related compensation andbenefit packages;
• Paycheck stubs;
• Prior tax returns, taxes owed and tax-deductible expenses;
• Receipts and appraisals from art, collectibles, furnishings,antiques, jewelry, and real estate;
• Lease, property, and life insurance policies;
• Financial statements or tax returns of separate entities such asclosely-held businesses, entities of ownership interest, ortrusts;
• Financial plan (if one has been prepared);
• Mortgage documents;
• Loan documents;
• Wills;
• Property tax statements;
• Inventories of safe-deposit contents; and
• Other documents related to personal assets.
Source: MSDW Private Wealth Management Asset Allocation Group.
-
101
High Net Worth Investment Tools: Personal Financial Statements (cont.) Frances M. Drake
Step 2: Prepare The Balance Sheet
The balance sheet, also known as the statement offinancial condition, provides a snapshot of the investor’sposition at a specific point in time. The balance sheetdelineates all material assets and liabilities, and from itan investor’s total net worth can be calculated. The finalcomputation of subtracting all liabilities, including taxesthat have accrued and tax liabilities that would be owedon the sale of assets, from all assets will equal totalliabilities and net worth.
The balance sheet provides a framework by whichpotential interdependent relationships among assetclasses may be analyzed. By reviewing financial assetsand liabilities at least once each fiscal year, an individualcan gauge financial progress and set future goals basedupon his or her asset/liability mix and income/spendinglevels. Information obtained from the documents listedin Exhibit 2 provide most, if not all, the input needed tocreate the balance sheet.
A detailed sample personal balance sheet template is setforth in Exhibit 3. Ideally, this document should beprepared in the form of a working spreadsheet allowingthe investor to view different scenarios by modifyingnumbers, introducing and comparing asset classes, andrecalculating net worth percentages. Supportingspreadsheets or documents can be attached to the balancesheet, along with notes on those assets that warrant amore detailed description.
Assets are classified as either current or non-current, andare arranged in descending order according to the degreeof cash-convertibility of each instrument. Current assetsinclude cash and cash equivalents, marketable securities,short-term government securities, accounts receivable,prepaid expenses, and the cash value of life insurancepolicies. Current assets, sometimes referred to as liquidassets, are defined as being easily convertible into cashwithin a time frame of less than one year. Non-currentassets are generally acquired and held for the long-term.Such assets include most durable goods, such asproperty, buildings at their appraised value, machinery,
furniture, jewelry, art, precious metals, automobiles, andantiques.
Non-current financial assets include securities that arenot immediately saleable and may include restrictedstock, shares in exchange funds, and investments inventure capital, private equity, and hedge funds. Closely-held and thinly-traded stocks are also considered notreadily marketable. The sale of certain types of realestate holdings may be impeded by the terms of acontract or liens attached to it. For balance sheetpurposes, illiquid or partially-liquid assets such asrestricted stock may need to be valued at some degree ofdiscount from quoted market prices and possible taxesdue when these assets are sold.
Likewise, liabilities are divided into current and non-current liabilities, and are customarily arranged in orderof their payment due date. Liabilities representobligations to transfer monies to creditors either incurrent or future fiscal periods. Current liabilities includeshort-term bank debt, the current portion of long-termdebt, accounts payable, interest payable, and taxespayable. Payments of current liabilities are expectedwithin the same fiscal period in which the chargeoccurred. Non-current liabilities, meanwhile, encompassauto loans, lease payments, mortgages, otherintermediate- to long-term debt, and deferred taxes.
Step 3: Prepare the Income Statement
While the balance sheet provides a fixed-point view ofthe amount and the structure of the investor’s assets, theincome statement is a record or projection of inflows andoutflows over a specific period of time. The incomestatement can be used in conjunction with the balancesheet to monitor or manage changes in total net worth.The income statement is divided into three sections:revenues (income); expenses (expenditures); and netincome (gain or loss).
The income statement can provide a framework forperforming a budget analysis by disclosing the amountsof income earned and by helping to document spending
-
102

High Net Worth Investment Tools: Personal Financial Statements (cont.) Frances M. Drake
Exhibit 3: Sample Personal Balance Sheet Template
Assets Monetary Value % of Total AssetsCash, Savings Accounts, and Certificates of DepositMoney Market Account(s)Marketable SecuritiesSavings Bonds and Treasury BillsStock and Bond Mutual FundsCorporate and Municipal BondsNotes ReceivableInterest ReceivableCash Value of Life Insurance PoliciesRoyaltiesStock OptionsInvestments in Closely-Held Businesses and Private CompaniesInvestments in Public CompaniesIRA AccountsRetirement PlansIncome Interests in Testamentary TrustsRemainderperson Interests in Testamentary TrustsInvestments in Real EstatePersonal ResidencesAutomobilesJewelryAntiquesCrystal, China, and Sterling SilverOther Personal EffectsTotal Assets
Liabilities Monetary Value % of Total LiabilitiesPersonal Debts
Automobile LoansHome Equity LoansHome MortgagesMargin LoansCredit Card LoansOther Consumer Borrowings
Alimony/Child Support PayableTotal Debts
Estimated TaxesIncome TaxesCapital Gains TaxesReal Estate TaxesOther Taxes
Total Taxes
Net WorthTotal Liabilities and Net Worth
Source: MSDW Private Wealth Management Asset Allocation Group.
-
103
High Net Worth Investment Tools: Personal Financial Statements (cont.) Frances M. Drake
habits. If revenues exceed expenses, a net surplus isavailable for additional investments; if expendituresexceed revenues, an investor may need to take action toincrease his or her income stream or curtail spendinglevels. An income statement is frequently prepared whenthe investor is contemplating a major purchase, such as abusiness, a residence, oil and gas interests, or asubstantial parcel of real estate.
The income statement is also useful for tax preparationpurposes or when a major change occurs in one’sfinancial situation, such as the receipt of a largedividend, interest payment, or a sizable short-termcapital gain from the sale of securities or property.Individuals who will find the income statementparticularly useful include: (i) retirees; (ii) self-employedpersons; (iii) day traders who may incur short-termcapital gains taxes; (iv) investors in stock options; and(v) investors who employ techniques which may incurlarge capital gains taxes. Investors are encouraged toview their finances in much the same way as a securitiesanalyst views a company’s financial statement. The moreof each year’s income that can be transferred to thebalance sheet annually in the form of liquid assets andcapital assets with the potential to appreciate in value,the greater the potential to increase wealth over time.
Once again, a working spreadsheet is ideal, preferablyone that is computer-based and that can be easilyupdated on a regular basis. Income statements can beprepared on a monthly, quarterly, and/or annual basisdepending on an individual’s income level, tax bracket,and tax-sensitivity. A detailed sample personal incomestatement template is provided in Exhibit 4.
Step 4: Tax Planning Using the Personal FinancialStatement
Tax planning is a considerable area that ties into and canbenefit from PFS analysis. By aggregating one’s assets,liabilities, and income in one place, a Personal FinancialStatement allows an investor to more accurately gauge towhat extent his or her assets have appreciated ordepreciated and can thus help to understand any future
tax liabilities. Future tax liability is an estimate of taxesthat may be payable in the future owing to circumstancessuch as the sale of appreciated assets which may thentrigger capital gains taxes. Calculation of future taxliability assumes a complete, voluntary sale of all assetsas of the date of the financial statement, and is the totalamount of taxes that would be assessed on such aliquidation. All estimated taxes at the federal, state,county, and city level must be included in thiscalculation. The potential liability for all these taxes intheir entirety is called the effective tax rate – the averagerate at which income is taxed.
It is important to note that, on the federal level, the rateat which income from the sale of an asset is taxeddepends on the type of asset and the length of time theasset has been held by the investor. Therefore, taxableitems must be segregated between those taxable ascapital gains and those taxable as ordinary income.Effective tax rates must then be developed for eachcategory.
If state, county, or city tax codes impose capital gains atrates different from ordinary income, this differenceshould be noted when computing the effective tax ratefor capital gains. Otherwise, if any differences in state,county, or city taxes are immaterial in amount, using thesame combined state, county, and city effective rate forordinary income and taxable gains is usually acceptable.
When determining potential tax liability, the investorneeds to know not only the current values of the assetsand the current amounts of the liabilities, but also theircost basis and the dates they were acquired. If theestimated current value of an asset is greater than theasset’s cost basis, the asset has unrealized appreciation invalue. If the estimated current value of an asset is lessthan the asset’s cost basis, the asset has unrealizeddepreciation in value. If the tax basis of a liability isgreater than the liability’s estimated current amount, theliability has unrealized appreciation in value. If thereverse is true, the liability has unrealized depreciationin value.
-
104

High Net Worth Investment Tools: Personal Financial Statements (cont.) Frances M. Drake
Exhibit 4: Sample Personal Income Statement Template
Revenues Monetary Amount % of Total IncomeGross SalaryBonuses & CommissionsPartnership IncomeInterest and DividendsRealized Capital GainsAlimony/Child Support receivedTrust DistributionsPension IncomeSocial Security DistributionGiftsOther IncomeTotal Income
Expenses Monetary Amount % of Total IncomeFixed and Semi-Fixed Expenses
Home Mortgages/RentsLoan PaymentsInsurance PaymentsAlimony/Child Support PaymentsTaxes
Income TaxesSocial Security TaxesCapital Gains TaxesReal Estate TaxesOther Taxes
Variable ExpensesFoodClothingUtilitiesRentHome Maintenance/ImprovementsTransportationMedical and Health ExpensesChild Care ExpensesTuition/educational expensesInvestments/Savings PaymentsContributions/GiftsEntertainment/VacationPersonal CareOther
Total Expenses
Net Income
Source: MSDW Private Wealth Management Asset Allocation Group.
-
105

High Net Worth Investment Tools: Personal Financial Statements (cont.) Frances M. Drake
Keeping in mind the need to segregate those assets taxedas capital gains from those taxed as ordinary income, theinvestor can take the sum of the unrealized appreciationand depreciation of the assets and liabilities in eachgroup separately. Then, each sum should be multipliedby the effective tax rate for its effective category. Addingthe two products together produces the total estimatedfuture income tax liability.
If the difference between unrealized appreciation andunrealized depreciation is negative, there is netunrealized depreciation, and no future income taxliability is recorded. This is because no tax is assessedwhen net depreciation occurs, and is also based on theassumption that there will be zero appreciation in thefuture.
Step 5: Using Goals as a Framework to Analyze thePersonal Financial Statement
The Personal Financial Statement is an invaluable tool tohelp individuals and families achieve their goals,whether they are education-, retirement-, orphilanthropy-related. Upon analyzing a PersonalFinancial Statement, an investor may decide that his orher current financial position does not adequately allowfor his or her goals to be met. The investor may decideto: (i) defer additional pre-tax income to a tax-deferredinvestment plan; (ii) adjust total current income and theamounts allotted to different expenditures; (iii) increaseor decrease interest income and dividends from currentinvestments; (iv) offset capital gains against losses; and(v) study how the sale of some assets may affect taxliabilities.
In addition, analysis of a Personal Financial Statement canenable the investor to identify his or her risk tolerance. Forinstance, if an investor has a low risk tolerance, he or shewill likely invest in low-risk asset classes. Thus, anabundance of low-risk assets on the investor’s PersonalFinancial Statement may indicate a low risk tolerance.Based on insights about his or her risk tolerance, theinvestor can then gain a useful and realistic perspective onthe investor’s financial standing and take steps to increasehis or her chances of achieving goals.
Armed with this information regarding risk tolerance andthe distribution of the investor’s assets, a PersonalFinancial Statement can be a powerful tool in helping theinvestor to construct and optimize his or her assetallocation framework. By strategically altering thepercentage of assets allocated to cash, equity, fixedincome, and alternative investments, the investor can seekto maximize returns while minimizing tax liability andrisk.
The Personal Financial Statement can also be used as anaid in financial planning. Different balance sheet scenariosmay be constructed for specific circumstances. Forexample, excluding assets that are not immediately salablefrom the balance sheet may provide a clearer picture of theinvestor’s ability to meet current expenses, whereas theinclusion of personal items is useful when assessingwealth that can be passed from generation to generation.
Most investors should periodically reallocate theirinvestment resources as their own criteria and goalschange throughout life. For a young investor in the wealth-seeding phase of wealth creation, higher-risk investmentscan be tolerated. During the wealth-building phase,investments may become more balanced and moderated interms of riskiness as the investor begins to addresschildren’s educational expenses and retirement. Lastly, asthe investor enters retirement and the wealth realizationphase of the investment lifecycle, tax and estateconsiderations as well as capital preservation will probablybe of greatest consequence.
The Personal Financial Statement is one way to clearlyview an investor’s total resources and test the implicationsof various reallocation strategies on paper before actuallyimplementing them. Achieving important life-goals is notas simple as choosing to make a purchase or balancing acheckbook. To accomplish these objectives, it helps tocreate, examine, and update one or multiple balance sheetsand income statements that take into account the investor’scomplete financial situation.
A list of selected resources to help the investor prepare aPersonal Financial Statement is set forth in Exhibit 5.
-
106

High Net Worth Investment Tools: Personal Financial Statements (cont.) Frances M. Drake
Exhibit 5: Resources to Assist in the Preparation of a Personal Financial Statement
Software Books Websites ProfessionalsMicrosoftMoney
Keys to Business and Personal FinancialStatements(1)
www.mycfo.com Financial Advisor/InvestmentRepresentative
Quicken Checklist and Illustrative Financial Statementsfor Personal Financial Statement Engagements(2)
www.financialengines.com Certified Public Accountant
My Database Audit and Accounting Guides(2) www.aicpa.org Certified Financial PlannerMicrosoft Works Personal Financial Statement(2) www.money.com BookkeeperCashPlan Pro Registered Investment Advisor
Notes: (1) Nicholas G. Apostolou, Barron’s Educational Series Inc., 1991.(2) American Institute of Certified Public Accountants, 1983, 1990, 1999.
The following sources were used as references for this article: (1) “Keys to Business and Personal Financial Statements, “by Nicholas G. Apostolou;and (2) MicroMash, Preparing Personal Financial Statements, by Mary Ellen Phillips.
-
107
High Net Worth Investment Tools:Investment Alternative — A Tutorial on Exchange Funds Jeffrey C. Huebner
The risk of holding highly concentrated, single-equitypositions may compel some investors to actively seekdiversification strategies, particularly in light of themarket conditions experienced over the past two years.The more risk-tolerant investor may deploy a type ofderivatives strategy to limit the exposure to pricefluctuations in the stocks that are owned, typically ashort-term solution. Some investors may choose toreduce their exposure by selling a portion of their stockposition, paying any applicable capital gains taxes, andthen reinvesting the proceeds elsewhere in the market. Inaddition to these potentially effective strategies fordiversifying concentrated equity positions, investing inan exchange fund may provide a tax-efficient,disciplined, and long-term solution for investors.
Effectively, investors in an exchange fund have agreed toswap exposure in a single security for shares in adiversified portfolio, without triggering a taxable event.The simple mechanics of the “exchange” entail a groupof individual subscribers, each holding a concentratedequity position in one or more securities, who contributesome or all of their equity position to the fund inexchange for a pro rata ownership of the fund as a whole.Ownership is in the form of fund shares, typically in aLimited Partnership or a Limited Liability Company (anLLC). Through an exchange fund, investors canexchange their concentrated equity positions for a long-term ownership stake in a diversified and professionallymanaged investment. An exchange fund may provide aninherent discipline to an investor’s overall assetallocation, in that the fund’s investment objective willlikely remain unchanged, and the investment typicallywill be made with a longer-term perspective in mind.
The composition and investment objective of exchangefunds are varied; an exchange fund may be set up as anemerging growth fund, a multi-cap growth fund, or alarge-cap growth portfolio, among other objectives.Based on the portfolio manager’s investment criteria,certain securities will be deemed acceptable for inclusionin the fund. During the offering period, potentialinvestors who hold an acceptable security will completea subscription booklet if they choose to participate. Thepotential pool of contributed equities is aggregated by
the fund’s general partner at the conclusion of theoffering period and prior to the closing. An InspectionReport (a pro forma composition of the fund) isdistributed to those who have completed the subscriptiondocuments, allowing investors to review the entireportfolio before making a final investment decision. Themarket price of the contributed securities is determinedat or near the closing date of the fund. Potential investorswill find a detailed description of the fund in the offeringmemorandum informing them of the risks, taximplications, fees, and redemption/dissolution specificsassociated with the investment. Since each fund has itsown terms and conditions, each offering memorandumshould be evaluated on its own merits and may warrantconsultation with professional advisors.
Typically, there is minimal, if any, current cash flowfrom an exchange fund, although some exchange fundsmay provide a small, annual distribution to theirinvestors. Since subscribers to an exchange fundtypically surrender the dividend and voting rightsassociated with their stock, this investment vehicle maynot be appropriate for investors who rely upon thedividend income from the securities they hold. However,some exchange funds will allow for a small redemptionfrom the fund on a periodic basis to meet any additionalincome needs an investor might have.
Exchange funds can be offered to investors throughbroker-dealers, investment management firms, orspecified third parties. An exchange fund contributiontypically is not considered a market transaction and thusdoes not exert selling pressure on individual stock prices.Additionally, the resale rules of SEC Rule 144 (such asfiling and volume conditions) may not be applicable inan exchange fund transaction. Current regulations dictatethat exchange funds hold a portion of the fund assets in“illiquid” or “qualifying” assets at their closing to allowfor the tax-free exchange of the equity contributed to thefund.
The availability of exchange funds varies, and dependsupon the number of portfolio managers currentlysponsoring funds. Consequently, there may be numerous,few, or no exchange funds available to investors at any
-
108
High Net Worth Investment Tools:Investment Alternative — A Tutorial on Exchange Funds (cont.) Jeffrey C. Huebner
given point in time. Historically, exchange funds havebeen structured as stand-alone funds. More recently,however, a second style, known as a hub-and-spokeexchange fund, has been introduced.
• Stand-alone exchange funds generally have aspecified one-time offering period when thefunds are being offered to potential investors;subsequently, they will be closed to newinvestors. Prior to the closing, investors areapprised of the primary equities that willcomprise the portfolio; however, subscribersmay not be able to easily view the pastperformance of that particular group ofsecurities and how they perform as a unit. Theone-time closing of the fund may place limitson the portfolio manager going forward, sinceno new or additional equity positions can beadded to the fund. However, some investorsappreciate the assurance that the equityportfolio is unlikely to change substantiallyover time due to the portfolio manager’sactions. Stand-alone exchange funds are morelikely to be structured as smaller, niche-oriented funds, i.e., a small-cap exchangefund or a technology-oriented exchange fund,which investors may find attractive.
• Hub-and-spoke exchange funds, by contrast,tap into an existing portfolio of securities.This structure allows potential investors to seethe current portfolio and view its pastperformance, prior to subscribing to the fund.The hub-and-spoke structure enables theportfolio manager to add more securities tothe overall portfolio through future exchangefund closings. With this structure, theportfolio manager may be able to bettermanage the composition of the fund inresponse to market conditions and in keepingwith the original investment criteria. Hub-and-spoke funds tend to be larger funds with amore diversified equity portfolio.
Typically, the minimum subscription amount for anexchange fund contribution is $1 million of equity,which may consist of more than one security.Subscribers generally are required to have more than $5million in overall investments in order to participate inan exchange fund. There may be a placement fee, basedon the size of the subscription, and an annualmanagement fee generally associated with an exchangefund. It is possible that the diversification and the tax-efficient features of an exchange fund may substantiallyoffset applicable fees.
An exchange fund can be structured with a limited life orit can be structured as a perpetual fund. Although somefunds may offer subscribers the ability to redeem anytime after the closing, albeit with a penalty, investorstypically are committed to an exchange fund for a periodof at least two to three years. Investors seeking to redeemtheir investment prior to the seven-year anniversary oftheir contribution, a prescribed regulatory time frame,should expect to receive some amount of their originalsecurities back, based upon the performance of the fund.Investors who remain in the fund for seven years or moregenerally will be offered the choice of requesting: (i)their own stock back; (ii) a diversified basket ofsecurities; or (iii) a pro rata piece of the entire portfolio.
Since their inception in the early 1960s, informalestimates suggest that more than $15 billion in equity hasbeen contributed to exchange funds. The tax-efficient,disciplined, long-term nature of these vehicles hasattracted many participants to this investment vehicle.Investors who believe that an exchange fund may fit withtheir investment strategy should contact their FinancialAdvisor or Investments Representative for furtherdetails.
Since exchange funds are usually offered throughprivate placements exempt from registration with theUS Securities and Exchange Commission, they cannotbe marketed as a prospecting tool by the placementagent. Placement agents are expected to have anestablished business relationship with the prospectiveinvestor in order to comply with federal securitiesrules.
-
109
High Net Worth Investment Tools:Planning for and Financing a College Education
Regina B. MaherSharon Gibbons
Learning is a treasure which accompanies its ownereverywhere – Chinese Proverb
Introduction
Next to retirement, investors might list college educationas their most important savings goal. For many investors,education is a significant expense, especially when thereis more than one child to provide for. In addition,advanced degrees are becoming more broadly sought andare often requisite to moving ahead in certain fields.Planning for a college education or an advanced degreecan be an exhilarating experience, yet a tedious chorefinancially and strategically. The amount of informationavailable on the topic can be daunting and under recentchanges to the tax code, much of which takes effect in2002, some new advantages as well as complexities needto be considered.
The College Board reports that in 2001-2002, averagecollege costs rose between 5.5 and 7.7 percent at four-year institutions, with charges for room and board alsorising.1 Six percent of all students attend schools wherethe annual tuition alone costs $24,000 or more. Severalleading educational figures have stated that a collegeeducation is still well within the grasp of all Americans -in fact, for the 2001-2002 school year, a record $74billion was available in student financial aid fromfederal, state, and institutional sources.2 Many highereducation specialists hold that the cost of a collegeeducation should be viewed as an investment thatprovides personal and financial dividends for a lifetime.US Census Bureau statistics support this notion: acollege graduate earns approximately 80 percent more onaverage than an individual whose highest degree is ahigh school diploma.
Financing Vehicles for Education
Education savings incentives have been expanded underrecent tax legislation. The Economic Growth and TaxRelief Reconciliation Act of 2001 has made Section 529plans and Education IRAs (now called EducationSavings Accounts) even more appealing as a means ofsaving for college. Perhaps as a result, Cerulli Associates 1The College Board, Trends in College Pricing 2001, Washington, DC: 20012The College Board, Trends in Student Aid 2001, Washington, DC: 2001
estimates that the total college savings market will growby close to $80 billion over the next five years (from anestimated $22 billion in 2001 to $101 billion in 2006),with more than one-half of that total due to Section 529savings plans and one-third due to Education SavingsAccounts. According to Cerulli Associates, “it is likelythat a good portion of the new assets will representsavings that would not have occurred otherwise, frominvestors looking to realize tax savings.”3
It will now be possible to contribute to both of thesetypes of plans in the same tax year. These improvementstook effect on January 1, 2002, but without additional taxlegislation, may disappear after the year 2010. Section529 savings plans and prepaid tuition plans, EducationSavings Accounts, Roth IRAs, U.S. Savings Bonds, andcustodial accounts are all savings vehicles that areworthy of consideration by individual investors, in ourview. Additionally, learning credits against Federalincome tax, as well as federal and private loans, may betapped for funding college and many other forms ofhigher education. The main educational financingvehicles are discussed below.
Section 529 Qualified Tuition Programs
Many state governments have created innovative collegesavings programs designed to meet the needs of parentsand guardians to finance college educations. These plansvary from state to state, and may take the form of asavings plan or a prepaid tuition plan. It is possible toinvest in a plan outside the investor’s home state or evento invest in multiple state plans; most states offerresident and non-resident participation. Information oneach state’s plan is available through the CollegeSavings Plans Network (collegesavings.org), an affiliateof the National Association of State Treasurers.
Section 529 Savings Plans:The primary advantage of Section 529 savings plans isthat they are generally able to compound free of federaland local income taxes when used for education-relatedexpenses, and thus they may grow faster than a taxable
3Cerulli Associates, The Cerulli ReportTM, “The State of the College SavingsMarket: 529 Plans in Perspective.” Boston, MA: 2001 (cerulli.com/report-529.htm)
-
110
High Net Worth Investment Tools:Planning for and Financing a College Education (cont.)
Regina B. MaherSharon Gibbons
investment. Section 529 plans can be used by mostinvestors, since there are usually no income limits. Suchplans have become more flexible and the proceeds cangenerally be used at any college or universitynationwide. Parents, relatives, and friends can contributeon behalf of a specific beneficiary. Some state plans alsooffer an immediate state tax credit for annualcontributions.
The Tax Relief Act of 2001 enhanced the appeal ofSection 529 plans. Beginning in 2002, earningswithdrawn from these accounts will be free from federaltaxes. Most states are expected to follow suit at the statelevel, and benefactors will be permitted to roll fundsover to a different state plan once a year. In addition,taxpayers can claim a Hope Scholarship Tax Credit or aLifetime Learning Credit (both are federal tax credits), inthe same year that a tax-free distribution is made from aqualified tuition program, as long as the distribution isnot used for the same educational expenses for which thecredit was claimed.
Section 529 Savings Plans, some of which are managedby professional asset managers, also appeal to affluentinvestors since there are no applicable family incomelimits, and since allowable contributions to theseaccounts are sizable. If $100 per month is contributed toa Section 529 Savings Plan each year for 18 years, andearns 10% per annum, the account will grow to over$60,000. Many of these plans allow a benefactor tocontribute up to $100,000 for each child, and thedefinition of “family member” has been expanded toinclude first cousins. In some states, the maximumaccount balance (which may include a number ofcontributors) for a specific beneficiary exceeds$200,000. Unlike custodial accounts, which childrenmay assume control of at age 18, 21, or 25, these savingsplans remain under the control of the benefactor until thefunds are used for education.
Section 529 plans are still developing and establishedfinancial institutions currently manage or are vying forthe management of these state-sponsored plans. Onevariation on these plans is a college savings rewardsprogram. An organization called Upromise, has
established partnerships with corporations and brandsacross the country, and consumers are encouraged to buyproducts and services from these companies, receivingrewards into 529 plans established for this purpose.Family and friends are encouraged to set up accounts aswell, for the benefit of a particular beneficiary. Upromisecurrently has approximately 100 participatingcorporations such as AT&T, McDonald’s, and Citibank.These firms also contribute a portion of what eachbenefactor spends (usually 1 or 2 percent) into adesignated account.
One perceived drawback of 529 plans has been a lack offlexibility for the benefactor as to how the account ismanaged and the types of asset classes which may beincluded. To counter this perception, many states areadding choices such as multiple age-based portfolioswith conservative, moderate, and aggressive assetallocations. If Section 529 funds are not used foreducation purposes, earnings become taxable at theinvestor’s current federal income tax rate uponwithdrawal, with an additional 10% federal penalty taxon accumulated earnings.
As of April 2002, 220,000 accounts have been opened inthe New York State Section 529 Savings Plan, withapproximately $1 billion funded. Contributors to the planreceive an immediate New York State income taxdeduction. Single filers can contribute up to $5,000annually, and $10,000 annually for joint filers. As ofJanuary 1, 2002, withdrawals for qualified highereducation expenses are no longer subject to federal orNew York State income taxes. Total contributions to anindividual account cannot exceed $100,000 and themaximum allowable account balance for any onebeneficiary is $235,000.
Tuition Credit Programs:These plans allow the parent or benefactor to pay futuretuition today, thus locking in today’s tuition cost levels,effectively shielding the investor from increases intuition rates. Prior to the enactment of the Tax ReliefReconciliation Act of 2001, only states were allowed tooffer tuition credits, and these programs were primarilydesigned for students who planned to attend state
-
111
High Net Worth Investment Tools:Planning for and Financing a College Education (cont.)
Regina B. MaherSharon Gibbons
schools. Prepaid tuition plans can now be established byany eligible educational institution, but withdrawals willnot be tax free for private institutions until 2004. Sometuition credit programs allow the investor to switch fundsto a school outside of the host state, in some casesresulting in a reduction of all or a portion of the in-statebenefits.
Two other factors to consider before initiating a prepaidtuition plan include: (i) the fact that having the money inthe investor’s own portfolio may produce a rate of returnin excess of the projected tuition increases; and (ii) thefact that contributions to a prepaid tuition plan mayaffect a family’s application for financial aid.
The Education Savings Account (“Education IRA”)
Despite having had the term “IRA” in its name, anEducation IRA is not connected with retirement.Recently renamed “Education Savings Account” underthe new tax law, this investment vehicle was originallyestablished in 1998 to help individuals defray the costsof higher education. The Tax Relief Act of 2001increased the amount that can be contributed to anEducation Savings Account from $500 to $2,000 perchild (with no limit to the number of contributors).Under the new legislation, this savings account may alsobe used to pay for private elementary and high schoolexpenses. Annual contributions to an Education SavingsAccount are non-deductible, but withdrawals will be taxfree when used for qualified education-related purposes.The Education Savings Account can be invested in abroad range of assets, as can a traditional IRA, withflexibility as to how it is managed.
Income limits apply to Education Savings Accounts. Thephase-out for contributions to Education SavingsAccounts for married taxpayers filing jointly begins at$190,000 in adjusted gross income. No contributions areallowed if this income exceeds $220,000. BecauseEducation Savings Accounts are subject to incomelimitations, one option may be to set up accounts in thechild’s name. If the maximum amount of $2,000 iscontributed to an Education Savings Account each yearfor 18 years, earning 10% per annum, the account willgrow to slightly less than $100,000.
An Education Savings Account is set up with a specifiedbeneficiary (under the age of 18) in mind. No additionalfunds may be added to the account after the beneficiaryreaches age 18, but the account can continue to grow taxfree. In general, the funds have to be used for educationalpurposes by the time the beneficiary reaches 30 years ofage. New exceptions apply to special-needsbeneficiaries. Contributions can be made after thespecial-needs beneficiary reaches age 18, and the balancein the account does not have to be distributed when he orshe reaches age 30.
Education Savings Accounts are not restricted to parentsand grandparents; anyone may make a contribution for aspecific beneficiary. As a result, more than oneEducation Savings Account might exist for the samebeneficiary. Since the total contribution per year islimited to $2,000 per beneficiary, multiple contributorsneed to coordinate their efforts. The beneficiary of aspecific account may be changed, but only to anotherfamily member of the beneficiary. If rolled over to a newbeneficiary, an Education Savings Account is allowed tocontinue its tax-free status until the new beneficiary usesit for education-related expenses.
Taxpayers are now eligible to make a contribution toboth an Education Savings Account and a qualifiedtuition program (Section 529 plan) in the same tax year.Distributions from an Education Savings Account are taxfree when they are: (i) used to pay for qualifiededucation expenses; and (ii) used in the same tax year inwhich the withdrawal was made. Tax-free withdrawalswould have to be coordinated with (but no longerpreclude) the Hope Scholarship Tax Credit and LifetimeLearning Credits (federal tax credits) as long as the sameexpenses are not used for both.
Qualified education-related expenses include tuition andfees, room and board (subject to certain limits andprovided that the student is a half-time student at least),the cost of books, supplies, and equipment, and amountscontributed to a qualified tuition program. If withdrawalsfrom the Education Savings Account exceed expenses,excess withdrawals will be subject to income taxes andto a 10% penalty. Similarly, if there are any funds left in
-
112

High Net Worth Investment Tools:Planning for and Financing a College Education (cont.)
Regina B. MaherSharon Gibbons
the account when the beneficiary reaches 30 years ofage, a distribution of the balance must be made within 30days, and will also be subject to taxes and a penalty of10%.
“Above the Line” Deductions for Higher EducationExpensesTaxpayers meeting certain income limitations arepermitted to take a deduction for qualified highereducation expenses. However, the deduction cannot beclaimed in the same year as a Hope Scholarship TaxCredit or Lifetime Learning Credit (federal tax credits)for the same student.
In 2002 and 2003, taxpayers with adjusted gross incomenot exceeding $65,000 ($130,000 in the case of marriedtaxpayers filing jointly) are entitled to a maximumdeduction for qualified higher education expenses of$3,000 per year. In 2004 and 2005, this deductionincreases to $4,000, and taxpayers with adjusted grossincome not exceeding $80,000 ($160,000 for marriedtaxpayers filing jointly) will become entitled to areduced maximum deduction of $2,000.
Additional Investment OptionsTraditional and Roth IRAsUnder the new tax legislation, the contribution limits toall IRAs have been increased. In 2002, it is possible forcertain investors to set aside $3,000 annually per personin Roth IRAs to compound on a tax-free basis. Thisamount increases to $4,000 in 2005 and $5,000 in 2008.It is possible to withdraw contributions to Roth IRAs ona tax-free and penalty-free basis for use toward a child’scollege education. Earnings in the account can be usedfor college expenses without penalty, if taxes are paid onthe early withdrawals. Roth IRAs are subject to incomelimitations.
Savings BondsU.S. Treasury securities can under certain conditions becashed in and used for educational purposes on a tax-freebasis. Tuition covered by Hope Scholarship Credit orLifetime Learning Credit (federal tax credits) cannot becounted in determining exclusion of interest income.
Custodial Trust AccountsIt may be advantageous to shift ownership of certainassets to the investor’s children. The income is taxed atthe child’s rate (although for children under age 14, theamount of unearned income that may be taxed at thechild’s federal income tax rate is limited.) The simplestway to accomplish the transfer of assets to children is byestablishing a custodial account through the UniformGift to Minors Act (UGMA) or the Uniform Transfer toMinors Act (UTMA) depending on the investor’s state ofresidence and the types of assets selected to fund theaccount. These tax-advantaged accounts enable theinvestor to give money to a child (a minor), while at thesame time allowing the investor to maintain control overhow the money is spent and invested until the childreaches the age of majority.
For children under age 14, the first $750 in earnings istax-free and the next $750 is taxed at the child’s tax rate;for older children, all earnings are taxed at the child’s taxrate. Although significant, these tax advantages are notas compelling as the zero tax rates in a Section 529 planor in an Education Savings Account. A drawback tothese accounts is the lack of certainty that the funds willbe applied toward education expenses. These fundstransfer out of the custodian’s hands and over to thechild at age 18, 21, or 25 (depending upon the age atwhich custodial accounts end in the investor’s state).Another potential drawback for families of moderateincome is that since custodial accounts are considered astudent’s asset, they may render a family less eligible forfinancial aid.
Zero Coupon BondsInvestors can purchase zero-coupon bonds that are slatedto mature just as children reach college. Because theyield to maturity is established at the time of purchase,investors have the advantage of knowing exactly howmuch the bonds will be worth when they mature.
Student Loans and Other BorrowingIf the cost of education is too high to be covered bysavings alone, or if the investor’s time horizon is tooshort to accumulate sufficient funds for educationalexpenses, other methods of funding may be considered.
-
113

High Net Worth Investment Tools:Planning for and Financing a College Education (cont.)
Regina B. MaherSharon Gibbons
These methods include federal loans such as (PLUSloans, Stafford loans, or Sallie Mae loans), home equityloans, or loans against the investor’s 401(k) plan.
Under the new tax legislation, the deduction for studentloan interest has been enhanced, but income limits apply.In 2002 and 2003, the $3,000 deduction for interest paidon qualified education loans will be phased out at$65,000 for single taxpayers and $130,000 for marriedtaxpayers filing a joint return. There is no longer a limiton the number of months for which the deduction can betaken.
Federal loans are guaranteed by the government and canprovide an inexpensive way for students and parents toborrow. Federal loans include Federal Stafford Loans,Federal Perkins Loans, and Parent Loans forUndergraduate Students (PLUS).
Federal Stafford Loans, available to undergraduate andgraduate students, are the most commonly utilizededucation loans. There are limitations on the amount thatcan be borrowed and the repayment term for these loansranges up to ten years. Stafford loans can be subsidizedby the government if it is determined that the loan isneed-based. In this case, the government pays theinterest on the loan while the student is in school andduring the grace period before the student begins payingback the loan. Unsubsidized Stafford loans are availableto students who do not qualify for a subsidized loan. Theborrower is responsible for the interest on the loan assoon as the loan is initiated.
Federal Perkins Loans are federally funded, bear a lowinterest rate, and are awarded by individual participatingcolleges based on the student’s need. Since eachparticipating school has a limited allocation of Perkinsfunding, these loans are usually distributed selectivelywhere need can be shown.
Federal PLUS Loans are low-interest federally fundedloans for creditworthy parents of undergraduate students.These loans can be used to pay for the full cost of astudent’s education.
Private loans can be used by students in addition tofederal loans. Interest rates on these loans may be as lowas the prime rate, depending upon the borrower’s creditrating, with a repayment term of up to 25 years. SallieMae offers private loans such as the Signature StudentLoan and the Career Training Loan.
Learning CreditsFederal tax credits exist to recover a portion of tuitionand fees for taxpayers with modified adjusted grossincome below certain levels (geared to lower- andmoderate-income families). Tax credits, which aresubtracted from income taxes due on a dollar-for-dollarbasis, are generally more effective in reducing taxexpenses than tax deductions. The Hope Scholarship TaxCredit provides up to $1,500 in federal tax credit peryear and per student and is available for the first twoyears of a college education when the student is pursuinga degree or another recognized educational credential.Lifetime Learning Tax Credits offer one credit of up to$1,000 per family per year; the credit extends beyondcollege and is available for one or more courses. Bothcredits cannot be claimed in the same tax year for thesame student. New tax legislation no longer restrictstaking one of these credits in the same year that anEducation IRA withdrawal is made.
Scholarship Information
Scholarship sources include government agencies,private industry, trade organizations, labor unions, localbusinesses, community associations, and non-profitorganizations. They may be based on academicachievement, special talent, a specific career goal, orperhaps financial need. While federal and state sourcesmay generally base their awards on need, some schoolsare offering merit awards to attract better students andultimately raise the school’s overall ranking. TheNational Merit Scholarship Corporation, a non-profitprivate organization, is another source for scholarshipsbased on merit.
Some scholarships can be applied for more than onceand not all scholarship applications apply only to the firstyear of school. Employees may have access to company-sponsored scholarship programs. The Internet is a
-
114

High Net Worth Investment Tools:Planning for and Financing a College Education (cont.)
Regina B. MaherSharon Gibbons
resource for available scholarship monies, offeringservices that are either free4 to online browsers or feebased.5 Scholarships are often tied to performance ineither academics or athletics, and can be rescinded undercertain conditions.
College grants offer advantageous financial assistancebecause they are not tied to performance and do not haveto be repaid. Grants can be extended to students basedupon need or merit. The largest federal grant program,Federal Pell Grants, is based on financial need. FederalSupplemental Education Opportunity Grants (FSEOG)are available to those with exceptional need.
Resources Available
College guides are a good first step in the selectionprocess. Colleges and universities are listed and oftenrated according to various criteria, including academics,sports, reputation, median test scores, location, cost,available majors, extracurricular activities, and othercategories. Among other sources, guides includeChoosing the Right College, The New Best 331 Collegesfrom Princeton Review’s Annual College Rankings, U.S.News & World Report’s: America’s Best Colleges, TheFiske Guide to Colleges 2002, and Kiplinger’s.
The Testing Process: Kaplan, Princeton Review,CollegePrep, and other groups offer test preparationreview courses for entrance exams. These testpreparation resources provide online self-tutoringprograms, classroom-based instruction at local centers,and self-study guides.
Online college planning sites can aid in the collegeselection process, educate students and parents aboutfinancing options, and provide information on preparingfor entrance examinations.6 College savings plancalculators allow investors to estimate future education 4Scholarship Experts, endorsed by Sallie Mae, is an example of a fee-basedInternet site which offers guidance on scholarships and adheres to a strictcode of privacy.
5Scholarships.com and FastWeb.com are popular free internet servicesaccording to New York Times article, “For Resourceful Students, the InternetIs a Key to Scholarships,” dated March 31, 2002.
6Wired Scholar, Sallie Mae’s go-to-college website, was designated by Forbesmagazine as the best of its kind online in Forbes’s Best of the Web Issue datedJune 25, 2001
costs and potential shortfalls, and devise a monthlysavings plan to cover future expenses. These calculationtools take into consideration: present costs, averageannual cost increases, the number of years before thestudent enters school, the type of school underconsideration, current savings levels, expected rates ofreturn on savings, and the expected number of years inschool.
For students who will have to travel a distance to schoolor travel for educational purposes, two student travelservices, Council Travel (counciltravel.com), STA Travel(statravel.com), and Student Universe(studentuniverse.com) help parents/students find the bestfares for student travel. The Student Advantage Card(from Council Travel) offers discounts on certain airfareand ground transportation. AirTran Airways X-Faresenables students to fly standby at reduced rates. The Bluefor Students card from American Express offers areduced flight program, as does Citibank’s no-feeplatinum card for students.
Investors are reminded that Morgan Stanley does notprovide legal or tax advice. The investor shouldconsult his or her personal tax advisor or attorney formatters involving taxation and tax planning andhis/her attorney for matters involving personal trustsand estate planning, including the issues discussedabove and how they apply to the investor’s personalsituation.
-
115

High Net Worth Investment Tools:Planning for and Financing a College Education (cont.)
Regina B. MaherSharon Gibbons
Sources of Further Information
Books
The Best Way to Save for College, by Joseph F. Hurley, BonaComPublications, 2002.
America’s Best Colleges, U.S. News & World Report, 2002.
Choosing the Right College, by Intercollegiate Studies Institute, 2001.
The Fiske Guide to Colleges, by Edward B. Fiske, 2002.
Financing College, by Kristin Davis, Kiplinger’s, 2001.
Peterson’s College Money Handbook, Peterson’s Guides, 2001.
The Prentice Hall Guide to Scholarships and Fellowships for Math andScience Students, by Mark Kantrowitz, Prentice Hall, 1993.
Government Brochures
US Department of Education. Funding Your Education, 2000-2001
US Department of Education. Looking for Student Aid
US Department of Education. The Student Guide, 2001-2002
Websites
Cerulli Associates (cerulli.com) New York Saves (nysaves.org)
College Board (collegeboard.org) Peterson’s (petersons.com)
College Savings Plans Network (collegesavings.org) Princeton Review (review.com)
Federal Student Aid (ed.gov/studentaid) SallieMae (salliemae.com)
FastWeb (fastweb.com) Saving for College (savingforcollege.com)
Fidelity (fidelity.com) Scholarship Experts (scholarshipexperts.com)
FinAid (finaid.org) Scholarships (scholarships.com)
Forbes (forbes.com) SmartMoney (smartmoney.com)
Free Application for Federal Student Aid (fafsa.ed.gov) STA Travel (statravel.com)
Internal Revenue Service (irs.gov) Upromise.com (upromise.com)
Kaplan (kaplan.com) US Department of Education (ed.gov)
Kaplan Test Prep (kaplantestprep.com) US News (usnews.com)
Kiplinger (kiplinger.com) US Treasury (ustreas.gov)
Motley Fool (fool.com) Wiredscholar (wiredscholar.com)
National Merit Scholarship Corporation (nationalmerit.org)
-
116
Construction and Implementation 119
Qualitative Investment Factors 123
Investment Manager Selection Criteria 125
Evolution of the Core Equity Concept 127
Tax-Efficient Separate Account Management 132
The Interplay of Fear, Greed, and Rationality in Equity Investing 135
S&P 500 Industry Sector Composition 137
Financial Parenting 141
Venture Capital/Private Equity: Environmentally Conscious Investing 147
-
117


Investment Philosophy: Construction and Implementation John M. Snyder
John Snyder is a Private Wealth Management VicePresident managing discretionary and non-discretionaryassets for High Net Worth investors.
Successful investing, reduced to its most basic elements,is a two-part affair. The first decision involves selectionof securities, the second decision has to do with abidingby the first, often over a considerable period of time.
The security selection process is a skill requiringrelentless research, inquiry, and analysis. It is active, anddemands continuous monitoring to verify the originaldecision. The skill is developed by mastering therequisite business, accounting, and mathematical skills,and utilizing them with good common sense.
The ability to abide by one’s judgment is an attribute ofcharacter, having to do with patience, faith, and thestrength to endure alarming, nonmaterial short-termfluctuations. Though it is based on strength ofconviction, it can appear passive in the face of eventsthat seem to demand action. Examples of sticking toone’s guns are the patience of Job, the fortitude ofPenelope, and the profound late works of Beethoven,composed after the loss of his hearing.
All of the legendary investors, including Ben Graham,Warren Buffett, and Philip Fisher seem to havepossessed these parallel attributes, which, at first glance,can appear disparate. Put another way, the twodisciplines, selection and conviction, are also sequentialand of unequal duration, as in the acquisition of a prize-winning acorn and the harvesting of an oak at a laterdate.
Consider some examples of the investment prowess ofBenjamin Graham, Philip Fisher, and Warren Buffett.Benjamin Graham’s business career spanned the GreatDepression, and his ultra conservative investmentstrategy was influenced by it. “Margin of Safety as theCentral Concept of Investment” is the title of the lastchapter of his book, The Intelligent Investor, which isaddressed to investors as opposed to speculators.Graham’s methodology was quantitative andmathematical. His calculations enabled him to findcompanies selling at discounts to their liquidating value.He invested primarily in such bargains and held them
tenaciously, sure in his evaluation, until their value wasrecognized in the market.
For an example of his prowess, I am indebted to apassage from John Train’s The Money Masters: “Grahamnoticed that Northern Pipeline held $95 per share ofquick assets, although it was selling at only $65, atwhich price it yielded 9%. Graham’s partnership boughta substantial interest in the company with the thought ofencouraging it to distribute the unneeded assets to itsshareholders. At the 1928 annual meeting, he arrivedwith proxies for 38% of the shares and went on theBoard of Directors. In due course he was instrumental inpersuading the company to pay out $50 per share. Whatwas left was still worth more than $50 a share, bringingthe total value to $100, or a substantial profit over hiscost of $65.”
What distinguished Graham as a great investor was hisability to define value and his conviction on the ultimateoutcome, which he either patiently waited for or induced.
Philip Fisher developed a rigorous 15-point checklistfor the selection of a growth stock that he was willing tohold for a long period. In addition, he devised a highlyeffective informal strategy to corroborate hisconclusions. This method, which he terms “scuttlebutt,”consisted of tapping into the business “grapevine” ofindividuals who were customers, employees, formeremployees, suppliers, or competitors of the company —people closely connected to its operations and not in thebusiness of buying and selling stocks. Once a companymet his muster, Fisher bought in with the intention ofholding indefinitely as long as the fundamentals did notchange.
An example of Philip Fisher’s prowess is his investmentin Motorola, which was accumulated over of a period ofmonths beginning in 1957. Mr. Fisher told me recentlythat he still retains every share of his original investmentin Motorola, 40 years later. Each dollar invested in 1957is now worth slightly more than $242, a 14.7%compound annual rate of return. A relatively small initialinvestment is now worth many millions. Mr. Fishermodestly requested that we not publish the actual size ofhis initial and current investment.
-
119
Investment Philosophy: Construction and Implementation (cont.) John M. Snyder
Philip Fisher differs substantially from Ben Graham inhis focus on discovering companies having thepossibility of sustainable growth for many years in thefuture.
Warren Buffett, who spent two years at Graham’scompany, Graham Newman, credits both Graham andFisher for contributing to the philosophy leading to hisown notable investment record. He once said that hisinvestment philosophy was 85% Ben Graham and 15%Phil Fisher. Many observers feel that the Fisher influencehas increased with the evolution of Buffett’s thought.
Warren Buffett’s best known success is his investment inCoca-Cola, which was initiated in 1988. By the end of1989, he had invested a little over one billion dollars inthe company, substantially completing his position.According to the 1996 Berkshire Hathaway AnnualReport, his year-end 1996 position was 200,000,000shares, having a market value of approximately $10.5billion, compared to a total cost of approximately $1.3billion.
Buffett differs from Graham and Fisher in his focus onthe value of a business franchise that he can easilyunderstand. He does not invest in technology-basedgrowth stocks, preferring consumer, insurance, andfinancial businesses whose future streams of earnings hefeels are more predictable.
Successful investing along the lines of these threemasters is not impossible for individual investors. Lesswell-known than Buffett’s triumph with Coca-Cola arethe many shrewd individuals, particularly in the state ofGeorgia, that made the investment decision to buy Coca-Cola long before 1988, added to their positions over theyears, and achieved returns superior even to Buffett’s byselecting well and by exercising patience.
Philip Fisher told me that numerous readers of hisCommon Stocks and Uncommon Profits (first publishedin 1958) have reported very good results achieved byinvesting according to his principles. Probably the“scuttlebutt” element of Fisher’s approach has benefitedmany successful investors in regional companies (Coca-Cola in Georgia, for instance) simply because an
awareness of the companies’ acumen was commonknowledge in the area and readily available to localinvestors.
Of course, these successful local practitioners alsoexhibited the requisite patience, a trait with which somepeople seem to be factory-equipped. Others lack the geneentirely.
Fortunate are those who happen to have grown up in thegeographical backyard of a Coca-Cola, and had theperspicacity to invest in it. Practically speaking,however, most people haven’t had that good fortune orthe time and inclination to master the discipline ofsecurities analysis. The problem then becomes that ofdeveloping an intelligent investment philosophy withinthe constraints of limited time.
The quest begins with the investor educating himself orherself by studying classic investment literature to obtainguidelines to historically successful strategies, most ofwhich boil down to stringent research combined with along-term investment mentality. The writings ofGraham, Fisher, and Buffett are a good start, and areaccessible to the layperson in the following publications:
• The Intelligent Investor, by Benjamin Graham(Harper & Row, 1973)
• Common Stocks and Uncommon Profits and OtherWriting, by Philip A. Fisher (John Wiley & Sons,Inc. 1996 paperback edition)
• Berkshire Hathaway Annual Reports 1977–1996,written by Warren Buffett. A two-volume set ofletters from the 1977–1996 annual reports areavailable to nonshareholders at a charge by writtenrequest to Berkshire Hathaway Inc., 3555 FarnamStreet, Omaha, NE 68131
• An excellent book, in my view, about WarrenBuffett (who has not written one, and has indicatedthat his annual reports adequately reflect hisphilosophy) is: Buffett, the Making of an AmericanCapitalist, by Roger Lowenstein (Random House,1995)
-
120
Investment Philosophy: Construction and Implementation (cont.) John M. Snyder
The process of developing an investment philosophy canbe broken further into a few key disciplines:
I. Obtaining Facts for Selection and SubsequentMonitoring of Investments
This begins with reading investment classics like thoselisted above. It is supplemented with financialpublications such as The Wall Street Journal, Barron’s,Business Week, Forbes, The Economist, OutstandingInvestor Digest, and statistical sources such as ValueLine Investment Survey and the Standard & Poor’sMonthly Stock Guide. Specific company research isavailable from the research department of the institutionwith whom the investor has an investing servicesrelationship. Much information is also available on theInternet.
II. Informal Inquiries into the Operation of aCompany
This consists of talking and listening to persons withdirect knowledge of a company — employees, suppliers,customers, and others who have a working acquaintancewith its operations, and who are not in the securitiesbusiness. It is an effort to obtain relevant publicinformation about a company, particularly itsmanagement, and is not an attempt to extricate illegalinside information. This element of investing is easierwith companies in one’s geographical region, but it isbecoming more feasible at a distance with the advent ofinvestor chat forums and other venues on the Internet.
III. Reflecting Upon and Knowing One’s Self
This is the part of the process that requires theapplication of sufficient thoroughness, ruthlessintrospection, and self-honesty in the selection process tojustify the resolution to be patient once the investment ismade. This is no small matter, as applying patience to abad decision could have very unfavorable results. It is anarea where acquaintance with philosophical valuesreflected in enduring literature, art, and religion comeinto play since the selection process depends first on
determining the truth so far as it can be known, followedby the faith to abide by one’s determination so that “thetruth may out.” In a fast-moving world where thepreference is for instant gratification, the requisitedisciplines may place the long-term investor in a lonelyposition.
IV. Writing Down an Investment Philosophy
The last step in the process is to put in writing an outlineof one’s plan. A plan might include some or all of thefollowing topics:
1. Characteristics of Investable Companies:
• A business that can be easily understood
• An enduring franchise
• Steady history of revenue and earning increases
• Strong finances
• A leader in its industry
• Management has significant stock ownership (eats itsown cooking)
• Good management with long-term focus andenlightened employee relations
• Substantial investment in R&D and modernization
• The CEO is a visionary genius in his or her field
2. Characteristics of Companies to be Avoided:
• Participation in too many businesses to be easilyunderstood
• Little stock ownership by management
• Highly competitive business with no significant edge
• Overcompensated officers
• Poor employee relations
• Excessive financial leverage
• Erratic historical earnings
• Overdependence on one supplier, one product, or onecustomer
• Insufficient R & D budget to remain competitive
• Turnaround situation with too much uncertainty
-
121

Investment Philosophy: Construction and Implementation (cont.) John M. Snyder
3. Methods of Financial Evaluation:
• Debt issues’ credit rating
• Degree of financial leverage
• Magnitude of free cash flow
• Price-earnings ratio reasonable in relation to past andprojected growth rates
• Consistent stock repurchases
• Dilution of outstanding stock options offset by sharerepurchases
4. Sources of Investment Information:
• Annual reports, 10-Ks, and 10-Qs
• Mailing lists
• Websites
• Professional investment associations
5. Selection and Monitoring of Positions:
• Cultivate contacts — customers, employees, andsuppliers of companies in which the investor isinterested
• Use the Internet to contact fellow shareholders andother interested groups
• Monitor the comments of large shareholders
• Attend corporate annual meetings
• Listen to quarterly conference calls reviewingmanagement’s discussion of earnings
• Attend company roadshows when in the investor’slocality
• Speak to Investor Relations personnel, who oftenreflect the spirit and attitude of a company
• Keep abreast of relevant scientific research at thehighest level the investor can understand(publications such as Scientific American, PopularScience, Consumer Reports, and the science sectionof the newspaper can be useful)
• Read publications of appropriate trade associations
6. Sell Disciplines:
• When subsequent developments make it clear that theoriginal selection was a mistake
• When, over time, there is a negative change infundamentals such as a mass exodus of keypersonnel, new management reveals a short-termorientation or self-serving policies, an inability tomaintain profit margins, technological obsolescence,or the inability or a corporate unwillingness to fundsufficient R&D to remain competitive
• When an overwhelmingly superior investmentbecomes available
These six steps outline many of the components of whatis involved in constructing an investment philosophy. Insome ways, the process is simple, as a few good choicescan be exceedingly profitable over time. The complexitylies in the accuracy and good judgment required in theselection process, and the considerable fortitudenecessary to stay with a good selection to reap the long-term returns from investing.
In any case, the job seems simple when both theselection and the abiding are well-executed. It hasgenerally been to the advantage of the successful HighNet Worth investor to have associated himself or herselfwith an institution having a reputation of significantcompetence and integrity. Equally important, has been arelationship within that institution with a person orpersons who have shown the ability to discern value, andwho firmly uphold the discipline to stick with goodpositions for long periods of time. This approach issupported by the observations of Ben Graham, PhilipFisher, and Warren Buffett. These prophets’ utterancesshould be revisited with some degree of frequency, asthe virtue of patience resides in an area easily susceptibleto backsliding, and where periodic renewal is in order.
-
122
Investment Philosophy: Qualitative Investment Factors Thomas C. Frame
Perhaps 90% of investment literature and dialoguefocuses on the quantitative, mathematically certaincharacteristics of securities. After all, accounting is thelanguage of business, and price earnings ratios, earningsgrowth, return on equity, and margins are the tools ofinvestment analysis. At the same time, most successfulinvestors realize that the quantitative factors are merelythe starting point. Most of the really large returns, theten-baggers, accrue to those skilled in evaluating thequalitative investment factors. Warren Buffett credits hispartner, Charlie Munger, with convincing him that it isbetter to buy a “great business at a good price than agood business at a great price.” Great businesses aredistinguished by the uncommon characteristics which arenot easily measured and not easily replicated.
While the qualitative factors are not complex, successfulinvesting requires an experienced evaluation of theirimportance vis-a-vis the quantitative issues. It comes asno surprise that the best companies in an industrytypically trade at a premium to the average. Yet, it ispossible over and over to find vastly superior companiestrading at modest premiums to average performers. Withthis in mind, it is almost always a mistake to purchasethe statistically cheaper company, since the really greatones are always expensive. The justifications for thesepremiums are found in the qualitative factors. Some ofthe most important are the following:
Management
To some extent, investing in any stock represents a leapof faith for an investor who is in essence turning overpersonal funds to the company’s management. Buffetthas advised buying “a business even an idiot could run,because sooner or later, one will.” A great managementteam cannot make a mediocre business great, but itsvalue to an already good business is incalculable.Absolute integrity is a must, but perhaps the bestyardstick is a long-term total commitment to enhancingshareholder wealth. The investor should be especiallywary of the bureaucratic, caretaker management withlittle regard for the long-term return to shareholders.Particularly in financial companies, a strong culture ofmanagement conservatism in lending and underwriting is
far more important than the appearance of adequatereserves.
Longevity of management and founders with a stake inthe business are also a meaningful indicator. Jack Welchoften credits his having sufficient amounts of time toimplement important changes to General Electric’s long-term success. Would anyone question Bill Gates or SamWalton’s dedication to the shareholder’s best interests?Founder/entrepreneurs often offer one of the bestfinancial bargains, as their compensation typically isminimal compared to their ownership interest. They actlike owners because they are. On the other hand,handsome compensation packages in and of themselvesare not a negative. Jack Welch, Roberto Goizueta ofCoca-Cola, and Michael Eisner of Disney each havebeen able to accumulate significant wealth whiledelivering outstanding returns to shareholders.
In addition to a long-term track record, most executivesreveal a great deal in their annual letter to shareholders.Their enthusiasm is readily apparent and the best seem todemonstrate a palpable love for their business and acandor for straightforward discussion of problems. Theinvestor who reads a number of annual reports canquickly discern which are the outstanding managementteams. Buffett has talked of the “tailor who is thinkingonly of suit sizes when he meets the Pope.” Reading anannual letter from Al Zeien of Gillette or the lateRoberto Goizueta of Coca-Cola seems immediately toreveal a passion for their business which is rarely found.A prime example is Jack Welch describing GE’s SixSigma program as a “soul transforming experience” forGE employees. While it may not make the investor wantto work at GE, it demonstrates an intensity thatshareholders admire and appreciate.
Research and Development
Research and development of new products is critical forsustaining superior performance from almost allcompanies. It is also one area which is virtuallyimpossible to assess from quantitative reports andrequires extensive trust in management. Particularly inthe healthcare and technology fields, the average investor
-
123
Investment Philosophy: Qualitative Investment Factors (cont.) Thomas C. Frame
would have no way to determine what a company maybe working on for future products or how effective thoseproducts are likely to be. The investor can only rely onmanagement’s demonstrated success and technologicalcapabilities.
When properly implemented, the research anddevelopment process should offer not only superior newproducts but also additional pricing power, brandleverage, and cost reduction potential.
Gillette has apparently spent over $750 million todevelop its new Mach 3 razor. Since its developmentwas shrouded in secrecy, investors can only rely on thecompany’s long-standing track record that the fundswere well spent. Similarly, investors can never trulyassess the drug pipeline of a Merck or Pfizer, but theycan be fairly confident that a number of potentialproducts are on the way.
Often, a superior research and development processoffers the additional benefit of causing current reportedresults to be very conservative. Much of the cost ofsignificant new products from Intel and Microsoft islikely expensed in this year’s numbers even thoughrevenues may not appear for several years. Astuteanalysts noted several years ago the higher-than-normalresearch expenses showing up at Pfizer. While it isimpossible to quantitatively evaluate the future films andother products which are being developed by the WaltDisney Company, their likely existence has probably asmuch to do with the rationale for purchasing the stock asany numerical criteria.
The Brand
Of the assets a company owns, brand strength is likelythe most powerful, yet the most difficult to achieve andmaintain. No single statistic provides insight into its truevalue. Executives move on, machinery wears out, and
products become obsolete, but a brand can be maintainedas a basis for sustainable, profitable growth. Yet a brandis far more than successful product positioning or cleveradvertising. Good business managers know that a brandshould dominate all decisions and be protected at allcosts. They understand that strong brands are effects, notcauses. They are the result of attention to millions ofdetails relentlessly pursued by a dedicated culture.
Good brand managers have a clear idea of what theywant to represent to consumers. McDonald’s is careful toensure that a Big Mac provides the same experienceworldwide. Disney employees know that when they referto “The Mouse,” an image is evoked of quality, familyentertainment that stands for something in theconsumer’s mind. Disney received a special exemptionfrom the international maritime authorities to paint thelifeboats on its new cruise ships yellow to matchMickey’s colors. They live the brand. Protecting a brandis sometimes painful: to maintain their brand Johnson &Johnson quickly recalled all its Tylenol to reestablishconsumers’ trust and Intel replaced the Pentium chipswhich contained an obscure flaw.
The brand which is well nurtured should offer bothstrong pricing power and the volume growth whichmakes displacement extremely difficult. In time, theseshould become reflected in the company’s numbers andstock price performance.
Each of the above qualitative factors adds an importantdimension to the quantitative assessment of investments,highlighting the longer-term endurable facets of aninvestment. The investor is well served to remember thatprecisely because of its precision, accounting isinadequate to capture imprecise but far more importantinvestment criteria. Mastery of both realms is the key tosuperior performance.
-
124
Investment Philosophy: Investment Manager Selection Criteria Jesse L. Carroll, Jr.
The principal factor in the success of most portfoliomanagers is really not the particular technique, but theskill of the manager using that technique.
— Institutional Investing, by Charles W. Ellis
Technique, method, strategy, style, system: however onelabels the investment selection process, every authenticinvestment manager generally abides by one. With thecurrent abundance of investment vehicles and styles, andinvestors’ generally positive experiences with financialassets, there seems to be no shortage of ways to managemoney. Even when the investor has focused his or hersearch on a specific type of style and/or vehicle, he orshe must continue to search, with detail and discipline,for the most appropriate investment manager.
For the High Net Worth individual investor, the primaryobjective of investing has remained undisturbed over theyears for all practical purposes. The overwhelmingmajority among this group invest to increase wealthand/or to insulate their capital from the depredations ofinflation and taxes. This implies that capital should beinvested in some manner to maximize total real returnafter taxes. Accordingly, an investment manager whofails to take account of the potentially negative effects ofinflation and taxes, fails to recognize the true nature ofthe individual investment world. As a result, his or herinvestment methodology is severely disadvantaged.
In the October 15, 1997 Wood, Struthers & WinthropQuarterly Investor Letter, Stanley A. Nabi, Chairman oftheir Investment Policy Committee, spelled out a highlyencompassing description of the “right stuff” required oftop calibre investment managers. He stated that:
Investing is a dynamic process that possessesnone of the limits of the physical sciences. It is adiscipline that demands a panoramic view ofsubstantially all of the relevant informationaccumulated over the history of mankind. Itrequires familiarity with science and technology,an understanding of politics and internationalrelations, an appreciation of the role of socialpsychology (and the hysteria of crowds), a graspof the various shadings of accountancy, agenerally accurate assessment of theproduction/consumption factors that drive theengines of the important economies of the world,and the exacting sense to accord each of theforegoing its proper value in the investment
equation. In short, it is a discipline beyond humancapacity to master totally.
Any reader of this superhuman job description has noreason to wonder why indexing has grown so rapidly andbecome such a popular alternative to active management,particularly in the institutional arena.
Selection of an investment manager is, in some ways,more manageable than the challenges Nabi describesfacing a full-time investment manager, yet selection isstill a difficult task. Selecting an investment manager isanalogous to a high-level executive search, backed up byextensive analysis. Containing both qualitative andquantitative factors, a useful framework for selecting amanager can be summarized in the four P’s: people,philosophy, process, and performance.
Investment Manager People Evaluation Criteria
The first area of inquiry, people, concerns theorganization supporting the manager’s investmentactivity. Some of the key issues to address in evaluatingasset managers are set forth in the accompanying box.
• What is the ownership structure?
• What are the reporting lines?
• What is the depth of the professional staff, includingportfolio managers, analysts, traders, and theadministrative support team?
• Who is (are) the key decision maker(s)?
• How is compensation determined?
• How is the organization planning to handle the strainscreated by growth in assets under management?
• What succession plan, if any, is in place?
Investment Manager Philosophy Evaluation Criteria
The next area to probe, philosophy, is the heart and soulof the manager’s technique. Correctly understanding amanager’s philosophy may be the most difficultchallenge the High Net Worth individual investor facesin selecting an investment organization or person tomanage his or her assets. This is the “P” where thegreatest value is added by the individual investor whocan devote the resources to research the issues describedin the accompanying box.
-
125

Investment Philosophy: Investment Manager Selection Criteria (cont.) Jesse L. Carroll, Jr.
Investment Manager Philosophy Evaluation Criteria
• How does the manager define his or her philosophy?
• Is the manager’s philosophy understandable and doesit make sense?
• Has the manager’s philosophy been appliedconsistently? What proof is there of a consistentapplication of the philosophy?
• Does the manager “eat home cooking” (manage his orher own funds pari passu with his or her clients’funds)? If so, what percentage of the manager’s assetsare committed to his or her technique? If not, why?
• Are all clients treated equally? If not, what are theexceptions and why? Do these exceptions makesense?
• Does the manager attempt to time the market, orremain fully invested at all times? Does the manager’sphilosophy fit the client’s investment objectives?
• What is the manager’s turnover rate? What portion ofthe turnover is attributable to investment decisions,harvesting of unrealized losses, and client requests forwithdrawals?
Investment Manager Process Evaluation Criteria
The third point of examination, process, concerns theimplementation of the manager’s technique. Theaccompanying box furnishes a number of factors of usein the evaluation of a manager’s investment managementprocess.
• Can the process be clearly and simply articulated,despite the complexities of the underlying discipline?
• Can it be replicated by others in the event of amanager departure?
• Can the process be tracked and monitored forinvestment style drift?
• Are the fees charged reasonable?
• What allowances does the manager make for newbusiness presentations, interacting with, and servicingclients? Do clients have direct access to the manageron an ongoing basis?
• Where and how does the manager source investmentideas?
• What are the sources for research? What are thebuy/sell guidelines?
Investment Manager Performance Evaluation Criteria
The final area of inquiry, performance, is the statisticalyardstick for assessing a manager's technique. Somecomponents of this evaluation methodology arecontained in the accompanying box.
• Are the published returns compliant with the standardsof the Association for Investment Management andResearch (AIMR)?
• Does the record belong to one decision maker orseveral?
• What percentage of the manager’s accounts areincluded in his or her composite investment returns?
• How much variance is there within the manager’scomposite return results?
• What is the appropriate benchmark for comparativepurposes?
• What are the after-tax returns?
• What are the risk-adjusted returns?
• How frequently and under what format is performancereported?
These four P’s, of people, philosophy, process, andperformance, are intended to provide the individualinvestor with a set of filters to select, from among themultitude of choices, the most appropriate investmentmanager, given the investor’s specific objectives,circumstances, and resources.
Even though wide currency, equity, and bond marketfluctuations may at times loom large in investors’consciousness, High Net Worth investors need to stayfocused on the true underlying issues: inflation, taxes,and investment results. We believe establishing long-term investment guidelines, determining the appropriatestrategic asset allocation, and using the four P’s forinvestment manager selection are among the mostimportant means of enhancing the individual High NetWorth investor’s chances of achieving his or her long-term financial goals.
-
126

Investment Philosophy: Evolution of the Core Equity Concept Walter Maynard, Jr.
We believe a successful investment strategy for anequity-oriented taxable investor should consider as oneof its primary objectives, the holding for three to fiveyears or more, of a diversified group of quality growthstocks. This time period should allow for a reasonablenumber of positive surprises as well as bridge anynormal period of down markets. The initial commitmentmight include ten positions, out of perhaps 25–30 in theportfolio, which could be called “core holdings”: that is,participations in companies with excellent businessprospects which can be held indefinitely for significantlong-term rewards. These stocks are generally expensivein valuation terms. In the advanced stages of a bullmarket, they may very well be selling at prices of two ormore times their expected long-term earnings growthrates. Nevertheless, if experience is any guide, they willbe well worth paying up for. To illustrate the point,assume a portfolio managed since the mid-1970scontains within its list of core holdings three of unusualduration, shown in the table below.
Table 1: Selected Core Holdings List
Shares CompanyPurchase
Date Cost
MarketValue
12/31/98 Appreciation
CompoundAnnualGrowth
Rate13,200 Dayton Hudson 1/14/1976 $16,956 $699,144 41x 18%32,000 Abbot Labs 8/19/1982 61,901 1,568,000 25x 22%16,000 Johnson &
Johnson8/19/1982 83,973 1,258,027 15x 18%
Source: MSDW Investment Group.Past performance is not indicative of future returns.
Dayton Hudson was purchased to participate in the alreadywell-defined growth of the Target discount chain. AbbottLabs and Johnson & Johnson were then, as they aregenerally viewed now, recognized leaders in health careproducts. The timing of these purchases was clearlyfavorable. In 1976, the U.S. equity market was stillrecovering from its worst decline since the 1940s. August19, 1982, was a day or two after then-Federal ReserveChairman Paul Volcker brought about a historic reductionin short-term interest rates (then in the mid-teens), whichmarked the beginning of a bull market in stocks and bonds.At the same time, there are numerous examples of strongrelative performance among the leading growth stocksbought in 1973 at record high prices of three or four times
their earnings growth rates. Many of these stocks fell by50–75% in 1974–1975, but after a sufficiently longrecovery period, the best companies among this group hadgenerated superior cumulative investment returns throughthe late 1980s and during the 1990s. In his book, Stocks forthe Long Run, University of Pennsylvania Professor JeremySiegel points out that an investor who purchased all NiftyFifty companies (including 20 or more which generatedlackluster returns) at peak prices in 1972 would have earned12.5% annually on such a portfolio over the succeeding 25years, only 20 basis points less than the S&P 500 indexover the same time period.
Genesis of the Core Holding Approach
In the 1950s and early 1960s, bank trust departmentscomprised the largest category of institutional investors.For these institutions, the primary investment objectivewas to preserve capital while participating in the overallgrowth of the economy. Serving this purpose was arecommended list of core stocks from which trustofficers would construct client portfolios. The idea wasto have representation at all times across a widespectrum of the economy via a selection of establishedblue-chip industry leaders. A typical list included suchnames as AT&T, Alcoa, Eastman Kodak, Du Pont, DowChemical, General Motors, RCA, General Electric,General Foods, International Paper, IBM, Merck, J.P.Morgan, Sears Roebuck, Union Carbide, and U.S. Steel.These were all considered core stocks of the day.
Industry analysts at Wall Street firms providedmaintenance research on these holdings and sought touncover new opportunities that would add to investmentperformance. Acceptance of a new name onto the trustdepartments’ approved lists could create a torrent ofinstitutional commissions, particularly if this involved aswitch out of another holding. Gaining acceptance ofnew names for these lists was difficult. Final decisionswere made by an investment committee whose memberswere often veterans of the 1930s and 1940s. Committeemembers were typically comfortable with virtually allthe names on these lists including deep cyclicals such asAlcoa, Union Carbide, and US Steel, which had
-
127
Investment Philosophy: Evolution of the Core Equity Concept (cont.) Walter Maynard, Jr.
performed well in the 1950s and early 1960s. Theinfrastructure of the U.S. economy was growing rapidly.Smokestack companies were benefiting from majortechnological advances. Import competition had notbegun to limit pricing power. In time, committeemembers’ resistance to change was overcome, and agradual shift took place from well-known cyclical stocksto core holdings that were believed to offer consistent,fairly predictable growth.
IBM came to epitomize all the desirable characteristicsfor a core holding in the 1960s and 1970s. It became thesingle most essential stock to be bought and held in allthe bank trust departments and in the large internallymanaged pension funds that had come to dominate theinstitutional investment landscape. When IBM began tofalter and fell on hard times in the 1980s, the idea thatcertain stocks could be bought and held indefinitely wasdealt a severe blow.
A greater degree of investment flexibility was alsofacilitated by the decline in institutional brokeragecommission rates and the buildup of brokerage firms’institutional sales and trading departments, whichfacilitated, first, block trading and then program tradingof entire portfolios. A further shift took place in the mid-1980s and the 1990s, marked by the ascendance ofmutual funds as the dominant institutional investorgroup. Superior performance became necessary to attractinvestors, and portfolio turnover increased with littleregard to the associated tax consequences. Given thediversity of styles pursued by equity mutual fundmanagers, the core designation began to be applied to theleading stocks in an industry group, rather than to a listof stocks chosen for the portfolio as a whole. Forexample, Microsoft and Intel ascended to the first rankamong the must-own technology stocks. Merck andPfizer achieved similar prominence in thepharmaceutical sector.
On the eve of the twenty-first century, the investmentlandscape is again undergoing change. Indexation andthe quest for high-quality exposure to global marketshave enhanced the appeal of large capitalization U.S.equities. These stocks also offer liquidity and areperceived to have reduced volatility relatively and the
resources to weather adverse operating conditions. At thesame time, High Net Worth investors have come toappreciate the advantages of owning stocks in separateaccounts so as to avoid the tax consequences of highturnover and to control the overall level of assetmanagement expenses. An additional motivation hasbeen the wide publicity given to Warren Buffett’s long-term investment success, achieved through buying andholding Coca-Cola, Gillette, and other global brand-name companies. Buffett’s followers constitute agrowing constituency of separate account owners whobelieve in the concentration of their investments among agroup of core holdings.
Characteristics of Core Holdings
What are the chief characteristics of core holdings? Fortunemagazine’s annual listing of most admired companiesprovides some useful criteria: (i) innovativeness; (ii) qualityof management; (iii) employee talent; (iv) quality ofproduct/services; (v) long-term investment value; (vi)financial soundness; (vii) social responsibility; and (viii) useof corporate assets. The following table lists the overallwinners for 1997 and 1998:
Table 2: Fortune Magazine’s“Most Admired Companies”
Rank 1997 1998
1 General Electric General Electric2 Microsoft Coca-Cola3 Coca-Cola Microsoft4 Intel Dell5 Hewlett Packard Berkshire Hathaway6 Southwest Airlines Wal-Mart7 Berkshire Hathaway Southwest Airlines8 Disney Intel9 Johnson & Johnson Merck
10 Merck DisneySource: Fortune, March 2, 1998 and March 1, 1999.
What is interesting about these lists is that among Fortune’s10 “Most Admired Companies,” virtually all have largecapitalizations and apparently impressive records of growthin earnings per share. Yet the criteria for selection areprimarily subjective rather than objective. These samecriteria could be used to evaluate most established publiccompanies. The following paragraphs list some analytical
-
128
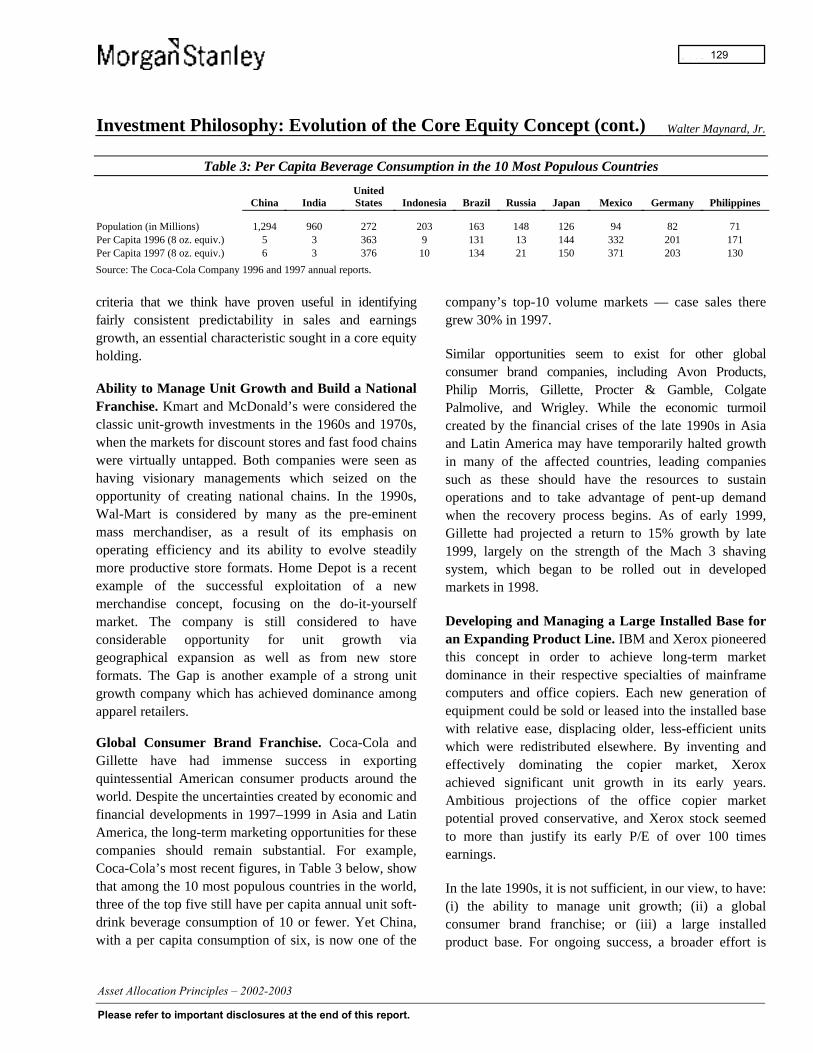
Investment Philosophy: Evolution of the Core Equity Concept (cont.) Walter Maynard, Jr.
Table 3: Per Capita Beverage Consumption in the 10 Most Populous Countries
China IndiaUnitedStates Indonesia Brazil Russia Japan Mexico Germany Philippines
Population (in Millions) 1,294 960 272 203 163 148 126 94 82 71Per Capita 1996 (8 oz. equiv.) 5 3 363 9 131 13 144 332 201 171Per Capita 1997 (8 oz. equiv.) 6 3 376 10 134 21 150 371 203 130
Source: The Coca-Cola Company 1996 and 1997 annual reports.
criteria that we think have proven useful in identifyingfairly consistent predictability in sales and earningsgrowth, an essential characteristic sought in a core equityholding.
Ability to Manage Unit Growth and Build a NationalFranchise. Kmart and McDonald’s were considered theclassic unit-growth investments in the 1960s and 1970s,when the markets for discount stores and fast food chainswere virtually untapped. Both companies were seen ashaving visionary managements which seized on theopportunity of creating national chains. In the 1990s,Wal-Mart is considered by many as the pre-eminentmass merchandiser, as a result of its emphasis onoperating efficiency and its ability to evolve steadilymore productive store formats. Home Depot is a recentexample of the successful exploitation of a newmerchandise concept, focusing on the do-it-yourselfmarket. The company is still considered to haveconsiderable opportunity for unit growth viageographical expansion as well as from new storeformats. The Gap is another example of a strong unitgrowth company which has achieved dominance amongapparel retailers.
Global Consumer Brand Franchise. Coca-Cola andGillette have had immense success in exportingquintessential American consumer products around theworld. Despite the uncertainties created by economic andfinancial developments in 1997–1999 in Asia and LatinAmerica, the long-term marketing opportunities for thesecompanies should remain substantial. For example,Coca-Cola’s most recent figures, in Table 3 below, showthat among the 10 most populous countries in the world,three of the top five still have per capita annual unit soft-drink beverage consumption of 10 or fewer. Yet China,with a per capita consumption of six, is now one of the
company’s top-10 volume markets — case sales theregrew 30% in 1997.
Similar opportunities seem to exist for other globalconsumer brand companies, including Avon Products,Philip Morris, Gillette, Procter & Gamble, ColgatePalmolive, and Wrigley. While the economic turmoilcreated by the financial crises of the late 1990s in Asiaand Latin America may have temporarily halted growthin many of the affected countries, leading companiessuch as these should have the resources to sustainoperations and to take advantage of pent-up demandwhen the recovery process begins. As of early 1999,Gillette had projected a return to 15% growth by late1999, largely on the strength of the Mach 3 shavingsystem, which began to be rolled out in developedmarkets in 1998.
Developing and Managing a Large Installed Base foran Expanding Product Line. IBM and Xerox pioneeredthis concept in order to achieve long-term marketdominance in their respective specialties of mainframecomputers and office copiers. Each new generation ofequipment could be sold or leased into the installed basewith relative ease, displacing older, less-efficient unitswhich were redistributed elsewhere. By inventing andeffectively dominating the copier market, Xeroxachieved significant unit growth in its early years.Ambitious projections of the office copier marketpotential proved conservative, and Xerox stock seemedto more than justify its early P/E of over 100 timesearnings.
In the late 1990s, it is not sufficient, in our view, to have:(i) the ability to manage unit growth; (ii) a globalconsumer brand franchise; or (iii) a large installedproduct base. For ongoing success, a broader effort is
-
129
Investment Philosophy: Evolution of the Core Equity Concept (cont.) Walter Maynard, Jr.
required, incorporating some or all of the followingcharacteristics.
An Enterprise Solution: Potential core investmentcompanies may demonstrate the ability to become asingle source for all of a large user’s needs by providingthe right combination of products and services for arange of applications throughout the company. Failure toanticipate and implement this strategy was consideredIBM’s mistake in the 1980s. IBM managementapparently underestimated the potential forminicomputers and PCs, while trying to preserve thecompany’s virtual monopoly on mainframe computers.Today both IBM and Xerox offer enterprise solutionsand consequently are once again viewed as coreholdings.
Excellence in Research: Research ingenuity,productivity, and cost effectiveness are consideredparticularly important for technology and pharmaceuticalcompanies. For example, Intel’s ability to design evermore powerful microprocessors, doubling inperformance every 18 months, has contributed to makingit the dominant supplier and mainspring of productivitygrowth for the PC industry. It can be said thatMicrosoft’s enterprise software solution strategy is reallya process of research, development, and testing withminimal manufacturing expense. Intel’s faster processingspeeds would seem of little commercial value were it notfor Microsoft’s commensurately more productivesoftware. Microsoft Windows NT 2000 software fornetworks and servers represents the most recent exampleof the company’s migration into steadily morecomprehensive and powerful applications, and the mostlikely source of the company’s next phase of revenueand profitability growth.
For quite some time, Merck has been among the researchleaders in the pharmaceutical industry, and notcoincidentally, one of the largest and most successfulU.S. drug companies. Pfizer’s recent revenue andearnings growth has also derived from a prolific researchprogram which has produced a series of very successfuldrugs. While drug research tends to be precisely targeted,a large enough budget can produce fortuitous results.
Pfizer’s Viagra was a by-product of human testing for acardiac drug. Minnesota Mining’s Post-it family ofproducts is a second example of a hugely successfulbrand emanating by accident from a world-class researcheffort.
Capacity for Self-Regeneration: Superior-qualitycompanies typically have the resources and stayingpower to right themselves and correct their mistakes. Forexample, in the late 1990s, Coca-Cola and Disney haveencountered periods of slower earnings growth, but bothare expected to rise to the challenge of regainingmomentum. Often, the key ingredient is a visionaryleader who is able to re-focus the company. GeneralElectric could have stagnated had not Jack Welch seenthe potential for GE Capital to become a significantengine of growth. IBM successfully emerged from aperiod of adversity and reached new levels of strongperformance under the guidance of Lou Gerstner. Thesame results were generated at American Express underHarvey Golub. These latter two individuals areconsidered to have exceptional organizational andmarketing skills developed in prior managementconsulting careers.
Timing of Core Purchases
Core stock relative valuations are almost always high. Itis important therefore for investors to anticipate positivechanges in company prospects well in advance. Specificexamples in one manager’s experience relate to thetiming of initial positions in Microsoft and Pfizer.
It was widely known in the fall of 1993 that Microsofthad in development a major Windows operating systemupgrade which would greatly enhance PC speed and easeof use. A PC with an Intel Pentium processor andWindows 95 operating software would likely havehighly attractive price-performance characteristics. As ithappened, the Windows 95 introduction wasconsiderably delayed, and Microsoft’s stock price in late1993 had already gone nowhere for almost two years.Since the initial purchases in late 1993, Microsoft’sstrong stock price performance through early 1999 wasdriven by powerful trends in PC demand, networkingand emerging commerce on the Internet.
The Pfizer purchase decision early in 1990 resulted froma tragic circumstance at the time: a series of structural
-
130
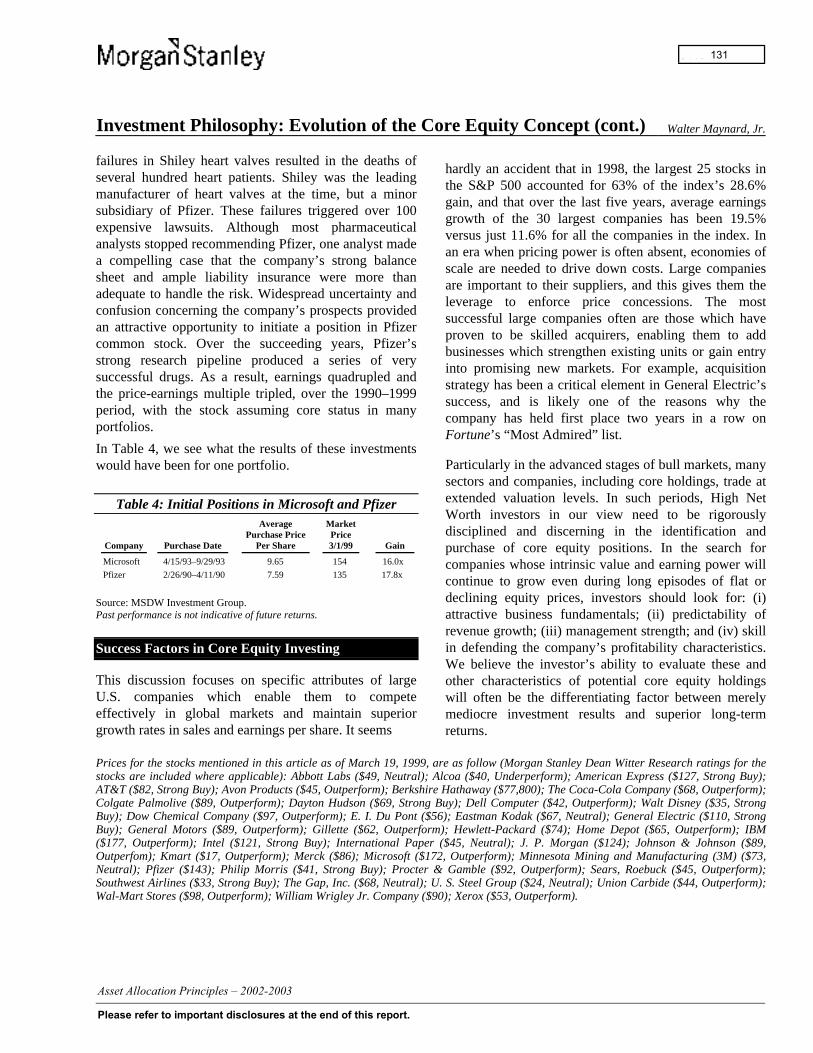
Investment Philosophy: Evolution of the Core Equity Concept (cont.) Walter Maynard, Jr.
failures in Shiley heart valves resulted in the deaths ofseveral hundred heart patients. Shiley was the leadingmanufacturer of heart valves at the time, but a minorsubsidiary of Pfizer. These failures triggered over 100expensive lawsuits. Although most pharmaceuticalanalysts stopped recommending Pfizer, one analyst madea compelling case that the company’s strong balancesheet and ample liability insurance were more thanadequate to handle the risk. Widespread uncertainty andconfusion concerning the company’s prospects providedan attractive opportunity to initiate a position in Pfizercommon stock. Over the succeeding years, Pfizer’sstrong research pipeline produced a series of verysuccessful drugs. As a result, earnings quadrupled andthe price-earnings multiple tripled, over the 1990–1999period, with the stock assuming core status in manyportfolios.
In Table 4, we see what the results of these investmentswould have been for one portfolio.
Table 4: Initial Positions in Microsoft and Pfizer
Company Purchase Date
AveragePurchase Price
Per Share
MarketPrice3/1/99 Gain
Microsoft 4/15/93–9/29/93 9.65 154 16.0x
Pfizer 2/26/90–4/11/90 7.59 135 17.8x
Source: MSDW Investment Group.Past performance is not indicative of future returns.
Success Factors in Core Equity Investing
This discussion focuses on specific attributes of largeU.S. companies which enable them to competeeffectively in global markets and maintain superiorgrowth rates in sales and earnings per share. It seems
hardly an accident that in 1998, the largest 25 stocks inthe S&P 500 accounted for 63% of the index’s 28.6%gain, and that over the last five years, average earningsgrowth of the 30 largest companies has been 19.5%versus just 11.6% for all the companies in the index. Inan era when pricing power is often absent, economies ofscale are needed to drive down costs. Large companiesare important to their suppliers, and this gives them theleverage to enforce price concessions. The mostsuccessful large companies often are those which haveproven to be skilled acquirers, enabling them to addbusinesses which strengthen existing units or gain entryinto promising new markets. For example, acquisitionstrategy has been a critical element in General Electric’ssuccess, and is likely one of the reasons why thecompany has held first place two years in a row onFortune’s “Most Admired” list.
Particularly in the advanced stages of bull markets, manysectors and companies, including core holdings, trade atextended valuation levels. In such periods, High NetWorth investors in our view need to be rigorouslydisciplined and discerning in the identification andpurchase of core equity positions. In the search forcompanies whose intrinsic value and earning power willcontinue to grow even during long episodes of flat ordeclining equity prices, investors should look for: (i)attractive business fundamentals; (ii) predictability ofrevenue growth; (iii) management strength; and (iv) skillin defending the company’s profitability characteristics.We believe the investor’s ability to evaluate these andother characteristics of potential core equity holdingswill often be the differentiating factor between merelymediocre investment results and superior long-termreturns.
Prices for the stocks mentioned in this article as of March 19, 1999, are as follow (Morgan Stanley Dean Witter Research ratings for thestocks are included where applicable): Abbott Labs ($49, Neutral); Alcoa ($40, Underperform); American Express ($127, Strong Buy);AT&T ($82, Strong Buy); Avon Products ($45, Outperform); Berkshire Hathaway ($77,800); The Coca-Cola Company ($68, Outperform);Colgate Palmolive ($89, Outperform); Dayton Hudson ($69, Strong Buy); Dell Computer ($42, Outperform); Walt Disney ($35, StrongBuy); Dow Chemical Company ($97, Outperform); E. I. Du Pont ($56); Eastman Kodak ($67, Neutral); General Electric ($110, StrongBuy); General Motors ($89, Outperform); Gillette ($62, Outperform); Hewlett-Packard ($74); Home Depot ($65, Outperform); IBM($177, Outperform); Intel ($121, Strong Buy); International Paper ($45, Neutral); J. P. Morgan ($124); Johnson & Johnson ($89,Outperfom); Kmart ($17, Outperform); Merck ($86); Microsoft ($172, Outperform); Minnesota Mining and Manufacturing (3M) ($73,Neutral); Pfizer ($143); Philip Morris ($41, Strong Buy); Procter & Gamble ($92, Outperform); Sears, Roebuck ($45, Outperform);Southwest Airlines ($33, Strong Buy); The Gap, Inc. ($68, Neutral); U. S. Steel Group ($24, Neutral); Union Carbide ($44, Outperform);Wal-Mart Stores ($98, Outperform); William Wrigley Jr. Company ($90); Xerox ($53, Outperform).
-
131
Investment Philosophy: Tax-Efficient Separate Account Management Jesse L. Carroll, Jr.
Paying taxes is one of life’s certainties. But for thetaxable investor, how much he or she pays can varywidely depending on the tax efficiency of his or herportfolio. Just as importantly, the after-tax return on aportfolio, not the pre-tax return, will determine theamount of wealth buildup the taxable investor achievesover his or her lifetime.
Tax-efficient investment management has its roots inlegislative developments that have occurred over the last30 years. After the Dow Jones Industrial Averageplummeted from the 1,000 mark in 1973 to below 600 in1974, IRAs were introduced. Two years later, the TaxReform Act of 1976 was passed, resulting in theintroduction of open-end municipal bond funds andvariable life programs. Tax law revision in 1978 created401(K) plans. Tax-exempt money market funds wereunveiled in 1979. In 1982, universal IRAs were rolledout. The Tax Reform Act of 1986 reduced IRAdeductibility. Finally, as a result of the Taxpayer ReliefAct of 1997, Roth, Education, and conventional IRAswere ushered in along with lower capital gains rates andschedules.1
As important as these legislative developments were,they dealt for the most part with providing mechanismsto defer pre-tax income for investment in accounts thatwere not subject to tax until the funds are withdrawn,typically at retirement. The mutual fund industry hasbenefited handsomely from these developments, as it isestimated that more than half of the entire mutual fundindustry’s assets today are made up of some type of tax-deferred account. But what about the financial assets thetaxable investor cannot shield from taxes? How does heor she approach the problem of investing to achieve themost attractive after-tax rate of return on funds that areearmarked for long-term capital appreciation? Tax-efficient separate account management may be onesolution to this dilemma.
As an illustration of the effect of taxes on portfolio returns,assume three different hypothetical portfolios, Portfolio A,Portfolio B and Portfolio C. After 12 months, each 1 Strategic Insight Overview, October 1998.
portfolio returned 12% pre-tax on a $1,000,000investment. All three investors are in the 39.6% Federaltax bracket (state taxes are not included). Each investorassumed that he or she had posted an attractive 12% returnfor the year. But after analyzing the derivation of therespective 12% returns, a totally different conclusion isdrawn: Portfolios B and C fared much better than PortfolioA, in fact, 31.9% and 44.3% better, respectively. Why?The tax-efficiency of Portfolios B and C compared toPortfolio A.
Calculated Portfolio Returns
Portfolio A Portfolio B Portfolio C% $ % $ % $
Dividends 3.0 30,000 2.0 20,000 1.0 10,000Short-Term Gains 7.0 70,000 0.0 0 0.0 0Long-Term Gains 0.0 0 3.0 30,000 0.0 0Unrealized Gains 2.0 20,000 7.0 70,000 11.0 110,000Pre-Tax Return 12.0 120,000 12.0 120,000 12.0 120,000
Portfolio A Portfolio B Portfolio C% $ % $ % $
Taxes OwedDividends at 39.6% 11,880 7,920 3,960Short-Term Gains at 39.6% 27,720 0 0Long-Term Gains at 20.0% 0 6,000 0Total Taxes Due 39,600 13,920 3,960After-Tax Return 8.0% 80,400 10.6% 106,080 11.6% 116,040Tax Efficiency Ratio 67.0 88.4 96.7
Source: Portfolio Management Consultants, Inc.
In evaluating the preceding table, the ratio of the threeportfolios’ after-tax returns to their pre-tax returns, theportfolio’s tax-efficiency ratio, is the key measure.Portfolio A, with a pre-tax return of 12.0% and an after-tax return of 8.0%, can be described as 67.0% taxefficient. Similarly, the tax-efficiency of Portfolios B andC is 88.4% and 96.7%, respectively. The determinant ofa portfolio’s tax-efficiency is the composition of thereturn on investment from the various sources of returns.The greater the contribution to total return from the mosttax-favored sources of returns, the more tax efficient theportfolio.
-
132

Investment Philosophy: Tax-Efficient Separate Account Management (cont.) Jesse L. Carroll, Jr.
Tax-efficient separate account managers pursue highafter-tax returns by endeavoring to balance investmentconsiderations with tax consequences. The investmentdecision should always dominate, but investmentdecisions are never made without taking taxramifications into account. The goal of the tax-efficientseparate account manager is not to avoid taxesaltogether, but rather to maximize the after-tax return fora portfolio over the long term.
Before turning to the techniques and strategies employedby tax-efficient separate account managers, it isworthwhile to consider the benefits of a tax-efficientseparate account management strategy over a long timehorizon. Referring to the pre-tax and after-tax returns ofhypothetical Portfolios A, B and C, the following graphdemonstrates the benefits from the deferral of taxpayments compounded over 20 years.
Growth of $1,000,000 at 12% Pre-TaxUnder Different Tax-Efficient Ratios
$0
$2
$4
$6
$8
$10
$12
0 1 2 3 4 5 6 7 8 9 10 11 12 13 14 15 16 17 18 19 20
PortfolioAfter-tax
return (%)Tax Efficient
Ratio (%)Value After 20Years ($mm)
Portfolio A 8.0% 66.7% $4.66Portfolio B 10.6% 88.4% $7.50Portfolio C 11.6% 96.7% $8.9812% return 12.0% 100.0% $9.65
Millions
Years
Source: MSDW Investment Group.
An analysis of the preceding graph shows the substantialdifferences in wealth buildup between Portfolios A, Band C. The tax efficiency of Portfolios B and C led to a59.7% and 91.4% greater accumulation of capital thanthe relatively tax inefficient Portfolio A.
What criteria should the taxable investor use to evaluate atax-efficient separate account manager? First and
Tax-Efficient Separate Account ManagementStrategies and Techniques
Does the manager:
• Manage with a long-term investment time horizon and a buy-and-hold orientation?
Comment: By focusing on long-term investments, ratherthan those offering mostly near-term payoffs, the realizationof capital gains is deferred and, possibly, avoided.
• Minimize capital-gain-producing turnover?
Comment: Significantly reducing portfolio turnover thatresults in realized capital gains is the most effective way toimprove after-tax returns and is considered the cornerstoneof tax-efficient investing.
• Minimize income and dividends?
Comment: Minimizing income and dividends receivedfurther reduces the effect of taxes since they are taxed at ahigher ordinary income tax rate.
• Harvest unrealized short-term losses to reduce the tax impactof realized long-term gains?
Comment: Harvesting capital losses allows the portfoliomanager to offset realized capital gains and/or to build acushion for offsetting future capital gains.
• Utilize tax lot accounting technology?
Comment: Selling securities with the highest cost basis(HIFO) minimizes capital gains realization.
• Use leverage for cash withdrawals?
Comment: When the sale of securities with a low cost basisis undesirable from a tax standpoint, borrowing may be anattractive means of sourcing cash.
• Contribute winners that outgrow the portfolio in which theyoriginated (because the increased weight exceeds themanager’s comfort level) to an exchange fund, charitableremainder trust, private foundation, or charitable institution?
Comment: Compared to a taxable sale of an appreciatedasset, a contribution to a charitable remainder trust mayincrease the return from the asset to the donor (and thecharity, of course) through tax-free compounding. Similarly,contributing appreciated securities to an exchange fundallows the taxable investor to diversify into a broad portfolioof U.S. equities and other non-marketable assets withoutengaging in a taxable sale.
foremost is investment performance; the most tax-efficientstrategies are meaningless if the separate accountmanager’s pre-tax returns are not competitive. Second,assuming the taxable investor finds the prospective
-
133
Investment Philosophy: Tax-Efficient Separate Account Management (cont.) Jesse L. Carroll, Jr.
organization’s investment philosophy, investment process,and investment professionals impressive, he or she wouldbe well advised to look for the strategies and techniquesshown in the accompanying box. They provide a checklistby which a tax-efficient separate account manger can beevaluated.2
Most of the articles written about tax-efficient investingzero in on a manager’s turnover rate as the most criticaldeterminant of tax efficiency. While the turnover rate isimportant, the taxable investor should understand that alow turnover rate per se does not guarantee taxefficiency. The authors of the article entitled, “Tax-Aware Equity Investing: Active Management of TaxablePortfolios Is Challenging But Not Impossible” make thefollowing observations:
In response to the challenges posed by taxes, manymanagers seek to reduce or minimize portfolioturnover. In our view, this strategy makes no sensebecause there is not both “good” and “bad”turnover. Even at low levels, turnover is bad if amanager mindlessly realizes gains and incurs taxliabilities without substantially increasing theportfolio’s expected excess return. By contrast, evenat high levels, turnover can be good if realized gainsare offset by realized losses and/or a sufficientincrease in the expected excess return. By balancingrealized gains and realized losses, the tax-efficientseparate account manager defers net realized capitalgains and the immediate payment of taxes. Therebalancing facilitated by the use of realized lossesallows the manager to sell overvalued positions andreinvest in securities with higher expected returns.3
In other words, what the tax-efficient separate accountmanager needs to control is not his or her turnover but,as one writer labels it, his or her “gains realization rate.”4
2 Jesse L. Carroll, Jr., “Investment Manager Selection Criteria,” Asset
Allocation Principles, Second Half 1999.3 Roberto Apelfeld, Gordon B. Fowler, Jr., and James P. Gordon, Jr., “Tax-
Aware Equity Investing: Active Management of Taxable Portfolios IsChallenging But Not Impossible,” The Journal of Portfolio Management(Winter 1996).
4 James P. Garland, “The Attraction of Tax-Managed Index Funds,” TheJournal of Investing (Spring 1997).
Just as the importance of turnover is overstated in themanagement of taxable portfolios, the significance ofbuilding up unrealized gains is underrated. Unrealizedgains represent that portion of the taxable investor’sportfolio appreciation that has not been converted intocash for reinvestment elsewhere. The longer the gains inthe taxable investor’s portfolio remain unrealized, themore valuable they become because, as in the case withIRAs, compounding occurs on a pre-tax basis. A tax-efficient strategy that emphasizes the deferral of realizedgains can lead to not only superior after-tax returns butalso tax avoidance since, under present law in the case ofindividuals, the deferred tax liability is forgiven atdeath.5
In the taxable investing game, what matters most isthe interrelationship between the taxable investor’spre-tax return and the tax efficiency of that return.Some have described taxable investing as a “loser’sgame.” Those taxable investors who utilize a tax-efficient strategy stand to lose the least to taxes and“win the most when the game’s all over.”6
5 Robert H. Jeffrey and Robert D. Arnott, “Is Your Alpha Big Enough to
Cover Its Taxes,” The Journal of Portfolio Management (Spring 1993).6 Garland, op. cit.
-
134

Investment Philosophy:The Interplay of Fear, Greed, and Rationality in Equity Investing John M. Snyder
It is useful to consider management of the tensionsexisting between emotion and rationality in equityinvesting because the implications for performanceappear material. We propose the idea that equityinvestors swing continually between the emotions ofgreed and fear.
Implicit in the greed/fear cliché is the acknowledgmentthat there can exist a suspension of rationality andcommon sense, traits that normally provide someintervening governance. What lies behind this temporarymadness to which many investors are susceptible? Let usconsider the relative significance of fear, greed, andrationality.
It is to fear, a potent emotion, that we assign the highestweight in relative significance. Fear causes a vessel thatis half full to suddenly appear half empty, a particularlyunpleasant shift when the perception applies to one’sinvestment portfolio. Fear is a primal emotion groundedin the universal comprehension of life’s uncertainty. Fewof us fail to wince at Julius Caesar’s famous lines:
“Cowards die many times before their deaths; thevaliant never taste of death but once.”
Fear can be pushed aside, but it sleeps lightly. When it isawakened, the investor’s mood can turn quickly to panicand an immediate urge to run for cover, i.e., to lighten upor sell out without too much regard for the ongoing valueof the assets being disposed.
“Neath the sun’s rays our shadow is our comrade;When clouds obscure the sun our shadow flees.So Fortune’s smiles the fickle crowd pursues,But swift is gone whene’er she veils her face.”
Ovid, Tristia, I.9,11
Greed, on the other hand, though one of the seven deadlysins (covetousness, in Biblical terms), can becomfortably agreeable when things are going one’s way.In market terms, this is when prices are rising, nounpleasantness is on the horizon, and all glasses are seento be at least half full. The investment conclusion is often
to toss caution to the winds and to buy with noapprehension regarding the valuation of the purchase.
Rationality is generally perceived to be an importantarbiter between greed and fear. Great lip service is paidto reason and common sense, but they lack the visceralintensity of the passions they are supposed to control,and are sometimes no more effective than shouting“Stop!” at a runaway horse. Thus, our expressedweighting of rationality is, more often than not, at oddswith our actions, and reason’s contribution to theinvestment process is muted.
In addition to its usefulness in tempering opposingemotions, reason provides the tools for valuing equitiesby weighing the underlying fundamentals of acompany’s business, its past performance, and, to anextent, the probability of its future course.
Long-Term Investing, the Principal Casualty
A deep paradox has long existed in equity investing.Numerous studies have shown that long-term exposureto the equity markets provides superior relative returnsbecause market moves come at unpredictable intervals(Please see Exhibit 1). One would expect that this well-known fact would result in long-term equity investingbeing the most popular strategy. That this has not beenthe case is worthy of consideration.
Exhibit 1: Value of $100 Invested in theS&P 500 Index from 1981 – 1999
Continually invested $1,082Missed 10 best days 665Missed 20 best days 477Missed 30 best days 357Missed 40 best days 273
Source: Morgan Stanley Dean Witter Equity Research.
Why have so few individual investors been able topursue what appears to be the most rational strategy?Could it be that the emotions of greed and fear regularlyoverwhelm rational judgment and precipitate moves inand out of the market at precisely the most inopportunetimes?
-
135
Investment Philosophy:The Interplay of Fear, Greed, and Rationality in Equity Investing (cont.) John M. Snyder
Indexing as Forced Long-Term Investing
It has not gone unnoticed that index investing,particularly in the form of the S&P 500 index funds thatcame into full flower in the mid to late 1990s, hasoutperformed four-fifths or more of actively managedequity mutual funds over this period. Consider thepossibility that a key element in S&P index performancemight be attributed to the long-term nature of indexinvesting, i.e., that component companies are notchanged unless they are either removed from or added tothe index. Average S&P 500 turnover, by virtue of this“charter” provision, has been approximately 5% per yearfrom 1981 through 1998, although in the 1995–1999period, nearly 180 companies were replaced in the S&P500 index.
It is worth considering whether some meaningfulcomponent of the superior performance of the S&P 500index should be attributed to the low turnover, long-termtime element intrinsic to the concept.
Combining the Intrinsic Time Discipline of Indexingwith the Science of Intelligent Stock Selection
If a significant proportion of the performance of indexfunds can be attributed to the long holding period andminimal turnover intrinsic to their investment strategy,this may point the way to a superior investment approachfor discerning and disciplined investors.
It is broadly accepted that the human emotionsassociated with equity investing are strong and difficultto govern. It has also been demonstrated that indexinvesting, by definition, enforces some degree of long-term discipline that helps contain and control theseemotions.
It may be asked whether an intelligent investor cancreate, at appropriate valuations, a portfolio ofcompanies having a true competitive edge in theirindustries by virtue of superior product, franchise, and
management, thus establishing a reasonable chance ofoutperforming a mechanically selected index.
The chances of such an outcome might be increased byadhering to a long-term discipline as if the rationallychosen portfolio were governed by an index-like“charter” that specified that no changes would be madeunless there were material changes in the prospects ofthe individual holdings.
Such is the course that has been followed by the handfulof this century’s great investors, including WarrenBuffett, Philip Fisher, Philip Carret, and many of theinvestment disciples of Benjamin Graham. Theseindividuals seem to have transcended the greed/fearsyndrome and generated high and tax-efficient returns onintelligently selected stocks held for long periods oftime.
We think it is well within the capability of the High NetWorth investor, with access to superior research andastute guidance, to adopt a similar rational approach toequity investing. We see no reason that the individualinvestor should be left with sub-par performance byemotional and visceral reactions that can be channeled tomore productive ends. It seems a mechanical indexshould not be able to outperform intelligent selection justbecause it is intrinsically long-term in nature.
In our view, the investor should allocate to risk-freefixed income investments — if possible within a tax-advantaged ownership structure — his or her insuranceagainst catastrophic events, and give well-chosenequities sufficient time to prosper.
“Perceive at last that thou hast in thee somethingbetter and more divine than the things which causethe various effects, and, as it were, pull thee by thestrings.”
The Meditations of Marcus Aurelius, Book XI, 19.
-
136

Investment Philosophy: S&P 500 Industry Sector Composition Lily Rafii
The S&P 500 index, one of the most widely usedbenchmarks of U.S. equity performance, consists of 500stocks chosen for market size, liquidity, and industrygroup representation. Since its inception in 1957, theindex has undergone a dramatic change in composition.The scope and nature of the change, however, have beenmost evident over the 1995–1999 time frame astechnology companies have become the largest industrycomponent of the composite index.
During the 1980s and 1990s as a whole, the S&P 500index was characterized by two major changes, atransition from a heavy index concentration in energycompanies to a concentration in technology companies,and an increasingly stronger index in terms ofprofitability. The fact that technology companies nowdominate the index as a whole can be attributed toseveral factors.
First, technology has played an increasingly large role inthe economy and financial markets as a result of greaterpenetration of technology-related products and servicesand the market’s assessment of the future prospects forthe companies that provide them.
Second, the profitability of established technologycompanies is high. For instance, AOL earnings were up440% in 1998 and an average of 513% from 1997through 1999. Its one-year shareholder return of 486%beat all the 499 remaining companies in the index, andits three-year total return is 1,348%.1 Morgan StanleyDean Witter strategist Leah Modigliani has noted thatwithout technology stocks, the S&P’s total return for1999 would have been only 7.5% versus 21.0% withtechnology’s contribution.2
Third, valuations for technology companies are high andmarket values are large. Because the S&P 500 isweighted according to market value, each stock isrepresented in proportion to its total value, or marketcapitalization. As a result, the more a given stock gains,
1 Business Week, March 29, 1999.2 Morgan Stanley Dean Witter, U.S. Investment Perspectives, January 5,
2000.
the greater its share in the S&P. This allows rising stockssuch as Microsoft to take up an expanding proportion ofthe index.
It can be seen from Exhibit 1 that over the last 20 years,there has been a notable decline in the energy sector’sproportion of the S&P 500 index, from 27% to 6%, and asignificant rise in the proportion of technology, from10% in 1980 to 30% in 1999. In effect, technology hasdisplaced energy in the index as the most influentialsector.
Exhibit 1: S&P 500 Industry Sector Composition
1980 1986 1990 1994 1997 1998 1999
Basic Materials 8% 7% 7% 7% 5% 3% 3%Capital Goods 11 11 10 10 9 8 8Communication Services 6 8 9 9 6 8 8Consumer Cyclicals 10 14 11 12 9 9 9Consumer Staples 8 12 17 16 16 15 11Energy 27 12 13 10 8 6 6Financials 5 10 8 11 17 16 13Health Care 6 7 10 9 11 12 9Technology 10 9 7 10 13 19 30Transportation 2 2 1 1 1 1 1Utilities 6 8 7 5 3 3 2
Source: Donaldson, Lufkin & Jenrette; 1998 and 1999 data are fromMorgan Stanley Dean Witter Equity Research.
It is interesting to note that just as technology hasdominated business headlines in the late 1990s, themarket focused on energy issues in the late 1970s andearly 1980s. Twenty years ago, the market was fixatedon oil prices as a result of OPEC actions and politicalinstability in some large oil-producing countries; thegiant oil companies were the financial market’s chiefvehicle for responding to these conditions. Today,technology and the Internet make headlines daily and, toa certain extent, the market appears to believe thateconomic destiny lies in the hands of the technologycompanies. E-commerce has grown over 460% in oneyear, from $235 million at the end of the third quarter of1998 to $1.1 billion at the same time in 1999.3
Advertising by Internet companies grew by 291% to $1.4billion through the first nine months of 1999.4
3 ING Barings Research, December 19, 1999.4 Competitive Media Reporting.
-
137
Investment Philosophy: S&P 500 Industry Sector Composition (cont.) Lily Rafii
Exhibit 2 illustrates the shift of leadership in the S&P byshowing the top 10 companies which comprised theindex on December 31, 1980, and on December 31,1999.
Exhibit 2: Comparative Leadership within S&P 500(1980 – 1999)
December 31, 1999 Market Value % of Cum. %
Company Rank $ Millions Index of Index
Microsoft Corp 1 604,078 4.92 4.92General Electric 2 507,734 4.14 9.06Cisco Systems 3 366,481 2.99 12.04Wal-Mart Stores 4 307,843 2.51 14.55Exxon Mobil 5 278,218 2.27 16.82Intel Corp 6 274,998 2.24 19.06Lucent Technologies 7 234,982 1.91 20.97Int’l Bus. Machines 8 194,447 1.58 22.55Citigroup 9 187,734 1.53 24.08America Online 10 169,606 1.38 25.47Top 10 Total Market Cap. $3,126,121
December 31, 1980 Market Value % of Cum. %
Company Rank $ Millions Index of Index
Int’l Bus. Machines 1 39,604 4.27 4.27American Tel. & Tel. 2 35,676 3.85 8.12Exxon Corp 3 34,856 3.76 11.87Standard Oil 4 23,365 2.52 14.39Schlumberger, Ltd. 5 22,331 2.41 16.80Shell Oil 6 17,990 1.94 18.74Mobil Corp 7 17,163 1.85 20.59Standard Oil of Cal. 8 17,020 1.84 22.42Atlantic Richfield 9 15,030 1.62 24.04General Electric 10 13,883 1.50 25.54Top 10 Total Market Cap. $236,918
Source: Standard & Poor’s Quantitative Services Group;www.spglobal.com.
Past performance is not a guarantee of future results.
Of the top 10 stocks in the S&P today, six aretechnology companies. In 1980, seven of the top 10companies in the index were oil companies. Notably, the
only energy company that remains in the top 10presently is Exxon.5 In 1980, IBM was the onlytechnology company on the list. Microsoft has been ontop of the list since 1998; before then, it made its firstappearance in the “top 10” in 1995 as the firsttechnology company to appear on the list after IBM.Only over the last four years has technology had asubstantial presence on the list. The index is verysensitive to the performance of these massive companies,with the 10 largest stocks in the index today drivingabout 25% of index performance. The proportion of thetotal index represented by the top 10 names has remainedremarkably stable over the last 20 years, even in light ofthe striking difference in market values.
The price momentum of technology companies on thelist is clear, as five out of the six technology companieson the list outperformed the S&P overall, and thus theaverage S&P company. In 1999, Cisco Systems,America Online, Microsoft, Intel, Lucent, andInternational Business Machines increased by 131%,96%, 68%, 39%, 36%, and 17%, respectively,6 while theS&P increased by about 21% in total return terms (priceappreciation plus dividends). The 5-year annualized S&P500 return is 29%, the 10-year annualized return is 18%,and the 20-year annualized return is about 17%, whichpartially reflects technology companies’ improvingprofitability in recent years.7 Exhibit 3 indicates thattechnology was not only the best performing sector year-to-date in 1999 and year-over-year, but also that itaccounted for almost half of the composite’s year-over-year return and more than the entire market return year-to-date. Microsoft alone accounted for over 10% of theS&P’s performance.8
5 Exxon and Mobil completed a merger on November 30, 1999.6 Trailing 12 months, from December 31, 1998 to December 31, 1999.7 Standard & Poor’s Research and Bloomberg L.P.8 Leah Modigliani, Morgan Stanley Dean Witter, U.S. Investment
Perspectives, January 5, 2000.
-
138
Investment Philosophy: S&P 500 Industry Sector Composition (cont.) Lily Rafii
Exhibit 3: S&P 500 Sector Total Return Performance
RelativePerformance
Contribution toS&P 500
Performance
Rank y-t-d y-o-y y-t-d y-o-y
Basic Materials 8% -13% 7% 2%Capital Goods 11 11 24 11Communication Services 3 11 12 11Consumer Cyclicals -4 6 3 11Consumer Staples -18 -21 -36 4Energy 12 -9 20 5Financials -10 -11 -13 9Health Care -16 -25 -24 1Technology 25 47 110 47Transportation -16 -26 -2 0Utilities -9 -29 -2 0
S&P 500 5 28 100 100
Data are as of September 30, 1999.
Source: Lehman Brothers U.S. Equity Performance Attribution Quarterly.
Past performance is not a guarantee of future results.
The S&P 500 reflects a representative sample of leadingcompanies in leading industries. While the U.S.technology sector has demonstrated innovation, sales andprofit growth, and stock market performance, there hasbeen discussion that the rate at which technologycompanies have been added to the index may indicateS&P’s bias toward companies that outperform. MorganStanley Dean Witter strategist Peter Canelo has writtenthat the new S&P 500 represents the best of U.S.corporations, “a younger, stronger index” with a definitebias toward profitability and the result is “changing thetrajectory of earnings growth for the index to doubledigits.” H. Vernon Winters, Chief Investment Officer at
Mellon Private Capital Management, says “when [theS&P] chooses new companies, they pick better, moresuccessful companies, and that gives the index more of agrowth orientation.”9
Fast-growing technology companies, such as Yahoo!,were added to the index in 1999;10 for 1999 as a wholeten technology companies were added, out of 42 totalchanges, displacing companies such as RJR Nabisco,Browning-Ferris, and Rubbermaid. Peter Canelo hasindicated that since 1995, there have been nearly 180changes in the index and only 330 of the companies thatwere on the list then, remain now. Never in the history ofthe S&P 500 have there been more alterations.11
A technology-heavy S&P 500 index also impliesincreased volatility. Technology stocks tend to be morevolatile, and can contribute to sharp swings in themarket. For instance, the S&P 500 lost 2.1% of its valuein one day when Intel reported earnings below analysts’expectations for the third quarter.12 The inclusion oftechnology companies in the S&P 500 is seen asrepresenting the growing perception of the Internet-centric future of many businesses. Their inclusion mayindeed make the S&P 500 more reflective of the overalleconomy and financial environment. However, as aresult, the index may be susceptible to the greatervolatility that characterizes the prices of technologycompanies upon which the market’s high expectationsfor the future depend.
9 Business Week, March 24, 1997.10 Yahoo was added in on December 7, 1999.11 MSDW U.S. Investment Perspectives, January 20, 2000.12 Business Week, October 25, 1999.
-
139
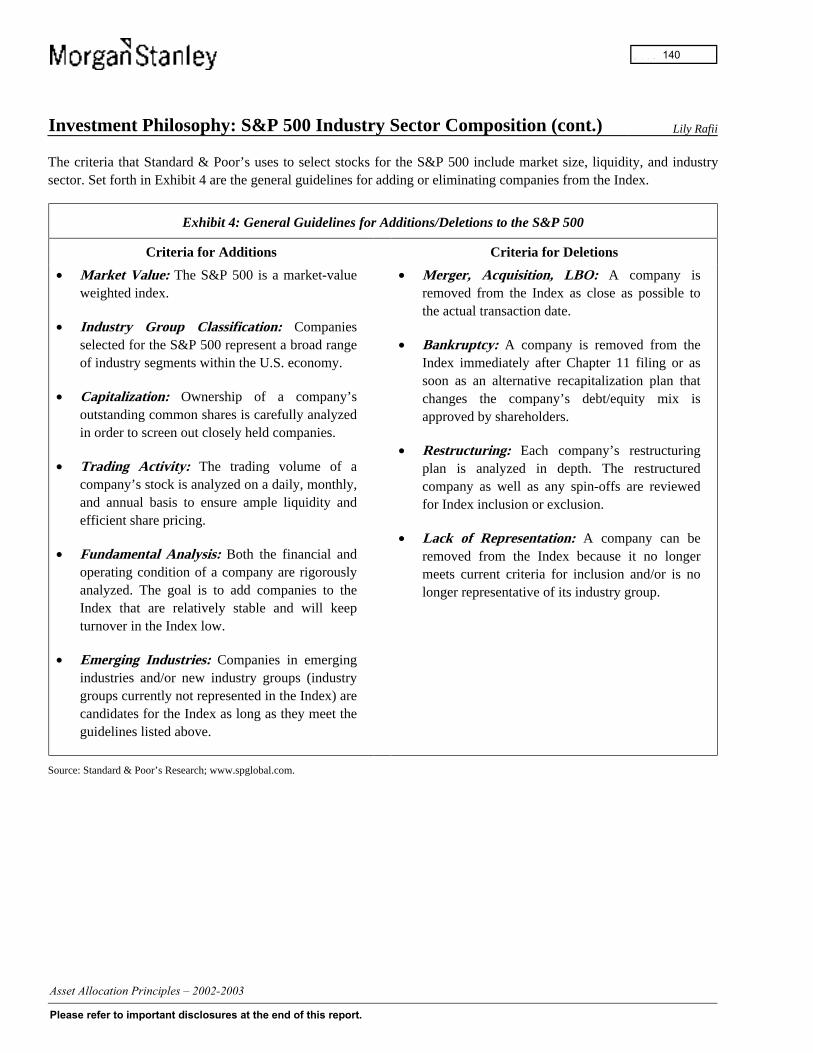
Investment Philosophy: S&P 500 Industry Sector Composition (cont.) Lily Rafii
The criteria that Standard & Poor’s uses to select stocks for the S&P 500 include market size, liquidity, and industrysector. Set forth in Exhibit 4 are the general guidelines for adding or eliminating companies from the Index.
Exhibit 4: General Guidelines for Additions/Deletions to the S&P 500
Criteria for Additions Criteria for Deletions
• Market Value: The S&P 500 is a market-valueweighted index.
• Industry Group Classification: Companiesselected for the S&P 500 represent a broad rangeof industry segments within the U.S. economy.
• Capitalization: Ownership of a company’soutstanding common shares is carefully analyzedin order to screen out closely held companies.
• Trading Activity: The trading volume of acompany’s stock is analyzed on a daily, monthly,and annual basis to ensure ample liquidity andefficient share pricing.
• Fundamental Analysis: Both the financial andoperating condition of a company are rigorouslyanalyzed. The goal is to add companies to theIndex that are relatively stable and will keepturnover in the Index low.
• Emerging Industries: Companies in emergingindustries and/or new industry groups (industrygroups currently not represented in the Index) arecandidates for the Index as long as they meet theguidelines listed above.
• Merger, Acquisition, LBO: A company isremoved from the Index as close as possible tothe actual transaction date.
• Bankruptcy: A company is removed from theIndex immediately after Chapter 11 filing or assoon as an alternative recapitalization plan thatchanges the company’s debt/equity mix isapproved by shareholders.
• Restructuring: Each company’s restructuringplan is analyzed in depth. The restructuredcompany as well as any spin-offs are reviewedfor Index inclusion or exclusion.
• Lack of Representation: A company can beremoved from the Index because it no longermeets current criteria for inclusion and/or is nolonger representative of its industry group.
Source: Standard & Poor’s Research; www.spglobal.com.
-
140
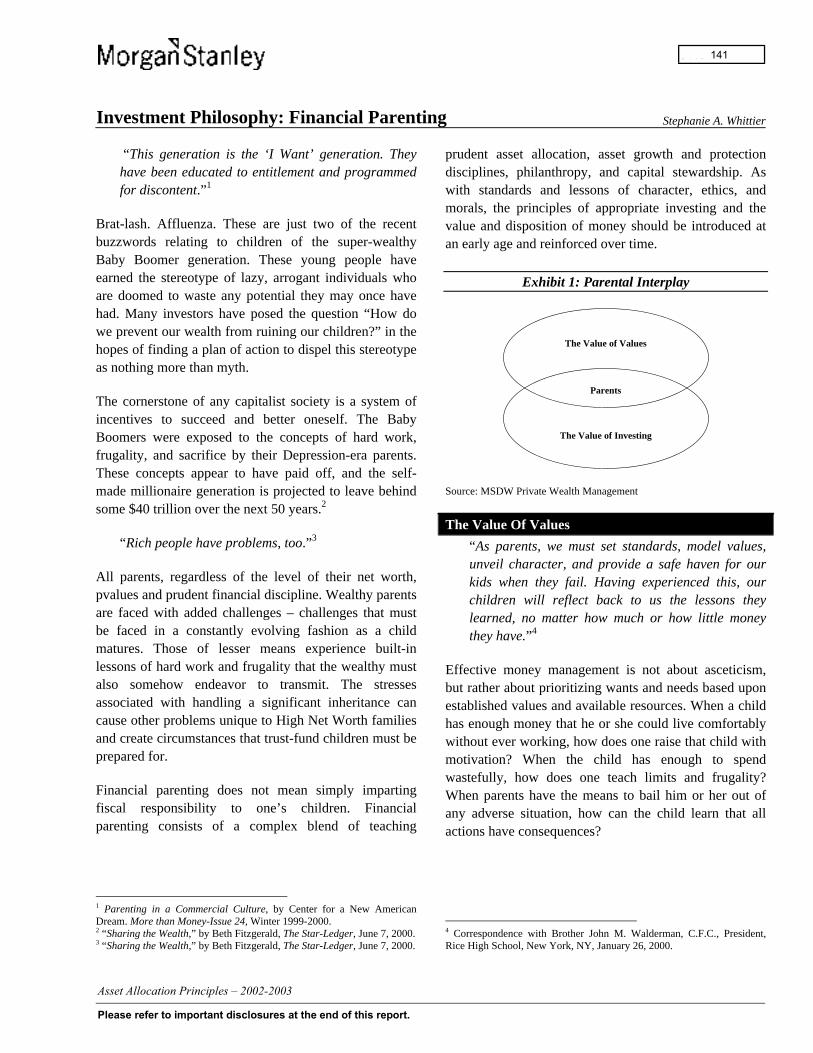
Investment Philosophy: Financial Parenting Stephanie A. Whittier
“This generation is the ‘I Want’ generation. Theyhave been educated to entitlement and programmedfor discontent.”1
Brat-lash. Affluenza. These are just two of the recentbuzzwords relating to children of the super-wealthyBaby Boomer generation. These young people haveearned the stereotype of lazy, arrogant individuals whoare doomed to waste any potential they may once havehad. Many investors have posed the question “How dowe prevent our wealth from ruining our children?” in thehopes of finding a plan of action to dispel this stereotypeas nothing more than myth.
The cornerstone of any capitalist society is a system ofincentives to succeed and better oneself. The BabyBoomers were exposed to the concepts of hard work,frugality, and sacrifice by their Depression-era parents.These concepts appear to have paid off, and the self-made millionaire generation is projected to leave behindsome $40 trillion over the next 50 years.2
“Rich people have problems, too.”3
All parents, regardless of the level of their net worth,pvalues and prudent financial discipline. Wealthy parentsare faced with added challenges – challenges that mustbe faced in a constantly evolving fashion as a childmatures. Those of lesser means experience built-inlessons of hard work and frugality that the wealthy mustalso somehow endeavor to transmit. The stressesassociated with handling a significant inheritance cancause other problems unique to High Net Worth familiesand create circumstances that trust-fund children must beprepared for.
Financial parenting does not mean simply impartingfiscal responsibility to one’s children. Financialparenting consists of a complex blend of teaching
1 Parenting in a Commercial Culture, by Center for a New AmericanDream. More than Money-Issue 24, Winter 1999-2000.2 “Sharing the Wealth,” by Beth Fitzgerald, The Star-Ledger, June 7, 2000.3 “Sharing the Wealth,” by Beth Fitzgerald, The Star-Ledger, June 7, 2000.
prudent asset allocation, asset growth and protectiondisciplines, philanthropy, and capital stewardship. Aswith standards and lessons of character, ethics, andmorals, the principles of appropriate investing and thevalue and disposition of money should be introduced atan early age and reinforced over time.
Exhibit 1: Parental Interplay
The Value of Values
Parents
The Value of Investing
Source: MSDW Private Wealth Management
The Value Of Values
“As parents, we must set standards, model values,unveil character, and provide a safe haven for ourkids when they fail. Having experienced this, ourchildren will reflect back to us the lessons theylearned, no matter how much or how little moneythey have.”4
Effective money management is not about asceticism,but rather about prioritizing wants and needs based uponestablished values and available resources. When a childhas enough money that he or she could live comfortablywithout ever working, how does one raise that child withmotivation? When the child has enough to spendwastefully, how does one teach limits and frugality?When parents have the means to bail him or her out ofany adverse situation, how can the child learn that allactions have consequences?
4 Correspondence with Brother John M. Walderman, C.F.C., President,Rice High School, New York, NY, January 26, 2000.
-
141

Investment Philosophy: Financial Parenting (cont.) Stephanie A. Whittier
“We might value racial diversity, yet choose to livein neighborhoods of only one race. We might believein public education, yet send our children to privateschool. We might espouse earning a living, yet liveon an inheritance.”5
The old adage “The apple doesn’t fall far from the tree”highlights one of the most important points for raising“good kids”: Education by example. Intentionally orunintentionally, parents often end up raising childrenwho resemble their parents. Successful, motivated,value-oriented parents tend to raise children who exhibitsimilar traits. The converse is true as well; parents whotend to spoil their children, buy them whatever theywish, or live reckless lives themselves often havedifficulties expecting better values from their children.
“Recommend virtue to your children; it alone, notmoney, can make them happy. ”6
It is important to maintain an age-appropriate, opendialogue between parents and children about the family’sfinancial affairs. The University of Michigan’s Institutefor Social Research has found that the influence of thefamily is significant on a child’s financial discipline.Fully 72% of the teenagers polled by the Institute saidthey learned financial discipline from their parents, and79% indicated that they plan to handle their finances in amanner similar to their parents.7 Adults often choose tosurround themselves with people who share their values.Children do not have the luxury of choosing theirparents; rather, they are subject to their parents’influence for 18 years, whether the parents are good rolemodels or not. Given the strength of that influence,parents need to strive to serve as good role models fortheir offspring.
Parents can demonstrate through their own actions theimportance of earning a living and can expose theirchildren to the reality of the workplace by bringing themto work. When deciding whether to make purchases, for
5 “No Easy Solutions”, by Anne Slepian, More Than Money-Issue 24,Winter 1999-2000.6 Ludwig van Beethoven, “The Heiligenstadt Testament,” October 6, 1802.7 Yankelovich Partners, 1999.
the family or for the child, parents can “think out loud,”explaining their decision-making process to the child inlanguage he or she can understand. If children perceiveparents as spending money arbitrarily, they will notunderstand the concept of spending limits or the value ofbudgets.
“Whenever it is in any way possible, every boy andgirl should choose as his or her life work someoccupation which he or she should like to doanyhow, even if he or she did not need the money.” 8
Parents should seek to personally play an activeeducational role in their children’s lives. In a number ofinstances, highly affluent children may reflect the samedegree of “impoverishment” as underprivileged children,sometimes due to the absence of strong positive parentalinfluence. Parents need to give thought to balancing thedesire to work and accumulate greater wealth (withwhich to provide for their children) versus the necessityto spend quantity as well as quality time in the home toprovide a stable and constructive domestic environmentfor their children. Many aspects of a child’s upbringingcan be put at risk by parental neglect, not to mention by ahigh caretaker turnover rate.
Many of today’s parents learned valuable lessons aboutthe nature of and the necessity for hard work, and canvividly recall the satisfaction derived from their firstpaper route, lemonade stand, or lawn-cutting job. Insimilar fashion, today’s children can learn many of theirmost important lessons through experience. Part-timejobs provide an education in money management andtime management. Through starting a small business,children can learn budgeting and working capitalprinciples. Such experience offers children theopportunity to learn the value of hard work and toexperience firsthand the satisfaction of personalaccomplishment beyond mere financial compensation.This can also help many affluent children to find a senseof independence and overcome the feeling that they areriding the coattails of their successful parents orgrandparents.
8 Irish Blessing
-
142

Investment Philosophy: Financial Parenting (cont.) Stephanie A. Whittier
“Anything in life worth having is worth workingfor.”9
Parents can also provide opportunity for hands-onlearning through simple devices such as a reasonableweekly allowance, a pre-paid phone card, a budgetedshopping trip and limits on computer time usage. Whenthe child knows in advance what his or her resources are,he or she can learn to prioritize and build a frameworkfor short-, medium- and long-term goals. When facedwith the consequences of poor financial decisions,children may in stages learn to think about and deal withthe ramifications of their decisions. For example, if aparent agrees to split the reasonable cost of somethingthe child wishes to buy, but the child falls short of his orher portion, the child may learn that this can be a deal-breaker. This way, the lessons of real-world moneymatters may not come as a shock to them, and their firstexperience with negative consequence will not besomething like a downgraded credit rating due to unpaidutilities bills. Children of means are better off if they canlearn not only that their wealth provides them with manyoptions and opportunities, but also that having moneydoes not grant them license to behave irresponsibly.
“They need to learn by trial and error that when youdrop things they fall.”10
At the beginning of this millennium, the estimatedspending power of 16- to 24-year olds is projected toexceed $100 billion per annum.11 Children need tounderstand the tradeoffs and opportunity costs inherentin financial decisions and the value of establishing agood reputation with creditors. By putting their progenyinto appropriate “sink or swim” situations from an earlyage — where the consequences are relatively small and asafety net can be in place — parents can allow childrento gain important experience that leads to maturedecision making.
9 Andrew Carnegie, excerpt from The American Dreams Collection, by JimBickford.10 “Who’s Spoiled?”, by Brigid McMenamin, Forbes June 12, 2000.11 U.S. Census Bureau, 1999.
“If children live with sharing, they learn to begenerous.” 12
Given the rapid accumulation rate of their wealth, somehighly-affluent individuals are finding that they havemore money than they can spend. Many parents aremoving toward “giving back” to the community by wayof philanthropy in hopes of setting an example andinstilling within their children a sense of responsibility.The Boston College Social Welfare Research Institutepredicts that “a golden age of philanthropy is dawning[due in part to] economic and emotional incentives todevote financial resources to charitable purposes.” 13
“Goodness is the only investment which neverfails.” 14
Besides aiding in the development of values-drivenchildren, philanthropy benefits the children in otherways. According to Sal Salvo, one of the co-founders ofthe Institute for Family Wealth Counseling:
“The children of successful entrepreneurs end up
with poor self-esteem because they don’t think they
can measure up to their successful parents…They
will never be able to do what their parents did
because they will never be hungry like their
parents. Someone will always look at them and
think, ‘If your parents weren’t successful, you
wouldn’t be successful.’ But philanthropy
helps….”15
In addition to training their children to make sociallyresponsible decisions with the family wealth, parents canencourage their offspring to actively participate infamily volunteerism. Volunteerism can enhance anunderstanding of money’s utility by demonstrating the
12 Children Learn What They Live, by Dorothy Nolte.13 Millionaires and the Millennium: New Estimates of the ForthcomingWealth Transfer and the Prospects for a Golden Age of Philanthropy, JohnJ. Havens and Paul G. Schervish, Social Welfare Research Institute BostonCollege, 1999.14 Henry David Thoreau, excerpt from The Book of Positive Quotes, byJohn Cook, Fairview Press, 1997.15 Sharing the Wealth, by Beth Fitzgerald, The Star-Ledger, June 7, 2000.
-
143

Investment Philosophy: Financial Parenting (cont.) Stephanie A. Whittier
principle that all personal satisfaction is not financiallyderived. Most children are giving and idealistic bynature; community service will reinforce charitablebehavior.
The Value Of Investing
“If money is your hope for independence, you willnever have it. The only real security that a personwill have in this world is a reserve of knowledge,experience, and ability.”16
If they can help shape a childhood full of lessons andexperiences that lead to a strong value set, parents shouldbe comfortable in the knowledge that their sons anddaughters are capable of making prudent financialdecisions. Sudden access to significant wealth providesmany wonderful options for the recipient, but also bringswith it great responsibility and stress unless a strongholdof knowledge and preparation has been built.
“If you are going to build the Empire State Building,the first thing you need to do is dig a deep hole andpour a strong foundation. If you are going to build ahome in the suburbs, all you need to do is pour a 6-inch slab of concrete. Most people, in their drive toget rich, are tring to build an Empire State Buildingon a 6-inch slab”17
In training children to become investment-savvy adults,parents are usually the primary teachers. A Yankelovichstudy found that 88% of teens did not understand theconcept of “compound interest,” while 85% wereunfamiliar with mutual funds.18 Children can accompanytheir parents on trips to the bank and/or meetings withtheir investment advisor. Most financial institutionsprovide marketing materials for youthful readers; theFederal Reserve Bank even has comic books outliningthe workings of the banking system and the NYSE hasliterature and videos depicting capital markets and howthey work.
16 Henry Ford17 Rich Dad Poor Dad, by Robert T. Kiyosaki.18 Yankelovich Partners, 1999.
Every child matures at a different rate, so activities andconversation should be tailored to the child’s specificlevel of maturity and comprehension. Besides takingchildren to financial meetings, parents can groom theirchildren on a smaller scale by judiciously including themin the family’s financial decision-making process. If amajor business decision is being made, Mom or Dadmight explain to the child the underlying logic behindthe decision. Understanding basic operations such asremoving funds from one investment and placing themin another can contribute to a young child’sconceptualization of finance.
“The only source of knowledge is experience” 19
In the investment world, hands-on experience remains animportant learning tool. Parents may take advantage ofthe current media frenzy surrounding financial marketsby introducing the child to prudent investing. By giftingshares or allowing the child to choose stocks that havesome particular meaning in his or her life, parents canimpart some sense of the real-world risks and rewards ofinvesting. While the parent may officially enact thetrade, allowing the child to research investment ideas andtrack investment performance will harness a youngperson’s enthusiasm and great capacity for newexperiences.
Many elementary and high schools have begun to offercourses or activities that bolster money managementskills. The Stock Market Game permits students ingrades 4-12 to actively manage a mock stock portfolioand compete against their peers from around the U.S.Programs such as those run by the Future BusinessLeaders of America can enhance financial educationthrough lectures and trips to financial markets, such asthe New York Stock Exchange. DECA, a nationalassociation of marketing education for students, aims tomerge national leadership development activities withclassroom instruction. Actual hands-on experience withmoney is also important for a child’s financial growth.Children and young adults need something tangible to
19 Albert Einstein
-
144

Investment Philosophy: Financial Parenting (cont.) Stephanie A. Whittier
see, feel and understand. The concept of money iselusive and abstract to many children, no matter howmuch they have. Letting a child see physical currency,giving them a piggy bank, or showing them how to enteramounts into their own check register can help to makemoney seem more real and perhaps thus easier to handle.
“If man or woman empties their purse into theirhead, no one man can take it away from them. Aninvestment in knowledge always pays the bestinterest.” 20
It is very important to encourage maturing young adultsto follow their own interests in their investments ratherthan expecting them to either mimic their parents’ stockpicks or to slavishly follow the strategies of their
20 Benjamin Franklin, Poor Richard’s Almanac.
parents’ financial advisors. All too often, as noted above,they are defined in terms of their parents’ success andtheir family’s wealth. If parents succeed in teaching theirchildren respectable values, they should have no qualmsin allowing these upstanding young men and women tofollow their character and reason in prudent investment.Financial learning is a lifelong pursuit; parents need tolay the groundwork for integrity, guide the developmentof their children’s understanding of finance and itsresources, and then stand back and watch them succeed.
“Teach about money. If there’s a lot of it around andlikely always will be, kids should know how to dealwith the stuff. Sort of like growing up on a boat andknowing how to swim.”21
21 “Who’s Spoiled?”, by Brigid McMenamin, Forbes June 12, 2000.
-
145

Investment Philosophy: Financial Parenting (cont.) Stephanie A. Whittier
Resources Available to ParentsBooks
• How to Talk So Kids Will Listen & Listen So Kids Will Talk, by Adele Faber, Avon Books, 1999.• Kids, Money & Values, by Patricia Schiff Estess, Betterway Publications, 1994.• Money Doesn’t Grow on Trees: A Parent’s Guide to Raising Financially Responsible Children, by Neale S.
Godfrey, Fireside, 1994.• A Penny Saved: Teaching Your Children the Values and Life Skills They Will Need to Live in the Real World, by
Neale S. Godfrey, Fireside, 1996.• Inspired Philanthropy, by Tracy Gary, Chardon, 1993.• Why the Wealthy Give, by Francie Ostrower, Princeton University Press, 1997.• Wealth Preservation and Estate Planning, by Jonathan G. Blattmachr, Regnery, 2000.• Street Wise: A Guide for Teen Investors, by Janet Bamford, Bloomberg Press, 2000.• Leading with the Heart, by Mike Krzyzewski, Warner Books, 2000.• Investing with Your Values: Making Money & Making a Difference, by Hall Brill, Jack Brill and Cliff Feigenbaum,
Bloomberg Press, 1999.• The Stewardship of Private Wealth: Managing Personal & Family Assets, by Sally S. Kleberg. McGraw Hill, 1997.• Privileged Ones (Children of Crisis, Volume 5), by Robert Cole, Little, Brown, & Co., 1982.• Money Matters for Teens Workbook, by Larry Burkett, Moody Press, 1998.• The Totally Awesome Money Book for Kids and Their Parents, by Adriane Berg, Newmarket Press, 1993.• The Kid’s Guide to Money: Earning It, Saving It, Spending It, Sharing It, by Steve Otfinoski, Scholastic Trade,
1996.• Children Learn What They Live, by Dorothy Nolte, Workman Publishing, 1998.• Rich Dad Poor Dad, by Robert T. Kiyosaki, Warner Books, 1997.
Internet Sites• www.morganstanley.com• www.nyse.com• www.federalreserve.gov• www.frugal-moms.com• www.inheritance-project.com• www.kidsource.com• family.go.com• www.kidsbank.com• www.deca.org• www.moneymentors.net• www.jumpstartcoalition.org• www.100hot.com/finance/full screen.html• www.kiplinger.com/kids• www.smg2000.com• www.coolbank.com• www.kidsenseonline.com/home.html• www.plan.ml.com/family/teachers/ resource.html
Games• Monopoly• Monopoly Jr.• Game of Life• Payday• The Allowance Game• The Stock Market Game• Mall Madness Organizations• Morgan Stanley Dean Witter• Future Business Leaders of America• Boy Scouts and Girl Scouts• Boy’s and Girl’s Clubs• New York Stock Exchange• Jump Start Coalition• Federal Reserve System
-
146
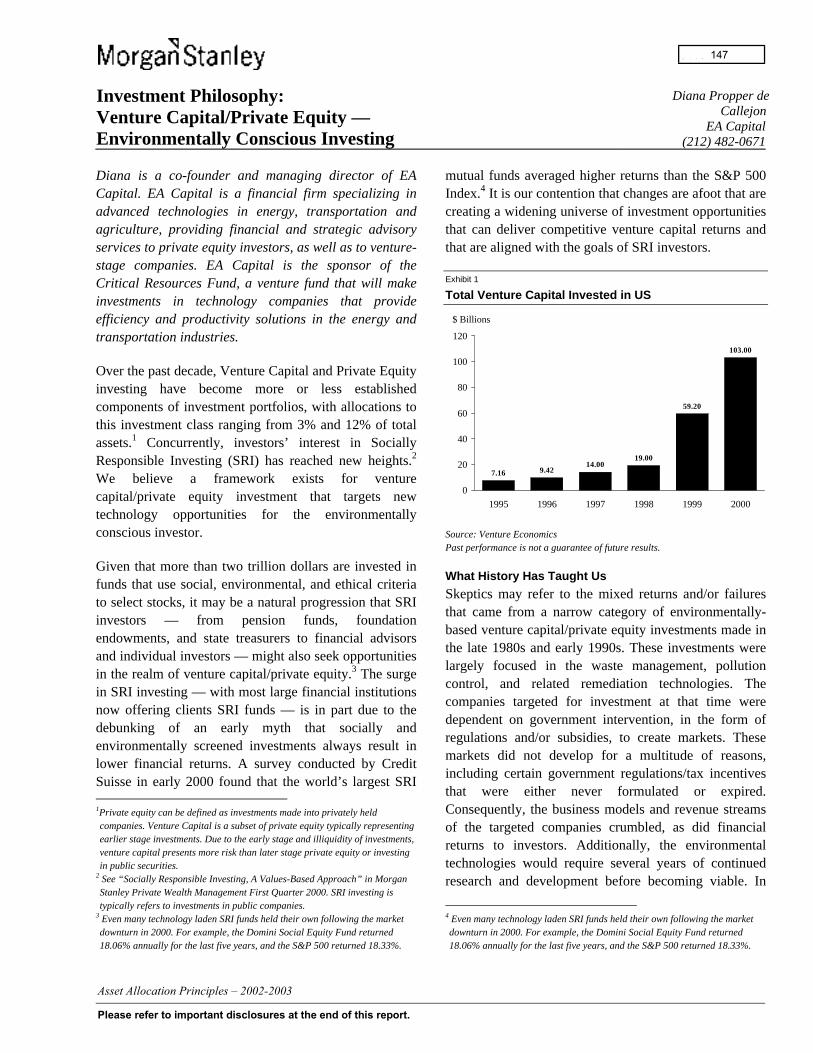
Investment Philosophy:Venture Capital/Private Equity —Environmentally Conscious Investing
Diana Propper deCallejon
EA Capital(212) 482-0671
Diana is a co-founder and managing director of EACapital. EA Capital is a financial firm specializing inadvanced technologies in energy, transportation andagriculture, providing financial and strategic advisoryservices to private equity investors, as well as to venture-stage companies. EA Capital is the sponsor of theCritical Resources Fund, a venture fund that will makeinvestments in technology companies that provideefficiency and productivity solutions in the energy andtransportation industries.
Over the past decade, Venture Capital and Private Equityinvesting have become more or less establishedcomponents of investment portfolios, with allocations tothis investment class ranging from 3% and 12% of totalassets.1 Concurrently, investors’ interest in SociallyResponsible Investing (SRI) has reached new heights.2
We believe a framework exists for venturecapital/private equity investment that targets newtechnology opportunities for the environmentallyconscious investor.
Given that more than two trillion dollars are invested infunds that use social, environmental, and ethical criteriato select stocks, it may be a natural progression that SRIinvestors — from pension funds, foundationendowments, and state treasurers to financial advisorsand individual investors — might also seek opportunitiesin the realm of venture capital/private equity.3 The surgein SRI investing — with most large financial institutionsnow offering clients SRI funds — is in part due to thedebunking of an early myth that socially andenvironmentally screened investments always result inlower financial returns. A survey conducted by CreditSuisse in early 2000 found that the world’s largest SRI 1Private equity can be defined as investments made into privately heldcompanies. Venture Capital is a subset of private equity typically representingearlier stage investments. Due to the early stage and illiquidity of investments,venture capital presents more risk than later stage private equity or investingin public securities.
2 See “Socially Responsible Investing, A Values-Based Approach” in MorganStanley Private Wealth Management First Quarter 2000. SRI investing istypically refers to investments in public companies.
3 Even many technology laden SRI funds held their own following the marketdownturn in 2000. For example, the Domini Social Equity Fund returned18.06% annually for the last five years, and the S&P 500 returned 18.33%.
mutual funds averaged higher returns than the S&P 500Index.4 It is our contention that changes are afoot that arecreating a widening universe of investment opportunitiesthat can deliver competitive venture capital returns andthat are aligned with the goals of SRI investors.
Exhibit 1
Total Venture Capital Invested in US
7.16 9.42
19.00
59.20
103.00
14.00
0
20
40
60
80
100
120
1995 1996 1997 1998 1999 2000
$ Billions
Source: Venture EconomicsPast performance is not a guarantee of future results.
What History Has Taught Us
Skeptics may refer to the mixed returns and/or failuresthat came from a narrow category of environmentally-based venture capital/private equity investments made inthe late 1980s and early 1990s. These investments werelargely focused in the waste management, pollutioncontrol, and related remediation technologies. Thecompanies targeted for investment at that time weredependent on government intervention, in the form ofregulations and/or subsidies, to create markets. Thesemarkets did not develop for a multitude of reasons,including certain government regulations/tax incentivesthat were either never formulated or expired.Consequently, the business models and revenue streamsof the targeted companies crumbled, as did financialreturns to investors. Additionally, the environmentaltechnologies would require several years of continuedresearch and development before becoming viable. In
4 Even many technology laden SRI funds held their own following the marketdownturn in 2000. For example, the Domini Social Equity Fund returned18.06% annually for the last five years, and the S&P 500 returned 18.33%.
-
147
Investment Philosophy:Venture Capital/Private Equity —Environmentally Conscious Investing (cont.)
Diana Propper deCallejon
EA Capital(212) 482-0671
some instances, it would be up to ten years beforeinvestors could exit these investments, further depressingreturns. Even the successful environmental investments,which delivered annual returns of 8% to 12%, wereunderperformers relative to similar investments in otherindustry groups such as telecommunications.5 Whileperhaps a noble endeavor, these environmentalenterprises were not well suited to venture capital and asa result fell out of favor, with environmental activitiesbecoming limited to philanthropy.
A new profitable framework for investing in venturecapital and the environment is coming to the fore, onethat focuses on major market and business opportunitieswith a clear and speedy path to liquidity. In thisapproach, venture capital/private equity investments aremade in companies that increase natural resourceefficiency and productivity. Opportunities are driven bycustomer demand and powerful market forces and not byregulatory fiat. Environmental benefits may be abyproduct, but no longer the primary focus of investorsor of the venture capital recipient. We believe suchopportunities currently exist in a number of industriesacross the spectrum of energy, agriculture,transportation, chemicals, biotech, and industrial processindustries. A look at current opportunities in energy-related technologies may illustrate this best.
Advances in Energy-Related TechnologiesSeveral forces are driving an unprecedentedtransformation in the energy industry. Similar totelecommunications in the 1980s, energy markets arebeing deregulated. Although the process may not beperfectly smooth, it is allowing commercial andresidential customers to increasingly choose their electricpower providers. As a result, utilities are striving todifferentiate themselves in the marketplace, andattempting to improve customer service and relations.These industry changes and challenges are creatingfertile ground for the development andcommercialization of a suite of new technologies that areattracting a growing amount of venture capital.
5 Venture funds that made early investments in the environment includeTechnology Funding Inc., First Analysis Venture Capital, and AdventInternational.
At the same time, the demand for power quality andreliability in the US is growing dramatically. With aneconomy increasingly reliant on high technology,computers, and the Internet, the financial risks of thecountry’s energy problems are increasing. Because therehas been little investment in new power plants and in thecountry’s power transmission and distributioninfrastructure, US businesses are said to be losing asmuch as $30 billion annually due to more frequentblackouts, power disruptions, and poor-quality power.6
New technologies are being developed to meet the needsof corporations. The primary goal of increased energyproduction may be accompanied by lessened resourceconsumption and waste generation, thus providingenvironmental benefits. Below we describe the emergingtechnologies in some detail.
Distributed Generation (DG): Typically built assmaller scale power plants located close to or at the pointof use, distributed generation technologies provideprimary power or backup power to the electric powergrid. Customers can operate their “mini” power plantalongside, in place of, or as back up to the electricitygrid. This flexibility protects customers against extremeprice volatility, improves reliability, and allows forrecovery of waste heat for other operational needs. DGtechnologies in various stages of commercializationinclude microturbines, fuel cells, stirling engines(external heating of a sealed working fluid or gas), andflywheels. The environmental benefits of DG includereduced emissions of air pollutants (e.g., Sulfur Dioxide)and climate change gases (e.g., CO2), as well as energyefficiency improvements where heat recovery is apossibility.
• Metering, Monitoring and Control (MMC)Technologies: In an effort to provide higher-qualityservices to customers and to differentiate themselvesin the marketplace, energy service providers areoffering their customers more control over theirenergy usage via MMC technologies. Technologies
6 The Electric Power Research Institute. (The problems with the US’s electricityinfrastructure are now most apparent in, although not limited to, California.)
-
148
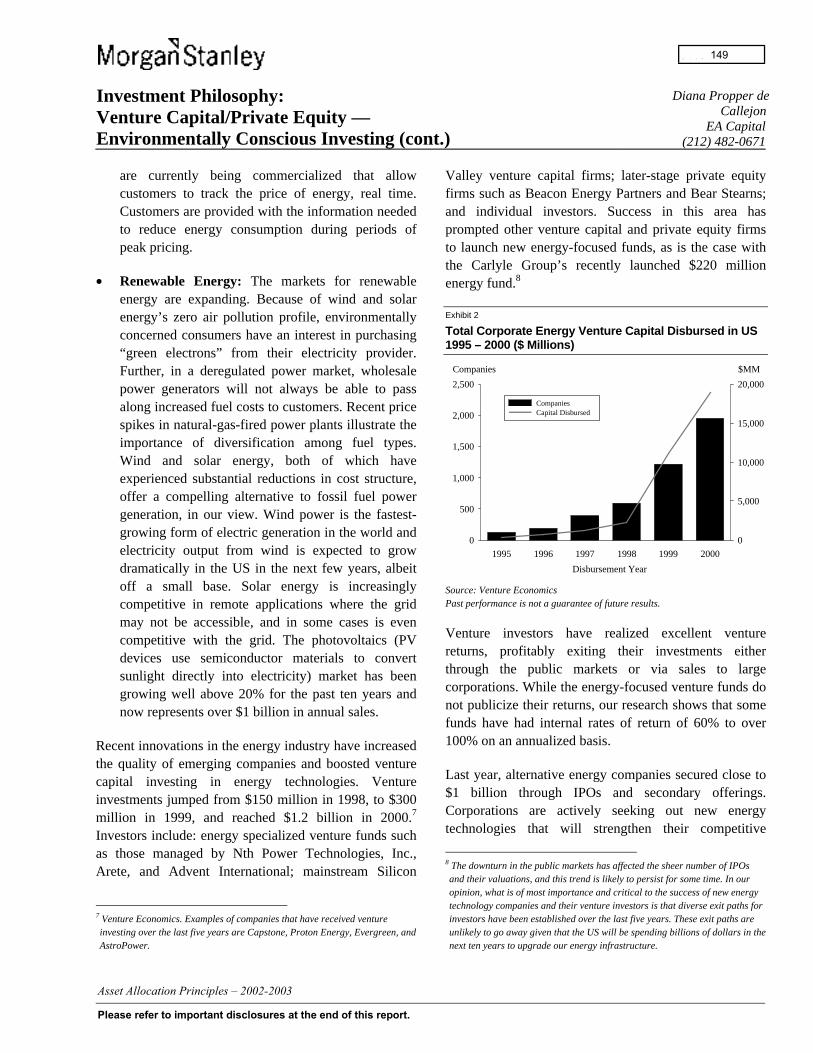
Investment Philosophy:Venture Capital/Private Equity —Environmentally Conscious Investing (cont.)
Diana Propper deCallejon
EA Capital(212) 482-0671
are currently being commercialized that allowcustomers to track the price of energy, real time.Customers are provided with the information neededto reduce energy consumption during periods ofpeak pricing.
• Renewable Energy: The markets for renewableenergy are expanding. Because of wind and solarenergy’s zero air pollution profile, environmentallyconcerned consumers have an interest in purchasing“green electrons” from their electricity provider.Further, in a deregulated power market, wholesalepower generators will not always be able to passalong increased fuel costs to customers. Recent pricespikes in natural-gas-fired power plants illustrate theimportance of diversification among fuel types.Wind and solar energy, both of which haveexperienced substantial reductions in cost structure,offer a compelling alternative to fossil fuel powergeneration, in our view. Wind power is the fastest-growing form of electric generation in the world andelectricity output from wind is expected to growdramatically in the US in the next few years, albeitoff a small base. Solar energy is increasinglycompetitive in remote applications where the gridmay not be accessible, and in some cases is evencompetitive with the grid. The photovoltaics (PVdevices use semiconductor materials to convertsunlight directly into electricity) market has beengrowing well above 20% for the past ten years andnow represents over $1 billion in annual sales.
Recent innovations in the energy industry have increasedthe quality of emerging companies and boosted venturecapital investing in energy technologies. Ventureinvestments jumped from $150 million in 1998, to $300million in 1999, and reached $1.2 billion in 2000.7
Investors include: energy specialized venture funds suchas those managed by Nth Power Technologies, Inc.,Arete, and Advent International; mainstream Silicon
7 Venture Economics. Examples of companies that have received ventureinvesting over the last five years are Capstone, Proton Energy, Evergreen, andAstroPower.
Valley venture capital firms; later-stage private equityfirms such as Beacon Energy Partners and Bear Stearns;and individual investors. Success in this area hasprompted other venture capital and private equity firmsto launch new energy-focused funds, as is the case withthe Carlyle Group’s recently launched $220 millionenergy fund.8
Exhibit 2
Total Corporate Energy Venture Capital Disbursed in US1995 – 2000 ($ Millions)
0
500
1,000
1,500
2,000
2,500
1995 1996 1997 1998 1999 2000
0
5,000
10,000
15,000
20,000
Companies
Disbursement Year
$MM
Capital DisbursedCompanies
Source: Venture EconomicsPast performance is not a guarantee of future results.
Venture investors have realized excellent venturereturns, profitably exiting their investments eitherthrough the public markets or via sales to largecorporations. While the energy-focused venture funds donot publicize their returns, our research shows that somefunds have had internal rates of return of 60% to over100% on an annualized basis.
Last year, alternative energy companies secured close to$1 billion through IPOs and secondary offerings.Corporations are actively seeking out new energytechnologies that will strengthen their competitive
8 The downturn in the public markets has affected the sheer number of IPOsand their valuations, and this trend is likely to persist for some time. In ouropinion, what is of most importance and critical to the success of new energytechnology companies and their venture investors is that diverse exit paths forinvestors have been established over the last five years. These exit paths areunlikely to go away given that the US will be spending billions of dollars in thenext ten years to upgrade our energy infrastructure.
-
149

Investment Philosophy:Venture Capital/Private Equity —Environmentally Conscious Investing (cont.)
Diana Propper deCallejon
EA Capital(212) 482-0671
position within their respective markets. In general,corporate venture capital investments have beenincreasing rapidly. Corporate venture capital increasedfrom $372 million disbursed to 119 companies in 1995to $18.95 billion disbursed to 1,947 companies in 2000.
In the energy sector, Royal Dutch Shell, BP Amoco,Pacific Gas and Electric, Texaco, Cinergy, GE PowerSystems, and Caterpillar are but a few examples ofcorporations that have intensified their venture investingand acquisition activities.
Exhibit 3
Corporate Energy Venture Capital ExamplesCorporate Investors Investments Type of Investments $ Amounts
(millions)Texaco ECD Energy/Power $62.0General Electric Plug Power Power/Fuel cell $37.5Caterpillar ActivePower Power
reliability/backup$5.0
Enron Meter Technology
Electronic meters forcommercial andresidential customers
$5.0
Kawasaki Evergreen Solar powermanufacturer
$4.0
Source: EA Capital Research
Conclusion
Gone are the early days of investing in environmental“pure plays” which were out of touch with market forcesand industry fundamentals. The environmental companyof the 21st Century will probably not have a “green” or“eco” label attached to it. We believe that venturecapital/private equity investments have the potential todeliver environmental benefits along with the good
financial returns seen in SRI investing. The successful“early stage” investor should first identify market drivenopportunities, and then select the opportunities that canbest meet the investor’s environmental goals. To a largeextent, resource efficiency and productivity technologiesare at the center of the convergence between strongfinancial returns and environmental upside.
This investment framework is finding success in theenergy industry, and we believe similar and abundantopportunities exist across the spectrum of thetransportation, chemicals, biotech, agriculture, andindustrial process industries.
www.eacapital.com
www.epri.com “Electricity Technology Roadmap,” theElectric Power Research Institute, 1999.
http://www.iea.org/weo/index.htm “World EnergyOutlook,” International Energy Agency (IEA), 2000.
http://www.undp.org/seed/eap/activities/wea/ “WorldEnergy Assessment,” United Nations DevelopmentProgramme and WEC, 2000.
http://www.rmi.org/sitepages/pid171.asp “EnergySurprises for the 21st Century,” by Amory Lovins andChris Lotspeich, Rocky Mountain Institute, 1999.
http://www20.cera.com/ “2020 Vision: Global Scenariosfor the Future of the World Oil Industry,” CambridgeEnergy Research Associates (CERA), 2000.
-
150

Common Stock and Uncommon Profits Phillip A. Fisher 153
The Intelligent Investor Benjamin Graham 154
The Art of Speculation Philip L. Carret 156
The Battle for Investment Survival Gerald M. Loeb 158
The Essays of Warren Buffett Warren E. Buffett 160
Manias, Panics, and Crashes Charles P. Kindleberger 162
Capital Ideas Peter L. Bernstein 164
Reminiscences of a Stock Operator Edwin LeFèvre 167
Extraordinary Popular Delusions andthe Madness of Crowds Charles Mackay 170
Confusión de Confusiones Joseph de la Vega 173
Lombard Street: A Description of the Money Market Walter Bagehot 177
Where Are the Customers’ Yachts? Fred Schwed, Jr. 182
Irrational Exuberance Robert J. Shiller 187
The Go-Go Years: The Drama and Crashing Finale ofWall Street's Bullish 60s John Brooks 195
Pioneering Portfolio Management David F. Swensen 202
-
151


Classic Investment Readings: Philip A. Fisher
Common Stocks and Uncommon Profits
The Fifteen Points to Look For in a Common Stock
Philip A. Fisher is considered by many investmentprofessionals to be one of the most influential authors ofall time on equity investing. In his 1957 book, CommonStocks and Uncommon Profits, Phil Fisher outlines hisFifteen Points to Look for in a Common Stock.
1. Does the company have products or services withsufficient market potential to make possible a sizableincrease in sales for at least several years?
2. Does the management have a determination tocontinue to develop products or processes that willstill further increase total sales potentials when thegrowth potentials of currently attractive productlines have largely exploded?
3. How effective are the company’s research anddevelopment efforts in relation to its size?
4. Does the company have an above-average salesorganization?
5. Does the company have a worthwhile profit margin?
6. What is the company doing to maintain or improveprofit margins?
7. Does the company have outstanding labor andpersonnel relations?
8. Does the company have outstanding executiverelations?
9. Does the company have depth to its management?
10. How good are the company’s cost analysis andaccounting controls?
11. Are there other aspects of the business, somewhatpeculiar to the industry involved, which will give theinvestor important clues as to how outstanding thecompany may be in relation to its competition?
12. Does the company have a short-range or long-rangeoutlook in regard to profit?
13. In the foreseeable future, will the growth of thecompany require sufficient equity financing so thatthe larger number of shares then outstanding willlargely cancel the existing stockholders’ benefitfrom the anticipated growth?
14. Does the management talk freely to investors aboutits affairs when things are going well, but “clam up”when troubles and disappointments occur?
15. Does the company have a management ofunquestionable integrity?
Copyright © 1996 by Philip A. Fisher. Used bypermission from John Wiley & Sons, Inc.
-
153
Classic Investment Readings: Benjamin Graham
The Intelligent Investor
Benjamin Graham is considered by many the father ofValue Investing. In Warren E. Buffett’s 1983 preface toGraham’s seminal work, The Intelligent Investor(originally published in 1949), he writes: “The sillier themarket’s behavior, the greater the opportunity for thebusinesslike investor. Following Benjamin Graham’sprecepts will help the investor profit from folly ratherthan participate in it.” Set forth below are someunderlying principles of equity investing that Grahamaddresses in his book (the principles were edited solelyfor modern context). They will likely be construed ashighly conservative by all but the most dyed-in-the-woolvalue investors. Some of the ratios may need to beadjusted for current market condition.
The rate of return sought should be dependent on theamount of intelligent effort the investor is willing andable to bring to bear on the task of equity investing. Theminimum return goes to the passive (defensive) investor,who wants both safety and freedom from concern. Themaximum return is generally realized by the alert andenterprising investor who exercises maximumintelligence and skill.
The selection of common stocks for the portfolio of thedefensive investor should be a relatively simple matter.Set forth below are four rules to be followed:
1. There should be adequate though not excessivediversification. This might mean a minimum of tendifferent issues and a maximum of about thirty.
2. Each company selected should be large, prominent,and conservatively financed. Indefinite as theseadjectives must be, their general sense is clear.
3. Each company should have a long record ofcontinuous dividend payments.
4. The investor should impose some limit on the pricehe or she will pay for an issue in relation to itsaverage earnings over, say, the past seven years.
The activities especially characteristic of the enterprisinginvestor in the common-stock field may be classifiedunder four headings:
1. Buying in low markets and selling in high markets.
2. Buying carefully chosen growth stocks.
3. Buying bargain issues of various types.
4. Buying into special situations.
The equity investment criteria set forth in the sevencategories below have been established especially for theneeds and the temperament of defensive investors. Thesecriteria would eliminate the great majority of commonstocks as candidates for the portfolio, and in twoopposite ways. On the one hand, they would excludecompanies that are (i) too small; (ii) in relatively weakfinancial condition; (iii) with a deficit stigma in their ten-year record; and (iv) not having a long history ofcontinuous dividends. By contrast, the sixth and seventhcriteria are exclusive in the opposite direction, bydemanding more earnings and more assets per dollar ofprice than the popular issues will supply.
-
154

Classic Investment Readings: Benjamin Graham (cont.)
1. Adequate Size of the Enterprise: The minimum sizecriterion is arbitrary, especially in the matter of sizerequired. The idea is to exclude small companieswhich may be subject to more than averagevicissitudes, especially in the industrial field. Thereare often good possibilities in such enterprises, butthey are not considered to be suited to the needs ofthe defensive investor.
2. Sufficiently Strong Financial Condition: Forindustrial companies, current assets should be atleast twice current liabilities — a so-called two-to-one current ratio. Also, long-term debt should notexceed the net current assets, also known as workingcapital.
3. Earnings Stability: The company should have shownsome earnings for the common stock in each of thepast ten years.
4. Dividend Record: The company should have haduninterrupted payments for at least the past 20 years.
5. Earnings Growth: The company should have showna minimum increase of at least one-third in per-shareearnings in the past ten years, using three-yearaverages at the beginning and end.
6. Moderate Price/Earnings Ratio: The current priceshould not be more than 15 times average earningsof the past three years.
7. Moderate Ratio of Price to Assets: The current priceshould not be more than 1.5 times the book valuelast reported. However, multiples of earnings below15 could justify a correspondingly higher multiple ofassets. As a rule of thumb, it is suggested that theproduct of the price/earnings multiple times the ratioof price to book value should not exceed 22.5. Thisfigure corresponds to 15 times earnings and 1.5times book value. It would admit an issue selling atonly 9 times earnings and 2.5 times asset value, andso forth.
The predictive approach to investing could also be calledthe qualitative approach, since it emphasizes prospects,management, and other nonmeasurable, albeit highlyimportant, factors that go under the heading of quality.The protective approach may be called the quantitativeor statistical approach, since it emphasizes thequantifiable relationships between selling price andearnings, assets, dividends, and other measures of value.
Those who emphasize prediction will endeavor toanticipate fairly accurately just what the company willaccomplish in future years — in particular, whetherearnings will show pronounced and persistent growth.These conclusions may be based on a very careful studyof such factors as supply and demand in the industry —or volume, price and costs.
Those who emphasize protection are always especiallyconcerned with the price of the issue at the time of study.Their main effort is to assure themselves of a substantialmargin of indicated present value above the market price— this margin could be used if necessary to absorbunfavorable developments in the future.
Copyright © 1949 by Benjamin Graham. Used by permission from Harper & Row, Publishers Inc.
-
155
Classic Investment Readings: Philip L. Carret
The Art of SpeculationPhilip Louis Carret founded the first mutual fund,the Pioneer Fund, in 1929. Even until his death at101 years old, Mr. Carret was revered by Warren Buffettas having the “best long-term investment record ofanyone in America.” Originally written in 1930 whenCarret was an apprentice at Barron's, The Art ofSpeculation is replete with timeless insights into the artand science of investing, many of which are excerptedbelow.
Speculation may be defined as the purchase or sale ofsecurities or commodities in expectation of profiting byfluctuations in their prices.
Just as water always seeks its level, answering the pull ofgravity, so in the securities market prices are alwaysseeking a level of values. Speculation is the agency bywhich the adjustment is made.
The speculator is the advance agent of the investor,seeking always to bring market prices into line withinvestment values, opening new reservoirs of capital tothe growing enterprise, and shutting off the supply fromenterprises which have not profitably used that whichthey already possessed.
The road to success in speculation is the study of values.The successful speculator must purchase or holdsecurities which are selling for less than their real value,and avoid or sell securities which are selling for morethan their real value.
In fact, speculation is inseparable from investment. Theinvestor must assume some degree of speculative risk;the intelligent investor will seek a certain measure ofspeculative profit.
The obvious fact about security prices to any student ofthe market is that they fluctuate.
For practical purposes, the occurrence of ripples andwaves in price movements is unpredicable. To attempt totrade on such movements is mere gambling, with theodds against the trader by a considerable margin. It isastounding that thousands of otherwise intelligentpersons persist in trying to make money this way.
The general state of business does not forecast the courseof stock prices except in the apparently paradoxicalfashion that great prosperity affords an advantageous
time for selling stocks, and extreme business depressionan opportunity for purchase.
Economic history never repeats itself exactly.
An overdose of rising stock prices has the same ultimateeffect as an overdose of any stimulant.
Bull markets and bear markets last long enough so thatthe average trader is likely to forget by the time theclimax is approaching that any other sort of movement ispossible.
Stock prices respond to unpredictable human impulses.Most traders are optimists by nature and therefore buyersrather than sellers of stocks. A long-continued bullmarket both feeds the optimism of the trading public andprovides increasing resources which the optimist canutilize. The greater the momentum which a bull marketacquires, the longer does it take the economic breaks tobring it to a stop.
-
156

Classic Investment Readings: Philip L. Carret (cont.)
A study of economic fundamentals shows that a trader instocks may sometimes profitably continue to hold stocksafter standard business indices have given warningsignals. Clearly a bull market does not stop preciselywhere the doctrinaire economist or statistician supposesthat it should. Beyond a certain point which can bedesignated with some assurance, a bull marketnevertheless resembles the octogenarian who is living on“borrowed time.” It may have months or years yet to livebut it is increasingly a poor risk.
It is possible to make an outline of the factors which thespeculator consciously or unconsciously considers inarriving at a conclusion regarding the intrinsic value ofan industrial stock:
1. The outlook for the industry(a) Prospects for long-range growth(b) Prospects for the immediate trend of profits
(i) Probable price movement of principalcommodities and/or other inputs
(ii) State of competition
2. Position of the company in the industry(a) Relative size in comparison with competitors(b) Relative rate of growth in comparison with
competitors
3. Condition of the company(a) Record of earnings and trend(b) Working-capital position and trend(c) Capital structure
A vital fact about any business is its normal profitmargin. Theoretically, high profit margins invitecompetition; low profit margins are sometimes safer.
Business success is largely a matter of management.Methods of doing business are constantly changing. Themanagement of an enterprise must be alert to sense thesechanges, to adopt those which are improvements overold methods.
Twelve Commandments for Speculators
The speculator will never be a success if he or she attemptsto follow any set of rules blindly. There will always beexceptions; he must apply his or her intelligence keenly inany given situation. Twelve precepts for the speculativeinvestor may be stated as follows:
1. Never hold fewer than ten different securitiescovering five different fields of business.
2. At least once in six months reappraise every securityheld.
3. Keep at least half of the total fund in income-producing securities.
4. Consider yield the least important factor inanalyzing any stock.
5. Be quick to take losses, reluctant to take profits.
6. Never put more than 25% of a given fund intosecurities about which detailed information is notreadily and regularly available.
7. Avoid “inside information” as you would the plague.
8. Seek facts diligently, advice never.
9. Ignore mechanical formulas for valuing securities.
10. When stocks are high, money rates rising, andbusiness prosperous, at least half a given fundshould be placed in short-term instruments.
11. Borrow money sparingly and only when stocks arelow, money rates low or falling, and businessdepressed.
12. Set aside a moderate proportion of available fundsfor the purchase of long-term options on stocks ofpromising companies whenever available.
One of the essential qualifications of the successfulspeculator is patience. It may take years for the market ina given stock to reflect in any large degree the valueswhich are being accumulated behind it.
There is no reason why the stockholder should terminatea commitment, unless strongly convinced that stockprices in general have far outrun values.
Copyright © 1930 by Phillip L. Carret. Used by permissionfrom John Wiley & Sons, Inc.
-
157
Classic Investment Readings: Gerald M. Loeb
The Battle for Investment SurvivalIn his 1995 Forward to Gerald M. Loeb’s The Battle forInvestment Survival (written in 1935), John Rothchildwrote: “When Gerald Loeb wrote his memorable book,investors could be divided into two camps: the Buy-and-Holders and the Skittish Traders. In Gerald Loeb’s day,the Skittish Traders had a much larger following thanthe Buy-and-Holders, with Loeb as the principalspokesperson for moving in and out of the market:cutting losses, taking profits and running, and gettingout while the getting was good. Benjamin Graham’sbook, Security Analysis, published the same year, hasbecome the Buy-and-Holder’s Bible. Like BenjaminGraham and Warren Buffett, Loeb realized that stockswere the only real chance a person had to increasewealth, but he didn’t think the way to do it was to sitback and be patient and wait for true values to bereflected in the prices. Loeb believed in taking quickprofits, buying and selling at key points, and takingadvantage of trends. However, Benjamin Graham’s bookcontinues to have a large following today, whereasLoeb’s classic book has, until its recent republication,all but disappeared from the scene. As a full-blowndescription of how a prolonged bear market can affectinvestors, their psychology, and their modus operandi,The Battle for Investment Survival is an invaluableresource. The fact that Loeb’s point of view was once sowidely accepted and now is so widely discredited makesit worthy of some attention.” A selected number ofGerald Loeb’s timeless insights are excerpted below.
Any earner who earns more than he or she can spend isautomatically an investor. The real objective ofinvestment is fundamentally to store excess currentpurchasing power for future use.
What success investors eventually have is governed bytheir abilities, the stakes they possess, the time they giveto it, the risks they are willing to take, and the marketclimate in which they operate.
Diversification is a necessity for the beginner. On theother hand, the really great fortunes were made byconcentration. The greater your experience, the greateryour capability for running risks, and the greater yourability to chart your course yourself, the less you need todiversify.
Nothing is more difficult than consistently and fairlyprofiting in Wall Street.
Market values are fixed only in part by balance sheetsand income statements; much more by the hopes andfears of humanity; by greed, ambition, acts of God,invention, financial stress and strain, weather, discovery,fashion, and numberless other causes impossible to belisted without omission.
One must devote some time every day to the subject ofinvestment. Nothing is more logical, yet nothing is moresurprising to most people. One should devote either agenerous amount of time, or no time at all. Halfwaymeasures are impossible.
Commitments should not be closed haphazardly orallowed to remain open without justification.
Concentration of investments in a minimum of stocksinsures that enough time will be given to the choice ofeach so that every important detail about them will beknown.
The investor should particularly scrutinize companiesthat cannot show enough cash income to invest in plant
-
158
Classic Investment Readings: Gerald M. Loeb (cont.)
expansion, needed growth in working capital, anddividends, without resort to continual new financing.
Investors rarely sense what to do when they discoversomething accurate and important. It always was andalways will be the power to understand and the ability toact that turns information into profits.
For practical reasons, one necessarily has to makecompromises. The factors that make an ideal investmentare never all present at the same time.
A willingness and the ability to hold funds uninvestedwhile awaiting real opportunities is a key to success inthe battle for investment survival.
People like to take profits and don’t like to take losses.They also hate to repurchase something at a price higherthan they sold it. Human likes and dislikes will wreckany investment program. Only logic, reason,information, and experience can be listened to if failureis to be avoided.
The most important single factor in shaping securitymarkets is public psychology. The psychology whichleads people to pay forty times earnings for a stock underone set of conditions and refuse to buy the same sharesunder another set of conditions at ten times earnings issuch a powerful and vital price-changing factor that itcan overshadow actual earnings trends as an influence onstock prices.
Accepting losses is the single most important investmentdevice to insure safety of capital. It is also the action thatmost people know the least about, and that they are leastliable to execute. It is a great mistake to think that whatgoes down must come back up.
The way to successful investment lies much more inlearning how to utilize your best thoughts and minimizeyour worst inclinations, rather than in being better atselection or better at timing than the average.
The beginner needs diversification until he or she learnsthe ropes. For those who are accomplished, mostaccounts have entirely too much diversification of thewrong sort and not enough of the right. The greatestsafety lies in putting a significant portion of your eggs inone basket and watching the basket.
The better the quality of an investment, the better thechance to survive if the road grows really rough.
Remember, life is a succession of cycles. Day and night.Hot and cold. Good times and bad. High prices and low.Dividends increased and dividends cut. So don’t expectyour investments to be the exception to the rule.
One of the greatest causes of loss in security transactionsis to open a commitment for a particular reason, and thenfail to close it when the reason proves to be invalid.
Of all the factors that affect the success of a corporation,none exceeds the competence of management. Oneaspect of management worth noting is the extent towhich the officers own their own shares.
What might a bull market do to your investmentthinking? We tend to: (i) congratulate ourselves on beingastute investors; (ii) think how foolish we were to havebeen so conservative, and how much better off we wouldbe if we had taken greater risks; and (iii) start stretchingand reaching for quick profits under the guise of a “moreaggressive” investment approach, which is nothing morethan a risky, speculative approach.
Have a firm foundation of the strongest and bestcommon stocks of companies which are moving aheadand which have shown an ability to do well under allsorts of conditions.
Stick steadfastly to your long-term investment plan, notmodified by the fears or exuberance of the moment.
There are three ways of making money. One is to sellyour time. The second is to lend your money. The thirdis to risk your money.
The next time you think you see a bargain, take it as ared signal to look further and see if you have missed animportant weakness.
If you want to sell some of your stocks and not all,invariably go against your emotional inclinations and sellfirst the issues with losses, small profits, or none at all.Always get rid of the weakest and keep your best issuesfor the last.
This book is called The Battle for Investment Survivalbecause protecting and increasing capital is in fact abattle.
Copyright © 1935 by Gerald M. Loeb. Used by permissionfrom John Wiley & Sons, Inc.
-
159

Classic Investment Readings: Warren E. Buffett
The Essays of Warren Buffett:Lessons for Corporate America
A student of Benjamin Graham at Columbia BusinessSchool in the 1950s and a native of Omaha, Nebraska,Warren E. Buffett, is renowned as the chairman ofBerkshire Hathaway Inc. and one of the world’slegendary investors. As set forth in the introduction toLawrence A. Cunningham’s The Essays of WarrenBuffett: Lessons for Corporate America (Cardozo LawReview, 1997), readers of Buffett’s annual letters toshareholders have gained an enormously valuableeducation. The letters distill in plain words the basicprinciples of sound business practices: selectingmanagers and investments, valuing businesses, andusing financial information profitably. As Cunninghamputs it, the writings are broad in scope, and long onwisdom. In the interest of education, Buffett has postedcopies of the annual letters since 1977 to the company’swebsite at www.berkshirehathaway.com. With 20 Lettersto Shareholders and the Berkshire Hathaway Owner’sManual totaling 437 pages in the aggregate, until now,Buffett’s writings existed in a form that was neithereasily accessible nor organized in any thematic way.Over the past three years, Cunningham, a corporategovernance professor at Yeshiva University’s CardozoSchool of Law in New York City, selected, edited,arranged, and introduced these writings. When asked atthe 1998 Berkshire Hathaway Annual Meeting about thebest book to read on Berkshire’s investment style,Warren Buffett replied, “Larry Cunningham has done agreat job at collating our philosophy. It is far better thanany of the biographies written to date. If I were to pickone book to read this would be the one.” Following areselected insights from The Essays of Warren Buffett.
Investment success should be measured by analyzing thelong-term progress of companies, rather than the month-to-month movements of their stocks.
When evaluating common stocks as a potentialinvestment, the investor should approach the transactionas if he or she were buying into a private business. Keyevaluative criteria include: (i) the economic prospects ofthe business; (ii) the people in charge of running it; and(iii) the price to be paid.
When a management with a reputation for brilliancetackles a business with a reputation for poor fundamental
economics, it is the poor reputation of the business thatremains intact.
Investment success will not be produced by formula-driven approaches, computer programs, or technicalsignals flashed by the price behavior of stocks andmarkets. Rather, an investor will succeed by couplinggood business judgment with an ability to insulate his orher thoughts and behavior from the super-contagiousemotions that swirl about the marketplace.
The investor should be quite content to hold a securityindefinitely, so long as the prospective return on equitycapital of the underlying business is satisfactory,management is competent and honest, and the marketdoes not overvalue the business.
For many investors, it is preferable to achieve a return ofX while associating with people whom the investorstrongly likes and admires, than realize 110% of X byexchanging these relationships for uninteresting orunpleasant ones.
-
160

Classic Investment Readings: Warren E. Buffett (cont.)
The less the prudence with which others conduct theiraffairs, the greater the prudence with which the investorshould conduct his or her own affairs.
An investor should ordinarily hold a small piece of anoutstanding business with the same tenacity that anowner would exhibit if he or she owned all of thatbusiness.
A policy of portfolio concentration may well decreaserisk if it raises, as it should, both the intensity with whichan investor thinks about a business and the comfort levelhe or she must feel about its economic characteristicsbefore buying into it.
The goal should be to find an outstanding business at asensible price, not a mediocre business at a bargain price.
The best business to own is one that over an extendedperiod can employ large amounts of incremental capitalat very high rates of return. The worst business to own isone that must, or will, do the opposite — that is,consistently employ ever-greater amounts of capital atvery low rates of return.
Asset-heavy businesses generally earn low rates ofreturn — rates that often barely provide enough capitalto fund the inflationary needs of the existing business,with nothing left over for real growth, for distribution toowners, or for acquisition of new businesses. Adisproportionate number of great business fortunes builtup during the inflationary years arose from ownership ofoperations that combined significant intangible assets oflasting value with relatively minor requirements fortangible assets.
The investor should focus on businesses he or sheunderstands. That means they must be relatively simpleand stable in character. The investor should favorbusinesses and industries unlikely to experience majorchange. The investor should search for operations that heor she believes are virtually certain to possess enormouscompetitive strength 10 or 20 years from now.
An investor can pay too much for even the best ofbusinesses. The overpayment risk surfaces periodicallyand may at times be quite high for the purchasers ofvirtually all stocks. Investors making purchases in anoverheated market need to recognize that it may oftentake an extended period for the value of even anoutstanding company to catch up with the price theypaid.
The investor does not have to be an expert on everycompany, or even many. What is important is the abilityto evaluate companies within the investor’s circle ofcompetence. The size of that circle is not very important;knowing boundaries, however, is vital.
The investor’s goal should simply be to purchase, at arational price, a part interest in an easily-understandablebusiness whose earnings are virtually certain to bematerially higher five, ten, and twenty years from now.
Stockholders as a whole and over the long term mustinevitably underperform the companies they ownbecause of the heavy transaction and investmentmanagement costs they bear. If American business, inaggregate, earns about 12% on equity annually, investorsusually end up earning significantly less.
Investors should seek to hold shares in companies whoseoperations they understand, time horizons they share,and successes and failures they measure as they measurethemselves.
In selecting an investment, an investor should adopt thesame attitude one might find appropriate in looking for aspouse: it pays to be active, interested, and open-minded,but it does not pay to be in a hurry.
In investing, just as in baseball, to put runs on thescoreboard one must watch the playing field, not thescoreboard.
Tax-paying investors will realize a greater sum from asingle investment that compounds internally at a givenrate than from a succession of separately realizedinvestments compounding at the same rate.
Copyright © 1997 by Lawrence A. Cunningham. Used bypermission from Lawrence A. Cunningham.
To order The Essays of Warren Buffett, contact ProfessorLawrence A. Cunningham: (i) by email at [email protected];(ii) by mail at Cardozo Law School, 55 Fifth Avenue, New York,NY 10003; (iii) by telephone at 212-790-0435; or (iv) by Internetat www.Amazon.com.
-
161
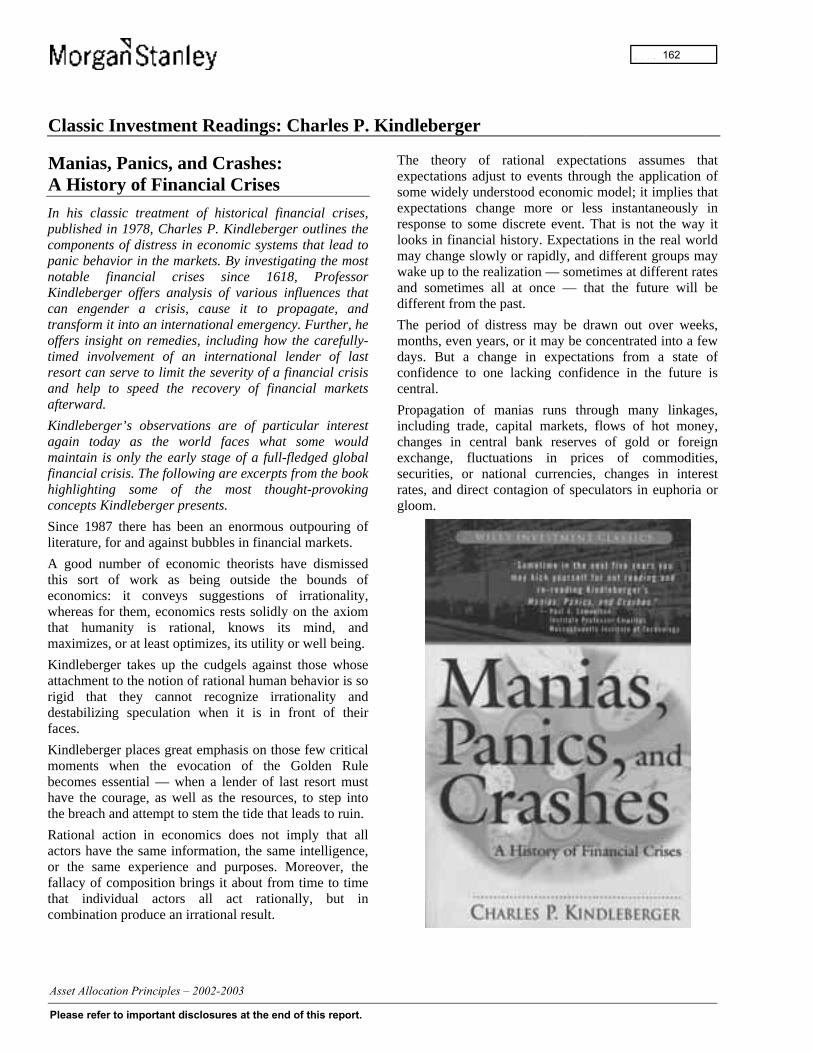
Classic Investment Readings: Charles P. Kindleberger
Manias, Panics, and Crashes:A History of Financial CrisesIn his classic treatment of historical financial crises,published in 1978, Charles P. Kindleberger outlines thecomponents of distress in economic systems that lead topanic behavior in the markets. By investigating the mostnotable financial crises since 1618, ProfessorKindleberger offers analysis of various influences thatcan engender a crisis, cause it to propagate, andtransform it into an international emergency. Further, heoffers insight on remedies, including how the carefully-timed involvement of an international lender of lastresort can serve to limit the severity of a financial crisisand help to speed the recovery of financial marketsafterward.
Kindleberger’s observations are of particular interestagain today as the world faces what some wouldmaintain is only the early stage of a full-fledged globalfinancial crisis. The following are excerpts from the bookhighlighting some of the most thought-provokingconcepts Kindleberger presents.
Since 1987 there has been an enormous outpouring ofliterature, for and against bubbles in financial markets.
A good number of economic theorists have dismissedthis sort of work as being outside the bounds ofeconomics: it conveys suggestions of irrationality,whereas for them, economics rests solidly on the axiomthat humanity is rational, knows its mind, andmaximizes, or at least optimizes, its utility or well being.
Kindleberger takes up the cudgels against those whoseattachment to the notion of rational human behavior is sorigid that they cannot recognize irrationality anddestabilizing speculation when it is in front of theirfaces.
Kindleberger places great emphasis on those few criticalmoments when the evocation of the Golden Rulebecomes essential — when a lender of last resort musthave the courage, as well as the resources, to step intothe breach and attempt to stem the tide that leads to ruin.
Rational action in economics does not imply that allactors have the same information, the same intelligence,or the same experience and purposes. Moreover, thefallacy of composition brings it about from time to timethat individual actors all act rationally, but incombination produce an irrational result.
The theory of rational expectations assumes thatexpectations adjust to events through the application ofsome widely understood economic model; it implies thatexpectations change more or less instantaneously inresponse to some discrete event. That is not the way itlooks in financial history. Expectations in the real worldmay change slowly or rapidly, and different groups maywake up to the realization — sometimes at different ratesand sometimes all at once — that the future will bedifferent from the past.
The period of distress may be drawn out over weeks,months, even years, or it may be concentrated into a fewdays. But a change in expectations from a state ofconfidence to one lacking confidence in the future iscentral.
Propagation of manias runs through many linkages,including trade, capital markets, flows of hot money,changes in central bank reserves of gold or foreignexchange, fluctuations in prices of commodities,securities, or national currencies, changes in interestrates, and direct contagion of speculators in euphoria orgloom.
-
162

Classic Investment Readings: Charles P. Kindleberger (cont.)
The panic feeds on itself, as did the speculation, untilone or more of three things happen: (i) prices fall so lowthat people are again tempted to move back into lessliquid assets; (ii) trading is cut off by setting limits onprice declines, shutting down exchanges, or otherwiseclosing markets; or (iii) a lender of last resort succeeds inconvincing the market that money will be made availablein sufficient volume to meet the demand for cash.
The detailed story of every banking crisis in our historyshows how much depends on the presence of one ormore outstanding individuals or entities willing toassume responsibility and leadership.
A lender of last resort should always come to the rescue,in order to prevent needless deflation, but always leave ituncertain whether rescue will arrive in time or at all, soas to instill caution in other speculators, lenders,regulators, and countries.
Boom, distress, and panic are transmitted betweennational economies through a variety of connections: (i)arbitrage in commodities or securities (and marking upor down prices in one market when they change inanother, without actually buying and selling); (ii)movements of money in various forms: specie, bankdeposits, bills of exchange, interest rates changedthrough uncovered arbitrage, cooperation amongmonetary authorities; and (iii) readily neglected purepsychology.
The dominant argument against the view that panics canbe cured by being left alone is that they almost never areleft alone. The authorities feel compelled to intervene. Inpanic after panic, crash after crash, crisis after crisis, theauthorities or some “responsible citizens” try to bring thepanic to a halt by one device or another.
It follows from the international propagation of financialcrises, from the efficacy under certain circumstances oflending in the last resort, and from the historical record,that a case can be made for an international lender of lastresort. With no world government, no world centralbank, and only weak international law, the question ofwhere last-resort lending comes from is a crucial one.The historical record suggests that it comes from theleading financial center of the world, often assisted byother countries. It suggests further that when there is nosuch lender, as in 1873, 1890, and 1931, depressionfollowing financial crisis is long and drawn out — this,in contrast to episodes when there is a lender of lastresort and the crisis passes like a summer storm.
For most of the financial crises covered from 1720 to1988, both national and international, a lender of lastresort did swing into action in response to the pressuresof the market, though often protesting all the way. Therole was not always dispatched with efficiency, so that arefined analysis would categorize the aftermath of crisesnot only by the presence or absence of a lender of lastresort, but also by how well the role was discharged.Second, the aftermath of a depression depends not juston how the crisis was handled, but on a host of othervariables, especially the factors affecting long-terminvestment: (i) population growth; (ii) the existence of afrontier; (iii) demands arising from military conflict; (iv)exports; (v) the presence or absence of innovations thatare or are not fully exploited, and the like.
Despite these difficulties, Kindleberger is prepared tomake the case, tentatively, that a lender of last resortdoes shorten the business depression that followsfinancial crisis. The evidence turns mainly on 1720,1873, 1882 in France, 1890, 1921, and 1929. In none ofthese was a lender of last resort effectively present. Thedepressions that followed them were much longer anddeeper than others.
This by no means constitutes a conclusive demonstrationthat intervention of a lender of last resort in a panicsoftens the depression that follows. Too many otherfactors are at work, both long- and short-term, and theoccasions when a panic has been allowed to run itscourse are so few that the material is not abundantenough for strong conclusions. At most there remains apresumption, but not a strong one, that halting acumulative deflation helps shorten the depression thatfollows.
A wider claim is made for lenders of last resort: that theymake it possible to avoid financial crises altogether. Therecord shows that financial crises were less frequent inBritain after 1866 and in the United States after 1929. Inaddition, the record can be interpreted to reveal that theywere less terrifying.
The existence of a lender of last resort, while it mayexacerbate speculation, calms anxieties when speculationoccurs.
Copyright © 1978, 1989, 1996 by Charles P. Kindleberger.Used by permission from John Wiley & Sons, Inc.
-
163

Classic Investment Readings: Peter L. Bernstein
Capital IdeasThe revolutionary financial innovations described in PeterBernstein’s book help investors deal with uncertainty. Theyprovide benchmarks for determining whether expectationsare realistic or fanciful, and whether risks make sense orare imprudent. They establish norms for determining howwell a market is accommodating the needs of itsparticipants. They have reformulated such familiarconcepts as risk, return, diversification, insurance, anddebt. Moreover, these innovations have quantified theseconcepts and have suggested new ways of employing themand combining them for optimal results. Although many ofthe individuals described in Capital Ideas may not be widelyknown among the investing public, their profound insightsnow touch virtually every decision that investors make.
The accompanying paragraphs profile several of theindividuals whose insights have shaped financial marketsand ways of thinking about markets. Harry Markowitzexpounded the wisdom of optimizing the trade-off betweenrisk and return, and William Sharpe showed how toaccomplish this task. Franco Modigliani and Merton Milleremphasized the critical role played by arbitrage indetermining the value of securities. Paul Samuelson andEugene Fama advised investors that, in an unpredictablemarket, they had better not venture forth unprepared.
Today’s financial markets reflect the effects of thinking thatbegan and/or was rediscovered in the 1970s, in academiarather than in the financial industry. These theories, andtheir practical applications, are based on two basic laws ofeconomics: (i) there can be no reward without risk; and (ii)gaining an advantage over skilled and knowledgeablecompetitors in a free market is extraordinarily difficult. Thedaily movements of security prices reveal how confidentinvestors are in their expectations, what time horizons theyenvisage, and what hopes and fears they are communicatingto one another.
The French economist, Louis Bachelier, completed the firsteffort to employ theory, including mathematical techniques,to explain why the stock market behaves as it does.Bachelier postulated that the probability of a rise in price atany moment is the same as the probability of a fall in price,because the price considered most likely by the market isthe true current price: if the market judged otherwise, itwould quote not this price, but another price, higher orlower. The Efficient Market Hypothesis is based on thenotion that stock prices reflect all available informationabout individual companies and about the economy as awhole. The Efficient Market Hypothesis draws upon thework of Bachelier, for it assumes that information is sorapidly reflected in stock prices that no single investor canconsistently know more than the market as a whole knows.Investors who opt for a buy-and-hold strategy say that all
they can forecast is that stocks represent a good investmentover the long run. No one investor can win if all investorsreceive all the necessary information, understand itcompletely, and act on it at once. Profitable trading dependson imperfections, which develop only when other investorseither are slower to receive information, draw erroneousconclusions from it, or delay acting on it.
In a short paper titled “Portfolio Selection,” published inthe March 1952 issue of the Journal of Finance, HarryMarkowitz set forth one of the most famous insights inmodern finance and investment. Markowitz stated thatinvestors cannot hope to earn high returns unless they arewilling to accept the risk involved, risk being defined asfacing the possibility of losing as well as the possibility ofwinning. Markowitz also posited that diversificationdepends more on the way individual assets perform relativeto one another than it does on how many assets the investorowns. The portfolio that conforms to Markowitz’s rule andthat he commends to the investor is a so-called efficientportfolio. It is a portfolio that offers the highest expectedreturn for any given degree of risk, or that has the lowestdegree of risk for any given expected return.
-
164
Classic Investment Readings: Peter L. Bernstein (cont.)
Markowitz’s other highly original contribution was hisinsistence on distinguishing between the riskiness of anindividual stock and the riskiness of an entire portfolio. Theriskiness of a portfolio depends on the covariance of itsholdings, not on the average riskiness of the separateinvestments. A combination of very risky holdings may stillcomprise a low-risk portfolio so long as they do not movein lockstep with one another — that is, so long as they havelow covariance. Investors face the difficult challenge ofmaking reliable estimates of variability for each individualsecurity. They also have to estimate the expected return foreach individual security, a challenging task under anycircumstances. These two challenges pale in comparisonwith the task of determining how each of the manysecurities under consideration will vary in relation to everyone of the others. Harry Markowitz aims for a precision inthe specification of both motives and of expectations whichit seems unlikely that most investors can reasonably beexpected to possess or express coherently.
James Tobin’s powerful contribution to portfolio theorywas a fortuitous outgrowth of his concerns over economicpolicy and the ravages caused by depressions andinflations. Tobin’s Separation Theorem rejects theconventional method of designing a separate portfoliospecifically for each investor. Rather, Tobin prescribesidentical equity portfolios for all investors, regardless ofobjective or risk aversion. Tobin’s work enables theinvestor to identify the single portfolio of risky securitieson Markowitz’s efficient frontier that dominates all theother possible combinations of efficient portfolios. Despitethe advance that Tobin’s innovation made possible, it didnothing to ease the daunting task of performing thethousands, if not millions, of calculations prescribed byMarkowitz. Tobin helped the investor to make the strategicchoice from the efficient frontier, but that did nothing tomake defining the frontier any easier.
William Sharpe developed an effective method forovercoming the calculational difficulties inherent in theday-to-day application of Markowitz’s theories ofdiversification and efficient portfolios. Sharpe’s majorbreakthrough came in 1964, with what is known as theCapital Asset Pricing Model. CAPM combines so manystrands of theoretical innovation that it remains thekeystone in investment theory, theories of market behavior,and the allocation of capital in both private and publicenterprises. The major characteristic of Sharpe’s model isthe assumption that the returns of various securities arerelated only through common relationships with some basicunderlying factor. There is no doubt that individual stocksrespond most directly to the stock market as a whole. Theunique price variability characteristics of a stock itself tendto disappear when as few as a dozen individual stocks arecombined into a portfolio. Then, diversification effectsoverpower the individual attributes of the stocks, and more
than 90 percent of the portfolio’s variability is explained bythe broad market index. The primary role of the CapitalAsset Pricing Model (CAPM) is to predict expected returns,or to place a valuation on risky assets. The expected returnscome in three parts. First, a stock should be expected toearn at least as much as the risk-free rate of interestavailable on Treasury bills. Second, as stocks are a riskyasset, the market as a whole should actually earn a premiumover the risk-free rate. Third, an individual stock’s beta —its volatility relative to the portfolio’s volatility — will thendetermine how much higher or lower the expected returnsof that stock will be relative to what investors expect fromthe market as a whole.
Sharpe also pointed out that the market never explains 100percent — and often no more than 30 percent — of astock’s performance. A stock reflects the uniquecharacteristics of the company that issues it, the industry inwhich the company operates, and whether the stock isowned primarily by institutions or by individuals. Sharpedefines unsystematic risk as that part of an asset’svariability that is independent of what happens in themarket. Sharpe insisted that unsystematic risk has little orno impact on the value of a stock. Sharpe’s system ofanalyzing the correlation between the behavior of aportfolio and the behavior of the market as a whole, revealsa lot about how portfolio managers are doing their job. Itprovides a measure of how much risk they are taking withtheir clients’ money and reveals whether their results areconsistent with that risk. The track record of somemanagers who looked like winners at first glance mightturn out to be just the consequence of their concentrating inrisky stocks in a bull market.
Paul Samuelson, considered one of the greatest economistsof the modern era, places great emphasis on the importanceof information. No investor in stocks, no buyer ofcommodities for future delivery, and no lender or borrowercan possibly arrive at a decision without information ofsome kind. Samuelson has explored how human behaviorshapes expectations and how expectations shapespeculative prices. Most human beings have stable, well-defined preferences, and they make rational choicesconsistent with those preferences. Rational expectationstheory assumes that investors take a view of the future thatis thoughtful rather than visceral, even if not necessarilyaccurate. Samuelson has also devoted intellectual effort todistinguishing between the difficulty of predicting theprices of individual securities, and the difficulty ofpredicting the behavior of entire markets.
Eugene Fama aimed at consolidating what was knownabout the behavior of stock prices into a comprehensivetheory to explain why prices appear to fluctuate randomly.The idea that most investors are likely to do no better thanaverage, even when armed with the best information, and
-
165
Classic Investment Readings: Peter L. Bernstein (cont.)
are likely to do worse than average without the bestinformation, was what made professional investors soantagonistic to the academic theories. In Fama’s writings,an efficient market is not necessarily a rational market, noris the information it reflects always accurate. In theirenthusiasm, or in their collective gloom, investorssometimes end up agreeing among themselves that certainstocks are somehow worth far more, or far less, than theirintrinsic values. Although reality will ultimately assertitself, an efficient market is one in which no single investorhas much chance, beyond luck, of consistently outguessingall the other participants.Apparently the most rigorous, and also the most influential,method for determining intrinsic value was published in1938 by John Burr Williams. His contribution to financialthinking, the Dividend Discount Model, defines intrinsicvalue as that value justified by earnings and dividends,discounted back to the present at an appropriate interestrate. Williams also questioned why a rational investorwould buy a stock in the first place. According to Williams,the investor expects the stock to rise in price, but that isonly a hope. For the price to rise, other investors mustchange their minds about the value of the stock and bid upits price, and there is no guarantee that they will perceivethe stock any differently from the investor who is stillconsidering whether or not to buy it.Merton Miller and Franco Modigliani studied how acorporation should select securities to issue, to arrive at anoptimal balance between debt and equity — the claims ofcreditors versus the claims of stockholders. Investors arecontinually making judgments about the streams of incomethey expect corporations to produce over time for theirowners and creditors, judgments about the uncertaintysurrounding those future income streams, and judgmentsabout the relative riskiness and relative earning power ofeach corporation relative to other corporations. Althoughthe owners of a company that borrows money are in ariskier position than the owners of a debt-free company, thevalue of that company’s bonds and stock, taken as atotality, still depends on the company's overall expectedearning power and the basic risks the company faces.Followed to its ultimate conclusion, the Modigliani-Millertheorem says that the value of the corporation will be thesame whether the corporation pays a big dividend, a smalldividend, or no dividend at all.Jack Treynor refers to the anticipated spread between riskyand risk-free returns as the “risk premium.” Treynor’scontribution to the theory of finance was to devise a methodfor predicting the risk premium and to demonstrate itsoverarching importance in the behavior of capital marketsas well as in portfolio selection. The investor’s option tohold assets in cash, or, to be more precise, in a liquid assetlike Treasury bills that provides a return known withcertainty in advance, is critically important. With the choice
of a risk-free asset always available to them, investors willbuy risky assets only if they can expect a return greater thanthe risk-free return. Stephen Ross developed an interestingextension of CAPM in 1976, in a concept known asArbitrage Pricing Theory. APT differs from CAPM inimportant ways. CAPM specifies where asset prices willsettle, given investor preferences for trading off risk forexpected returns, but it is silent about what produces thereturns that investors expect. It also identifies only onefactor as the dominant influence on stock returns. APT fillsthose gaps by providing a method to measure how stockprices will respond to changes in the multitude of economicfactors that influence them, such as inflation, interest ratepatterns, changing perceptions of risk, and economicgrowth. Through the use of arbitrage, APT also providesinvestors with strategies for betting on their forecasts of thefactors that shape stock returns. Finally, the construction ofAPT enables it to avoid the rigid and often unrealisticassumptions required by CAPM.Barr Rosenberg delved into what determines a manager’sresidual returns, defined as returns that vary from whatCAPM predicts. Many analysts had assumed that residualreturns were either the result of noise and random forces, orthe result of an active decisions by the manager to composea portfolio that differed from the market. Rosenberg sensedthat what appeared to be random was not necessarilyrandom. Rosenberg put forth the idea that the risk ofowning a stock must be related to more than just thebehavior of the stock’s price. In the end, risk and stockprice behavior will reflect such fundamental aspects of thecompany as its industry, its size, its financial condition, itscost structure, the diversification of its customer group, andits record of growth.Arguably one of the first pure index funds was set up byJames Vertin in 1973 at Wells Fargo as a commingled fund,open to any and all trust accounts. The fund would track theperformance of the 500 stocks of Standard & Poor’sComposite Index, which then accounted for about 65percent of the total marketable equity market in the UnitedStates. His colleague, William Fouse, designed anotherproduct that has become increasingly important: tacticalasset allocation, a method of calculating separately theexpected returns for the stock market, the bond market, andthe markets for cash equivalents such as Treasury bills.Investors’ assets are shifted to the market or markets thatappear relatively most attractive. Tactical asset allocationdiffers from so-called market timing in two ways. First, it isa scientific method of allocating assets. Second, the idea isto buy undervalued assets and to sell overvalued assets andto wait until the market corrects the perceivedmisvaluations.Copyright © 1992 by Peter L. Bernstein.Published by Simon and Schuster, Inc.
-
166

Classic Investment Readings: Edwin LeFèvre
Reminiscences of a Stock OperatorWhile never personally involved in the markets, EdwinLeFèvre, a journalist, columnist, novelist, and short-story writer, spent several weeks interviewing JesseLivermore, a Wall Street trader. As a result of thoseinterviews, LeFèvre crafted a true classic — a book that,because of its unique content or expository style, remainswidely read and has been appreciated generations afterits publication. Originally published in serialized form inthe Saturday Evening Post before being published inbook form in 1923, Reminiscences of a Stock Operator isfilled with observational gems about the markets andtrading. Investors who can absorb and follow the lessonsspread throughout Reminiscences can enhance theirinsights as traders. Some investors have even found thatthe book has more to teach them about themselves andother investors than years of experience in the market.Reminiscences captures the details of influence in themind of a trader — the recollections of mistakes made,the lessons learned, and the insights gained — byportraying the experience and thoughts of itsprotagonist, Larry Livingstone, LeFèvre’s pseudonymfor Jesse Livermore.
I noticed that in advances as well as in declines, stockprices were apt to show certain habits. You can spot, forinstance, where the buying is only a trifle better than theselling. A battle goes on in the stock market and the tapeis your telescope. You can depend upon it seven out often cases. There is nothing new in Wall Street. Whateverhappens in the stock market today has happened beforeand will happen again.
There is always a reason for fluctuations, but the tapedoes not concern itself with the why and wherefore. Itdoes not go into explanations. The reasons for what acertain stock does today may not be known for two orthree days, or weeks, or months. Your business with thetape is now — not tomorrow. The reason can wait. Butyou must act instantly or be left. You will remember thatHollow Tube went down three points the other day whilethe rest of the market rallied sharply. That was the fact.On the following Monday you saw that the directorspassed the dividend. That was the reason. They knewwhat they were going to do, and even if they did not sell
the stock themselves they at least did not buy it. Therewas no inside buying; no reason why it should not break.
I always made money when I was sure I was right beforeI began. What beat me was not having brains enough tostick to my own game that is, to play the market onlywhen I was satisfied that precedents favored my play.There is the plain fool, who does the wrong thing at allthe wrong times everywhere, but there is the Wall Streetfool, who thinks he must trade all the time.
The desire for constant action irrespective of underlyingconditions is responsible for many losses in Wall Street,even among the professionals. A stock operator has tofight a lot of expensive enemies within himself.
-
167

Classic Investment Readings: Edwin LeFèvre (cont.)
They say there are two sides to everything. But there isonly one side to the stock market; and it is not the bullside or the bear side, but the right side. My losses havetaught me that I must not begin to advance until I amsure I shall not have to retreat. But if I cannot advance Ido not move at all. A man must believe in himself and hisjudgement if he expects to make a living at this game.
If a stock does not act right, do not touch it; because,being unable to tell precisely what is wrong, you cannottell which way it is going. No diagnosis, no prognosis.No prognosis, no profit. But not even a world war cankeep the stock market from being a bull market whenconditions are bullish, or a bear market when conditionsare bearish. And all a man needs to know to make moneyis to appraise conditions.
The big money was not in the individual fluctuations butin the main movements that is, not in reading the tapebut in sizing up the entire market and its trend. Afterspending many years in Wall Street and after making andlosing millions of dollars I want to tell you this: It neverwas my thinking that made the big money for me. It wasalways my sitting. Men who can both be right and sittight are uncommon. I found it one of the hardest thingsto learn. But it is only after a stock operator has firmlygrasped this that he can make big money. It is literallytrue that millions come easier to a trader after he knowshow to trade than hundreds did in the days of hisignorance.
Disregarding the big swing and trying to jump in and outwas fatal to me. Nobody can catch all the fluctuations. Ina bull market your game is to buy and hold until youbelieve that the bull market is near its end. To do thisyou must study general conditions and not tips or specialfactors affecting individual stocks. Then get out of allyour stocks; get out for keeps! Without faith in his ownjudgement no man can go very far in this game. It is thebig swing that makes the big money for you.
To buy on a rising market is the most comfortable wayof buying stocks. The point is not so much to buy ascheap as possible or to go short at top prices, but to buyor sell at the right time. When I am bearish and I sell a
stock, each sale must be at a lower level than theprevious sale. When I am buying, the reverse is true. Imust buy on a rising scale. I do not buy long stock on ascale down, I buy on a scale up.
A man cannot expect the market to absorb fifty thousandshares of one stock as easily as it does one hundred. Hewill have to wait until he has a market there to take it.There comes the time when he thinks the requisitebuying power is there. When that opportunity comes hemust seize it. As a rule he will have been waiting for it.He has to sell when he can, not when he wants to. Tolearn the time, he has to watch and test. It is no trick totell when the market can take what you give it. But instarting a movement it is unwise to take on your full lineunless you are convinced that conditions are exactlyright. Remember that stocks are never too high for you tobegin buying or too low to begin selling. But after theinitial transaction, do not make a second unless the firstshows you a profit. Wait and watch.
All stock-market mistakes wound you in two tenderspots your pocketbook and your vanity. Losingmoney is the least of my troubles. A loss never bothersme after I take it. I forget it overnight. But being wrong not taking the loss that is what does the damage tothe pocketbook and to the soul.
The speculator’s chief enemies are always boring fromwithin. It is inseparable from human nature to hope andto fear. In speculation when the market goes against you,you hope that every day will be the last day and youlose more than you should had you not listened to hope to the same ally that is so potent a success-bringer toempire builders and pioneers, big and little. And whenthe market goes your way you become fearful that thenext day will take away your profit, and you get out too soon. Fear keeps you from making as much moneyas you ought to. The successful trader has to fight thesetwo deep-seated instincts. He has to reverse what youmight call his natural impulses. Instead of hoping hemust fear; instead of fearing he must hope. He must fearthat his loss may develop into a much bigger loss, andhope that his profit may become a big profit.
-
168
Classic Investment Readings: Edwin LeFèvre (cont.)
A trader, in addition to studying basic conditions,remembering market precedents and keeping in mind thepsychology of the outside public as well as thelimitations of his brokers, must also know himself andprovide against his own weaknesses. There is no need tofeel anger over being human. I have come to feel that itis as necessary to know how to read myself as to knowhow to read the tape.
You can transmit knowledge that is, your particularcollection of card-indexed facts but not yourexperience. A man may know what to do and lose money if he does not do it quickly enough.
Observation, experience, memory and mathematics these are what the successful trader must depend on. Hemust not only observe accurately but remember at alltimes what he has observed. He cannot bet on theunreasonable or on the unexpected, however strong hispersonal convictions may be about man’sunreasonableness or however certain he may feel that theunexpected happens very frequently. He must bet alwayson probabilities that is, try to anticipate them.
The appeal in all booms is always frankly to thegambling instinct aroused by cupidity and spurred by apervasive prosperity. People who look for easy moneyinvariably pay for the privilege of proving conclusivelythat it cannot be found on this sordid earth.
Speculation in stocks will never disappear. It cannot bechecked by warnings as to its dangers. You cannotprevent people from guessing wrong no matter how ableor how experienced they may be. Carefully laid planswill miscarry because the unexpected and even theunexpectable will happen. Disaster may come from aconvulsion of nature or from the weather, from your owngreed or from some man’s vanity; from fear or fromuncontrolled hope.
The speculator’s deadly enemies are: ignorance, greed,fear and hope. All the statute books in the world and allthe rules of all the exchanges on earth cannot eliminatethese from the human animal.
The experience of years as a stock operator hasconvinced me that no man can consistently andcontinuously beat the stock market though he may makemoney in individual stocks on certain occasions. Nomatter how experienced a trader is, the possibility of hismaking losing plays is always present. Wall Streetprofessionals know that acting on “inside” tips will breaka man more quickly than famine, pestilence, cropfailures, political readjustments, or what might be callednormal accidents. There is no asphalt boulevard tosuccess in Wall Street or anywhere else.
Copyright © 1993, 1994 by Expert Trading, Ltd. Forward© 1994 by John Wiley & Sons, Inc. Originally published in1923 by George H. Doran and Co. Used by permissionfrom John Wiley & Sons, Inc.
-
169
Classic Investment Readings: Charles Mackay
Extraordinary Popular Delusionsand the Madness of Crowds
Extraordinary Popular Delusions and the Madness ofCrowds by Charles Mackay was originally published in1841 under the title Memoirs of Extraordinary PopularDelusions. The tales told in this volume cover events thathappened about three hundred years ago, but the accountssound like only yesterday, or maybe even today. Thatexplains why this book has held the attention of investorsfor so long — the more things change, the more they seemto stay the same. Most features of market behavior todayare little different from market behavior in the seventeenthcentury. Delusions was the favorite book of well-knownAmerican Financier Bernard Baruch and, by mostaccounts, Mackay’s lessons helped Baruch preserve hisimmense wealth through the crash of 1929. AlthoughMackay’s research and some of his anecdotal evidencehave been questioned, no amount of scholarly debunkingis likely to extinguish the fondness of investors forExtraordinary Popular Delusions. As long as people stakemoney on their ability to outsmart the majority opinion,they will cherish the thought that the majority periodicallybecomes deranged.
Money Mania: The Mississippi Scheme
The personal character and career of one man are sointimately connected with the great scheme of the years1719 and 1720 that a history of the Mississippi madnesscan have no fitter introduction than a sketch of the life of itsgreat author, John Law. Born in Edinburgh in the year1671, John Law was neither a knave nor a madman, but onemore deceived than deceiving, more sinned against thansinning. He was thoroughly acquainted with the philosophyand true principles of credit. He understood the monetaryquestion better than any man of his day; and if his systemfell with a crash so tremendous, it was not so much his faultas that of the people amongst whom he had erected it.
On the 5th of May, 1716, a royal edict was published, bywhich Law was authorized, in conjunction with hisbrother, to establish a bank under the name of Law andCompany, the notes of which should be received inpayment of the taxes. His many years of studying finance
and trade guided him in the management of his bank. Hemade all his notes payable at sight, in the coin current atthe time they were issued. This last was a masterstroke ofpolicy, and immediately rendered his notes more valuablethan the government notes backed by precious metals. Thelatter were constantly liable to depreciation by the unwisetampering of the government. A thousand livres of silvermight be worth their nominal value one day, and reducedto one-sixth the next, but a note of Law’s bank retained itsoriginal value. In the course of a year, Law’s notes rose toa fifteen per cent premium, while the billets d’etat, ornotes issued by the government as security for the debtscontracted by the extravagant Louis XIV, were at adiscount of no less than seventy-eight and a half per cent.The comparison was too great in favour of Law not toattract the attention of the whole kingdom, and his creditextended itself day by day.
Law then commenced the famous project which handed hisname down to posterity. He proposed to the regent toestablish a company that should have the exclusiveprivilege of trading to the great river Mississippi and theprovince of Louisiana. The country was supposed toabound in precious metals, and the company would besupported by the profits of their exclusive commerce. Thefrenzy of speculating began to seize upon the nation, asLaw’s bank had effected so much good, that any promisesfor the future which he made were readily believed. Amidthe intoxication of success, both Law and the regent forgotthe maxim Law had so loudly proclaimed before, that abanker deserved death who made issues of paper withoutthe necessary funds to provide for them. The systemcontinued to flourish till the commencement of the year1720, but no sooner did the breath of popular mistrust blowsteadily upon it, than it fell to ruins, and none could raise itup again.
Without enough specie to redeem all the notes the peoplewanted to exchange, Law attempted in vain to raiseconfidence in the notes again, by depreciating the value ofcoin five, then ten per cent below paper. Payments of thebank were at the same time restricted to one hundred livresin gold, and ten in silver, but with no effect. Peoplecontinued to hoard precious metals and transport them outof the country, so in this emergency, Law hazarded the
-
170
Classic Investment Readings: Charles Mackay (cont.)
experiment of forbidding the use of specie altogether.Instead of restoring the credit of the paper, as wasintended, it destroyed it completely, and drove the countryto the very brink of revolution. The value of shares in theLouisiana, or Mississippi stock, had fallen very rapidly,and few indeed were found to believe the tales that hadonce been told of the immense wealth of that region. Lawhimself, in a moment of despair, determined to leave thecountry where his life was no longer secure.
The South-Sea Bubble
The South-Sea Company was originated by the celebratedHarley, Earl of Oxford, in the year 1711, with the view ofrestoring the public credit, which had suffered by thedismissal of the Whig ministry, and of providing for thedischarge of the army and navy debentures, and other partsof the floating debt. A company of merchants took thisdebt upon themselves, and the government agreed tosecure them for a certain period the interest of six per cent.To provide for this interest, the duties upon wines,vinegar, India goods, wrought silks, tobacco, whale-fins,and some other articles, were rendered permanent. Themonopoly of the trade to the South Sea was granted, andthe company, being incorporated by an act of parliament,assumed the title by which it has ever since been known.Even at this early period of its history, the most visionaryideas were formed by the company and the public of theimmense riches of the eastern coast of South America.Everybody had heard of the gold and silver mines of Peruand Mexico; everyone believed them to be inexhaustible,and that it was only necessary to send the manufacturers ofEngland to the coast to be repaid a hundredfold in goldand silver ingots by the natives.
The king’s speech at the opening of the session of 1717made pointed allusion to the state of public credit, andrecommended that proper measures should be taken toreduce the national debt. The two great monetarycorporations, the South-Sea Company and the Bank ofEngland, made proposals to parliament. The name of theSouth-Sea Company was continually before the public.Though their trade with the South American Statesproduced little or no augmentation of their revenues, theycontinued to flourish as a monetary corporation. Their stock
was in high request, and the directors, buoyed up withsuccess, began to think of new means for extending theirinfluence. The Mississippi scheme of John Law, which sodazzled and captivated the French people, inspired themwith an idea that they could carry on the same game inEngland. The anticipated failure of his plans did not divertthem from their intention. Wise in their own conceit, theyimagined they could avoid his faults, carry on their schemesforever, and stretch the cord of credit to its extremesttension, without causing it to snap asunder. It was whileLaw’s plan was at its greatest height of popularity, that theSouth-Sea directors laid before parliament their famousplan for paying off the national debt, and although the Bankof England had a similarly attractive plan, parliamentresolved to use the South-Sea Company’s proposal.
The company’s stock rose with the most astonishingrapidity during the whole time that the bill in its severalstages was under discussion. Every exertion was made by
-
171
Classic Investment Readings: Charles Mackay (cont.)
the directors and their friends to raise the price of the stock.The most extravagant rumors were in circulation. Treatiesbetween England and Spain were spoken of, whereby thelatter was to grant a free trade to all her colonies. Theinordinate thirst of gain that had afflicted all ranks ofsociety was not to be slaked even in the South Sea. Otherschemes, of the most extravagant kind, were started. Theshare-lists were speedily filled up, and an enormous trafficcarried on in shares, while, of course, every means wereresorted to, to raise them to an artificial value in the market.Sensible men beheld the extraordinary infatuation of thepeople with sorrow and alarm. There were some, both inand out of parliament, who foresaw clearly the ruin that wasimpending. On the 11th of June, the day the parliamentrose, the king published a proclamation, declaring that allthese unlawful projects should be deemed public nuisances,and prosecuted accordingly.
The bubble was then full-blown, and began to quiver andshake preparatory to its bursting. The South-SeaCompany’s stock fell rapidly. Their bonds were in suchdiscredit, that a run commenced upon the most eminentgoldsmiths and bankers, some of whom, having lent outgreat sums upon South-Sea stock, were obliged to shut uptheir shops and abscond. The Bank finding they were notable to restore public confidence and stem the tide of ruinwithout running the risk of being swept away with thosethey intended to save, declined to carry out the agreementinto which they had partially entered. No sooner had thenation awakened from its golden dream, than a popularand even a parliamentary clamor demanded its victims.
Tulipomania
The tulip — so named, it is said, from a Turkish word,signifying a turban — was introduced into western Europeabout the middle of the sixteenth century. Rich people atAmsterdam sent for the bulbs direct to Constantinople,and paid the most extravagant prices for them. The firstroots planted in England were brought from Vienna in1600. Until the year 1634 the tulip annually increased inreputation, until it was deemed a proof of bad taste in anyperson of fortune to be without a collection of them. Therage for possessing them soon caught the middle classes ofsociety, and merchants and shopkeepers, even of moderatemeans, began to vie with each other in the rarity of theseflowers and the preposterous prices they paid for them.
One would suppose that there must have been some greatvirtue in this flower to have made it so valuable in the eyesof so prudent a people as the Dutch; but it has neither thebeauty nor the perfume of the rose — hardly the beauty ofthe “sweet, sweet-pea,” neither is it as enduring as either.
The demand for tulips of a rare species increased so much inthe year 1636, that regular markets for their sale wereestablished on the Stock Exchange of Amsterdam, inRotterdam, Harlaem, Leyden, Alkmar, Hoorn, and othertowns. The stock-jobbers, ever on the alert for a newspeculation, dealt largely in tulips, making use of all themeans they so well knew how to employ to causefluctuations in prices. At first, as in all these gambling mania,confidence was at its height, and everybody gained. Thetulip-jobbers speculated in the rise and fall of the tulip stocks,and made large profits by buying when prices fell, and sellingout when they rose. Many individuals grew suddenly rich. Agolden bait hung temptingly out before the people, and oneafter the other, they rushed to the tulip marts, like flies arounda honey-pot. Nobles, citizens, farmers, mechanics, sailors,livery persons, servants, even chimney-sweeps and oldclothesdealers, dabbled in tulips. People of all gradesconverted their property into cash, and invested it in flowers.Houses and lands were offered for sale at ruinously lowprices, or assigned in payment of bargains made at the tulip-mart. Foreigners became smitten with the same frenzy, andmoney poured into Holland from all directions.
At last, however, the more prudent began to see that thisfolly could not last forever. Rich people no longerbought the flowers to keep them in their gardens, but tosell them again at 100 percent profit. It was seen thatsomebody must lose fearfully in the end. As thisconviction spread, prices fell, and never rose again.Confidence was destroyed, and a universal panic seizedupon the dealers. Many who, for a brief season, hademerged from the humbler walks of life, were cast backinto their original obscurity. Substantial merchants werereduced almost to beggary, and many a representative ofa noble line saw house fortunes ruined beyondredemption. The commerce of the country suffered asevere shock from which it was many years before itrecovered.
Copyright © 1841 by Charles Mackay. Used by permissionfrom John Wiley & Sons, Inc.
-
172

Classic Investment Readings: Joseph de la Vega
Confusión de Confusiones
Whoever comes to know Joseph Penso de la Vega’sConfusión de Confusiones will recognize at once that he isconcerned with a literary oddity. Here is a book written inSpanish by a Portuguese, published in Amsterdam, cast indialogue form, embellished from start to finish with biblical,historical, and mythological allusions, and yet concernedprimarily with the business of the stock exchange as early as1688, when Confusión de Confusiones was first issued.
De la Vega makes the reader acquainted not only with thehistory of speculation on the exchange, but also with thevarious types of speculative transactions used at that time.The security chiefly involved was the stock of the Dutch EastIndia Company, an enterprise that had been launched in1602 and that had prospered handsomely. Each share ofstock of the East India Company had a market value at thattime of more than 17,000 guilders.
In seventeenth-century Amsterdam, speculators thought interms of the difference between an agreed price for stock,and what would be the prevailing value at the stipulated timeof transaction. Perhaps this approach combined with thehigh unit value encouraged the development of devices forspeculation.
For students of economic and business history, the volumehas been of signal value. No other book deals as extensivelyas this one with the trading in stocks at Amsterdam, andnowhere else in the world of the seventeenth century wasthere so mature a business of this sort as existed then atAmsterdam. Through a perusal of de la Vega’s book, onelearns how rapidly the trading in stocks becamesophisticated.
First Dialogue:Beginnings of the Stock Exchange
In the first dialogue, I deal with the beginnings and theetymology of the stock exchange, with the wealth of theCompany, the considerable extension of the speculation, andthe meaning of the premium business, while I make someallusion to the swindling maneuvers.
PHILOSOPHER: And what kind of business is this aboutwhich I have often heard people talk but which I neitherunderstand nor have ever made efforts to comprehend?
SHAREHOLDER: I really must say that you are an ignorantperson, friend Greybeard, if you know nothing of thisenigmatic business which is at once the fairest and mostdeceitful in Europe, the noblest and the most infamous in theworld, the finest and the most vulgar on earth. It is aquintessence of academic learning and a paragon of
fraudulence; it is a touchstone for the intelligent and atombstone for the audacious, a treasury of usefulness and asource of disaster. The best and most agreeable aspect of thenew business is that one can become rich without risk.
SHAREHOLDER: In 1602 a few Dutch merchants founded acompany. The wealthiest people [in the country] took aninterest in it, and a total capital of sixty-four and a third tons ofgold was raised. Several ships were built and in 1604 were sentout to seek adventure Quixote-like in the East Indies. Theirsuccessful voyages, their victorious conquests, and the richreturn cargoes meant that Caesar’s veni, vidi, vici wassurpassed and that a tidy profit was made, which became astimulus to further undertakings. The first distribution of theprofit was postponed till 1612 in order to increase theCompany’s capital. Then the administration distributed 57.5per cent, while in 1613 the dividends amounted to 42.5 percent, so that the shareholders, after having had their capitalpaid back to them, could enjoy any further return as so muchvelvet.
PHILOSOPHER: I think I have fully grasped the meaning ofthe Company, its shares, its principles, its reputation, itssplendor, its initiation, its progress, its administration, thedistribution of profits, and its stability.
SHAREHOLDER: Every year the financial lords and the bigcapitalists enjoy the dividends from the shares that they haveinherited or have bought with money of their own. They do notcare about movements in the price of the stock. Since theirinterest lies not in the sale of the stock but in the revenuessecured through the dividends, the higher value of the sharesforms only and imaginary enjoyment for them, arising fromthe reflection that they could in truth obtain a high price if theywere to sell their shares.
A second class of participants is formed by merchants whobuy a share on expectations of favourable news from India or apeace treaty in Europe. They sell these shares when theiranticipations come true and the price rises.
Gamblers and Speculators belong to a third class who have putup wheels of fortune. Some who are in difficulties try to freethemselves through the following argument: the buyer is notobligated to pay for that which is bought if he loses in thepurchase. Such operations take place in the deep anddangerous waters of the stock exchange, where the swimmerscalculate that if the water is reaching up to their necks, theycan at best only save their lives. [And the most amusing] thingis that, sometimes before six months have passed, those
-
173
Classic Investment Readings: Joseph de la Vega (cont.)
persons whose money was taken away from them make dealsagain with those involved in their former business transactions.
PHILOSOPHER: I cannot deny that, in spite of my naturalinclination, I would try my fortune [on the exchange] if threegreat obstacles did not prevent me. First obstacle: I questionwhether I should go on board such an endangered ship, towhich every wind means a storm and every wave a shipwreck.Second obstacle: With my limited capital, I could win only if I[were willing to] renounce my reputation frivolously. But tofeel degraded without being compensated by wealth, such athought is vain and insane. Third obstacle: Preoccupation withthis business seems to me unworthy of a philosopher; sinceeveryone knows the humble character of my surroundings,there would be nobody to give me credit and to haveconfidence in my beard.
SHAREHOLDER: Even without going into technicalities, Ican overcome your doubts. The first danger is removed,because [I can tell you that] there are ropes which secure thevessel against shipwreck and anchors which resist the storm.Give “opsies,” or premiums, and there will be only limited riskto you, while the gain may surpass all your imaginings, andhopes. In the light of these precautionary measures, the secondobjection becomes void. The third drawback, namely, that it isnot proper for a philosopher to speculate, must not concernyou, for the exchange resembles the Egyptian temples whereevery species of animal was worshipped.
Footnote to opsies above: The Dutch call the option business“opsies,” a term derived from the Latin word optio, whichmeans choice, because the payer of the premium has thechoice of delivering the shares to the acceptor of the premiumor of demanding them from him or her.
Second Dialogue: Instability of Prices
In the second dialogue, I explain to you the instability of pricesand the reasons therefore, give advice for a successfulspeculation, point out the causes of the ups and downs, talkabout the fears of the bears and the courageous attitude of thebulls.
SHAREHOLDER: Take note and realize that there are threecauses of a rise in the prices on the exchange and three of afall: the conditions in India, European politics, and opinion onthe stock exchange itself. For this last reason, the news [assuch] is often of little value, since counteracting forces [may]operate in the opposite direction.
MERCHANT: People who get involved in this swindle seemto contain in their bodies an inner light that advises them. [Byyour account] these stock-exchange people are quite silly, fullof instability, insanity, pride and foolishness. They will sellwithout knowing the motive; they will buy without reason.
SHAREHOLDER: They are very clever in inventing reasonsfor a rise in the price of the shares on occasion when there is adeclining tendency, or for a fall in the midst of a boom. It isparticularly worth remarking that in this gambling hell thereare two classes of speculators. The first class consists of thebulls. The second faction consists of the bears. The bulls arelike the giraffe which is scared by nothing. They love
everything, they praise everything, they exaggerate everything.They are not impressed by a fire or disturbed by a debacle. Thebears, on the contrary, are completely ruled by fear,trepidation, and nervousness. Rabbits become elephants,brawls in a tavern become rebellions, faint shadows appear tothem as signs of chaos.
-
174
Classic Investment Readings: Joseph de la Vega (cont.)
SHAREHOLDER: The fall of prices need not have a limit,and there are also unlimited possibilities for the rise. Thereforethe excessively high values need not alarm you.
PHILOSOPHER: It is considered particularly wise to talk tothe purchasers and to converse with the sellers, to weighopinions and reasons, and to take the most advantageouscourse after these efforts.
SHAREHOLDER: While philosophy teaches that differenteffects are ascribable to different causes, at the stock exchangesome buy and some sell on the basis of a given piece of news,so that here one cause has different effects. [Given thesituation, I suppose that I should not be] surprised that somespeculators consider a certain piece of news favorable, othersunfavorable. Facts are changed by emotions, and they appearto each person in a different light.
Third Dialogue: Transactions and Business Practices
In the third dialogue, I explain to you various transactions, toteach you some of the rules [of the game], and to clarify someof the business practices. I talk about the equity of thecontracts, the time of delivery, the place of the transference ofthe shares, the delay in the settlement of the accounts, and thevarieties of brokers, their conscientiousness, their risks, andtheir temerity.
SHAREHOLDER: Honesty, cooperation, and accuracy areadmirable and surprising. But to make payments forobligations which according to the Exchange usances do notexist, when your credit is not endangered and your reputationnot likely to suffer — that is not liberality, but insanity; it is notpunctuality, but prodigality; not courage, but the foolishness ofDon Quixote. [I would also remark that] a 20 per cent drop inthe stock prices is not large enough to be considered a seriousblow. You do not have to despair and to bemoan your fate, for,as the price may drop twenty per cent overnight, it may alsorise fifty per cent in the same period.
SHAREHOLDER: What is hardly believable (because itseems to be complete fancy rather than over-exaggeration) isthe fact that the speculator fights his own good sense, strugglesagainst his own will, counteracts his own hope, acts against hisown comfort, and is at odds with his own decisions.
SHAREHOLDER: Sometimes, when a decided trend prevails,it is possible to execute an order with the greatest promptness.But there are also cases where crafty people sense the directionof the investor’s purpose and inject such confusion into the
investor’s operations that the investor can execute the orderonly with [unanticipated] disadvantage and difficulty.
SHAREHOLDER: Some clerks have discovered that thespeculation in ordinary shares (which are called large or paid-up shares) was too hazardous for their slight resources. Theybegan, therefore, a less daring game in which they dealt insmall shares. For while with whole shares one could win orlose 30 gulden of Bank money for every point that the pricerose or fell, with the small shares one risked only 3 gulden foreach point. This branch of trade has been increasing during thelast five years to such an extent (and mainly with a certaingroup which is as boisterous as it is quick-witted) that it isengaged in by both sexes, old men, women, and children.Therefore the means devised to reduce hazards has in factmade the dangers more widespread.
SHAREHOLDER: If one were to lead a stranger through thestreets of Amsterdam and ask him where he was, he wouldanswer, “Among speculators,” for there is no corner [in thecity] where one does not talk shares. Some gamble for the funof it, some for vanity, many are spendthrifts, many findsatisfaction in their occupation, and quite a few [just] make aliving [at the stock exchange].
Fourth Dialogue: Speculation on the Exchange
In the fourth dialogue I describe the most speculative part ofthe business, the climax of the Exchange transactions, theacme of Exchange operations, the craftiest and mostcomplicated machinations which exist in the maze of theExchange and which require the greatest possible cunning.
SHAREHOLDER: Only a description of the most speculativepart of the business is now left to me, the climax of theExchange transactions. Some 10 or 12 persons get together atthe Exchange and form a ring. When this ring thinks itadvisable to sell shares, the means for prudently carrying outthis purpose are given much thought. The members initiateaction only when they can foresee its result, so that, apart fromunlucky incidents, they can reckon on a rather sure success.
The following are twelve “tricks” of the bears’ ring:
SHAREHOLDER: The first trick [of the bears’ ring] is toprevent numerous extensions of the contract by which thegreat financiers buy shares for cash and sell them on term,contenting themselves with [a spread in price equivalent to]the interest on the money invested; the ring arranges sales forlater dates at the same price at which the shares are being soldfor cash; in the hope of a greater profit, they do not payattention to the loss of interest.
-
175
Classic Investment Readings: Joseph de la Vega (cont.)
Secondly, a broker in whom the syndicate has confidence isgiven the order to buy secretly a batch of shares from an[avowed] bull, without revealing his real principal. But he sellsthe very same shares with a good deal of publicity, while it isshouted out that even the bulls are making sales. As the brokerwants to sell to one bull the same shares he has bought fromanother bull, the first one sees that the story about the sales ofthe latter is true. Alarmed, the second bull sells his shares also.
Thirdly, the syndicate of the bears sells some blocks of sharesfor cash to one of the wealthy people who live on thehypothecation of stocks. As it is known that the latter [as amatter of course] sell at once for future delivery the shareswhich they have bought for cash, the syndicate bids its broker[charged with the execution of the maneuver], before thefixing of the prices [of the day], to send a message verysecretly to the agent of every business firm [represented on theExchange], a communication which will soon be an opensecret, to the effect that the great capitalist has receivedimportant news and that alarmed by it he intends to sell stocks.
Fourthly, at the beginning of a campaign, the syndicateborrows all the money available at the Exchange and makes itapparent that it wishes to buy shares with this money.Afterwards, however, large sales are executed. Thus two birdsare killed with one stone. First, the Exchange is supposed tobelieve that the original plan is altered because of importantnews; secondly, the bulls are prevented from finding moneyfor hypothecating their shares.
The fifth stratagem [of the syndicate] consists in selling thelargest possible quantity of call options in order to bringpressure on the payers of premiums to sell the stocks if theyexercise their right to call.
The sixth stratagem is to enter into as many put contracts aspossible, until the receivers of the premiums do not dare to buymore stock.
The seventh stratagem is to recognize that the bulls are in needof shares to survive the siege; and so [the bears] give themmoney. Then [the bears] sell the hypothecated shares again,and with the difference between what they receive on the salesand what they loan on the shares, they are able to engage infurther call and put operations.
The eighth trick [of the syndicate of the bears] is the following:if it is of importance to spread a piece of news which has beeninvented by the speculators themselves, they have a letterwritten and [arrange to have] the letter dropped as if by chanceat the right spot. The finder believes himself to possess atreasure, whereas he has really received a letter of Uriah whichwill lead him into ruin.
Ninthly, the syndicate encourages a friend whose judgment isesteemed, whose connections are respected, and who hasnever dealt in shares, to sell one or two lots of stock while therisk of loss is borne by the group. The notion [lying behind thismaneuver] is the belief that anything new attracts attention,and that therefore the decision of this person [to sell] willproduce astonishment and will have important consequences.
The tenth trick [of the syndicate] is to whisper into the ear ofan intimate friend (but loud enough to be heard by those wholie in wait for it) that he should sell if he wants to make money.
Eleventhly, in order to insinuate that their own concern isfounded on grave consideration and does not refer exclusivelyto the situation of the Company, the bears sell governmentobligations.
Finally, the ring practices a twelfth maneuver. In order to bewell-informed about the tendency of the market, even thebears [before launching their big operation] begin withpurchases and take all items [offered]. If the shares rise inprice, they pocket the quick profit; if the prices fall, however,they sell at a loss, content to have ascertained the weakeningtendency. Moreover, the interest which the timid public takesin their proceedings is already useful to them, since the publicthinks that conditions must be serious when the speculatorssell at a loss. This is one of the most powerful availablestratagems for influencing the wavering elements.
MERCHANT: Do the poor bulls have no means [of defense]against these maneuvers?
SHAREHOLDER: One of the neatest tricks which take placein these circles is for some of the bulls to pose as bears. This isdone for two reasons. First, because the opponents [the realbears] imagine that, if they [are able to] buy a share fromamong those held back and concealed, the other party [that ofthe bulls] has changed its ideas and, instead of building silverbridges for them, seek to drag them down. Secondly, thesespeculators resort to such a trick in order, in suddenconjunctures, to sell without producing a panic. As it is takenfor granted that these [particular] speculators undoubtedlybelong to the Contremine, the bulls rally around furiously inorder to buy the shares offered by the first group, on theassumption that they have to stand by their opinions and haveto make sacrifices for them.
Copyright © 1995 John Wiley & Sons, Inc.Used by permission.
-
176
Classic Investment Readings: Walter Bagehot
Lombard Street: A Description of theMoney Market
In London, Lombard Street runs a total length of abouttwo blocks in a southeasterly direction from the Bank ofEngland. The street derived its name from the bankersand money changers from northern Italy who came toLondon centuries ago and who were as artistic in thecreation of the instruments of finance as theircompatriots were creative with the instruments of fineart.
Walter Bagehot was born in 1826 and lived for only 51years. He came from a banking family, but writing washis passion. He was recognized as one of England’sgreatest essayists as well as one of her mostdistinguished economists, and his collected works fillfive large volumes. After succeeding his father as head ofthe family banking business, he subsequently succeededhis father-in-law as editor of The Economist magazine.His importance was so great in understanding andarticulating developments in the world of finance thatGladstone referred to him as “Permanent Chancellor ofthe Exchequer.”
Lombard Street is a compilation of articles that Bagehotwrote for The Economist during the 1850s and thatsubsequently appeared in book form in 1873.Personalities, sociology, political considerations, andanecdotes appear all through the analysis.
Bagehot’s objective in these technical perorations was tomake clear to his contemporaries that the financialsystem comprised far more than the currency issued bythe Bank of England. Bagehot invented crisismanagement; after nearly 150 years, his wise words arestill the prescription of choice for containing financialcrises, as well as a handbook for avoiding them.
I venture to call this Essay ‘Lombard Street,’ and not the‘Money Market,’ because I wish to deal with concreterealities. The briefest and truest way of describingLombard Street is to say that it is by far the greatestcombination of economical power and economicaldelicacy that the world has ever seen.
English money is ‘borrowable’ money. Our people arebolder in dealing with their money than any continentalnation, and even if they were not bolder, the mere factthat their money is deposited in a bank makes it far moreobtainable. A million in the hands of a single banker is agreat power; he can at once lend where he will, andborrowers can come to him, because they know orbelieve that he has it. But the same sum scattered in tensand fifties through a whole nation is no power at all: noone knows where to find it or whom to ask for it. A placelike Lombard Street, where in all but the rarest timesmoney can be always obtained upon good security orupon decent prospects of probable gain, is a luxurywhich no country has ever enjoyed with evencomparable equality before.
* * * * *
-
177
Classic Investment Readings: Walter Bagehot (cont.)
An individual of large wealth, however intelligent,always thinks, more or less — ‘I have a great income,and I want to keep it. If things go on as they are I shallcertainly keep it; but if they change I may not keep it.’Consequently every change of circumstance isconsidered a ‘bore,’ and is thought about as little aspossible. But a new person, who has his or her way tomake in the world, knows that such changes areopportunities; he or she is always on the lookout forthem, and always heeds them when they are found. Therough and vulgar structure of English commerce is thesecret of its life; for it contains ‘the propensity tovariation,’ which, in the social as in the animal, is theprinciple of progress. In this constant and chronicborrowing, Lombard Street is the great go-between. It isa sort of standing broker between quiet saving districts ofthe country and the active employing districts.
The objects which you see on Lombard Street, and inthat money world which is grouped about it, are theBank of England, the Private Banks, the Joint StockBanks, and the bill brokers. The distinctive function ofthe banker, says Ricardo, ‘begins as soon as he usesmoney of others;’ as long as he uses his own money he isonly a capitalist.
All London banks keep their principal reserve on depositat the Banking Department of the Bank of England. TheBank of England thus has the responsibility of takingcare of it. But those who keep immense sums with abanker gain a convenience at the expense of a danger.They are liable to lose them if the bank fails.
Any depreciation, however small — even the liability todepreciation without its reality — is enough to disorderexchange transactions. They are calculated to such anextremity of fineness that the change of a decimal maybe fatal, and may turn profit into loss. Accordingly,London has become the sole great settling-house ofexchange transactions in Europe, instead of beingformerly one of two. This foreign deposit is evidently ofdelicate and peculiar nature. It depends on the goodopinion of foreigners, and that opinion may diminish orchange into a bad opinion.
All of our credit system depends on the Bank of Englandfor its security. On the wisdom of the directors of thatJoint Stock Company, it depends whether England shallbe solvent or insolvent. This may seem too strong, but itis not. The directors of the Bank are, therefore, in fact, ifnot in name, trustees for the public, to keep a bankingreserve on their behalf; and it would naturally beexpected either that they distinctly recognized this dutyand engaged to perform it, or that their own self-interestwas so strong in the matter that no engagement wasneeded.
Three times since 1844 the Banking Department of theBank of England has received assistance, and wouldhave failed without it. But still there is a faith in theBank, contrary to experience, and despising evidence.No one in London ever dreams of questioning the creditof the Bank, and the Bank never dreams that its owncredit is in danger.
Such a reserve as we have seen is kept to meet suddenand unexpected demands. Speaking broadly, these extrademands are two kinds — one from abroad to meetforeign payments requisite to pay large and unusualforeign debts, and the other from at home to meet suddenapprehension or panic arising in any manner, rational orirrational.
The Bank of England must keep a reserve of ‘legaltender’ to be used for foreign payments if itself fit, andto be used in obtaining bullion if itself be unfit. In orderto find such great sums, the Bank of England requires thesteady use of an effectual instrument. That instrument isthe elevation of the rate of interest.
A domestic drain is very different. Such a drain arisesfrom a disturbance of credit within the country, and thedifficulty of dealing with it is greater, because it is oftencaused, or at least often enhanced, by a foreign drain.Times without number the public have been alarmedmainly because that the Banking reserve was alreadylow, and that it was daily getting lower. The twomaladies — an external drain and an internal — oftenattack the money market at once. What then ought to bedone? In opposition to what might be at first sight
-
178
Classic Investment Readings: Walter Bagehot (cont.)
supposed, the best way for the bank of banks, who havethe custody of the bank reserve to deal with a drainarising from internal discredit, is to lend freely. The firstinstinct of everyone is contrary. There being a largedemand on a fund which you want to preserve, the mostobvious way to preserve it is to hoard it — to get in asmuch as you can, and to let nothing go out which youcan help. But every banker knows that this is not the wayto diminish discredit. This discredit means, ‘an opinionthat you have not got any money,’ and to dissipate thatopinion, you must, if possible, show that you havemoney: you must employ it for public benefit in orderthat the public may know that you have it. The time foreconomy and for accumulation is before. A good bankerwill have accumulated in ordinary times the reserve he orshe is to make use of in extraordinary times.
A panic grows by what it feeds on… a panic, in a word,is a species of neuralgia, and according to the rules ofscience you must not starve it. The holders of the cashreserve must be ready not only to keep it for their ownliabilities, but to advance it most freely for the liabilitiesof others. We must look first to the foreign drain, andraise the rate of interest as high as may be necessary,unless you can stop the foreign export, you cannot allaythe domestic alarm.
There should be a clear understanding between the Bankand the public that, since the Bank holds our ultimatebanking reserve, they will recognize and act on theobligations which this implies — that they will replenishit in times of foreign demand as fully, and lend it intimes of internal panic as freely and readily, as plainprinciples of banking require.
Deposit banking is of this sort. Its essence is that a verylarge number of persons agrees to trust a very fewpersons, or some one person. Banking would not be aprofitable trade if bankers were not a small number, anddepositors in comparison an immense number. But to geta great number of persons to do exactly the same thingalways is very difficult, and nothing but a very palpablenecessity will make them on a sudden begin to do it. Andthere is no such palpable necessity in banking.
A system of note issues is therefore the best introductionto large system deposit banking. No nation as yet hasarrived at a great system of deposit banking withoutgoing first through the preliminary stage of note issue,and of such note issues the quickest and most efficient inthis way is one made by individuals resident in thedistrict, and conversant with it. And this explains whydeposit banking is so rare. Such a note issue as has beendescribed is possible only in a country exempt frominvasion, and free from revolution.
Nothing can be truer in theory than the economicalprinciple that banking is a trade and only a trade, andnothing can be more surely established by a largerexperience than a Government which interferes with anytrade injures that trade. The best thing undeniably thatGovernment can do with the Money Market is to let ittake care of itself. But, a Government can only carry outthis principle universally if it observes one condition: itmust keep its own money.
Many persons believe that the Bank of England has somepeculiar power of fixing the value of money. They seethat the Bank of England varies its minimum rate ofdiscount from time to time, and that, more or less, allother banks follow its lead, and charge much as itcharges; and they are puzzled why this should be. Thereis at the bottom, however, no difficulty in the matter. Thevalue of money is settled, like that of all othercommodities, by supply and demand, and only the formis essentially different.
This is the meaning of the saying ‘John Bull can standmany things, but he cannot stand two per cent’: it meansthat the greatest effect of the three great causes is nearlypeculiar to England; here, and here almost alone, theexcess is deposited in banks; here, and here only, areprices gravely affected. In these circumstances, a lowrate of interest, long protracted, is equivalent to a totaldepreciation of the precious metals. The rise in pricesmust, therefore, be due to an increased demand, and thefirst question is, to what is that demand due? We believeit to be due to the combined operation of three causes —
-
179
Classic Investment Readings: Walter Bagehot (cont.)
cheap money, cheap commodities prices, and improvedcredit.
As far as prosperity is based on a greater quantity ofproduction, and that of the right articles — as far as it isbased on the increased rapidity with which commoditiesof every kind reach those who want them — its basis isgood. Human industry is more efficient, and therefore ismore to be divided among mankind. But in so far as thatprosperity is based on a general rise of prices, it is a riseonly in name; whatever anyone gains on the articleswhich are to be sold, they lose on the articles which areto be bought, and so everyone is just where they started.
And in so far as the apparent prosperity is caused by anunusual plentifulness of loanable capital and aconsequent rise in prices, that prosperity is not onlyliable to reaction, but certain to be exposed to reaction.The same causes which generate this prosperity will,after they have been acting a little longer, generate anequivalent adversity. In consequence, a long-continuedlow rate of interest is almost always followed by a rapidrise in that rate.
Every great crisis reveals the excessive speculations ofmany houses which no one before suspected, and whichcommonly indeed had not begun or had not carried veryfar those speculations, till they were tempted by the dailyrise of price and the surrounding fever.
At the very beginning of adversity, the counters in thegambling mania, the shares in the companies created tofeed the mania, are discovered to be worthless; downthey all go, and with them much of credit. The goodtimes of high price almost always engender fraud. Allpeople are most credulous when they are most happy;and when much money has just been made, when somepeople are really making it, there is a happy opportunityfor ingenious mendacity. Almost everything will bebelieved for a little while, and long before discovery, theworst and most adroit deceivers are geographically orlegally beyond the reach of punishment.
When we understand that Lombard Street is subject tosevere alternations of opposite causes, we should cease
to be surprised at its seeming cycles. We should ceasetoo to be surprised at the sudden panics. During theperiod of reaction and adversity, just even at the lastinstant, of prosperity, the whole structure is delicate. Thepeculiar essence of our banking system is anunprecedented trust between human and human: andwhen that trust is much weakened by hidden causes, asmall accident may greatly hurt it, and a great accidentfor a moment may almost destroy it. Now too that wecomprehend the inevitable vicissitudes of LombardStreet, we can also thoroughly comprehend the cardinalimportance of always retaining a great banking reserve.Whether the times of adversity are well met or ill metdepends far more on this than on any other singlecircumstance. If the reserve be large, its magnitudesustains credit; and if it be small, its diminutionstimulates the gravest apprehensions.
In ordinary times the Bank is only one of many lenders,whereas in a panic, it is the sole lender, and we want, asfar as we can, to bring back the unusual state of a time ofpanic to the common state of ordinary times.
The Bank of England has to keep the sole bankingreserve of the country; has to keep it through all changesof the money market, and all turns of the Exchanges; hasto decide on the instant in a panic what sort of advancesshould be made, to what amounts, and for what dates. Onone vital point, the Bank’s management has beenexcellent. It has done perhaps less ‘bad business,’certainly less very bad business, than any bank of thesame size and the same age. There has never been asuspicion that it was ‘worked’ for the benefit of any oneperson, or any combination of persons.
There is a cardinal difference between banking and otherforms of commerce; you can afford to run much less riskin banking than in commerce, and you must take muchgreater precautions. The business of a banker thereforecannot bear so many bad debts as that of a merchant, andhe must be much more cautious to whom he gives credit.Real money is a commodity much more coveted thancommon goods: for one deceit which is attempted on amanufacturer or a merchant, twenty or more are
-
180
Classic Investment Readings: Walter Bagehot (cont.)
attempted on a banker. Adventure is the life ofcommerce, but caution, I had almost said timidity, is thelife of banking.
At every moment there is a certain minimum which Iwill call the ‘apprehension minimum,’ below which thereserve cannot fall without great risk of diffused fear;and by this, I do not mean absolute panic, but only avague fright and timorousness which spreads itselfinstantly, and as if by magic, over the public mind. Suchseasons of incipient alarm are exceedingly dangerous,because they beget the calamities they dread. What ismost feared at such moments of susceptibility is thedestruction of credit; and if any grave failure or badevent happens at such moments, the public fancy seizeson it, there is a general run, and credit is suspended. TheBank reserve then never ought to be diminished belowthe ‘apprehension point.’ And this is as much as to say,that it never ought very closely to approach that point;since, if it gets very near, some accident may easily bringit down to that point and cause the evil that is feared.
The cardinal rule to be observed is that errors of excessare innocuous but errors of defect are destructive. Toomuch reserve only means a small loss of profit, but toosmall a reserve may mean ‘ruin.’ I know it will be saidthat in this work I have pointed out a deep malady, andonly suggested a superficial remedy.
A system of credit which has slowly grown up as yearswent on, which has suited itself to the course of business,which has forced itself on human habits, will not bealtered because theorists disapprove of it, or becausebooks are written against it.
No one who has not long considered the subject can havea notion how much this dependence on the Bank ofEngland is fixed in our national habits. And everypractical person—every person who knows the scene ofaction—will agree that our system of banking, based ona single reserve in the Bank of England, cannot bealtered, or a system of many banks, each keeping its ownreserve, be substituted for it.
This being so, there is nothing but to make the best ofour banking system and to work it in the best way that itis capable of. A fixed proportion of the liabilities, evenwhen that proportion is voluntarily chosen by thedirectors, and not imposed by law, is not the properstandard for a bank reserve. Liabilities may be imminentor distant, and a fixed rule which imposes the samereserve for both will sometimes err by excess, andsometimes by defect.
We must therefore, I think, have recourse to feeble andhumble palliatives such as I have suggested. With goodsense, good judgment, and good care, I have no doubtthat they may be enough.
Copyright © 1999 John Wiley & Sons, Inc.Used by permission.
-
181
Classic Investment Readings: Fred Schwed, Jr.
Where Are the Customers’ Yachts?: AGood Hard Look at Wall Street
Fred Schwed, Jr., was a professional trader who had thegood sense to get out of the market after losing a bundle(of mostly his own money) in the 1929 crash. Some yearslater, he published a children’s book titled Wacky theSmall Boy. Wacky became a bestseller, and Schwedwent on to draw further on his experience by writingWhere Are the Customers’ Yachts? His publisher said ofhim, “Mr. Schwed has attended Lawrenceville andPrinceton and has spent the last ten years on Wall Street.As a result, he knows everything there is to know aboutchildren.”
“Wall Street,” reads the sinister old gag, “is a street witha river at one end and a graveyard at the other.” This isstriking, but incomplete. It omits the kindergarten in themiddle, and that’s what this book is about. The chiefconcern of this book will be with an examination of thenonsense — a commodity which keeps sluicing inthrough the weeks and years with the irresistibleconstancy of the waters of the rolling Mississippi. Booksabout Wall Street fall into two categories which mayrespectively be called the admiring, or “Oh, My!”School, and the vindictive, or “Turn the Rascals Out”School.
Figures, as used in financial arguments, seem to have thebad habit of expressing a small part of the truth forcibly,and neglecting the other part. It seems that the immaturemind has a regrettable tendency to believe, as actuallytrue, that which it only hopes to be true. In this case, thenotion that the financial future is not predictable is justtoo unpleasant to be given any room at all in the WallStreeter’s consciousness.
Some Wall Streeters manage to shed these dreams ofconquests, coups, and power, for themselves or for thepeople they advise, given sufficient years. But theultimate dream they almost never shed; that there is asecret, meaningful, and predictable pattern, in the riseand fall of financial enterprises — that a “close study” ofthis and that will prove something; that it will tell theinitiate when there will be a rally or give the speculator a
better than ever chance of making a killing. All thesethings are demonstrably unpredictable.
The broker influences the customer with his or herknowledge of the future, but only after convincinghimself or herself. It may have been observed that whilearguing my case against the validity of financialpredictions, I have not touched on the most spectacularexample — the late nineteen-twenties, the suprememiscalculation of this century, which Mr. WestbrookPegler always refers to as “the era of wonderfulnonsense.” There is a feeling in some quarters that evenin the late twenties there were crafty Wall Streeters whoknew the market was too high. Sure there were, but itdidn’t do many of them much good.
The conservative banker is an impressive specimen,diffusing the healthy glow which comes of moderation ineating, living, and thinking. Your truly conservativebanker cannot be stampeded into unwary speculations bythe hysteria of a boom. After these great and established
-
182
Classic Investment Readings: Fred Schwed, Jr. (cont.)
bankers come all sorts of lesser bankers. The lesserbankers are under the unfortunate necessity of saying“yes” more frequently. This is because the idealborrowers (people who don’t need the money) do notcome to them. Their clients need the money, and thelesser bankers must occasionally get it for them, or elseclose up shop and, God forbid! go home and relax. Likemost other Wall Streeters, bankers suffer from theinability to do nothing. Some strategists have to writeweekly, and even daily, “market letters.” This is a toughway to make a living. It not only requires the constantmaking of predictions, but it requires putting thepredictions down on paper for anyone interested to checkup on. Sometimes these letters come back with a jug ofmustard and a forcible suggestion that the writer applythe mustard to his or her letter and eat it.
When “conditions” are good, the forward-lookinginvestor buys. But when “conditions” are good, stocksare high. Then, without anyone having the courtesy toring a warning bell, “conditions” get bad. Stocks godown, and the margin clerk sends the forward-lookinginvestor a telegram containing the only piece of financialadvice he will ever get from Wall Street, which has noifs or buts in it.
When the student looks, however closely, at a graph ofthe Dow Jones averages, all he or she sees for certain is ahistory of past performances clearly and convenientlydepicted. That one can, by examining the line alreadydrawn, make a useful guess at the line not yet drawn,must be predicated on the hypothesis that “historyrepeats itself.” History does in a vague way repeat itself,but it does so slowly and ponderously, and with aninfinite number of surprising variations. All I was everable to conclude from my informal studies was that chartreading is a complex way of arriving at a simpletheorem, to wit: when they have gone up for aconsiderable time, they will continue to go up for aconsiderable time; and the same holds true for goingdown.
A customer may be loosely defined as anyone who iswilling to put up some money. The simplest way of
getting wealthy customers is to be born unto them.Otherwise, customers are obtained by much the samemysterious methods whereby doctors get patients andlawyers clients. This is done by circulating around andimpressing people with one’s talents.
A lot of us who clearly are not magicians pool ourmoney and hire a set of professional experts to do theguessing. They may not quite be magicians, but theyhave everything that should be necessary — experience,reputation, trained staffs, inside information, andunlimited resources for research. Since the amount wepool together is quite large, we can afford to pay themfortunes for their ability. Paying them fortunes will be agreat bargain for us, provided only that they come acrosswith the ability. There has been a deal of thoughtful,searching legislation enacted against mutual fund abuses,and all of it favors the investor. The sad thing is thatthere can be no legislation against stupidity.
The notion of selecting the “best” securities still deservesa close scrutiny. Those classes of investments considered“best” change from period to period. The pathetic fallacyis that what are thought to be the best are in truth onlythe most popular — the most active, the most talked of,the most boosted, and consequently, the highest in priceat that time. Here we have the basic trouble withselecting the “best” securities for a fixed portfolio. Infact, here we have the basic trouble with all securityselection for whatever purpose. Implacably, thisuniversal habit of buying the popular securities works forbad results over a period of time. It must tend to get thebuyer in nearer the top than the middle.
Once upon a time there were two small mutual funds,managed by the late John W. Pope, which were of suchstuff as dreams are made on. To be exact, the time wasthat impossible period in finance, 1929–1931.Everything about these companies was the opposite ofall other mutual funds, including the fact that they madebig money while the others were losing big money.Everything about the intellect and philosophy of theyouthful Mr. Pope was the reverse of what I haveexplained a Wall Streeter must be. His statement of
-
183
Classic Investment Readings: Fred Schwed, Jr. (cont.)
condition as of December 31, 1930, was extremelysimple. All the money was in cash and short-terminstruments, which, strangely enough, was preciselywhere it should have been. This statement also containedan incredible sentiment, to this effect:
“It is the belief of the management of thiscorporation that a diversified list of carefullyselected securities, held over a period of time, willnot increase in value.”
John Pope came to his untimely death in 1931. He wasstill a very young man — a sort of Keats or Shelley offinance. It can now never be known whether his amazingrecord could have been sustained; whether indeed hewould have continued to be, as he was then, the brilliantexception that proves the rule. In all discussions of shortselling that are meant for public consumption, everyone,whether pro or con, agrees that bear raiding is outside thepale of decent human activity. Bear raiding is the furtherruthless slaughtering of prices by selling short at a timewhen prices are already cruelly disorganized by actualeconomic calamity. That is raiding at what is consideredits worst. Other operations of the raider are somewhatmore technical and less spectacular. One is the effort todepress a certain stock a few points in the hope oftriggering some stop-loss orders. If this is accomplished,the stock would sell yet lower, at least briefly, whichgives the raider a chance for profit. Even if no stop-lossorders are uncovered, the sight of declining prices on theticker tape usually frightens some holders into selling.That, at least, is the bears’ hypothesis. A more extensiveoperation, looking for a larger profit, is to help depressstocks to the point where margin calls will be sent out.
In attempting to find out just what, if anything, was goodin the good old days, it is necessary to determine whenthe good old days were. It would be more correct andmore honest to recognize that the good old days weresimply boom days. In our moments of sober thought weall realize that booms are bad things, not good. Butnearly all of us have a secret hankering for another one.
There has evolved a considerable saga of the deeds andderring-do of the Great Speculators of the good old days.The individuals under discussion are those who made,
and often lost, their fortunes in stocks, trading them,manipulating them, cornering them, and generallyperforming razzle-dazzle with them. This excludes suchpersons as Rockefeller and Carnegie who were primarilyengaged in such realistic businesses as oil and steel —their Wall Street interests grew only secondarily fromthat.
The inability to grasp ultimate realities is the outstandingmental deficiency of the speculator, small as well asgreat. The speculator is an incurable romantic andusually egotistical. His or her mind is fast, active, andresourceful, and, in a peculiarly limited way, shrewd.That is, he or she is shrewd in everything save that he orshe is constantly, day by day, laying himself or herselfopen to the possibility of being ruined. The speculatorseems to believe, with Mother Goose, that a treetop isthe proper place for a cradle. When they are speculating,how much of what the speculators are doing is wisdomand foresight and experience, and how much is sheerguessing? Certainly they never admit to themselves thatthey are making guesses, or they would have to quit thebusiness at which they have so much fun. If they areacting on guesses or hunches, as I suspect they are, theyare the world’s best rationalizers in finding profoundreasons for their hunches.
Admittedly, it is preposterous to suggest that stockspeculation is like coin flipping. I know that there ismore skill to stock speculation. What I have never beenable to determine is — how much more? In Thakeray’sVanity Fair there is a masterly description of a ruinedspeculator, which demonstrates that the genus has notaltered an iota in over a century. Old Mr. Sedley was nota realist, either. He felt strongly that that scoundrelNapoleon had escaped from Elba and rallied all Franceto his banner chiefly for the purpose of making itimpossible for him, Mr. Sedley, to meet his obligationson settlement day. Most of the great speculators eitherended their days in penury or came sickeningly close toit one or more times. An interesting exception was HettyGreen, who never took a backward step. She started richand soon got richer, and after that she got progressivelymore wealthy.
-
184

Classic Investment Readings: Fred Schwed, Jr. (cont.)
For the loosest use of a pronoun in the English languageI nominate “they,” as in the common Wall Streetexpressions, “‘They’ are accumulating the coppers,”“‘They’ are taking profits,” and “‘They’ won’t let thismarket run away until after the election.” Who are“they”? They are either the great speculators andmanipulators, or the daemons of the nether world, orboth.
So much has been written and argued aboutmanipulation of stocks that I am reluctant to add muchmore. The business is based on the fairly soundhypothesis that the public is chiefly interested in buyingstocks that are “going up.” Thus the manipulators selecta stock that they think is underpriced and that has a goodstory for a “tip” to go with it, and they try to see to it thatit “goes up.” They also spread the tip, of the truth ofwhich they have carefully convinced themselves, andwhich may indeed turn out to be true.
Manipulation, like other frowned-on practices I havecited, is not an easy road to fortune. I recall acorrespondence of many years ago. A “pool manager,”having been supplied with large funds by a “pool” of adozen investors to hoist a certain stock, was having nosuccess whatever. The pool manager had bought plentyof stock and the stock was still down. The pool managerwrote a letter to each of the members of the pool,explaining at length the hard luck that had beenencountered and asking them each for an additionalcontribution of fifty thousand dollars. With this, the poolmanager assured them, the chestnuts could be pulled outof the fire and a handsome profit would be substitutedfor an apparent loss. One of the replies read as follows:
Dear :
Enclosed please find the check for FiftyThousand Dollars ($50,000) which you requested inyours of the 15th. It was not really necessary foryou to assume an apologetic tone. I am sure thatyou have done your skillful best in this matter, and Iam sufficiently experienced to understand that youhave encountered reverses which could not be
foreseen. Trusting that our enterprise will turn outin the profitable way that you outline, I remain,
Sincerely,
P.S. That is what I would have written, you(! deleted !), if I had been sucker enough to enclosemy check for $50,000.
Investment and speculation are said to be two differentthings, and the prudent investor is advised to engage inthe one and avoid the other. This is something likeexplaining to the troubled adolescent that Love andPassion are two different things. He or she perceives thatthey are different, but they don’t seem quite differentenough to clear up his or her problems.
Investment and speculation have been so often definedthat a couple more faulty definitions should do no harm,the science of economics having reached a point wherefurther confusion is impossible. Thus, Speculation is aneffort, probably unsuccessful, to turn a little money intoa lot. Investment is an effort, which should be successful,to prevent a lot of money from becoming a little.
The underlying principle of the genuine investmentcounsel seems to be sound and important. It is amundane one, i.e., it has to do with how the counselorsare paid off. They receive a stated fee for giving advice;they do not get their pay in commissions or profits ontrades, as most brokers and dealers do. This reduces thewealthy person’s problems to two:
(1) Is there such a thing as consistently usefulfinancial advice?
(2) If there is, which investment counselor cansupply it?
For no fee at all, I am prepared to offer to any wealthyperson an investment program which will last a lifetimeand will not only preserve the estate but greatly increaseit. Like other great ideas, this one is simple:
-
185
Classic Investment Readings: Fred Schwed, Jr. (cont.)
When there is a stock-market boom, and everyoneis scrambling for common stocks, take all yourcommon stocks and sell them. Take the proceedsand buy conservative bonds. No doubt the stocksyou sold will go higher. Pay no attention to this —just wait for the depression which will come sooneror later. When this depression — or panic —becomes a national catastrophe, sell out the bonds(perhaps at a loss) and buy back the stocks. Nodoubt the stocks will go still lower. Again pay noattention. Wait for the next boom. Continue torepeat this operation as long as you live, and you’llhave the pleasure of dying rich.
A glance at financial history will show that there neverwas a generation for whom this advice would not haveworked splendidly. But it distresses me to report that Ihave never enjoyed the social acquaintance of anyonewho managed to do it. It looks as easy as rolling off alog, but it isn’t. The chief difficulties, of course, arepsychological. It requires buying bonds when bonds aregenerally unpopular, and buying stocks when stocks areuniversally detested. I suspect that there are actually afew people who do something like this, even though Ihave never had the pleasure of meeting them.
Consider the case of a family which has, besides amodest earned income, $100,000 to invest. Just now itseems that they ought to be able to glean from this anaverage yield of a few thousand dollars a year, withreasonable safety. Suppose the family invests the moneyat this rate. Their chief problem now, I suggest, is not somuch to watch their investments as to watch themselves.So long as they can attune their material needs and theirsocial dignity to that income, they can retain thatreasonable safety. The greatest of investment mistakes isin trying for too high a return with its attendant tragicrisk. There is also a reverse side to this picture. This is atendency on the part of fiduciaries (including trustees,executors, and lawyers) to play so safe with a client’sfunds that they just don’t perform any useful service atall.
This book has thus far skirted two juicy topics — WallStreet behavior and the many steps that have been takento regulate it. This should work no hardship on theinquiring student because there are reams of printedmaterial on these subjects. This book has chiefly tried topaint a picture of thousands of erring humans, of varyingdegrees of good will, solemnly engaged in the businessof predicting the unpredictable. It has been furthersuggested that to this effort most of them bring a certaincockeyed sincerity. The burned investor certainly prefersto believe that he or she has been robbed rather thanhaving been a fool on the advice of fools.
One of the chief points on the agenda of the S.E.C. hasbeen to work toward the ideal of a “completely informedinvesting public.” However, just as a fanciful exercise inparadox, let us consider what would happen if on somemiraculous dawn the entire investing public woke up tofind itself “completely informed.” That would certainlybe the end of an orderly market, for a panic, either bullor bear, would ensue. Everybody would know whether tobuy or sell, and whichever it was, everybody would tryto do the same thing at once. And there would be no oneto complete the other side of the trade! Orderly markets,like horse races, exist on differences of opinion.
In conclusion, I must remind you that I work in WallStreet and assure you that my organization is of coursequite different from anything I have described here.Perhaps what you are looking for is a long-rangecomprehensive investment program, conservative yetliberal, which will protect you from the effects ofinflation and also deflation, and which will allow you tosleep nights. In this case just stop in my office and let usrecommend a program. I will see to it personally thatyour inquiries are referred to the Head of our Crystal-Ball Gazing Department.
-
186
Classic Investment Readings: Robert J. Shiller
Irrational Exuberance
Irrational Exuberance is a broad study, drawing on awide range of published research and historicalevidence, of the enormous recent stock market boom.
Why did the U.S. stock market reach such high levels bythe turn of the millennium? What changed to cause themarket to become so highly priced? What do thesechanges mean for the market outlook in the openingdecades of the new millennium? Are powerfulfundamental factors at work to keep the market high orto push it even higher, even if there is a downwardcorrection? Or is the market high only because of someirrational exuberance—wishful thinking on the part ofinvestors that blinds them to the truth?
To answer these questions, Irrational Exuberanceharvests relevant information from economics,psychology, demography, sociology, history, andbehavioral finance. The stock market at the dawn of thenew millennium displays the classic features of aspeculative bubble: a situation in which temporarily highprices are sustained largely by investors’ enthusiasmrather than by consistent estimation of real value.
Among the unanticipated consequences of the investmentculture is that many of the tens of millions of adultsinvested in the stock market act as if the price level isgoing to keep rising at its current rate. Even though thestock market appears based on some measures to behigher than it has ever been, investors behave as thoughit can never be too high, and that it can never go downfor long.
The conventional wisdom holds that the stock market asa whole has always been the best investment, and alwayswill be, even when the market is overpriced by historicalstandards. Most investors also seem to view the stockmarket as a force of nature unto itself. They do not fullyrealize that they themselves, as a group, determine thelevel of the market. People are optimistic about the stockmarket. There is a lack of sobriety about its downside
and the consequences that may very well ensue as aresult.
The Stock Market Level in Historical Perspective
By historical standards, the U.S. stock market has soaredto extremely high levels in recent years. Yet if thehistory of high market valuations is any guide, the publicmay be very disappointed with the performance of thestock market in coming years. The Dow Jones IndustrialAverage stood at around 3,600 in early 1994. By 1999, ithad passed 11,000, more than tripling in five years, atotal increase in stock market prices of over 200%. Overthe same period, basic economic indictors did not comeclose to tripling. U.S. personal income and grossdomestic product rose less than 30%, and almost half ofthis increase was due to inflation. Corporate profits roseless than 60%. Between 1994 and 1999, the total averagereal price increase of homes in ten major U.S. cities wasonly 9%.
-
187
Classic Investment Readings: Robert J. Shiller (cont.)
Similarly, after 1901, there was no pronouncedimmediate downtrend in real equity prices, but for thenext decade, prices bounced around or just below the1901 level and then fell. By June 1920, the stock markethad lost 67% of its June 1901 real value. The averagereal return (including dividends) was 4.4% a year in theten years following June 1901, 3.1% a year in the fifteenyears following June 1901, and -0.2% a year in thetwenty years following June 1901.
Another instance of a high price-earnings ratio, 32.6,occurred in September 1929, the high point of the marketin the 1920s and the second highest ratio of all time. Thereal S&P Composite Index did not return to itsSeptember 1929 value until December 1958. Theaverage real return in the stock market (includingdividends) was -13.1% a year for the five yearsfollowing September 1929, -1.4% a year for the next tenyears, -0.5% a year for the next fifteen years, and 0.4% ayear for the next twenty years.
Yet another instance of a high price-earnings ratiooccurred in January 1966, when the price-earnings ratioreached a local maximum of 24.1. Real stock priceswould not be back up to the January 1966 level untilMay 1992. The average real return in the stock market(including dividends) was -2.6% a year for the five yearsfollowing January 1966, -1.8% a year for the next tenyears, -0.5% a year for the next fifteen years, and 1.9% ayear for the next twenty years.
Precipitating Events: The Internet, the Baby Boom,and Other Events
Most historical events, from wars through revolutions,do not have simple causes. When these events move inextreme directions, as price-earnings ratios have in therecent stock market, it is usually because of a confluenceof factors, none of which is by itself large enough toexplain these events.
Set forth below is a list of factors that may help explainthe present speculative market, mostly factors that havehad an effect on the market that are not warranted byrational analysis of economic fundamentals.
1. The Internet and the World Wide Web haveinvaded investors’ homes during the second half ofthe 1990s, making the population intimatelyconscious of the pace of technological change. Theoccurrence of profit growth, coincident with theappearance of a new technology as dramatic as theInternet, can easily create an impression among thegeneral public that the two events are somehowconnected. Publicity linking these twin factors wasespecially strong with the advent of the newmillennium—a time of much optimistic discussionof the future.
2. In many areas of activity, the U.S. appears tooccupy a leadership position, and therefore it startsto seem only natural that confidence in the premiercapitalist system would translate into confidence inthe market, and that the U.S. stock market should bethe most highly valued in the world.
3. The bull market has been accompanied by asignificant rise in materialistic values. It isplausible that materialistic feelings might influenceinvestors’ demand for stocks, which have long heldout at least the possibility of amassing substantialand quick riches.
4. Republican lawmakers in the 1980s and 1990swere much more pro-business than theirDemocratic predecessors. In 1997, the top capitalgains tax rate was cut from 28% to 20%.
5. The Baby Boom in the United States was markedby very high birth rates during the years 1946-66,and so there are in the year 2000 (and will be forsome time) an unusually large number of peoplebetween the ages of 35 and 55. One theory justifieshigh price-earnings ratios as the result of theseBoomers’ buying stocks to save for their eventualretirement and bidding share prices up relative to theearnings they generate. According to the othertheory, it is their spending on current goods andservices that boosts stocks, through a generalizedpositive effect on the economy: high expendituresmean high profits for companies.
-
188
Classic Investment Readings: Robert J. Shiller (cont.)
6. CNBC, CNNfn, and Bloomberg Television haveproduced an uninterrupted stream of financialnews, much of it devoted to the stock market.
7. Analysts now appear to be reluctant torecommend that investors sell anything. Onereason often given for this reluctance is that a sellrecommendation might incur the wrath of thecompany involved.
8. Changes over time in the nature of employeepension plans have encouraged people to learnabout, and eventually accept, stocks as investments.The most revolutionary change in these institutionsin the United States has been the expansion ofdefined contribution pension plans at the expense ofdefined benefit plans.
9. The stock market boom has coincided with apeculiar growth spurt in the mutual fund industryand a proliferation of advertising for mutual funds.In 1982, there were 6.2 million equity mutual fundshareholder accounts in the United States, about onefor every ten U.S. families. By 1998, there were119.8 million such shareholder accounts, or nearlytwo accounts per family.
10. High inflation is perceived as a sign of economicdisarray, of a loss of basic values, and a disgrace tothe nation, an embarrassment before foreigners. Lowinflation is viewed as a sign of economic prosperity,social justice, and good government. It is notsurprising, therefore, that a lower inflation rateboosts public confidence, and hence stock marketvaluation.
11. The higher equity turnover rate may besymptomatic of increased interest in the market.According to a study by the SEC, there were 3.7million online accounts in the United States in 1997;by 1999 there were 9.7 million such accounts.
12. There has been a dramatic increase in gamblingopportunities in the United States in recent years.Gambling suppresses natural inhibitions against
taking risks. A spillover from gambling to financialvolatility may come about because gambling, andthe institutions that promote it, yield an inflatedestimate of one’s own ultimate potential for goodluck, a heightened interest in how one performscompared with others, and a new way to stimulateoneself out of a feeling of boredom or monotony.
Amplification Mechanisms: Naturally OccurringPonzi Processes
Investors, their confidence and expectations buoyed bypast price increases, bid up stock prices further, therebyenticing more investors to do the same, so that the cyclerepeats again and again, resulting in an amplifiedresponse to the original precipitating factors. Investors’belief in the resilience of the market seems to stem froma generalized feeling of optimism and assurance, ratherthan from a belief in the long-run stability of prices.People seem to think that they have discovered a safeand lucrative investment, one that cannot lose.
In the most popular version of the feedback theory, onethat relies on adaptive expectations, feedback takes placebecause past price increases generate expectations offurther price increases. In another version of thefeedback theory, feedback takes place because ofincreased investor confidence in response to past priceincreases. Economists have proposed a theory of habitformation that may also serve to amplify stock marketresponses. In their model, people become slowlyhabituated to the higher level of consumption that theycan expect from a more highly valued stock market. It isdifficult to prove that a simple mechanical pricefeedback model, producing heightened investor attentionand enthusiasm, is actually a factor in financial markets.
Speculative feedback loops that are in effect naturallyoccurring Ponzi schemes do arise from time to timewithout the contrivance of a fraudulent manager.Perceived long-term risk is down. Expected returns arenot down, despite a highly-priced market. Emotions andheightened attention to the market create a desire to getinto the game. Such is irrational exuberance in theUnited States.
-
189

Classic Investment Readings: Robert J. Shiller (cont.)
The News Media
The history of speculative bubbles begins roughly withthe advent of newspapers. Significant market eventsgenerally occur only if there is similar thinking amonglarge groups of people, and the news media are essentialvehicles for the spread of ideas. A confluence of factorsmay cause a significant market change, even if theindividual factors themselves are not particularlynewsworthy. The role of news events in affecting themarket seems often to be delayed, and to have the effectof setting in motion a sequence of public attentions.These attentions may focus on images or stories, or onfacts that may already have been well known. The factsmay previously have been ignored or judgedinconsequential, but they can attain newfoundprominence in the wake of breaking news. Thesesequences of attention may be called cascades, as onefocus of attention leads to attention to another, and thenanother.
On October 28, 1929, the Dow fell 12.8% in one day.The second-biggest drop in history (until 1987) occurredthe following day, when the Dow dropped 11.7%. Farmore significant than news about fundamentals amongthe newspaper stories on Monday, October 28, 1929, areclues to the importance attached in people’s minds to theevents of just a few days earlier, when the stockexchange experienced a record decline in share prices.That was the so-called Black Thursday, October 24,1929, when the Dow had fallen 12.9% within the day butrecovered substantially before the end of trading, so thatthe closing average was down only 2.1% from thepreceding close. This event was no longer news, but thememory of the emotions it had generated was very muchpart of the ambience on the following Monday.
There was news on the Wednesday before BlackThursday that there had been a major drop in the market(the Dow closed on Wednesday down 6.3% fromTuesday’s close) and that total transactions had had theirsecond highest day in history. The most significantconcrete news stories in the newspapers seemconsistently to have been about previous moves of themarket itself. There is no way that the events of the stock
market crash of 1929 can be considered a response toany real news stories. We see instead a negative bubble,operating through feedback effects of price changes, andan attention cascade, with a series of heightened publicfixations on the market. The stock market crash hadsubstantially to do with a psychological feedback loopamong the general investing public from price declinesto selling and thus further price declines, along the linesof a negative bubble. The Brady Commission wrote intheir summary the following explanation for the 1987Crash:
The precipitous market decline of mid-October was“triggered” by special events: an unexpectedly highmerchandise trade deficit which pushed interest ratesto new high levels, and proposed tax legislationwhich led to the collapse of the stocks of a numberof takeover candidates. This initial decline ignitedmechanical, price-insensitive selling by a number ofinstitutions employing portfolio insurance strategiesand a small number of mutual fund groups reactingto redemptions. The selling by these investors, andthe prospect of further selling by them, encouraged anumber of aggressive trading-oriented institutions tosell in anticipation of further market declines. Theseinstitutions included, in addition to hedge funds, asmall number of pension and endowment funds,money management firms, and investment bankinghouses. This selling, in turn, stimulated furtherreactive selling by portfolio insurers and mutualfunds.
The Brady Commission was saying, in effect, that thecrash of 1987 was a negative bubble. The importantpoint is that it was the changed nature of the feedbackloop, not the news stories that broke around the time ofthe crash, that was the essential cause of the crash. Themedia can sometimes foster stronger feedback from pastprice changes to further price changes, and they can alsofoster another sequence of events, referred to as anattention cascade.
New Era Economic Thinking
Stock market expansions have often been associated withpopular perceptions that the future is brighter or lessuncertain than it was in the past. The term new era has
-
190
Classic Investment Readings: Robert J. Shiller (cont.)
periodically been used to describe these times. Thepublic is interested in expansive descriptions of futuretechnology—for example, in what amazing newcapabilities computers will soon have—not in gaugingthe level of U.S. corporate earnings in coming years.
In a sense, the high-tech age, the computer age, and thespace age seemed just around the corner in 1901, thoughthe concepts were expressed in different words thanwould have been used in early 2000. People were upbeatin 1901, and in later years, the first decade of thetwentieth century came to be called the Age ofOptimism, the Age of Confidence, or the Cocksure Era.
The 1920s were a time of rapid economic growth and, inparticular, of the widespread dissemination of sometechnological innovations, such as automobiles, that hadformerly been available only to the wealthy. Prof. IrvingFisher at Yale, who has been described as one ofAmerica’s most eminent economists, argued that theU.S. stock market was not at all overvalued. He wasquoted as saying just before the peak in 1929 that “stockprices have reached what looks like a permanently highplateau.”
New era thinking also seemed, judging from mediaaccounts, to undergo a sudden surge in the mid-1950s.The idea that Irving Fisher had presented in the 1920s asa reason for optimism, that businesses were able to planbetter for the future, was floated again as a new idea inthe 1950s. The increase in the use of consumer creditwas also cited, as it had been in the 1920s, as a reason toexpect prosperity.
In 1996, one observer, writing in a Business Week articleentitled “The Triumph of the New Economy,” listed fivereasons that the market is not crazy: increasedglobalization, the boom in high-tech industries,moderating inflation, falling interest rates, and surgingprofits.
Speculative bubbles and their associated new erathinking do not end definitively with a sudden, finalcrash. People today remember the stock market crash of1929 as occurring in one or two days. In fact, after that
crash, the market recovered almost all of its lost groundby early 1930. Ends of new eras seem to be periodswhen the national focus of debate changes and can nolonger be upbeat. Often, the ends of bull markets appearto be caused by concrete events unrelated to anyirrational exuberance in the stock market. Notable amongthese are financial crises, such as banking or exchangerate crises. These financial crisis stories illustrate thecomplicated factors that sometimes capture the attentionof economic and financial analysts. Discussions mayfocus on these factors and pull attention away from thelarge changes in public opinion that are reflected inspeculative prices.
Psychological Anchors for the Market
In considering lessons from psychology, it must be notedthat many popular accounts of the psychology ofinvesting are simply not credible. Investors are said to beeuphoric or frenzied during booms or panic-strickenduring market crashes. In both booms and crashes,investors are described as blindly following the herd likeso many sheep, with no minds of their own. Most peopleare more sensible during such financial episodes thanthese accounts suggest.
Solid psychological research does show that there arepatterns of human behavior that suggest anchors for themarket that would not be expected if markets workedentirely rationally. Quantitative anchors give indicationsfor the appropriate levels of the market that some peopleuse as indications of whether the market is over- orunderpriced and whether it is a good time to buy, andmoral anchors, which operate by determining thestrength of the reason that compels people to buy stocks,a reason that they must weigh against their other uses forthe wealth they already have (or could have) invested inthe market.
Much of the human thinking that results in action is notquantitative, but instead takes the form of storytellingand justification. Some of the attraction to gambling,despite odds that are often openly stacked againstgamblers, apparently has to do with narrative-basedthinking. Gamblers use a different vocabulary than do
-
191

Classic Investment Readings: Robert J. Shiller (cont.)
probability theorists, preferring the words luck or luckyday, and rarely uttering the words probability orlikelihood. These stories can convey a sense of meaningand significance to events that are in fact purely random.
Herd Behavior and Epidemics
A fundamental observation about human society is thatpeople who communicate regularly with one anotherthink similarly. Part of the reason people’s judgments aresimilar at similar times is that they are reacting to thesame information—the information that was publiclyavailable at that time. But rational response to publicinformation is not the only reason that people thinksimilarly, nor is the use of that public information alwaysappropriate or well reasoned. People simply think that allthe other people could not be wrong.
People have learned that when experts tell themsomething is all right, it probably is, even if it does notseem so. People are ready to believe the majority view orto believe authorities even when they plainly contradictmatter-of-fact judgment.
Word-of-mouth communications, either positive ornegative, are an essential part of the propagation ofspeculative bubbles, and the word-of-mouth potential ofany event must be weighed in judging the likelihood ofthat event to lead to a speculative bubble. One reasonwhy the contagion of ideas can sometimes happenrapidly, and why public thinking can experience suchabrupt turnarounds, is that the ideas in question arealready in investors’ minds.
Efficient Markets, Random Walks, and Bubbles
The argument for the efficient markets hypothesis doesnot suggest that the stock market cannot go throughperiods of significant mispricing lasting years or evendecades.
After the fact, it is known that the run-up in the stockmarket from 1920 to 1929 was a colossal mistake andthat the drop from 1929 to 1932 was another colossalmistake. Virtually nothing actually happened over eitherof these intervals to the dividend present value.
Fluctuations in stock prices, if they are to beinterpretable in terms of the efficient markets theory,must instead be due to new information about the long-run outlook for real dividends. The invocation ofefficient markets theory to imply that the late 1990supspike in the stock market is a routine and accurateresponse to genuine news is simply not correct.
Investor Learning—and Unlearning
Besides the efficient markets-random walk argument,another rationalization for the exuberance in the marketis that the public at large has learned that the long-termvalue of the market is really greater than they hadthought it was, and higher than conventional indicatorswould have suggested it should be. According to thisview, people have realized that, in light of historicalstatistics, they have been too fearful of stocks. Armedwith this new knowledge, investors have now bid stockprices up to a higher level, to their rational or true level,where the stocks would have been all along had there notbeen excessive fear of them.
A best-selling book in 1924 by Edgar Lawrence Smithmade a number of historical comparisons of investmentsin stocks versus bonds and found that stocks alwayscame out ahead over long holding periods, in bothperiods of rising general prices (inflation) and periods ofdeclining general prices (deflation). The “fact” that iswidely cited is that in the United States there has been nothirty-year period over which bonds have outperformedstocks. The supposed fact is not really true, since, asJeremy Siegel himself points out in his book Stocks forthe Long Run, stocks underperformed bonds in theperiod 1831-61.
In Glassman’s and Hassett’s book, Dow 36,000: TheNew Strategy for Profiting from the Coming Rise in theStock Market, they stress that investors have not finishedlearning that diversified holdings of stocks are not riskyand that they will continue to bid up stock prices incoming years as the lesson really sinks in. They claimthat “A sensible target date for Dow 36,000 is early2005, but it could be reached much earlier.”
-
192
Classic Investment Readings: Robert J. Shiller (cont.)
It has been shown that stock price declines are not thattransitory, that they can persist for decades, and thus thateven long-run investors should see risk in stock marketinvestments. There is also reason to believe that much ofthe enthusiasm for mutual funds is a sort of investor fadthat has not been caused by any real learning.
Stocks can go down, and stay down for many years.They can become overpriced and underperform for adecade or several decades. The public is said to havelearned that stocks must always outperform otherinvestments, such as bonds, over the long run, andtherefore, long-run investors will always do better instocks. Evidence also exists that investors do largelythink this. But again, they have gotten their facts wrong.Stocks have not always outperformed other investmentsover decades-long intervals, and there is no reason tothink they must in the future.
Speculative Volatility in a Free Society
The high recent valuations in the stock market havecome about for no good reasons. The market level doesnot, as so many imagine, represent the consensusjudgment of experts who have carefully weighed thelong-term evidence. The market is high because of thecombined effect of indifferent thinking by millions ofpeople, very few of whom feel the need to performcareful research on the long-term investment value of theaggregate stock market, and who are motivatedsubstantially by their own emotions, random attentions,and perceptions of conventional wisdom.
The sense of “victory” of capitalist economies thatdeveloped after some of America’s close competitorsabroad began to falter after 1990 is not likely to persistindefinitely. What then is the rough scorecard for thelikely future of the twelve precipitating factors in theopening years of the twenty-first century? Two (theInternet boom and the expansion of stock tradingopportunities) will probably increase in strength, two(the Baby Boom and perceived victory over foreigneconomic rivals) will decrease, and the others will likelystay about the same. The conclusion is that no overallchange in these twelve factors can be confidently
predicted, and that, if constancy of the precipitatingfactors implies constancy of the market level, thenreturns will remain confined to the low dividend yieldrecently exhibited by stocks.
The list of factors that could potentially interruptearnings growth is of course very long. Some of them areset forth below, with no presumption that any of these ismore or less likely as of the turn of the New Millennium:a decline in consumer demand, a dearth of newdevelopment opportunities, failures of majortechnological initiatives, heightened foreign competition,a resurgent labor movement, an oil crisis, a corporate taxincrease, newly discovered problems with the longer-runconsequences of downsizing and incentive-basedcompensation for employees, a decline in employeemorale and productivity, a war, a terrorist attack or evena new terrorist threat that hampers business activities, anindustrial accident that suggests that certain technicalprocesses are more dangerous than previously thought,heightened regulatory or antitrust activity, increasedforeign tariffs or import quotas, a depression abroad,stricter environmental standards, class-action lawsuitsagainst corporations, a suddenly erratic monetary policy,systemic problems due to a failure of major banks orfinancial institutions, a widespread computer systemproblem, large-scale weather problems, natural disasters,and epidemics.
If market expectations for earnings growth are realized,and if U.S. gross domestic product growth is 4% a year,then after-tax corporate profits’ share of gross domesticproduct will be over 12% in 2010, a value almost twiceas high as any time since 1948. Resentment against theUnited States and its strong free enterprise system hasmoral overtones too; people in many other countries thatare not quite as strong economically wonder if theirrelative lack of economic success might not be due totheir greater concern as societies and as individuals withequity, fairness, and human values.
What should investors do now? The natural first stepmay be, depending on current holdings and specificcircumstances, to reduce holdings of U.S. stocks. One
-
193
Classic Investment Readings: Robert J. Shiller (cont.)
should at the very least diversify thoroughly. Individualsshould consider increasing their savings rates. Accordingto the latest Investment Company Institute/EmployeeBenefits Research Institute study, more than two-thirdsof 401(k) pension plan balances were in the stock marketin 1996. Authorities who are responsible for pensionplans (in the businesses that sponsor them or in the plansthemselves) should come out much more stronglyagainst putting all or almost all of one’s plan balanceinto the stock market.
It would be a serious mistake to adopt the policy,proposed by some, of replacing the current SocialSecurity system with a defined contribution plan forretirement, investing plan balances in the stock market,or even a plan that would give individuals a choice ofinvestment categories. Such a plan would replace thecurrent societal commitments to the elderly with a hopethat financial markets will do as well as in the past.Adopting such a plan at a time when the market is at arecord high relative to fundamentals would be an error ofhistoric proportions.
The genesis of a speculative bubble, such as the one weare in now, is a long, slow process, involving gradualchanges in people’s thinking. Small changes in interestrates will not have any predictable effect on suchthinking; big changes might, but only because they havethe potential to exert a devastating impact on theeconomy as a whole. A time-honored way of restrainingspeculation in financial markets is for intellectual andmoral leaders to try to call the attention of the public toover-and underpricing errors when they occur.
It is plausible that by concealing a large short-term pricechange from the public eye, it may be possible to headoff public overreaction to the price change, and soprevent a longer-term price trend from developing inresponse to the vivid memory of a really large one-day
change. Investors need to be encouraged by experts tounderstand that true diversification largely meansoffsetting the risks that they are already locked into. Thismeans investing in assets that help insure their laborincomes, in assets that tend to rise in value when theirlabor income declines, or at least that do not tend tomove in the same direction. It also means investing inassets that help insure the equity in their single-familyhomes, in assets that tend to rise in value when theirhome value declines. Since labor income and homeequity account for the great bulk of most people’swealth, offsetting the risks to these assets is the criticalfunction of risk management.
The problems posed for policy makers by the tendencyfor speculative markets to show occasional bubbles aredeep ones. The nature of the bubbles is sufficientlycomplex and changing that one can never expect todocument the particular role of any given policy insecuring the objective of long-term economic welfare.Policies that interfere with markets by shutting themdown or limiting them, although under some veryspecific circumstances apparently useful, probablyshould not be high on the list of solutions to theproblems caused by speculative bubbles. Speculativemarkets perform critical resource-allocation functions,and any interference with markets to tame bubblesinterferes with these functions as well. It is impossible toprotect people completely without denying them thepossibility of achieving their own fulfillment. Societycannot be completely protected from the effects of wavesof irrational exuberance or irrational pessimism—emotional reactions that are themselves part of thehuman condition. Most of the thrust of national policiesto deal with speculative bubbles should take the form offacilitating more free trade, as well as greateropportunities for investors to take positions in more andfreer markets.
-
194
Classic Investment Readings: John Brooks
The Go-Go Years:The Drama and Crashing Finale ofWall Street’s Bullish 60s
What is mainly interesting today for readers of JohnBrooks is how different the market of the current erafeels from the market of the 1960s. There were very fewforeign markets, very few bonds, and almost nocomputers. On the other hand, the SEC, the NYSE, andthe Establishment loom large in Brooks’ account. TheGo-Go Years reduces fairly neatly to a series of moralitytales about the most outlandish events of the 1960s. Howtame they now all seem! They have lost their ability toshock. The reader Brooks imagines himself to bespeaking to is the same shockable character who hasvanished from the financial world over the past thirtyyears. Who on Wall Street these days thinks twice aboutspeculation? Who disapproves of large corporatetakeovers? (The above is from the foreword by MichaelLewis)
The following is an excerpt from John Brooks’ TheGo-Go Years, which was published in 1973.
In the second quarter of 1970, a portfolio consisting ofone share of every stock listed on the Big Board wasworth just about half of what it would have been worth atthe start of 1969. The high flyers that led the market of1967 and 1968—conglomerates, computer leasingcompanies, far-out electronics firms, franchisers—weredown 80, 90, or 95 percent. As of April 22, 1970, aninvestment in Ling-Temco-Vought at 170 was worth 15;in Four Seasons Nursing Centers at 91 was worth 33(and would shortly be all but worthless); in DataProcessing at 92 was worth 11; in Parvin-Dohrman at142 was worth 19; and in Resorts International at 62 wasworth 7.
Before the crash in 1929, the financial sages had insistedrepeatedly that there couldn’t be another panic like thatof 1907 because of the protective role of the FederalReserve System; before the crash of 1969-70, a latergeneration observed repeatedly that there couldn't be
another panic like that of 1929 because of the protectiverole of the Federal Reserve System and the Securitiesand Exchange Commission. In each case, a severemarket break had taken place about eight years earlier (in1921 and 1962, respectively), followed by a period ofprogressively more unfettered speculation. In each case,huge, shaky financial pyramids, built on a minimumequity base, had been erected by financiers eager to takemaximum advantage of the public’s insatiable appetitefor common stocks. Before 1929, they had been calledinvestment trusts and holding companies; in the 1960s,they were called mutual funds and conglomerates. Ineach case, there had been a single market operator towhom the public assigned the star role of official seer. Inthe 1920s, the man to whom the public ascribed almostsupernatural power to divine the future prices of stockshad been Jesse L. Livermore. In the middle 1960s, it wasGerald Tsai.
In Wall Street there has always been extraordinaryenterprise, generosity, courage, villainy on a grand scale,the drama of success and failure, even now and again a
-
195
Classic Investment Readings: John Brooks (cont.)
certain nobility. In the nineteen sixties, Wall Street stillhad a stimulating tendency, as it had had for a centuryand more, to project humanity (and specificallyAmerican humanity) on a wide screen, larger than life; tobe a stage, perhaps one of the last, for high, pure, moralmelodrama on the themes of possession, domination, andbelonging.
The nineteen sixties in Wall Street were the nineteentwenties replayed in a new and different key—differentbecause the nineteen sixties were more complex, moresophisticated, and more democratic.
On the last day of 1969, Wall Street was in an euphoricNew Year’s Eve mood. The attention of buoyantinvestors was turning from blue chips to morespeculative issues—Brunswick, Sperry-Rand, Hupp,Ampex, Transitron. Gerald M. Loeb, one of the last menon Wall Street to have vivid memories of 1929, wassaying a couple of weeks later, “If you want to sleep andsmile when the wonder shares return to reality, now isthe time to break away from the crowd.”
On January 5, 1962, the S.E.C. came out with its reporton its investigation of the American Stock Exchange,accusing a “dominant group” of having passed theessential power at the Amex back and forth amongthemselves for a decade; criticizing, in general andparticular, this group’s discipline over specialists andfloor traders; demanding swift action to end the“manifold and prolonged abuses” of the decade past; andthreatening once again to move in and assume commandif the Amex should fail to clean its own house. Later inthe year, a brilliant and spotless new president, Edwin D.Etherington, was brought in, and an entire new Amexconstitution was written and ratified that conformedlargely to the recommendations of the S.E.C. and theGustave L. Levy committee.
After the severe stock market decline in 1962, the manWall Street turned to was chairman of the S.E.C.,William Lucius Cary. The appointment proved to havebeen a brilliant one. Cary brought to the organization avigor and a drive that it had lacked for years.
In 1966, the S.E.C. brought, and for the most parteventually won, a civil complaint against Texas GulfSulphur and thirteen of its directors and employeescharging that they had made improper use of insideinformation about a Canadian ore strike, in a case thatshook Wall Street to its foundations.
The Senate passed a measure authorizing $750,000 to theS.E.C. for a two-year Special Study of the SecuritiesMarkets—such a study as had not been undertaken for ageneration.
All in all, the Special Study was a blueprint for a fair andorderly securities market, certainly the mostcomprehensive such blueprint ever drawn up. The lawthat was finally passed—the Securities ActsAmendments of 1964—had two main sections, oneextending S.E.C. jurisdiction to include a large numberof over-the-counter stocks, and the other giving thegovernment the authority to set standards andqualifications for securities firms and their employees.
The loss of power and influence of the OldEstablishment was partly its own fault. This changebrought with it a new ethical climate. It was a style alittle less dour—not less materialistic or grasping butmore candid and humorous about the materialism as wellas the manner; a style not less interested in the trappingsand icons of culture, but undoubtedly by tradition morecapable of enjoying culture; a style with more of a bentfor justice and less of an acceptance of caste. And itprobably was—although this would be hard to prove—astyle more inclined to dash and daring as opposed torespectability, less concerned about preservation ofvalues and appearances and more sympathetic towardspeculation and outright gambling.
The term “go-go” came to designate a method ofoperating in the stock market—a method that was, to besure, free, fast, and lively. The method was characterizedby rapid in-and-out trading of huge blocks of stock, withan eye to large profits taken very quickly, and the termwas used specifically to apply to the operation of certainmutual funds, none of which had previously operated inanything like such a free, fast, or lively manner.
-
196

Classic Investment Readings: John Brooks (cont.)
The year 1966 found Wall Street slowly and reluctantlybeginning to recognize itself as a marketplace for themillions rather than an élite club with a limitedmembership. That summer, the S.E.C. forced arecalcitrant New York Stock Exchange to relax slightlythe ironclad monopoly implied in its cherished Rule 394,which forbade members, except in rare instances, totransact business in listed stocks off the Exchange; underthe amended rule, they were allowed to deal off theExchange in cases where they could not fill an order at afair price on it.
By the end of August 1966, the Dow Jones IndustrialAverage, which had started the year at near 1,000, washovering around 790. Certain groups not only resistedthe downward trend but actually bucked it. Among thosein the most favored group, Ling-Temco-Vought was upalmost 70 percent for the year, City Investing was upabout 50 percent, Litton Industries and Textron were upbetween 15 and 20 percent, while InternationalTelephone and Telegraph and Gulf and WesternIndustries were up by smaller percentages but werepoised for huge rises early in 1967. The group, of course,was the one that comprised the new corporatewunderkinder of the stock market, the conglomerates.
During their most flourishing years (roughly 1966-1969),the conglomerateurs were said to represent a forward-looking form of enterprise characterized by freedomfrom all that is hidebound in conventional corporatepractice.
In 1958, James Ling gained entry to Wall Street whenWhite, Weld and Company undertook a privateplacement of Ling Electronics convertible bonds. In1959, he took over Altec, University Loudspeakers, andContinental Electronics; in 1960, Temco Electronics andMissiles; in 1961, Chance Vought Corporation. In 1965,Ling-Temco-Vought ranked number 204 on the Fortunedirectory of the largest U.S. industrial companies; in1967, 38; finally in 1969, 14. In 1968, Ling embarked onhis most ambitious venture and the one that along withother factors, would eventually bring about his downfall.It was the acquisition of Jones and Laughlin Steel, for a
cash tender of $425 million; the largest ever made byone company for another.
In 1955, Meshulam Riklis took over a firm called RapidElectrotype; in 1957 he merged it into another calledAmerican Colortype; and the combination, which was tobe Riklis’ key corporate vehicle thereafter, was namedRapid-American Corporation. By 1962, Rapid-Americancontrolled McCrory Corporation, a combine of retailstores, and Glen Alden, a consumer-products company.Eventually Riklis came to control a complex with salesof $1.7 billion, including such well-known companies asInternational Playtex, B.V.D., Schenley Industries,Lerner Shops, and RKO-Stanley Warner Theatres.
Charles Bluhdorn was a secret conservative, morecautious and calculating than he wanted to seem. In1957, just past thirty, he bought control of an automobileparts manufacturing company called Michigan Bumper.It entered the nineteen sixties with sales of $8.4 millionand a small annual deficit. Eight years and more thaneighty corporate deals later, his enterprise—Gulf andWestern Industries—would have sales of $1.3 billionand net annual income of $70 million. In the first part of1965, his was still essentially a small car-parts firm; butthat year he managed to borrow $84 million to buycontrol of New Jersey Zinc Company. After that,acquisitions followed at a dizzying rate: E.W. Bliss,Desilu Productions, South Puerto Rican Sugar,Consolidated Cigar. Undoubtedly Bluhdorn’s acquisitionmasterpiece was Paramount Pictures in 1966. He alsomade takeover overtures to Armour and to Pan AmericanAirways.
But the conglomerate movement also had serious anddangerous consequences within the world ofcorporations. With Litton openly aiming at acquiringfifty companies a year and with dozens of lesserconglomerates eager for entry into the great world ofconglomerate colossi, hardly any company anywhere inthe country that had its stock on the market could feelsafe from a takeover attempt at any time. Somecompanies became battle-scarred veterans of theconglomerate wars. Allis-Chalmers weathered serioustakeover attempts by Ling-Temco-Vought, Gulf and
-
197
Classic Investment Readings: John Brooks (cont.)
Western, and White Consolidated, one right after theother.
Not until virtually the whole business community hadbeen aroused in 1969 by the attempts of ResortsInternational (formerly Mary Carter Paints) to take overPan American World Airways, and of brash Leasco DataProcessing to forcibly marry Chemical Bank, would thetemporarily chastened conglomerates lose some of theirappetite for prey bigger and more prestigious thanthemselves.
What came to be regarded as the classic defense wasmounted in 1969 by B.F. Goodrich, the celebrated old-line rubber company, to foil a takeover attempt byNorthwest Industries (clothing, pesticides, steel, and fora time, the nation’s only profitable commuter railroad,the Chicago and North Western). It changed itsaccounting methods. It achieved not one quickly plannedmerger of its own, but two. It bought newspaper ads torevile Northwest and its tactics. It changed its charter toprovide for staggering the terms of its directors.Goodrich vigorously used its influence to getgovernment intervention in both its home state, Ohio,and in Washington.
Conglomerates’ headquarters were mostly on the twocoasts, and often enough, their corporate victims residedin the cities in between. The result was the repeatedreduction of many mid-American cities’ oldestestablished industries, from many independent venturesto subsidiaries of conglomerates based in New York orLos Angeles. Pittsburgh, for one, lost about a dozenimportant corporations through conglomerate mergers.
But the era was on its way to its end when, in January of1968, it was shown for the first time that conglomeratemanagement—even the best of it—could lose trackentirely of the progress or regress of the far-flungenterprises it ostensibly controlled and thus fail utterly ofits function.
Nineteen sixty-eight was to be the year when speculationspread like a prairie fire—when the nation, sick anddisgusted with itself, seemed to try to drown its guilt in a
frenetic quest for quick and easy money. It was a marketin which the “leaders” were neither old blue chips, likeGeneral Motors and American Telephone, nor newersolid stars, like Polaroid and Xerox, but stocks withnames like Four Seasons Nursing Centers, KentuckyFried Chicken, United Convalescent Homes, andApplied Logic. The fad, as in 1961, was for taking short,profitable rides on hot new issues through firms such asCharles Plohn; an underwriter known as “Two-a-WeekCharlie” for the number of new low-priced issues hebrought out.
Beginning on June 12, 1968, the securities markets wereclosed tight every Wednesday—a measure not used since1929—in order to give securities firms’ back offices aregular midweek breather in which to make a stab atcatching up.
Beginning on January 2, 1969, the exchanges resumed afive-day trading week with 2 p.m. closings. It wasexplained later that the Wednesday closings had beenabandoned not because they had accomplished theirpurpose, but because they had failed to do so; too manybrokerage firms, rather than using them to catch up, hadsimply treated them as holidays. Starting early in July,the exchanges began lengthening their daily tradinghours, in thirty-minute stages, until closing time wasback to 3:30 p.m.
By 1969, institutional investors had effectively takenover the New York Stock Exchange business. At thebeginning of the decade, their share of total tradingvolume had been less than a third; now they had 54percent of total public-share volume and 60 percent oftotal public-dollar volume.
The rise of institutional investing had brought into beinga new kind of high-risk brokerage operation, the blockpositioner. There were other, less salutary,developments. Many of the mutual funds themselveswere taking advantage of the permissive climate byindulging in a form of sleight-of-hand that gave theirasset value the same kind of painless, instant, andessentially bogus boost as merger accounting could give
-
198
Classic Investment Readings: John Brooks (cont.)
to conglomerate earnings. The sleight-of-hand involvedthe use of what was called “letter stock.”
Letter stock was not registered with the S.E.C., andtherefore could not legally be resold until it had beenthrough such registration; for practical purposes, it wasunmarketable. It was sold—legally—through aninvestment letter (whence the term, “letter stock”) inwhich these terms were set forth and the buyer agreednot to resell, pending registration.
Funds did what was the common practice in accountingfor letter stock: they took the market price as their baseand marked it down by one-third to allow for the shares’non-registration. It should be noted that this was severaltimes as much as the fund had just paid for them. Withno change in the market price of the stock, and with nospecific news as to the firm’s business prospects, thefund made what appeared on the books it displayedproudly to the investing public to be an investmentyielding an instant profit.
To round out the inventory of the various symptoms ofdementia that afflicted the 1968-1969 stock market—there were the hot new issues.
In stock-market history, a new-issues craze is always thelast stage of a dangerous boom. In 1961 they were tinyscientific companies put together by little churches ofglittery-eyed young Ph.D.’s, their company namesending in “ onics.” In 1968-1969, what a promoterneeded to launch a new stock was to have a “story”—aneasily grasped concept, preferably related to somecurrent national fad or preoccupation, that sounded as ifit would lead to profits. A cunning investor couldpresumably get a piece of this action by buying stockssuch as Four Seasons Nursing Centers, UnitedConvalescent Homes, International Leisure, ResponsiveEnvironments, Bonanza International, or NationalStudent Marketing Corporation.
The beginning of the year 1970 corresponds roughly tothe late spring of 1929. In each case, there were warningsignals across the land of a coming economic recession.In each case, a steep decline in second-rank stock
issues—a sort of hidden crash, since it didn’t show up inthe popular averages—was already underway. In eachcase, speculation continued to flourish, and in each case,the Federal Reserve, torn between trying to dampenspeculation and inflation on the one hand and trying tohead off recession on the other, was frantically pressingits various monetary levers to little effect.
But there was at least one big difference. Where in 1929the stock market became the national craze as it hadnever been before, in 1970, the investor mood was oneof fatalism, and the decline in trading volume wouldbecome as great a problem for Wall Street as the declinein stock prices.
Between the end of 1968 and October 1, 1970, the assetsof the twenty-eight largest hedge funds declined by 70percent. Among offshore fund management companies,in mid-October 1970, the week before GramcoManagement suspended redemptions, Gramco stock,which had once sold at 38, was then available for 1½. InJune 1972, a block of preferred shares of InvestorsOverseas Services changed hands in Geneva at one centa share.
Reform follows public crises as remorse follows privateones. In December 1970, Congress passed and PresidentNixon signed into law a bill creating a SecuritiesInvestor Protection Corporation. The Stock Exchange setabout reforming itself internally. In March 1972, itsmembers voted to reorganize its governing structurealong more democratic lines by replacing the old thirty-three-person, heavily insider-dominated board with anew board comprising twenty-one members, ten of themfrom outside Wall Street, and a new salaried chairman tosupercede the traditionally unpaid, nominally part-timechairmen of the past.
From the September 1929 peak to the nadir of the GreatDepression in the summer of 1932, the Dow JonesIndustrial Average dropped from 381 to 36, or just over90 percent. From the December 1968 peak to the May1970 bottom, the same index dropped from 985 to 631,or about 36 percent. One analyst compiled a list of thirtyleading glamour stocks of the nineteen sixties—ten
-
199
Classic Investment Readings: John Brooks (cont.)
leading conglomerates including Litton, Gulf andWestern, and Ling-Temco-Vought, ten computer stocksincluding IBM, Leasco, and Sperry Rand, and tentechnology stocks including Polaroid, Xerox, andFairchild Camera. The average 1969-1970 decline of theten conglomerates, the analyst found, had been 86percent; of the computer stocks, 80 percent; of thetechnology stocks, 77 percent. The average decline of allthirty stocks in this handmade neo-Dow had been 81percent.
In 1929 there were, at the most, four or five millionAmericans who owned stock; in 1970, there were about31 million. Losses, then, of $300 billion in a year and ahalf, spread over more than 30 million investors—suchwere the bitter fruits of the go-go years; of theconglomerates and their promoters’ talk of synergismand of two and two making five; of the portfolio wizardswho wheeled and dealt with their customers’ money; ofthe works of bottom-line fiction written by the creativeaccountants; of the garbage stock dumped on the marketby two-a-week underwriters; of the stock salespeoplewho acted as go-betweens for quick commissions; of themutual funds that got instant performance by writing upthe indeterminate value of unregistered letter stock.
In the latter nineteen sixties, the capital structure of WallStreet itself became unsafe and unsound to a degree that,when hard times struck, was revealed as nothing lessthan a scandal. Not until 1970 did the first Wall Streetfirm raise money for its operations from outside byselling its own stock to the public, and it took a changein the New York Stock Exchange’s constitution to makesuch a sale possible. The S.E.C. and the Stock Exchangehad allowed Wall Street firms to comply with the netcapital rule—imposed for the protection of the firmsthemselves as well as that of their customers—withcapital that was essentially a mirage.
Capital troubles began to crop up in the backlash of the1968 paperwork crisis.
Early in 1970, as the continuing decline in prices andvolume made the situation for brokers progressivelyworse, a wave of brokerage mergers arose. McDonnell
and Company closed its doors; in Los Angeles, Kleiner,Bell withdrew from the brokerage business; and Hayden,Stone and Company, an eighty-four-year-old giant notfar from the core of the Wall Street Establishment,shortly thereafter erupted into the first phase of the crisisthat almost brought Wall Street low for good.
Several more firms, the largest of them Blair andCompany, went under in June and July. By the last weekof August three more firms—Robinson and Company,First Devonshire Corporation and Charles Plohn andCompany—were suspended for capital deficiencies andwent into liquidation.
One of the largest crises involved Goodbody andCompany, for decades a pillar of the brokeragecommunity—its co-founder in 1891 had been thelegendary Charles H. Dow. Merrill Lynch was broughtin to take on Goodbody.
In 1970, F.I. du Pont joined forces with two otherbrokerage houses, Glore, Forgan and Staats, and Hirschand Company, to form a new organization to be calledF.I. du Pont-Glore, Forgan and Company. In the lastweek of April, an agreement was reached that Ross Perotand his colleagues would lend $55 million, in exchangefor at least 80 percent control of F.I. du Pont.
A study of mutual funds by Irwin Friend, Jean Crockette,and Marshall Blume of the faculty of the WhartonSchool, published in August 1970, by the TwentiethCentury Fund, resulted in the startling conclusion that“equally weighted or unweighted investment in NewYork Stock Exchange stocks would have resulted in ahigher rate of return than that achieved by mutual fundsin the 1960-1968 period as a whole.”
If Wall Street’s nineteen sixties were in many ways areplay of its nineteen twenties—refuting the optimism ofthose who believe that reform can make social historyinto a permanent growth situation rather than a cyclicalstock—its go-go years were also utterly characteristic ofthe larger trends of their own time, reflecting andprojecting all the lights and shadows of a troubled,confused, frightening decade the precise like of which
-
200

Classic Investment Readings: John Brooks (cont.)
had never been seen before and surely will not be seenagain.
Full disclosure in the nineteen sixties market was largelya failure, giving the small investor the semblance ofprotection without the substance. And that failure raisedthe question of just how much full disclosure can everaccomplish. Rules can be tightened, as many wereduring the decade and more will be in the future; but assurely as night follows day, the tricksters of Wall Streetand its financial tributaries will be ever busy topping thenew rules with new tricks, and there is no reason todoubt that the respectable institutions will again playPied Piper by catching the quick money fever the nexttime it is epidemic.
All that notwithstanding, Wall Street is changing in ademocratic direction. After it graduated, around the
beginning of this century, from being chiefly an arenafor the depredations of robber barons and themanipulations of sharp traders in railroad bonds, WallStreet became not only the most important financialcenter in the world but also a national institution. In thenineteen twenties it was in a real sense what WallStreeters always cringed to hear it called, a private club.
In the nineteen sixties, despite declining aristocraticcharacter and political influence, it was still those things,playing out week by week and month by month itsconcentrated and heightened version of the largernational drama. But after the convulsion with which thedecade and that particular act in the drama ended, itsdays in the old role seemed to be numbered.
Copyright ©1973 by John Brooks. Used by permissionfrom John Wiley & Sons.
-
201
Classic Investment Readings: David F. Swensen
Pioneering Portfolio Management
The following is an excerpt from David F. Swensen’sPioneering Portfolio Management. Mr. Swensen is theChief Investment Officer at Yale University, where hehas managed the university’s endowment for more than15 years. All opinions expressed herein are those of theauthor and do not necessarily reflect those of MorganStanley.
From the Forward by Charles D. Ellis
David Swensen and his team meet regularly with nearly100 current investment managers; analyze many, manypotentially interesting proposals; conduct due diligenceon large numbers of prospective new managers; examineeach manager’s investment performance versusexpectations; and run Monte Carlo simulations to“stress test” the portfolio under various possible marketscenarios to work out the probable impact of bothintended and unintended risks.
One secret of Yale’s success has been David Swensen’sability to engage the committee in governance and not ininvestment management. Contributing factors include:selection of committee members who are experienced,hard-working, and personally agreeable; extensivedocumentation of the due diligence devoted to preparingeach investment decision; and full agreement on theevidence and reasoning behind the policy frameworkwithin which specific investment decisions will be made.
David Swensen was concerned that a “how-to” bookmight make it look “too easy.” He felt that otherinstitutions (particularly those with smaller endowmentfunds) might be attracted by the impressive resultsachieved in the past several years for Yale. They mightnot have the internal staff or the organizational structureand discipline required to sustain commitments throughthe good and bad markets that are encountered in thefinancial arena. David Swensen knows that sustainedcommitment is necessary for success with out-of-the-mainstream portfolio structures.
Introduction
Investing with a time horizon measured in centuries tosupport the educational and research mission of society’scolleges and universities creates a challenge guaranteedto engage the emotions and intellect of fund fiduciaries.A rich understanding of human psychology, a reasonableappreciation of financial theory, a deep awareness ofhistory, and a broad exposure to current events allcontribute to the development of well-informed portfoliostrategies. Asset allocation relies on a combination oftop-down assessment of asset class characteristics andbottom-up evaluation of asset class opportunities.
Among the many important investment activities thatrequire careful oversight, maintaining policy assetallocation targets stands near the top of the list. Far toomany investors spend enormous amounts of time andenergy constructing policy portfolios, only to allow theallocations they established to drift with the whims of themarket. The process of rebalancing requires a fair degreeof activity, buying and selling to bring underweight andoverweight allocations to target.
-
202
Classic Investment Readings: David F. Swensen (cont.)
A second theme concerns the prevalence of issues thatinterfere with the successful pursuit of institutionalgoals. Nearly every aspect of funds management suffersfrom decisions made in the self-interest of the decisionmakers, not in the best interests of the fund. The wedgebetween principal goals and agent actions causesproblems at the highest governance level, causing somefiduciary decisions to fail to serve the interests of aperpetual life endowment fund. Individuals desireimmediate gratification, leading to overemphasis ofpolicies expected to pay off in a relatively short timeframe. Every aspect of the investment managementprocess contains real and potential conflicts between theinterests of institutional funds and the interests of theagents engaged to manage portfolio assets.
Market timers and security selectors face intenselycompetitive environments in which the majority ofparticipants fail. While private markets provide a muchgreater range of mispriced assets, investors fare littlebetter than their marketable security counterparts as theextraordinary fee burden typical of private equity fundsalmost guarantees delivery of disappointing risk-adjustedresults.
The staff resources required to create portfolios with areasonable chance of producing superior asset classreturns place yet another obstacle in the path ofinstitutions considering active management strategies.Promising investments come to light only after thoroughculling of dozens of mediocre alternatives. Hiring andcompensating the personnel needed to identify out-of-the-mainstream opportunities imposes a burden too greatfor many institutions to accept.
Establishing and maintaining an unconventionalinvestment profile requires acceptance of uncomfortablyidiosyncratic portfolios, which frequently appeardownright imprudent in the eyes of conventionalwisdom.
Investment and Spending Goals
The high-risk, high-return investment policy best suitedto serve asset preservation conflicts with the low-risk,low-return investment approach more likely to produce
stable distributions to the operating budget. Whilefiduciary principles generally specify only that theinstitution preserve the nominal value of a gift, toprovide true permanent support, institutions mustmaintain the inflation-adjusted value of a gift.
In a period of high inflation accompanied by bearmarkets for stocks and bonds, spending at a levelindependent of the value of assets creates the potential todamage the endowment fund permanently. Spendingpolicies specify the trade-off between protectingendowment assets for tomorrow’s scholars and providingendowment support for today’s beneficiaries. Sensiblepolicies cause current-year spending to relate to: (i)prior-year endowment distributions; and (ii)contemporaneous endowment values, with the formerfactor reducing fluctuation in operating budget flows byproviding a core on which planners can rely and thelatter factor protecting purchasing power by introducingsensitivity to market influences.
Yale University’s spending policy relates current-yearspending to both the current endowment market valueand the previous level of spending from endowment.Under Yale’s rule, spending for a given year equals 70percent of spending in the previous year, adjusted forinflation, plus 30 percent of the long-term spending rateapplied to the endowment’s current market level.
By reducing the impact on the operating budget of theinevitable fluctuations in endowment value caused byinvesting in risky assets, spending rules that employ anaveraging process insulate the academic enterprise fromunacceptably high year-to-year swings in support.Because sensible spending policies dampen theconsequences of portfolio volatility, portfolio managersgain the freedom to accept greater investment risk withthe expectation of achieving higher return withoutexposing the institution to unreasonably largeprobabilities of significant budgetary shortfalls. Thedistinction between current income and capitalappreciation can be too easily manipulated to provide asound foundation for spending policy.
-
203
Classic Investment Readings: David F. Swensen (cont.)
Target spending rates among endowed institutions rangefrom a surprisingly low 1.25 percent of the endowmentto an unsustainably high 10.0 percent of the endowment.More than 90 percent of institutions employ target ratesbetween 4.0 percent and 6.0 percent, with nearly halfusing a 5.0 percent rate. The appropriate rate of spendingdepends on the risk and return characteristics of theinvestment portfolio, the structure of the spendingpolicy, and the preferences expressed by trusteesregarding the trade-off between stable budgetary supportand asset preservation.
Investment Philosophy
Recognizing that decisions regarding the relativeimportance of asset allocation, market timing, andsecurity selection lie within an investor’s purview servesas an important starting point for policymakers. Insteadof passively accepting the overwhelming importance ofasset allocation, knowledgeable investors treat eachsource of return as a significant independent factor ingenerating portfolio returns.
Focus on asset allocation relegates market timing andsecurity selection decisions to the background, reducingthe degree to which investment results depend onmercurial, unreliable factors. For sensible investors,defining an institution’s policy portfolio constitutes thecentral activity of investment management. Selecting theasset classes for a portfolio constitutes a criticallyimportant set of decisions, contributing a large measureto a portfolio’s success or failure. Identifying appropriateasset classes requires focus on functional characteristics,considering each asset’s potential to deliver returns andmitigate portfolio risk.
Maintaining an equity bias and following diversificationprinciples provide the foundation for building stronginvestment portfolios. Market timers who increase therisk profile of a portfolio by overweighting a risky assetat the expense of lower-risk positions face a differentchallenge. Fiduciaries must consider the advisability ofmoving risk beyond policy portfolio levels. Seriousinvestors avoid the temptation of attempting to timemarkets.
An inverse relationship exists between efficiency in assetpricing and the appropriate degree of activemanagement. Passive management strategies suit highlyefficient markets, such as U.S. Treasury bonds, wheremarket returns drive results and active management addsvery little to returns. Active management strategies fitinefficient markets, such as private equity, where marketreturns contribute very little to ultimate results andinvestment selection provides the fundamental source ofreturn. Active managers willing to accept illiquidityachieve a significant edge in seeking high risk-adjustedreturns. Because market players routinely overpay forliquidity, serious investors may benefit by avoidingoverpriced liquid securities and locating bargains in lesswidely followed, less liquid market segments.
The pursuit of value-oriented strategies enhancesopportunities to achieve security selection success. Valuecan be purchased, by identifying assets trading belowfair value, or created, by bringing unusual skills toimprove corporate operations. Value investors tend tooperate with a margin of safety unavailable to lessconservative investors.
By identifying high-return asset classes, not highlycorrelated with domestic marketable securities, investorsachieve diversification without the opportunity costs ofinvesting in fixed income. The most common high-returndiversifying strategy for a U.S. investor involves addingforeign equities to the portfolio. Studies of long-termreturns in the United States ignore the fact that investorsin foreign markets have experienced less favorableoutcomes, sometimes with dramatically worse results.
Because cash represents a poor asset class for investorswith long time horizons, market timing strategiesemploying cash pose particularly great dangers toendowment assets. If investors mistakenly overweightcash and underweight higher expected return assets,subsequent rallies in long-term asset prices might causepermanent impairment of value.
Investors hoping to profit in the short run fromrebalancing trades face nearly certain long-rundisappointment. Over long periods of time, portfolios
-
204
Classic Investment Readings: David F. Swensen (cont.)
that are allowed to drift tend to contain ever increasingallocations to risky assets, as higher returns cause riskierpositions to crowd out other holdings. The fundamentalpurpose of rebalancing lies in controlling risk, notenhancing return. Rebalancing trades keep portfolios atlong-term policy targets by reversing deviations resultingfrom asset class performance differentials. Disciplinedrebalancing activity requires a strong stomach andserious staying power.
Rising equity prices provide a similar set of challenges.In a sustained bull market, rebalancing appears to be alosing strategy as investors constantly sell assetsshowing relative price strength. Years go by withoutreward other than the knowledge that the portfolioembodies the desired risk-reward characteristics. Likemany other contrarian pursuits, rebalancing frequentlyappears foolish as momentum players reap short-termrewards from going with the flow.
Markets with inefficiently priced assets ought to befavored by active managers; markets with efficientlypriced assets should be approached by active managerswith great caution. Over time, managers in efficientmarkets gravitate toward closet indexing, structuringportfolios with only modest deviations from the market.
U.S. Treasury securities, arguably the most efficientlypriced asset in the world, trade in staggering volumes inmarkets dominated by savvy financial institutions. Thespread between first- and third-quartile results for activemanagers measures an astonishingly small 1.2 percentper annum for the decade ending December 31, 1997.Large-capitalization equities represent the next rung ofthe efficiency ladder, with a range of 2.5 percentbetween top and bottom quartiles. Less efficiently pricedinternational equities show a range of 2.9 percent perannum. Real estate, venture capital, and leveragedbuyouts exhibit dramatically broader dispersions ofreturns. For the ten-year period ending December 31,1997, real estate returns show a range of 4.7 percentbetween the first and third quartiles, while leveragedbuyouts and venture capital exhibiting even moreextreme 13.0 and 21.2 percent per annum spreads.
Selecting top-quartile managers in private markets leadsto much greater rewards than in public markets.Ironically, identifying superior managers in the relativelyinefficiently priced private markets may in fact proveless challenging than in the efficiently priced marketablesecurities markets. Greater inefficiency in the marketenvironment for an asset class may not lead to greateraverage success. Private markets provide a case in point.Median results for venture capital and leveraged buyoutsdramatically trail those for marketable equities, despitethe higher risk and greater illiquidity of private investing.Over the decade ending December 31, 1997, investmentperformance deficits relative to the S&P 500 amountedto 5.9 percent annually for venture capital and 1.4percent annually for leveraged buyouts, numbers thatwould be even higher after risk adjustment. In order tojustify including private equity in the portfolio, investorsmust believe they can select top-quartile managers.Anything less fails to compensate for the time, effort,and risk entailed in the pursuit of nonmarketableinvestments.
Errors of underinclusion and overinclusion tend to biasmanager performance data, limiting the usefulness ofconsultants’ reports in understanding active managementresults. Underinclusion occurs when managers disappearwithout a trace; overinclusion results when new entrantscontribute their historical results to the database.Compilations of returns data sometimes include onlyresults of managers active at the time of the study.Discontinued products and discredited managersdisappear, coloring the returns data with an optimistictint. The potential also exists for overinclusion to exertfurther upward pressure on reported results. Since onlysuccessful managers rise to the level necessary to gainthe attention of the consulting industry, adding completerecords of new entrants produces an upward bias inreported results.
Survivorship bias in the distributions of active managerreturns fundamentally alters investor attitudes towardactive management. Data indicating that the majority ofmanagers beat the index encourage investors to play theactive management game, while numbers showing that apreponderance of managers fail to match index returns
-
205
Classic Investment Readings: David F. Swensen (cont.)
discourage active management. The positive tiltintroduced by survivorship bias no doubt leads toexcessive confidence regarding active managementstrategies.
Illiquidity tends to foster appropriate long-term investorbehavior. Rather than relying on liquid markets to tradeout of mistakes, investors in illiquid securities enter intolong-term arrangements, purchasing part ownership in abusiness with which they have to live. As a consequence,increased care, thoroughness, and discipline representhallmarks of successful investors in less liquid assets.
Consistent investment success follows most reliablyfrom pursuing value-based strategies, in which investorsacquire assets at prices below fair value. Investorswishing to implement value-oriented programs requireunusual skill, intelligence, and energy. Without asignificant edge relative to other market participants,investors face likely failure. Moreover, valueopportunities tend to be out of favor with mainstreaminvestors, demanding courage of conviction to initiateand maintain contrarian positions. On the other hand,mindless contrarian investing poses dangers toportfolios. Sometimes popular companies deservepremium valuations. Sometimes out-of-favor companiesfail to recover, justifying the market’s discountedvaluation.
In fact, value investors seek to purchase companies at adiscount to fair value, not to purchase distressed assetsper se. Superb opportunities to purchase assets at pricessignificantly below fair value tend to be hidden in deeplyout-of-favor market segments. At market bottoms, thebroad consensus so loathes certain asset types thatinvestors brave enough to make commitments find theirsanity and sense of responsibility questioned. Managerssearching among unloved opportunities face greaterchances of success, along with almost certain tirades ofcriticism in the event of failure.
An investment philosophy defines an investor’sapproach to generating portfolio returns, describing inthe most fundamental fashion the tenets that permeatethe investment process. Market returns stem from three
sources—asset allocation, market timing, and securityselection—with each source of return providing a toolfor investors to use in attempting to satisfy institutionalgoals. Asset allocation should seek to create a diversifiedportfolio with equity-oriented asset classes that behave ina fundamentally different fashion from one another,providing an important underpinning to the investmentprocess.
Market timing causes investors to hold portfolios thatdiffer from policy targets, jeopardizing a fund’s ability tomeet long-term objectives. Often driven by fear or greed,market timing tends to detract from portfolioperformance. Many investors practice an implicit form ofmarket timing by failing to maintain allocations at long-term policy targets. Risk control requires regularportfolio rebalancing, ensuring that portfolios reflect theinvestor’s preferences.
Active security selection plays a prominent role in nearlyall institutional investment programs, despite the poorrelative results posted by most investors. Investorsincrease the probability of success by focusing oninefficient markets, which present the greatest range ofopportunities. Accepting illiquidity pays outsizeddividends to the patient long-term investor, whileapproaching markets with a value orientation provides amargin of safety. Even if investors approach activemanagement programs with intelligence and care,efficiency in pricing assets creates great difficulty inidentifying and implementing market-beating strategies.
Asset Allocation
Defining and selecting asset classes constitute the initialsteps in producing a portfolio. Investors begin byselecting asset classes which promise to meetfundamental investment goals. Many portfolios requireassets likely to generate equity-like returns, such asdomestic and foreign equities, absolute return strategies,and private equity. To mitigate equity risks, portfoliosalso may include assets such as fixed income and realestate.
Asset class distinctions rest on broad differences infundamental character: debt versus equity, private versus
-
206
Classic Investment Readings: David F. Swensen (cont.)
public, liquid versus illiquid, domestic versus foreign,inflation-sensitive versus deflation-sensitive. Whilemarket participants disagree on the appropriate numberof asset classes, fewer may very well be better. Portfoliocommitments must be large enough to make a difference.Committing less than 10 percent of an investor’s assetsto a particular type of investment may make little sense.
The recently issued Treasury Inflation-ProtectedSecurities (TIPS) probably should not be classified asfixed-income securities. Traditional fixed income assetsrespond to unanticipated inflation by declining in price,as the future stream of fixed payments becomes worthless. In contrast, inflation-indexed bonds respond tounexpected price increases by providing a higher return.When two assets respond in opposite fashion to the samecritically important variable, those assets belong indifferent asset classes.
Careful investors define asset classes in terms offunction, relating security characteristics to the roleexpected from a particular group of investments. In thecase of fixed income, the introduction of credit risk, callrisk, and currency risk tend to diminish disaster-hedgingattributes. As a separate asset class, high-quality foreignbonds hold little interest. The combination of low,bondlike expected returns and foreign exchangeexposure negate any positive attributes associated withnon-domestic fixed income.
Although the asset allocation process necessarilyinvolves quantitative tools, unless statistical analysisrests on reasonable judgment, the resulting portfoliostands little chance of meeting investors’ needs.Quantitative analysis provides essential underpinnings tothe portfolio structuring process, forcing investors totake a disciplined approach to portfolio construction. Forexample, the systematic specification of inputs for anasset allocation model clarifies the central issues inportfolio management.
Mean-variance optimization identifies efficientportfolios, which for a given level of risk have thehighest possible return. Using inputs of expected return,expected risk, and expected correlation, the optimization
process evaluates various combinations of assets,ultimately identifying superior portfolios. An efficientportfolio dominates all others producing the same returnor exhibiting the same risk. In other words, for a givenrisk level, no other portfolio produces a higher returnthan the efficient portfolio. Similarly, for a given returnlevel, no other portfolio exhibits lower risk than theefficient portfolio. Note that the definition of efficiencyas implied in this context relates entirely to risk andreturn. Mean-variance optimization fails to considerother asset class characteristics.
Practitioners generally assume that normal, or bell-curve-shaped, distributions describe asset classcharacteristics, allowing complete specification of thedistribution of returns with only a mean and a variance.Although using normal distributions facilitatesimplementation of mean-variance analysis, securityreturns may include significant nonnormalcharacteristics, limiting the value of the conclusions.Unconstrained mean-variance results usually providesolutions unrecognizable as reasonable portfolios. Mean-variance optimization significantly overweights(underweights) those assets that have large (small)estimated returns, negative (positive) correlations andsmall (large) variances. Correlations specify the mannerin which the returns of one asset class tend to vary withthe returns of other asset classes, quantifying thediversification power of combining asset classes thatrespond differently to forces that drive returns.
Evidence suggests that the distributions of securityreturns might not be normal, with markets exhibitingmore extreme events than would be consistent with abell-shaped curve distribution. A general rule of thumb isthat every financial market experiences one or moredaily price moves of four standard deviations or moreeach year. And in any year, there is usually at least onemarket that has a daily move greater than ten standarddeviations. In fact, investors may care more aboutextraordinary situations, such as the 1987 stock marketcrash, than about outcomes represented by the heart ofthe bell-shaped curve distribution.
-
207
Classic Investment Readings: David F. Swensen (cont.)
Mean-variance optimization assumes that expectedreturn and risk completely define asset classcharacteristics. The framework fails to consider otherimportant attributes, such as liquidity and marketability.In fact, the inclusion of less liquid assets in a mean-variance framework raises material issues. Mostfrequently, mean-variance optimization involves analysisof annual series of return and risk data. The analysisimplicitly assumes an annual rebalancing of portfolioallocations. That is, if stocks have moved above targetand bonds below, then on the relevant anniversary date,investors sell stocks and buy bonds, restoring targetallocations. Clearly, less marketable assets, such asprivate equity and real estate holdings, cannot berebalanced annually in a low-cost, efficient manner.
The way in which asset classes relate to each other maynot be stable. Most investors rely heavily on historicalexperience in estimating quantitative inputs, yetcontinuous structural evolution is sufficient to causehistorical correlations to be of questionable use inbuilding portfolio allocations. Even more disturbing,market crises tend to cause otherwise distinct markets tobehave in a similar fashion. In the final analysis, both thefundamental shortcoming and the basic attraction ofquantitative analysis stem from reducing a rich set ofasset class attributes to a neat, compact package ofprecisely defined statistical characteristics. Because theprocess involves material simplifying assumptions,adopting the unconstrained asset allocation pointestimates produced by mean-variance optimizationmakes little sense.
The limitations of mean-variance analysis argue forinclusion of qualitative considerations in the assetallocation process. Judgment might be incorporated byapplying reasonable constraints to particular asset classallocations. Limiting asset allocation responses byconstraining asset class movements represents a sensiblemodification of the optimization process. Care must betaken, however, to avoid using asset class constraintssimply to fashion a reasonable-looking portfolio. Takento an extreme, placing too many constraints on theoptimization process causes the model to do nothingother than reflect the investor’s original biases.
Return and risk expectations constitute the heart of anyquantitative assessment of portfolio alternatives. Whilehistorical experience represents a reasonable startingpoint in developing a set of forward-looking data,investors seeking to create truly useful conclusions mustmove beyond simply plugging historical numbers intothe mean-variance optimizer. Mean reverting behavior insecurity prices implies that periods of abnormally highreturns follow periods of abnormally low returns, andvice versa. If prices tend to revert to the mean, thenreturn expectations must be adjusted to dampenexpectations for high fliers and boost forecasts for poorperformers. Structural changes in markets force analyststo weight recent data more heavily, de-emphasizingnumbers reflecting earlier, sometimes dramaticallydifferent environments.
In running mean-variance optimization, data on expectedreturns provide the most powerful determinant of results,demanding the greatest share of the quantitativemodeler’s attention. Forecasts of the variances constitutethe second most significant collection of variables, whileassumptions regarding correlations prove least critical tothe process. Fortunately, the most intuitive variables—expected returns and variances—prove to be moreimportant to the modeling process than the less intuitivecorrelations.
Over the long sweep of time, as fixed income investorsfound returns eroded by spells of unanticipated inflation,bonds provided mediocre real returns of 1.2 percent perannum with risk, as measured by the standard deviationin annual returns of 6.5 percent. At the beginning of theNew Millennium, the Yale University Investment officeassumes an expected real return of 2 percent for bonds,with risk (standard deviation) of 10 percent.
Combining mean-reverting tendencies with theobservation that the equity risk premium seems todecline secularly justifies an assumption for U.S. equityreturns of 6 percent in real terms, with a standarddeviation of 20 percent. Foreign developed marketsreturn levels are assumed to be 6 percent real, with riskof 20 percent, matching expectations for U.S. equities,while corresponding closely to historical levels for
-
208
Classic Investment Readings: David F. Swensen (cont.)
developed foreign markets. Expected real returns of 8percent compensate holders of emerging market equitiesfor accepting increased risk of 30 percent standarddeviation of returns.
Alternative assets exist outside established markets. Nobenchmark returns provide guidance to investors seekingto model asset characteristics. Past data, limited in scope,generally describe active manager returns, with resultsinflated by substantial survivorship bias. Absolute returninvesting is dedicated to exploiting inefficiencies inpricing marketable securities. Absolute return managersattempt to produce equity-like returns uncorrelated totraditional marketable securities through pursuit ofinvestments in event-driven and value-driven strategies.Event-driven strategies, including merger arbitrage anddistressed security investing, depend on the completionof a corporate finance transaction such as a merger orcorporate liability restructuring. Value-driven strategiesemploy offsetting long and short positions to eliminatemarket exposure, relying on market recognition ofmispricings to generate returns. Absolute returninvestments generally involve transactions withrelatively short time horizons, ranging from severalmonths to a year or two.
Real estate markets provide dramatically cyclicalreturns. Real estate embodies characteristics of both debtand equity. Lease payments, the contractual obligationsof tenants, resemble fixed income instruments, while theproperty’s residual value contains equity-like attributes.Because real estate data come predominantly frominfrequently conducted appraisals, reported returns fail tocapture true economic volatility.
Private equity consists primarily of venture capital andleveraged buyout participations, assets that respond tomarket influences in a manner similar to marketableequities. In fact, both venture and buyout investmentsresemble high-risk equity assets. Since fundamentalcharacteristics of private investments created throughfinancial engineering suggest strong similarity tomarketable security counterparts, the argument forsegregating such private assets rests primarily ondifferences in liquidity.
A stronger justification for treating private equity as adistinct asset class stems from value-added managementby investment principals. Superior potential for valuecreation, combined with liquidity and structuraldifferences, supports treatment of private equity as adistinct asset class. Illiquidity and higher risk in privateassets demand a substantial premium over domesticequity’s expectations of 6 percent returns with 20 percentrisk. Assuming that private equity investments generate12.5 percent returns with a risk level of 25 percentrepresents an appropriately conservative modification ofthe historical record of 19.1 percent returns accompaniedby a 20.0 percent risk level.
Under normal circumstances, bond returns exhibit highpositive correlation to stock returns. With unexpectedinflation, the long-term correlation between stocks andbonds proves to be low, providing substantialdiversification to the portfolio. During periods ofdeflation, low or negative correlation between stocks andbond helps to diversify portfolio assets.
Despite mean-variance optimization’s potential forpositive contribution to portfolio structuring, dangerousconclusions may be reached if poorly consideredforecasts enter the modeling process. Investors relyingon backward-looking data in cyclical markets invitewhipsaw. In the deeply cyclical real estate market,historical data suggest high allocations at market peaks(when returns have been high and risks low) and lowallocations at market troughs (when returns have beenlow and risks high).
Interpreting simulated results requires a combination ofquantitative and qualitative judgment. Some portfoliosfall from consideration on the basis that they aredominated by others that have lower probabilities offailing to meet each of the goals. Other portfolios failbecause they satisfy one goal at the expense of the other.Simulations liberate mean-variance analysis fromanother of its practical limitations: the use of one-yearinvestment periods. Theoretically, mean-varianceoptimization ought to be conducted for periodscommensurate with the investment horizon of theinvestor. Three-year, five-year, or even ten-year periods
-
209
Classic Investment Readings: David F. Swensen (cont.)
would be appropriate for most long-term investors.Unfortunately, data limitations force the use of annualperiods. Reasonably long time series of data do not existfor many asset classes, including foreign equities, realestate, venture capital, and leveraged buyouts. Without along time series, investigators lack a sufficient number ofindependent three-year, five-year, or ten-year data pointsto draw robust conclusions.
Failure to achieve investment goals defines portfolio riskin the most fundamental way. Goals, and risks followingtherefrom, must be described in a manner allowinginvestors to understand the trade-offs between variousportfolios. By evaluating portfolios in terms ofprobabilities of maintaining purchasing power andproviding stable returns patterns, investors understandand choose among possibilities defined in the context ofcriteria directly relevant to the investor’s own objectives.
Portfolios generated through a combination of mean-variance optimization and forward-looking simulationsuffer from a number of limitations. The results dependon assumptions regarding future returns, risks, andcovariances. If the quality of return and risk assumptionshappened to represent the greatest hurdles, conclusionsreached through quantitative analysis would still be quiterobust. More serious problems stem from instability inthe risk and covariance characteristics of asset classes.Questions regarding the nature of distributions ofsecurity returns and the stability of relationships betweenasset classes pose serious challenges to quantitativemodeling of asset allocation.
Portfolio Management
The degree of risk assumed in pursuit of investmentreturns constitutes the core issue in investmentmanagement. By determining which risky assets are heldand in what proportions, the asset allocation decisionresides at the center of portfolio managementdiscussions. If investors allow actual portfolio holdingsto differ materially from asset class targets, the resultingportfolio fails to reflect the risk and return preferencesoriginally expressed through the asset allocation process.By holding assets in proportion to policy targets, andgenerating asset class returns commensurate with market
levels, investors improve their odds of achievinginvestment goals without slippage.
Dealing with the over- or under-allocation resulting fromilliquid positions creates a tough challenge for thethoughtful investor. Portfolio managers willingly acceptthe risks associated with active management, expectingthat investment skill will ultimately provide positiveresults. But because the expected excess returns arrive inunpredictable fashion, if at all, the actively managedasset class might suffer from periods of materialunderperformance, opening a gap between reality and thehoped-for active management result. Leverage, bothexplicit and implicit, poses another challenge to faithfulimplementation of policy asset allocation targets.Inherent in certain derivatives positions, leverage lurkshidden in many portfolios, coming to the light only wheninvestment disaster strikes.
Most market participants treat risk with littlesophistication. Portfolio managers spend enormousamounts of time, energy, and resources on assetallocation projects, implement the recommendations, andthen let portfolio allocations drift with the markets. Afterestablishing asset allocation policies, risk controlrequires regular rebalancing to policy targets.Movements in the prices of financial assets inevitablycause asset class allocations to deviate from target levels.For instance, a decline in U.S. stock prices and anincrease in bond prices leads stocks to be underweightand bonds to be overweight relative to target, causing theportfolio to have lower than desired expected risk andreturn characteristics. To restore the portfolio to targetallocations, rebalancing investors purchase stocks andsell bonds.
Investors debate the frequency with which portfoliosshould be rebalanced. Some follow the calendar,transacting monthly, quarterly, or annually. Owners ofprivate assets must modify rebalancing activity. At anypoint in time, illiquid holdings of venture capital,leveraged buyouts, and real estate are unlikely to matchtargeted levels. Cash, bonds, and absolute returninvestments provide reasonable temporary alternativesfor private asset underallocations.
-
210

Classic Investment Readings: David F. Swensen (cont.)
The strategy of investing underallocations of privateassets in fundamentally similar marketable securitiesholds superficial appeal. For instance, while attemptingto build a venture capital portfolio, allocation shortfallsmight be invested in a portfolio of small technologystocks. Unfortunately, the strategy exposes investors tothe risk that venture partnerships call funds whentechnology stocks trade at depressed levels, causing salesto be made at an inopportune time. Using short-duration,lower-risk assets to substitute for generally higher-returnprivate assets decreases expected portfolio return andrisk levels; the opposite result occurs when reducingmarketable security positions to accommodate a privateequity overweighting.
Rebalancing ensures that investors face the risk profileembodied in the policy portfolio. By allowing portfolioallocations to drift with the whims of the market,portfolio risk and return characteristics changeunpredictably. In fact, over long periods of time, withoutrebalancing, portfolio allocations move toward thehighest return asset, increasing the overall risk level ofthe portfolio. Deviations from benchmark returnsrepresent an important source of portfolio risk. Amongthe powerful ways in which asset classes might differfrom benchmarks are with respect to size, sector, andstyle.
Purposeful, thoughtful strategic bets might generate risk-adjusted excess returns for the portfolio. Strategicportfolio biases add value only if implemented in adisciplined fashion, after thoughtful analysis, with anappropriately long investment horizon.
Strong biases within asset classes may reward strong-willed, adventuresome investors, but they pose seriousdanger to investors with weak hands. The temptation tofire underperforming managers often proves too great toresist. When underperformance stems from anunderlying portfolio bias, the fund exposes itself to apotential whipsaw—firing a manager with the wind in itsface and hiring a manager with the wind at its back, alldone just as the wind is about to change.
By following standard Wall Street practice of referring tomany reinvestment strategies as “arbitrages,” marketparticipants obtain a false sense of security. Webster’sDictionary defines arbitrage as “the often simultaneouspurchase and sale of the same or equivalent security (asin different markets) in order to profit from pricediscrepancies.” While occasional mispricings of futurescontracts for stocks and bond relative to cash marketsprovide fleeting arbitrage opportunities, other so-calledarbitrages do not involve “the same or equivalentsecurity,” thereby exposing assets to substantial risk.When active management results appear too good to betrue, they probably are. As much as people want tobelieve that success comes from intelligence and hardwork, good fortune generally plays at least a supportingrole. Investors must have sufficient confidence ininvestment strategies to increase commitments wheninevitable setbacks occur.
Placing asset allocation targets at the center of theportfolio management process increases the likelihood ofinvestment success by ensuring that portfolios rest on thestable foundation of policy targets. Disciplinedrebalancing techniques provide the basis for creatingportfolios that reflect articulated risk and returncharacteristics. Attractive investment opportunitiesfrequently contain elements of illiquidity, introducingsome rigidities into a portfolio’s asset allocation. Byforcing investors to hold positions inconsistent withtargeted levels, illiquid assets force overall portfoliocharacteristics to deviate from desired levels, creatingchallenges for disciplined rebalancing activity.
While successful active management programseventually create value, investors face the interimpossibility of experiencing periods of underperformance.Many sensible investment strategies require timehorizons of three to five years, introducing the likelihoodthat even ultimately successful decisions appear foolishin the short run. When market prices move againstestablished positions, investors with strong hands add toholdings, increasing the benefit from activemanagement. Conversely, sensible investors trimwinning positions, preventing excessive exposure torecently successful strategies. Leaning against the wind
-
211
Classic Investment Readings: David F. Swensen (cont.)
proves to be an effective risk-control measure. Manyhigh-profile investment disasters in recent years involvelosses stemming from leverage lurking beneath thesurface of portfolio management activities. Avoidingdisaster requires thorough understanding of the sourcesand magnitude of exposure to leverage in an investmentfund.
Traditional Asset Classes
Bonds contribute diversification. Under normalcircumstances, the stabilizing influence of bond positionscomes at the opportunity cost of low relative returns.When conditions fail to meet expectations, bondsdiversify. Unexpected inflation damages fixed income,while unanticipated deflation causes bonds to shine.Marketable equities are the primary driver of investmentreturns in traditional portfolio schemes, providing thelong-run gains necessary to support institutionalactivities. Ownership of interests in corporate enterprisesgenerates superior results for patient investors withsufficiently long holding periods.
The efficiency of pricing in fixed income markets leaveslittle room for successful active management.Government bonds trade in the most competitive marketin the world, allowing no opportunity for activemanagers to create an edge. Large-capitalization U.S.equities operate in a similarly efficient environment,presenting few, if any, opportunities for value-addedmanagement. Smaller-capitalization domestic stockstrade in less efficient markets, affording thoughtfulinvestors the possibility of beating the market. Since theevolution of overseas financial markets lags thedevelopment of the U.S. investment industry, lessheavily researched foreign securities often presentsuperior active management opportunities. Owners ofmarketable securities incur costs imposed by agencyactivity, as the stewards of corporate assets pursue self-interest at the expense of providers of debt and equitycapital.
The role that fixed income plays depends critically onthe economic and financial environment that investorsface, with bonds exhibiting the strongest diversifyingcharacteristics in periods of unanticipated inflationary or
deflationary price changes. Investors frequently ownmore fixed income than necessary to protect againsthostile financial environments, leading to behavior thatundermines the fundamental purpose of holding bonds.Confronted with a larger-than-ideal allocations to fixedincome, investment managers often seek to enhancereturns by accepting credit, option, and currency risk.Although under normal circumstances, risky bondsmight generate superior returns, investors face likelydisappointment in times of financial stress.
Historical returns amount to 3.8 percent per annum forcash, which reduces to a paltry 0.7 percent year afteradjustment for inflation. If investors operate with timehorizons of several years, cash constitutes a risky asset.Holding-period returns become uncertain as investorsroll over maturing cash instruments into new investmentsat then-market rates. In contrast, when employing a five-year investment horizon, the five-year zero coupon bondwith its fixed nominal return represents the risk-freeasset.
Some investors argue that cash provides necessaryliquidity for endowment funds, ignoring the massiveamounts of liquidity resident in institutional portfolios.Interest income, dividend payments, and rental streamsprovide liquid cash flows, facilitating the ability of theinvestment fund to meet spending distributionrequirements. Natural turnover of assets provides anothersource of funds. Bonds mature, companies merge, andprivate assets become liquid, serving as sources of cashflow for the institution. Manager sell decisions create yetanother set of liquidity events.
Although bond owners occasionally outperformstockholders, sometimes for extended periods, equitypositions deliver superior returns over sufficiently longtime frames. The portfolio construction process for long-term investors begins with the presumption of a heavycommitment to equities. The principal justification forincurring expected opportunity costs by investing inbonds and real estate stems from the diversification theyprovide when marketable equities perform poorly. At theother end of the return continuum, venture capital andleveraged buyouts claim a place in institutional
-
212
Classic Investment Readings: David F. Swensen (cont.)
portfolios by promising returns in excess of marketableequities. As the core asset, equity holdings set thestandard for evaluating other assets.
From an investor’s perspective, the fundamentaldifference in choosing among companies in the globalmarketplace lies in the currency exposure associatedwith owning stocks of foreign companies, suggesting aseparation of domestic from foreign holdings. Furtherdivision between developed markets and emergingmarkets allows investors to calibrate exposure to thefundamentally riskier less developed markets.
Over long periods of time, domestic stocks tend to trackinflation, protecting holders from price-level-induceddeclines in asset purchasing power. Corporateprofitability constitutes the basic force driving returns toholders of marketable equities. Investors pursuing activemanagement of marketable equities find fewopportunities to exploit among larger-capitalizationdomestic securities, leading prudent investors to passivemanagement of the more efficiently priced assets.Mispricings become more prevalent in the less-well-followed small-capitalization and foreign securitymarkets, with the emerging markets providing the richestset of active management opportunities. By focusingmanagement efforts in arenas with the greatest degree ofopportunity, investors increase the likelihood ofproducing market-beating results.
Success favors rigorous, fundamental, bottom-upapproaches to assessing forward-looking estimates ofinvestment cash flows. Seeking to acquire assets atbelow fair value, disciplined investors combinequantitative techniques with informed market judgment,creating concentrated portfolios designed to generatehandsome risk-adjusted returns. By seeking to identify aclear, compelling set of strengths prior to initiating arelationship with an active manager, investors increasethe likelihood of success. Managers choose to approachinvesting somewhere along the bottom-up/top-downcontinuum. Bottom-up investment involves selectingstocks based solely on the relative attractiveness ofindividual securities; top-down investing incorporatesonly high-level macro factors in portfolio structuring.
Other important dimensions of active managementinclude fundamental versus technical, value versusgrowth, quantitative versus judgmental, and concentratedversus diversified. The positioning of investmentmanagement firms along each of these vectors drivesportfolio performance in fundamental ways.
Extreme growth and extreme value strategies each reston naive foundations, exposing practitioners to seriousdangers. Both approaches focus on the past, ignoringforward-looking information important to determiningsecurity prices. Value investors examine the relationshipbetween market price and historical cost of assets (bookvalue) or between market price and historical earnings.Extreme growth strategies embody similar flaws.Projecting continuation of historical growth rates into thefuture ignores powerful mean reverting tendencies.Reasonable security selection techniques rely onforward-looking approaches, attempting to uncover whatwill happen.
By providing substantial levels of return over extremelylong periods of time, equity holdings benefit patientinvestors willing to hold positions through thick and thin.Although equity ownership provides the bedrock forconstructing institutional portfolios, investors oftenexhibit excessive enthusiasm for equities after extendedstretches of superior relative performance. While owningequity securities provides enormous benefits to steadfastinvestors, the stock market’s long-term performancecomes with occasionally troubling volatility andsometimes extended spells of miserable returns. Bylimiting stock market exposures to levels that fundmanagers can maintain comfortably, investors avoid thewhipsaw of buying high and selling low, and ensurereceipt of the benefits of long-term exposure to equitymarkets.
Alternative Asset Classes
Alternative asset pricing lacks the efficiency typical oftraditional marketable securities, leading to opportunitiesfor astute managers to add substantial value in theinvestment process. Only by generating superior activereturns do investors realize the promise of investing inalternative assets.
-
213
Classic Investment Readings: David F. Swensen (cont.)
Absolute return investing, a relatively new asset class,consists of inefficiency-exploiting marketable securitiespositions exhibiting little or no correlation to traditionalstock and bond investments. Absolute return positionsprovide equity-like returns, yet also possess powerfuldiversifying characteristics. Merger arbitrage representsa core event-driven absolute return strategy, with resultsrelated to the manager’s ability to predict the probabilitythat a deal will close, its likely timing, and the expectedvalue of the consideration for the transaction. Eventhough for short time periods, absolute return strategiesmay show high correlation to marketable equities, overreasonable investment horizons, assets driven byfundamentally different factors produce fundamentallydifferent patterns of returns.
Value-driven absolute return strategies rest on themanager’s ability to identify undervalued and overvaluedsecurities, establish positions, and reduce marketexposure through hedging activity. While value-driveninvestment strategies share with event-driven approachesthe lack of correlation with traditional marketablesecurities, investors face a longer time horizon for value-driven portfolios. Expected holding periods for mergerarbitrage and distressed securities correspond to theanticipated date of corporate combination or bankruptcyresolution, implying a reasonably short duration forevent-driven strategies. In contrast, value-drivenpositions lack the clear valuation realization triggerspresent in event-driven investing. To the consternation offund managers, undervalued stocks frequently decline inprice, while overvalued positions often rise in value,leading to poor performance relative to expectations.
Like other alternative assets, absolute return investmentslack an investible benchmark, forcing investors to lookelsewhere for defining characteristics of the asset class.Because of a limited institutional history, absolute returninvesting poses even greater challenges to theunderstanding of its quantitative attributes than do realestate, leveraged buyouts, and venture capital. In termsof survivorship bias, absolute return suffers from thecombination of relative immaturity and a fairly highdegree of liquidity. Immaturity suggests a substantialamount of flux, as managers posting attractive risk-
adjusted returns enter the realm of institutionalacceptability, adding distinguished records to the store ofabsolute return knowledge. Liquidity allows easy entryand exit, creating instability beneath the surface of thepool used to evaluate manager returns.
Without useful historical data, investors turn to theunderlying characteristics of the investment strategiesthat make up the asset class, hoping to develop a set ofreturn, risk, and covariance attributes without guidancefrom a robust series of past performance numbers. Afteradjusting for fees and incentive compensation, investorsemploying a combination of event-driven and value-driven strategies might reasonably expect nominalreturns of 10 percent to 12 percent, more or lessequivalent to the long-term return to domestic equities,with lower risk and essentially no correlation.
Real estate holdings play a special role in investors’portfolios, providing protection against unanticipatedincreases in inflation. Asset prices of high-quality, well-located, fully leased buildings respond directly toinflation as the cost of replacing properties increasesalong with rising price levels. Income flows rise asleases mature and new leases incorporate inflationaryincreases, insulating real estate owners from thedebilitating effects of unexpected inflation on fixedpayment streams. Under normal circumstances, realestate and bonds lend a measure of stability to portfolios,as high levels of current cash flow in the form of rentand interest payments moderate the fluctuations in pricerequired to adjust for changes in expected returns. Overlong periods of time, the provision of year-to-yearvolatility dampening comes at a substantial cost. Onlybecause inflationary or deflationary conditionsoccasionally surprise investors do diversifying assetsplay a major role.
Unanticipated inflation benefits real estate positions anddamages bond holdings, while unexpected deflationhelps bond positions and hurts real estate holdings. Likeall other private asset classes, real estate lacks a broadcollection of properties defining an investible benchmarkfor investors. Unlike venture capital and leveragedbuyouts, market observers benefit from access to
-
214

Classic Investment Readings: David F. Swensen (cont.)
information on the performance of large numbers ofindividual real estate properties.
In any event, the true volatility of the real estate propertyindex likely exceeds the observed standard deviation ofreturns, which are dampened by the appraisal-basedmeans that investors employ to value real estate assets.Lacking a ready market for pricing assets, investors hireappraisers to assess market values, using discounted cashflows, comparable sales, and replacement cost asvaluation metrics. Conducted infrequently, often by thesame firm year after year, the appraisal process smoothesthe observed series of prices, understating true volatility.For the two decades ending in 1998, REITs provided an11.4 percent annualized return relative to a 9.4 percentresult for a broad-based collection of privately heldproperties. The superior REIT results, likely driven bythe positive impact of leverage, came at the price ofhigher volatility of 16.4 percent standard deviation ofreturns relative to a 6.9 percent risk level for theunlevered property index.
Regardless of the observed differences in behaviorbetween public and private holdings of real estate, in thefinal analysis REITs represent real estate. Long-terminvestors favor REITs when portfolios trade at a discountto private market value, avoiding high-priced privateassets, and sell REITs when shares trade at a premium,pursuing relatively attractive private properties. Realestate lends itself to active management becausemispricings create opportunities for nimble investors totake advantage of market anomalies.
Properly selected investments in leveraged buyouts andventure capital contain the potential to generate highreturns relative to other equity alternatives, providing ameans to enhance overall portfolio results. The superiorprivate equity returns come at the price of higher risklevels, as investors expose assets to greater financialleverage and more substantial operating uncertainty.Private company managements tend to operate withlonger time horizons and lower risk aversion, pursuingstrategies that promote creation of enterprise value at theexpense of personal job security. Because private dealsgenerally require management to take material
ownership stakes, interests of outside owners andoperating management align. Leveraged buyouts respondto many of the same factors that influence marketablesecurities. In fact, buyouts often simply representturbocharged equity, with leverage magnifying theresults — good or bad — produced by a particularcompany.
Although early-stage venture capital lacks the superficialsimilarities that leveraged buyouts share with marketableequities, strong links exist between venture investing andthe stock market. Market action influences the price atwhich venture investors enter an investment and plays aneven more critical role in the price at which investorsexit successful positions. In their most basic form,venture and buyout investing represent a riskier means ofobtaining equity exposure. The high leverage inherent inbuyout transactions and the early-stage nature of ventureinvesting cause investors to experience greaterfundamental risk and to expect materially higherinvestment returns.
If two otherwise identical companies differ only in theform of organization — one private, the other public —the infrequently valued private company appears muchmore stable than the frequently valued publicly tradedcompany. Although both companies react in identicalfashion to fundamental drivers of corporate value, theless volatile private entity boasts superior riskcharacteristics based solely on mismeasurement of thecompany’s true underlying volatility. While a fairportion of the observed “diversification” provided byprivate equity stems from the infrequent valuationsaccorded illiquid assets, some of the lack of correlationbetween marketable and private assets results fromvalue-added strategies that private firms pursue.
Pure financial engineering holds little interest for seriousprivate equity investors, since providing financingrepresents a commodity-like activity with low barriers toentry. Private investors offering only capital operate inan extremely competitive market with reasonablyefficient pricing mechanisms. Private equityopportunities become particularly compelling whenmanagers pursue well-considered value-added strategies.
-
215

Classic Investment Readings: David F. Swensen (cont.)
Head-to-head comparisons of historical risk and returndata for marketable equities and private investmentslikely overstate the attractiveness of private assets byunderstating true risk levels. Infrequent valuations ofprivate positions cause smoothing of results, reducingthe observed volatility of private equity. The tellingcomparison between buyout returns and equivalent-riskmarketable security returns indicates that the vastmajority of investors in buyout partnerships failed toearn results to compensate for risk.
The relatively short span of institutional private equityinvestment activity weakens any general conclusionsdrawn from the available data set. Venture capital andleveraged buyout returns beginning in 1980 representsamples drawn from an unusual capital marketenvironment. Leveraged buyout transactions, forexample, occur almost entirely under conditions ofdeclining interest rates and rising equity valuations,fanning the wind at the back of private equity investors.Since available data fail to include extended periodsproviding a poor backdrop for private investing,observed results paint an inflated picture of privateequity potential, overstating likely future performance.
Burdened by staggering fees and characterized by wellabove marketable equity risk levels, a broad collection ofprivate equity funds would likely produce returns farfrom sufficient to compensate for the risk incurred.Investors justify the inclusion of private equity inportfolios only by selecting top-quality managerspursuing value-added strategies with appropriate dealstructures. The character of a private equity fund’sinvestment principals constitutes the most importantcriterion in evaluating the merits of a buyout or ventureinvestment. Driven, intelligent, ethical individualsoperating in a cohesive partnership possess an edgelikely to translate into superior investment results. On theother end of the spectrum, individuals willing to cutcorners — operationally, intellectually, or ethically —place an investor’s money and reputation at risk.
Comprehensive due diligence requires substantial effort.Personal and professional references provided by theprospective fund managers provide an initial set of
contacts. Because of the inevitable selection bias in ahand-picked reference list, sensible investors seekcandid, confidential assessments from other individuals,including former business colleagues, professionalrelationships, and personal acquaintances. Over time,investors develop networks that facilitate referencechecking, increasing confidence in the quality ofdecision making. Careful investors make skeptical calls,actively looking for potential issues. Going through themotions by conducting superficial checks adds nothingto the due diligence process.
Investment Advisers
Identifying a portfolio that merely beats the market failsto define success, because managers must choosesecurities that generate returns sufficient to covermanagement fees, transactions costs, and market impactand beat the market. Only when compelling evidencesuggests that a strategy possesses clear potential to beatthe market should investors abandon the passivealternative. Top-notch managers invest with a passion,working to beat the market with a nearly obsessivefocus. Many extraordinary investors spend an enormousamount of time investigating investment opportunities,continuing to labor long after rational professionalswould have concluded a job well done. Great investorstend to pursue the game not for profit but for sport.
Due diligence on the principals of an investmentmanagement organization provides critical input into themanager selection process. Spending time with managercandidates allows assessment of whether the managerexhibits the characteristics of a good partner. Extensivereference checking, questioning individuals on manager-supplied lists, confirms or denies impressions gatheredearlier in the due diligence process. Contacts with peopleoutside of an official reference list, includingcompetitors, provide opportunities to evaluate the qualityof a prospective manager’s business dealings andintegrity level.
Investment Process
Most aspects of investment philosophy embody anintuitive appeal, allowing groups to adopt and followsensible principles without great difficulty. Among the
-
216

Classic Investment Readings: David F. Swensen (cont.)
less challenging principles are maintaining an equitybias, adopting appropriate diversification policies, andstructuring investment relationships to align interests.Two important tenets of investment management –contrarian thinking and long-term orientation – creategreat difficulties for governance of endowment funds.Unless carefully managed, group dynamics frequentlythwart contrarian activities and impose shorter-than-optimal time horizons on investment activity. Themanagement of perpetual life assets, explicit recognitionof the discontinuity between personal and institutionaltime frames and adequate continuity in management andgovernance provide the only practical response.
Investors seeking short-term success will likely befrustrated by markets too efficient to offer much in termsof easy gains. As investors successfully exploit oneshort-term inefficiency, it must be replaced by anotherattractive position followed by another, and yet another,ad infinitum. Judging long-term pools of assets bytrailing twelve-month performance numbers induces thewrong kind of thinking, emphasizing short-termconsensus-oriented investing. Varying too far from thegroup consensus exposes the manager to the risk ofbeing labeled unconventional. If the institution fails in itsunusual approach, the policy will likely be abandonedand the investment staff will likely be looking for newpositions. In contrast, had the institution failed with astandard institutional portfolio, policies may still beabandoned, but investment professionals would likelyremain gainfully employed.
Significant differences between successful investmentoperations and other well-run business activities causethe application of standard corporate managementtechniques to fail in the investment world. Mostbusinesses grow by feeding winners. Putting resourcesbehind successful products generally leads to larger,increasingly impressive gains. Ruthless cuts of failedinitiatives preserve corporate resources for moreattractive strategies. In contrast, investment successgenerally stems from contrarian impulses. Winnersshould be viewed suspiciously, with consideration givento reducing or even eliminating previously successfulstrategies.
Contrarian investing represents more than a reflex action,causing investors to buy the dips. In fact, going againstthe grain will likely appear foolish in the short run asalready cheap assets become cheaper. causing the truecontrarian to appear fundamentally out of sync withinvestors more successfully in tune with the market.Unfortunately, overcoming the tendency to follow thecrowd, while necessary, proves insufficient to guaranteeinvestment success. By pursuing ill-considered,idiosyncratic policies, market players expose portfoliosto unnecessary, often unrewarded risks. While courage totake a different path enhances chances for success,investors face likely failure unless a thoughtful set ofinvestment principles undergirds the courage.Responsible fiduciaries best serve institutions byfollowing basic investment principles, avoiding thetemptation to pursue policies designed to satisfy specificindividual agendas.
Policy decisions concern long-term issues that inform thebasic structural framework of the investment process.Strategic decisions represent intermediate-term movesdesigned to adapt longer-term policies to moreimmediate market opportunities and institutionalrealities. Trading and tactical decisions involve shorttime horizon implementation of strategies and policies.Decision makers spend too much time on relativelyexciting trading and tactical decisions at the expense ofthe more powerful, yet more mundane policy decisions.A decision-making process designed to place appropriateemphasis on policy decisions increases an investor’schances of winning.
In many ways, establishing policy asset allocation targetsrepresents the heart of the investment process. No otheraspect of portfolio management plays as great a role indetermining an investor’s ultimate performance, and noother statement says as much about the character of aninvestor. Establishing a framework focused on policydecisions represents the most fundamental obligation ofinvestment fiduciaries. Asset allocation targets ought tobe reviewed once (and only once) per year. An annualreview allows managers to make changes necessary tomove portfolios in desired directions. Perhaps moreimportant, limiting policy discussions to the assigned
-
217

Classic Investment Readings: David F. Swensen (cont.)
meeting diminishes the possibility of damage from ill-considered moves made in response to the gloom oreuphoria characterizing current market conditions. In theabsence of a disciplined process for articulatinginvestment recommendations, decision making tends tobecome informal, even casual. Written recommendationsprovide a particularly useful means of communicating
investment ideas. The process of drafting memos oftenexposes logical flaws or gaps in reasoning. Knowledgethat a critical audience of colleagues and committeemembers reviews investment memos stimulates careful,logical exposition of proposals.
Copyright © 2000, The Free Press. Used by permission.
-
218
-
219


K:\graphics\2002\Word\M\Maher\AAP 1H02\Inside_Back_Cover1H02.doc
This Asset Allocation Principles is intended to complement and be used in conjunction with other Morgan Stanley researchpublications as follows:
Investment Perspectives (Weekly)[Asia/Pacific, European, Global, Japan,Latin America, US and the Americas]• Strategy and Economics• Industry Analysis• Opinion Changes and New Coverage• Company Analysis
Investment Strategy Digest (Monthly)• Morgan Stanley Economists’ and Strategists’
Summaries• Morgan Stanley Asset Allocation
Frameworks• External Asset Allocation Frameworks
Macroscope (Bi-Monthly)• Morgan Stanley Investment Research Asset
Allocation• Global Positioning Charts• Charting the Markets
Global Strategy Chartbook (Bi-Monthly)• Global, multi-asset class charts and tables• Global model portfolios• Global economics, earnings, and valuations• Regional and sector investment strategy
Investment Strategy Chartbook (Bi-Monthly)[US, European, UK, Japan, Global EmergingMarkets Strategy (GEMSsm), Asia/Pacific, LatinAmerica]• Economy and Interest Rates• Earnings, Valuation, and Technical Analysis• Flow of Funds, US Dollar, and Political
Environment• Sector Emphasis, Regional Model Portfolios,
Fresh Money Buys List and QuantitativeAnalysisFinancial Management Review and Outlook
(Quarterly)• Global Equity and Debt Securities Markets• Major Asset Class Reviews• Asset Allocation Concepts• Funds Management Asset Allocation Frameworks
Asset Allocation Principles (Semiannually)• Asset Allocation Concepts• High Net Worth Investment Tools• Investment Philosophy Concepts
Competitive Edge (Quarterly)• Identify Powerful Global Competitors• List of 250 Companies with Sustainable Advantage• Industry Teams Identify Companies• Company Characteristics Include Scale, Scope,
Financial and Management Strength, and Liquidity
Market View Bulletin (Monthly)• One Page Summary of Market Factors• Presents Bullish and Bearish Cases• Fundamental, Valuation,
Psychological/Technical/Liquidity Issues

Investing Services Investment Management
Representative Global Morgan Stanley Offices
Morgan Stanley IAS Regions and Regional Headquarters
© 2002 Morgan Stanley
For a complete listing of Morgan Stanley offices worldwide, please refer to: www.morganstanley.com
Investor Advisory ServicesRegional Headquarters
Tel: (877) 937-6739
Atlanta New YorkChicago San FranciscoDallas SeattleLos Angeles Tampa(Plus over 450 branch offices in 50 states.)
Private Wealth Management
Tel: (800) 419-2861
Amsterdam MadridAtlanta Menlo ParkBoston MiamiChicago MilanGeneva New YorkHong Kong San FranciscoHouston SingaporeLondon ZurichLos Angeles
The Americas Europe Japan Asia Pacific1585 Broadway 25 Cabot Square, Canary Wharf 20-3, Ebisu 4-Chome, Shibuya-ku Three Exchange SquareNew York, New York 10036-8293 London E14 4QW, England Tokyo 150-6008, Japan Hong KongTel: (212) 761-4000 Tel: (44 20) 7677-8000 Tel: (813) 5424-5000 Tel: (852) 2848-5200
Morgan StanleyInvestment Management
Tel: (212) 762-7400
NY CS 33177 11/02
AmsterdamBostonCedar RapidsChicagoFrankfurtHong KongHoustonJersey City
Kansas CityLondonMelbourneMenlo ParkMilanMumbaiNew YorkOakbrook Terrace
San FranciscoSeoulSingaporeSydneyTokyoWest Conshohocken
Mumbai
MoscowLondon
San Francisco Seoul
Bangkok
Menlo Park (CA)Houston
Paris
New York
Montreal
MilanMadrid
Singapore
Melbourne
SydneyJohannesburgBuenos Aires
São Paulo
Hong Kong
Beijing
Taipei
Tokyo
Frankfurt
Stockholm
Los Angeles
New York City
Chicago
Atlanta
TampaDallas
Seattle
Hawaii
Puerto Rico
Alaska San Francisco
CLF# 38636