Assessment report - European Medicines · PDF fileAssessment report as adopted by the CHMP...
99
30 Churchill Place ● Canary Wharf ● London E14 5EU ● United Kingdom An agency of the European Union Telephone +44 (0)20 3660 6000 Facsimile +44 (0)20 3660 5520 Send a question via our website www.ema.europa.eu/contact 26 March 2015 EMA/238334/2015 Committee for Medicinal Products for Human Use (CHMP) Assessment report Synjardy International non-proprietary name: empagliflozin / metformin Procedure No. EMEA/H/C/003770/0000 Note Assessment report as adopted by the CHMP with all information of a commercially confidential nature deleted.
Transcript of Assessment report - European Medicines · PDF fileAssessment report as adopted by the CHMP...

30 Churchill Place ● Canary Wharf ● London E14 5EU ● United Kingdom
An agency of the European Union
Telephone +44 (0)20 3660 6000 Facsimile +44 (0)20 3660 5520 Send a question via our website www.ema.europa.eu/contact
26 March 2015 EMA/238334/2015 Committee for Medicinal Products for Human Use (CHMP)
Assessment report
Synjardy
International non-proprietary name: empagliflozin / metformin
Procedure No. EMEA/H/C/003770/0000
Note Assessment report as adopted by the CHMP with all information of a commercially confidential nature deleted.

Assessment report EMA/238334/2015 Page 2/99
1. Background information on the procedure .............................................. 5 1.1. Submission of the dossier ..................................................................................... 5 1.2. Manufacturers ..................................................................................................... 6 1.3. Steps taken for the assessment of the product ........................................................ 6
2. Scientific discussion ................................................................................ 6 2.1. Introduction ........................................................................................................ 6 2.2. Quality aspects .................................................................................................... 8 2.2.1. Introduction ..................................................................................................... 8 2.2.2. Active Substance ............................................................................................... 8 2.2.3. Finished Medicinal Product ................................................................................ 10 2.2.4. Discussion on chemical, pharmaceutical and biological aspects ............................. 13 2.2.5. Conclusions on the chemical, pharmaceutical and biological aspects ...................... 13 2.2.6. Recommendation(s) for future quality development ............................................. 13 2.3. Non-clinical aspects ............................................................................................ 14 2.3.1. Pharmacology ................................................................................................. 14 2.3.2. Pharmacokinetics ............................................................................................ 15 2.3.3. Toxicology ...................................................................................................... 17 2.3.4. Ecotoxicity/environmental risk assessment ......................................................... 20 2.3.5. Discussion on non-clinical aspects ..................................................................... 23 2.3.6. Conclusion on the non-clinical aspects ............................................................... 24 2.4. Clinical aspects .................................................................................................. 24 2.4.1. Introduction ................................................................................................... 24 2.4.2. Pharmacokinetics ............................................................................................ 24 2.4.3. Pharmacodynamics .......................................................................................... 31 2.4.4. Discussion on clinical pharmacology .................................................................. 35 2.4.5. Conclusions on clinical pharmacology ................................................................. 36 2.5. Clinical efficacy .................................................................................................. 36 2.5.1. Dose response studies and main studies ............................................................ 36 2.5.2. Discussion on clinical efficacy............................................................................ 76 2.5.3. Conclusions on the clinical efficacy .................................................................... 78 2.6. Clinical safety .................................................................................................... 78 2.6.1. Discussion on clinical safety .............................................................................. 86 2.6.2. Conclusions on the clinical safety ...................................................................... 90 2.7. Pharmacovigilance ............................................................................................. 90 2.8. Risk Management Plan ........................................................................................ 90 2.9. Product information ............................................................................................ 93 2.9.1. User consultation ............................................................................................ 93
3. Benefit-Risk Balance ............................................................................. 94
4. Recommendations ................................................................................. 99

Assessment report EMA/238334/2015 Page 3/99
List of abbreviations
AE Adverse event
AESI Adverse event of special interest
ALT Alanine aminotransferase
ANCOVA Analysis of covariance
AST Aspartate aminotransferase
AUC Area under the curve
BCS Biopharmaceutics Classification System
BI Boehringer Ingelheim
BIcMQ BI-customised MedDRA query
bid Twice-daily
BMI Body mass index
CI Confidence interval
Cmax Maximum measured plasma concentration
DBP Diastolic blood pressure
DPP-4 Dipeptidyl-peptidase 4
ECG Electrocardiogram
EFF Efficacy trial grouping
eGFR (Estimated) glomerular filtration rate
EMA European Medicines Agency
Empa Empagliflozin
FAS Full analysis set
FDA Food and Drug Administration
FDC Fixed-dose combination
FF Final formulation
FPG Fasting plasma glucose
GCP Good Clinical Practice
HbA1c Glycosylated haemoglobin
HDL High-density lipoprotein
ICH International Conference on Harmonisation of Technical Requirements for Registration of Pharmaceuticals for Human Use
IU International Units
LDL Low-density lipoprotein
LOCF Last observation carried forward

Assessment report EMA/238334/2015 Page 4/99
MDRD Modification of Diet in Renal Disease
MedDRA Medical dictionary for drug regulatory activities
Met Metformin
MMRM Mixed model repeated measures
NDA New Drug Application
NCF Non-completers considered failure
OC Observed cases
Pio Pioglitazone
PIP Paediatric Investigational Plan
PT Preferred term
qd Once-daily
SAF Safety trial grouping
SBP Systolic blood pressure
SD Standard deviation
SE Standard error
SGLT Sodium-dependent glucose co-transporter
SmPC Summary of Product Characteristics
SMQ Standardised MedDRA query
SOC System organ class
SU Sulphonylurea
Tmax Time from dosing until maximum measured plasma concentration
TS Treated set
UACR Urinary albumin-to-creatinine ratio
UGE Urinary glucose excretion
ULN Upper limit of normal
Assessment report EMA/238334/2015 Page 5/99
1. Background information on the procedure
1.1. Submission of the dossier
The applicant Boehringer Ingelheim GmbH submitted on 3 July 2014 an application for Marketing Authorisation to the European Medicines Agency (EMA) for Synjardy, through the centralised procedure falling within the Article 3(1) and point 3 of Annex of Regulation (EC) No 726/2004. The eligibility to the centralised procedure was agreed upon by the EMA/CHMP on 25 April 2013.
The applicant applied for the following indication: Synjardy is indicated in adults aged 18 years and older with type 2 diabetes mellitus as an adjunct to diet and exercise to improve glycaemic control
• in patients inadequately controlled on their maximally tolerated dose of metformin alone
• in patients inadequately controlled with metformin in combination with other glucose-lowering medicinal products, including insulin (see sections 4.5 and 5.1 for available data on different combinations)
• in patients already being treated with the combination of empagliflozin and metformin as separate tablets.
The legal basis for this application refers to:
Article 10(b) of Directive 2001/83/EC – relating to applications for new fixed combination products.
The application submitted is a new fixed combination medicinal product.
The application submitted is composed of administrative information, complete quality data, non-clinical and clinical data based on applicants’ own tests and studies and/or bibliographic literature substituting/supporting certain tests or studies.
Information on Paediatric requirements
Pursuant to Article 7 of Regulation (EC) No 1901/2006, the application included an EMA Decision P/271/2011 on the granting of a product-specific waiver.
Information relating to orphan market exclusivity
Similarity
Pursuant to Article 8 of Regulation (EC) No. 141/2000 and Article 3 of Commission Regulation (EC) No 847/2000, the applicant did not submit a critical report addressing the possible similarity with authorised orphan medicinal products because there is no authorised orphan medicinal product for a condition related to the proposed indication.
Scientific Advice
The applicant received Scientific Advice from the CHMP on 17 February 2011. The Scientific Advice pertained to clinical aspects of the dossier.
Licensing status
The product was not licensed in any country at the time of submission of the application.

Assessment report EMA/238334/2015 Page 6/99
1.2. Manufacturers
Manufacturer responsible for batch release
Boehringer Ingelheim Pharma GmbH & Co.KG Binger Strasse 173 55216 Ingelheim am Rhein GERMANY
1.3. Steps taken for the assessment of the product
The Rapporteur and Co-Rapporteur appointed by the CHMP were:
Rapporteur: Pieter de Graeff Co-Rapporteur: Daniela Melchiorri
• The application was received by the EMA on 3 July 2014.
• The procedure started on 23 July 2014.
• The Rapporteur's first Assessment Report was circulated to all CHMP members on 10 October 2014. The Co-Rapporteur's first Assessment Report was circulated to all CHMP members on 13 October 2014.
• PRAC RMP Advice and assessment overview, adopted by PRAC on 6 November 2014.
• During the meeting on 20 November 2014, the CHMP agreed on the consolidated List of Questions to be sent to the applicant. The final consolidated List of Questions was sent to the applicant on 21 November 2014.
• The applicant submitted the responses to the CHMP consolidated List of Questions on 20 January 2015.
• The Rapporteurs circulated the Joint Assessment Report on the applicant’s responses to the List of Questions to all CHMP members on 2 March 2015.
• PRAC RMP Advice and assessment overview, adopted by PRAC on 12 March 2015.
• Joint Rapporteur/Co-Rapporteur updated Assessment Report on the responses provided by the applicant, dated 19 March 2015.
• During the meeting on 26 March 2015, the CHMP, in the light of the overall data submitted and the scientific discussion within the Committee, issued a positive opinion for granting a Marketing Authorisation to Synjardy.
2. Scientific discussion
2.1. Introduction
Empagliflozin
The applicant developed empagliflozin as adjunct to diet and exercise to improve glycaemic control in adults with type 2 diabetes mellitus either as monotherapy or as add-on to other oral antidiabetic treatments including insulin. Empagliflozin is formulated as a tablet for oral administration and the recommended doses are 10 mg and 25mg once daily. The clinical development of empagliflozin started in January 2007. The clinical program that formed the basis for the initial application of empagliflozin as monotherapy comprised 30 phase I trials, 5 phase II trials, and 13 phase IIb/III trials. These studies established the pharmacokinetics, safety, and efficacy profiles of empagliflozin.

Assessment report EMA/238334/2015 Page 7/99
Empagliflozin was authorised in the EU as Jardiance in May 2014 (European Public Assessment Report: http://www.ema.europa.eu/docs/en_GB/document_library/EPAR_-_Public_assessment_report/human/002677/WC500168594.pdf)
Empagliflozin is a reversible, highly potent (IC50 of 1.3 nmol) and selective competitive inhibitor of SGLT2. Empagliflozin does not inhibit other glucose transporters important for glucose transport into peripheral tissues and is 5000 times more selective for SGLT2 versus SGLT1, the major transporter responsible for glucose absorption in the gut. SGLT2 is highly expressed in the kidney, whereas expression in other tissues is absent or very low. It is responsible, as the predominant transporter, for the reabsorption of glucose from the glomerular filtrate back into the circulation. In patients with type 2 diabetes (T2DM) and hyperglycaemia a higher amount of glucose is filtered and reabsorbed.
Empagliflozin improves glycaemic control in patients with type 2 diabetes by reducing renal glucose reabsorption. The amount of glucose removed by the kidney through this glucuretic mechanism is dependent on blood glucose concentration and GFR. Inhibition of SGLT2 in patients with T2DM and hyperglycaemia leads to excess glucose excretion in the urine. In patients with T2DM, urinary glucose excretion increased immediately following the first dose of empagliflozin and is continuous over the 24 hour dosing interval. Increased urinary glucose excretion was maintained at the end of the 4-week treatment period, averaging approximately 78 g/day with empagliflozin 25 mg. Increased urinary glucose excretion resulted in an immediate reduction in plasma glucose levels in patients with type 2 diabetes. Empagliflozin improves both fasting and post-prandial plasma glucose levels. The mechanism of action of empagliflozin is independent of beta cell function and insulin pathway and this contributes to a low risk of hypoglycaemia. Improvement of surrogate markers of beta cell function including Homeostasis Model Assessment-β (HOMA-β) was noted. In addition, urinary glucose excretion triggers calorie loss, associated with body fat loss and body weight reduction. The glucosuria observed with empagliflozin is accompanied by mild diuresis which may contribute to sustained and moderate reduction of blood pressure.
Metformin
Pharmacokinetics, safety, and efficacy of metformin are well established and are described in the current Summary of Product Characteristics (Glucophage; November, 2011). Metformin is described chemically as N,N-dimethylimidodicarbonimidic diamide hydrochloride.
Metformin decreases hepatic glucose production, decreases intestinal absorption of glucose, and improves insulin sensitivity by increasing peripheral glucose uptake and utilization.
Empagliflozin/metformin FDC
A total of six dose strengths have been developed for the empagliflozin/metformin FDC: 5/500 mg, 5/850 mg, 5/1000 mg, 12.5/500 mg, 12.5/850 mg, and 12.5/1000 mg twice-daily. The empagliflozin/metformin FDC tablet formulation was not used in any phase II/III clinical studies included in the evaluation of efficacy and safety in the current application. However, bioequivalence of the proposed commercial FDC tablets and the corresponding dose of free combination tablets (considering the twice daily posology) has been demonstrated for all intended dose strengths of the FDC in three pivotal bioequivalence studies.
The metformin used in clinical studies demonstrating the efficacy and safety of the combination of empagliflozin and metformin included US-sourced and EU-sourced metformin tablets (both Glucophage). The EU sourced metformin was also used in the pivotal bioequivalence studies.
In clinical studies, empagliflozin on a background of metformin was evaluated in combination with a sulphonylurea, pioglitazone, basal and MDI insulin and DPP-4 inhibitors.

Assessment report EMA/238334/2015 Page 8/99
2.2. Quality aspects
2.2.1. Introduction
The finished product is a fixed combination immediate release film-coated tablet containing 5 mg / 850 mg, 5 mg / 1000 mg, 12.5 mg / 850 mg and 12.5 mg / 1000 mg of empagliflozin and metformin hydrochloride as active substances respectively per tablet.
Other ingredients are maize starch, copovidone, colloidal anhydrous silica, magnesium stearate, hypromellose, macrogol 400, titanium dioxide (E171), and talc. In addition, different strength tablets contain additional colouring agents as follows: iron oxide yellow (E172) for the 5/850 mg and 5/1000 mg strengths; iron oxide black (E172) for 12.5/850 mg and 12.5/1000 mg strengths; iron oxide red (E172) for 12.5/850 mg and 12.5/1000 mg strength. The excipients are described in section 6.1 of the SmPC.
The product is available in polyvinylchloride/polyvinylidene chloride/aluminium unit dose perforated blisters (PVC/PVDC/Alu) as described in section 6.5 of the SmPC.
2.2.2. Active Substance
Empagliflozin
General information The chemical name of empagliflozin is (1S)-1,5-anhydro-1-(4-chloro-3-{4-[(3S)-tetrahydrofuran- 3-yloxy]benzyl}phenyl)-D-glucitol, also known as D-Glucitol,1,5-anhydro-1-C-[4-chloro-3- [[4-[[(3S)-tetrahydro-3-furanyl]oxy]phenyl]methyl]phenyl]-, (1S), corresponding to the molecular formula C23H27ClO7 and it has a relative molecular mass 450.9 g/mol and the following structure:
The structure of empagliflozin was unambiguously confirmed by 1H and 13C NMR, UV spectroscopy, FT-IR spectroscopy, mass spectrometry and elemental analysis.
Empagliflozin appears as a white to yellowish non-hygroscopic crystalline solid, very slightly soluble in water (pH 1-7.4), slightly soluble in acetonitrile and ethanol, sparingly soluble in methanol, and practically insoluble in toluene. The molecule has no ionisable centres. Its partition coefficient has been determined to be 1.7 at pH 7.4. The pure active substance melts at 150 ± 2 oC.
Empagliflozin is chiral and possesses 6 stereogenic centres. Enantiomeric purity is controlled routinely by chiral HPLC/specific optical rotation. A single polymorphic form has been observed for empagliflozin and is consistently produced by the manufacturing process. The isolated form is non-solvated and non-hydrated.
Manufacture, characterisation and process controls Empagliflozin is synthesized by a single manufacturer in 4 steps from well-defined starting materials with acceptable specifications. The active substance is then recrystallized and milled. Five of the stereocentres originate from the chiral pool whereas the sixth benzylic centre is controlled by a diastereoselective reduction during the process. Potential and actual impurities were well discussed with regards to their origin and fate and characterised. None were deemed to have genotoxic potential.

Assessment report EMA/238334/2015 Page 9/99
The characterisation of the active substance and its impurities is in accordance with the EU guideline on chemistry of new active substances.
Adequate in-process controls are applied during the synthesis. The specifications and control methods for intermediate products, starting materials and reagents have been presented and are considered adequate.
The active substance is packaged in a double layer of LDPE resin bags with cable binders, then stored away from light in a fibre drum. The primary packaging material complies with the relevant EC regulations and Ph. Eur. requirements.
Specification The active substance specification includes tests for appearance, identity (IR, HPLC), impurities (HPLC), diastereomer (chiral HPLC), assay (HPLC), residual solvents (GC), water content (KF), residue on ignition (Ph. Eur.), and particle size (laser diffraction). Optical purity is controlled by a test for specific optical rotation in the 2 chiral starting materials. The analytical methods used have been adequately described and appropriately validated in accordance with the ICH guidelines. The limits of 3 specified impurities are above the qualification threshold according to ICH Q3A and they have been sufficiently toxicologically qualified (these data were assessed in the MAA procedure for Jardiance (EMEA/H/C/002677)). The limit set for one of those impurities will be re-evaluated once sufficient manufacturing experience has been gained.
Batch analysis data on 5 commercial scale batches of the active substance are provided. The results are within the specifications and consistent from batch to batch. Batch analysis date on a further 40 batches (varying from pilot to commercial scale) carried out using previous incarnations of the synthetic process and used for toxicology and clinical studies are also provided, with all batches conforming to specifications in place at the time.
Stability Stability data on three commercial scale batches of empagliflozin manufactured using the proposed commercial process stored in the intended commercial packaging for up to 36 months under long term conditions (25 ºC / 60% RH) and for up to 6 months under accelerated conditions (40 ºC / 75% RH) according to the ICH guidelines were provided. Stability was also tested under stressed conditions in the solid state (1 commercial scale batch) and in solution (1 development batch). Solid state photostability testing following the ICH guideline Q1B was performed on 1 commercial scale batch. Solid state material was also exposed to high temperature (80 oC) and to open storage conditions (40 oC / 75 % RH). Empagliflozin was tested in solution at low (2.5), intrinsic, and high (13) pH, each under heat stress conditions (80 oC), in the presence of strong (H2O2), or mild (AIBN) oxidants, and under UV irradiation (20 W/m2). The following parameters were tested: appearance, impurities (HPLC), diastereomer (chiral HPLC), assay (HPLC), water content (KF) and particle size (laser diffraction). The analytical methods used were the same as for release.
No changes to any test parameters were observed under long term or accelerated conditions. Empagliflozin is neither photosensitive, nor affected by high temperature or humidity in the solid state. In solution, it is prone to degradation at low and high pH and in the presence of a strong oxidant. It is also unstable to a mild oxidant at high pH and slightly sensitive to light. None of the chiral centres showed any propensity to epimerisation during the stability studies. The results demonstrate that the analytical methods are stability indicating.
The stability results indicate that the drug substance manufactured by the proposed supplier is sufficiently stable. The stability results justify the proposed retest period in the proposed container. Primary stability studies on the three commercial batches will continue up until the proposed re-test period.

Assessment report EMA/238334/2015 Page 10/99
Metformin hydrochloride
General information Metformin is a well-known active substance often formulated in combination with other antidiabetic substances for the treatment of diabetes. The INN name of the active substance is metformin and the chemical name is 1,1-dimetylbiguanidine hydrochloride. Its molecular formula and weight are C4H11N5.HCl and 165.6 g/mol respectively, and its structure is shown below:
Metformin hydrochloride is a white or almost white, slighly hygroscopic crystalline powder. It is freely soluble in water, slightly soluble in ethanol and practically insoluble in acetone. Metformin hydrochloride has been reported to exist in two polymorphic forms, a stable form and a metastable one, which has only been observed under experimental conditions. Therefore no control of polymorphism is considered necessary. Metformin hydrochloride has a non-chiral molecular structure. As there is a monograph of metformin hydrochloride in the European Pharmacopoeia, the manufacturer of the active substance has been granted a Certificate of Suitability of the European Pharmacopoeia (CEP) which has been provided within the current Marketing Authorisation Application.
Manufacture The description of manufacturing process steps and in-process controls, characterisation, control of materials and of critical steps and intermediates, process validation and manufacturing process development are all covered by the CEP. Metformin is manufactured at one manufacturing site. The holder of the certificate has declared the absence of use of material of human or animal origin in the manufacturing of the substance.
The relevant information on the manufacture was assessed by the EDQM before issuing the CEP.
Specification The control tests comply with the specifications and test methods of the Ph. Eur. monograph, as confirmed by the CEP. The CEP includes an additional control for a residual solvent used in the manufacturer’s synthetic route.
Batch analyses data for 11 batches were provided. The results are consistent from batch to batch and comply with the specification in all cases.
Stability The proposed re-test period and packaging material for metformin are covered by the CEP.
2.2.3. Finished Medicinal Product
Description of the product and pharmaceutical development The objective of formulation development was to develop a fixed dose immediate-release tablet of empagliflozin and metformin. The quality target product profile (QTPP) was established and defined as a twice daily orally administered immediate release film-coated tablet available in 4 strengths (5 mg/850 mg, 5 mg/1000 mg, 12.5 mg/850 mg, and 12.5 mg/1000 mg) with adequate purity and

Assessment report EMA/238334/2015 Page 11/99
stability. In addition, the combination product should be bioequivalent with empagliflozin and metformin hydrochloride administered as mono products as demonstrated by comparable immediate release in vitro dissolution performance in order to promote patient compliance.
The pharmaceutical development of the current product was largely based on the experience gained with empagliflozin film-coated tablets (Jardiance) and linagliptin / metformin hydrochloride film-coated tablets (Jentadueto). To combine the low amount of empagliflozin with the relatively high quantity of metformin hydrochloride, a wet granulation process with granulation liquid containing empagliflozin was chosen.
Principles of Quality by Design (QbD) were applied to the pharmaceutical development. The critical quality attributes (CQAs) of the finished product were identified as those that affect the target design quality criteria of purity, strength, drug release and stability, and should be within an appropriate limit or range. The identified CQAs are in line with the typical product attributes of an immediate release tablet intended for oral administration. Based on the experimental work, particle size distribution of metformin hydrochloride, particle size of empagliflozin, Loss on Drying (LOD) of the granules, appearance of the tablet cores, tablet hardness, tablet weight, appearance of the film-coated tablets, and weight gain of the film-coated tablets were identified as CQAs. A risk assessment was carried out in early development and after the experimental work on the potential relationships between critical material attributes (CMA) / critical process parameters (CPP) and CQAs of the drug product. Main compression force was the only critical process parameter (CPP) identified. A qualitative approach was chosen based on results of formulation development and early process development activities in lab scale and prior knowledge from formulation development. No design space was applied for and manufacture and validation are carried out classically. Based on the development activities, proven acceptable ranges (PARs) were defined for process parameters and material attributes. The settings of process parameters were confirmed at production scale. All CMAs/CPPs are included in the control strategy. Properties of the active substances which are relevant for finished product manufacture or performance were sufficiently explained. Both substances are classified as BCS Class III (high solubility, limited absorption). The particle size of empagliflozin was fixed during the development of empagliflozin film-coated tablets and is suitable for the current fixed-dose combination finished product as well. Particle size of metformin was not found to considerably impact the process nor influence dissolution or bioavailability and so no requirement for particle size distribution has been included in the specification of metformin hydrochloride.
The selection of excipients was justified. Compatibility between the two active substances and between empagliflozin and the excipients of the core tablets was confirmed in binary mixtures. Regarding the compatibility of metformin hydrochloride with the excipients of the core tablets and compatibility of both substances with the excipients of the film-coat, it was considered acceptable to rely on experience with linagliptin / metformin hydrochloride film-coated tablets and empagliflozin film-coated tablets respectively. This prior knowledge was supported by stability results of the finished product. All excipients are well known pharmaceutical ingredients and their quality is compliant with Ph. Eur. standards except for the film-coating, which is manufactured by an established supplier and tested according to established methods. The four strengths can be distinguished by colour and debossing. They have the same shape and comparable sizes. The fixed-dose combination formulation intended for commercialisation was not used in the phase III clinical trials which were carried out using a combination of empagliflozin tablets (supplied by Boehringer Ingelheim) and metformin hydrochloride tablets (Glucophage EU commercial product) mono component products. In order to bridge between the clinical and proposed commercial formulations, a number of bioequivalence studies was carried out, demonstrating the equivalence of in vivo performance of all 4 strengths.

Assessment report EMA/238334/2015 Page 12/99
The biobatches used in the bioequivalence studies were manufactured at the intended commercial manufacturing site at commercial scale. Representative single entity products were chosen based on dissolution and assay data of three batches. As no 12.5 mg strength has been developed for the empagliflozin single entity product, tablets of the 2.5 mg and 10 mg strength were combined and the justification provided in this regard was considered satisfactory. In parallel to the bioequivalence studies, comparative dissolution studies were carried out at pH 1, 4.5, and 6.8 using the proposed routine dissolution method for the fixed dose combination products. Whereas in the case of empagliflozin the dissolution profiles of test and reference were similar, in the case of metformin, the reference formulation dissolution profiles were much slower that the test, especially at acidic pH, for all strengths. Moreover a great variability was observed between different reference batches of metformin available on the market. However it has been sufficiently demonstrated by own data and bibliographic evidence that the routine dissolution conditions used in this exercise were over discriminating for metformin hydrochloride with respect to in vivo performance. In addition, and considering the aqueous solubility of the two active substances, dissolution is not expected to be the limiting factor in vivo. The discriminatory power of the dissolution method to be used for quality control purposes has been demonstrated. The suitability of the container closure system was established during stability testing.
Manufacture of the product and process controls The manufacturing process consists of fluid-bed granulation, blending, compression, and film-coating. The critical process parameters and in-process controls (IPCs) have been presented and are justified in relation to how the product quality attributes are affected. Control is achieved through a combination of specifications (e.g. for input materials), IPCs, control of operating conditions by respective quality systems, and specifications of the drug product. The designed control strategy ensures that the manufacturing process consistently delivers a drug product that meets the defined criteria for all CQAs.
The main manufacturing operations correspond to a standard process. However due to the low empagliflozin content (<2%), the finished product is regarded as specialised dosage form requiring production scale process validation data. The manufacturer has, however, significant manufacturing experience products with low active substance content. Therefore the process validation data presented and the bracketing approach were accepted. The process was successfully validated with four production scale batches of the 5 / 500 mg (no marketing authorisation applied for) and the 12.5 / 850 mg strengths, three production scales batches of the 5 / 850 mg, 5 / 1000 mg, and 12.5 / 500 mg (no marketing authorisation applied for) strengths, and one production scale batch of the 12.5 / 1000 mg strength.
Product specification The finished product release specifications comprise appropriate tests for this kind of dosage form including description (visual test), identification of empagliflozin (HPLC and UV), identification of metformin hydrochloride (HPLC and UV), impurities (HPLC), assay of empagliflozin and of metformin hydrochloride (HPLC), dissolution of both active substances (Ph. Eur.), uniformity of dosage unit by content uniformity (HPLC), mass variation and microbiological quality (Ph. Eur., skip lot testing as per ICH Q6A). The absence of tests for organic solvents, inorganic impurities, enantiomeric purity (empagliflozin), hardness and disintegration time has been adequately justified by the applicant and relevant data were provided. The analytical methods used have been adequately described and non-compendial methods appropriately validated in accordance with the ICH guidelines. Batch analysis results are provided for 19 commercial scale batches covering all applied strengths confirming the consistency of the manufacturing process and its ability to manufacture to the intended product specification.

Assessment report EMA/238334/2015 Page 13/99
Stability of the product A bracketing design was applied based similarity of composition of the different dosage strengths and comparable stability of strengths in stress stability studies. Stability data on 14 commercial scale batches of finished product covering all strengths, stored under long term conditions (25 ºC / 60% RH) for up to 24 months and under accelerated conditions (40 ºC / 75% RH) for up to 6 months according to the ICH guidelines were provided. The batches were manufactured at commercial scale according to the proposed manufacturing process at the intended commercial manufacturing site. Tested parameters were description, dissolution, degradation products, assay, and microbiological quality. The latter was tested initially and thereafter yearly under long term conditions. The analytical methods were the same as for release. The HPLC method for assay and degradation products of empagliflozin was modified during the stability studies to improve robustness and selectivity. No relevant change or trend to any of the measured parameters was observed under either condition. The analytical procedures used are stability indicating.
Stressed stability studies at elevated temperature, high humidity, and a photostability study as per ICH Q1B were carried out on one production scale batch of each strength. Tested parameters were description, loss on drying, dissolution, degradation products, assay, and microbiological quality. The latter was only tested at high humidity. No changes were observed at elevated temperature and under light stress conditions. Moderate changes were observed in loss on drying after open storage at all storage conditions and degradation of empagliflozin after open storage at 40°C / 75% RH. However these changes were within the specification. It is concluded that no labelling precautions are necessary for the commercial product regarding exposure to heat, moisture, or light.
Adventitious agents The drug product is produced with no materials of human or animal origin.
2.2.4. Discussion on chemical, pharmaceutical and biological aspects
Information on development, manufacture and control of the active substances and the finished product has been presented in a satisfactory manner. The results of tests carried out indicate consistency and uniformity of important product quality characteristics, and these in turn lead to the conclusion that the product should have a satisfactory and uniform performance in clinical use.
The applicant has applied QbD principles in the development of the finished product and its manufacturing process. However, no design spaces were claimed.
2.2.5. Conclusions on the chemical, pharmaceutical and biological aspects
The quality of this product is considered to be acceptable when used in accordance with the conditions defined in the SmPC. Physicochemical and biological aspects relevant to the uniform clinical performance of the product have been investigated and are controlled in a satisfactory way.
2.2.6. Recommendation(s) for future quality development
In the context of the obligation of the MAHs to take due account of technical and scientific progress, the CHMP recommends the following points for investigation:
- The Applicant commits to re-evaluate the limit for a diastereomer in the empagliflozin active substance specification by the end of 2015.
Assessment report EMA/238334/2015 Page 14/99
2.3. Non-clinical aspects
2.3.1. Pharmacology
Empagliflozin
Empagliflozin is a selective and potent inhibitor of the human, rat and mouse glucose transporter SGLT2. Non-clinical data of empagliflozin has been evaluated in the context of the initial marketing application of Jardiance (available in the European Public Assessment Report: http://www.ema.europa.eu/docs/en_GB/document_library/EPAR_-_Public_assessment_report/human/002677/WC500168594.pdf)
Metformin
No primary pharmacodynamic studies with metformin have been performed by the applicant.
Metformin, belonging to the biguanide class, is the first-line drug of choice for the treatment of type 2 diabetes, in particular in overweight and obese people and those with normal kidney function. The mechanism of action of metformin is complex, involves different cellular pathways and is still not fully understood. Metformin improves hyperglycaemia primarily through its suppression of hepatic glucose production and decreases absorption of glucose from the gastrointestinal tract. No secondary or safety pharmacology studies with metformin were conducted by the applicant.
Empagliflozin/Metformin
Empagliflozin in combination with metformin has been tested acutely (single dosing) with an oral glucose tolerance test (OGTT) in Zucker fatty diabetes (ZDF) rats. Both empagliflozin at a dose of 3 mg/kg and metformin at a dose of 300 mg/kg as well as the combination achieved a robust reduction of glucose excursion in plasma after oral glucose administration, assessed by glucose AUC. The combination of empagliflozin with metformin reduced plasma glucose AUC by 63%, and this reduction was significantly greater than the effect achieved with each monotherapy alone (empagliflozin: 37%, metformin: 39%).
A chronic 28 day study has been conducted in ZDF rats to investigate the effect of empagliflozin (3 mg/kg/day) combined with metformin (300 mg/kg/day) on glucose homeostasis. Following 28 days of treatment, fasting glucose was further improved by empagliflozin when combined with metformin. This was also associated with a superior reduction of HbA1c (-4.80%) for the combination, compared to monotherapy treatments (-3.32% for empagliflozin and -2.12% for metformin) from a baseline of 14.4% in the vehicle-treated group. Superiority of the combination was also observed in an OGTT performed at the end of the study. However, in this model a trend towards increased body weight gain was observed after either metformin or empagliflozin treatment. The combination further enhanced this effect on body weight gain which was now statistically significant throughout the study. At the end of the 28-day drug treatment period, the body weights of the ZDF rats administered BI 10773 3 mg/kg po, metformin 300 mg/kg po and the combination of BI 10773 and metformin were 7.1%, 7.3% and 16.2% higher, respectively, than those of the vehicle-treated animals. The effect on body weight gain by empagliflozin conflicts with previous results obtained in dietary-induced obese Wistar rats, where body weight was reduced by empagliflozin treatment. Similarly, in humans empagliflozin also has a diminishing effect of body weight.
Based on the available data and known differential pharmacology of metformine and empagliflozin, it is agreed that no secondary pharmacology studies are performed with the combination of both compounds.

Assessment report EMA/238334/2015 Page 15/99
There were no adverse effects in empagliflozin safety pharmacology studies indicative of potential human safety concerns. Dedicated safety pharmacology studies were not conducted for metformin due to the lack of adverse outcomes derived from extensive cumulative clinical data. Therefore evaluation of the combination in a full battery of safety pharmacology studies was considered unwarranted.
2.3.2. Pharmacokinetics
Empagliflozin
Empagliflozin has previously been assessed in detail (EPAR of Jardiance: http://www.ema.europa.eu/docs/en_GB/document_library/EPAR_-_Public_assessment_report/human/002677/WC500168594.pdf). Empagliflozin was well absorbed following oral administration in all animal species investigated and adequate plasma exposure was achieved in toxicology studies. In rat and dog toxicology studies, empagliflozin plasma exposure following oral administration generally increased proportionally with dose. The oral bioavailability of empagliflozin was high in the CD-1 mouse (90-97%), moderate in the Wistar rat (31%), and high in the beagle dog (89%). In mice, the clearance of empagliflozin was moderate, the steady-state volume of distribution was moderate, and the elimination halflife after intravenous administration was moderate. The disposition of empagliflozin in rat and dog was characterized by low to intermediate clearance, moderate volume of distribution, and moderate half-life. In rat and dog toxicology studies, there were no consistent trends in the toxicokinetic data to suggest an effect of repeated dosing on plasma exposure, indicating that there was little or no accumulation of empagliflozin. Empagliflozin is a substrate for the efflux transporters P-glycoprotein (P-gp) and breast cancer resistance protein (BCRP). Since the bioavailability of empagliflozin in all preclinical animal species was high, and in the single rising dose clinical study there was a linear relationship between oral dose and plasma exposure at all administered doses, interactions between empagliflozin and P-gp or BCRP are not likely to restrict its absorption.
The mean plasma protein binding of empagliflozin was determined in the plasma of mouse (88.1%), rat (90.5%), rabbit (91.1%), dog (88.8%), and human (83.7%). Partitioning of empagliflozin into blood cells was moderate in all species tested. In a QWBA study in the male pigmented rat, distribution of radiolabeled empagliflozin or its metabolites into tissues following oral administration was limited. Matrices with the highest concentrations of empagliflozin-derived radioactivity were the gastrointestinal tract contents, urine, and bile. Radioactivity was not measurable in central nervous system tissues protected by the blood brain barrier at any sampling time. Similarly, radioactivity was not associated with the melanin-containing tissues in the eye or skin, and was not detected in testis, lens of the eye, or bone marrow at any sampling time. In timed-pregnant Wistar (Han) rats, the distribution of radioactivity was limited. Peak concentrations of radioactivity were low in the maternal reproductive tissues. Empagliflozin-derived radioactivity was not observed in the fetuses of the Gestation Day 13 animals, but was observed at low levels at one time point of the Gestation Day 18 animals, suggesting that drug-derived radioactivity does cross the placental barrier, but at low levels. Empagliflozin is a substrate of two uptake transporters expressed at the liver sinusoidal membrane, OATP1B1 and OATP1B3, and one kidney transporter, OAT3. Transport of empagliflozin by efflux (P-gp, BCRP) and uptake (OATP1B1, OATP1B3, OAT3) transporters may affect its disposition in humans.
In humans, the primary route of metabolism was glucuronidation by multiple UGT isoforms, resulting in the formation of 3 glucuronide conjugates, while oxidation was the primary route of metabolism in the mouse, rat, and dog. Ten metabolites of empagliflozin were identified in the plasma or excreta of mice, 7 in rats, 12 in dogs, and 6 in human. The 3 most abundant glucuronide metabolites identified in human plasma were found in dog and mouse plasma and were not detected in rat plasma. In

Assessment report EMA/238334/2015 Page 16/99
humans, no single glucuronide metabolite was considered major (>10% of total drug-related material). Oxidative metabolites of empagliflozin identified in human excreta collectively do not exceed 10% of dose, and as such it is unlikely that empagliflozin exposure will be affected by drugs that are known to inhibit or inactivate oxidative metabolism. Empagliflozin is not an inducer, inhibitor, or inactivator of the major human CYP450 isoforms at steady-state plasma concentrations achieved following dosing at the maximal therapeutic dose of 25 mg qd. Thus, the potential for empagliflozin to reversibly inhibit or inactivate the major CYP450 isoforms is remote, and drug-drug interactions involving the major CYP450 isoforms with empagliflozin and concomitantly administered substrates of these enzymes are considered unlikely.
The primary route of elimination of empagliflozin and its metabolites, following either PO or IV dosing, was through excretion into feces in mouse, rat, and dog (48-82% of administered dose). In all preclinical species evaluated, urinary excretion also contributed to the excretion of empagliflozin and its metabolites (3.5-36% of administered dose). In the human ADME study, in which a single 50 mg dose of radiolabeled empagliflozin was administered orally, 34.2% of the dose was recovered as parent empagliflozin in feces, and 23.7% of the dose was recovered as parent empagliflozin in urine. In a lacteal secretion study in the Wistar (Han) rat, empagliflozin-derived radioactivity was excreted into milk at all time points through 24 hr postdose. Mean milk:plasma concentration ratios ranged from a low of 0.634 at 1 hr to a high of 5.00 at 8 hr postdose. In humans dosed orally with [14C]empagliflozin, unchanged empagliflozin comprised 43.5% of urine radioactivity and 82.9% of fecal radioactivity. Overall, 57.9% of the administered dose was excreted as parent compound. The overall mean recovery of the administered radioactivity in urine and feces was 95.6%; recovery in individual subjects ranged from 93.0 to 99.4%.
Metformin
Metformin hydrochloride is highly soluble but poorly permeable. Thus, metformin can be classified as BCS class III drug. The oral bioavailability in rats was low, about 30% in doses ranging from 50 to 200 mg/kg.
Metformin has moderate to high volume of distribution (2-3 L/kg) in mice and rats, indicating extensive tissue distribution, and was confirmed experimentally by dosing radiolabeled metformin. High concentrations of radioactivity were found in the gastrointestinal tract (stomach, jejunum, ileum and colon), kidneys, liver and the salivary glands at concentrations higher than in blood. Lower levels were observed in the heart, skeletal muscle, white fat, and brain, indicating that metformin and/or metabolites may cross the blood brain barrier. OCTs were shown to be involved in the renal and hepatic distribution of metformin. Metformin does not bind appreciably to plasma proteins, but demonstrates a time-dependent association with erythrocytes in blood. This may be explained by slow uptake into erythrocytes due to the low permeability. Based on human data, metformin crosses the blood-placenta-barrier.
Metformin does not inhibit human CYP450 enzymes. The overall contribution of metabolic transformation of metformin to its elimination is low in preclinical species, and in human metformin is not metabolized and is completely excreted as unchanged parent. However, in rats, it has been demonstrated that metformin is partially metabolized via CYP2C11, CYP2D1 and CYP3A1/2. Due to this CYP450-mediated metabolism of metformin in the rat, a slight intestinal or hepatic first pass metabolism has been observed.
Renal elimination of unchanged metformin is the principal pathway of excretion in preclinical species, and the sole pathway of excretion in human. Active secretion involving human transporters MATE2-K and OCT2 in the proximal tubules of the kidney is suggested to be a mechanism driving renal excretion, in addition to glomerular filtration. Biliary excretion is low or non-existent in preclinical
Assessment report EMA/238334/2015 Page 17/99
species and human. Metformin is excreted into milk in humans. Animal data concerning excretion of metformin into milk in lactating animals is not currently available in the literature.
Empagliflozin/Metformin
Based on nonclinical data for empagliflozin and metformin, in particular their metabolism and transport characteristics, pharmacokinetic drug-drug interactions between empagliflozin and metformin at the intended therapeutic doses are highly unlikely. Additionally, a clinical DDI study was conducted in which metformin (1000 mg, bid) and empagliflozin (50 mg, qd) were co-administered to steady-state. Empagliflozin exposure was not affected by co-administration with metformin. The fraction of empagliflozin excreted into urine was not affected by co-administration with metformin. Similarly, metformin exposure was not affected by co-administration with empagliflozin. The fraction of metformin excreted into urine was not affected by co-administration with empagliflozin. These data indicate that no clinical DDI was observed for metformin and empagliflozin when the two drugs were co-administered.
2.3.3. Toxicology
Empagliflozin
Empagliflozin has been assessed previously in the MAA procedure for Jardiance (EPAR: http://www.ema.europa.eu/docs/en_GB/document_library/EPAR_-_Public_assessment_report/human/002677/WC500168594.pdf).
Non-clinical data reveal no special hazard for humans based on conventional studies of safety pharmacology, genotoxicity, fertility and early embryonic development.
In long term toxicity studies in rodents and dogs, signs of toxicity were observed at exposures greater than or equal to 10-times the clinical dose of empagliflozin. Most toxicity was consistent with secondary pharmacology related to urinary glucose loss and electrolyte imbalances including decreased body weight and body fat, increased food consumption, diarrhea, dehydration, decreased serum glucose and increases in other serum parameters reflective of increased protein metabolism and gluconeogenesis, urinary changes such as polyuria and glucosuria, and microscopic changes including mineralisation in kidney and some soft and vascular tissues. Microscopic evidence of the effects of exaggerated pharmacology on the kidney observed in some species included tubular dilatation, and tubular and pelvic mineralisation at approximately 4-times the clinical AUC exposure of empagliflozin associated with the 25 mg dose.
The genotoxic potential of empagliflozin was investigated in several assays, in which empagliflozin was found to be without genotoxic potential.
In a 2 year carcinogenicity study, empagliflozin did not increase the incidence of tumors in female rats up to the highest dose of 700 mg/kg/day, which corresponds to approximately 72-times the maximal clinical AUC exposure to empagliflozin. In male rats, treatment-related benign vascular proliferative lesions (haemangiomas) of the mesenteric lymph node were observed at the highest dose, but not at 300 mg/kg/day, which corresponds to approximately 26-times the maximal clinical exposure to empagliflozin. Interstitial cell tumors in the testes were observed with a higher incidence in rats at 300 mg/kg/day and above, but not at 100 mg/kg/day which corresponds to approximately 18-times the maximal clinical exposure to empagliflozin. Both tumors are common in rats and are unlikely to be relevant to humans.
Empagliflozin did not increase the incidence of tumors in female mice at doses up to 1000 mg/kg/day, which corresponds to approximately 62-times the maximal clinical exposure to empagliflozin. Empagliflozin induced renal tumors in male mice at 1000 mg/kg/day, but not at 300 mg/kg/day, which corresponds to approximately 11-times the maximal clinical exposure to empagliflozin. The

Assessment report EMA/238334/2015 Page 18/99
mode of action for these tumors is dependent on the natural predisposition of the male mouse to renal pathology and a metabolic pathway not reflective of humans. The male mouse renal tumors are considered not relevant to humans.
At exposures sufficiently in excess of exposure in humans after therapeutic doses, empagliflozin had no adverse effects on fertility or early embryonic development. Empagliflozin administered during the period of organogenesis was not teratogenic. Only at maternally toxic doses, empagliflozin also caused bent limb bones in the rat and increased embryofetal loss in the rabbit.
In pre- and postnatal toxicity studies in rats, reduced weight gain of offspring was observed at maternal exposures approximately 4-times the maximal clinical exposure to empagliflozin. No such effect was seen at systemic exposure equal to the maximal clinical exposure to empagliflozin. The relevance of this finding to humans is unclear.
Metformin
The general toxicity of metformin was studied in a 2-week toxicity study and in a metformin alone group of the 2- and 13-week combination toxicity study in the rat. Target organs were the heart, liver, kidneys, salivary glands, ovaries, thymus, gastrointestinal tract and adrenal glands. In addition, body weight gain was reduced. Metformin was administered by oral gavage to rats at dosages of 0, 100, 200 or 1000 mg/kg/day for 2 weeks. At 1000 mg/kg/day, body weight gain was slightly decreased. The organ weights of the heart, liver, adrenals, pituitary (females only) were increased and thymus weights were reduced. Microscopic concentric hypertrophy of the ventricle myocardium correlated with increased heart weights. Other microscopic findings consisted of cytoplasmic vacuolation of the adrenal medulla (zona fasciculata), hyperplasia of the pituitary gland (females only) and atrophy of the seminal vesicles (males). There were also alterations of the parotid salivary gland and size reduction of the cortical areas of the thymus. The NOAEL was 200 mg/kg/day with a Cmax,ss of 70.100 nM and AUC(0-24)ss of 374000 nM•h.
According to the NDA of Glumetza (metformin hydrochloride extended-release tablets), genotoxicity assessments for metformin in the Ames test, gene mutation test (mouse lymphoma cells), chromosomal aberrations test (human lymphocytes), and in vivo mouse micronucleus tests were negative.
According to the Summary basis of approval for Glumetza, long-term carcinogenicity studies with metformin have been performed in Sprague Dawley rats at doses of 150, 300, and 450 mg/kg/day in males and 150, 450, 900, 1200 mg/kg/day in females. These doses were approximately 2, 4, and 8 times in males, and 3, 7, 12, and 16 times therapeutic exposures based AUC values with the maximum recommended human daily dose of 2000 mg/kg/day. No evidence of carcinogenicity with metformin was found in either male or female rats. No additional studies have been performed by the applicant.
According to the Summary basis of approval for Glumetza, fertility of male or female rats was unaffected by metformin and was not teratogenic in rats and rabbits at doses up to 600 mg/kg/day, which represent 3 and 6 times the MRHD of 2000 mg based on body surface area comparison for rats and rabbits, respectively.
In an embryo-fetal development study performed by the applicant metformin was administered by oral gavage to bred female Wistar (Han) rats at up to 1000 mg/kg/day from gestation day (GD) 7 to 16. The mean body weight gain of all dose groups was decreased. In the foetuses shortened truncus brachiocephalicus and small kidney were observed at 1000 mg/kg/day. In the skeleton, the observed variations were attributable to delayed ossification indicating developmental retardation. Most of them occurred at 1000 mg/kg/day dose group, but they were also observed at 500 mg/kg/day. Skeletal and external malformations were seen at 1000 mg/kg/day. They comprised split sternebra lateral axis, flat and thickened rib (unilateral and bilateral), and rib z-shaped (bilateral) as well as

Assessment report EMA/238334/2015 Page 19/99
single unilateral anophthalmia and single unilateral polydactylia in one litter. Flat and thickened ribs (bilateral) were also seen at 500 mg/kg/day. There was an increased incidence of scapula bent inwardly (finding without classification) at 500 and 1000 mg/kg/day. At the NOAEL of 200 mg/kg/day the maternal plasma exposure was 638 µM.h, which gives a safety margin of approximately 4.
Empagliflozin/Metformin
In the two week combination study, the coadministration of 500/1000 mg/kg/day empaglifozin/metformin is clearly above the maximum tolerated dose as evidenced by lower body weight gain or body weight loss, lethality and adverse clinical observations prior to scheduled sacrifice. Several adverse findings were observed in the 300/600 empaglifozin/metformin coadministration group; including, hunched appearance, dehydration, decreased body weight gain in males, and cortical tubular degeneration and mineralization of the pelvic calices of the kidney. Mineralization of the pelvic calices of the kidney (calculi) was observed with increased incidence in the 300/600- and 500/1000 mg/kg/day coadministration dose groups compared with the 500 mg/kg/day empaglifozin group; most animals with this finding also had hydronephrosis. The combination of mineralization of pelvic calices (calculi) and hydronephrosis was considered adverse. The NOAEL for the coadministration of empaglifozin and metformin is 100/200 mg/kg/day. The NOAEL corresponds to a Cmax and AUC0-24 for empaglifozin of 17150 nM and 61900 nM·h, respectively (sexes combined), and for metformin; 64350 nM and 429000 nM·h, respectively (sexes combined).
In a 13-week toxicity study, rats were administered empagliflozin/metformin at doses of 50/100, 100/200, or 200/400 mg/kg/day, 200 mg/kg/day empagliflozin or 400 mg/kg/day metformin. There were no test article-related deaths during this study. Transient clinical signs, ano-genital staining in males and watery/unformed stool in both sexes, were noted at 200/400 mg/kg/day empagliflozin/metformin between Days 2 and 11. In addition, there was increased food consumption at all dose levels and lower body weight only in males at 200/0 (-5%) and 200/400 mg/kg/day empagliflozin/Metformin (-7% to -15%). The oral administration of empagliflozin (alone and/or in combination with metformin) resulted in expected pharmacologic glucosuric and hypoglycemic effects at all doses (both sexes). Empagliflozin-associated effects were kidney (all doses; both sexes) and liver-related (≥100/≥200 mg/kg/day empagliflozin/metformin; both sexes) and were exacerbated when combined with metformin. Findings included electrolyte variances (mainly hypochloraemia, which is usually associated with acid-base disturbances), aciduria, liver enzyme elevations (less than 2-fold) and increases in kidney and liver weights. In addition, at the high dose coadministration of 500/1000 empagliflozin/metformin, cortical tubular epithelial cell degeneration was uniquely observed and in these animals other renal pathology was exacerbated (hydronephrosis) or occurred with increased incidence (cortical tubular vacuolation or mineralisation). Also the severity of the hypochloraemia and aciduria was greater with combination treatment and was dose-related, indicating that combination therapy magnified hypochloraemia and aciduria. Taken together these data suggest that empagliflozin’s effects on renal physiology, electrolyte balance and acid/base state is more prominent/occurs at lower doses when empagliflozin is administered concomitantly with metformin, than when administered alone. Renal toxicity is seen only at high exposure levels and the combination does not lead to smaller safety margins in this respect.
Decreased thymus weights at 200/0 and ≥100/≥200 mg/kg/day empagliflozin/metformin correlated with reduced body weight and/or increased adrenal weights and reduced glucose levels. The decreased thymus weight was not associated with microscopic changes that would suggest a direct effect of empagliflozin on the thymus. Consequently, these phenomena are interpreted as stress-related.
After a 1-month dose-free period, absolute body weight in the 200/0 and 200/400 mg/kg/day empagliflozin/metformin males were still lower than controls. There were no new target organs identified with the combination of empagliflozin/metformin compared to empagliflozin or metformin alone. Under the conditions of this study, due to hypochloraemia, the

Assessment report EMA/238334/2015 Page 20/99
no-observed-adverse-effect-level (NOAEL) was considered to be 50/100 mg/kg/day empagliflozin/metformin. This dose level is associated with a safety margin of 4 for empagliflozin and 2 for metformin, based on plasma AUC values.
Neither empagliflozin nor metformin were shown previously to be genotoxic, therefore additional genotoxicity studies were considered unwarranted.
Since the mode of action that causes the renal tumors in mice is not considered relevant for humans, it can be agreed that no combination carcinogenicity study is performed.
No microscopic changes in reproductive organs were seen in the rat in the 13 week empagliflozin/metformin combination study. Since neither empagliflozin nor metformin were shown to affect fertility, a combination fertility study with empagliflozin/metformin was not considered warranted in accordance with the guideline of the non-clinical development of fixed dose combinations of medicinal products.
In an embryo-fetal development study in pregnant Wistar (Han) rats empagliflozin/metformin was administered by oral gavage at dose levels of 30/60, 100/200, 300/600, 300/0, and 0/600 mg/kg/day from gestation days 7-16. Maternal and developmental toxicity was evident at 300/600 mg/kg/day empagliflozin/metformin as indicated by reductions in body weight gain and/or body weight during the administration period, early and late resorptions, lower fetal weight, visceral and skeletal variations and skeletal malformations. A similar pattern was seen in the metformin only (600) group. In contrast, the empagliflozin only (300) group showed reduction in maternal body weight, but developmental effects. In the metformin only study, Metformin provoked developmental retardation and induced changes during organogenesis of the rib cage, the axial skeleton and the scapula at a dose of 1000 mg/kg and in clearly less extent at a dose of 500 mg/kg, pointing to a teratogenic action of metformin. Malformations observed at 300:600 mg/kg empagliflozin:metformin HCl are therefore considered to be due to metformin and not to empagliflozin. However, glucose measurements on GD 7 indicate a trend towards a empagliflozin dose dependent decrease. Part of the observed fetal morphological changes in the 300:600 mg/kg empagliflozin:metformin HCl may therefore partly be attributable to dysglycaemia, resulting from treating normoglycemic rats.
The NOAEL for the combination of empagliflozin/metformin for maternal and developmental toxicity was 100/200 mg/kg/day empagliflozin/metformin and the NOAEL for renal development was >300/600 mg/kg/day empagliflozin/metformin.
The reproductive/developmental toxicity profiles of empagliflozin and metformin are sufficiently characterized, therefore a combination pre- and postnatal study with empagliflozin/metformin was not considered warranted in accordance with the guideline of the non-clinical development of fixed dose combinations of medicinal products.
There were no local tolerance studies performed with the empagliflozin/metformin combination, since there were no specific concerns with either empagliflozin or metformin alone.
No impurities or degradants specific to the empagliflozin/metformin FDC have been observed in the drug product above the ICH Q3B qualification threshold at release or on primary stability. Furthermore, these impurities and degradants have been screened and all were predicted to be non-mutagenic.
2.3.4. Ecotoxicity/environmental risk assessment
Both metformin and empagliflozin are already marketed by the same applicant for patients with the same indication. For both compounds an ERA has already been performed and assessed for the patient population with the indication of diabetes II (See paragraph I.1.5). The fixed combination product does not include new indications. Because of this and because the same maximum dosage is

Assessment report EMA/238334/2015 Page 21/99
applied, an increase in use of the individual active ingredients is not expected. Thus, an ERA does not need to be performed for this combination product.
Metformin
An ERA for metformin was performed for the product Trajentamet (Jentadueto, EMEA/H/C/002279/0000). The assessment of the phase II ERA, study summaries and an EPAR were prepared within this procedure. No risk to the environment is to be expected from the use of metformin. The EPAR table for metformin is included below.
Table 1 Summary of main study results Substance (INN/Invented Name): metformin CAS-number (if available): 657-24-9 PBT screening Result Conclusion Bioaccumulation potential- log Kow
shake flask log Dow = -1.1 (pH 7.4) Potential PBT: No
PBT-assessment Parameter Result relevant
for conclusion Conclusion
Bioaccumulation
log Kow log Dow = -1.1 at pH 7.4 not B BCF not determined
Persistence DT50 or ready biodegradability
not readily biodegradable
Toxicity NOEC or CMR N.A. PBT-statement : metformin is not PBT, nor vPvB. Phase I Calculation Value Unit Conclusion PEC surfacewater , default Fpen 7.8 (metformin
base) µg/L > 0.01 threshold:
Y Other concerns (e.g. chemical class)
unknown unknown
Phase II Physical-chemical properties and fate Study type Test protocol Results Remarks Adsorption-Desorption OECD 106 Koc =4.8 and 7.5 L/kg 2 sludges, based
on Kd OECD 106 Koc =283, 2056 and 3209 L/kg 3 soils; based on
Kd Ready Biodegradability Test OECD 301A not ready biodegradable Aerobic and Anaerobic Transformation in Aquatic Sediment systems
OECD 308 DT50 water: 9.2 (r) and 7.9 (p) days DT50 total system: 22.0 (r) and 22.3 (p) days At the end of the study (day 79), 7.5% of applied radioactivity (AR) was remaining as parent compound in the total pond system, and in the river system the parent metformin was not observed any longer. Radioactive carbon dioxide: 79.4% (river system) and 59.9% (pond system) at day 79
r = river, p = pond. A very high rate of mineralisation of the test item was observed in both test systems throughout the study
Phase IIa Effect studies Study type Test protocol Endpoint value Unit Remarks
All toxicity test results expressed as mg metformin base / L Algae, Growth Inhibition Test P. subcapitata
OECD 201 NOEC ≥ 78 mg/L
Daphnia sp. Reproduction Test D. magna
OECD 211 NOEC 17 mg/L 21 d mortality, reproduction
D. magna OECD 211 LC50 38 mg/L 21 d mortality

Assessment report EMA/238334/2015 Page 22/99
D. magna OECD 211 LC100 55 mg/L 21 d mortality Fish, Early Life Stage Toxicity Test D. rerio
OECD 210 NOEC ≥ 10 mg/L Result valid for hatching rate, time to hatch, surivival, length and weight.
Activated Sludge, Respiration Inhibition Test
OECD 209 EC10 110 mg/L EC50>1000 mg/L
Phase IIb Studies Sediment dwelling organism OECD 218 NOEC 125 mg/kg TOC 2.4%
Empagliflozin
An ERA for empagliflozin was performed for the product Jardiance (EMEA/H/C/002677/0000). The assessment of the phase II ERA, study summaries and an EPAR were prepared within this procedure. No risk to the environment is to be expected from the use of empagliflozin. The EPAR table for empagliflozin is included below.
Table 2 Summary of main study results Substance (INN/Invented Name): empagliflozin CAS-number (if available): 864070-44-0 PBT screening Result Conclusion Bioaccumulation potential – log Kow
OECD107 Log Kow = 1.73 Not potentially PBT, nor vPvB
PBT-assessment Parameter Result relevant
for conclusion Conclusion
Bioaccumulation
log Kow Log Kow = 1.73 not B
Persistence DT50 or ready biodegradability
Not readily biodegradable
DT50 parent DT50, water = 2.3/2.1 d (r/p)
DT50, sediment = 4.9/3.6 d (r/p)
DT50, whole system = 2.5/2.5 d (r/p)
r=river, p=pond,
DT50 values corrected to 12°C;
Conclusion: not P
DT50 metabolite M3 DT50, sediment = 169/125 (r/p)
DT50 values corrected to 12°C.
Conclusion: P
Toxicity NOEC or CMR 2.4 mg/L not T
PBT-statement empagliflozin is considered not PBT, nor vPvB
empaglifozin forms a persistent metabolite (M3)
Phase I Calculation Value Unit Conclusion PEC surfacewater , default or refined (e.g. prevalence, literature)
0.125 µg/L > 0.01 threshold
Other concerns (e.g. chemical class)
No
Phase II Physical-chemical properties and fate Study type Test protocol Results Remarks Adsorption-Desorption OECD 106 Koc = 51.5 L/kg Mean of 49 and
54 L/kg for WWTP sludge.
Ready Biodegradability Test OECD 301 Not readily biodegradable

Assessment report EMA/238334/2015 Page 23/99
Aerobic and Anaerobic Transformation in Aquatic Sediment systems
OECD 308 DT50, water = 1.2/1.1 d (r/p) DT50, sediment = 2.6/1.9 d (r/p) DT50, whole system = 1.3/1.3 d (r/p) shifting to sediment = 26.4/25.0% (r/p)
r = river, p = pond, DT50 values at 20°C; Significant shifting to sediment observed
OECD 308 metabolite M3
DT50, sediment = 88.9/66.0 d (r/p)
DT50 values at 20°C
Phase IIa Effect studies Study type Test protocol Endpoint value Unit Remarks
Algae, Growth Inhibition Test / Pseudokirchneriella subcaptitat
OECD 201 NOEC ≥ 100 mg/L growth rate; yield
Daphnia sp. Reproduction Test OECD 211 NOEC ≥ 100 mg/L mortality; reproduction
Fish, Early Life Stage Toxicity Test / Danio rerio
OECD 210 NOEC 2.4 mg/L length; weight
Activated Sludge, Respiration Inhibition Test
OECD 209 NOEC ≥ 100 mg/L respiration
Phase IIb Studies Sediment dwelling organism / Chironomus riparius
OECD 218 NOEC 1011 mg/kg emergence; normalised to 10% o.c.
2.3.5. Discussion on non-clinical aspects
Empagliflozin is a selective and potent inhibitor of the human, rat and mouse glucose transporter SGLT2.
Metformin, a compound belonging to the biguanide class, improves hyperglycemia primarily through its suppression of hepatic glucose production and decreases absorption of glucose from the gastrointestinal tract.
In a primary pharmacology study in ZDF rats, fasting glucose was further improved by empagliflozin when combined with metformin. This was also associated with a superior reduction of HbA1c for the combination. Superiority of the combination was also observed in an OGTT performed at the end of the study. However, in this model a trend towards increased body weight gain was observed after either metformin or empagliflozin treatment, which contradicts with previous results in dietary-induced obese Wistar rats, where body weight was reduced by empagliflozin treatment.
Based on nonclinical data for empagliflozin and metformin, in particular their metabolism and transport characteristics, pharmacokinetic drug-drug interactions between empagliflozin and metformin at the intended therapeutic doses are highly unlikely.
In a 13-week toxicity study, rats were administered empagliflozin/metformin which resulted in expected pharmacologic glucosuric and hypoglycemic effects at all doses (both sexes). Empagliflozin-associated effects were kidney (all doses; both sexes) and liver-related (≥100/≥200 mg/kg/day empagliflozin/metformin; both sexes) and were exacerbated when combined with metformin. Findings included electrolyte variances (mainly hypochloremia, which is usually associated with acid-base disturbances), aciduria, liver enzyme elevations (less than 2-fold) and increases in kidney and liver weights. In addition, at the high dose coadministration of 500/1000 empagliflozin/metformin, cortical tubular epithelial cell degeneration was uniquely observed and in these animals other renal pathology was exacerbated (hydronephrosis) or occurred with increased incidence (cortical tubular vacuolation or mineralisation). Also the severity of the hypochloremia and aciduria was greater with combination treatment and was dose-related, indicating that combination

Assessment report EMA/238334/2015 Page 24/99
therapy magnified hypochloremia and aciduria. Taken together these data suggest that empagliflozin’s effects on renal physiology, electrolyte balance and acid/base state is more prominent/occurs at lower doses when empagliflozin is administered concomitantly with metformin, than when administered alone. Renal toxicity is seen only at high exposure levels and the combination does not lead to smaller safety margins in this respect.
Decreased thymus weights at 200/0 and ≥100/≥200 mg/kg/day empagliflozin/metformin correlated with reduced body weight and/or increased adrenal weights and reduced glucose levels. The decreased thymus weight was not associated with microscopic changes that would suggest a direct effect of empagliflozin on the thymus. Consequently, these phenomena are interpreted as stress-related.
In an embryo-fetal development study in pregnant Wistar (Han) rats empagliflozin/metformin or metformin alone caused teratogenicity mostly evident as an increase in skeletal malformations. These effects were seen starting at a dose level of 500 mg/kg/day. At this dose level plasma exposure was approximately 7 times the maximal human exposure to metformin. This finding is noteworthy as SmPC wording from other metformin containing products generally state that metformin is not a reproductive toxicant. This findings are now adequately reflected in the SmPC section 5.3.
2.3.6. Conclusion on the non-clinical aspects
An adequate rationale and supportive non-clinical evidence has been provided for the combined use of empagliflozin and metformin in the treatment of T2DM. The safety of the FDC of empagliflozin and metformin has been sufficiently investigated. It was shown that empagliflozin’s effects on renal physiology, electrolyte balance and acid/base state is more prominent/occurs at lower doses when empagliflozin is administered concomitantly with metformin, than when administered alone, with hypochloremia occurring at exposures of approximately 9- times and 3-times the clinical exposure for empagliflozin and metformin respectively (Safety margins at NOAEL 4 and 2 times, respectively).
2.4. Clinical aspects
2.4.1. Introduction
GCP
The Clinical trials were performed in accordance with GCP as claimed by the applicant.
The applicant has provided a statement to the effect that clinical trials conducted outside the community were carried out in accordance with the ethical standards of Directive 2001/20/EC.
2.4.2. Pharmacokinetics
As the pharmacokinetics/pharmacodynamics of metformin are well known, no specific studies with respect to the pharmacokinetics of metformin were submitted.
In this report the pharmacokinetics of empagliflozin administered alone are discussed and in combination with metformin (interaction as well as bioequivalence). Also bioequivalence of metformin in the combination products will be discussed here.
The pharmacokinetics of metformin are only summarized here.
Assessment report EMA/238334/2015 Page 25/99
Metformin administered alone
Absorption and bioavailability
After an oral dose of metformin, Tmax is reached in 2.5 hours. The absolute bioavailability is approximately 50% to 60%. After oral administration, metformin hydrochloride absorption is saturable and has a limited absorption window and therefore metformin pharmacokinetics are non-linear. At the usual metformin doses and dosing schedules, steady state plasma concentrations are reached within 24 to 48 hours. Food decreases the extent, and slightly delays the absorption, of metformin as shown by an approximately 40% lower Cmax, a 25% lower AUC, and a 35-minute prolongation of Tmax following administration of a single 850 mg tablet. However, the clinical relevance of these changes is unknown.
Distribution
Plasma protein binding is negligible. Metformin partitions into erythrocytes and the blood peak is lower than the plasma peak and appears at approximately the same time. The mean volume of distribution is between 63-276 L according to the EU SmPC and on average 654 L according to the US prescribing information.
Metabolism and elimination
Metformin is excreted unchanged in the urine; no metabolites have been identified in humans. The renal clearance of metformin is greater than 400 mL/min, indicating that metformin is eliminated by glomerular filtration and tubular secretion. Following an oral dose, the apparent terminal elimination half-life is approximately 6.5 hours.
Empagliflozin administered alone
Drug Products
During drug development three formulations were used:
The formulation TF-I was developed in the dose strengths of 0.5 mg, 5 mg, 25 mg and 100 mg. Formulation TF-II was developed for Phase II clinical studies based on TF-I as this formulation provided the desired systemic exposure and stability. The qualitative composition of TF-II is the same as for TF-I but differ in the quantitative composition. The final formulation 25 mg FF contained in the tablet core the same excipients as TF-II with an optimized quantitative composition. The 10 mg formulation has a composition different from the 25 mg tablets.
Specific and high performance liquid chromatography tandem mass spectrometry (HPLC-MS/MS) methods for the quantification of empagliflozin and its metabolite were developed and validated for human urine and plasma to support the clinical empagliflozin development program. Initially, the assays were developed for empagliflozin and its metabolite and they were later modified for the determination of empagliflozin only.
Population Pharmacokinetic/pharmacodynamic Modelling
The applicant performed a Population pharmacokinetic and pharmacokinetic-pharmacodynamic modelling of empagliflozin in patients with type 2 diabetes mellitus.

Assessment report EMA/238334/2015 Page 26/99
Pharmacokinetic Results
The demographic covariates (BMI, age, gender, and race) as well as TPRO had a significant, but small impact on empagliflozin's CL/F and AUCô,ss, respectively. The typical AUC,ss values were generally within ±25% of the reference group value across the range of most commonly observed covariate values and thus were considered as not clinically relevant. Furthermore, the apparent oral clearance of empagliflozin decreased with a decrease in eGFR leading to an increase in drug exposure. The typical AUC,ss increased by 18.5% (95% CI: 13.0, 24.8), 49.2% (95% CI: 39.2, 60.6), 88.1% (95% CI: 69.9, 107) in patients with an eGFR of 60, 30, and 15 mL/min/1.73 m2, respectively, compared to a reference patient with a eGFR of 100 mL/min/1.73 m2. Other covariates tested included smoking status and liver enzymes (LDH, AST, ALT, and AP) did not have a significant effect on the PK of empagliflozin. These results are further elaborated and commented upon with the respective headers in this report.
Absorption and Bioequivalence
The Applicant did not provided an absolute bioavailability study in which a comparison of the exposure to empagliflozin is compared between an intravenous dose and an oral dose.
However, in the mass-balance study 54% of the radioactivity administered orally was found in the urine and about 5% in the faeces as metabolites. It can therefore be assumed that at least 60% of the oral dose is absorbed.
The provided data indicates that the final 25 mg formulation can be considered bioequivalent with the trial formulation FT-II which is used in the pivotal pharmacokinetic studies. However, in some phase I studies also the trial formulation FT-I was used. As the quantitative composition of this formulation differ substantially from the final formulation (FF) as well as from the other trial formulation FT-II, comparison of the results with this first formulation is difficult to make as no comparative bioavailability study was submitted. As stated by Applicant empagliflozin can be considered as a Class III drug in the BCS, a biowaiver for this formulation can be granted as this formulation was only used in three non-pivotal studies and The submitted studies demonstrate that food significantly affect the bioavailability of empagliflozin. The extent of exposure (AUC) is decreased by 10 - 15% and the rate of exposure Cmax by more than 25%. The differences are considered not clinical relevant.
In study 1245.79 was shown that the 10 mg formulation was bioequivalent with the 25 mg formulation under fasting conditions. The 90% confidence intervals for the extent and rate of absorption were, after dose correction, within the acceptance ranges of 0.80 - 1.25.
Distribution
Empagliflozin is rapidly absorbed following oral administration empagliflozin with a mean tmax of 0.938 h in plasma. After reaching peak levels, plasma concentrations declined in a biphasic fashion with a rapid distribution phase and a slower elimination phase, with a half-life of 16 hours. The apparent steady-state volume of distribution was 73.8 L. The apparent terminal elimination half-life of empagliflozin was 12.4 hours, and the apparent oral clearance was 10.6 L/h.
The protein binding in human plasma is about 80 - 86% and the distribution to red blood cell 28 - 37% of the plasma concentration.
In Figure the figure below typical concentration-time curves of empagliflozin upon oral administration are given.
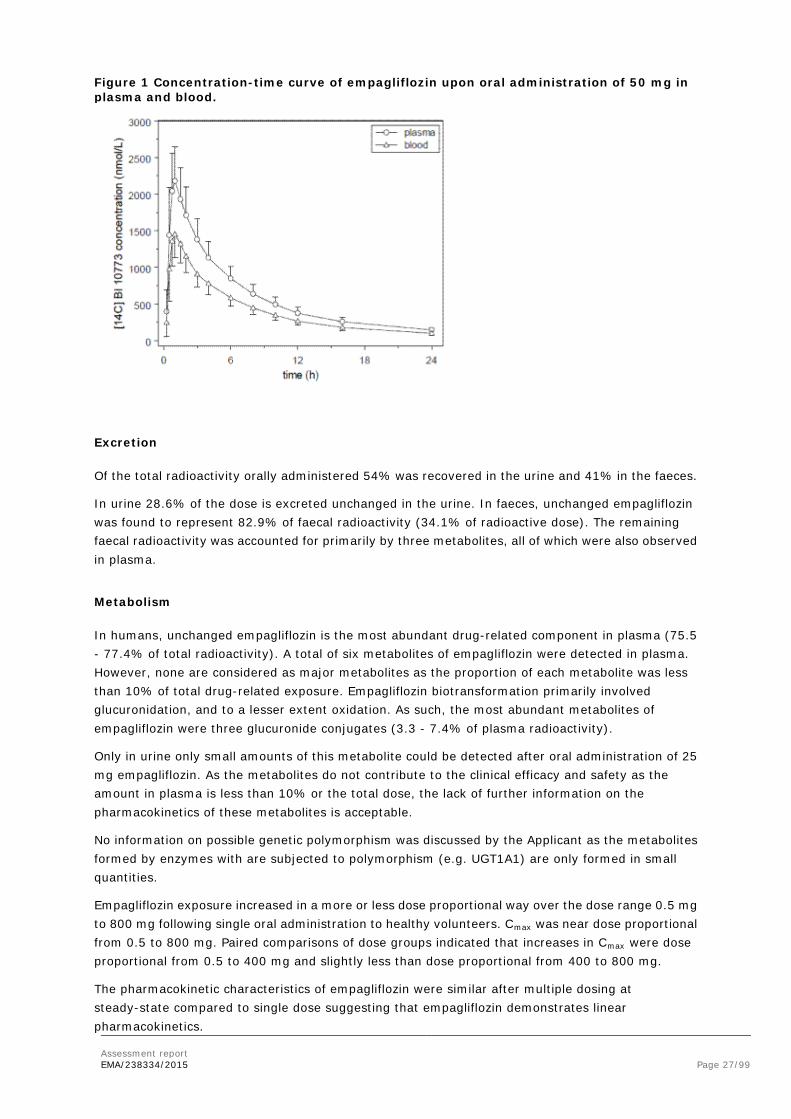
Assessment report EMA/238334/2015 Page 27/99
Figure 1 Concentration-time curve of empagliflozin upon oral administration of 50 mg in plasma and blood.
Excretion
Of the total radioactivity orally administered 54% was recovered in the urine and 41% in the faeces.
In urine 28.6% of the dose is excreted unchanged in the urine. In faeces, unchanged empagliflozin was found to represent 82.9% of faecal radioactivity (34.1% of radioactive dose). The remaining faecal radioactivity was accounted for primarily by three metabolites, all of which were also observed in plasma.
Metabolism
In humans, unchanged empagliflozin is the most abundant drug-related component in plasma (75.5 - 77.4% of total radioactivity). A total of six metabolites of empagliflozin were detected in plasma. However, none are considered as major metabolites as the proportion of each metabolite was less than 10% of total drug-related exposure. Empagliflozin biotransformation primarily involved glucuronidation, and to a lesser extent oxidation. As such, the most abundant metabolites of empagliflozin were three glucuronide conjugates (3.3 - 7.4% of plasma radioactivity).
Only in urine only small amounts of this metabolite could be detected after oral administration of 25 mg empagliflozin. As the metabolites do not contribute to the clinical efficacy and safety as the amount in plasma is less than 10% or the total dose, the lack of further information on the pharmacokinetics of these metabolites is acceptable.
No information on possible genetic polymorphism was discussed by the Applicant as the metabolites formed by enzymes with are subjected to polymorphism (e.g. UGT1A1) are only formed in small quantities.
Empagliflozin exposure increased in a more or less dose proportional way over the dose range 0.5 mg to 800 mg following single oral administration to healthy volunteers. Cmax was near dose proportional from 0.5 to 800 mg. Paired comparisons of dose groups indicated that increases in Cmax were dose proportional from 0.5 to 400 mg and slightly less than dose proportional from 400 to 800 mg.
The pharmacokinetic characteristics of empagliflozin were similar after multiple dosing at steady-state compared to single dose suggesting that empagliflozin demonstrates linear pharmacokinetics.

Assessment report EMA/238334/2015 Page 28/99
As the proposed dose is 10 and 25 mg, the deviation from linearity in the higher range is considered of no clinical relevance.
As no unexpected accumulation occur after multiple doing of empagliflozin, time dependent changes in the pharmacokinetics are unlikely to occur.
Pharmacokinetics in the target population
The exposure of empagliflozin in T2DM patients do not differ in a clinical significant way from healthy subjects. By comparing the pharmacokinetic variables after single dose in healthy subject from with those of T2DM patients a slightly higher exposure was found in T2DM patients (Table ). These exposure differences are marginal and as empagliflozin also shows linear pharmacokinetics in both healthy volunteers and patients with T2DM, the observed minor differences in empagliflozin exposure are not expected to confine the applicability of healthy volunteer trial results to the patient population.
Table 3 Comparison of pharmacokinetic variables after single dose in healthy subjects and T2DM patients
Intrinsic factors
The extent of exposure (AUC) is clearly affected by renal insufficiency. In mild and moderate impairment the exposure is increased by 30% and in patients with severe impairment by 70%. Also the half-life is increased in severe renal impaired patient in comparison with normal renal functions.
This increase in exposure is mainly caused by less renal excretion of empagliflozin in these patients. As the active site of action of empagliflozin is the renal tubuli, the efficacy will be probably also be decreased in these patients as the glucose in urine is these patients is also decreased significantly.
This higher exposure in renal impaired patients and the lower glucose excretion in these patients may be considered of no clinical relevance. This is based on the data of the Phase III study 1245.36 from which the Applicant claims that patients with moderate renal impairment did show a positive B/R ratio.
The relationship between renal impairment and the exposure is shown in Figure .

Assessment report EMA/238334/2015 Page 29/99
Figure 2 The relationship between renal impairment and exposure.
Liver impairment affects the exposure of empagliflozin significantly. The extent as well as the rate of exposure increased by 80% in severe liver impaired patients in comparison with healthy subjects. This is not due to renal insufficiency, which may be also manifest in patients with liver impairment, as the amount excreted in urine is increased slightly also. No dose adjustment is considered necessary in these patients.
The exposure to empagliflozin in Japanese and Chinese subjects is significant higher after multiple dosing of 25 mg orally than in Caucasian subjects. This may be due to differences in the weight as the subjects as the exposure to empagliflozin decrease by weight.
The slight increase in exposure in patients over 65 years may be explained by a lesser renal function in these group of patients as renal impairment clearly affect the exposure of empagliflozin. It is therefore acceptable not to adjust the dose on the basis of age but more on the renal function.
Weight and gender does not have clinical; significant effect on the exposure of empagliflozin.
Interactions
Potential drug-drug interactions of empagliflozin have been investigated in a number of phase I trials. The test substances were selected based on the properties of empagliflozin or as important and frequently prescribed co-medications in the target population.
Empagliflozin pharmacokinetics were similar with and without co-administration of metformin, glimepiride, pioglitazone, sitagliptin, linagliptin, warfarin, verapamil, ramipril, simvastatin, hydrochlorothiazide, and torasemide. Overall exposure (AUC) of empagliflozin increased 1.6-fold following co-administration with gemfibrozil, 1.35-fold with rifampicin, and 1.5-fold with probenecid. The observed increases in the overall exposure of empagliflozin were not considered to be clinically significant.
No dosage adjustment of empagliflozin is recommended when it is administered concomitantly with gemfibrozil, rifampicin, or probenecid. Therefore interaction on the level of the transporters OATP1B1, OATP1B3, OATP2B1 and OAT3 are considered not clinical relevant.
Empagliflozin had no clinically meaningful effect on the pharmacokinetics of metformin, glimepiride, pioglitazone, sitagliptin, linagliptin, warfarin, digoxin, ramipril, simvastatin, hydrochlorothiazide, torasemide, and oral contraceptives when co-administered with any of these drugs.
As empagliflozin is a substrate for P-gp, however, an interaction study with a single dose of verapamil (a moderate inhibitor of P-gp) did show that P-gp has only a small effect on the exposure of empagliflozin.

Assessment report EMA/238334/2015 Page 30/99
Empagliflozin / metformin Fixed Dose Combination
Bioequivalence and food effect
The Applicant developed four different fixed dose combination (FDC) tablets containing empagliflozin and metformin: empagliflozin/metformin FDC Film-coated tablet 5 mg/850 mg, 5 mg/1,000 mg, 12.5 mg/850 mg and 12.5 mg/1,000 mg. The empagliflozin/metformin FDC will be administered twice-daily due to the pharmacokinetic properties of metformin.
To support this application the applicant has conducted three bioequivalence studies (1276.6, 1276.7, and 1276.8) in which FDC tablets were compared with individual tablets empagliflozin (5 mg and 12.5 mg) and metformin (500 mg, 850 mg, and 1000 mg).
• Study 1276.6 was a bioequivalence study under fed conditions (high fat, high-caloric meal) comparing the pharmacokinetics of:
o 12.5 mg empagliflozin/500 mg metformin (FDC) tablet with free dose combination of 10 mg + 2.5 mg empagliflozin tablets, and 500 mg metformin (Glucophage)
o 5 mg empagliflozin/ 500 mg metformin FDC tablet with free dose combination of 5 mg empagliflozin and 500 mg metformin (Glucophage)
• Study 1276.7 was a bioequivalence study under fed conditions (high fat, high-caloric meal) comparing the pharmacokinetics of :
o 12.5 mg empagliflozin/850 mg metformin (FDC) tablet with free dose combination of 10 mg + 2.5 mg empagliflozin, and 850mg metformin (Glucophage)
o 5 mg empagliflozin/ 850 mg metformin FDC tablet with free dose combination of 5 mg empagliflozin and 850 mg metformin (Glucophage)
• Study 1276.8 was a randomised, open-label, crossover bioequivalence study under fed and fasted conditions.
o 12.5 mg empagliflozin/1000 mg metformin (FDC) tablet with free dose combination of 12.5 mg empagliflozin and 1000 mg metformin (Glucophage)
Bioequivalence has been established between FDC tablets and the free dose combinations in these bioequivalence studies (1276.6, 1276.7 and 1276.8).
Administration of the new combination products shows to be bioequivalent with the separate compounds administered under fed conditions for all strengths combinations. Al 90% Confidence intervals for the rate and extent of absorption were within the required acceptance range of 0.80 - 1.25.
The highest strength is also bioequivalent under fasted conditions.
The results of study 1276.8 demonstrates that food slightly affect the bioavailability of empagliflozin. The extent of exposure (AUC) is decreased by 10 - 15% and the rate of exposure Cmax) by 25%.
Also the rate of absorption of metformin is reduced after food intake but the extent is not affected.
This was already known for metformin. As metformin should be administered with food to reduce side effects, the combination with empagliflozin will be administered with food also. Therefore the small effect of food on the bioavailability of both compounds is considered not clinical relevant.

Assessment report EMA/238334/2015 Page 31/99
Interactions
In a repeated oral administration study with 50 mg empagliflozin and 1000 mg metformin no interaction was found in the pharmacokinetics of both compounds. The extent and rate of absorption met the bioequivalence criteria for both empagliflozin and metformin.
Comparison once daily vs twice daily dosing
Twice daily administration of 5 mg or 10 mg empagliflozin compared with once daily 10 mg or 25 mg, respectively, results in a comparable extent of exposure over 24 hours (see Figure ). However, as can be expected the Cmax is significantly lower.
To support twice daily dosing the efficacy and safety of empagliflozin administered twice-daily (5 mg or 12.5 mg) compared with once-daily (10 mg or 25 mg) as add-on therapy to a twice-daily dosing regimen of metformin in patients with type 2 diabetes was evaluated in a 16-week placebo-controlled posology bridging trial (1276.10). In this study was shown that empagliflozin steady-state concentrations of empagliflozin were maintained during the course of the study. The trough plasma concentrations after repeated dosing were significant higher after twice daily dosing of 5 mg compared with 10 mg once daily. This is in line with the comparable extent of exposure between the two dosing regimens.
Figure 3 Comparison of once and twice daily administration of empagliflozin (study 1276.9).
2.4.3. Pharmacodynamics
Introduction
Empagliflozin
In patients with type 2 diabetes (trials 1245.2 and 1245.4), administration of empagliflozin resulted in a dose-dependent increase in urinary glucose excretion (UGE), which averaged about 78 g/day with 25 mg empagliflozin once-daily. A plateau appeared to be reached at the 10 mg dose of empagliflozin once-daily. Increased urinary glucose excretion resulted in an immediate reduction in plasma glucose levels in patients with type 2 diabetes. However, increased UGE with empagliflozin treatment did not result in marked increases of urine volume.
An exposure-response relationship for FPG and HbA1c was established using data from several phase II and III trials (1245.2, 1245.4, 1245.9, 1245.10, 1245.15, 1245.19, 1245.20, 1245.23, 1245.33, 1245.36). The maximal observed decrease in FPG appeared to occur within 1 to 2 weeks after

Assessment report EMA/238334/2015 Page 32/99
initiation of empagliflozin treatment. The maximal change in HbA1c following initiation of empagliflozin treatment was almost reached after 12 weeks.
Single oral doses of 25 mg (therapeutic) and 200 mg empagliflozin (supra-therapeutic) were not associated with a prolongation of the QT(c) interval as demonstrated in a thorough QT trial in healthy subjects (trial 1245.16).
Empagliflozin/metformin combination
No dedicated pharmacodynamic or QT interval studies were conducted for the empagliflozin/metformin FDC because it can be assumed that the data reported for empagliflozin also apply to the FDC.
The pharmacodynamics profile of empagliflozin has been characterised based on the results of ten clinical pharmacology studies, including one QT study. The information about pharmacodynamics in this dossier was previously assessed for Jardiance (empagliflozin) and is described in its EPAR (http://www.ema.europa.eu/docs/en_GB/document_library/EPAR_-_Public_assessment_report/human/002677/WC500168594.pdf).
Mechanism of action
The kidney has a role in the regulation of blood glucose levels. Therefore the kidney can serve as a target for antidiabetic therapy. The sodium-dependent glucose co-transporter-2 (SGLT-2) is localized in the renal proximal tubules, accounting for approximately 90% of renal glucose reabsorption. It reabsorbs most of the ~ 180 g glucose filtered under normal conditions through the glomeruli per day. SGLT-2 inhibition decreases renal glucose reabsorption, promotes glycosuria and results in reduced levels of blood glucose. Empagliflozin selectively inhibits SGLT-2 in the kidney, resulting in direct, insulin-independent, elimination of glucose by the kidney.
Primary pharmacology
The urinary glucose excretion (UGE) is the main parameter assessed in the investigation of the pharmacodynamic profile of empagliflozin. The choice of urinary glucose excretion (UGE) as the main parameter in the investigation of the pharmacodynamics of empagliflozin is acceptable and crucial in view of its claimed mechanism of action. UGE has been assessed in three trials in healthy volunteers and in five trials in subjects with T2DM.
From the three trials in healthy subjects it is concluded that oral administration of empagliflozin resulted in a dose-dependent increase in UGE. In healthy volunteers, UGE was higher with all doses (0.5 mg to 800 mg) compared with placebo (see Figure ). Following a single oral administration of empagliflozin, up to 91 g of glucose was excreted in urine. Empagliflozin inhibited reabsorption of <40% of filtered glucose with single daily doses up to 10 mg and approximately 40–60% of filtered glucose at higher doses, with the effect reaching a plateau at around the 100 mg dose. At doses less than 50 mg, the majority of glucose was excreted in the first 24 h, but at doses of 100 mg and above, glucose excretion continued for up to 48–72 h. The time to reach the maximum rate of UGE was 7 h in most subjects and was similar in all dose groups.
It is concluded that empagliflozin can induce sustained, dose-dependent glycosuria in healthy subjects.
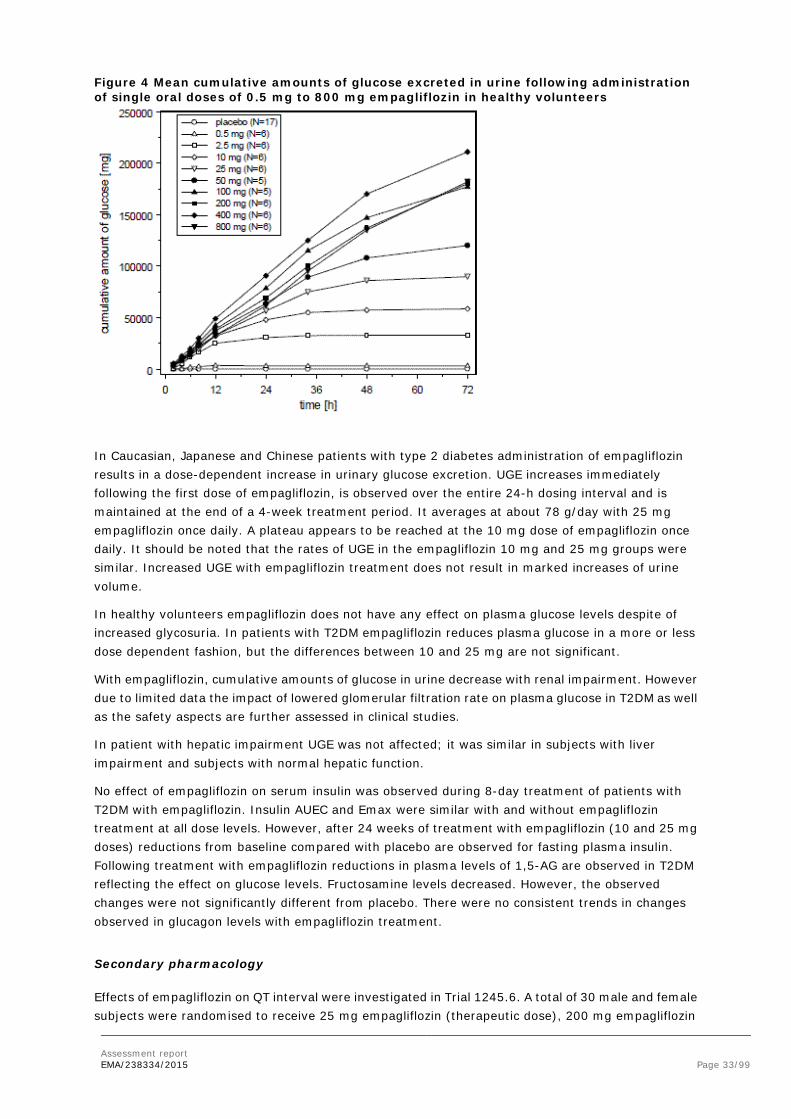
Assessment report EMA/238334/2015 Page 33/99
Figure 4 Mean cumulative amounts of glucose excreted in urine following administration of single oral doses of 0.5 mg to 800 mg empagliflozin in healthy volunteers
In Caucasian, Japanese and Chinese patients with type 2 diabetes administration of empagliflozin results in a dose-dependent increase in urinary glucose excretion. UGE increases immediately following the first dose of empagliflozin, is observed over the entire 24-h dosing interval and is maintained at the end of a 4-week treatment period. It averages at about 78 g/day with 25 mg empagliflozin once daily. A plateau appears to be reached at the 10 mg dose of empagliflozin once daily. It should be noted that the rates of UGE in the empagliflozin 10 mg and 25 mg groups were similar. Increased UGE with empagliflozin treatment does not result in marked increases of urine volume.
In healthy volunteers empagliflozin does not have any effect on plasma glucose levels despite of increased glycosuria. In patients with T2DM empagliflozin reduces plasma glucose in a more or less dose dependent fashion, but the differences between 10 and 25 mg are not significant.
With empagliflozin, cumulative amounts of glucose in urine decrease with renal impairment. However due to limited data the impact of lowered glomerular filtration rate on plasma glucose in T2DM as well as the safety aspects are further assessed in clinical studies.
In patient with hepatic impairment UGE was not affected; it was similar in subjects with liver impairment and subjects with normal hepatic function.
No effect of empagliflozin on serum insulin was observed during 8-day treatment of patients with T2DM with empagliflozin. Insulin AUEC and Emax were similar with and without empagliflozin treatment at all dose levels. However, after 24 weeks of treatment with empagliflozin (10 and 25 mg doses) reductions from baseline compared with placebo are observed for fasting plasma insulin. Following treatment with empagliflozin reductions in plasma levels of 1,5-AG are observed in T2DM reflecting the effect on glucose levels. Fructosamine levels decreased. However, the observed changes were not significantly different from placebo. There were no consistent trends in changes observed in glucagon levels with empagliflozin treatment.
Secondary pharmacology
Effects of empagliflozin on QT interval were investigated in Trial 1245.6. A total of 30 male and female subjects were randomised to receive 25 mg empagliflozin (therapeutic dose), 200 mg empagliflozin
Assessment report EMA/238334/2015 Page 34/99
(supratherapeutic dose), 400 mg moxifloxacin (positive control), or 2 times placebo. Single oral doses of 25 mg (therapeutic) and 200 mg empagliflozin (supra-therapeutic) in healthy subjects are not associated with prolongation of the QT interval. The primary endpoint was mean change from baseline (MCfB) in the population heart rate-corrected QT interval (QTcN) between 1–4 h after dosing. The placebo-corrected adjusted mean change from baseline in QTcN within the time interval 1 – 4 h after dosing was 0.59 ms (90% CI: -0.69, 1.87) for 25 mg empagliflozin and -0.22 ms (90% CI: -1.39, 0.94) for 200 mg empagliflozin. The difference in the mean QTcN change from baseline between 2 h and 4 h after administration of moxifloxacin vs. placebo was 12.42 ms with a lower 90% CI of 10.7 ms clearly above zero. Also the analysis of the primary endpoint by gender and analyses of secondary endpoints indicated the absence of a clinically relevant increase from baseline in the mean QTcN interval. It is concluded that empagliflozin has no effect on QT-interval.
Relationship between plasma concentration and effect
There was no additional analysis investigating the exposure-response relationship for the FDC.
Empagliflozin showed linear pharmacokinetics over a wide dose range from 0.5 mg to 800 mg with single oral doses and from 2.5 mg to 100 mg with multiple daily doses. As such, the results of this study are considered to be valid for 10 mg and 25 mg daily doses investigated in the Phase III program.
No separate discussion of the plasma-concentration-effect relationship was found. However, based on linear PK, the concentration-effect curve will be similar to the dose-effect curve (see F#1).
Pharmacodynamic interactions with other medicinal products or substances
There were no dedicated studies/analyses investigating the effect of a empagliflozin/ metformin FDC tablet on the PK of other medications or vice versa. It can be, however, assumed that the same conditions, limitations and dose adjustments as reported for the single entities (see Section 1.1.1) will also apply to the FDC. This is concluded based on the absence of a clinically relevant interaction between empagliflozin and metformin.
Similarly, there were no dedicated studies/analyses investigating any possible PD interactions.
For the FDC, no new (PK or PD) interaction studies are reported. The discussion in the SmPC is based on the separate components.
Genetic differences in PD response
In healthy subjects and in Caucasian, Japanese and Chinese patients with type 2 diabetes administration of empagliflozin results in a dose-dependent increase in urinary glucose excretion (UGE). UGE increases immediately following the first dose of empagliflozin, is observed over the entire 24-h dosing interval and is maintained at the end of a 4-week treatment period. It averages at about 78 g/day with 25 mg empagliflozin once daily. A plateau appears to be reached at the 10 mg dose of empagliflozin once daily. There are no differences between Japanese, Chinese and Caucasian subjects.
In healthy Caucasian and Japanese subjects empagliflozin does not influence plasma glucose. In Japanese and Chinese patients with type 2 diabetes as well as in Caucasian patients administration of empagliflozin reduces plasma glucose.
There are no arguments to conclude genetic differences between Caucasian, Japanese and Chinese subjects concerning serum insulin, 1,5-Anhydroglucitol, fructosamine or glucagon during administration of empagliflozin.
Assessment report EMA/238334/2015 Page 35/99
There are no differences between Japanese, Chinese and Caucasian subjects.
2.4.4. Discussion on clinical pharmacology
Pharmacokinetics
The pharmacokinetics of empagliflozin alone and in combination with metformin are well investigated and characterised. The exposure of empagliflozin in T2DM patients do not differ in a clinical significant way from healthy subjects. By comparing the pharmacokinetic variables after single dose in healthy subject with those of T2DM patients, a slightly higher exposure was found in T2DM patients
The FDC is considered bioequivalent with both separate compounds and the effect of food is not changed for both compounds with respect to empagliflozin alone of metformin alone.
In a repeated oral administration study with 50 mg empagliflozin and 1000 mg metformin no interaction was found in the pharmacokinetics of both compounds. The extent and rate of absorption met the bioequivalence criteria for both empagliflozin and metformin.
Twice daily administration of 5 mg or 10 mg empagliflozin compared with one daily 10 mg or 25 mg, respectively, results in a comparable extent of exposure over 24 hours. However, as can be expected, the Cmax is significant lower. The trough plasma concentrations after repeated dosing are significant higher after twice daily dosing of 5 mg compared with 10 mg one daily. This is in line with the comparable extent of exposure between the two dosing regimes.
Pharmacodynamics
The pharmacodynamics of the compound have been assessed in healthy volunteers, in Caucasian, Japanese and Chinese subjects with T2DM and also in T2DM patients with renal and hepatic impairment. This is considered an adequate approach.
In healthy subjects and in Caucasian, Japanese and Chinese patients with type 2 diabetes administration of empagliflozin results in a dose-dependent increase in urinary glucose excretion (UGE). UGE increases immediately following the first dose of empagliflozin, is observed over the entire 24-h dosing interval and is maintained at the end of a 4-week treatment period. It averages at about 78 g/day with 25 mg empagliflozin once daily. A plateau appears to be reached at the 10 mg dose of empagliflozin once daily. No significant differences were found between 10 mg and 25 mg. In the clinical studies the 10 mg as well as the 25 mg dose have been studied. This is justified for an optimal dose selection.
In healthy volunteers empagliflozin does not have any effect on plasma glucose levels despite increased glycosuria. However in patients with T2DM empagliflozin reduces plasma glucose in a more or less dose dependent fashion.
In renal impairment with empagliflozin, cumulative amounts of glucose in urine decrease, which can be expected base on the mechanism of action. However due to limited data the impact of lowered glomerular filtration rate on plasma glucose in T2DM as well as the safety aspects should be further assessed in clinical studies.
In patients with liver impairment on the basis of pharmacokinetic results no dosage adjustment of empagliflozin can be recommended. The impact of liver impairment on plasma glucose in T2DM as well as the safety aspects are further assessed in phase III studies (see below).
A thorough QT study indicates that single oral doses of 25 mg (therapeutic) and 200 mg empagliflozin (supra-therapeutic) in healthy subjects are not associated with prolongation of the QT interval.

Assessment report EMA/238334/2015 Page 36/99
It is concluded that the data concerning pharmacodynamics of empagliflozin indicate efficacy of the compound in the treatment of T2DM.
2.4.5. Conclusions on clinical pharmacology
PK and PD of empagliflozin are adequately characterised and show the characteristics of a SGLT2 inhibitor. Dose-response data supported the use of 10 and 25 mg in the phase III studies.
There are no indications of an interaction between empagliflozin and metformin.
2.5. Clinical efficacy
2.5.1. Dose response studies and main studies
An overview of the efficacy groupings and trials included in the evaluation of the empagliflozin/metformin FDC is provided in 4. A total of 6036 patients contribute to the analyses of efficacy.
Table 4 Trials included in the evaluation of efficacy
Trials included Characteristics Analysis timepoints
(weeks)
Number of treated patients on metformin background
1245.23(met) 1245.23(met+SU)
1245.19
1245.311
Patients from the pivotal double-blind trials and their extension with metformin background
24 2 24 2 24 2 52, 76
637 666 376 1679
EFF-C1 24, 52, 76 1679
1245.33 (EFF-C2i) 1245.49 (EFF-C2ii)
Patients with metformin and insulin background
18 2, 78 18 2, 52
394 400
EFF-C2 18 794
1245.36 = EFF-C3
Patients from the renal impairment trial 1245.36 with metformin background3
24 2, 52 238
1245.28 Active-controlled trial (glimepiride comparator) with metformin background
104 2,4 1545
1276.10 Posology bridging trial with metformin background
16 2 965
1275.1(met) Patients from factorial design empagliflozin/linagliptin FDC trial with metformin background
24 2, 52 674
1245.10+ 1245.24
Long-term with metformin background and open-label extension
90 5 1416
Assessment report EMA/238334/2015 Page 37/99
1 Trial 1245.31 comprises the extensions of 1245.23(met), 1245.23(met+SU), and 1245.19 (i.e. 3 trials). The number of treated patients refers to the total of treated patients in the initial trials
2 Timepoint of the primary analysis on trial level
3 Patients with screening eGFR ≥60 mL/min/1.73 m²
4 Timepoint of primary analysis (database lock: 27 September 2013). The trial is currently ongoing (planned extension period: 104 weeks)
5 Overall duration of trial 1245.10 and its open-label extension trial 1245.24
6 Patients taking empagliflozin (10 mg or 25 mg) on a background of metformin in the combined analysis of trials 1245.10 and 1245.24
The ‘pivotal’ trials in EFF-C1 provide the evidence for use of the proposed FDC in patients not using insulin. Both trials in EFF-C2 (1245.33 and 1245.49) provide the evidence for use of the proposed FDC in patients using one or more insulin injections per day. In this sense they can also be considered ‘pivotal’. Active comparator trial 1245.28 shows durability of efficacy.
Posology bridging trial 1276.10
Study 1276.10 was the only study submitted for this application that was not previously assessed.
Study 1276.10 was a 16-week posology bridging trial to investigate the efficacy and safety of different dose regimens of empagliflozin (twice daily versus once daily), administered orally as add-on therapy to immediate release metformin in patients with type 2 diabetes and insufficient glycaemic control. The study was designed to test non-inferiority of: empagliflozin 5 mg twice daily versus 10 mg once daily; and empagliflozin 12.5 mg twice daily versus empagliflozin 25 mg once daily. The superiority of all 4 empagliflozin dose regimens versus placebo was also tested.
The Study was a randomised, double-blind, placebo-controlled, parallel group comparison. Randomisation was stratified by HbA1c, renal function at screening, assessed based on eGFR values (according to MDRD staging criteria), and geographical region. A 2-week single-label placebo run-in period preceded randomisation. Patients were to be followed-up for 1 week after end-of-treatment. The study was conducted in compliance with the EMA SA received in February 2011 suggesting to conduct a direct comparison of clinical efficacy of empagliflozin at the two different dose regimens in patients failing on optimized metformin monotherapy and to obtain additional comparative data on safety and pharmacokinetics.
Overall, the inclusion and exclusion criteria are similar to those used in previous studies in T2DM patients and are acceptable.
Outcomes/endpoints
The primary endpoint (change from baseline in HbA1c after 16 weeks of treatment) and secondary endpoints (change from baseline in FPG after 16 weeks of treatment) are in line with the recommendations in the guideline on clinical investigation of medicinal products in the treatment or prevention of diabetes mellitus (CPMP/EWP/1080/00 Rev. 1) and are consistent with the primary and secondary endpoints in previous studies with empagliflozin.
Statistical analysis
Based on previous experience with empagliflozin, it was estimated that the standard deviation of change in HbA1c from baseline after 12 weeks of treatment would be 0.66%. The Applicant defined a non-inferiority margin equal to 0.35% that was established by the results of a previous study (Study 1245.10). This is acceptable for non -inferiority comparisons. For superiority testing a minimal clinical difference versus placebo was set to 0.6%.

Assessment report EMA/238334/2015 Page 38/99
Baseline characteristics
A total of 1626 patients were screened by 139 centres in 18 countries. Overall, the majority of patients (93.2%) completed the 16-week treatment period and 6.8% prematurely discontinued trial medication. The number of patients who discontinued medication due to adverse events was higher in the empagliflozin 10 mg qd group as compared with the other groups.
Overall, the patients enrolled in study 1276.10 were representative of the target population in terms of demographic characteristics, (62.9%) were from Europe. Details are reported in Table 5 below:
Table 5 Demographic Data - Trial 1276.10 - FAS
Overall, the patients enrolled in study 1276.10 were representative of the target population in terms of severity and duration of diabetes as well as BMI with the majority of patients being overweight or obese. Over half (64.9%) of all patients had an HbA1c <8%, and only a minority (9%) had an HbA1c ≥9%. Mean blood pressure values were within the recommended targets for patients with diabetes.
It was noted that 55 patients had moderate or severe renal impairment (eGFR <60 ml/min/1.73m2 [MDRD]), which is not in accordance with the inclusion criteria (excluding patients with eGFR <60 ml/min/1.73m2 according to Cockcroft-Gault formula . The MAH should justify the inclusion of the group of renal impaired patients defined as having an eGFR <60 ml/min/1.73m2 MDRD in the study.

Assessment report EMA/238334/2015 Page 39/99
The treatment groups seem to be well balanced, with the exception of HbA1c cut-off levels distribution among groups: more patients had an HbA1c <8% in the placebo group as compared with the other groups (73.8% in the placebo group vs. 67.0%, 64.0%, 64.2% and 59.8% in the empagliflozin 12.5, 25, 5 and 10 mg, groups, respectively), whereas the proportion of patients with an HbA1c between 8 and 9% was lower in the placebo group as compared with other groups (16.8% in the placebo group vs. 24.7%, 24.1, 23.7% and 33.6% in the empagliflozin 12.5, 25, 5 and 10 mg groups, respectively). This unbalance would not impact efficacy results from the primary endpoint and other secondary endpoints (changes of HbA1c level from baseline) but it would impact the secondary efficacy endpoint ”proportion of patients with HbA1c <7.0% after 16 weeks of treatment” in favour of placebo.
Details of baseline efficacy variables across treatment groups (FAS) are shown in table 6 below.
Table 6 - Trial 1276.10 - FAS
Antidiabetic background medication: the most commonly introduced antidiabetic therapy was sulphonylurea, followed by DPP-IV inhibitor and insulin.
All patients were on metformin IR ≥1500 mg daily, consistent with the inclusion criteria.

Assessment report EMA/238334/2015 Page 40/99
Results
Primary endpoint:
The primary endpoint was change from baseline in HbA1c after 16 weeks
Non-inferiority of empagliflozin 12.5 mg twice daily versus 25 mg once daily (-0.11, 95%CI 0.26-0.03) as well as that of empagliflozin 5 mg twice daily versus 10 mg once daily (-0.02, CI 95% -0.16-0.13) was demonstrated (Table 7).
Table 7 Change from baseline in HbA1c after 16 weeks - Trial 1276.10 – FAS (LOCF)
A treatment comparison of the adjusted mean change in HbA1c from baseline after 16 weeks was also performed for the FAS (OC) using the MMRM model. The changes from baseline in HbA1c in the empagliflozin+metformin groups were consistent with the primary analysis performed for the FAS (LOCF) using an ANCOVA model.
Testing for superiority of all 4 empagliflozin doses versus placebo showed statistical significant reductions in HbA1c for all empagliflozin tested doses (p<0.001 for each comparison). Observed reductions were comparable across groups, however a better treatment effect was obtained with the high dose (12.5mg) at twice daily regimen.
Subgroup analysis:
Consistent with the results for the FAS, subgroup analyses suggests that a better trend in HbA1c reduction at week 16 across subgroup analyses is obtained with the 12.5 mg bid dose as compared with the 25 mg qd dose of empagliflozin. With regard to subgroup analysis according to BMI categories, empagliflozin showed significant treatment effect in reducing HbA1c at week 16 when compared to placebo in the BMI category 30 to<35 and at lesser extend in the BMI category 25 to <30. In both BMI categories, empagliflozin high dose twice daily showed the best effect.
Secondary endpoints
FPG change from baseline: significant and clinically meaningful reductions in FPG were observed with all empagliflozin doses as compared with placebo, which supports the primary outcome. A slightly

Assessment report EMA/238334/2015 Page 41/99
larger reduction in FPG was observed with the twice daily regimens (5mg or 12.5mg) as compared with the corresponding once daily regimens. (see table 8 below)
Table 8 Change from baseline in FPG [mg/dl] after 16 weeks - Trial 1276.10 – FAS (LOCF)
Exploratory endpoints
The proportions of patients on empagliflozin bid with HbA1c <7% after 16 weeks were comparable with the proportions of patients on empagliflozin qd and significantly greater as compared with the proportion of patients with HbA1c <7% in the placebo group. Results from other exploratory endpoints, such as body weight and systolic blood pressure, showed similar treatment effect of the twice versus once daily regimens. Of note, treatment impact on blood pressure changes was clinically irrelevant. In addition, the proportion of patients with rescue medication was very low and similar across empagliflozin treatment groups. No patient had an increase in background medication.
Ancillary analyses
Consistent with the results for the FAS, subgroup analyses (i.e. by metformin dose, time since diagnosis, HbA1C baseline, BMI) suggests that a better trend in HbA1c reduction at week 16 across subgroup analyses is obtained with the 12.5 mg bid dose as compared with the 25 mg qd dose of empagliflozin.
With regard to subgroup analysis according to BMI categories, empagliflozin showed significant treatment effect in reducing HbA1c at week 16 when compared to placebo in the BMI category 30 to<35 and at lesser extend in the BMI category 25 to <30. In both BMI categories, empagliflozin high dose twice daily showed the best effect. (see figure 5 below).

Assessment report EMA/238334/2015 Page 42/99
Figure 5 Adjusted mean change from baseline in HbA1c by BMI subgroups – 1276.10
Studies in special populations
Study 1245.36 in patients with renal insufficiency has limited relevance for this application, as subjects with eGFR < 60 ml/min/1.73m2 are contraindicated to metformin and also to this FDC. A summary table of this trial is included below
Supportive studies
Study 1275.1(met) is part of the empagliflozin/linagliptin FDC development programme. Only patients from trial 1275.1(met) are included for efficacy evaluation in this report. Specifically, the relevant comparison from this study in the context of the current application is the empagliflozin/linagliptin FDC+metformin versus linagliptin+metformin. A summary table of this trial is included below.
Trial 1245.28 was a long-term active-controlled trial, comparing empagliflozin to glimeperide. This trial is also considered supportive and a summary table of this trial is included below.
• Summary of main efficacy results
The following tables summarise the efficacy results from the main studies supporting the present application. These summaries should be read in conjunction with the discussion on clinical efficacy as well as the benefit risk assessment (see later sections).

Assessment report EMA/238334/2015 Page 43/99
Table 9 Summary of efficacy for trial 1245.19
Title: A randomised, double–blind, placebo–controlled parallel group efficacy and safety trial of BI 10773 (10 and 25 mg administered orally once daily) over 24 weeks in patients with type 2 diabetes mellitus with insufficient glycaemic control despite a background therapy of pioglitazone alone or in combination with metformin
Study identifier 1245.19
Design Multicenter, 24–weeks, randomized, double–blind, placebo–controlled, parallel group, treatment with fixed doses of empagliflozin 10 and 25 mg/day as add–on to pioglitazone alone or pioglitazone in combination with metformin
Duration Main phase: 24 weeks
Run–in phase: 2 weeks
Extension phase: 1 week (if patients did not immediately enter the extension trial 1245.31)
Hypothesis Superiority of empagliflozin (both doses) over placebo
Treatments Placebo (PBO) Placebo for 24 weeks, 166 patients randomized
Empagliflozin 10mg (Empa 10mg)
Empagliflozin 10 mg/day for 24 weeks with background therapy of pioglitazone alone or pioglitazone + metformin, 165 patients randomized
Empagliflozin 25mg (Empa 25mg)
Empagliflozin 25 mg/day for 24 weeks with background therapy of pioglitazone alone or pioglitazone + metformin, 168 patients randomized
Endpoints Primary endpoint ΔHbA1c Change from baseline in HbA1c (%) after 24 weeks of treatment
Key secondary endpoints
ΔFPG Change from baseline in fasting plasma glucose (FPG) (mg/dL) after 24 weeks of treatment
ΔBW Change from baseline in body weight (kg) after 24 weeks of treatment
ΔHbA1cpio+met Change from baseline in HbA1c after 24 weeks of treatment (pio plus met combination background only)
Database lock 11 May 2012
The hypotheses were tested in a pre–specified hierarchical sequence (primary endpoint, first key secondary endpoint, second key secondary endpoint, and primary endpoint for patients with pioglitazone in combination with metformin background therapy).
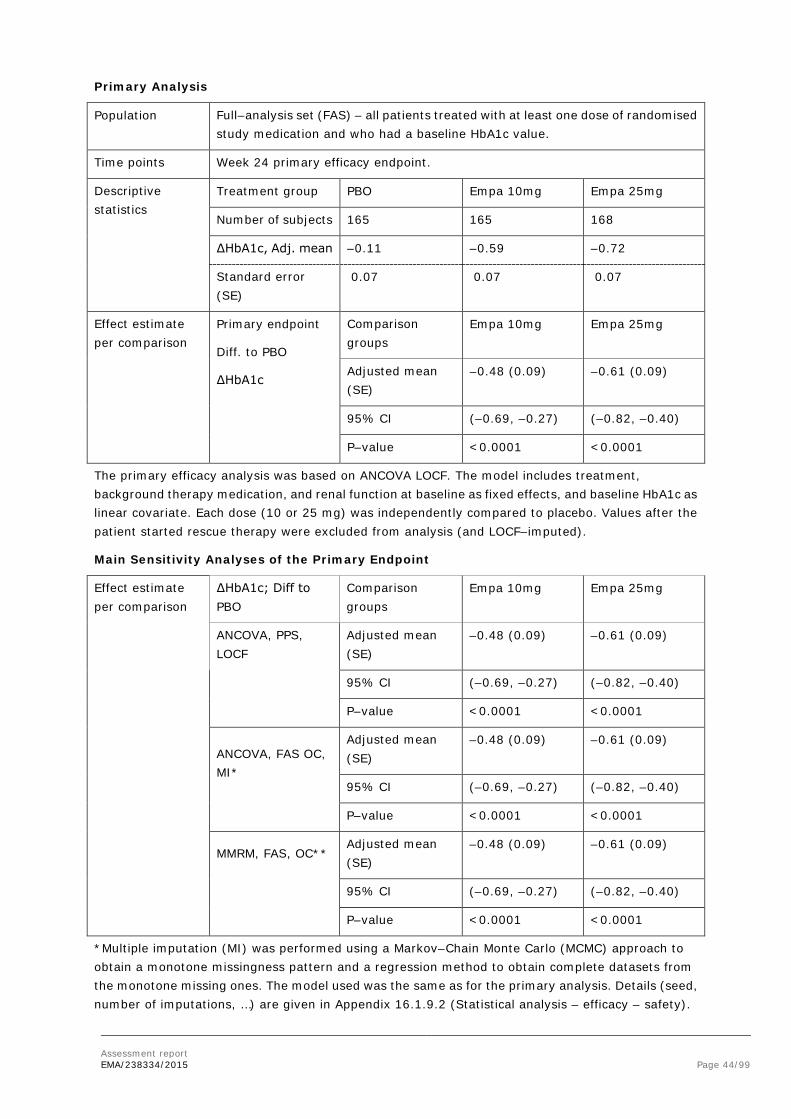
Assessment report EMA/238334/2015 Page 44/99
Primary Analysis
Population Full–analysis set (FAS) – all patients treated with at least one dose of randomised study medication and who had a baseline HbA1c value.
Time points Week 24 primary efficacy endpoint.
Descriptive statistics
Treatment group PBO Empa 10mg Empa 25mg
Number of subjects 165 165 168
ΔHbA1c, Adj. mean –0.11 –0.59 –0.72
Standard error (SE)
0.07 0.07 0.07
Effect estimate per comparison
Primary endpoint
Diff. to PBO
ΔHbA1c
Comparison groups
Empa 10mg Empa 25mg
Adjusted mean (SE)
–0.48 (0.09) –0.61 (0.09)
95% CI (–0.69, –0.27) (–0.82, –0.40)
P–value <0.0001 <0.0001
The primary efficacy analysis was based on ANCOVA LOCF. The model includes treatment, background therapy medication, and renal function at baseline as fixed effects, and baseline HbA1c as linear covariate. Each dose (10 or 25 mg) was independently compared to placebo. Values after the patient started rescue therapy were excluded from analysis (and LOCF–imputed).
Main Sensitivity Analyses of the Primary Endpoint
Effect estimate per comparison
ΔHbA1c; Diff to PBO
Comparison groups
Empa 10mg Empa 25mg
ANCOVA, PPS, LOCF
Adjusted mean (SE)
–0.48 (0.09) –0.61 (0.09)
95% CI (–0.69, –0.27) (–0.82, –0.40)
P–value <0.0001 <0.0001
ANCOVA, FAS OC, MI*
Adjusted mean (SE)
–0.48 (0.09) –0.61 (0.09)
95% CI (–0.69, –0.27) (–0.82, –0.40)
P–value <0.0001 <0.0001
MMRM, FAS, OC**
Adjusted mean (SE)
–0.48 (0.09) –0.61 (0.09)
95% CI (–0.69, –0.27) (–0.82, –0.40)
P–value <0.0001 <0.0001
*Multiple imputation (MI) was performed using a Markov–Chain Monte Carlo (MCMC) approach to obtain a monotone missingness pattern and a regression method to obtain complete datasets from the monotone missing ones. The model used was the same as for the primary analysis. Details (seed, number of imputations, …) are given in Appendix 16.1.9.2 (Statistical analysis – efficacy – safety).

Assessment report EMA/238334/2015 Page 45/99
** Mixed model repeated measures (MMRM) model includes treatment, renal function, background medication, visit, and visit–by–treatment interaction as fixed effects, baseline HbA1c as linear covariate, and patient as random effect. The unstructured covariance structure and the Kenward–Roger method for degrees of freedom (DF) were used. Details are given in Appendix 16.1.9.2 (Statistical analysis – efficacy – safety).
Analyses of Key Secondary Endpoints
Population Full–analysis set (FAS).
Time points Week 24 efficacy endpoint.
Descriptive statistics
Treatment group PBO Empa 10mg Empa 25mg
ΔFPG : N
Adjusted mean (SE)
165
6.47 (2.61)
163
–17.00 (2.63)
168
–21.99 (2.59)
ΔBW : N
Adjusted mean (SE)
165
0.34 (0.21)
165
–1.62 (0.21)
168
–1.47 (0.21)
ΔHbA1cpio+met : N
Adjusted mean (SE)
124
–0.11 (0.08)
125
–0.55 (0.08)
127
–0.70 (0.07)
Effect estimate per comparison
Comparison groups
Empa 10mg Empa 25mg
ΔFPG Diff. to PBO (SE) –23.48 (3.71) –28.46 (3.68)
95% CI (–31.81, –15.15) (–36.73, –20.19)
P–value <0.0001 <0.0001
ΔBW Diff. to PBO (SE) –1.95 (0.30) –1.81 (0.30)
95% CI (–2.64, –1.27) (–(2.49, –1.13)
P–value <0.0001 <0.0001
ΔHbA1cpio+met Diff. to PBO (SE) –0.45 (0.11) –0.60 (0.11)
95% CI (–0.69, –0.21) (–0.83, –0.36)
P–value <0.0001 <0.0001
ANCOVA LOCF model includes treatment, background therapy medication, renal function at baseline, baseline HbA1c, and baseline value.

Assessment report EMA/238334/2015 Page 46/99
Table 10 Summary of efficacy for trial 1245.23(met)
Title: A phase III randomised, double–blind, placebo–controlled, parallel group, efficacy and safety study of BI 10773 (10 mg, 25 mg) administered orally, once daily over 24 weeks in patients with type 2 diabetes mellitus with insufficient glycaemic control despite treatment with metformin alone or metformin in combination with a sulphonylurea
Study identifier Study 1245.23
Design Multicenter, 24–weeks, randomized, double–blind, placebo–controlled, parallel group, treatment with fixed doses of empagliflozin 10 and 25 mg/day as add–on therapy to metformin only (met) or metformin plus sulphonylurea (met+SU) as background therapy. An OL arm of patients with very poor glycaemic control (HbA1c >10%) treated with empagliflozin 25 mg/day was also included
Duration Main phase: 24 weeks
Run–in phase: 2 weeks (except for patients allocated to the OL arm)
Extension phase: 1 week (if patients did not immediately enter the extension trial 1245.31)
Hypothesis Superiority of empagliflozin (both doses) over placebo
Treatments PBO Placebo for 24 weeks
Empa 10mg Empagliflozin 10 mg/day for 24 weeks
Empa 25mg Empagliflozin 25 mg/day for 24 weeks
Endpoints Primary endpoint ΔHbA1c Change from baseline in HbA1c (%) after 24 weeks of treatment
Key secondary endpoints
ΔBW Change from baseline in body weight (kg) to Week 24
ΔMDG Change from baseline in mean daily plasma glucose (MDG) (mg/dL) using the 8–point blood glucose profile
Database lock 23 March 2012
For the analysis of the primary endpoint, two hypotheses (one for each dose) were tested independently at the significance level of 0.025. The analysis of the key secondary endpoints was carried out using a hierarchical testing approach following the order in which the variables are presented in the table.
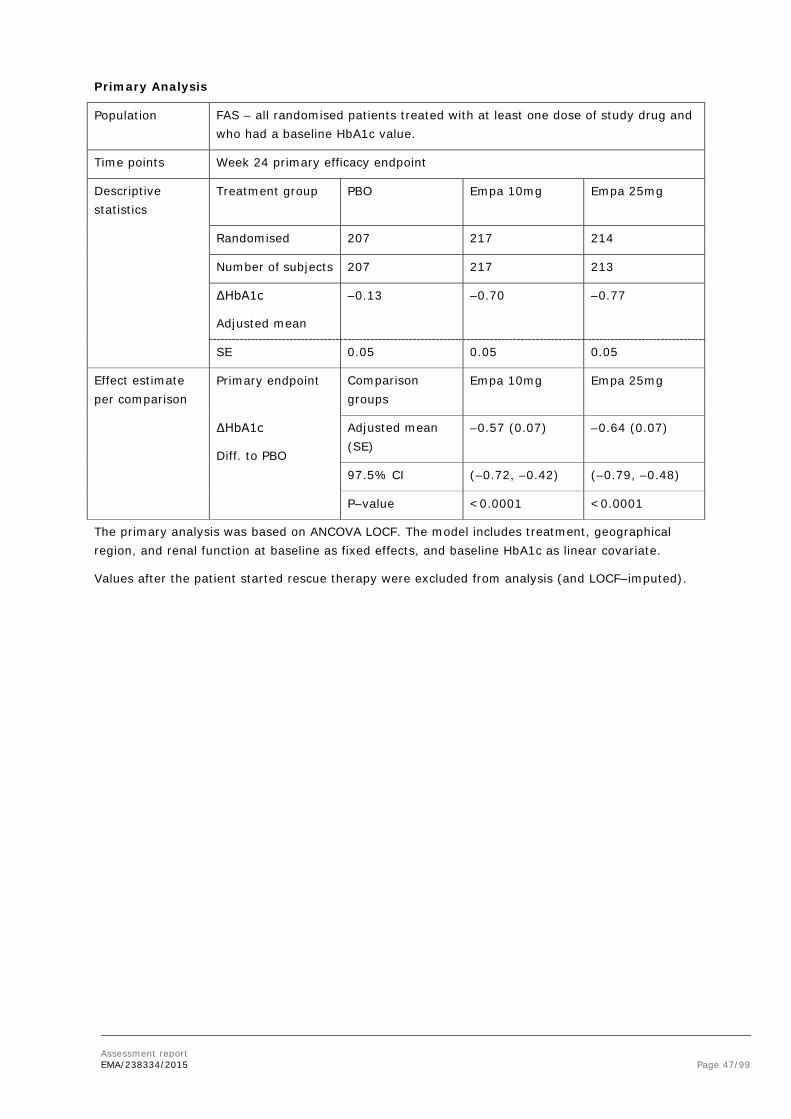
Assessment report EMA/238334/2015 Page 47/99
Primary Analysis
Population FAS – all randomised patients treated with at least one dose of study drug and who had a baseline HbA1c value.
Time points Week 24 primary efficacy endpoint
Descriptive statistics
Treatment group PBO Empa 10mg Empa 25mg
Randomised 207 217 214
Number of subjects 207 217 213
ΔHbA1c
Adjusted mean
–0.13 –0.70 –0.77
SE 0.05 0.05 0.05
Effect estimate per comparison
Primary endpoint Comparison groups
Empa 10mg Empa 25mg
ΔHbA1c
Diff. to PBO
Adjusted mean (SE)
–0.57 (0.07) –0.64 (0.07)
97.5% CI (–0.72, –0.42) (–0.79, –0.48)
P–value <0.0001 <0.0001
The primary analysis was based on ANCOVA LOCF. The model includes treatment, geographical region, and renal function at baseline as fixed effects, and baseline HbA1c as linear covariate.
Values after the patient started rescue therapy were excluded from analysis (and LOCF–imputed).

Assessment report EMA/238334/2015 Page 48/99
Main Sensitivity Analyses of the Primary Endpoint
Effect estimate per comparison
ΔHbA1c, Diff. to PBO
Comparison groups
Empa 10mg Empa 25mg
ANCOVA, PPS, LOCF
Number of subject
202 197
Adjusted mean (SE)
–0.54 (0.07) –0.63 (0.07)
95% CI (–0.69, –0.40) (–0.77, –0.48)
P–value <0.0001 <0.0001
ANCOVA, FAS, MI* Number of subject
217 205
Adjusted mean (SE)
–0.53 (0.07) –0.63 (0.08)
95% CI (–0.67, –0.39) (–0.78, –0.48)
P–value <0.0001 <0.0001
MMRM, FAS, OC** Number of subject
217 209
Adjusted mean (SE)
–0.55 (0.07) –0.64 (0.07)
95% CI (–0.69, –0.40) (–0.78, –0.50)
P–value <0.0001 <0.0001
*A MCMC approach was used to obtain monotone missingness and a regression method was used to obtain complete dataset.
**The REML–based MMRM model includes treatment, renal function, region, visit, and visit–by–treatment interaction, and baseline HbA1c.

Assessment report EMA/238334/2015 Page 49/99
Analyses of Key Secondary Endpoints
Population Full–analysis set (FAS).
Time points Week 24 efficacy endpoint.
Descriptive statistics
Treatment group PBO Empa 10mg Empa 25mg
ΔBW
Number of subject 207 217 213
Adjusted mean (SE)
–0.45 (0.17) –2.08 (0.17) –2.46 (0.17)
ΔMDG
Number of subject 133 148 147
Adjusted mean (SE)
–1.99 (1.99) –9.64 (1.89) –14.36 (1.89)
Effect estimate per comparison
Comparison groups
Empa 10mg
Empa 25mg
ΔBW Diff. to PBO (SE) –1.63 (0.24) –2.01 (0.24)
97.5% CI (–2.17, –1.08) (–2.56, –1.46)
P–value <0.0001 <0.0001
ΔMDG Diff. to PBO (SE) –7.65 (2.74) –12.37 (2.75)
97.5% CI (–13.81, –1.48) (–18.55, –6.19)
P–value 0.0055 <0.0001
ANCOVA LOCF model includes treatment, region, renal function, baseline HbA1c, and baseline.

Assessment report EMA/238334/2015 Page 50/99
Table 11 Summary of efficacy for trial 1245.23 (met+SU)
Design: similar to 1245.23(met) see above
Primary Analysis
Population FAS – all randomised patients treated with at least one dose of study drug and who had a baseline HbA1c value.
Time points Week 24 primary efficacy endpoint.
Descriptive statistics
Treatment group PBO Empa 10mg Empa 25mg
Randomised 225 226 218
Number of subject 225 225 216
ΔHbA1c
Adjusted mean
–0.17 –0.82 –0.77
SE 0.05 0.05 0.05
Effect estimate per comparison
Primary endpoint
ΔHbA1c
Comparison groups
Empa 10mg
Empa 25mg
Diff. to PBO
Adjusted mean (SE)
–0.64 (0.07)
–0.59 (0.07)
97.5% CI (–0.79, –0.49) (–0.74, –0.44)
P–value <0.0001 <0.0001
Analysis based on ANCOVA LOCF with treatment, geographical region, and renal function at baseline as fixed effects, and baseline HbA1c as linear covariate.
Values after the patient started rescue therapy were excluded from analysis (and LOCF–imputed).

Assessment report EMA/238334/2015 Page 51/99
Main Sensitivity Analyses of the Primary Endpoint
Descriptive statistics
Treatment group
Number of subjects
Effect estimate per comparison
ΔHbA1c (Diff. to PBO)
Comparison groups
Empa 10mg Empa 25mg
ANCOVA, PPS, LOCF
Number of subject
203 191
Adjusted mean (SE)
–0.65 (0.07) –0.64 (0.07)
95% CI (–0.79, –0.51) (–0.78, –0.50)
P–value <0.0001 <0.0001
ANCOVA, FAS, MI* Number of subject
225 216
Adjusted mean (SE)
–0.66 (0.07) –0.62 (0.07)
95% CI (–0.79, –0.52) (–0.76, –0.48)
P–value <0.0001 <0.0001
MMRM, FAS, OC** Number of subject
217 200
Adjusted mean (SE)
–0.66 (0.07) –0.63 (0.07)
95% CI (–0.80, –0.51) (–0.78, –0.48)
P–value <0.0001 <0.0001
*A MCMC approach was used to obtain monotone missingness and a regression method was used to obtain complete datasets.
**The REML–based, MMRM model includes treatment, renal function, region, visit, and visit–by–treatment interaction, and baseline HbA1c.
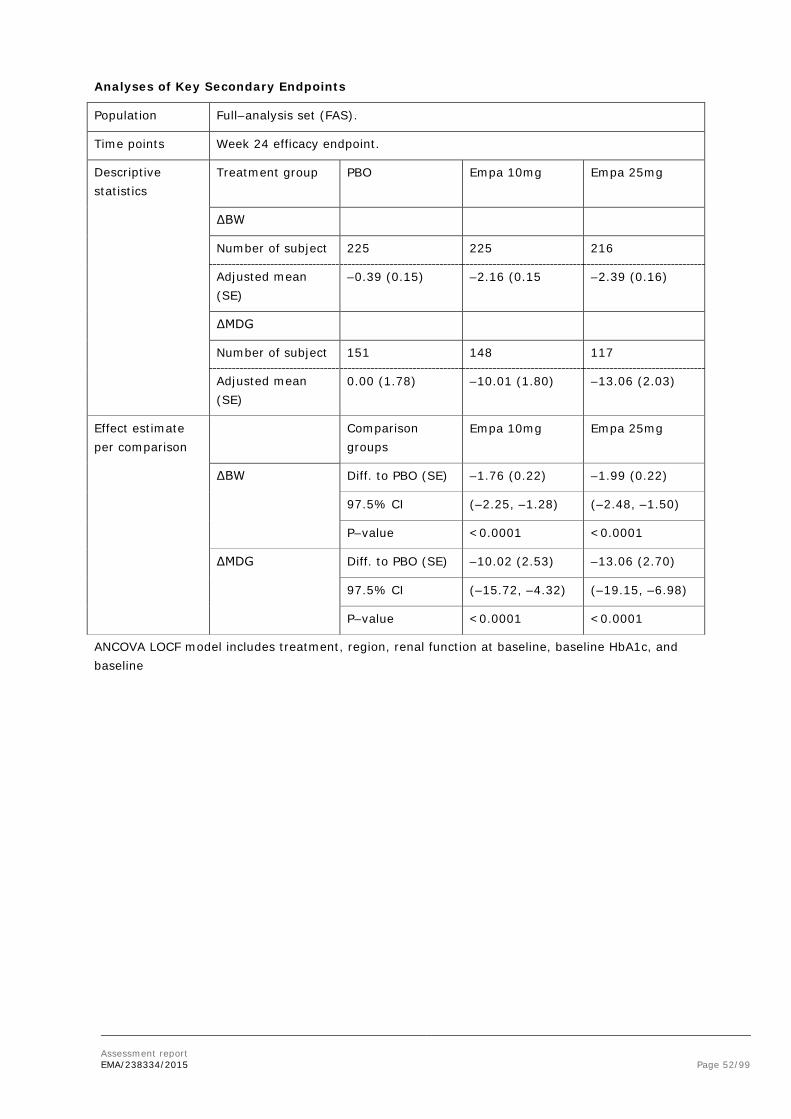
Assessment report EMA/238334/2015 Page 52/99
Analyses of Key Secondary Endpoints
Population Full–analysis set (FAS).
Time points Week 24 efficacy endpoint.
Descriptive statistics
Treatment group PBO Empa 10mg Empa 25mg
ΔBW
Number of subject 225 225 216
Adjusted mean (SE)
–0.39 (0.15) –2.16 (0.15 –2.39 (0.16)
ΔMDG
Number of subject 151 148 117
Adjusted mean (SE)
0.00 (1.78) –10.01 (1.80) –13.06 (2.03)
Effect estimate per comparison
Comparison groups
Empa 10mg Empa 25mg
ΔBW Diff. to PBO (SE) –1.76 (0.22) –1.99 (0.22)
97.5% CI (–2.25, –1.28) (–2.48, –1.50)
P–value <0.0001 <0.0001
ΔMDG Diff. to PBO (SE) –10.02 (2.53) –13.06 (2.70)
97.5% CI (–15.72, –4.32) (–19.15, –6.98)
P–value <0.0001 <0.0001
ANCOVA LOCF model includes treatment, region, renal function at baseline, baseline HbA1c, and baseline

Assessment report EMA/238334/2015 Page 53/99
Table 12 Summary of efficacy for trial 1245.28 (Supportive trial)
Title: A phase III randomised, double–blind, active–controlled parallel group efficacy and safety study of BI 10773 compared to glimepiride administered orally during 104 weeks with a 104–week extension period in patients with type 2 diabetes mellitus and insufficient glycaemic control despite metformin treatment
Study identifier 1245.28
Design The objective was to investigate the efficacy, safety, and tolerability of empa 25 mg daily compared with glimepiride 1 to 4 mg daily administered over 104 weeks as add–on therapy to immediate release met with a 104–week extension period in patients with type 2 diabetes and insufficient glycaemic control despite treatment with met.
This is a randomised, double–blind, active–controlled, parallel–group comparison study. Randomisation was stratified by HbA1c at screening, renal function at screening, and geographical region.
Duration Main phase: 104 weeks
Run–in phase: 2 weeks
Extension phase: 104 weeks
Follow up: 4 weeks
Hypothesis Non–inferiority vs. glimepiride was performed using an ANCOVA model. If non–inferiority for HbA1c was established, tests for the superiority of empa vs. glimepiride with regard to the key secondary endpoints were to be conducted in hierarchical order: change in body weight, occurrence of confirmed hypoglycaemic AEs, change in SBP, change in DBP, all at Week 104
Treatments empa 25 mg daily
glimepiride 1 to 4 mg daily
Endpoints primary endpoint Δ HbA1c Change from baseline in HbA1c [%]
Δ BW Change from baseline in body weight [kg]
Δ SBP Change from baseline in SBP [mmHg]
Δ DBP Change from baseline in DBP [mmHg]
Database lock 27 SEP 2013
Overall, 1549 patients were entered in a 1:1 ratio and all but 4 patients in the empaglifozin 25 mg group were treated. By Week 104, 16.1% of the patients had prematurely discontinued study medication. Overall, 55.2% of the patients were male, 65.8% White, and 32.8% Asian. The mean (SD) age was 55.9 (10.4) years, baseline HbA1c 7.92 (0.84)%, and BMI 30.11 (5.29) kg/m2.

Assessment report EMA/238334/2015 Page 54/99
Primary Analysis
Population full analysis set with an LOCF approach
Time points Week 104
Descriptive statistics
Treatment group Glimepiride Empa 25mg
Nr of subjects 780 765
Primary endpoint
Δ HbA1c Mean (SE) –0.55 (0.03)
–0.66 (0.03)
Adjusted mean (SE) –0.55 (0.03)
–0.66 (0.03)
Secondary endpoint
Δ BW Mean (SE) 1.33 (0.13) –3.11 (0.13)
Adjusted mean (SE) 1.34 (0.13) –3.12 (0.13)
Δ SBP Mean (SE) 2.5 (0.5) –3.1 (0.5)
Adjusted mean (SE) 2.5 (0.4) –3.1 (0.4)
Δ DBP Mean (SE) 0.9 (0.3) –1.8 (0.3)
Adjusted mean (SE) 0.9 (0.3) –1.8 (0.3)
Effect estimate per comparison
Primary endpoint
Δ HbA1c Adjusted mean (SE) –0.11 (0.04)
97.5% CI –0.20, –0.01
P non–inferiority <0.0001
p–value superiority 0.0153
Secondary endpoint
Δ BW Adjusted mean (SE) –4.46 (0.18)
97.5% CI –4.87, –4.05
P non–inferiority <0.0001
Δ SBP Adjusted mean (SE) –5.6 (0.6)
97.5% CI –7.0, –4.2
P non–inferiority <0.0001
Δ DBP Adjusted mean (SE) –2.7 (0.4)
97.5% CI –3.5, –1.8
P non–inferiority <0.0001
SE= standard error;CI = Confidence interval

Assessment report EMA/238334/2015 Page 55/99
Table 13 Summary of efficacy for trial 1245.31
Title: A phase III double–blind, extension, placebo–controlled parallel group safety and efficacy trial of empagliflozin (10 and 25 mg once daily) and sitagliptin (100 mg once daily) given for minimum 76 weeks (including 24 weeks of preceding trial) as monotherapy or with different background therapies in patients with type 2 diabetes mellitus previously completing trial 1245.19, 1245.20 or 1245.23
Study identifier Study 1245.31
Design This extension study combines 4 studies under one study number, which varied with regard to background therapy (drug–naive patients and patients on 3 different background therapies, i.e. pioglitazone, metformin only, or metformin plus sulfonylurea). The objective was to investigate the long–term efficacy, safety, and tolerability of empagliflozin compared with placebo in patients with type 2 diabetes. Each study was designed as a randomised, double–blind, active or placebo–controlled, parallel group comparison. Patients continued on the treatment to which they had been randomised in the preceding trial; no re–randomisation was performed in the extension trial. All analyses were performed separately for each of the 4 studies. All data of the respective preceding trial were combined with the data obtained up to the interim database lock in this extension trial. No separate analysis of the extension trial was performed. Patients from the preceding trials were included in the analyses irrespective of participation in the extension.
Duration Main phase: Treatment up to 130 weeks (including 24 weeks main trial). Results shown for 74 weeks below
Hypothesis Safety, exploratory efficacy
Endpoints No primary efficacy endpoint was defined (primary efficacy endpoint was analysed at week 24 of the preceding trials).
Secondary endpoints
Δ HbA1c
Δ BW
Δ Waist
Δ FPG
Δ SBP
Δ DBP
change from baseline [in preceding trial] in HbA1c, body weight, waist circumference, fasting plasma glucose, and systolic and diastolic blood pressure after a total treatment duration of 52 weeks (24 weeks in the preceding trial plus 28 weeks in the extension).
Study 1245.20, nor its extension, are included in this dossier.

Assessment report EMA/238334/2015 Page 56/99
Extension of study 1245.19(pio), n=305
Extension of study 1245.23(met), n=463
Extension of study 1245.23(met+SU), n=474
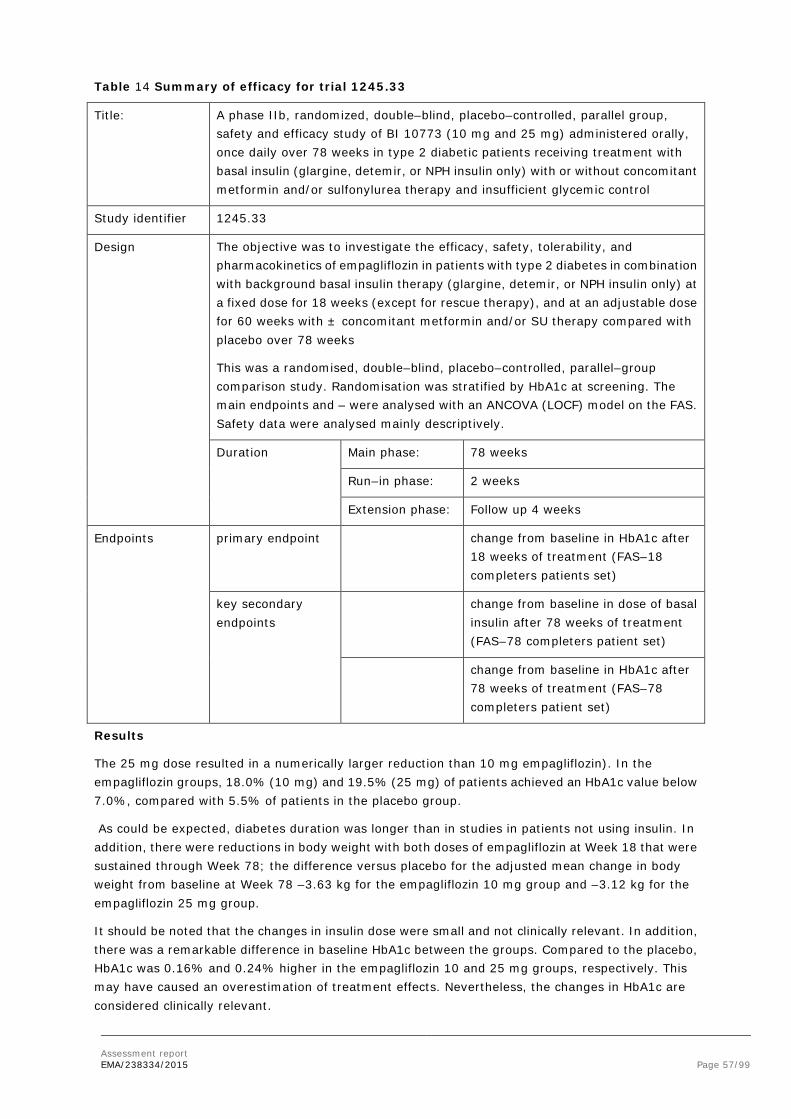
Assessment report EMA/238334/2015 Page 57/99
Table 14 Summary of efficacy for trial 1245.33
Title: A phase IIb, randomized, double–blind, placebo–controlled, parallel group, safety and efficacy study of BI 10773 (10 mg and 25 mg) administered orally, once daily over 78 weeks in type 2 diabetic patients receiving treatment with basal insulin (glargine, detemir, or NPH insulin only) with or without concomitant metformin and/or sulfonylurea therapy and insufficient glycemic control
Study identifier 1245.33
Design The objective was to investigate the efficacy, safety, tolerability, and pharmacokinetics of empagliflozin in patients with type 2 diabetes in combination with background basal insulin therapy (glargine, detemir, or NPH insulin only) at a fixed dose for 18 weeks (except for rescue therapy), and at an adjustable dose for 60 weeks with ± concomitant metformin and/or SU therapy compared with placebo over 78 weeks
This was a randomised, double–blind, placebo–controlled, parallel–group comparison study. Randomisation was stratified by HbA1c at screening. The main endpoints and – were analysed with an ANCOVA (LOCF) model on the FAS. Safety data were analysed mainly descriptively.
Duration Main phase: 78 weeks
Run–in phase: 2 weeks
Extension phase: Follow up 4 weeks
Endpoints primary endpoint change from baseline in HbA1c after 18 weeks of treatment (FAS–18 completers patients set)
key secondary endpoints
change from baseline in dose of basal insulin after 78 weeks of treatment (FAS–78 completers patient set)
change from baseline in HbA1c after 78 weeks of treatment (FAS–78 completers patient set)
Results
The 25 mg dose resulted in a numerically larger reduction than 10 mg empagliflozin). In the empagliflozin groups, 18.0% (10 mg) and 19.5% (25 mg) of patients achieved an HbA1c value below 7.0%, compared with 5.5% of patients in the placebo group.
As could be expected, diabetes duration was longer than in studies in patients not using insulin. In addition, there were reductions in body weight with both doses of empagliflozin at Week 18 that were sustained through Week 78; the difference versus placebo for the adjusted mean change in body weight from baseline at Week 78 –3.63 kg for the empagliflozin 10 mg group and –3.12 kg for the empagliflozin 25 mg group.
It should be noted that the changes in insulin dose were small and not clinically relevant. In addition, there was a remarkable difference in baseline HbA1c between the groups. Compared to the placebo, HbA1c was 0.16% and 0.24% higher in the empagliflozin 10 and 25 mg groups, respectively. This may have caused an overestimation of treatment effects. Nevertheless, the changes in HbA1c are considered clinically relevant.

Assessment report EMA/238334/2015 Page 58/99
Overall, 494 patients were randomised; all patients were treated as planned. Sixty–five patients (13.2%) prematurely discontinued trial medication. Overall, 56.7% of patients were male, 69.8% were White, and 21.1% were Asian. The mean (SD) age was 59.0 (9.7) years and the mean (SD) BMI was 32.0 (5.9) kg/m2. Overall, the mean (SD) baseline HbA1c was 8.23 (0.82) %, the mean (SD) baseline FPG was 143.0 (48.7) mg/dL, and the mean (SD) weight was 91.77 (21.35) kg. .
Primary Analysis
Effect estimate per comparison
Comparison groups Empa 10 mg
Empa 25 mg
Primary endpoint
HbA1c at Week 18 [%]
Adjusted mean difference to placebo (SE)
–0.56 (0.10)
–0.70 (0.10)
97.5% confidence interval
(–0.78, –0.33)
(–0.93, –0.47)
p–value <0.0001 <0.0001
Secondary endpoint
Basal insulin dose at Week 78 [IU]
Adjusted mean difference to placebo (SE)
–6.66 (2.18)
–5.92 (2.25)
97.5% confidence interval
(–11.56, –1.77)
(–11.00, –0.85)
p–value 0.0024 0.0090
HbA1c at Week 78 [%]
Adjusted mean difference to placebo (SE)
–0.46 (0.12)
–0.62 (0.12)
97.5% confidence interval
(–0.73, –0.19)
(–0.90, –0.34)
p–value 0.0001 <0.0001
SE= standard error
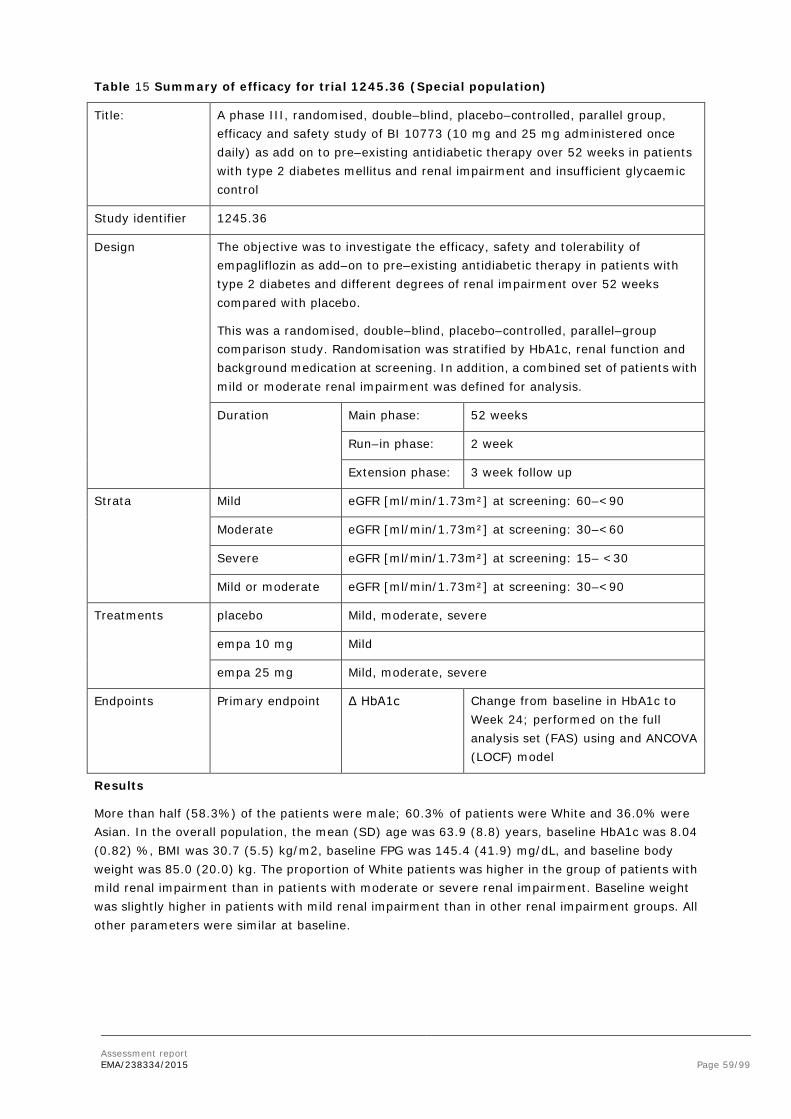
Assessment report EMA/238334/2015 Page 59/99
Table 15 Summary of efficacy for trial 1245.36 (Special population)
Title: A phase III, randomised, double–blind, placebo–controlled, parallel group, efficacy and safety study of BI 10773 (10 mg and 25 mg administered once daily) as add on to pre–existing antidiabetic therapy over 52 weeks in patients with type 2 diabetes mellitus and renal impairment and insufficient glycaemic control
Study identifier 1245.36
Design The objective was to investigate the efficacy, safety and tolerability of empagliflozin as add–on to pre–existing antidiabetic therapy in patients with type 2 diabetes and different degrees of renal impairment over 52 weeks compared with placebo.
This was a randomised, double–blind, placebo–controlled, parallel–group comparison study. Randomisation was stratified by HbA1c, renal function and background medication at screening. In addition, a combined set of patients with mild or moderate renal impairment was defined for analysis.
Duration Main phase: 52 weeks
Run–in phase: 2 week
Extension phase: 3 week follow up
Strata Mild eGFR [ml/min/1.73m²] at screening: 60–<90
Moderate eGFR [ml/min/1.73m²] at screening: 30–<60
Severe eGFR [ml/min/1.73m²] at screening: 15– <30
Mild or moderate eGFR [ml/min/1.73m²] at screening: 30–<90
Treatments placebo Mild, moderate, severe
empa 10 mg Mild
empa 25 mg Mild, moderate, severe
Endpoints Primary endpoint Δ HbA1c Change from baseline in HbA1c to Week 24; performed on the full analysis set (FAS) using and ANCOVA (LOCF) model
Results
More than half (58.3%) of the patients were male; 60.3% of patients were White and 36.0% were Asian. In the overall population, the mean (SD) age was 63.9 (8.8) years, baseline HbA1c was 8.04 (0.82) %, BMI was 30.7 (5.5) kg/m2, baseline FPG was 145.4 (41.9) mg/dL, and baseline body weight was 85.0 (20.0) kg. The proportion of White patients was higher in the group of patients with mild renal impairment than in patients with moderate or severe renal impairment. Baseline weight was slightly higher in patients with mild renal impairment than in other renal impairment groups. All other parameters were similar at baseline.
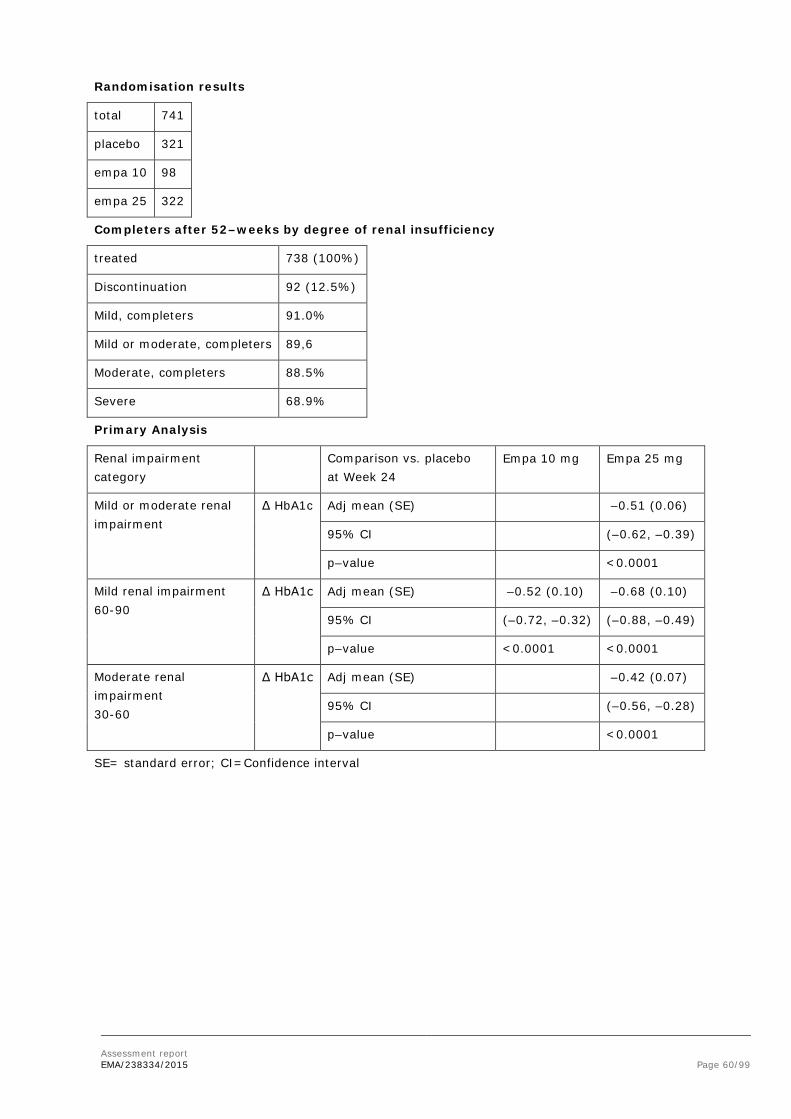
Assessment report EMA/238334/2015 Page 60/99
Randomisation results
total 741
placebo 321
empa 10 98
empa 25 322
Completers after 52–weeks by degree of renal insufficiency
treated 738 (100%)
Discontinuation 92 (12.5%)
Mild, completers 91.0%
Mild or moderate, completers 89,6
Moderate, completers 88.5%
Severe 68.9%
Primary Analysis
Renal impairment category
Comparison vs. placebo at Week 24
Empa 10 mg Empa 25 mg
Mild or moderate renal impairment
Δ HbA1c Adj mean (SE) –0.51 (0.06)
95% CI (–0.62, –0.39)
p–value <0.0001
Mild renal impairment 60-90
Δ HbA1c Adj mean (SE) –0.52 (0.10) –0.68 (0.10)
95% CI (–0.72, –0.32) (–0.88, –0.49)
p–value <0.0001 <0.0001
Moderate renal impairment 30-60
Δ HbA1c Adj mean (SE) –0.42 (0.07)
95% CI (–0.56, –0.28)
p–value <0.0001
SE= standard error; CI=Confidence interval

Assessment report EMA/238334/2015 Page 61/99
Table 16 Summary of efficacy for trial 1245.49
Title: A phase III randomized, double–blind, placebo–controlled, parallel group safety and efficacy study of BI 10773 (10 mg and 25 mg administered orally once daily) during 52 weeks in patients with type 2 diabetes mellitus and insufficient glycemic control on MDI insulin regimen alone or with metformin
Study identifier 1245.49
Design The objective was to investigate the safety and efficacy of empagliflozin (10 mg or 25 mg once daily) compared with placebo, added to an insulin regimen of multiple daily injections (MDI) alone or with metformin in patients with type 2 diabetes and insufficient glycaemic control
This was a randomised, double–blind, placebo–controlled, treat–to–target, parallelgroup comparison. Randomisation was stratified by HbA1c, eGFR, background medication at Visit 1, and geographic region. The total randomised treatment period was 52 weeks. From Week 1 to Week 18, patients were to maintain a stable insulin dose with trial treatment added. From Week 19 to 40, treat–to–target insulin dose adjustments were to be made as needed in order to achieve glucose treat–to–target values (pre–prandial <100 mg/dL [5.5 mmol/l] and postprandial <140 mg/dL [7.8 mmol/l]). From Week 41 to Week 52, patients were to maintain a stable insulin dose, and adjustments were to be made for safety reasons only.
Different LOCF approaches were used at Week 18 and at Week 52 (LOCF–18 and LOCF–52).
Duration Main phase: 52 weeks
Week 1–18 stable insulin dose
Week 19–40 treat to target insulin adj.
Week 41–52 stable insulin dose
Run–in phase: 2 weeks
Follow up 4 weeks
Hypothesis <Superiority> < Equivalence> <Non–inferiority> <Exploratory: specify>
Treatments All (Background) Multiple Dose Insulin (MDI) ±met
Placebo
Empa 10
Empa 25
Endpoints primary endpoint Δ HbA1c The change from baseline in HbA1c [%] after 18 weeks of treatment (was analysed with an analysis of covariance (ANCOVA) model in a hierarchical sequence for each dose, using the last observation carried forward approach (LOCF) on the full analysis set at Week 18 (FAS–18).

Assessment report EMA/238334/2015 Page 62/99
secondary endpoint Δ insulin
Δ BW
Δ HbA1c (52)
The changes from baseline in total insulin daily dose [IU/day], body weight [kg], and HbA1c [%] after 52 weeks of treatment (the 3 key secondary endpoints, with both noninferiority and superiority testing for HbA1c) were analysed with an ANCOVA similar to that described for the primary endpoint, on the per–protocol completers set of patients at Week 52 (PPS–completers–52).
A total of 566 patients were randomised in a 1:1:1:1 ratio and 563 patients were treated. Overall, 15.6% of the treated patients prematurely discontinued study medication. The proportion of male patients was 45.5%. Most patients were White (94.3%). The mean (SD) age was 56.7 (9.5) years, the mean baseline HbA1c 8.34% (0.73%), the mean BMI 34.79 (4.06) kg/m2, the mean baseline body weight 96.2 (17.5) kg, the mean SBP (SD) 133.3 (15.5) mmHg, and the mean DBP (SD) 78.8 (8.6) mmHg. Overall, 71.0% of patients had a combined MDI insulin+met antidiabetic background medication (65.7% of all patients in the FAS had ≥1500 mg metformin per day) and 29.0% of patients had an MDI insulin only antidiabetic background medication. The mean daily met dose (SD) was 2026.8 (542.2) mg.
Overall, 78.0% of patients had a history of hypertension, with controlled BP in 29.7% of patients. Two thirds of all patients had had type 2 diabetes for >10 years at study entry. The demographics and baseline characteristics were generally balanced across treatment groups.
All the steps in the hierarchical testing sequence were successful and treatment with both empagliflozin doses showed statistical superiority compared with placebo.
Primary Analysis
Placebo Empa 10 mg Empa 25 mg
Primary endpoint:
Δ HbA1c [%]1 Week 18
Nr analysed 188 186 189
Baseline mean (SE)
8.33 (0.05) 8.39 (0.05) 8.29 (0.05)
Key secondary endpoints 2
Total daily insulin dose
Nr analysed 115 118 117
Baseline mean (SE)
89.84 (4.08) 88.57 (3.43) 90.38 (4.09)
Body weight [mmHg]
Nr analysed 115 119 118
Baseline mean (SE)
96.34 (1.63) 96.47 (1.53) 95.37 (1.73)
HbA1c [%] Week 52
Nr analysed 115 119 118
Baseline mean (SE)
8.25 (0.07) 8.40 (0.07) 8.37 (0.06)

Assessment report EMA/238334/2015 Page 63/99
Comparison to placebo
Empa 10 mg Empa 25 mg
Primary endpoint:
Δ HbA1c [%]1 Week 18
Pbo–adj mean (SE) –0.44 (0.08) –0.52 (0.07)
97.5% CI (–0.61, –0.27) (–0.69, –0.35)
p–value <0.0001 <0.0001
Key secondary endpoints 2
Total daily insulin dose Pbo–adj mean (SE) –8.83 (3.05) –11.22 (3.05)
97.5% CI (–15.7, –1.97) (–18.1, –4.4)
p–value 0.0040 0.0003
Body weight [mmHg] Pbo–adj mean (SE) –2.39 (0.51) –2.48 (0.51)
97.5% CI (–3.54, –1.24) (–3.63, –1.33)
p–value <0.0001 <0.0001
HbA1c [%] Week 52
Pbo–adj mean (SE) –0.38 (0.11) –0.46 (0.11)
97.5% CI (–0.62, –0.13) (–0.70, –0.22)
P non–inferiority3 <0.0001 <0.0001
P superiority 0.0005 <0.0001
pbo–adj = placebo adjusted; CI = confidence interval
1 primary endpoint; FAS–18 (LOCF–18); stable insulin background
2 key secondary endpoints; PPS–completers–52 (LOCF–52); change at Week 52, following a treat–to–target period from Week 19 to Week 40
3 one–sided test relative to 0.3 compared with placebo treatment

Assessment report EMA/238334/2015 Page 64/99
Table 17 Summary of efficacy for trial 1275.1 (Supportive trial)
Title: A phase III randomized, double–blind, parallel group study to evaluate the efficacy and safety of once daily oral administration of BI 10773 25 mg/linagliptin 5 mg and BI 10773 10 mg/linagliptin 5 mg Fixed Dose Combination tablets compared with the individual components (BI 10773 25 mg, BI 10773 10 mg, and linagliptin 5 mg) for 52 weeks in treatment naïve and metformin treated patients with type 2 diabetes mellitus with insufficient glycaemic control
Study identifier 1275.1
Design This was a randomised, double–blind, parallel group comparison study. Patients were recruited and randomised with or without their background medication (metformin). Randomisation was stratified by screening HbA1c, renal function at screening, assessed based on eGFR values (according to MDRD staging criteria), and geographical region. Patients were to be followed–up for 4 weeks after end–of–treatment or until the end of study after prematurely discontinuing trial medication.
Duration Main phase: 52 weeks
Run–in phase: 2 weeks
Extension phase: Follow up 4 weeks
Hypothesis superiority of the empa/lina FDCs over the respective dose of empagliflozin and linagliptin alone (analysed separately in metformin–treated patients)
Treatments E25L5 Empagliflozin 25 mg/linagliptin 5 mg FDC, once daily
E10L5 Empagliflozin 10 mg/linagliptin 5 mg FDC, once daily
E25 Empagliflozin 25 mg, once daily
E10 Empagliflozin 10 mg, once daily
L5 linagliptin 5 mg, once daily
Endpoints Primary endpoint HbA1c change from baseline in HbA1c (%) after 24 weeks of treatment (ANCOVA, LOCF, FAS))
Following a health authority request, an MMRM approach on the FAS (OC) was also used for the analyses
Key secondary endpoints
FPG
BW
change from baseline after 24 weeks of treatment in FPG and in body weight (comparison of the FDCs with lina),
Target the occurrence of a treat–to–target efficacy response, defined as HbA1c <7.0% (<53.0 mmol/mol) after 24 weeks of treatment
Database lock 12 Feb 2013
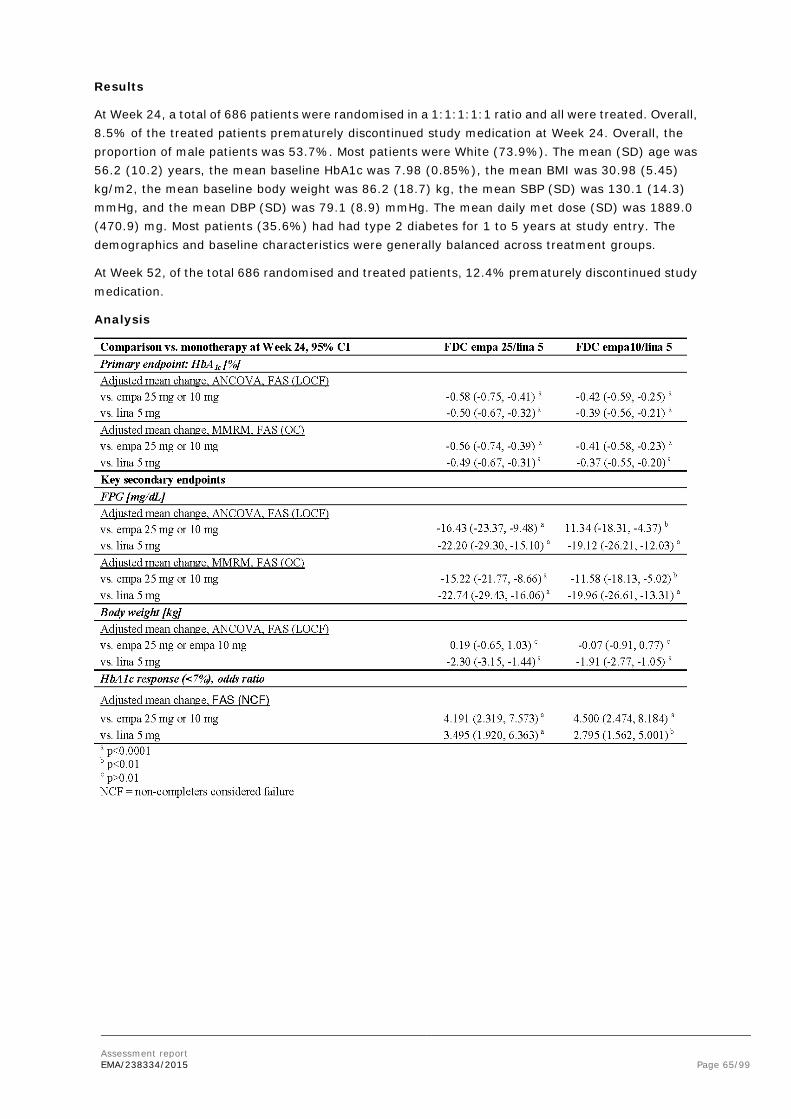
Assessment report EMA/238334/2015 Page 65/99
Results
At Week 24, a total of 686 patients were randomised in a 1:1:1:1:1 ratio and all were treated. Overall, 8.5% of the treated patients prematurely discontinued study medication at Week 24. Overall, the proportion of male patients was 53.7%. Most patients were White (73.9%). The mean (SD) age was 56.2 (10.2) years, the mean baseline HbA1c was 7.98 (0.85%), the mean BMI was 30.98 (5.45) kg/m2, the mean baseline body weight was 86.2 (18.7) kg, the mean SBP (SD) was 130.1 (14.3) mmHg, and the mean DBP (SD) was 79.1 (8.9) mmHg. The mean daily met dose (SD) was 1889.0 (470.9) mg. Most patients (35.6%) had had type 2 diabetes for 1 to 5 years at study entry. The demographics and baseline characteristics were generally balanced across treatment groups.
At Week 52, of the total 686 randomised and treated patients, 12.4% prematurely discontinued study medication.
Analysis

Assessment report EMA/238334/2015 Page 66/99
Table 18 Summary of efficacy for trial 1276.10
Title: A randomised, double–blind, placebo controlled, parallel group efficacy and safety study of oral administration of empagliflozin twice daily versus once daily in two different daily doses over 16 weeks as add–on therapy to a twice daily dosing regimen of metformin in patients with type 2 diabetes mellitus and insufficient glycaemic control
Study identifier 1276.10
Design The objective was to investigate the efficacy and safety of different dosages of empagliflozin administered twice daily versus once daily (at both dose levels, 10 mg and 25 mg daily), orally as add–on therapy to immediate release metformin in patients with type 2 diabetes and insufficient glycaemic control.
This was a randomised, double–blind, placebo–controlled, parallel group comparison. Patients were recruited and randomised with their background medication. Randomisation (2:2:2:2:1) was stratified by HbA1c, renal function at screening, assessed based on eGFR values (according to MDRD staging criteria), and geographical region.
Duration Main phase: 16 weeks
Run–in phase: 2–week
Extension phase: 1 week follow up
Hypothesis The study was designed to test non–inferiority of treatment with empagliflozin 5 mg twice daily versus treatment with empa 10 mg once daily and of treatment with empa 12.5 mg twice daily versus treatment with empagliflozin 25 mg once daily. The superiority of all 4 empagliflozin dose regimens versus placebo was also tested.
Treatments empa 12.5 mg twice daily
empa 25 mg once daily
empa 5 mg twice daily
empa 10 mg once daily
placebo.
Endpoints
primary endpoint The change from baseline in HbA1c after 16 weeks of treatment (, with noninferiority testing of twice vs. once daily administration of empa and superiority testing vs. placebo) Data were analysed with an analysis of covariance (ANCOVA) model, using the last observation carried forward approach (LOCF) on the full analysis set (FAS).
Secondary endpoint
The change from baseline in fasting plasma glucose (FPG) after 16 weeks of treatment (the secondary endpoint) was analysed with an

Assessment report EMA/238334/2015 Page 67/99
ANCOVA similar
Database lock
Results
A total of 983 patients were randomised and all were treated. Overall, 6.8% of the treated patients prematurely discontinued study medication. The proportion of male patients was 53.9%. Most patients were White (85.9%). Mean (SD) age was 58.2 (10.3) years, baseline HbA1c was 7.77 (0.80) %, BMI was 31.77 (5.22) kg/m2, baseline body weight was 89.0 (18.5) kg, the mean SBP (SD) was 131.3 (14.7) mmHg, and the mean DBP (SD) was 78.6 (8.7) mmHg. The mean daily immediate release met dose (SD) was 1959.9 (371.4) mg. More than half of all patients (56.3%) had type 2 diabetes for >5 years at study entry. The demographics and baseline characteristics were in general balanced among the randomised treatment groups.
Primary Analysis
Population FAS, LOCF
Time points Week 16
Treatment group Empa Placebo
12.5 mg bid
25 mg qd
5 mg bid 10 mg qd
Descriptive statistics
Primary endpoint: HbA1c [%]
Number analysed
215 214 215 213 107
Baseline mean (SE)
7.78 (0.05)
7.73 (0.05)
7.79 (0.06)
7.83 (0.05)
7.69 (0.07)
Adj mean change from baseline (SE)
–0.83 (0.05)
–0.72 (0.05)
–0.66 (0.05)
–0.64 (0.05)
–0.22 (0.07)
Secondary endpoint:
FPG [mg/dL]
Number analysed
213 214 213 213 107
Baseline mean (SE)
156.7 (2.6)
157.6 (2.2)
162.7 (2.8)
160.7 (2.7)
159.8 (3.3)
Adj mean change from baseline (SE)
–27.7 (2.0)
–22.7 (2.0)
–21.2 (2.0)
–17.6 (2.0)
–0.2 (2.8)
Effect estimate per comparison
Comparison to empa once daily
Primary endpoint HbA1c
Empa–adj mean change from baseline (SE)
–0.11 (0.07)
–0.02 (0.07)
95% CI –0.26, 0.03
–0.16, 0.13
p–value non–inferiority
<0.0001 <0.0001

Assessment report EMA/238334/2015 Page 68/99
Comparison to placebo
Endpoint HbA1c
Placebo–adj mean change from baseline (SE)
–0.61 (0.09)
–0.50 (0.09)
–0.44 (0.09)
–0.42 (0.09)
95% CI –0.79, –0.44
–0.68, –0.32
–0.62, –0.27
–0.60, –0.25
p–value superiority
<0.0001 <0.0001 <0.0001 <0.0001
Secondary endpoint
FPG [mg/dL]
Placebo–adj mean change from baseline (SE)
–27.5 (3.4)
–22.5 (3.4)
–21.1 (3.4)
–17.5 (3.4)
95% CI –34.2, –20.9
–29.2, –15.9
–27.7, –14.4
–24.1, –10.8
p–value superiority
<0.0001 <0.0001 <0.0001 <0.0001
SD=Standard deviation; SE=Standard error; Adj=Adjusted; CI=Confidence Interval; 4 patients had a missing baseline FPG
Dose selection
• Metformin dose
The dose recommendations for metformin are consistent with its approved label. The 500 mg metformin tablets will not available in line with previous CHMP decisions although it could be helpful in subjects experiencing GI complaints on metformin.
• Empagliflozin dose
Dose selection for the monotherapy phase III program was mostly based on the randomised, double-blind, placebo-controlled phase IIb trials 1245.9 and 1245.10. In trial 1245.9 empagliflozin (up to 25 mg once daily) was administered as monotherapy and in trial 1245.10, empagliflozin (up to 50 mg once daily) was administered as add-on therapy to a background regimen of metformin. All doses were well tolerated and showed a good safety profile. The primary endpoint HbA1c in trials 1245.9 and 1245.10 was the change from baseline in HbA1c after 12 weeks. In study 1245.9, an open-label metformin group was included (2x1000 mg, or maximum tolerated dose). In study 1245.10, an open-label sitagliptin group was included (100 mg).
In trial 1245.9, in which empagliflozin was administered as monotherapy, the differences between empagliflozin and placebo in the adjusted mean changes from baseline in HbA1c after 12 weeks increased with increasing dose of empagliflozin and were: -0.52% (5 mg), -0.57% (10 mg), and -0.72% (25 mg). The effect on the HbA1c level was highest in the metformin group (-0.85%).
In trial 1245.10, in which empagliflozin was administered as add-on therapy to background medication with metformin, the differences between empagliflozin and placebo in the adjusted mean changes from baseline in HbA1c after 12 weeks were -0.24% (1 mg), -0.39% (5 mg), -0.71% (10 mg), -0.70% (25 mg), and -0.64% (50 mg).
Thus, in the dose findings studies, the 25 mg dose of empagliflozin provided better efficacy than the 10 mg dose. The 50 mg dose was only investigated in study 1245.10. In this study, there was no

Assessment report EMA/238334/2015 Page 69/99
additional benefit of the 50 mg dose in terms of efficacy. The selection of the 10 mg and 25 mg dose for the phase III studies was reasonable.
In each of the pivotal phase III trials except for 1245.23 (met+SU) the reduction in HbA1c from baseline at 24 weeks was greater for empagliflozin 25 mg than for empagliflozin 10 mg. The pooled data of the pivotal trials (EFF-2) showed that the adjusted mean change from baseline in HbA1c after 24 weeks of treatment was -0.70% for empagliflozin 10 mg and -0.76% for empagliflozin 25 mg. Although the 25 mg performed better, the lower dose also showed clinically significant changes in HbA1c. During the MAA procedure for empagliflozin it was agreed to use the 10 mg dose as a starting dose and escalate the dose based on tolerability. This approach is supported from a clinical efficacy and safety point of view.
• Once daily vs twice daily dosing
Study 1276.10 was designed in line with comments in the EMA SA related to the ongoing factorial design trial 1276.1. This latter study is required by US FDA to cover the indication label for such FDC in the US (Adjunct to diet and exercise to improve glycemic control in adults with T2DM when treatment with both empagliflozin and metformin is appropriate). This trial can only be regarded ‘supportive’ for the EU “as the trial will not provide information about the efficacy/safety in the intended population (patients failing on optimized metformin monotherapy up to 3000 mg daily) nor about equivalence of the 12.5 mg bid versus 25 mg qd administration”. Therefore, CHMP advised to include a 5 mg bid arm to compare the clinical efficacy with 10 mg qd. In addition, it was strongly recommended to compare 12.5 mg bid and 25 mg qd directly.
Trial 1276.10 was powered to show non-inferiority of the bid versus the qd treatment regimen with empagliflozin in T2DM patients after 16 weeks, with the latter regimen being the reference regimen for the phase 3 add-on to metformin studies from the empagliflozin monotherapy program. The results of the trial showed non-inferiority of twice daily versus once daily empagliflozin regimens for both daily doses of 10 and 25 mg (Figure 1 B). The non-inferiority margin of 0.35% HbA1c is reasonable.
Figure 1 Comparison of efficacy in trial 1276.10
A Change from baseline

Assessment report EMA/238334/2015 Page 70/99
B Difference between treatments
Dashed red lines represent non-inferiority margins mentioned in text, ±0.30%, +0.35%.
Numerically larger reductions in HbA1c from baseline were observed for 12.5 mg bid compared to 25 mg qd while no difference was observed between the 5 mg bid and 10 mg qd regimens. In order to approve a ‘switch indication’ for patients already treated with separate tablets of 25 mg empagliflozin and metformin, equivalence in PK/PD has to be shown in line with regulatory requirements. The applicant performed a post-hoc equivalence exercise. When using the predefined non-inferiority margin of 0.35% as equivalence margins, the treatments would be considered equivalent. The margin can be tightened to 0.30% but this may be data-driven. Still, therapeutic equivalence of the treatments can be assumed, although this was not formally proven. There is no discussion or claim with regard to switching from twice daily treatment to once daily empagliflozin in the proposed SmPC; the treatments are called “similar” and numbers are mentioned in the SmPC.
Analysis performed across trials (pooled analyses AND meta-analysis)
Based on trial 1276.10, the results of the main trials with once daily dosing of empagliflozin can be applied to the proposed FDC and a twice daily dosing regimen. Insulin was included in the background therapy for trials 1245.33 and 1245.49 (EFF C2) but not for 1245.23(met), 1245.23(met+SU) and 1245.19 (EFF-C1).
• Methods
Population
Taken together, the development program provides sufficient information about the target population, both in subjects without and with concomitant insulin.
Primary endpoint
The trials critical for the evaluation of efficacy used the same primary endpoint to assess antidiabetic efficacy: the change from baseline in HbA1c. Exceptions were the double-blind extensions of the pivotal trials (1245.31), in which HbA1c was a secondary endpoint (confirmatory testing was done only in the preceding trials). Another exception was the cardiovascular safety trial 1245.25, which had a safety-related primary endpoint; the change from baseline in HbA1c was an exploratory endpoint. In all trials, blood samples for the determination of HbA1c were analysed in central laboratories that held a National Glycohemoglobin Standardization Program Level I certificate.
Secondary endpoints
Four endpoints were considered secondary endpoints for the pooled analyses of efficacy, i.e. the changes from baseline in FPG, body weight, SBP, and DBP. On trial level, FPG was a key secondary endpoint in the pivotal trial 1245.19, and body weight was a key secondary endpoint in the 4 pivotal trials and in the glimepiride-controlled trial 1245.28. SBP and DBP were defined as key secondary endpoints in trials 1245.20 and 1245.28. Furthermore, in trial 1245.48 (patients with diabetes and hypertension), 24-h SBP was a co-primary endpoint and 24-h DBP was a key secondary endpoint. These key secondary endpoints were part of the testing hierarchy of the respective trial. Thus, the
Assessment report EMA/238334/2015 Page 71/99
trial-level results for these endpoints provide confirmatory evidence. The analyses of other secondary endpoints on trial level were regarded as exploratory analyses.
Sample Size
The sample size calculations for the main trials were acceptable. The studies were designed with high power. With hindsight, the trials could have included less patients, based on the high statistical significance of the results.
As designed, 1276.10 would guarantee preservation of 30% of the treatment effect, which was estimated as 0.70% (-0.91% to -0.50%) resulting in a guaranteed minimal effect of (-0.50) —(-0.35%).= (-0.15%). Such a treatment effect would likely be considered insufficient. However, based on the trial’s results showing a numerical advantage for twice daily treatment, this issue is not further pursued (Figure 1 B).
Analysis populations
The analysis sets used use common definitions. The primary analysis was performed according to ITT and used the FAS, all randomised patients receiving at least one dose of trial medication and having a baseline HbA1c measurement (for trial 1275.19) and at least one dose of trial medication (for trials 1275.1 and 1275.10).
As study 1276.10 was a non-inferiority study, the analysis should have been performed co-primary on both the ITT-set and the PP-set. But as results in the PP-set resembled the ITT results, and the trial also tested for differences against placebo, this is not considered a problem.
Primary analysis
The primary analysis was based on the change from baseline HbA1c values in the FAS set, using ANCOVA with baseline HbA1c as covariate and treatment, baseline renal function and region as fixed factors. This is considered acceptable. As sensitivity analyses this was repeated on the PP set, and using a MMRM approach on the FAS, which is considered acceptable.
Disposition of patients
The rates of premature discontinuations of trial medication were low (17.2%) in all pivotal trials, with a consistently higher discontinuation rate in the placebo groups than in the empagliflozin 10 mg and 25 mg groups. The most frequent reasons for premature discontinuations were adverse events (other than worsening of disease under study or other pre-existing disease). Discontinuation rates were similar for the other phase III trials.
Long-term efficacy analyses (>24 weeks) of the pivotal trials and their double-blind extensions (1245.31) were based on the pooling of the pivotal trials. Of all patients randomised and treated in the pivotal trials, 82.8% completed treatment in the 24-week pivotal trials as planned and 77.3% continued into the extension trials.
Handling of missing data
For the primary and secondary analyses, a last observation carried forward (LOCF) approach was used to replace missing data. LOCF is not considered as an optimal method for the primary analysis, as the assumptions are quite strong and hard to prove. However, in this case, the results are not likely to be influenced much by the LOCF approach because of the relatively low rate of missing data, and the supportive evidence from the sensitivity analyses.
Conduct of the studies
The use of stratified randomisation by baseline characteristics is expected to reduce the risk of important baseline differences between treatment groups and is considered appropriate. There are no
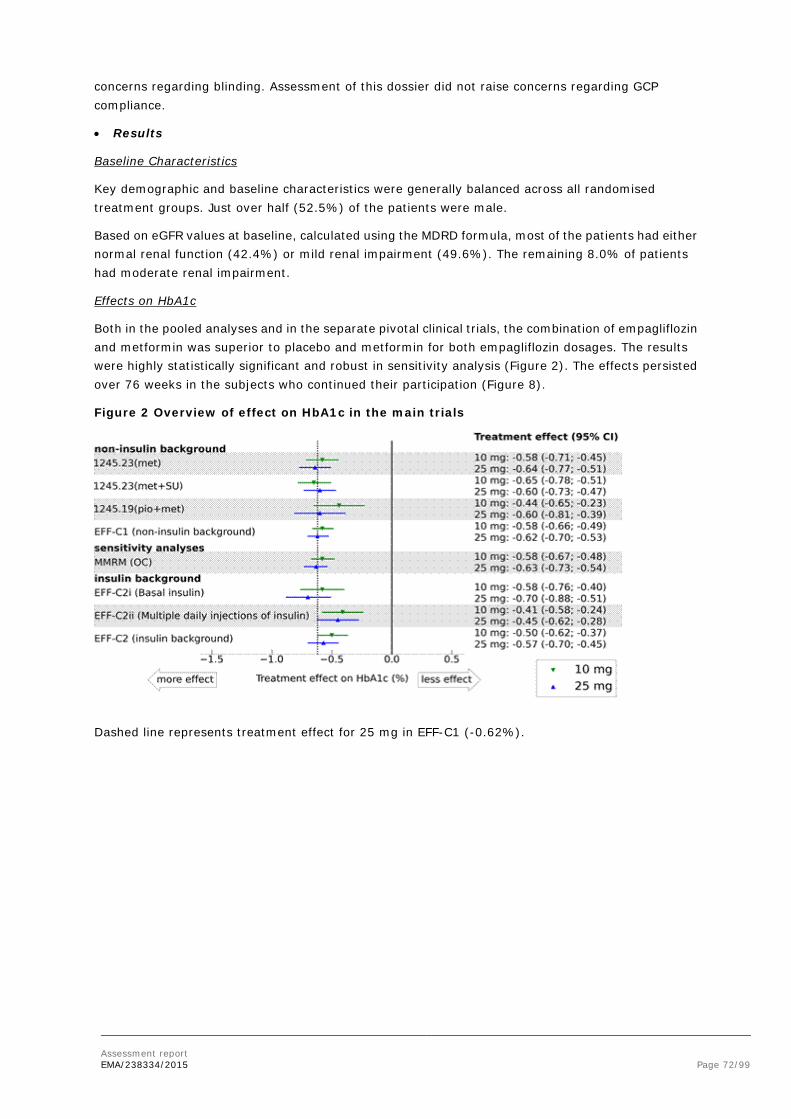
Assessment report EMA/238334/2015 Page 72/99
concerns regarding blinding. Assessment of this dossier did not raise concerns regarding GCP compliance.
• Results
Baseline Characteristics
Key demographic and baseline characteristics were generally balanced across all randomised treatment groups. Just over half (52.5%) of the patients were male.
Based on eGFR values at baseline, calculated using the MDRD formula, most of the patients had either normal renal function (42.4%) or mild renal impairment (49.6%). The remaining 8.0% of patients had moderate renal impairment.
Effects on HbA1c
Both in the pooled analyses and in the separate pivotal clinical trials, the combination of empagliflozin and metformin was superior to placebo and metformin for both empagliflozin dosages. The results were highly statistically significant and robust in sensitivity analysis (Figure 2). The effects persisted over 76 weeks in the subjects who continued their participation (Figure 8).
Figure 2 Overview of effect on HbA1c in the main trials
Dashed line represents treatment effect for 25 mg in EFF-C1 (-0.62%).

Assessment report EMA/238334/2015 Page 73/99
Figure 3 Change from baseline in HbA1c [%] over 76 weeks based on MMRM results in patients taking metformin background medication in the pivotal trials and their extension trial (EFF-C1) - FAS (OC)
Similar results were obtained for various background medications, including insulin (assessed over 18 weeks, Figure 2). The precise treatment effect with insulin is somewhat difficult to estimate, because dose adaptations of insulin were allowed during part of the trial, and this resulted in a decrease of the insulin dose in the empagliflozin group by 7-14 U over 52 weeks.
More subjects treated with empagliflozin reached the pre-specified target of HbA1c < 7.0% after 24 weeks (EFF-C1: Placebo 20%. empa 10 mg 30%, empa 25 mg 35%). This analysis considered non-responders as failure, which causes a slight bias towards empagliflozin, as more placebo patients dropped out.
Effects on fasting plasma glucose
In general the changes in FPG were consistent with the changes in HbA1c. Treatment with empagliflozin+metformin provided clinically meaningful reductions in FPG compared with placebo+metformin. The treatment advantage was 27-29 mg/dL (10 and 25 mg empa respectively; ~1.6 mmol/L) in EFF-C1 after 24 weeks.
Effects on body weight
The increased urinary glucose excretion associated with empagliflozin contributes to weight reduction. This is important as other classes of antidiabetic drugs, especially insulin and sulphonylureas, are often associated with weight gain.
The change from baseline in body weight at 24 weeks was a key secondary endpoint in all pivotal trials. For the patients from the pivotal trials, treatment with empagliflozin+metformin provided body weight reductions after 24 weeks of treatment compared with placebo+metformin, in EFF-C1 the mean treatment advantage was 1.77 kg (empa 10 mg) or 2.00 kg (empa 25 mg). The reductions in body weight were maintained over the entire 76-week duration of the pivotal trials with their extensions.
Effects on blood pressure
In the patients from the pivotal trials who were taking metformin background, empagliflozin+metformin reductions in systolic blood pressure (EFF-C1: empa 10 mg: 3.6 mmHg empa 25 mg: 3.7 mmHg) after 24 weeks compared with placebo+metformin. This effect was maintained over the 76-week period of the pivotal trials combined with their extensions.

Assessment report EMA/238334/2015 Page 74/99
Clinical studies in special populations
Figure 4 shows an overview of the subgroup analyses in EFF-C1. Efficacy in the groups ≥75 years, black or African American and Hispanic/Latino seems less than average, however these observations are not completely consistent between doses and accompanied by large confidence intervals (due to limited numbers of subjects).
The proposed SmPC recommends that, in patients 75 years and older, an increased risk for volume depletion should be taken into account (see sections 4.4 and 4.8). Due to the limited therapeutic experience with empagliflozin in patients aged 85 years and older, initiation of therapy in this population is not recommended. The observed reduction in efficacy may be related to worsening renal function with age.
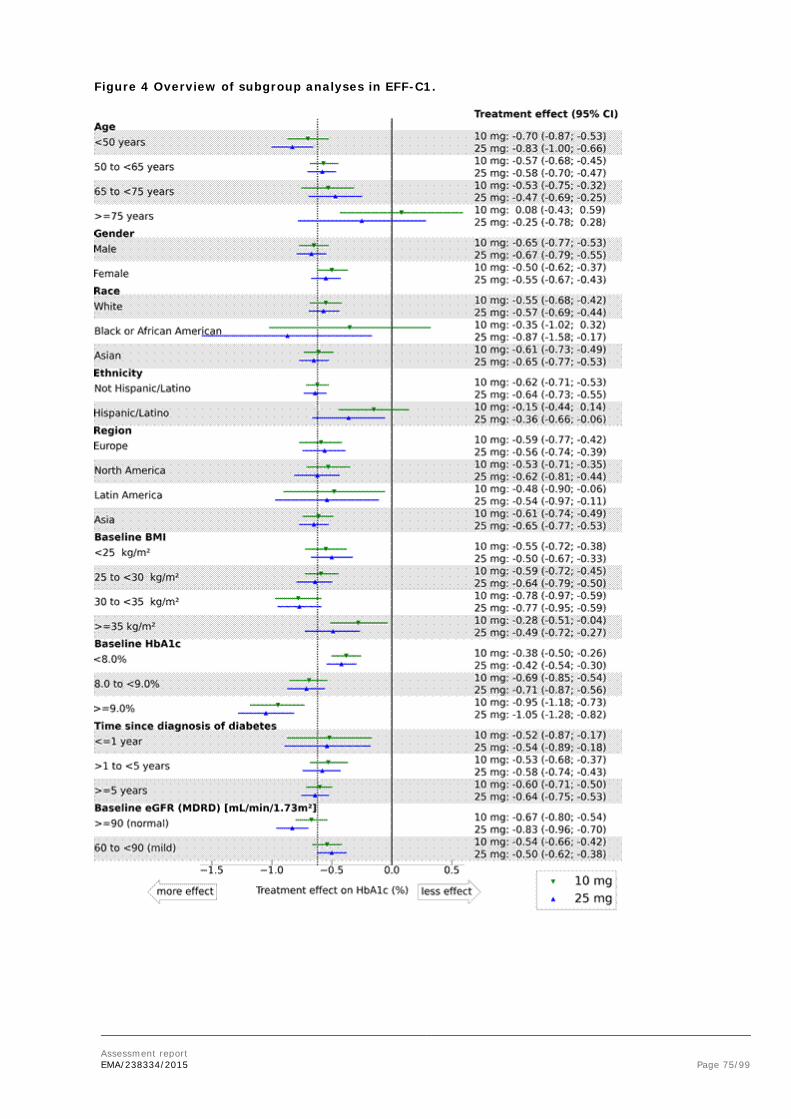
Assessment report EMA/238334/2015 Page 75/99
Figure 4 Overview of subgroup analyses in EFF-C1.
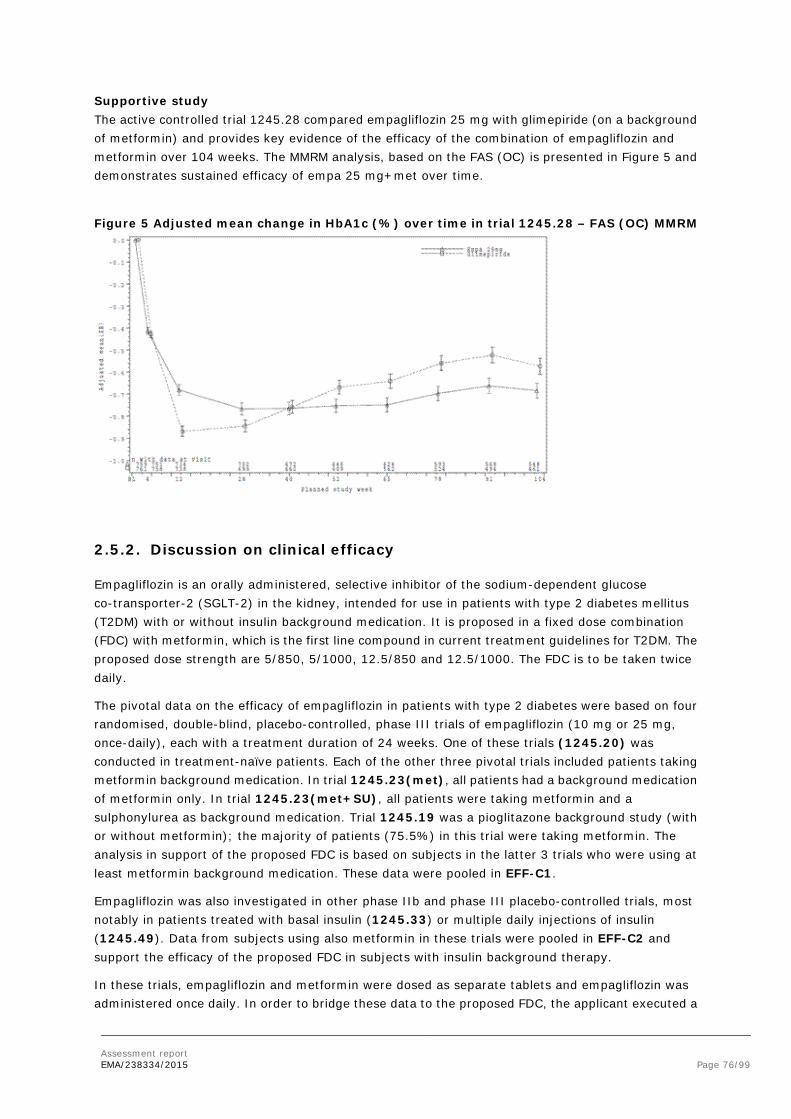
Assessment report EMA/238334/2015 Page 76/99
Supportive study The active controlled trial 1245.28 compared empagliflozin 25 mg with glimepiride (on a background of metformin) and provides key evidence of the efficacy of the combination of empagliflozin and metformin over 104 weeks. The MMRM analysis, based on the FAS (OC) is presented in Figure 5 and demonstrates sustained efficacy of empa 25 mg+met over time.
Figure 5 Adjusted mean change in HbA1c (%) over time in trial 1245.28 – FAS (OC) MMRM
2.5.2. Discussion on clinical efficacy
Empagliflozin is an orally administered, selective inhibitor of the sodium-dependent glucose co-transporter-2 (SGLT-2) in the kidney, intended for use in patients with type 2 diabetes mellitus (T2DM) with or without insulin background medication. It is proposed in a fixed dose combination (FDC) with metformin, which is the first line compound in current treatment guidelines for T2DM. The proposed dose strength are 5/850, 5/1000, 12.5/850 and 12.5/1000. The FDC is to be taken twice daily.
The pivotal data on the efficacy of empagliflozin in patients with type 2 diabetes were based on four randomised, double-blind, placebo-controlled, phase III trials of empagliflozin (10 mg or 25 mg, once-daily), each with a treatment duration of 24 weeks. One of these trials (1245.20) was conducted in treatment-naïve patients. Each of the other three pivotal trials included patients taking metformin background medication. In trial 1245.23(met), all patients had a background medication of metformin only. In trial 1245.23(met+SU), all patients were taking metformin and a sulphonylurea as background medication. Trial 1245.19 was a pioglitazone background study (with or without metformin); the majority of patients (75.5%) in this trial were taking metformin. The analysis in support of the proposed FDC is based on subjects in the latter 3 trials who were using at least metformin background medication. These data were pooled in EFF-C1.
Empagliflozin was also investigated in other phase IIb and phase III placebo-controlled trials, most notably in patients treated with basal insulin (1245.33) or multiple daily injections of insulin (1245.49). Data from subjects using also metformin in these trials were pooled in EFF-C2 and support the efficacy of the proposed FDC in subjects with insulin background therapy.
In these trials, empagliflozin and metformin were dosed as separate tablets and empagliflozin was administered once daily. In order to bridge these data to the proposed FDC, the applicant executed a

Assessment report EMA/238334/2015 Page 77/99
pharmacokinetic bioequivalence study. Moreover, in trial 1276.10 non-inferiority of twice daily dosing versus once daily dosing of empagliflozin was investigated.
Dose finding
In the dose findings studies, the 25 mg dose of empagliflozin provided better efficacy than the 10 mg dose. The 50 mg dose was only investigated in study 1245.10. In this study, there was no additional benefit of the 50 mg dose in terms of efficacy. The selection of the 10 mg and 25 mg dose for the phase III studies was reasonable. In each of the pivotal phase III trials except for 1245.23 (met+SU) the reduction in HbA1c from baseline at 24 weeks was greater for empagliflozin 25 mg than for empagliflozin 10 mg. The pooled data of the pivotal trials (EFF-C1) showed that the adjusted mean change from baseline in HbA1c after 24 weeks of treatment was -0.58% for empagliflozin 10 mg and -0.62% for empagliflozin 25 mg. Although the 25 mg performed slightly better, the lower dose also showed clinically significant changes in HbA1c. In patients insufficiently treated with metformin alone, empagliflozin can be added. It is recommended to start treatment with the lower dose and then increase the dose if possible.
In trial 1276.10 non-inferiority of twice daily dosing versus once daily dosing of empagliflozin was shown. The estimate of the difference between treatments suggest that twice daily dosing is slightly more effective than once daily dosing: -0.11% (-0.26%; 0.03%) for 25 mg and -0.02% (-0.16%; 0.13%) for 10 mg per day. The upper bound for the confidence interval was below the predefined non-inferiority margin of 0.35%. If the hypothesis had been equivalence, then this would have been shown also, even with a tighter margin of 0.30% on both sides.
Design and conduct of clinical studies
All trials were large, double blind and placebo-controlled with a main trial period of 24 weeks. The main inclusion and exclusion criteria were harmonised across the trials. Men and women diagnosed with type 2 diabetes mellitus and with insufficient glycaemic control (HbA1c ≥7.0%). The trials differed mainly in background medication. The primary endpoint was HbA1c change from baseline as expected.
In subjects with insulin background treatment, the main evaluation took place at 18 weeks. In the first 18 weeks, changing the insulin dose was discouraged, after that dose adaptations were allowed (resulting in reduced insulin use in the empa groups).
Efficacy data and additional analyses
Treatment with empagliflozin 10 mg or 25 mg once daily resulted in improvement of glycaemic control with modest reductions of HbA1c and FPG. The pivotal trials demonstrated the superiority of both doses of empagliflozin to placebo after 24 weeks.
Compared to placebo, empagliflozin as add on to metformin was associated with a clinically relevant reduction in HbA1c of -0.58% (10 mg) and -0.62% (25 mg). This result was consistent independent of background therapy besides metformin as tested in the various trials (none, sulphonylurea or pioglitazon). The effect was also robust in the sensitivity analysis using observed cases instead of “Last observation carried forward” as in the main analysis.
The effect on fasting plasma glucose analysed as secondary endpoint further confirmed the primary analysis; the treatment advantage was 1.6 mmol/L for both strengths of empagliflozin. Other secondary endpoints showed reduction of body weight (empa 10: 1.77 kg; empa 25: 2.00 kg) and systolic blood pressure (empa 10: 3.6 mmHg; empa 25: 3.7 mmHg).
Assessment report EMA/238334/2015 Page 78/99
Efficacy seemed almost the same when used in combination with insulin and metformin and evaluated after 18 weeks (empa 10 mg: -0.50%, empa 25 mg: -0.57%).
Analyses are shown that efficacy is maintained over a period of 78 weeks that was observed in extension trials and 104 weeks in 1245.28. In the trials using basal insulin background, the treatment effect at 78 weeks was further reduced: insulin/met/empa 10: -0.36%; insulin/met/empa 10: -0.66%. After 52 weeks in patients using multiple injections of insulin, these numbers were: insulin/met/empa 10: -0.39% and: insulin/met/empa 25: -0.50%. However, these numbers were obtained with a reduction of insulin use by 5.44, 4.33, 6.88, and 14.10 IU per day respectively, making interpretation difficult.
Subgroup analyses of the pivotal trials suggested that the treatment effect of empagliflozin in patients older than 75 years is reduced (25 mg: -0.25%) or absent (10 mg: +0.08%). This is related to reduced renal function in these subjects.
2.5.3. Conclusions on the clinical efficacy
The efficacy of treatment with empagliflozin/metformin combination therapy was robustly assessed by the clinical trial program and can be estimated as -0.6% HbA1c after 24 weeks. In clinical trials two doses were used: 10 mg and 25 mg. In general, the 25 mg dose performed slightly better, but 10 mg is adequate as a starting dose. The data are confirmed by a reduction in fasting plasma glucose. Other relevant benefits include weight reduction and reduction of systolic blood pressure. In subjects also using insulin, the total dose of insulin was reduced.
2.6. Clinical safety
For the analysis of safety, data from 20 clinical studies included in this application were arranged into 5 safety groupings (SAF-C1 to SAF-C5). A schematic representation of the groupings is provided in figure 6. Only patients taking metformin (with or without other antidiabetic medications) as background medication were included in the safety groupings. The safety groupings are:
• SAF-C1 (placebo-controlled studies, metformin only background): used for the safety assessment of empagliflozin in combination with background medication of metformin alone
• SAF-C2 (all placebo-controlled studies): used for the safety assessment of empagliflozin in combination with background metformin, with or without additional background antidiabetic medications. As the largest pool of placebo-controlled studies, SAF-C2 is the main pool for safety subgroup analyses
• SAF-C3 (all studies): includes studies without placebo control. As the largest pool of patients, it is mainly used for the identification of infrequent events
• SAF-C4 (16- to 24-week placebo-controlled studies): mainly used for drug side-effect labelling
• SAF-C5 (phase I studies): healthy subjects only
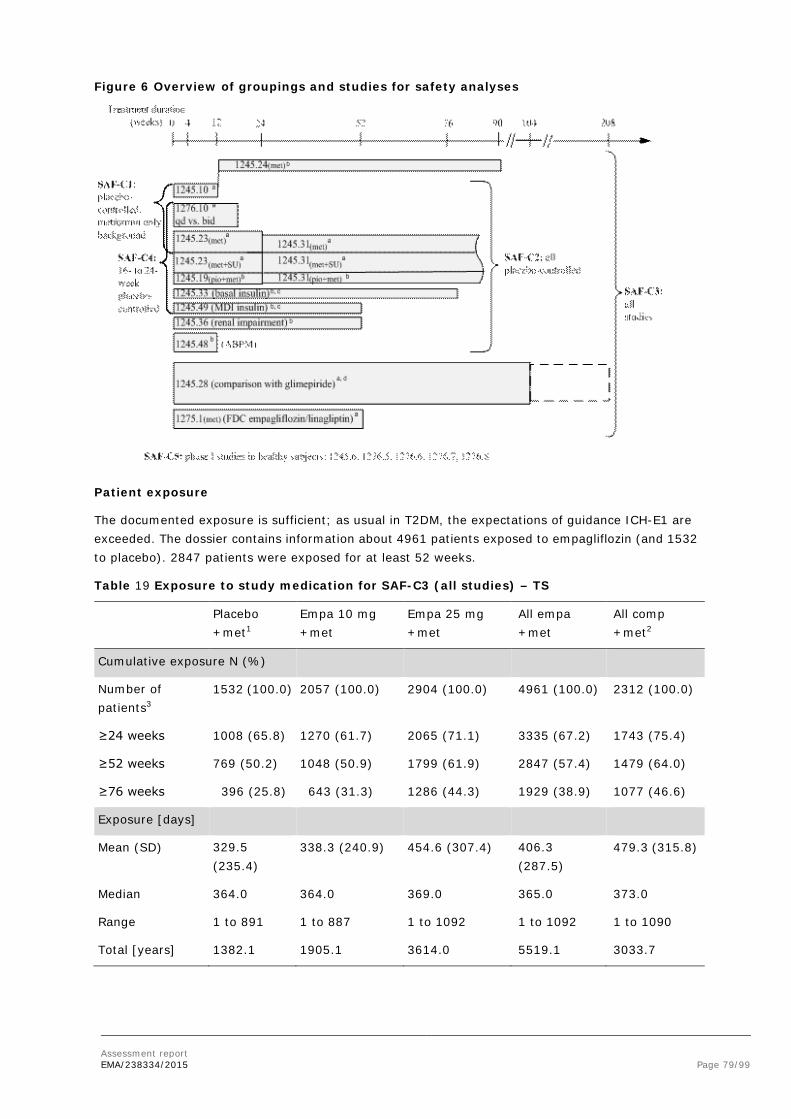
Assessment report EMA/238334/2015 Page 79/99
Figure 6 Overview of groupings and studies for safety analyses
Patient exposure
The documented exposure is sufficient; as usual in T2DM, the expectations of guidance ICH-E1 are exceeded. The dossier contains information about 4961 patients exposed to empagliflozin (and 1532 to placebo). 2847 patients were exposed for at least 52 weeks.
Table 19 Exposure to study medication for SAF-C3 (all studies) – TS
Placebo +met1
Empa 10 mg +met
Empa 25 mg +met
All empa +met
All comp +met2
Cumulative exposure N (%)
Number of patients3
1532 (100.0) 2057 (100.0) 2904 (100.0) 4961 (100.0) 2312 (100.0)
≥24 weeks 1008 (65.8) 1270 (61.7) 2065 (71.1) 3335 (67.2) 1743 (75.4)
≥52 weeks 769 (50.2) 1048 (50.9) 1799 (61.9) 2847 (57.4) 1479 (64.0)
≥76 weeks 396 (25.8) 643 (31.3) 1286 (44.3) 1929 (38.9) 1077 (46.6)
Exposure [days]
Mean (SD) 329.5 (235.4)
338.3 (240.9) 454.6 (307.4) 406.3 (287.5)
479.3 (315.8)
Median 364.0 364.0 369.0 365.0 373.0
Range 1 to 891 1 to 887 1 to 1092 1 to 1092 1 to 1090
Total [years] 1382.1 1905.1 3614.0 5519.1 3033.7

Assessment report EMA/238334/2015 Page 80/99
Adverse events
Adverse event (AE) analysis was based on treatment-emergent AEs, with the focus on placebo-controlled studies (SAF-C2), which is reasonable.
Most frequent AEs
Genital infections stand out as being reported more frequently in the empa+met groups than in the placebo+met group (empa 5.5-5.8%, placebo 1.4%)(Table 20). A large similarity is noted between the data for empa 10 and empa 25, which supports the quality of the data.
AEs of special interest
Based on scientific considerations and regulatory concerns for SGLT-2 inhibitors, predefined searches were executed for adverse events of special interest (Table 20).
Table 20 Overview of frequency of patients with adverse events in SAF-C2 (all placebo-controlled studies) – TS
N (%) Placebo +met
Empa 10 mg +met
Empa 25 mg +met
All comp3 +met
SAF-C2 (placebo-controlled studies) 1400 (100.0) 1670 (100.0) 1751 (100.0) --
Exposure, mean (SD) [days] 329.2 (244.7)
308.0 (257.1)
306.1 (249.2)
--
any adverse event 1019 (72.8) 1109 (66.4) 1161 (66.3) --
AEs leading to discontinuation of study medication
56 (4.0) 72 (4.3) 77 (4.4) --
serious adverse events 117 (8.4) 112 (6.7) 116 (6.6) --
Adverse events of special interest
decreased renal function (SMQ) 3 (0.2) 13 (0.8) 14 (0.8) --
hepatic injury (SMQ) 32 (2.3) 18 (1.1) 32 (1.8) --
urinary tract infection (BIcMQ) 168 (12.0) 194 (11.6) 185 (10.6) --
genital infection (BIcMQ) 20 (1.4) 97 (5.8) 97 (5.5) --
confirmed hypoglycaemic AEs 1 216 (15.4) 216 (12.9) 246 (14.0) --
bone fracture (BIcMQ) 30 (2.1) 24 (1.4) 18 (1.0) --
volume depletion (BIcMQ) 7 (0.5) 16 (1.0) 17 (1.0) --
In general, the frequencies of common adverse events were similar for the 2 doses of empagliflozin (10 mg and 25 mg) in combination with metformin. The most common adverse events in the grouping of placebo-controlled trials (SAF-C2) are provided in Table 21.
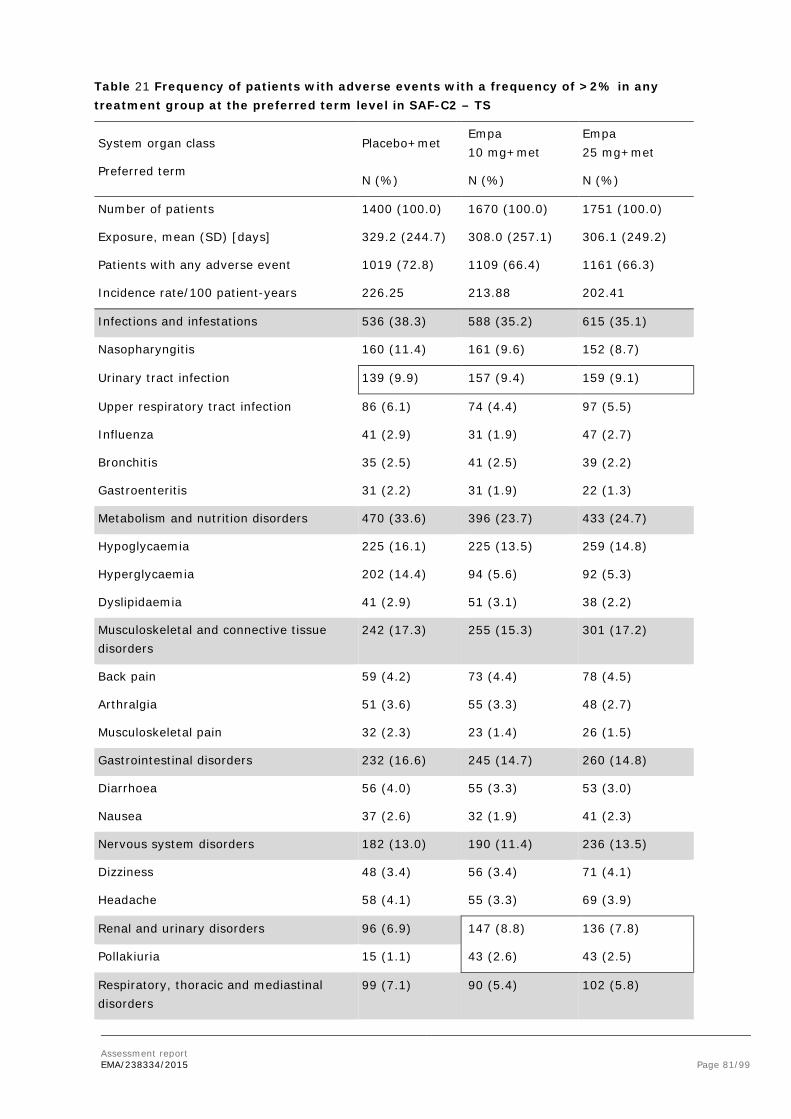
Assessment report EMA/238334/2015 Page 81/99
Table 21 Frequency of patients with adverse events with a frequency of >2% in any treatment group at the preferred term level in SAF-C2 – TS
System organ class
Preferred term
Placebo+met Empa 10 mg+met
Empa 25 mg+met
N (%) N (%) N (%)
Number of patients 1400 (100.0) 1670 (100.0) 1751 (100.0)
Exposure, mean (SD) [days] 329.2 (244.7) 308.0 (257.1) 306.1 (249.2)
Patients with any adverse event 1019 (72.8) 1109 (66.4) 1161 (66.3)
Incidence rate/100 patient-years 226.25 213.88 202.41
Infections and infestations 536 (38.3) 588 (35.2) 615 (35.1)
Nasopharyngitis 160 (11.4) 161 (9.6) 152 (8.7)
Urinary tract infection 139 (9.9) 157 (9.4) 159 (9.1)
Upper respiratory tract infection 86 (6.1) 74 (4.4) 97 (5.5)
Influenza 41 (2.9) 31 (1.9) 47 (2.7)
Bronchitis 35 (2.5) 41 (2.5) 39 (2.2)
Gastroenteritis 31 (2.2) 31 (1.9) 22 (1.3)
Metabolism and nutrition disorders 470 (33.6) 396 (23.7) 433 (24.7)
Hypoglycaemia 225 (16.1) 225 (13.5) 259 (14.8)
Hyperglycaemia 202 (14.4) 94 (5.6) 92 (5.3)
Dyslipidaemia 41 (2.9) 51 (3.1) 38 (2.2)
Musculoskeletal and connective tissue disorders
242 (17.3) 255 (15.3) 301 (17.2)
Back pain 59 (4.2) 73 (4.4) 78 (4.5)
Arthralgia 51 (3.6) 55 (3.3) 48 (2.7)
Musculoskeletal pain 32 (2.3) 23 (1.4) 26 (1.5)
Gastrointestinal disorders 232 (16.6) 245 (14.7) 260 (14.8)
Diarrhoea 56 (4.0) 55 (3.3) 53 (3.0)
Nausea 37 (2.6) 32 (1.9) 41 (2.3)
Nervous system disorders 182 (13.0) 190 (11.4) 236 (13.5)
Dizziness 48 (3.4) 56 (3.4) 71 (4.1)
Headache 58 (4.1) 55 (3.3) 69 (3.9)
Renal and urinary disorders 96 (6.9) 147 (8.8) 136 (7.8)
Pollakiuria 15 (1.1) 43 (2.6) 43 (2.5)
Respiratory, thoracic and mediastinal disorders
99 (7.1) 90 (5.4) 102 (5.8)
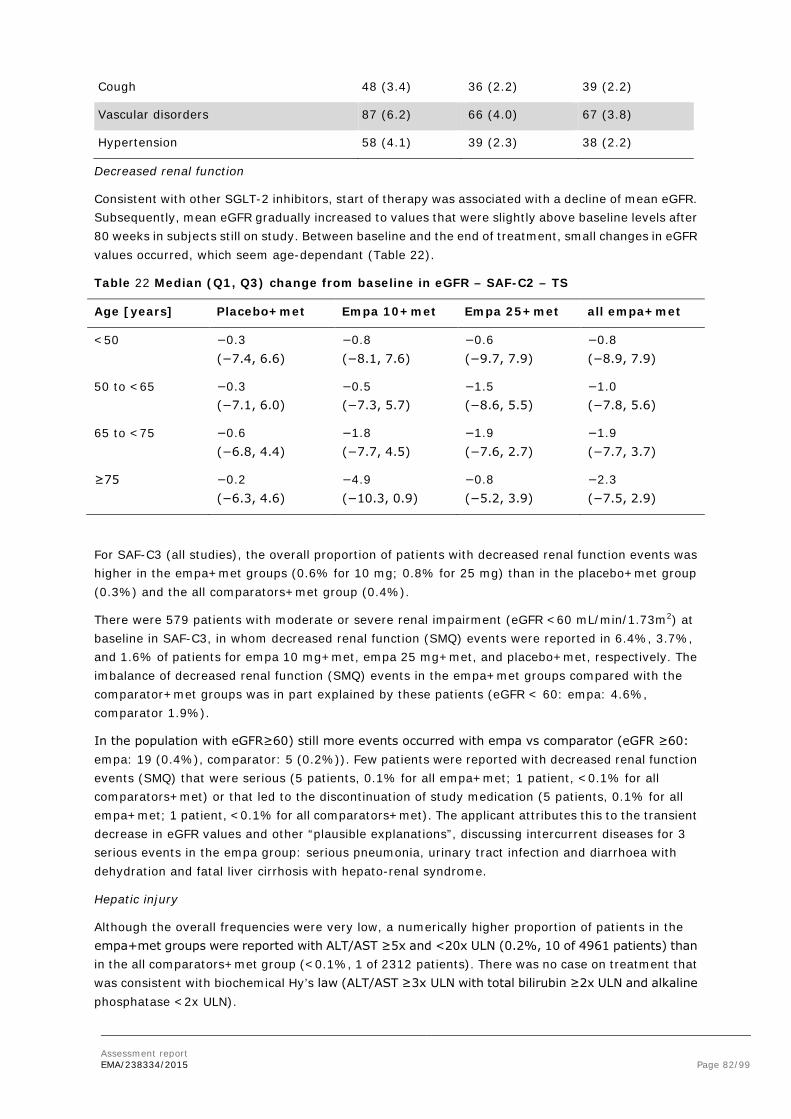
Assessment report EMA/238334/2015 Page 82/99
Cough 48 (3.4) 36 (2.2) 39 (2.2)
Vascular disorders 87 (6.2) 66 (4.0) 67 (3.8)
Hypertension 58 (4.1) 39 (2.3) 38 (2.2)
Decreased renal function
Consistent with other SGLT-2 inhibitors, start of therapy was associated with a decline of mean eGFR. Subsequently, mean eGFR gradually increased to values that were slightly above baseline levels after 80 weeks in subjects still on study. Between baseline and the end of treatment, small changes in eGFR values occurred, which seem age-dependant (Table 22).
Table 22 Median (Q1, Q3) change from baseline in eGFR – SAF-C2 – TS
Age [years] Placebo+met Empa 10+met Empa 25+met all empa+met
<50 −0.3 (−7.4, 6.6)
−0.8 (−8.1, 7.6)
−0.6 (−9.7, 7.9)
−0.8 (−8.9, 7.9)
50 to <65 −0.3 (−7.1, 6.0)
−0.5 (−7.3, 5.7)
−1.5 (−8.6, 5.5)
−1.0 (−7.8, 5.6)
65 to <75 −0.6 (−6.8, 4.4)
−1.8 (−7.7, 4.5)
−1.9 (−7.6, 2.7)
−1.9 (−7.7, 3.7)
≥75 −0.2 (−6.3, 4.6)
−4.9 (−10.3, 0.9)
−0.8 (−5.2, 3.9)
−2.3 (−7.5, 2.9)
For SAF-C3 (all studies), the overall proportion of patients with decreased renal function events was higher in the empa+met groups (0.6% for 10 mg; 0.8% for 25 mg) than in the placebo+met group (0.3%) and the all comparators+met group (0.4%).
There were 579 patients with moderate or severe renal impairment (eGFR <60 mL/min/1.73m2) at baseline in SAF-C3, in whom decreased renal function (SMQ) events were reported in 6.4%, 3.7%, and 1.6% of patients for empa 10 mg+met, empa 25 mg+met, and placebo+met, respectively. The imbalance of decreased renal function (SMQ) events in the empa+met groups compared with the comparator+met groups was in part explained by these patients (eGFR < 60: empa: 4.6%, comparator 1.9%).
In the population with eGFR≥60) still more events occurred with empa vs comparator (eGFR ≥60: empa: 19 (0.4%), comparator: 5 (0.2%)). Few patients were reported with decreased renal function events (SMQ) that were serious (5 patients, 0.1% for all empa+met; 1 patient, <0.1% for all comparators+met) or that led to the discontinuation of study medication (5 patients, 0.1% for all empa+met; 1 patient, <0.1% for all comparators+met). The applicant attributes this to the transient decrease in eGFR values and other “plausible explanations”, discussing intercurrent diseases for 3 serious events in the empa group: serious pneumonia, urinary tract infection and diarrhoea with dehydration and fatal liver cirrhosis with hepato-renal syndrome.
Hepatic injury
Although the overall frequencies were very low, a numerically higher proportion of patients in the empa+met groups were reported with ALT/AST ≥5x and <20x ULN (0.2%, 10 of 4961 patients) than in the all comparators+met group (<0.1%, 1 of 2312 patients). There was no case on treatment that was consistent with biochemical Hy’s law (ALT/AST ≥3x ULN with total bilirubin ≥2x ULN and alkaline phosphatase <2x ULN).
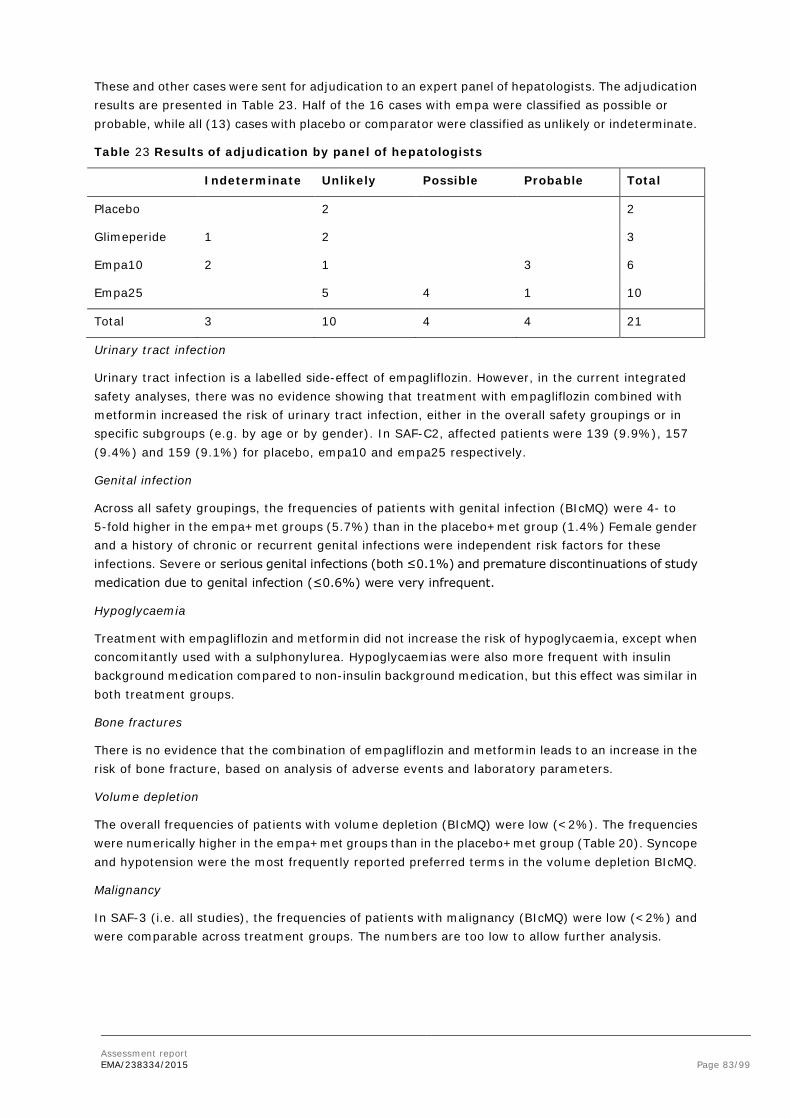
Assessment report EMA/238334/2015 Page 83/99
These and other cases were sent for adjudication to an expert panel of hepatologists. The adjudication results are presented in Table 23. Half of the 16 cases with empa were classified as possible or probable, while all (13) cases with placebo or comparator were classified as unlikely or indeterminate.
Table 23 Results of adjudication by panel of hepatologists
Indeterminate Unlikely Possible Probable Total
Placebo 2 2
Glimeperide 1 2 3
Empa10 2 1 3 6
Empa25 5 4 1 10
Total 3 10 4 4 21
Urinary tract infection
Urinary tract infection is a labelled side-effect of empagliflozin. However, in the current integrated safety analyses, there was no evidence showing that treatment with empagliflozin combined with metformin increased the risk of urinary tract infection, either in the overall safety groupings or in specific subgroups (e.g. by age or by gender). In SAF-C2, affected patients were 139 (9.9%), 157 (9.4%) and 159 (9.1%) for placebo, empa10 and empa25 respectively.
Genital infection
Across all safety groupings, the frequencies of patients with genital infection (BIcMQ) were 4- to 5-fold higher in the empa+met groups (5.7%) than in the placebo+met group (1.4%) Female gender and a history of chronic or recurrent genital infections were independent risk factors for these infections. Severe or serious genital infections (both ≤0.1%) and premature discontinuations of study medication due to genital infection (≤0.6%) were very infrequent.
Hypoglycaemia
Treatment with empagliflozin and metformin did not increase the risk of hypoglycaemia, except when concomitantly used with a sulphonylurea. Hypoglycaemias were also more frequent with insulin background medication compared to non-insulin background medication, but this effect was similar in both treatment groups.
Bone fractures
There is no evidence that the combination of empagliflozin and metformin leads to an increase in the risk of bone fracture, based on analysis of adverse events and laboratory parameters.
Volume depletion
The overall frequencies of patients with volume depletion (BIcMQ) were low (<2%). The frequencies were numerically higher in the empa+met groups than in the placebo+met group (Table 20). Syncope and hypotension were the most frequently reported preferred terms in the volume depletion BIcMQ.
Malignancy
In SAF-3 (i.e. all studies), the frequencies of patients with malignancy (BIcMQ) were low (<2%) and were comparable across treatment groups. The numbers are too low to allow further analysis.
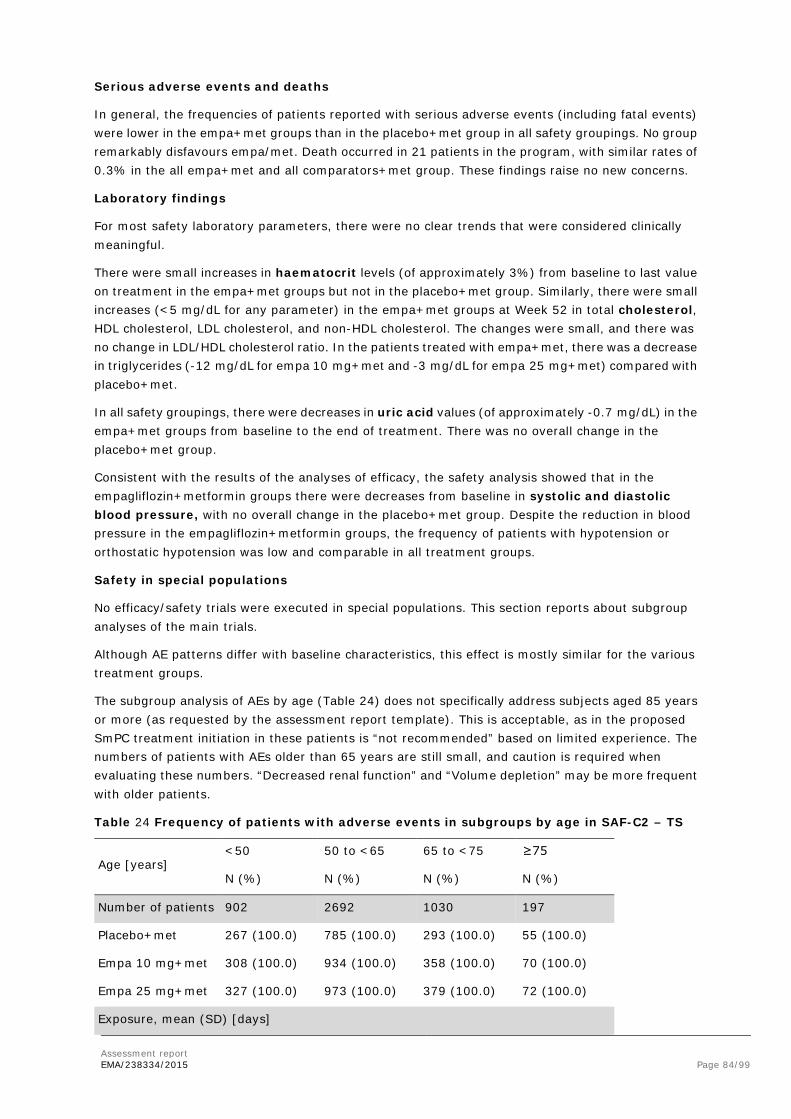
Assessment report EMA/238334/2015 Page 84/99
Serious adverse events and deaths
In general, the frequencies of patients reported with serious adverse events (including fatal events) were lower in the empa+met groups than in the placebo+met group in all safety groupings. No group remarkably disfavours empa/met. Death occurred in 21 patients in the program, with similar rates of 0.3% in the all empa+met and all comparators+met group. These findings raise no new concerns.
Laboratory findings
For most safety laboratory parameters, there were no clear trends that were considered clinically meaningful.
There were small increases in haematocrit levels (of approximately 3%) from baseline to last value on treatment in the empa+met groups but not in the placebo+met group. Similarly, there were small increases (<5 mg/dL for any parameter) in the empa+met groups at Week 52 in total cholesterol, HDL cholesterol, LDL cholesterol, and non-HDL cholesterol. The changes were small, and there was no change in LDL/HDL cholesterol ratio. In the patients treated with empa+met, there was a decrease in triglycerides (-12 mg/dL for empa 10 mg+met and -3 mg/dL for empa 25 mg+met) compared with placebo+met.
In all safety groupings, there were decreases in uric acid values (of approximately -0.7 mg/dL) in the empa+met groups from baseline to the end of treatment. There was no overall change in the placebo+met group.
Consistent with the results of the analyses of efficacy, the safety analysis showed that in the empagliflozin+metformin groups there were decreases from baseline in systolic and diastolic blood pressure, with no overall change in the placebo+met group. Despite the reduction in blood pressure in the empagliflozin+metformin groups, the frequency of patients with hypotension or orthostatic hypotension was low and comparable in all treatment groups.
Safety in special populations
No efficacy/safety trials were executed in special populations. This section reports about subgroup analyses of the main trials.
Although AE patterns differ with baseline characteristics, this effect is mostly similar for the various treatment groups.
The subgroup analysis of AEs by age (Table 24) does not specifically address subjects aged 85 years or more (as requested by the assessment report template). This is acceptable, as in the proposed SmPC treatment initiation in these patients is “not recommended” based on limited experience. The numbers of patients with AEs older than 65 years are still small, and caution is required when evaluating these numbers. “Decreased renal function” and “Volume depletion” may be more frequent with older patients.
Table 24 Frequency of patients with adverse events in subgroups by age in SAF-C2 – TS
Age [years] <50 50 to <65 65 to <75 ≥75
N (%) N (%) N (%) N (%)
Number of patients 902 2692 1030 197
Placebo+met 267 (100.0) 785 (100.0) 293 (100.0) 55 (100.0)
Empa 10 mg+met 308 (100.0) 934 (100.0) 358 (100.0) 70 (100.0)
Empa 25 mg+met 327 (100.0) 973 (100.0) 379 (100.0) 72 (100.0)
Exposure, mean (SD) [days]

Assessment report EMA/238334/2015 Page 85/99
Age [years] <50 50 to <65 65 to <75 ≥75
N (%) N (%) N (%) N (%)
Placebo+met 341.0 (243.7) 338.9 (250.2) 295.9 (235.1) 309.8 (204.4)
Empa 10 mg+met 344.0 (271.9) 315.5 (257.1) 269.5 (243.2) 245.8 (227.0)
Empa 25 mg+met 294.7 (248.6) 320.8 (255.6) 288.0 (231.8) 253.9 (243.2)
Patients with any adverse event
Placebo+met 201 (75.3) 568 (72.4) 207 (70.6) 43 (78.2)
Empa 10 mg+met 215 (69.8) 609 (65.2) 239 (66.8) 46 (65.7)
Empa 25 mg+met 208 (63.6) 634 (65.2) 270 (71.2) 49 (68.1)
Patients with AEs leading to discontinuation of study medication
Placebo+met 5 (1.9) 30 (3.8) 17 (5.8) 4 (7.3)
Empa 10 mg+met 8 (2.6) 41 (4.4) 21 (5.9) 2 (2.9)
Empa 25 mg+met 12 (3.7) 32 (3.3) 28 (7.4) 5 (6.9)
Patients with serious adverse events
Placebo+met 17 (6.4) 58 (7.4) 34 (11.6) 8 (14.5)
Empa 10 mg+met 11 (3.6) 64 (6.9) 29 (8.1) 8 (11.4)
Empa 25 mg+met 17 (5.2) 56 (5.8) 37 (9.8) 6 (8.3)
Patients with decreased renal function (SMQ)
Placebo+met 0 1 (0.1) 2 (0.7) 0
Empa 10 mg+met 1 (0.3) 7 (0.7) 3 (0.8) 2 (2.9)
Empa 25 mg+met 2 (0.6) 6 (0.6) 5 (1.3) 1 (1.4)
Patients with hepatic injury (SMQ)
Placebo+met 9 (3.4) 16 (2.0) 5 (1.7) 2 (3.6)
Empa 10 mg+met 7 (2.3) 9 (1.0) 2 (0.6) 0
Empa 25 mg+met 8 (2.4) 18 (1.8) 5 (1.3) 1 (1.4)
Patients with urinary tract infection (BIcMQ)
Placebo+met 36 (13.5) 84 (10.7) 36 (12.3) 12 (21.8)
Empa 10 mg+met 37 (12.0) 106 (11.3) 39 (10.9) 12 (17.1)
Empa 25 mg+met 27 (8.3) 97 (10.0) 51 (13.5) 10 (13.9)
Patients with genital infection (BIcMQ)
Placebo+met 8 (3.0) 9 (1.1) 1 (0.3) 2 (3.6)
Empa 10 mg+met 26 (8.4) 45 (4.8) 20 (5.6) 6 (8.6)
Empa 25 mg+met 23 (7.0) 54 (5.5) 16 (4.2) 4 (5.6)
Patients with confirmed hypoglycaemic AEs1

Assessment report EMA/238334/2015 Page 86/99
Age [years] <50 50 to <65 65 to <75 ≥75
N (%) N (%) N (%) N (%)
Placebo+met 46 (17.2) 117 (14.9) 45 (15.4) 8 (14.5)
Empa 10 mg+met 38 (12.3) 120 (12.8) 47 (13.1) 11 (15.7)
Empa 25 mg+met 39 (11.9) 139 (14.3) 60 (15.8) 8 (11.1)
Patients with bone fracture (BIcMQ)
Placebo+met 4 (1.5) 16 (2.0) 9 (3.1) 1 (1.8)
Empa 10 mg+met 3 (1.0) 16 (1.7) 3 (0.8) 2 (2.9)
Empa 25 mg+met 3 (0.9) 10 (1.0) 3 (0.8) 2 (2.8)
Patients with volume depletion (BIcMQ)
Placebo+met 1 (0.4) 4 (0.5) 2 (0.7) 0
Empa 10 mg+met 2 (0.6) 9 (1.0) 4 (1.1) 1 (1.4)
Empa 25 mg+met 2 (0.6) 7 (0.7) 7 (1.8) 1 (1.4)
Yellow mark indicates % higher than placebo.
Immunological events
N/A
Safety related to drug-drug interactions and other interactions
No new information is provided in this dossier compared to the evaluation of the monocomponents.
Discontinuation due to AES
Treatment with empa/met is usually well tolerated. More subjects prematurely discontinued placebo treatment. AEs leading to premature discontinuation in the empa groups were mostly associated with genital infections.
2.6.1. Discussion on clinical safety
Trial data were pooled to adequately analyse the different aspects of the safety profile of empagliflozin in combination with background metformin, with or without additional background antidiabetic medications. The most relevant safety pooling for the benefit-risk assessment of empagliflozin is SAF-C2 as this pooling corresponds to the placebo-controlled trials with extensions in which metformin was used by all patients (4821 patients in total).
The overall exposure to empagliflozin (10 or 25 mg) was 5519 patient years (median treatment duration 365 days) in SAF-C3 and is acceptable.
Adverse Events
Genital infections stand out as being reported more frequently in the empa+met groups than in the placebo+met group (empa 5.5-5.8%, placebo 1.4%). Also decreased renal function and volume depletion were reported more frequently during use of empagliflozin. These AEs were also predefined as AE of special interest, which are discussed below.

Assessment report EMA/238334/2015 Page 87/99
Decreased renal function
The overall proportion of patients with decreased renal function events was higher in the empa+met groups (0.6% for 10 mg; 0.8% for 25 mg) than in the placebo+met group (0.3%) and the all comparators+met group (0.4%). This effect was more pronounced in subjects with eGFR <60 mL/min/1.73m2. Although some patients are shown to have intermittent, acute illnesses, an aggravation of renal insufficiency by empa+met cannot be excluded. Moreover, the risk of metformin therapy increases with declining renal function, so small or temporary and reversible changes may still be clinically relevant.
The analysis of patients with serum creatinine ≥2x baseline and above the ULN showed no differences between treatment groups. However, this analysis may not be sensitive to the changes that actually occur.
With regard to renal function, both favourable and unfavourable observations are made. More renal AEs occurred with empa+met compared to placebo+met, both in subjects with eGFR >60 and even more in subjects with eGFR <60. The overall patterns observed for the changes in eGFR (i.e. an initial decrease followed by a sustained gradual increase) and in the decrease in albuminuria in patients treated with empagliflozin combined with metformin were consistent with those observed for the other drugs of the SGLT-2 inhibitor class. A trial in patients with type 1 diabetes showed that short-term treatment with empagliflozin attenuated renal hyperfiltration, which, along with the decrease in blood pressure and uric acid, provide a theoretical basis for kidney protection beyond blood glucose lowering for SGLT-2 inhibitors.
Renal impairment is an “Important potential risk” in the RMP.
Hepatic injury
A higher proportion of patients in the empa+met groups were reported with ALT/AST ≥5x and <20x ULN (0.2%, 10 of 4961 patients) than in the all comparators+met group (<0.1%, 1 of 2312 patients). There was no case on treatment that was consistent with biochemical Hy’s law (ALT/AST ≥3x ULN with total bilirubin ≥2x ULN and alkaline phosphatase <2x ULN).
All cases suspected of hepatic injury (including the above) were sent for blinded adjudication by a panel of independent hepatologists. There were 5 such cases in the comparator groups, all classified as “indeterminate” or “unlikely”. However, there were 16 cases in the empagliflozin groups, of which 8 were classified as “indeterminate” or “unlikely”, 4 as “possible” and 4 as “probable”.
During the registration process of Jardiance (empagliflozin), it became already clear (largely based on the same data) that the number of patients with serious hepatic adverse events is remarkably higher in the empagliflozin groups compared to placebo and comparators. 22 patients were reported with serious liver enzyme elevation (ALT/AST >=3x ULN with total bilirubin >=2x ULN or ALT/AST >=10x ULN) during or after treatment. Of these 22 patients 19 were reported during or after treatment with empagliflozin, whereas no cases were reported during treatment with placebo and only 2 cases were reported after treatment with placebo. One case was reported during treatment with glimepiride. In all but one of these cases the independent committee of hepatic experts judged that the causal relationship with the treatment was not probable. The occurrence of serious liver enzyme elevations was low and there were no imbalances unfavourable for empagliflozin in less severe signs of liver impairment (ALT and/or AST ≥3x ULN or total bilirubin ≥2x ULN). There was, however, a slight imbalance for elevations of ALT and/or AST ≥ 5x ULN (0.1% for placebo and 0.2% for both empa 10 and 25 mg). A higher frequency was seen for ALT and/or AST ≥ 10x ULN and ≥ 20x ULN.
The frequency of patients with elevated liver enzymes during the treatment period was not importantly influenced by history of liver or pancreatic disease at baseline or not. This means that the

Assessment report EMA/238334/2015 Page 88/99
risk of liver injury cannot be diminished by limiting the use of empagliflozin to individuals without a history of liver or pancreatic disease.
A risk for adverse liver events in patients cannot be excluded. Liver injury is identified as an “Important potential risk” in the RMP. The use of the product is contraindicated in section 4.3 of the SmPC and a warning is present in section 4.4 (Cases of hepatic injury have been reported with empagliflozin in clinical trials. A causal relationship between empagliflozin and hepatic injury has not been established.)
Urinary tract infection
Urinary tract infection is a labelled side-effect of empagliflozin. However, in these data treatment with empagliflozin combined with metformin did not increase the risk of urinary tract infection, either in the overall safety groupings or in specific subgroups (e.g. by age or by gender). In SAF-C2, affected patients were 139 (9.9%), 157 (9.4%) and 159 (9.1%) for placebo, empa10 and empa25 respectively.
In the absence of an SMQ for urinary tract infections, a wide list of MedDRA preferred terms was identified for a conservative assessment of adverse events related to or being a potential result of a urinary tract infection. There was low specificity for the diagnosis of urinary tract infection for some of the preferred terms in the search, such as “bacteriuria” and “asymptomatic bacteriuria”. However, this low specificity did not seem to abscure an effect.
Urinary tract infections are addressed in section 4.4 of the SmPC and an important identified risk in the RMP.
Genital infection
Across all safety groupings, the frequencies of patients with genital infection (BIcMQ) higher in the empa+met groups (5.7%) than in the placebo+met group (1.4%). Female gender and a history of chronic or recurrent genital infections were independent risk factors for these infections.
Severe or serious genital infections (both ≤0.1%) and premature discontinuations of study medication due to genital infection (≤0.6%) were infrequent. Therefore, although treatment with the combination of empagliflozin and metformin increased the risk of genital infections, the events appeared to be manageable.
Genital infection is an important identified risk in the RMP.
Hypoglycaemia
Treatment with empagliflozin and metformin only increased the risk of hypoglycaemia, when concomitantly used with a sulphonylurea. Hypoglycaemias were also more frequent with insulin background medication compared to non-insulin background medication, but this effect was similar in both treatment groups. Less precise dosing of SU compared to insulin and the fact that SU users often do not monitor their own blood glucose levels (contrary to insulin users) may contribute to this difference.
Hypoglycaemia with insulin and/or sulphonylurea is an important identified risk in the RMP.
Bone fractures
The combination of empagliflozin and metformin did not increase the risk of bone fracture, based on analysis of adverse events and laboratory parameters.

Assessment report EMA/238334/2015 Page 89/99
Bone fracture is an important potential risk in the RMP.
Volume depletion
The overall frequencies of patients with volume depletion (BIcMQ) were low (<2%), but higher in the empa+met groups than in the placebo+met group. Syncope and hypotension were the most frequently reported preferred terms in the volume depletion BIcMQ.
Use in patients at risk of volume depletion is addressed in section 4.4 of the SmPC and an important identified risk in the RMP.
Malignancy
In SAF-3 (i.e. all studies), the frequencies of patients with malignancy (BIcMQ) were low (<2%) and were comparable across treatment groups. The numbers are too low to allow further analysis.
Serious events
In general, the frequencies of patients reported with serious adverse events (including fatal events) were lower in the empa+met groups than in the placebo+met group in all safety groupings. No group specifically disfavours empa/met.
Death
Death occurred in 21 patients in the program, with similar rates of 0.3% in the all empa+met and all comparators+met group. These findings raise no concerns.
Discontinuation due to AEs
Treatment with empa/met is usually well tolerated. More subjects prematurely discontinued placebo treatment. AEs leading to premature discontinuation in the empa groups, were mostly associated with genital infections.
Labelling in the SmPC
The applicant has based the proposal for Section 4.8 of the SmPC on SAF-C4, consisting of 16- to 24-week placebo-controlled studies; this is a subset of SAF-C2 that was used for the above analysis (see figure 11). The numbers in SAF-C4 are similar, but not the same as in SAF-C2. For brevity, no tables for SAF-C4 are included here.
The Applicant’s algorithm for identifying side-effects was considered rather restrictive as it required a frequency of ≥2% in the empagliflozin+metformin group (10 mg or 25 mg) and a 2-fold higher frequency than in the placebo+metformin group. During the procedure, the applicant provided additional analyses showing that no adverse events would be additionally included when analysing Adverse events in SAF-C4 with a frequency of ≥ 1% more in the empagliflozin+metformin group (10 mg or 25 mg) than in the placebo+metformin group.
Special populations
No efficacy/safety trials were executed in special populations. Instead, subgroup analyses of the main trials are presented. Although AE patterns differ with baseline characteristics, this effect is mostly similar for the various treatment groups.

Assessment report EMA/238334/2015 Page 90/99
The numbers of patients with AEs older than 65 years are small, and caution is required when evaluating these numbers. “Decreased renal function” and “Volume depletion” may be more frequent with older patients (≥ 65 years).
Laboratory evaluations
For most safety laboratory parameters, there were no clear trends that were considered clinically meaningful.
There were small increases in haematocrit levels (of approximately 3%) and cholesterol. These changes can possibly be explained by haemoconcentration.
There were decreases in uric acid values (of approximately -0.7 mg/dL) with empa+met compared to placebo+met . This change could be non-adverse as lower uric acid levels may be associated with lower cardiovascular morbidity and mortality.
Consistent with the results of the analyses of efficacy, the safety analysis showed that there were decreases from baseline in systolic and diastolic blood pressure for empa+met but not placebo_met. This was not associated with events of (orthostatic) hypotension. Therefore, these changes are favourable rather than adverse. Also, there were almost no changes in pulse rate from baseline to the end of treatment.
2.6.2. Conclusions on the clinical safety
In general, tolerability of empagliflozin/metformin combination therapy was acceptable and the safety profile in line with what is expected from the combined use of empagliflozin and metformin. Genital infections are the most common AE of the FDC. Both pre-clinical and clinical findings suggest that combination of empagliflozin with metformin may increase toxicity, especially in relation to renal failure. “Decreased renal function” and “Volume depletion” may be more frequent with older patients. Uncertainty remains around hepatic injuries.
2.7. Pharmacovigilance
Detailed description of the pharmacovigilance system
The CHMP considered that the Pharmacovigilance system as described by the applicant fulfils the legislative requirements.
2.8. Risk Management Plan
The CHMP received the following PRAC Advice on the submitted Risk Management Plan:
The PRAC considered that the risk management plan version 1.1 could be acceptable if the applicant implements the changes to the RMP as described in the PRAC advice.
The CHMP endorsed this advice without changes.
The applicant implemented the changes in the RMP as requested by PRAC and CHMP.
The CHMP endorsed the Risk Management Plan version 1.2 with the following content:

Assessment report EMA/238334/2015 Page 91/99
Safety concerns
Summary of safety concerns
Important identified risks Urinary tract infection
Genital infection
Volume depletion
Lactic acidosis
Hypoglycaemia (with insulin and/or sulphonylurea)
Important potential risks Urinary tract carcinogenicity
Renal impairment
Liver injury
Bone fracture
Missing information Treatment of paediatric patients
Treatment of elderly patients
Treatment of pregnant/breastfeeding women
Clinical impact of dyslipidaemia
Long-term safety (particularly cardiovascular safety)
Concomitant use with glucagon-like peptide 1 analogues
Missing long-term safety information on melanoma
Pharmacovigilance plan
Ongoing and planned additional pharmacovigilance studies/activities in the pharmacovigilance plan
Study/activity Objectives Safety concerns addressed
Status Date for submission of interim or final reports
Long-term CV safety study 1245.25; category 3 (required additional pharmacovigilance activity from the empagliflozin monotherapy registration).
To evaluate long-term CV safety of empagliflozin in patients with T2DM and increased CV risk.
Long-term safety (particularly CV), dyslipidaemia, concomitant use of GLP-1 analogues, urinary tract carcinogenicity, bone fracture, missing long-term safety information on melanoma.
Started Event driven, final CTR planned for Q4 2015.
PASS (trial 1245.96) to assess the risk of renal and liver injury, and urinary tract/genital infection; category 3 (required additional pharmacovigilance activity from the empagliflozin
A PASS will evaluate the risk of urinary tract and genital infection, and acute renal and hepatic injury resulting in hospitalisations, in patients treated with empagliflozin compared with users of other antidiabetic treatment.
Urinary tract infection, genital infection, acute renal failure, liver injury.
Planned Will depend on patient uptake; estimates to be determined in the final trial protocol.

Assessment report EMA/238334/2015 Page 92/99
monotherapy registration). PASS (trial 1245.97) to assess the risk of urinary tract malignancies, preceded by feasibility assessment; category 3 (required additional pharmacovigilance activity from the empagliflozin monotherapy registration).
To evaluate the risk of renal and bladder cancer in patients treated with empagliflozin compared with users of other antidiabetic treatment.
Urinary tract carcinogenicity.
Planned To be determined in the final trial protocol.
Risk minimisation measures
Summary of risk minimisation measures
Safety concern Routine risk minimisation measures Additional risk minimisation measures
Important identified risks
Urinary tract infection
Routine pharmacovigilance activities. Prescription-only medicine. Appropriate labelling in SmPC sections 4.4 Special warnings and precautions for use and 4.8 Undesirable effects.
None.
Genital infection Routine pharmacovigilance activities. Prescription-only medicine. Appropriate labelling in SmPC section 4.8 Undesirable effects.
None.
Volume depletion Routine pharmacovigilance activities. Prescription-only medicine. Appropriate labelling in SmPC sections 4.4 Special warnings and precautions for use and 4.8 Undesirable effects.
None.
Lactic acidosis Routine pharmacovigilance activities. Prescription-only medicine. Appropriate labelling in SmPC sections 4.2 Posology and method of administration, 4.4. Special warnings and precautions for use, 4.8 Undesirable effects, and 4.9 Overdose.
None.
Hypoglycaemia (with insulin and/or SU)
Routine pharmacovigilance activities. Prescription-only medicine. Appropriate labelling in SmPC sections 4.2 Posology and method of administration, 4.8 Undesirable effects, and 4.9 Overdose.
None.
Important potential risks
Urinary tract carcinogenicity
Routine pharmacovigilance activities. Prescription-only medicine.
None.
Renal impairment Routine pharmacovigilance activities. Prescription-only medicine. Appropriate labelling in SmPC sections 4.2 Posology and method of administration, 4.3 Contraindications, and 4.4. Special warnings and precautions for use
None.

Assessment report EMA/238334/2015 Page 93/99
Safety concern Routine risk minimisation measures Additional risk minimisation measures
Liver injury Routine pharmacovigilance activities. Prescription-only medicine. Appropriate labelling in SmPC sections 4.2 Posology and method of administration, 4.3 Contraindications, 4.4. Special warnings and precautions for use, and 4.8 Undesirable effects.
None.
Bone fracture Routine pharmacovigilance activities. Prescription-only medicine.
None.
Missing information
Treatment of paediatric patients
Routine pharmacovigilance activities. Prescription-only medicine. Appropriate labelling in SmPC section 4.2 Posology and methods of administration.
None.
Treatment of elderly patients
Routine pharmacovigilance activities. Prescription-only medicine. Appropriate labelling in SmPC sections 4.2 Posology and methods of administration, 4.4 Special warnings and precautions for use, and 4.8 Undesirable effects.
None.
Treatment of pregnant/ breastfeeding women
Routine pharmacovigilance activities. Prescription-only medicine. Appropriate labelling in SmPC section 4.6 Pregnancy, fertility and lactation.
None.
Clinical impact of dyslipidaemia
Routine pharmacovigilance activities. Prescription-only medicine.
None.
Long-term safety (particularly cardiovascular safety)
Routine pharmacovigilance activities. Prescription-only medicine.
None.
Concomitant use with GLP-1 analogues
Routine pharmacovigilance activities. Prescription-only medicine.
None.
Missing long-term safety information on melanoma
Routine pharmacovigilance activities. Prescription-only medicine.
None.
2.9. Product information
Synjardy contains a new active substance (empagliflozin) which, on the 1st of January 2011, was not contained in any medicinal product authorised in the Union; the product information of Synjardy will therefore have the black triangle and the related standard statements and the product will be subsequently included on the additional monitoring list.
2.9.1. User consultation
The results of the user consultation with target patient groups on the package leaflet submitted by the applicant show that the package leaflet meets the criteria for readability as set out in the Guideline on the readability of the label and package leaflet of medicinal products for human use.

Assessment report EMA/238334/2015 Page 94/99
3. Benefit-Risk Balance
Synjardy (empagliflozin/metformin fixed dose combination: 5/850, 5/1000, 12.5/850 and 12.5/1000 mg) is proposed in adult patients with type 2 diabetes mellitus (T2DM) to improve glycaemic control in patients inadequately controlled with metformin, with or without other glucose-lowering medicinal products, including insulin. Empagliflozin is an orally administered, selective inhibitor of the sodium-dependent glucose co-transporter-2 (SGLT-2) in the kidney, already authorised as Jardiance, also for use in combination with metformin.
Benefits
Beneficial effects This application is based on an evaluation of the efficacy and safety of the combination of empagliflozin and metformin compared with the combination of placebo and metformin. Data from a total of 20 clinical trials, comprising 5 phase I trials, 4 phase IIb trials, and 11 phase III trials, is included. The clinical programme included a representative spectrum of patients with type 2 diabetes mellitus.
To support this application three bioequivalence studies were conducted under fed conditions (study 1276.6 and 1276.7) or fed and fasted conditions (study 1276.8 , only with the highest strength). In these studies the FDC tablets were compared with a free dose combination of the individual tablets empagliflozin (5 mg and 12.5 mg) and metformin (500 mg, 850 mg, and 1000 mg). Bioequivalence between the FDC tablets and the free dose combinations has been shown for all combinations tested and under fed and fasted conditions.
The empagliflozin/metformin FDC will be administered twice-daily due to the pharmacokinetic properties of metformin. The company conducted two studies to support twice daily dosing of empagliflozin in which the pharmacokinetics and safety and efficacy of twice daily administration of 5 mg or 12.5 mg empagliflozin were compared with once daily 10 mg or 25 mg, respectively. A comparable extent of exposure over 24 hours and glucose lowering effect has been found for the different dosing regimens and the steady state plasma concentrations of empagliflozin remained stable after repeated dosing over a period of 16 weeks.
From the trials, only those patients taking background metformin were included in the evaluation of efficacy. A pooled analysis of patients (n=1679) from 3 pivotal trials showed that the adjusted mean treatment difference to placebo+metformin for the change from baseline in HbA1c after 24 weeks was -0.58% for empagliflozin 10 mg+metformin and -0.62% for empagliflozin 25 mg+metformin. Empagliflozin+metformin provided improvements in glycaemic control regardless of additional background therapy. This was demonstrated when empagliflozin+metformin was administered without additional background medication, in combination with a sulphonylurea, and in combination with pioglitazone. In addition, empagliflozin+metformin was efficacious in patients treated with background insulin (with a simultaneous reduction in insulin dose). For all trials and efficacy groupings studied, the results for HbA1c were confirmed by the sensitivity analysis of observed cases and analyses of proportion of patients attaining HbA1c of less than 7%. Efficacy was also robust in most subgroups that were analysed.

Assessment report EMA/238334/2015 Page 95/99
Figure 7 Treatment differences in main efficacy groupings
The posology bridging study 1276.10 showed comparable efficacy of twice-daily and once-daily empagliflozin when administered as add-on therapy to metformin.
Figure 8 Treatment differences in trial 1276.10
The durability of efficacy was primarily based on data up to 104 weeks (for trial 1245.28) and showed a sustained treatment effect over time with regard to the HbA1c reduction from baseline; the extensions of the pivotal trials (1245.31) also showed durability of efficacy over 76 weeks.
Figure 9 Adjusted mean change in HbA1c (%) over time in trial 1245.28 – FAS (OC) MMRM
The effect on fasting plasma glucose analysed as secondary endpoint further confirmed the primary analysis; the treatment advantage was 1.6 mmol/L for both strengths of empagliflozin. Other

Assessment report EMA/238334/2015 Page 96/99
secondary endpoints showed reduction of body weight (empa 10: 1.77 kg; empa 25: 2.00 kg) and systolic blood pressure (empa 10: 3.6 mmHg; empa 25: 3.7 mmHg)
Uncertainty in the knowledge about the beneficial effects Subgroup analyses of the pivotal trials demonstrate that the treatment effect of empagliflozin in patients older than 75 years is reduced (25 mg: -0.25%, n=13) or absent (10 mg: +0.08%, n=15). This is related to reduced renal function in these subjects.
Originally, no separate results were presented for subjects with eGFR <60 mL/min/1.73m2, as metformin and the proposed FDC are contraindicated in these subjects. In the trials, 119 such patients were included, most (n=106) of them with 45 ≤ eGFR < 60 ml/min/1.73m2. In response to CHMP questions, results for these latter patients were presented: the placebo corrected treatment effect was -0.26% (10 mg) or -0.30% (25%).
Risks
Unfavourable effects The safety assessment of empagliflozin combined with metformin was based on 7052 patients with ongoing metformin therapy (with or without other antidiabetic therapies) from 20 clinical studies. A total of 2847 patients were exposed to empagliflozin in combination with metformin for at least a year and 1929 were exposed for 76 weeks or longer. For analysis, the data were pooled.
The frequencies of premature discontinuation of trial medication were higher in the placebo group than in the empagliflozin groups (EFF-C1: placebo: 21.8%; empagliflozin 10 mg: 13.8%; empagliflozin 25 mg: 16.0%).
The overall frequency of treatment-emergent adverse events was comparable between treatment groups (SAF-C2: placebo: 72.8%; empagliflozin 10 mg: 66.4%; empagliflozin 25 mg: 66.3%). AEs leading to discontinuation were slightly more frequent with empa+met (SAF-C2: placebo: 4.0%; empagliflozin 10 mg: 4.3%; empagliflozin 25 mg: 4.4%).
Across all safety groupings, the frequencies of patients with genital infection (BIcMQ) were 4- to 5-fold higher in the empa+met groups (5.7%) than in the placebo+met group (1.4%). Female gender and a history of chronic or recurrent genital infections were independent risk factors for these infections. Severe or serious genital infections (both ≤0.1%) and premature discontinuations of study medication due to genital infection (≤0.6%) occurred but were infrequent.
Consistent with other SGLT-2 inhibitors, therapy was associated with an initial decline of mean eGFR followed by recovery. The effect may be age-dependant. For SAF-C3 (all studies), the overall proportion of patients with decreased renal function events was higher in the empa+met groups (0.6% for 10 mg; 0.8% for 25 mg) than in the placebo+met group (0.3%) and the all comparators+met group (0.4%). This effect was more pronounced in subjects with eGFR <60 mL/min/1.73m2 (10 mg: 6.4%, 25 mg: 3.7%, placebo: 1.6%).
Although the overall frequencies were very low, a higher proportion of patients in the empa+met groups were reported with ALT/AST ≥5x and <20x ULN (0.2%, 10 of 4961 patients) than in the all comparators+met group (<0.1%, 1 of 2312 patients). There was no case on treatment that was consistent with biochemical Hy’s law (ALT/AST ≥3x ULN with total bilirubin ≥2x ULN and alkaline phosphatase <2x ULN). All cases suspected of hepatic injury (including the above) were sent for blinded adjudication by a panel of independent hepatologists. There were 5 such cases in the comparator groups, all classified as “indeterminate” or “unlikely”. However, there were 16 cases in the empagliflozin groups, of which 8 were classified as “indeterminate” or “unlikely”, 4 as “possible” and 4 as “probable”.

Assessment report EMA/238334/2015 Page 97/99
Urinary tract infection is a labelled side-effect of empagliflozin. However, in these data treatment with empagliflozin combined with metformin did not increase the risk of urinary tract infection, either in the overall safety groupings or in specific subgroups (e.g. by age or by gender). In SAF-C2, affected patients were 139 (9.9%), 157 (9.4%) and 159 (9.1%) for placebo, empa10 and empa25 respectively.
Treatment with empagliflozin and metformin increased the risk of hypoglycaemia, only when concomitantly used with a sulphonylurea (empa: 17.1-19.6%; placebo 14.5%). Hypoglycaemias were also more frequent with insulin background medication compared to non-insulin background medication, but this effect was similar in both treatment groups.
The combination of empagliflozin and metformin did not increase the risk of bone fracture, based on analysis of adverse events and laboratory parameters.
The overall frequencies of patients with volume depletion were higher in the empagliflozin+metformin groups (1.0% for both empagliflozin doses compared with the placebo+metformin group (0.5%).
In SAF-3 (i.e. all studies), the frequencies of patients with malignancy (BIcMQ) were low (<2%) and were comparable across treatment groups. The numbers are too low to allow further analysis.
In general, the frequencies of patients reported with serious adverse events (including fatal events) were lower in the empa+met groups than in the placebo+met group in all safety groupings. No group remarkably disfavours empa/met. Death occurred in 21 patients in the program, with similar rates of 0.3% in the all empa+met and all comparators+met group.
Subgroup analyses of the main trials show that AE patterns differ with baseline characteristics, but this effect is mostly similar for the various treatment groups; thus, the safety profile is usually similar for the various subgroups.
There were small increases in haematocrit levels (of approximately 3%) and all fractions of cholesterol during active treatment. Also, there were decreases in uric acid values in these patients. As mentioned under efficacy, there were decreases from baseline in systolic and diastolic blood pressure, without excess events of (orthostatic) hypotension.
Uncertainty in the knowledge about the unfavourable effects
The numbers of patients with AEs older than 65 years are small, and caution is required when evaluating these numbers. “Decreased renal function” and “Volume depletion” may be more frequent with older patients.
Balance
Importance of favourable and unfavourable effects The efficacy of treatment with empagliflozin/metformin combination therapy is robustly assessed by the clinical trial program and can be estimated as -0.6% HbA1c after 24 weeks, with a slight advantage for the higher dose. The data are confirmed by a reduction in fasting plasma glucose. The improvement in glycaemic control was significant and clinically meaningful, and was achieved without an increased incidence of hypoglycaemia. Other relevant benefits include weight reduction and reduction of systolic blood pressure. In subjects also using insulin, the total dose of insulin may be reduced, which might be beneficial.
The observed effects of empagliflozin on HbA1c, body weight and blood pressure could be beneficial for patients as they may translate into reductions in macrovascular and microvascular disease in the long term. There were small increases in cholesterol with empagliflozin, of which the resulting long-term effects have not been investigated. The results of a CV outcome study are awaited.

Assessment report EMA/238334/2015 Page 98/99
The proposed FDC is usually well tolerated, resulting in high retention rates in the clinical trials. In general, the safety profile of empagliflozin is that of a SGLT-2 inhibitor. Overall, no major differences were observed between the 10 and 25 mg dose, but number of AEs may be higher for the higher dose in some high risk patients, like patients ≥75 years. There was an increased risk of genital infections in patients using empagliflozin. Genital infections were usually not serious, but can be very uncomfortable.
With regard to renal function, both favourable and unfavourable observations are made. More renal AEs occurred with empa+met compared to placebo+met, both in subjects with eGFR >60 and even more in subjects with eGFR <60. The overall patterns observed for the changes in eGFR (i.e. an initial decrease followed by a sustained gradual increase) and in the decrease in albuminuria in patients treated with empagliflozin combined with metformin were consistent with those observed for the other drugs of the SGLT-2 inhibitor class. A trial in patients with type 1 diabetes showed that short-term treatment with empagliflozin attenuated renal hyperfiltration, which, along with the decrease in blood pressure and uric acid, provide a theoretical basis for kidney protection beyond blood glucose lowering for SGLT-2 inhibitors.
During the registration process of Jardiance (empagliflozin), similar concerns regarding hepatic injury were raised and it was premature to conclude that there would be no risk for adverse liver events in patients. However, the current data seem less reassuring than during the monotherapy assessment. This risk is important; therefore, hepatic injury is included as an important potential risk in the updated RMP.
In elderly patients (above 75 years) efficacy may be less by reduced renal function, while the risks of volume depletion and decreased renal function may be increased compared to younger patients. Thus, care should be taken as recommended in the SmPC.
With empagliflozin there was a low risk of hypoglycaemia, except in patients using empagliflozin in combination with MET+SU. In these patients empagliflozin should be used with caution.
Benefit-risk balance
The overall B/R of Synjardy is positive.
Discussion on the benefit-risk assessment Empagliflozin in combination with metformin overall has a B/R profile expected of both components; some additional issues were identified:
The number of patients with decreased renal function events was higher in the empa+met groups, compared to the monotherapy both within the target population (eGFR > 60 mL/min/1.73m2) and, in particular, with more advanced renal impairment. These latter patients are contra-indicated to the FDC due to the metformin, however patients who are already on treatment with the FDC may sometimes be still on treatment when eGFR drops below 60 mL/min/1.73m2. Efficacy may decrease and safety issues increase when the combination of metformin and empagliflozin is given in patients with reduced renal function. This may also concern patients > 75 years of age, who have reduced or even absent additional benefit when treated with the FDC.
The Applicant’s algorithm for identifying side-effects to describe in the SmPC was considered rather restrictive as it required a frequency of ≥2% in the empagliflozin+metformin group. However, an assessment of the events with a more sensitive excess of only ≥1% showed no different pattern.

Assessment report EMA/238334/2015 Page 99/99
4. Recommendations
Outcome
Based on the CHMP review of data on quality, safety and efficacy, the CHMP considers by consensus that the risk-benefit balance of Synjardy in the treatment of adults aged 18 years and older with type 2 diabetes mellitus as an adjunct to diet and exercise to improve glycaemic control
• in patients inadequately controlled on their maximally tolerated dose of metformin alone
• in patients inadequately controlled with metformin in combination with other glucose-lowering medicinal products, including insulin (see sections 4.5 and 5.1 for available data on different combinations)
• in patients already being treated with the combination of empagliflozin and metformin as separate tablets.
is favourable and therefore recommends the granting of the marketing authorisation subject to the following conditions:
Conditions or restrictions regarding supply and use
Medicinal product subject to medical prescription.
Conditions and requirements of the Marketing Authorisation
• Periodic Safety Update Reports
The marketing authorisation holder shall submit the first periodic safety update report for this product within 6 months following authorisation. Subsequently, the marketing authorisation holder shall submit periodic safety update reports for this product in accordance with the requirements set out in the list of Union reference dates (EURD list) provided for under Article 107c(7) of Directive 2001/83/EC and published on the European medicines web-portal.
Conditions or restrictions with regard to the safe and effective use of the medicinal product • Risk Management Plan (RMP) The MAH shall perform the required pharmacovigilance activities and interventions detailed in the agreed RMP presented in Module 1.8.2 of the Marketing Authorisation and any agreed subsequent updates of the RMP.
An updated RMP should be submitted:
• At the request of the European Medicines Agency;
• Whenever the risk management system is modified, especially as the result of new information being received that may lead to a significant change to the benefit/risk profile or as the result of an important (pharmacovigilance or risk minimisation) milestone being reached.
If the dates for submission of a PSUR and the update of a RMP coincide, they can be submitted at the same time.
Conditions or restrictions with regard to the safe and effective use of the medicinal product to be implemented by the Member States.
Not applicable.