
Hyperion DRM Online Training | Oracle Hyperion DRM Online Training | Hyperion DRM Online Course |
Upload
nguyendungCategory
view
216download
0
Assessment of the spectral stability ofLibya 4, Libya 1, and Mauritania 2sites using Earth Observing OneHyperion
Taeyoung ChoiXiaoxiong XiongAmit AngalGyanesh ChanderJohn J. Qu
Downloaded From: http://remotesensing.spiedigitallibrary.org/ on 06/08/2014 Terms of Use: http://spiedl.org/terms
https://ntrs.nasa.gov/search.jsp?R=20140017428 2018-06-17T15:15:11+00:00Z

Assessment of the spectral stability of Libya 4,Libya 1, and Mauritania 2 sites using
Earth Observing One Hyperion
Taeyoung Choi,a,* Xiaoxiong Xiong,b Amit Angal,c
Gyanesh Chander,d and John J. Que
aSigma Space Corporation, 4801, Forbes Boulevard, Lanham, Maryland 20706bNASA Goddard Space Flight Center (GSFC), Greenbelt, Maryland 20771cScience Systems and Applications, Inc. (SSAI), Lanham, Maryland 20706
dNASA GSFC, Greenbelt, Maryland 20771eGeorge Mason University, Global Environment and Natural Resources Institute (GENRI),
Department of GGS College of Science, Fairfax, Virginia 20171
Abstract. The objective of this paper is to formulate a methodology to assess the spectral sta-bility of the Libya 4, Libya 1, and Mauritania 2 pseudo-invariant calibration sites (PICS) usingEarth Observing One (EO-1) Hyperion sensor. All the available Hyperion collections, down-loaded from the Earth Explorer website, were utilized for the three PICS. In each site, a referencespectrum is selected at a specific day in the vicinity of the region of interest (ROI) defined byCommittee on Earth Observation Satellites (CEOS). A series of ROIs are predefined in thealong-track direction with 196 spectral top-of-atmosphere reflectance values in each ROI.Based on the reference ROI spectrum, the spectral stability of these ROIs is evaluated by averagedeviations (ADs) and spectral angle mapper (SAM) methods in the specific ranges of time andgeo-spatial locations. Time and ROI location-dependent SAM and AD results are very stablewithin �2 deg and �1.7% of 1σ standard deviations. Consequently, the Libya 4, Mauritania 2,and Libya 1 CEOS selected PICS are spectrally stable targets within the time and spatial swathranges of the Hyperion collections. © 2014 Society of Photo-Optical Instrumentation Engineers (SPIE)
[DOI: 10.1117/1.JRS.8.083618]
Keywords: average deviation; calibration; CEOS; Hyperion; Libya 1; Libya 4; Mauritania 2;PICS; RSR; SAM; spectral stability.
Paper 13300P received Aug. 13, 2013; revised manuscript received Mar. 27, 2014; accepted forpublication Apr. 10, 2014; published online Jun. 6, 2014.
1 Introduction
Specific locations1,2 on the Earth’s surface with stable radiometric characteristics have been usedto evaluate sensors’ postlaunch radiometric performance. These pseudo-invariant calibrationsites (PICS) have been recommended by the Committee on Earth Observation Satellites(CEOS).3–5 Most of the CEOS test sites are located in the desert areas with a set of desirablerequirements, e.g., spatial uniformity, minimum surface reflectance of 0.3, high signal-to-noiseratio, spectrally flat surface, small seasonal bi-directional reflectance distribution function, nearLambertian surface, and low aerosol loading.3,6 The CEOS Working Group on Calibration andValidation Infrared and Visible Optical Sensors group recommended a set of test sites for long-term on-orbit radiometric calibration stability of optical imaging sensors. The six CEOS refer-ence PICS are Libya 4, Mauritania 1∕2, Algeria 3, Libya 1, and Algeria 5. It should be pointedout that these sites had been used by the Centre National d’Etudes Spatiales for years to calibratethe imaging sensors.7
*Address all correspondence to: Taeyoung Choi, E-mail: [email protected]
0091-3286/2014/$25.00 © 2014 SPIE
Journal of Applied Remote Sensing 083618-1 Vol. 8, 2014
Downloaded From: http://remotesensing.spiedigitallibrary.org/ on 06/08/2014 Terms of Use: http://spiedl.org/terms

Among these test sites, only Libya 4 and Libya 1 have overlapped Hyperion collections withthe CEOS region of interest (ROI). There is no overlap of Hyperion collections with the CEOSROI for Mauritania 2 site. This site is included in this study because of its broad range ofuniformity.
The purpose of this paper is to evaluate the on-orbit spectral stability of the selected CEOSPICS. This paper is an extension of our previous study presented at SPIE. The SPIE work wasfocused on Libya 4 site only using one Hyperion collection per year from 2004 to 2012.8 In thisstudy, the developed spectral angle mapper (SAM) and average deviation (AD) methodology isapplied to the Libya 4, Mauritania 2, and Libya 1 CEOS PICS. In addition, all the availableimages, from launch to early of 2013, over the three sites are selected. The Earth ObservingOne (EO-1) Hyperion response is used as an input to the SAM method which is used to assessthe spectral stability of a given target without the gain effect.9,10 In addition, AD values arecalculated to evaluate the spectral variations compared to the reference spectrum.
2 Sensor Overview
As part of a 1-year technology validation/demonstration mission, EO-1 was launched onNovember 21, 2000. The EO-1 mission was extended thereafter to serve the interest of the sci-entific community. It has been successfully operated for over 13 years providing hyperspectralmeasurements. Hyperion on-board, the EO-1 satellite is a push-broom style hyperspectral sensorand its spectral range is from 0.4 to 2.5 μm covered by 242 spectral bands at 10-nm spectralresolution. It has 30-m spatial resolution acquiring measurements over a 7.7-km wide swath.11
Out of the 242 spectral bands, the 46 overlapping or noncalibrated bands are not included inthis study. Table 1 shows the overlapping and noncalibrated bands.
3 Test Site ROI Information and Hyperion Collections
Cosnefroy et al. identified several radiometrically stable desert targets in the North African andArabian Desert.12 An ROI of 100 × 100 km was chosen to evaluate the spatial uniformity andtemporal stability of each site. As mentioned in Sec. 1, there were six CEOS-recommended PICSin the Saharan desert. Only three test sites (Libya 4, Mauritania 2, and Libya 1) are utilized in thisstudy because of the limited swath of EO-1 Hyperion coverage. The Libya 4 site is a high reflec-tance target located at coordinates of þ28.55°N and þ23.39°E in the Libyan Desert in the northside of the African continent with an elevation of 118 m above sea level. It is composed of sanddunes with multiple sizes and no signature of vegetation. The second site, Mauritania 2, islocated on the northwestern side of the African continent with coordinates centered atþ20.85°N and −8.78°E with 384-m altitude. This site has slightly lower reflectance levelthan the Libya 4 site. The third target, Libya 1, is located at coordinates of þ24.42°N andþ13.35°E with an altitude of 648 m. It also has various sizes of sand dunes, which becomeless pronounced in the northwest direction. Additional information on CEOS PICS used inthis study is provided in the US Geological Survey (USGS) test site catalog,13 http://calval.cr.usgs.gov/sites_catalog_map.php, and extensively documented in Ref. 14.
Table 1 Hyperion overlapping and noncalibrated bands.
Band Wavelength (μm) Status
1 to 7 0.356 to 0.417 Not calibrated
56 to 57 0.913 to 0.926 Overlaps with 77 to 78
58 to 70 0.936 to 1.058 Not calibrated
71 to 76 0.852 to 0.902 Not calibrated
77 to 78 0.912 to 0.923 Overlaps with 56 to 57
225 to 242 2.406 to 2.578 Not calibrated
Choi et al.: Assessment of the spectral stability of Libya 4, Libya 1, and Mauritania 2 sites. . .
Journal of Applied Remote Sensing 083618-2 Vol. 8, 2014
Downloaded From: http://remotesensing.spiedigitallibrary.org/ on 06/08/2014 Terms of Use: http://spiedl.org/terms

To visualize the differences between CEOS specification and the reference ROI, the geo-located images are shown in Fig. 1 using Enhanced Thematic Mapper Plus (ETM+) andHyperion collections. The Hyperion scenes have a very narrow swath of 7.7 km compared toETM+’s 187-km swath. In Fig. 1(a), the Libya 4 CEOS ROI is illustrated by a blue rectangularbox, whereas the reference ROI is represented by a small red box within the Hyperion overlap.The ETM+ images included in Fig. 1 are for visualization purposes only.
The Landsat World Reference System 2 path/row and latitude/longitude coordinate informa-tion for these reference ROIs are shown in Table 2. These ROIs will be used as a baseline forfurther spectral stability analysis along with other ROIs. For the Mauritania 2 site, the location ofthe CEOS ROI is not included by the Hyperion collection. However, the Hyperion reference ROIis close enough to the PICS ROI and spectral signatures are very similar so that we can define thereference ROI as shown in Fig. 1(b). On the other hand, the reference ROIs in Libya 4 and Libya1 sites are the subsets of the CEOS ROIs as shown in Fig. 1(c). The further details of spectralsimilarities between the CEOS and reference ROI are discussed in Sec. 5.
4 Data Processing and Methodology
The EO-1 Hyperion data are readily available through USGS Earth Explorer website at http://earthexplorer.usgs.gov/. In this study, the processing level of the Hyperion data is Level 1Gst,which is radiometrically corrected and resampled for geometric correction and registration to ageographic map projection. All available images of the three sites were selected from launch toearly 2013. Prior to cloud filtering, a total of 302 Hyperion scenes were available with Libya 4site since 2004. There were 118 and 19 scenes available for Mauritania 2 and Libya 1 sites,respectively. Table 3 provides a summary of the total number of scenes used in our analysis.All these scenes were processed to compute the TOA reflectance before performing furtheranalyses.
4.1 Conversion to TOA Reflectance
As an initial step, the pixel calibrated digital numbers (DNs) need to be corrected for rescalinggain/bias and converted to absolute radiometric units such as at-sensor radiance or TOA
Fig. 1 Geo-referenced mosaic image of Libya 4, Mauritania 2, and Libya 1 sites using L7 ETM+band 3 and Hyperion band 16. The blue and red rectangles denote the standard CEOS ROI andHyperion subset of it as a reference ROI, respectively.
Table 2 The reference ROI coordinates and Hyperion collection dates for the PICS.
Sites Year Day Path Row Min. lat. Min. lon. Max. lat. Max. lon. Area (km2)
Libya 4 2012 179 181 40 28.55 23.69 28.57 23.72 8.73
Mauritania 2 2012 172 201 46 20.97 −9.11 20.99 −9.08 8.04
Libya 1 2012 167 187 43 24.45 13.34 24.48 13.37 8.82
Choi et al.: Assessment of the spectral stability of Libya 4, Libya 1, and Mauritania 2 sites. . .
Journal of Applied Remote Sensing 083618-3 Vol. 8, 2014
Downloaded From: http://remotesensing.spiedigitallibrary.org/ on 06/08/2014 Terms of Use: http://spiedl.org/terms
reflectance. The Hyperion DNs are converted to TOA reflectance values using the informationprovided in the metafile. The at-sensor radiance and reflectance (ρλ) calculations are performedusing the standard equation
ρλ ¼π · Lλ · d2
ESUNλ · cos θs: (1)
The reflectance (ρλ) is proportional to the spectral radiance at the sensor’s aperture (Lλ) and thesquare of the Earth–sun distance (d) in astronomical units divided by the mean exoatmosphericsolar irradiance (ESUNλ) and cosine of the solar zenith angle (θs) Hyperion ESUNλ is calculatedbased on Thullier model15 and the TOA reflectance values are integrated over the active wave-length range defined by the RSR.
4.2 Selection of Hyperion ROIs
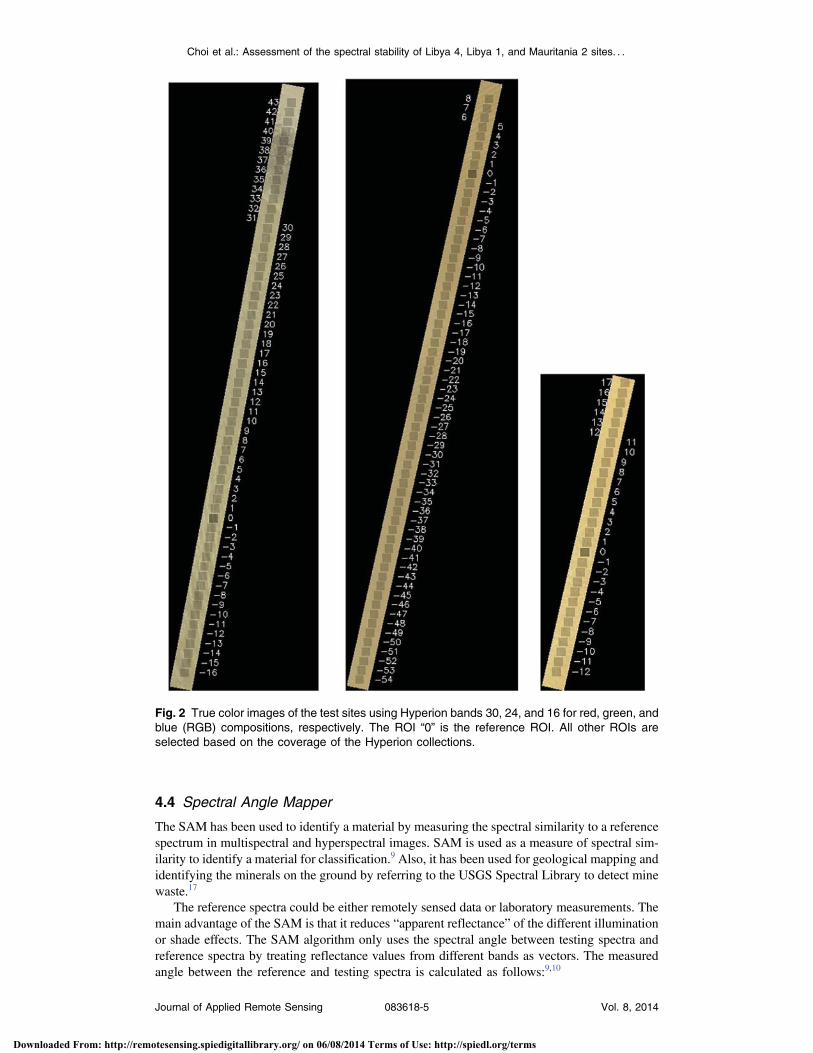
A reference rectangular ROI (approximately 2.9 × 2.9 km) was defined for each test site by thelatitude and longitude ranges as specified in Table 2. As an example, the Libya 4 test site refer-ence ROI is shown as a small red rectangle in Fig. 1, which is a subset of the CEOS PICS. Basedon the reference ROI, additional ROIs are selected along the EO-1 satellite track direction asshown in Fig. 2(a). In each test site, the reference ROI is marked as a dark shaded rectanglecorresponding to the number “0.” The Hyperion spectrum from ROI 0 is used as a referencespectrum, which is further used to compare against the spectra from other ROIs. Other rectan-gular ROIs are defined in Fig. 2 along the track direction of the satellite. Average reflectance iscomputed for each ROI on a band-by-band basis using the mean value. The spectra derived fromeach ROI are compared with the reference spectra to assess the spatial stability of the test sites.If there is any fill or saturated pixel value within any ROI, it is excluded in the reflectancecalculation.
4.3 Average Deviation
Once all the ROI spectra are retrieved, the spectral similarity of the selected ROI can be assessedby measuring the reflectance differences between the reference ROI and the other testing ROIsusing all the Hyperion spectral bands. To evaluate the reflectance differences in all the bands, thenormalized average absolute deviation (i.e., AD) is calculated by taking the sum of absolutedifference between the reference spectrum and testing spectra normalized by the number ofbands. Sometimes, median values are used as a robust estimator in median absolute deviationbecause of its little computation time and simple formula.16 In this study, mean values are cal-culated in the reference and testing ROIs to keep the AD values in the reflectance compatiblescale. This AD provides an estimate of the site’s variability as a summary statistics of statisticaldispersion across all wavelengths
AD ¼ 1
nb
Xnbi¼1
jri − tij; (2)
where nb is the number of bands, r is the reference spectrum, and t is the testingspectrum.
Table 3 Summary of number of scenes per year for Libya 4, Mauritania 2, and Libya 1 fromyear 2003 to 2013.
Year 03 04 05 06 07 08 09 10 11 12 13
Libya 4 N/A 14 9 30 48 54 47 27 23 42 8
Mauritania 2 3 10 4 21 15 18 11 11 9 14 1
Libya 1 N/A N/A N/A N/A N/A N/A N/A N/A N/A 18 N/A
Choi et al.: Assessment of the spectral stability of Libya 4, Libya 1, and Mauritania 2 sites. . .
Journal of Applied Remote Sensing 083618-4 Vol. 8, 2014
Downloaded From: http://remotesensing.spiedigitallibrary.org/ on 06/08/2014 Terms of Use: http://spiedl.org/terms
4.4 Spectral Angle Mapper
The SAM has been used to identify a material by measuring the spectral similarity to a referencespectrum in multispectral and hyperspectral images. SAM is used as a measure of spectral sim-ilarity to identify a material for classification.9 Also, it has been used for geological mapping andidentifying the minerals on the ground by referring to the USGS Spectral Library to detect minewaste.17
The reference spectra could be either remotely sensed data or laboratory measurements. Themain advantage of the SAM is that it reduces “apparent reflectance” of the different illuminationor shade effects. The SAM algorithm only uses the spectral angle between testing spectra andreference spectra by treating reflectance values from different bands as vectors. The measuredangle between the reference and testing spectra is calculated as follows:9,10
Fig. 2 True color images of the test sites using Hyperion bands 30, 24, and 16 for red, green, andblue (RGB) compositions, respectively. The ROI “0” is the reference ROI. All other ROIs areselected based on the coverage of the Hyperion collections.
Choi et al.: Assessment of the spectral stability of Libya 4, Libya 1, and Mauritania 2 sites. . .
Journal of Applied Remote Sensing 083618-5 Vol. 8, 2014
Downloaded From: http://remotesensing.spiedigitallibrary.org/ on 06/08/2014 Terms of Use: http://spiedl.org/terms

SAM ¼ cos−1�
~t · ~r
k~tk · k~rk
�¼ cos−1
� Pnbi¼1 ti · riffiffiffiffiffiffiffiffiffiffiffiffiffiffiffiP
nbi¼1 t
2i
p·
ffiffiffiffiffiffiffiffiffiffiffiffiffiffiffiffiPnbi¼1 r
2i
p�: (3)
The SAM computes a spectral angle between the testing and reference spectrum. For a simplecase, an SAM angle is illustrated in Fig. 3 from two band responses as shown as test and refer-ence vectors. When a vector is drawn from the origin through each response in bands 1 and 2, theangle between these two vectors constructs the SAM. The smaller the SAM angle, the moresimilar the reference and testing spectra. This spectral angle is insensitive to changes in theROI illumination (or magnitude), because the increase or decrease of the reflectance levelsis not affecting the angles of the reference or testing vectors as shown in Fig. 3.
5 Results and Analysis
As noted in Table 3, temporal coverage of Libya 4 and Mauritania 2 sites is quite well distributedin last 10 years, whereas only 18 scenes exist in 2012 with the Libya 1 site. Our spectral stabilityanalysis starts from Libya 4 because there are many scenes available compared to other sites. Thetotal numbers of available Hyperion scenes are 302 and 117 for Libya 4 and Mauritania 2 sites,respectively.
For each testing site, an initial usable range of ROIs is checked compared to the referenceROI with the reference collection (as defined in Table 2) excluding the apparently nonuniformROIs with different ground spectra in the EO-1s along-track direction. Once the usable ROIranges are checked, the time and ROI location-dependent spectral stabilities are estimated.
5.1 Spectra Comparisons on the Reference Hyperion Collection
This section provides detailed comparisons between the reference spectrum from the referencecollection and the other spectra from other testing ROIs. For each site, a reference Hyperioncollection is defined in Table 4. This spectrum from the reference ROI on the reference collectionis being used for all the following spectral analyses with AD and SAM methods. The total num-ber of the ROIs including the reference and testing ROIs, mean longitude, latitude range, andapproximate ROI coverage in kilometers are shown in Table 4. The number of ROI and approxi-mate along-track ROI coverages in the Mauritania 2 is almost twice as large as that of Libya 1,
Fig. 3 The concept of spectral angle mapper (SAM) using a simple sensor with two bands.
Table 4 The total number of ROIs, mean longitude, latitude range, and approximate ROI cover-age in kilometers from the reference Hyperion collection.
Sites Year Day Number of ROI Mean lon. Lat. rangeApproximate ROIcoverage (km)
Libya 4 2012 179 59 23.782 28.072 to 29.500 170
Mauritania 2 2012 172 62 −9.262 19.364 to 21.134 204
Libya 1 2012 167 30 13.378 24.099 to 24.981 104
Choi et al.: Assessment of the spectral stability of Libya 4, Libya 1, and Mauritania 2 sites. . .
Journal of Applied Remote Sensing 083618-6 Vol. 8, 2014
Downloaded From: http://remotesensing.spiedigitallibrary.org/ on 06/08/2014 Terms of Use: http://spiedl.org/terms

which is also shown in Fig. 2. These differences are caused by the duration of Hyperion col-lections. In each ROI, there are 196 reflectance values corresponding to each spectral band rang-ing from 0.425 to 2.395 μm at a spectral resolution of 10 nm. Figure 4 shows the mean values and1σ standard deviation ranges as error bars using all the spectra from all the ROIs. The red solidline is the reference spectrum with index “0” from Fig. 2 and averaged profile is shown as dashedblack line. In the first column of Fig. 4, there are common atmospheric absorption features in theHyperion spectral range with some spectral intensity deviations especially in Libya 4 site.
To effectively visualize these differences, 1σ standard deviation plots are generated using allthe ROIs in the second column of Fig. 4. The standard deviations are calculated based on thereflectance difference from the reference spectrum in each ROI. The Libya 4, Mauritania 2, andLibya 1 sites are showing spectral similarities between the reference ROI and other ROIs within�5% of the reflectance difference except some longwave length bands. In addition, the Libya 4site’s spectra are slightly larger values than other sites, which are caused by the different groundmaterials as shown in Fig. 1 on top of the Hyperion collection. These location-dependent outliersare rejected and the method will be discussed in the following section.
5.2 Spectral Stability from AD and SAM on the Reference Hyperion Collection
Since there are some outlier points especially in the Libya 4 sites, the AD and SAM values arecalculated for all the ROIs using the reference Hyperion collection to check specific spectrumdeviation compared to the reference spectrum. The AD and SAM values represent the reflectancedifferences and vector angle differences observed across the 196 Hyperion spectral bands. InFig. 5, the AD and SAM values are zero (denoted by the green diamond symbols), becauseall the AD and SAM results are calculated based on the same reference ROI. The x-axis ofthe figures is based on the center latitudes of the ROIs. The AD values are compatible with theaverage reflectance differences over all the bands by its definition from Eq. (2). In the Libya 4site, the AD values beyond the þ29.5 deg latitude show a significant upward trend. Generally,the AD results are very stable and mostly <0.03 in Fig. 5 and Table 5. The AD values beyond theþ29.5 deg latitude show a significant upward trend in both AD and SAM results, further con-firming that the spectra of these ROIs are different in comparison to the reference ROI. The ROIsbeyond the latitude limit of 29.5 deg will not be considered in further AD and SAM results. TheLibya 4 outlier profiles in Fig. 4 are caused by the sudden spikes near the latitudes of 29.0 and28.2, which have higher reflectance differences compared to the reference ROI. Regardless of the
Fig. 4 Mean and 1σ standard deviation of the Hyperion spectral reflectance responses from allthe ROIs with the reference collection.
Choi et al.: Assessment of the spectral stability of Libya 4, Libya 1, and Mauritania 2 sites. . .
Journal of Applied Remote Sensing 083618-7 Vol. 8, 2014
Downloaded From: http://remotesensing.spiedigitallibrary.org/ on 06/08/2014 Terms of Use: http://spiedl.org/terms

reflectance differences, the ground spectral compositions of the outlier ROIs are very consistentwith that of the reference ROI because the SAM responses remained stable. The SAM values aregradually decreased in the Mauritania 2 site. The mean and STD values are higher than othersites; however, the degree of SAM value change is <0.5 compared to the other sites and the ADshows as very stable in Table 5. Consequently, all the three testing sites are spectrally uniformwith small variations in AD and SAM values, <0.03 and 3 deg, respectively.
5.3 Time-Dependent Spectral Stability and Cloudy Scene Filtering
Figure 6 shows the time series SAM and AD results without applying any filtering. Apparentlythere are some cloudy scenes, which produced very large differences up to 40 deg with SAM and0.35 with AD values. In this AD and SAM analysis, all the 198 bands’ reflectance values areapplied without separating ETM+ band ranges. Figure 6 shows all the SAM and AD values inLibya 4 site from year 2003 to 2013 with days from 2003, i.e., “Ep 2003” in the x-axis. In eachHyperion collection or a specific location in the plot, there are approximately 60 points from thenumber of ROIs for the Libya 4 site. Whenever a collection was made on a clear cloud-free day,the SAM and AD values are <10 and 0.1, which was based on the visual check with natural colorimages. Especially in Fig. 6, the SAM and AD values were <10 deg and 0.1 with the clear daycollections near the day 400 and 4000 in the x-axis. On the contrary, the SAM value reached at
Fig. 5 The AD and SAM results using all the bands in a Hyperion collection.
Table 5 The mean and standard deviation values of AD and SAM.
Sites
Result
AD (reflectance) SAM (deg)
Mean STD Mean STD
Libya 4a 0.013 0.007 1.345 0.388
Mauritania 2 0.011 0.003 1.695 0.502
Libya 1 0.014 0.007 1.186 0.342
aLibya 4 results are calculated from the ROIs <29.5 deg.
Choi et al.: Assessment of the spectral stability of Libya 4, Libya 1, and Mauritania 2 sites. . .
Journal of Applied Remote Sensing 083618-8 Vol. 8, 2014
Downloaded From: http://remotesensing.spiedigitallibrary.org/ on 06/08/2014 Terms of Use: http://spiedl.org/terms
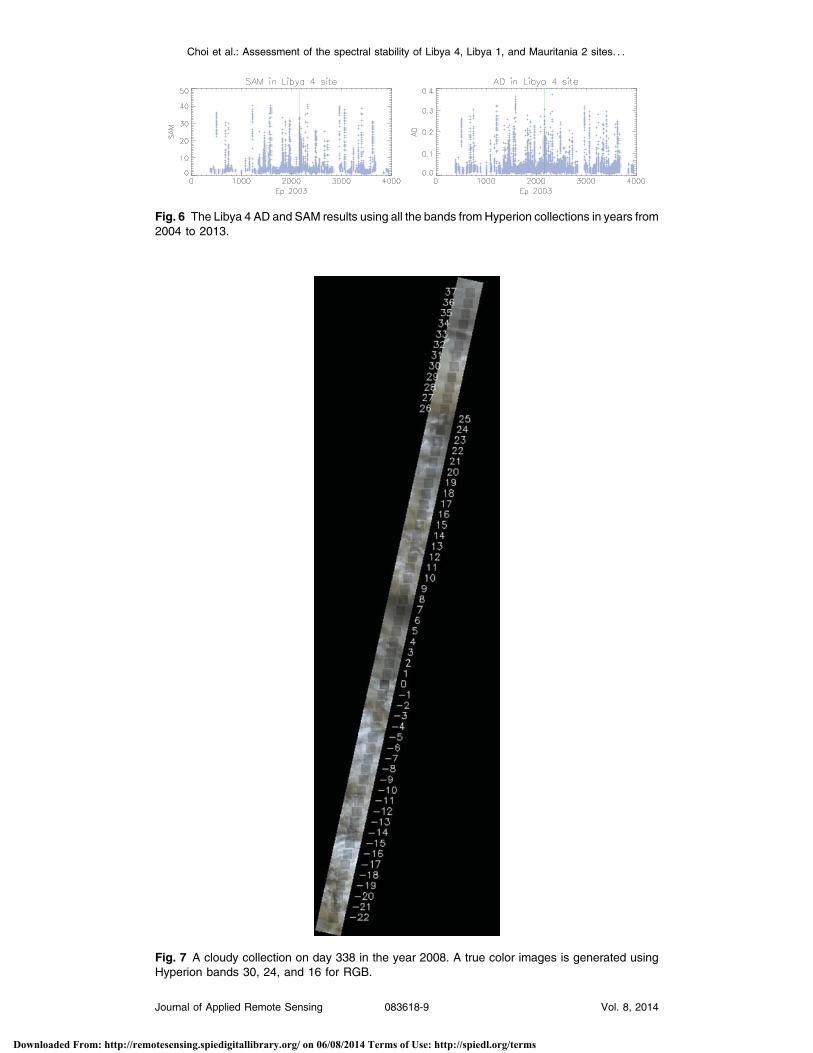
Fig. 6 The Libya 4 AD and SAM results using all the bands fromHyperion collections in years from2004 to 2013.
Fig. 7 A cloudy collection on day 338 in the year 2008. A true color images is generated usingHyperion bands 30, 24, and 16 for RGB.
Choi et al.: Assessment of the spectral stability of Libya 4, Libya 1, and Mauritania 2 sites. . .
Journal of Applied Remote Sensing 083618-9 Vol. 8, 2014
Downloaded From: http://remotesensing.spiedigitallibrary.org/ on 06/08/2014 Terms of Use: http://spiedl.org/terms
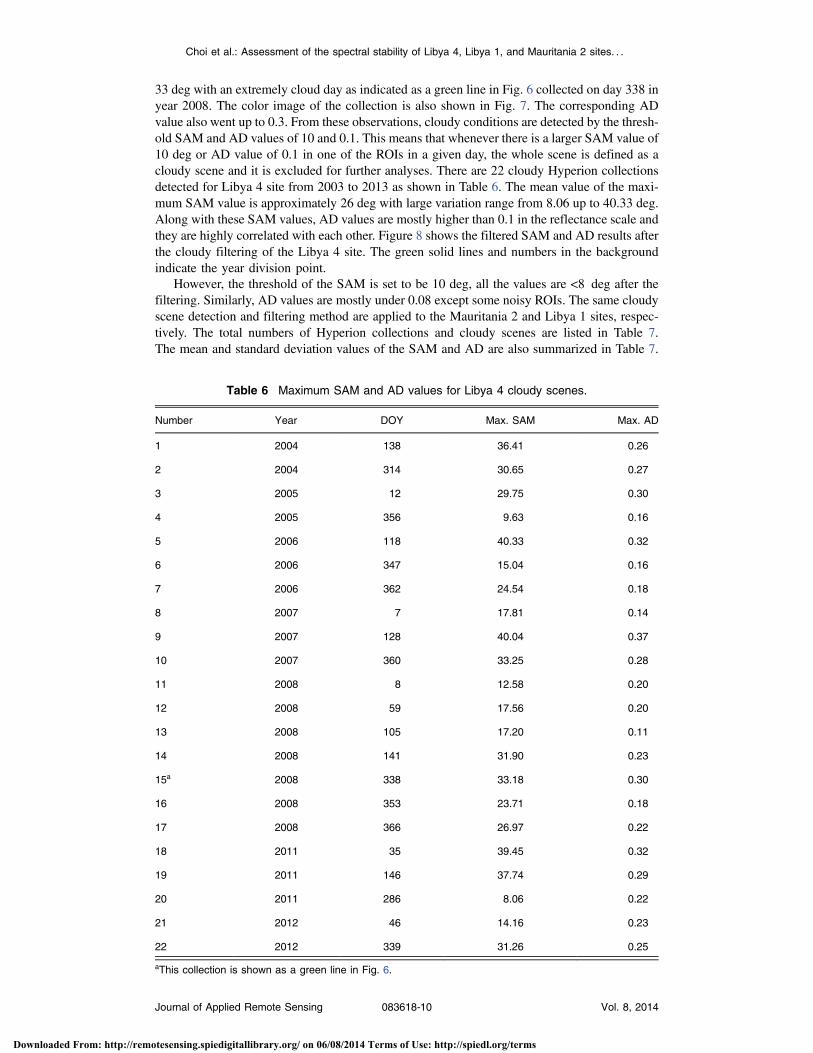
33 deg with an extremely cloud day as indicated as a green line in Fig. 6 collected on day 338 inyear 2008. The color image of the collection is also shown in Fig. 7. The corresponding ADvalue also went up to 0.3. From these observations, cloudy conditions are detected by the thresh-old SAM and AD values of 10 and 0.1. This means that whenever there is a larger SAM value of10 deg or AD value of 0.1 in one of the ROIs in a given day, the whole scene is defined as acloudy scene and it is excluded for further analyses. There are 22 cloudy Hyperion collectionsdetected for Libya 4 site from 2003 to 2013 as shown in Table 6. The mean value of the maxi-mum SAM value is approximately 26 deg with large variation range from 8.06 up to 40.33 deg.Along with these SAM values, AD values are mostly higher than 0.1 in the reflectance scale andthey are highly correlated with each other. Figure 8 shows the filtered SAM and AD results afterthe cloudy filtering of the Libya 4 site. The green solid lines and numbers in the backgroundindicate the year division point.
However, the threshold of the SAM is set to be 10 deg, all the values are <8 deg after thefiltering. Similarly, AD values are mostly under 0.08 except some noisy ROIs. The same cloudyscene detection and filtering method are applied to the Mauritania 2 and Libya 1 sites, respec-tively. The total numbers of Hyperion collections and cloudy scenes are listed in Table 7.The mean and standard deviation values of the SAM and AD are also summarized in Table 7.
Table 6 Maximum SAM and AD values for Libya 4 cloudy scenes.
Number Year DOY Max. SAM Max. AD
1 2004 138 36.41 0.26
2 2004 314 30.65 0.27
3 2005 12 29.75 0.30
4 2005 356 9.63 0.16
5 2006 118 40.33 0.32
6 2006 347 15.04 0.16
7 2006 362 24.54 0.18
8 2007 7 17.81 0.14
9 2007 128 40.04 0.37
10 2007 360 33.25 0.28
11 2008 8 12.58 0.20
12 2008 59 17.56 0.20
13 2008 105 17.20 0.11
14 2008 141 31.90 0.23
15a 2008 338 33.18 0.30
16 2008 353 23.71 0.18
17 2008 366 26.97 0.22
18 2011 35 39.45 0.32
19 2011 146 37.74 0.29
20 2011 286 8.06 0.22
21 2012 46 14.16 0.23
22 2012 339 31.26 0.25
aThis collection is shown as a green line in Fig. 6.
Choi et al.: Assessment of the spectral stability of Libya 4, Libya 1, and Mauritania 2 sites. . .
Journal of Applied Remote Sensing 083618-10 Vol. 8, 2014
Downloaded From: http://remotesensing.spiedigitallibrary.org/ on 06/08/2014 Terms of Use: http://spiedl.org/terms

The Libya 1 site provides the most stable SAM and AD results; however, the number ofHyperion collections is significantly smaller than other sites. It is not statically fair comparingwith other sites because of the small number of collections but Libya 1 site provides very stablespectral results from the SAM and AD results over a year range.
The Libya 4 site also provides very stable and similar results to the Libya 1 site, even thoughthe Libya 4 results are calculated from a larger number of scenes. The mean SAM angle differ-ence is 2.52 with very tight standard deviation value of 1.06. The AD result is also very smallmean value of 2.6% with 1.2% standard deviation in the reflectance scale. The Libya 4 siteproduces slightly higher mean and standard deviation in SAM and AD analysis than the resultsfrom the Libya 1 site, but both sites are still a spectrally very stable and having similar stabilitieswhen interannual variations are considered.
After the cloudy scene rejection filtering, there are 117 Hyperion collections used. Over adecadal analysis, the rate of cloudy scene is approximately two times higher than Libya 4 site.In conjunction to the atmospheric condition, the mean and standard deviation values are largerthan the two Libyan sites as shown in Table 7. The difference in the mean value suggests theconstant angle or reflectance offset compared to the reference spectrum. The actual stabilities inthe SAM and AD are captured by the standard deviations. The SAM standard deviation increaserate from Libya 4 to Mauritania 2 sites is from 1.06 to 1.99 deg, which is 87.7% increase. In thesame way, the AD increase rate is 33.3%. From these two increase rates, the SAM technique ismore sensitive than the AD method.
5.4 ROI Location-Dependent Spectral Stability Estimations
Besides the temporal analysis, ROI location-based spectral stability of the selected testing sites isalso evaluated using the cloud-filtered Hyperion collections. Due to different start time of eachHyperion granule, slightly varying ROI coverages are obtained in the along-track direction. Acommon latitude range is chosen for each site as shown in Fig. 2. The ROIs above 29.5 deg arenot included in Libya 4 site as mentioned earlier, which reduced about 11 ROIs above the latitudelimit. For the Libya 4 and Mauritania 2 sites, 10-year collections are used to calculate mean andstandard deviation of SAM and AD for each ROI location, respectively. For the Libya 1 site, only1 year collations in 2012 are used. Figure 9 shows SAM and AD results at the center latitudes ofthe ROIs in the x-axis. In all sites, the mean SAM angles are very stable at specific average levels
Fig. 8 The Libya 4 AD and SAM results using all the bands in a Hyperion collections.
Table 7 SAM and AD results in Libya 4, Mauritania 2, and Libya 1 sites with cloud rejectionfiltering.
Site Libya 4 Mauritania 2 Libya 1
Time range 2004 to 2013 2003 to 2012 2012
Number of scenes 302 117 19
Number of cloudy scene 22 18 2
Lifetime SAM mean� 1σ 2.51� 1.06 4.12� 1.99 2.24� 0.77
Lifetime AD mean� 1σ 2.6%� 1.2% 3.2%� 1.6% 2.6%� 1.1%
Choi et al.: Assessment of the spectral stability of Libya 4, Libya 1, and Mauritania 2 sites. . .
Journal of Applied Remote Sensing 083618-11 Vol. 8, 2014
Downloaded From: http://remotesensing.spiedigitallibrary.org/ on 06/08/2014 Terms of Use: http://spiedl.org/terms

from all the ROIs. The maximum differences in the averaged SAM angles from all the ROIs are0.44, 0.46, and 0.33 deg in Libya 4, Mauritania 2, and Libya 1 site, respectively. The corre-sponding maximum differences with the averaged AD values are 1.37%, 2.05%, and 0.81%.The average of SAM mean, SAM STD, AD mean, and AD STD values are angles of thetwo Libyan sites are summarized in Table 8. Under the condition that the average of meanSAM is just showing a stable and constant offset from the reference spectrum, the averageof SAM STD represents level of stability over the testing period. Over the 10 years of collections,the averaged STD value of the Libya 4 site is 0.95 deg less than Mauritania 2 site. As a result ofit, mean AD trending in this site showing larger variation along with the track direction ROIs inFig. 9. The mean of STD result in the Mauritania 2 site is also higher than other two Libyan sitesin Table 8. Even though the Mauritania 2 site shows higher variations in SAM and AD results,overall ROI spectral stability is excellent in SAM analysis with very stable and mean and STDresults with very small variations in all the three testing sites. As a cross validation, the locationdependent results shown in Table 8 are very similar to the time-dependent results with Table 7.
Fig. 9 ROI location based spectral stability from SAM and AD methods. The error bars representthe 1σ range and the green diamond symbol represents the reference ROI location in the specificsite.
Table 8 Average of SAMmean, SAM STD, AD mean, and AD STD for Libya 4, Mauritania 2, andLibya 1 sites after cloud-rejection filtering.
Site Average
SAM mean SAM STD AD mean AD STD
Libya 4 2.49 1.05 0.0249 0.0111
Mauritania 2 4.11 2.00 0.0319 0.0150
Libya 1 2.22 0.77 0.0248 0.0105
Choi et al.: Assessment of the spectral stability of Libya 4, Libya 1, and Mauritania 2 sites. . .
Journal of Applied Remote Sensing 083618-12 Vol. 8, 2014
Downloaded From: http://remotesensing.spiedigitallibrary.org/ on 06/08/2014 Terms of Use: http://spiedl.org/terms

6 Conclusion
The on-orbit spectral stability of the selected CEOS PICS (Libya 4, Mauritania 2, and Libya 1) isevaluated by using hyperspectral collections from EO-1 Hyperion. Ten years of Hyperion col-lections over Libya 4 and Mauritania 2 sites, and 1-year collections over the Libya 1 site, wereprocessed. A set of ROIs with a dimension of 2.9 × 2.9 km are defined in the satellite trackdirection in each site. A reference ROI is selected in the year 2012 which is a smaller subsetor near of the CEOS target ranges and it is served as the baseline spectrum to estimate spectralstability using the AD and SAM methods.
Within the Libya 4 site, the ROIs below 29.5-deg latitude are used because of the rapidground spectra changes above the limit. Cloud-contaminated scenes are identified and filteredby the SAM and AD threshold values of 10 deg and 0.1, respectively, in the three sites. Thetime-dependent SAM and AD values are very stable mostly within �2.0 deg and �1.7% inthe reflectance scale, when the standard deviations are considered at constant mean levels.The ROI location-dependent results are very stable over the testing period in all three sites.The maximum variation ranges of the SAM and AD values are very small within 0.5 deg and2.5%. It also suggests the limited spatial stability along the narrow swath of the Hyperion trackdirection is very stable in terms of SAM and AD. The mean of location-dependent SAM and AD1σ standard deviations are within �2.0 deg and �1.5%. Consequently, the Libya 4, Mauritania2, and Libya 1 sites are spectrally very stable targets within �2 deg of SAM and �1.7% of AD1σ standard deviation from all the available Hyperion collections and different ROI locations ata stable mean levels.
References
1. G. Chander et al., “Online catalogue of world-wide test sites for the post-launch charac-terization and calibration of optical sensors,” in Int. Astronautical Federation—58th Int.Astronautical Congress, Paris, France, pp. 2043–2051 (2007).
2. G. Chander et al., “An assessment of African test sites in the context of a global network ofquality-assured reference standards,” in IEEE Int. Geoscience and Remote SensingSymposium 2009 (IGARSS 2009), Piscataway, New Jersey, Vol. 5, pp. 236–239 (2009).
3. P. M. Teillet and G. Chander, “Terrestrial reference standard sites for postlaunch sensor cal-ibration,” Can. J. Remote Sens. 36(5), 437–450 (2010), http://dx.doi.org/10.5589/m10-079.
4. G. Chander et al., “Preliminary assessment of several parameters to measure and compareusefulness of the CEOS reference pseudo-invariant calibration sites,” Proc. SPIE 7826,78262L (2010), http://dx.doi.org/10.1117/12.865166.
5. P. Campbell et al., “EO-1 hyperion reflective time series at calibration and validation sites:stability and sensitivity to seasonal dynamics,” IEEE J. Sel. Top. Appl. Earth Obs. RemoteSens. 6(2), 276–290 (2013), http://dx.doi.org/10.1109/JSTARS.2013.2246139.
6. P. Teillet et al., “Prime candidate earth targets for the post-launch radiometric calibration ofspace-based optical imaging instruments,” Proc. SPIE 6677, 66770S (2007), http://dx.doi.org/10.1117/12.733156.
7. S. Lacherade et al., “Cross calibration over desert sites: description, methodology, andoperational implementation,” IEEE Trans. Geosci. Remote Sens. 51(3), 1098–1113 (2013),http://dx.doi.org/10.1109/TGRS.2012.2227061.
8. T. Choi et al., “Spectral stability of the Libya 4 site using EO-1 Hyperion,” Proc. SPIE 8724,872410 (2013), http://dx.doi.org/10.1117/12.2016644.
9. F. A. Kruse et al., “The spectral image processing system (SIPS)—interactive visualizationand analysis of imaging spectrometer data,” Remote Sens. Environ. 44(2–3), 145–163(1993), http://dx.doi.org/10.1016/0034-4257(93)90013-N.
10. R. H. Yuhas, A. F. H. Goetz, and J. W. Boardman, “Discrimination among semiarid land-scape endmembers using the spectral angle mapper (SAM) algorithm,” in Summaries of theThird Annual JPL Airborne Geoscience Workshop, Vol. 1, pp. 147–149, JPL Publication,Pasadena, California (1992).
11. E. Middleton et al., “The Earth Observing One (EO-1) satellite mission: over a decade inspace,” IEEE J. Sel. Top. Appl. Earth Obs. Remote Sens. 6(2), 243–256 (2013), http://dx.doi.org/10.1109/JSTARS.2013.2249496.
Choi et al.: Assessment of the spectral stability of Libya 4, Libya 1, and Mauritania 2 sites. . .
Journal of Applied Remote Sensing 083618-13 Vol. 8, 2014
Downloaded From: http://remotesensing.spiedigitallibrary.org/ on 06/08/2014 Terms of Use: http://spiedl.org/terms

12. H. Cosnefroy, M. Leroy, and X. Briottet, “Selection and characterization of Saharan andArabian Desert sites for the calibration of optical satellite sensors,” Remote Sens. Environ.58(1), 101–114 (1996), http://dx.doi.org/10.1016/0034-4257(95)00211-1.
13. G. Chander et al., “Online catalog of world-wide test sites for the post-launch characteri-zation and calibration of optical sensors,” in Proc. 58th Int. Astronautical Congr.,Hyderabad, India, pp. 2043–2051 (2007).
14. S. Lachérade et al., “Cross-calibration over desert sites: description, methodology andoperational implementation,” IEEE Trans. Geosci. Remote Sens. 51(3), 1098–1113(2013), http://dx.doi.org/10.1109/TGRS.2012.2227061.
15. G. Thuillier et al., “The solar spectral irradiance from 200 to 2400 nm as measured bythe SOLSPEC spectrometer from the ATLAS and EURECA missions,” Solar Phys.214(1), 1–22 (2003), http://dx.doi.org/10.1023/A:1024048429145.
16. P. J. Rousseeuw and C. Croux, “Alternatives to the median absolute deviation,” J. Am.Stat. Assoc. 88(424), 1273–1283 (1993), http://dx.doi.org/10.1080/01621459.1993.10476408.
17. I. McCubbin et al., “Mineral mapping using partial unmixing at ray mine, AZ,” in 7thAnnual Airborne Earth Science Workshop, Pasadena, California (1998).
Taeyoung Choi received a BS degree in electronics from Kon-Kuk University in the Republic ofKorea and an MS degree in electrical engineering at South Dakota State University, USA. He is aPhD candidate at George Mason University and currently works for NOAA performing radio-metric calibrations for S-NPP VIIRS with ERT Corp. He has been working in remotesensing, instrument calibration, and data applications since 1999 with sensors such as IKONOS,QuickBird, ETM+, ALI, Hyperion, MODIS, and VIIRS.
Xiaoxiong Xiong is an optical physicist at NASA Goddard Space Flight Center (GSFC). He iscurrently serving as the MODIS project scientist and the technical lead for the MODISCharacterization Support Team (MCST) and the VIIRS Calibration Support Team (VCST).In addition to sensor calibration, He had also worked in the fields of optical instrumentation,nonlinear optics, laser and atomic spectroscopy, and resonance ionization mass spectrometry.
Amit Angal received an MS degree in electrical engineering from South Dakota StateUniversity, Brookings, South Dakota. He is currently a senior instrument engineer withScience Systems and Applications, Inc., primarily working with on the radiometric characteri-zation and calibration of the reflective solar bands of the MODIS instruments on board the Terraand Aqua spacecrafts. His research interests include sensor cross-calibration and validation.
Gyanesh Chander received the PhD in geospatial science and engineering with specialization inremote sensing engineering, and an MS degree in electrical engineering from South Dakota StateUniversity, Brookings. He joined the NASA GSFC in Greenbelt, Maryland, to support the JointPolar Satellite System Ground Project as the data products engineering and services manager.Previously, he served as a principal systems engineer with SGT, Inc., at the USGS EarthResources Observation and Science Center in South Dakota.
John J. Qu is a professor in the College of Science at George Mason University, USA. He is thefounder and director of the Global Environment and Natural Resources Institute (GENRI) andEnvironmental Science and Technology Center, at GMU. He received PhD and MS degrees fromColorado State University and a BS degree from Nanjing Institute of Meteorology, China. Hisresearch areas are satellite remote sensing, atmospheric radiation transfer, environmentsciences, and sustainable energy geo-information system applications.
Choi et al.: Assessment of the spectral stability of Libya 4, Libya 1, and Mauritania 2 sites. . .
Journal of Applied Remote Sensing 083618-14 Vol. 8, 2014
Downloaded From: http://remotesensing.spiedigitallibrary.org/ on 06/08/2014 Terms of Use: http://spiedl.org/terms