ASSESSMENT OF THE RELEVANCE OF INFORMATION …
4
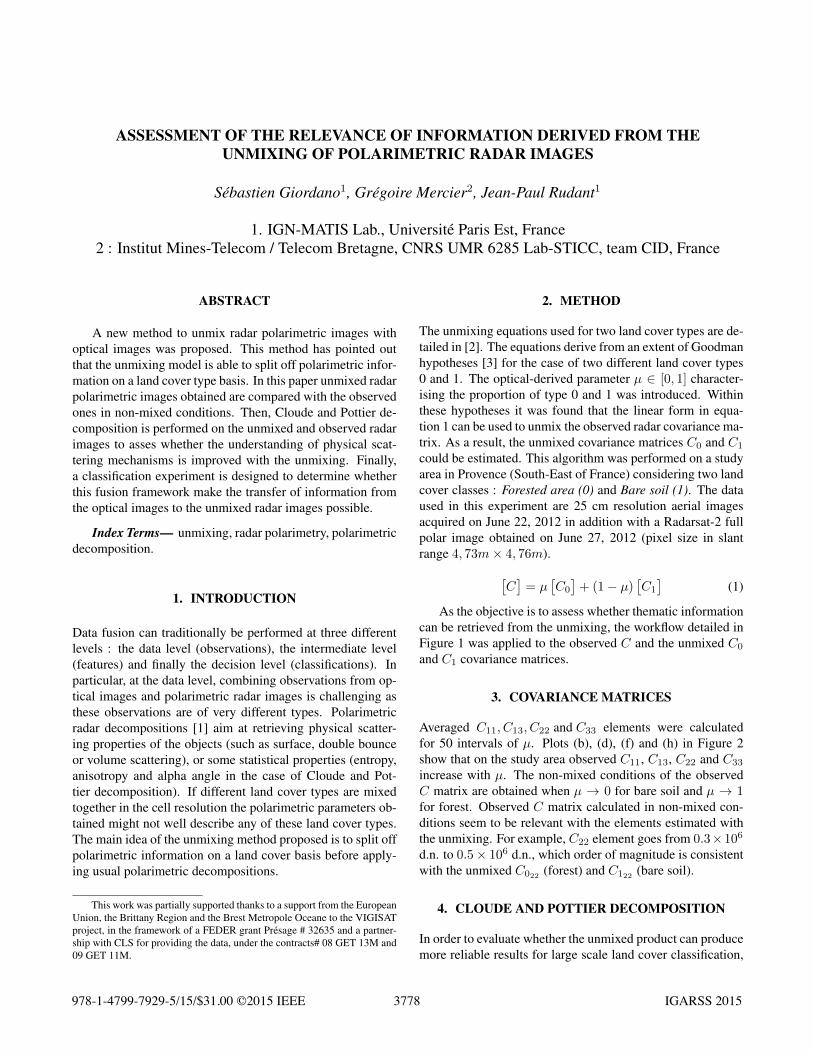
ASSESSMENT OF THE RELEVANCE OF INFORMATION DERIVED FROM THE UNMIXING OF POLARIMETRIC RADAR IMAGES S´ ebastien Giordano 1 , Gr´ egoire Mercier 2 , Jean-Paul Rudant 1 1. IGN-MATIS Lab., Universit´ e Paris Est, France 2 : Institut Mines-Telecom / Telecom Bretagne, CNRS UMR 6285 Lab-STICC, team CID, France ABSTRACT A new method to unmix radar polarimetric images with optical images was proposed. This method has pointed out that the unmixing model is able to split off polarimetric infor- mation on a land cover type basis. In this paper unmixed radar polarimetric images obtained are compared with the observed ones in non-mixed conditions. Then, Cloude and Pottier de- composition is performed on the unmixed and observed radar images to asses whether the understanding of physical scat- tering mechanisms is improved with the unmixing. Finally, a classification experiment is designed to determine whether this fusion framework make the transfer of information from the optical images to the unmixed radar images possible. Index Terms— unmixing, radar polarimetry, polarimetric decomposition. 1. INTRODUCTION Data fusion can traditionally be performed at three different levels : the data level (observations), the intermediate level (features) and finally the decision level (classifications). In particular, at the data level, combining observations from op- tical images and polarimetric radar images is challenging as these observations are of very different types. Polarimetric radar decompositions [1] aim at retrieving physical scatter- ing properties of the objects (such as surface, double bounce or volume scattering), or some statistical properties (entropy, anisotropy and alpha angle in the case of Cloude and Pot- tier decomposition). If different land cover types are mixed together in the cell resolution the polarimetric parameters ob- tained might not well describe any of these land cover types. The main idea of the unmixing method proposed is to split off polarimetric information on a land cover basis before apply- ing usual polarimetric decompositions. This work was partially supported thanks to a support from the European Union, the Brittany Region and the Brest Metropole Oceane to the VIGISAT project, in the framework of a FEDER grant Pr´ esage # 32635 and a partner- ship with CLS for providing the data, under the contracts# 08 GET 13M and 09 GET 11M. 2. METHOD The unmixing equations used for two land cover types are de- tailed in [2]. The equations derive from an extent of Goodman hypotheses [3] for the case of two different land cover types 0 and 1. The optical-derived parameter μ ∈ [0, 1] character- ising the proportion of type 0 and 1 was introduced. Within these hypotheses it was found that the linear form in equa- tion 1 can be used to unmix the observed radar covariance ma- trix. As a result, the unmixed covariance matrices C 0 and C 1 could be estimated. This algorithm was performed on a study area in Provence (South-East of France) considering two land cover classes : Forested area (0) and Bare soil (1). The data used in this experiment are 25 cm resolution aerial images acquired on June 22, 2012 in addition with a Radarsat-2 full polar image obtained on June 27, 2012 (pixel size in slant range 4, 73m × 4, 76m). C = μ C 0 + (1 - μ) C 1 (1) As the objective is to assess whether thematic information can be retrieved from the unmixing, the workflow detailed in Figure 1 was applied to the observed C and the unmixed C 0 and C 1 covariance matrices. 3. COVARIANCE MATRICES Averaged C 11 ,C 13 ,C 22 and C 33 elements were calculated for 50 intervals of μ. Plots (b), (d), (f) and (h) in Figure 2 show that on the study area observed C 11 , C 13 , C 22 and C 33 increase with μ. The non-mixed conditions of the observed C matrix are obtained when μ → 0 for bare soil and μ → 1 for forest. Observed C matrix calculated in non-mixed con- ditions seem to be relevant with the elements estimated with the unmixing. For example, C 22 element goes from 0.3 × 10 6 d.n. to 0.5 × 10 6 d.n., which order of magnitude is consistent with the unmixed C 022 (forest) and C 122 (bare soil). 4. CLOUDE AND POTTIER DECOMPOSITION In order to evaluate whether the unmixed product can produce more reliable results for large scale land cover classification, 3778 978-1-4799-7929-5/15/$31.00 ©2015 IEEE IGARSS 2015
Transcript of ASSESSMENT OF THE RELEVANCE OF INFORMATION …
ASSESSMENT OF THE RELEVANCE OF INFORMATION DERIVED FROM THEUNMIXING OF POLARIMETRIC RADAR IMAGES
Sebastien Giordano1, Gregoire Mercier2, Jean-Paul Rudant1
1. IGN-MATIS Lab., Universite Paris Est, France2 : Institut Mines-Telecom / Telecom Bretagne, CNRS UMR 6285 Lab-STICC, team CID, France
ABSTRACT
A new method to unmix radar polarimetric images withoptical images was proposed. This method has pointed outthat the unmixing model is able to split off polarimetric infor-mation on a land cover type basis. In this paper unmixed radarpolarimetric images obtained are compared with the observedones in non-mixed conditions. Then, Cloude and Pottier de-composition is performed on the unmixed and observed radarimages to asses whether the understanding of physical scat-tering mechanisms is improved with the unmixing. Finally,a classification experiment is designed to determine whetherthis fusion framework make the transfer of information fromthe optical images to the unmixed radar images possible.
Index Terms— unmixing, radar polarimetry, polarimetricdecomposition.
1. INTRODUCTION
Data fusion can traditionally be performed at three differentlevels : the data level (observations), the intermediate level(features) and finally the decision level (classifications). Inparticular, at the data level, combining observations from op-tical images and polarimetric radar images is challenging asthese observations are of very different types. Polarimetricradar decompositions [1] aim at retrieving physical scatter-ing properties of the objects (such as surface, double bounceor volume scattering), or some statistical properties (entropy,anisotropy and alpha angle in the case of Cloude and Pot-tier decomposition). If different land cover types are mixedtogether in the cell resolution the polarimetric parameters ob-tained might not well describe any of these land cover types.The main idea of the unmixing method proposed is to split offpolarimetric information on a land cover basis before apply-ing usual polarimetric decompositions.
This work was partially supported thanks to a support from the EuropeanUnion, the Brittany Region and the Brest Metropole Oceane to the VIGISATproject, in the framework of a FEDER grant Presage # 32635 and a partner-ship with CLS for providing the data, under the contracts# 08 GET 13M and09 GET 11M.
2. METHOD
The unmixing equations used for two land cover types are de-tailed in [2]. The equations derive from an extent of Goodmanhypotheses [3] for the case of two different land cover types0 and 1. The optical-derived parameter µ ∈ [0, 1] character-ising the proportion of type 0 and 1 was introduced. Withinthese hypotheses it was found that the linear form in equa-tion 1 can be used to unmix the observed radar covariance ma-trix. As a result, the unmixed covariance matrices C0 and C1
could be estimated. This algorithm was performed on a studyarea in Provence (South-East of France) considering two landcover classes : Forested area (0) and Bare soil (1). The dataused in this experiment are 25 cm resolution aerial imagesacquired on June 22, 2012 in addition with a Radarsat-2 fullpolar image obtained on June 27, 2012 (pixel size in slantrange 4, 73m× 4, 76m).[
C]= µ
[C0
]+ (1− µ)
[C1
](1)
As the objective is to assess whether thematic informationcan be retrieved from the unmixing, the workflow detailed inFigure 1 was applied to the observed C and the unmixed C0
and C1 covariance matrices.
3. COVARIANCE MATRICES
Averaged C11, C13, C22 and C33 elements were calculatedfor 50 intervals of µ. Plots (b), (d), (f) and (h) in Figure 2show that on the study area observed C11, C13, C22 and C33
increase with µ. The non-mixed conditions of the observedC matrix are obtained when µ → 0 for bare soil and µ → 1for forest. Observed C matrix calculated in non-mixed con-ditions seem to be relevant with the elements estimated withthe unmixing. For example, C22 element goes from 0.3×10⁶
d.n. to 0.5× 10⁶ d.n., which order of magnitude is consistentwith the unmixed C022 (forest) and C122 (bare soil).
4. CLOUDE AND POTTIER DECOMPOSITION
In order to evaluate whether the unmixed product can producemore reliable results for large scale land cover classification,
3778978-1-4799-7929-5/15/$31.00 ©2015 IEEE IGARSS 2015

[C0] Forested Area
< 7 × 7 > < 7 × 7 > < 7 × 7 >
[C1] Bare soil [C] Observed
[Cr] = µ[C0] + (1− µ)[C1]
[T0] Forested area [T1] Bare soil [T ] Observed
Pauli0 H0, A0, α0 Pauli1 H1, A1, α1
Segmentation H0/α0 Segmentation H1/α1
Pauli H,A, α
Segmentation H,α
Fig. 1: Polarimetric Radar Decompositions
(a) C011 , C111 (b) C11 (c) C013 , C111 (d) C13
(e) C022 , C122 (f) C22 (g) C033 , C133 (h) C33
Fig. 2: Elements of observed C and unmixed C0 and C1 depending on µ
the (H,α,A) parameters of the Cloude and Pottier decom-position [4] were computed from the the observed covariancematrix C and the unmixed C0 and C1 covariance matrices asdescribed in Figure 1. Figure 3 shows the physical scatter-ing characteristics defined by [4] obtained by segmenting the(H,α) plane.
In addition with the Z6, Z5 and Z2 behaviours that occurin the observed (H/α) segmentation, (H0/α0) segmentationintroduces new types of scattering mechanisms. Z4 scatteringtype traducing dihedral scattering with moderate entropy (for-est double-bounce scattering) appears in the forest when thecanopy cover is low. Isolated trees are characterised by Z7(isolated dihedral scatterers with low entropy) and Z8 (iso-lated dipole scatterer from vegetation) segmentation types.
5. CLASSIFICATION EXPERIMENT
Field work on the study area lead to a 5 classes land covernomenclature : forested area, bare calcareous soil, thymegrassland, annual grass and multiannual grass. An object-based classification was performed on the multi-spectraloptical images considering these 5 thematic classes usingthe µ parameter (optical information) and Cloude and Pottierparameters from the observed radar images (H,A, α) and theunmixed images (H0, A0, α0) and (H1, A1, α1).
On this study area the 5 land cover types can be retrievedwith the optical images, as a result ground truth data was pro-duced with a classification of the optical images. Randomforests importance of variables ([5]) was performed on the
3779

(a) optical NDVI of the study area
(b) H/α segmentation types from the observed T
(c) H0/α0 segmentation types from T0 (forest)
(d) (H1/α1) segmentation types from T1 (bare soil)Z1 Z2 Z3 Z4 Z5 Z6 Z7 Z8 Z9
Fig. 3: Segmentation H/α from T , T0 and T1, colour saturation : µ
datasat. Results are given in Table 1.
Then, a classification using the Random Forest classifier([5]) was performed and evaluated through cross-validation(automatic split of 3856 samples with 40% train, 60% con-trol). Table 3 shows overall precision, recall and F-measureof the classification for 6 combination of parameters definedin Table 2 : optical information (configuration A), observedradar (configuration B), unmixed radar (configuration C),optical information and observed radar (configuration D),optical information and unmixed radar (configuration E), op-tical information, observed and unmixed radar (configuration F).
On the one hand the optical-derived parameter µ is thehighest ranked parameter. It provides the major part of theinformation and leads in configuration A to 0.639 for F-measure.
Table 1: Radar Parameters Importance
Ranking Attribute Importance
1 µ 0.2932 H0 0.1653 H1 0.1104 A0 0.0865 A1 0.0786 α0 0.05607 α 0.0548 α1 0.0549 H 0.05210 A 0.051
3780

Table 2: Configuration
Config. Composition
A µ
B (H,α,A)
C (H0, α0, A0) ∪ (H1, α1, A1)
D µ ∪ (H,α,A)
E µ ∪ (H0, α0, A0) ∪ (H1, α1, A1)
F µ ∪ (H,α,A) ∪ (H0, α0, A0) ∪ (H1, α1, A1)
Table 3: Evaluation
Configuration Precision Recall F-Measure
A 0.615 0.666 0.639
B 0.348 0.379 0.363
C 0.593 0.664 0.626
D 0.665 0.729 0.696
E 0.684 0.735 0.709
F 0.683 0.738 0.709
On the other hand observed (H,α,A) parameters (con-figuration B) lead to poorer classification precision whereasF-measure of unmixed radar (configuration C) is close tothe configuration A F-measure. The first conclusion thatcan be drawn is that information from optical images seemsto be correctly transferred in the fusion process. Moreover,(H0, α0, A0) and (H1, α1, A1) are more significant than(H,α,A) for classification (Table 1).
Combination of radar and optical images produces thebest classification results either µ parameter is combined withthe observed radar or the unmixed radar parameters.
As a result we cannot conclude that greater informationhas been produced with the unmixing. Indeed ground truthwas done using optical images and the optical-derived pa-rameter µ is by itself discriminating. An another experimenthas to been designed. For instance, we hope to prove thatthe unimixing algorithm can improve vegetation volume orcanopy cover estimation with radar polarimetry. In that par-ticular case, ground truth can be done using aerial LiDAR data(available on this area) and optical images can only be usedto distinguish between soil and forest land cover types.
6. REFERENCES
[1] S. R. Cloude and E. Pottier, “A review of target decompo-sition theorems in radar polarimetry,” IEEE Transactionson Geoscience and Remote Sensing, vol. 34, no. 2, pp.498–518, Mar. 1996.
[2] S. Giordano, G. Mercier, and J.-P. Rudant, “Unmixingpolarimetric radar images based on land cover type beforetarget decomposition,” in IGARSS, 2014, pp. 2790–2793.
[3] J. W. Goodman, “Statistical properties of laser specklepatterns,” Laser speckle and related phenomena, vol. 9,pp. 9–75, 1975.
[4] S. R. Cloude and E. Pottier, “An entropy based classifica-tion scheme for land applications of polarimetric SAR.,”IEEE Transactions on Geoscience and Remote Sensing,vol. 35, no. 1, pp. 68–78, 1997.
[5] L. Breiman, “Random forests,” Machine Learning, vol.45, no. 1, pp. 5–32, 2001.
3781