Assessment of the oroville Vegetation Area on the Face of ... · OROVILLE DAM SEEPAGE COLLECTION 2...
28
2017 CALIFORNIA DEPARTMENT OF WATER RESOURCES Assessment of the Vegetation Area on the Face of the Oroville Dam August 30, 2017
Transcript of Assessment of the oroville Vegetation Area on the Face of ... · OROVILLE DAM SEEPAGE COLLECTION 2...

2017
C A L I F O R N I A D E P A R T M E N T O F W A T E R R E S O U R C E S
Assessment of the Vegetation Area on the Face of the Oroville Dam August 30, 2017

TABLE OF CONTENTS
1. INTRODUCTION 4 1.1 Background 4
1.2 Visible Vegetation on the face of Oroville Dam 5
1.3 Dam Construction 6
1.4 Seepage Monitoring Reviews 7
2. OROVILLE DAM SEEPAGE COLLECTION 9 2.1 Design Features 9
2.2 Performance Monitoring Instrumentation 11
2.3 Rainfall Effects on Seepage 14
3. ASSESSMENT OF THE VEGETATION AREA 16 3.1 Description of the Vegetation Area 16
4. SUMMARY ASSESSMENT OF THE VEGETATION AREA 24 4.1 Evaluation of Potential Seepage 24
4.2 Source of Water for the Vegetation Area 25
4.3 Effects of the Vegetation Area on Dam 25
5. REFERENCES 26

FIGURES
FIGURE 1. Aerial Photograph of Oroville Dam 5
FIGURE 2. View of vegetation on the downstream face of Oroville Dam
(Photograph taken on March 9, 2011, near the end of the rain season) 6
FIGURE 3. Low Saturation/Seepage Line Resulting when an Embankment Dam has a Central Core that is
1,000 times or more Less Pervious than Outer Shell Material (adapted from Cedergren, 1997) 9
FIGURE 4. Cross Section of Oroville Dam illustrating Designed Seepage Barriers and Seepage Collection System 10
FIGURE 5. View of Seepage Measuring Vault which contains a Measuring Weir, and Interior Low Water Pool Level
within Oroville Dam. (Photograph taken on April 22, 2017, when seepage fow was approximately
53 gallons per minute, a relatively low seepage amount) 11
FIGURE 6. Cross Section of Oroville Dam illustrating Water Levels Indicated by Downstream Piezometers between
1968 and mid-1980s 12
FIGURE 7. Cross Section of Oroville Dam illustrating Water Levels Indicated by Downstream Cross-Arm Settlement
Devices in 1960s and 1970s 13
FIGURE 8. Cross Section of Oroville Dam illustrating Water Level Indicated by Downstream Toe Seepage Weir -
1960s to Present 13
FIGURE 9. Water Year 2015-2016 Rainfall and Seepage Measurements made at the Seepage Weir Located at the
Base of Oroville Dam 14
Figure 9 was corrected on 9.14.2017 to refect the accurate gallons per minute that drains
annually into the toe seepage weir of Oroville Dam.
FIGURE 10. 2006-2016 Rainfall and Seepage Measurements made at the Seepage Weir Located at the Base of Oroville Dam 15
FIGURE 11. Lines of wet areas, ponded water, and erosion rills prior to initial flling of the reservoir in future vegetation
area. (Construction photograph taken on November 22, 1966) 17
FIGURE 12. Vegetation area showing lines of wet areas and erosion rills prior to initially flling the reservoir
(Construction photographs taken in January 1967) 18
FIGURE 13. Photographs of Ponded Water on the Construction Surface within the Vegetation Area Elevation Range 19
FIGURE 14. Photographs of the vegetation area taken during the wet seasons over several decades 20
FIGURE 15. Photographs of the vegetation area taken during summer months 21
FIGURE 16. Eroded rills or gullies in the vegetation area that were flled with cobbles. This encourages rain water
percolation into the fll instead of running down the slope (Photographs taken January 20, 2017) 22
A u g u s t 3 0 , 2 0 1 7 | iii

1
INTRODUCTION
This report documents the history and impact of vegetation occasionally visible on the face of Oroville Dam. The report
summarizes information collected during original construction and design of the dam, as well as ongoing performance
monitoring information regarding seepage collected over fve decades since construction.
1.1 BACKGROUND Oroville Dam is an earthfll embankment dam built from clay, rock and other natural materials that sits on the Feather
River in Butte County in Northern California.
Oroville Dam is the tallest dam in the United States, rising 770 feet tall and stretching approximately 5,600 feet across.
In comparison, Oroville Dam is 44 feet taller than Hoover Dam in Nevada and slightly longer than 19 football felds.
It was designed and constructed by the California Department of Water Resources (DWR) in the 1960s and is owned,
operated and maintained by DWR.
Oroville Dam is the largest water storage facility in the State Water Project. The operation, maintenance, and safety of
Oroville Dam is overseen and regulated by the California Division of Safety of Dams (DSOD) and the Federal Energy
Regulatory Commission (FERC).
Lake Oroville was created by the impoundment of the North, Middle, West and South Forks of the Feather River by
Oroville Dam. With 3.5 million acre-feet of water of storage capacity, Lake Oroville is the second largest reservoir in
California behind Lake Shasta. Aside from the benefts of food control, water storage, releases from the reservoir help
with downstream water quality for fsh and salinity control in the Delta. Lake Oroville is also one of the State’s premier
recreation areas for boating, camping and fshing, and is an important wildlife preservation area.
The majority of water releases from Lake Oroville are controlled through a separate concrete spillway called the Lake
Oroville Flood Control Outlet Spillway, or “main spillway.” The main spillway is separate from the face of Oroville
Dam. This is different from many familiar dams like Hoover Dam or Folsom Dam that have their main spillways over
the crests of the dams.
Adjacent to the main spillway is the emergency spillway, which releases water if reservoir levels top 901 feet. Unlike
the main spillway, which is controlled by radial gates that open and close, the emergency spillway is a curved wall that
water fows over – like the edge of a bathtub.
4 | A S S E S S M E N T O F T H E V E G E TAT I O N A R E A O N T H E FA C E O F O R O V I L L E DA M

FIGURE 1. Aerial Photograph of Oroville Dam
1.2 VISIBLE VEGETATION ON THE FACE OF OROVILLE DAM Since the mid-1960s, before original construction was complete, a band of vegetation has grown along the face of
Oroville Dam during wet seasons. This band is approximately 100 to 150 feet wide, and generally located between
elevation 570 and 670 feet, on the upper midpoint of the dam slope (see Figure 2). The area runs across the entire
width of the dam, but is more concentrated on the right, looking upstream toward the reservoir. The vegetation area
dries out during the hot summer months, turning yellow or brown during the dry season and becomes less visible. The
cycle begins again during the next wet season.
A u g u s t 3 0 , 2 0 1 7 | 5

FIGURE 2. View of vegetation on the downstream face of Oroville Dam. (Photograph taken on March 9, 2011, near the end of the rain season)
March 9, 2011
1
1.3 DAM CONSTRUCTION Oroville Dam is an earthfll embankment dam built from clay, rock and other natural materials. The dam is comprised
of different zones of tightly compacted material, which increases the density of the structure, making it more
impervious to seepage.
Zone 1 is located in the very center of the dam. This central clayey core is approximately 27-feet-wide at the top of the
dam and almost 300-feet-wide at the bottom of the core and was constructed in 10-inch layers compacted to a high
density. Based on nearly 2,000 tests completed during original dam construction, DWR found that the average density
in Zone 1 was 100 percent of DWR’s Standard Maximum Density, meaning the core is very dense and almost completely
impervious to seepage or leaking. Another 70 tests showed that the average permeability of the constructed clayey core
was 10 times more impervious than what engineers originally considered during the Oroville Dam design phase.
DWR calculates seepage using the following parameter: k = 0.0002 feet/day, with “k” representing the mean
permeability rate measured for samples obtained during construction. Using this value, the measured permeability of
6 | A S S E S S M E N T O F T H E V E G E TAT I O N A R E A O N T H E FA C E O F O R O V I L L E DA M

I N T R O D U C T I O N
the clayey core is approximately 2 million times more impervious than the bulk of the dam, including the downstream
face of the dam where vegetation is located.
For comparison, the average permeability of the clayey core is 10 times more impervious than the material placed in
3-foot-wide slurry cutoff walls constructed through levees in Yuba, Sutter, and Butte counties.
Using the average permeability value of the clayey core material, the seepage through the entire dam embankment
at maximum reservoir level was calculated to be about fve gallons per minute. This is considered to be a very close
match to the 8 – 10 gallons per minute that has historically been measured at the seepage weir during the dry season
(see Section 2.2).
Oroville Dam has a unique and comprehensive seepage collection system, discussed in greater detail in Section 2.
A nearly vertical drain downstream of the central clayey core was constructed to intercept and collect seepage. The
vertical drain then conveys the seepage to a monitored drainage pool at the base of the dam.
Tests completed during construction indicate that the material placed in the vertical drain was constructed to be
approximately 20 million times more pervious than the central clayey core material. The vertical drain has ample
capacity to intercept and collect any seepage through the core.
Construction records indicate that the outside embankment material (Zone 3 gravels) in the elevation range where
the vegetation area is observed ended up having more sand and fne soil than most of the other Zone 3 gravel material
placed above and below it. This localized area of fner material is more likely to retain perched, or trapped, rainwater
for a longer time than surrounding areas and therefore support vegetation growth.
1.4 SEEPAGE MONITORING REVIEWS In addition to annual inspections conducted by the Division of Safety of Dams, federal and state regulations require
Oroville Dam to be formally inspected, and its operational performance reviewed, by an independent outside
consultant every fve years. (California Code of Regulations 332). Vegetation on the face of the dam was noted in the
majority of these inspections, and was never identifed as a dam safety concern.
Two recent FERC fve-year inspections include recommendations by for an improved seepage monitoring program that
DWR has taken steps to address. A summary of actions is noted below.
■■ Eighth FERC Part 12D Independent Inspection (2010) recommended development of a long-term monitoring plan
of the phreatic surface, or seepage level, through Oroville Dam.
■■ DWR submitted the requested seepage monitoring plan, “Long-Term Plan for Monitoring of the Phreatic Surface
of Oroville Dam, State Dam No. 1-048, Butte County,” to FERC and DSOD on Dec. 20, 2012. The plan relied upon
design and construction information and results of monitoring information from prior instrumentation systems;
it did not call for installation of additional seepage monitoring instruments. DWR determined that its seepage
monitoring system at the downstream toe, coupled with piezometric monitoring data collected in the 1960s through
2000, established seepage patterns within the dam. Ongoing measurements at the toe seepage weir provides ongoing
A u g u s t 3 0 , 2 0 1 7 | 7

1 and long-term seepage measurements through the dam, and serves as a means to monitor the phreatic surface in
the downstream portion of the dam.
■■ Ninth FERC Part 12D Independent Inspection (2014) recommended a comprehensive review and evaluation
of seepage conditions in the dam, including an evaluation of the vegetation area on the face of the dam. This
comprehensive review and evaluation is to include reviews of design and construction information, materials placed
in the dam, monitoring information, evaluations of the effects of precipitation, and new seepage and slope stability
analyses. The evaluation is slated to be completed before the next FERC Part 12D Independent Inspection, scheduled
for 2019.
8 | A S S E S S M E N T O F T H E V E G E TAT I O N A R E A O N T H E FA C E O F O R O V I L L E DA M

OROVILLE DAM SEEPAGE COLLECTION
2
2.1 DESIGN FEATURES As stated in Section 1.3, Oroville Dam was designed to minimize seepage. The dam’s seepage control is based on
widely accepted dam safety designs that employ a central impervious core, continuous along the entire dam axis, to
reduce seepage.
As shown in Figure 3, the top surface of the seepage level in the downstream portion of a dam (phreatic surface) is
very low if the permeability (k) in the central core is at least 1,000 times less than that in the outer portion or shell of
the dam.
A u g u s t 3 0 , 2 0 1 7 | 9
Water surface
Saturation line (phreatic surface)
kk 11 < 1000k2k2
FIGURE 3. Low Saturation/Seepage Line Resulting when an Embankment Dam has a Central Core that is 1,000 times or more Less Pervious than Outer Shell Material (adapted from Cedergren, 1997).

2 As shown in Figure 4, the design for seepage control in Oroville Dam follows this general principle and incorporates a
central clayey core (Zone 1) that is about 2 million times more impervious than the outer shell zone (Zone 3) – a far
higher ratio than the ratio of 1,000 needed to assure a very low phreatic surface and dry slope.
The seepage collection and monitoring system in Oroville Dam provides an unusually effective way of monitoring
seepage through a zoned dam. The design incorporates elements to reduce seepage, intercept seepage passing through
the dam, and convey the seepage to a place where it can be easily monitored.
ZONE 3
ZONE 3
ZONE2
ZONE
1
ZONE
2 ZONE 3
ZONE 5B
ZONE 5A ZONE 4
ZONE 1B ZONE 4A
CORE BLOCK
3˜ RIPRAP 2.6:1
2.0:1
2.75:1
Central Clayey Core Internal Gravel Drain/ Seepage Collection System
Seepage Measuring Weir House/Vault
Seepage Collection Barrier
Lines of Grouted Boreholes in Bedrock
FIGURE 4. Cross Section of Oroville Dam illustrating Designed Seepage Barriers and Seepage Collection System.
As shown in Figure 4, the key barrier for seepage through the dam is the central clayey core within the dam (Zone 1).
The key barrier for seepage through the foundation is grout injected into a line of boreholes in the bedrock beneath the
core (red line below concrete core block). The clayey core is founded on a concrete block (core block) in the central
section of the dam to prevent differential settlement of the core.
Figure 4 shows a near vertical gravel drain (Zone 5B) constructed downstream of the core (yellow zone) to collect
seepage passing through the dam. Any seepage coming through the central clayey core is intercepted by this drain and
then drops down to a low internal pool (blue-shaded zone in lower portion of embankment downstream of the core
and core block).
By design, the low internal pool was created by a low seepage collection barrier constructed near the base of the dam.
This allows for seepage to be measured. The top surface of this low internal pool is only about 12 feet above the
normal water surface of the Feather River below the dam.
Also shown in Figure 4, embankment seepage fows through a pipe from the low internal pool (dashed line) and out
into a seepage measuring house (or vault) where it is measured by a weir as it discharges into the Feather River.
10 | A S S E S S M E N T O F T H E V E G E TAT I O N A R E A O N T H E FA C E O F O R O V I L L E DA M

O R O V I L L E D A M S E E P A G E C O L L E C T I O N
DWR has measured the quantity and quality of the seepage exiting through the weir and water levels within the low
internal seepage pool since 1966, prior to the dam’s completion and initial flling of the reservoir. The rates have
remained consistently low.
During the dry season, the seepage fow measured at the weir is only about 10 gallons per minute, an extremely low
amount of seepage for a dam this size. Even wet season seepage fow measurements, commonly up to 100 gallons per
minute, represent consistent seepage fows since construction was completed. By contrast, large zoned embankment
dams with smaller heights commonly seep several hundred gallons per minute.
FIGURE 5. View of Seepage Measuring Vault which contains a Measuring Weir, and Interior Low Water Pool Level within Oroville Dam. (Photograph taken on April 22, 2017, when seepage flow was approximately 53 gallons per minute, a relatively low seepage amount.)
2.2 PERFORMANCE MONITORING INSTRUMENTATION In accordance with industry standards, several types
of performance monitoring instruments were installed
during Oroville Dam construction to monitor internal
stresses, displacements, and seepage.
The predominant purpose of this instrumentation was
to confrm that the dam was behaving within acceptable
limits during construction and initial flling of the
reservoir. All the instrumentation related to seepage
through the dam confrmed that the amount of seepage
passing through the dam was very small, that the dam
materials downstream of the central core were not
saturated, except within the low internal seepage collection
pool as designed, and that the seepage conditions within
the dam were as expected by the designers:
2.2.1. A commonly used instrument during construction was a piezometer, which measures the pressure of water
within soil or rock. Instrumentation during construction confrmed that the amount of seepage passing through the
dam was very small, that the dam materials downstream of the central core were not saturated (except within the low
internal seepage collection pool as designed), and that the seepage conditions within the dam were as expected by
designers.
DWR engineers installed 16 piezometers to measure internal water levels downstream of the clayey core, 12 of which
were placed above the low internal pool. Between initial flling of the reservoir in 1968 and the mid-1980s, the 12
downstream piezometers above the low seepage pool all showed dry conditions (see Figure 6).
A u g u s t 3 0 , 2 0 1 7 | 11

ZONE 3
ZONE2
ZONE
1
Downstream Piezometer indicating Dry Conditions Downstream Piezoemeter indicating Low Seepage Pool Water Level
ZONE 4A
CORE BLOCK
3˜ RIPRAP 2.6:1
Vegetation Area
2.0:1
Piezometers reading dry conditions
2
FIGURE 6. Cross Section of Oroville Dam illustrating Water Levels Indicated by Downstream Piezometers between 1968 and mid-1980s.
Four downstream piezometers placed within the low seepage pool indicated water levels comparable to the top of the
seepage pool (about elevation 240-245 feet, about 330 feet below the bottom of the vegetation area).
While these instruments were abandoned in 2000 due to expected loss of functionality, all the piezometers still
functioning continued to read dry if they were located above the low internal pool or to read the level of the top of low
internal pool if they were located within the pool.
2.2.2. Two cross-arm settlement devices (Cross-arm “A” and Cross-arm “C”) were installed in the downstream
slope of the dam. These instruments were installed to measure internal settlements of the downstream portion of the
embankment. Water levels could also be measured inside the telescoping casings of these two instruments. Water levels
measured in the 1960s and 1970s indicated water levels comparable to the top of the low internal pool (see Figure 7).
ZONE 3
ZONE2
ZONE
1
ZONE
2 ZONE 3
ZONE 5B
ZONE 5A
Water Level Measured Inside Crossarm Settlement Device Inside Casing
ZONE 4A
CORE BLOCK
3˜ RIPRAP 2.6:1
2.0:1
Vegetation Area “Crossarm C”
FIGURE 7. Cross Section of Oroville Dam illustrating Water Levels Indicated by Downstream Cross-Arm Settlement Devices in 1960s and 1970s.
12 | A S S E S S M E N T O F T H E V E G E TAT I O N A R E A O N T H E FA C E O F O R O V I L L E DA M

O R O V I L L E D A M S E E P A G E C O L L E C T I O N
ZONE 3
ZONE2
ZONE
1
ZONE
2 ZONE 3
ZONE 5B
ZONE 5A
Water Level Measured Inside Low Seepage Pool from Pipe Connected to Seepage Measuring Vault/Weir
ZONE 4A
CORE BLOCK
3˜ RIPRAP 2.6:1
2.0:1 Seepage Measuring Vault/Weir
Vegetation Area
FIGURE 8. Cross Section of Oroville Dam illustrating Water Level Indicated by Downstream Toe Seepage Weir – 1960s to Present.
2.2.3. The pipe connected to the downstream seepage measuring vault/weir measures the water level within the low
internal pool in the dam. This level has fuctuated between elevation 237 and 239.5 feet since initial reservoir flling in
1968 (see Figure 8). It continues to function and register a water level in the dam that is approximately 330 feet below
the bottom elevation of the vegetation on the face of the dam.
A u g u s t 3 0 , 2 0 1 7 | 13

2 2.2.4. During the wet seasons of 1966 and 1967, rainwater infltration was measured at the seepage weir at the base
of the Oroville Dam into the downstream slope of the dam. This occurred during dam construction, and before the
reservoir was initially flled in 1968.
Seepage has been monitored once a week since construction, and DWR maintains an alarm on the seepage level in the
event seepage should ever exceed the action level set by the department.
In recent years, DWR has implemented higher frequency automated data collection of the seepage rate. The measured
seepage fows continue to be signifcantly affected by rainfall, but during the dry season weir measurements indicate
fows commonly about 10 gallons per minute, and as low as eight gallons per minute (see Figure 9). As stated previously,
this is an extremely low level of seepage considering the height of Oroville Dam, but compares very well with the fve
gallons per minute calculated using the average permeability measured in the clayey core during construction.
Reservoir Elevation (feet) Drainage (Gallons Per Minute) 1000 100
900 90
Reservoir Elevation 800 80
Toe Seepage 700 70
600 60
500 50
400 40
300 30
200 20
100 10
0 0
Daily Precipitation (inches) 3
Daily Rainfall 2
1
0 Oct. 2015 Nov. 15 Dec. 15 Jan. 2016 Feb. 16 Mar. 16 Apr. 16 May 16 June 16 July 16 Aug. 16 Sept 16
FIGURE 9. Water Year 2015-2016 Rainfall and Seepage Measurements made at the Seepage Weir Located at the Base of Oroville Dam.
14 | A S S E S S M E N T O F T H E V E G E TAT I O N A R E A O N T H E FA C E O F O R O V I L L E DA M

O R O V I L L E D A M S E E P A G E C O L L E C T I O N
2.3 RAINFALL EFFECTS ON SEEPAGE 2.3.1. Both the long-term seepage weir measurements and the piezometer readings obtained during construction
show that seepage fows within the downstream portion of the dam are signifcantly affected by rainfall. Each year,
seepage fows begin to increase after the frst rain storms. The seepage fows induced by rainfall commonly increase up
to 50 to 100 gallons per minute after rain events each year. These rainfall-driven seepage fows are much greater than
those coming through the dam during the dry season, when fows are generally only about 10 gallons per minute.
2.3.2. The effects of rainfall on seepage do not immediately end after it stops raining. Both seepage measurements
and construction piezometer data show that the effects of precipitation continue for months after rainfall has ended,
with gradually reducing seepage and water levels persisting through the summer and fall months (see Figure 10).
The effects of winter and spring rainfall commonly last until October each year as rain water slowly drains out of the
dam. The seepage levels then start rising when the rainy season begins. This cycle began in 1966 before the reservoir
was flled.
Toe Seepage (gallons per minute) 100
90
80
70
60
50
40
30
20
10
0
Weekly Precipitation (inches) 15
10
5
0 2006 2007 2008 2009 2010 2011 2012 2013 2014 2015 2016
2006 2007 2008 2009 2010 2011 2012 2013 2014 2015 2016
Toe Seepage
Weekly Rainfall
FIGURE 10. 2006-2016 Rainfall and Seepage Measurements made at the Seepage Weir Located at the Base of Oroville Dam.
A u g u s t 3 0 , 2 0 1 7 | 15

3
ASSESSMENT OF THE VEGETATION AREA
3.1 DESCRIPTION OF THE VEGETATION AREA Lines of wet earth in the vegetation area were frst observed during dam construction in 1966 and 1967, following
rainfall and the formation of erosion rills on the dam surface (see Figures 11 and 12). It has been monitored and
observed since that time.
3.1.1. Perched lines of wet areas shown in the construction photographs are from before the reservoir was frst flled
in 1968.
3.1.2. In addition to causing erosion rills or gullies in the downstream slope during construction, rainfall also
resulted in the ponding of water on the surface of Zone 3 fll placement within the elevation range of the vegetation
area (see Figure 13). Precipitation during construction periods tends to wash sandier and fner material into the ponds,
creating layers of less pervious material with a tendency to trap water within the dam.
3.1.3. A DSOD inspection report dated February 1, 1967, observed ponded and perched water and seepage bands on
the face of Oroville Dam as a result of rain water in the fll area described as the vegetation area in this report.
“There are several seepage bands showing up on the downstream face, particularly near the left abutment
where gullying is also severe. In these gullies, tight bands force seepage to the surface and form steps within
the gullies. At the road below the Palermo Canal about 15 to 20 gpm bleeds out of the fll and runs down the
roadway. The laminations and tight layers in Zone 3 should not be a problem except for public relations and
maintenance if Zone 5 is free draining.”
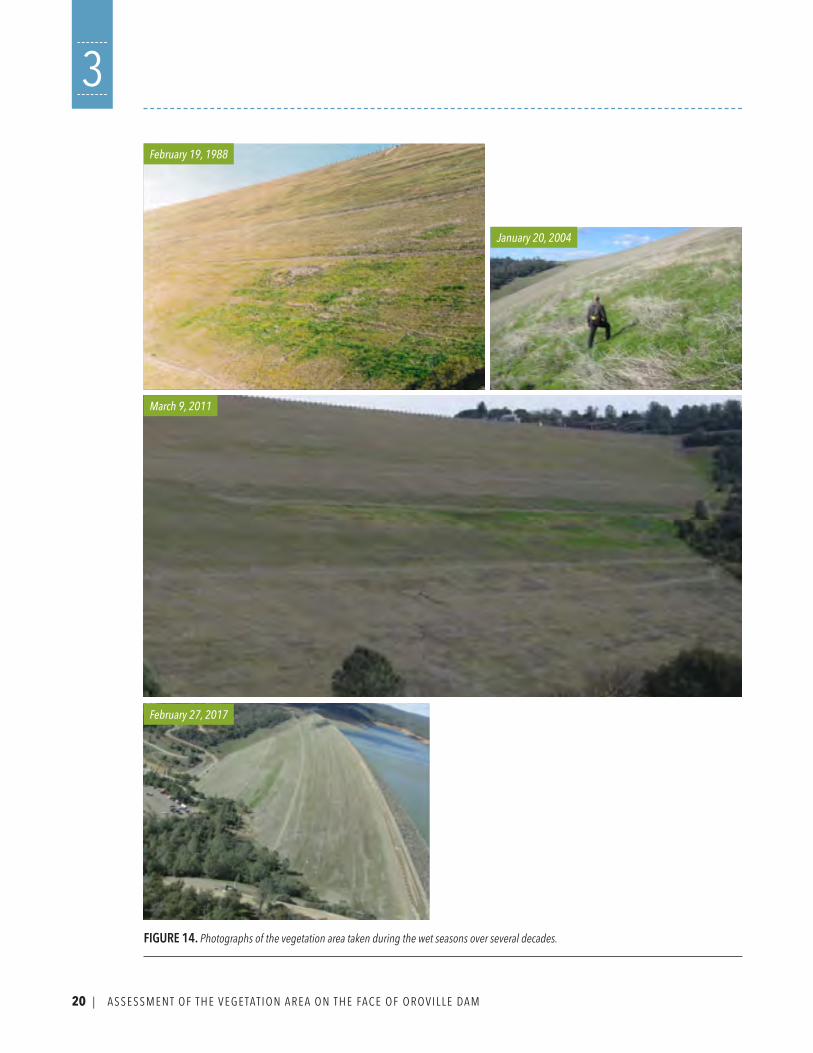
3.1.4. During the wet season of each year, the vegetation area turns green in the same general band across the dam
face (see Figure 14).
3.1.5. The vegetation area dries out every year, turning yellow and brown during the dry season (see Figure 15).
3.1.6. As previously noted, the vegetation area occurs in an area of the dam that developed erosion rills and gullies
due to rainfall during the construction of the dam. These erosion rills and gullies were repaired during original
construction by flling them in with cobbles, not regular dam fll (see Figure 16). These highly pervious cobble flls
encourage the percolation of rain water into the dam face in the region of the vegetation that grows on the face of the
dam, rather than running down the slope.
16 | A S S E S S M E N T O F T H E V E G E TAT I O N A R E A O N T H E FA C E O F O R O V I L L E DA M

FIGURE 11. Lines of wet areas, ponded water, and erosion rills prior to initial filling of the reservoir in future vegetation area. (Construction photograph taken on November 22, 1966)
A u g u s t 3 0 , 2 0 1 7 | 17

18 | A S S E S S M E N T O F T H E V E G E TAT I O N A R E A O N T H E FA C E O F O R O V I L L E DA M
3January 6, 1967
House T Access Road, -elevation 560'
Access Road, -elevation 670'
January 22, 1967 Approximate
maximum vegetation area extents
FIGURE 12. Vegetation area showing lines of wet areas and erosion rills prior to initially filling the reservoir. (Construction photographs taken in January 1967)

A S S E S S M E N T O F T H E V E G E T A T I O N A R E A
November 22, 1966
FIGURE 13. Photographs of Ponded Water on the Construction Surface within the Vegetation Area Elevation Range.
A u g u s t 3 0 , 2 0 1 7 | 19
20 | A S S E S S M E N T O F T H E V E G E TAT I O N A R E A O N T H E FA C E O F O R O V I L L E DA M
3
February 19, 1988
January 20, 2004
March 9, 2011
February 27, 2017
FIGURE 14. Photographs of the vegetation area taken during the wet seasons over several decades.

A S S E S S M E N T O F T H E V E G E T A T I O N A R E A
July 7, 1988
August 10, 2017
June 19, 2003
FIGURE 15. Photographs of the vegetation area taken during summer months.
A u g u s t 3 0 , 2 0 1 7 | 21

3
FIGURE 16. Eroded rills or gullies in the vegetation area that were filled with cobbles. This encourages rain water percolation into the fill instead of running down the slope. (Photographs taken January 20, 2017)
22 | A S S E S S M E N T O F T H E V E G E TAT I O N A R E A O N T H E FA C E O F O R O V I L L E DA M

4 SUMMARY ASSESSMENT OF THE
VEGETATION AREA
4.1 EVALUATION OF POTENTIAL DAM SEEPAGE The source of water for the wet area that foster vegetation growth on the face of the dam is not seepage from the
reservoir through the dam. This is evidenced by the following:
■■ The same area on the face of the dam that fosters vegetation growth was observed to have lines of wet earth during
original dam construction in the 1960s and two years before the reservoir was initially flled.
■■ The seepage control design for Oroville Dam includes a nearly impervious central clayey core to reduce seepage to a
negligible value. Any seepage from the reservoir that does make its way through the core is intercepted by a vertical drain,
preventing it from fowing to the downstream face of the dam. Seepage through the dam that is intercepted by the drain is
conveyed to a low level internal pool at the bottom of the dam, and then to a seepage weir for observation and measurement.
■■ Materials testing performed during dam construction confrm the very high impervious nature of the central clayey
core and the large drainage capacity of the vertical drain.
■■ Seepage measurements at the base of the dam show very low seepage fows during the dry season (only ~10 gallons
per minute). These measured seepage fows are consistent with both the design intent and seepage calculations
based on the soil permeabilities measured during construction.
■■ Performance monitoring instrumentation (piezometers, cross arms, and seepage weir) installed during construction
show that the water level inside the dam downstream of the core is consistently low. The measured low water level is
consistent with the top of the low internal pool designed for collection and measurement of seepage. This low water
level is only about 12 feet above the typical water surface of the Feather River below the dam.
4.2 SOURCE OF WATER FOR THE VEGETATION AREA The source of water for the vegetation area is concluded to be rainfall. This is evidenced by the following:
■■ Seepage measurements and construction piezometer readings showed that seepage in the dam has been greatly
affected by rainfall percolating into the dam even before the reservoir was frst flled. This response to rainfall has
remained consistent every year since construction of the dam.
A u g u s t 3 0 , 2 0 1 7 | 23

■■ Seepage measurements and construction piezometer readings show that seepage impacts from rainfall persist for months
after the rainy season, indicating that the rainwater that has percolated into the dam drains slowly out of the dam.
■■ Construction operations during the 1966-67 rainy season resulted in ponding of water on the fll surface and the
creation of stratifed lenses or layers within the fll in the area where vegetation is now present. These stratifed
layers encourage the perching or trapping of water during rain events. Numerous inspection reports and aerial
photographs taken during construction and prior to reservoir flling document the presence of wet areas seeping
rain water that had percolated into the dam.
■■ Vegetation grows on an area of the dam that developed erosion rills and gullies due to rainfall during original dam
construction. These erosion rills and gullies were repaired by flling them in with cobbles, not regular dam fll. These
highly pervious cobble flls encourage the percolation of rain water into the dam face, rather than rainfall running
down the slope.
■■ The vegetation area generally dries up and turns brown by the end of the summer, which would not happen if it had
a constant water source.
4.3 EFFECTS OF THE VEGETATION AREA ON DAM SAFETY As stated above, vegetation on the face of Oroville Dam is the result of rain water temporarily trapped within the dam’s
Zone 3 gravels. This vegetation area does not cause a dam safety concern. This is supported by the following:
■■ Rain water infltrates the dam’s gravelly shell each year and some of this water becomes temporarily perched on
dirtier layers of gravel within the dam shell. This was observed during dam construction and is documented in DWR
and DSOD construction and inspection reports and the cycle has occurred since before dam completion.
■■ The trapped height of water on these perched water levels is believed to be relatively low, and therefore requires
several months to drain out. During this time, vegetation grows where the trapped water drains out onto the face of
the dam. As the water drains out towards the end of summer, the vegetation dries out and turns brown. The cycle
then begins again during the next wet season.
■■ Construction records show that the Zone 3 dam material placed within the elevation band associated with vegetation
was densely compacted and has a high strength
■■ All portions of the dam’s face, including the vegetation area, have performed well for over 50 years with no signs of
distress, including after moderate earthquake shaking sustained during the 1975 Oroville Earthquake (M~6).
24 | A S S E S S M E N T O F T H E V E G E TAT I O N A R E A O N T H E FA C E O F O R O V I L L E DA M

5
REFERENCES
1. Cedergren, Harry R. (1997) “Seepage, Drainage, and Flow Nets,” 3rd Edition, Wiley Publications, January.
2. Rizzo Associates, Inc., URS Corporation, AMEC, and Geosystems, L.P. (2014), “Oroville Dam, FERC Project No.
2100-CA, State Dam No. 1-048, NID CA00035, CA00530, & CA83096, Ninth Five Year Part 12D, Safety Inspection
Report, 2014 Director’s Safety Review Board.”
3. State of California, The Resources Agency, Department of Water Resources, Division of Design and Construction
(1967), “Final Design Report for Oroville Dam, “ (DRAFT).
4. State of California, The Resources Agency, Department of Water Resources (1968) “Oroville Dam Embankment,
Materials Control Report.”
5. State of California, The Resources Agency, Department of Water Resources (1968-2006), Performance Reports,
Numbers 1 - 12, Oroville Dam.
6. State of California, The Resources Agency, Department of Water Resources, Division of Design and Construction
(1969), “Final Construction Report on Oroville Dam, Volume I, Oroville Dam,”
7. State of California, The Resources Agency, Department of Water Resources, Operations and Maintenance (1988),
“History of Green Spot Pictures”.
8. State of California, The Resources Agency, Department of Water Resources, Audio Visual Units Photo Unit Negative
Library.
9. State of California, The Resources Agency, Department of Water Resources, Monitoring Photos.
A u g u s t 3 0 , 2 0 1 7 | 25

March 27, 1967
March 27, 1967 photo of Oroville Dam before the dam was completed and the reservoir was first filled.
26 | A S S E S S M E N T O F T H E V E G E TAT I O N A R E A O N T H E FA C E O F O R O V I L L E DA M

August 29, 2017
Oroville Dam, showing vegetation area, in Butte County, California. (Photo taken August 29, 2017)
A u g u s t 3 0 , 2 0 1 7 | 27

D R A F T