Assessment of the Importance of Mooring Dynamics on...
10
Assessment of the Importance of Mooring Dynamics on the Global Response of the DeepCwind Floating Semisubmersible Offshore Wind Turbine Marco Masciola a , Amy Robertson a , Jason Jonkman a , Alexander Coulling b and Andrew Goupee b a National Renewable Energy Laboratory, Golden, CO, USA b Advanced Structures and Composites Center, University of Maine, Orono, ME, USA ABSTRACT This paper studies the influence of mooring line dynamics on the response of a coupled floating offshore wind turbine against an equivalent uncoupled model. The semisubmersible modeled in this paper is based on a design developed by the DeepCwind program and uses the National Renewable Energy Laboratory’s (NREL’s) 5- megawatt (MW) baseline wind turbine to represent the tower, nacelle, and blade properties. The uncoupled model was formed using FAST, an open-source program that models the wind turbine aerodynamics, control, motion, tower/blade flexure, and wave forces, but with the mooring line forces treated using a quasi-static approximation. In contrast, the coupled model was enabled by pairing FAST with Or- caFlex. OrcaFlex replaces FAST’s wave force and quasi-static cable model with an equivalent subsea fluid-structure representation and a lumped-mass cable system to capture the mooring line dynamics. This analysis revealed that an uncoupled model using the quasi-static mooring approximation can underestimate peak mooring line loads versus a coupled model using a dynamic mooring line. KEY WORDS: Floating wind turbine; coupled analysis; semisub- mersible; mooring dynamics NOMENCLATURE Ac Column cross-section area B 6 × 6 quadratic drag matrix CD Viscous (quadratic) drag coefficient dz Mooring axial cable damping coefficient EA Mooring axial stiffness Fi (t) Wave excitation force Fi Dimensionless wave-excitation force H, Hs Wave height, significant wave height Ki Linearized stiffness for the i th DOF ˜ k(s) Elastic wave number (for the mooring line) L Unstretched cable length q Generalized platform displacement T Wave period T (s) Cable tension power spectral density (PSD) u Local fluid velocity X f (ω) Wave excitation force at frequency ω γ Joint North Sea Wave Project (JONSWAP) spectrum peak enhancement factor λ Model/prototype scaling factor μ Cable mass per unit length ω Angular frequency (rad/s) INTRODUCTION Floating offshore wind turbines are viewed as a promising technology that has an ability to harness the large wind resource available in deep water. Recent studies show that offshore wind has the potential to help diversify worldwide energy resources and reduce dependency on hydrocarbons. As a result, there is a large drive to study how floating offshore wind turbines can supplement land-based wind resources. Fortunately, the budding offshore wind industry can leverage several decades of offshore oil and gas expertise to help grow the offshore wind area into a mature field. To aid in the research and development of new floating offshore wind turbine design concepts, the National Renewable Energy Laboratory (NREL) modified FAST, an aero-elastic computer-aided engineering (CAE) tool, to simulate the response and dynamic loads of land- based, fixed offshore, and floating offshore wind turbines (Jonkman and Buhl, 2005). FAST is a validated, comprehensive simulation program that considers the aerodynamic loads, tower and blade deflections, blade pitch and nacelle yaw controls, gear box, and torque transfer between the rotor and generator with nonlinear models in the time domain. In the realm of offshore floating wind turbine modeling, additional loads must be included, such as wave-excitation loads, fluid added-mass, wave-radiation damping, drag arising from flow separation, and the mooring line restoring forces. High-fidelity simulation tools will assist the offshore wind industry in developing economically sound, competitive, and viable concepts capable of surviving variable ocean environmental conditions. Currently, FAST is in the process of being enhanced with features to allow greater modeling fidelity. Study Motivation The focus of this paper is to analyze the response of a coupled and uncoupled semisubmersible floating wind turbine, using the DeepCwind system as a surrogate, to study how the mooring line dynamics may influence the motion of these and similar structures, Figs. 1∼2. Data from 1/50 th -scale tank tests performed at the Maritime Research Institute Netherlands (MARIN) were used as a basis to understand the characteristics of a coupled and uncoupled numerical model. To better comprehend subtle differences between responses, three numerical models were included in the analysis. Each model used a variation of accepted theories to better quantify the important physics and response characteristics of the simulation and
Transcript of Assessment of the Importance of Mooring Dynamics on...

Assessment of the Importance of Mooring Dynamics on the Global Response of the DeepCwindFloating Semisubmersible Offshore Wind Turbine
Marco Masciolaa, Amy Robertsona, Jason Jonkmana, Alexander Coullingb and Andrew GoupeebaNational Renewable Energy Laboratory, Golden, CO, USA
bAdvanced Structures and Composites Center, University of Maine, Orono, ME, USA
ABSTRACT
This paper studies the influence of mooring line dynamics on theresponse of a coupled floating offshore wind turbine against anequivalent uncoupled model. The semisubmersible modeled in thispaper is based on a design developed by the DeepCwind programand uses the National Renewable Energy Laboratory’s (NREL’s) 5-megawatt (MW) baseline wind turbine to represent the tower, nacelle,and blade properties. The uncoupled model was formed using FAST,an open-source program that models the wind turbine aerodynamics,control, motion, tower/blade flexure, and wave forces, but with themooring line forces treated using a quasi-static approximation. Incontrast, the coupled model was enabled by pairing FAST with Or-caFlex. OrcaFlex replaces FAST’s wave force and quasi-static cablemodel with an equivalent subsea fluid-structure representation anda lumped-mass cable system to capture the mooring line dynamics.This analysis revealed that an uncoupled model using the quasi-staticmooring approximation can underestimate peak mooring line loadsversus a coupled model using a dynamic mooring line.
KEY WORDS: Floating wind turbine; coupled analysis; semisub-mersible; mooring dynamics
NOMENCLATURE
Ac Column cross-section areaB 6× 6 quadratic drag matrixCD Viscous (quadratic) drag coefficientdz Mooring axial cable damping coefficientEA Mooring axial stiffnessFi(t) Wave excitation forceFi Dimensionless wave-excitation forceH , Hs Wave height, significant wave heightKi Linearized stiffness for the ith DOFk(s) Elastic wave number (for the mooring line)L Unstretched cable lengthq Generalized platform displacementT Wave periodT (s) Cable tension power spectral density (PSD)u Local fluid velocityXf (ω) Wave excitation force at frequency ωγ Joint North Sea Wave Project (JONSWAP) spectrum
peak enhancement factorλ Model/prototype scaling factorµ Cable mass per unit lengthω Angular frequency (rad/s)
INTRODUCTION
Floating offshore wind turbines are viewed as a promising technologythat has an ability to harness the large wind resource available in deepwater. Recent studies show that offshore wind has the potential tohelp diversify worldwide energy resources and reduce dependency onhydrocarbons. As a result, there is a large drive to study how floatingoffshore wind turbines can supplement land-based wind resources.Fortunately, the budding offshore wind industry can leverage severaldecades of offshore oil and gas expertise to help grow the offshorewind area into a mature field.
To aid in the research and development of new floating offshore windturbine design concepts, the National Renewable Energy Laboratory(NREL) modified FAST, an aero-elastic computer-aided engineering(CAE) tool, to simulate the response and dynamic loads of land-based, fixed offshore, and floating offshore wind turbines (Jonkmanand Buhl, 2005). FAST is a validated, comprehensive simulationprogram that considers the aerodynamic loads, tower and bladedeflections, blade pitch and nacelle yaw controls, gear box, andtorque transfer between the rotor and generator with nonlinear modelsin the time domain. In the realm of offshore floating wind turbinemodeling, additional loads must be included, such as wave-excitationloads, fluid added-mass, wave-radiation damping, drag arising fromflow separation, and the mooring line restoring forces. High-fidelitysimulation tools will assist the offshore wind industry in developingeconomically sound, competitive, and viable concepts capable ofsurviving variable ocean environmental conditions. Currently, FASTis in the process of being enhanced with features to allow greatermodeling fidelity.
Study Motivation
The focus of this paper is to analyze the response of a coupledand uncoupled semisubmersible floating wind turbine, using theDeepCwind system as a surrogate, to study how the mooring linedynamics may influence the motion of these and similar structures,Figs. 1∼2. Data from 1/50th-scale tank tests performed at theMaritime Research Institute Netherlands (MARIN) were used as abasis to understand the characteristics of a coupled and uncouplednumerical model. To better comprehend subtle differences betweenresponses, three numerical models were included in the analysis. Eachmodel used a variation of accepted theories to better quantify theimportant physics and response characteristics of the simulation and

were compared to results seen in the 1/50th-scale experiment.
In this paper, the terms ‘coupled’ and ‘uncoupled’ refer to the offshoreindustry definition of the mooring line representation (DNV, 2010;API, 1997). In the uncoupled analysis, the mooring line dynamicswere decoupled from the floating vessel motion. Uncoupled theoryusually consists of a quasi-static approximation of the mooring linerestoring forces (Irvine, 1992; Wang, et al, 2010). In comparison,coupled analysis numerically integrates the mooring line equation ofmotion to formulate the mooring line dynamic response (Merchantand Kelf, 1973; Ketchman and Lou, 1975; Jefferys and Patel, 1982).Again, in this exercise, ‘coupled’ and ‘uncoupled’ refer to how themooring was modeled.
Coupled and Uncoupled Model Description
FAST is a simulation tool that combines the tower motion, bladedeflection, aerodynamic forces, and hydrodynamics loads into theplatform equation of motion. Despite all these features, FAST isconsidered to be an ‘uncoupled’ model, in the sense that the mooringline restoring forces are presently solved using a quasi-static rep-resentation (Jonkman, 2007). A coupled model was developed bycombining FAST with OrcaFlex using the FASTlink module to accessthe OrcaFxAPI dynamically linked library. The OrcaFxAPI.dlllibrary is distributed with all current versions of OrcaFlex andallows external programs to access OrcaFlex functions. Through thecombination of FAST and OrcaFlex, a coupled model is produced.OrcaFlex itself is a time-domain program capable of modeling thecable dynamics and hydrodynamic loads of floating offshore vessels(Orcina, 2011). The mooring line dynamic loads include fluid-dragand added-mass, internal damping, and cable/seabed contact. Cablebending and torsion effects are omitted in both the FAST andFAST+OrcaFlex simulations. The specific code-coupling mechanismsare further explained in Masciola, et al (2011); but for completeness,the authors define the fundamental assumptions in creating theFAST+OrcaFlex coupled model briefly in this paper.
The FAST+OrcaFlex coupled model combines the two programsto exploit the strengths of both modeling tools. FAST modelsthe aerodynamic load and considers atmospheric turbulence on theblades, tower-bending moments, blade deflection, and wind turbinecontrol algorithms. OrcaFlex is well-known for its dynamic mooringline representation and sophisticated hydrodynamic modeling utilitythat can model a multimember floating support structure as discreteelements. This permits each submerged column and cross brace tobe modeled with different drag and added-mass coefficients. The twoprograms are combined in a manner that allows FAST to model thewind turbine components and OrcaFlex to model the floating vesselforces. OrcaFlex requires from FAST the platform displacement andvelocity as input at the current time step to solve the mooring lineand hydrodynamic forces. Once solved, the sum forces are returnedto FAST, where the vessel acceleration is integrated within FAST,resulting in the subsequent time-step platform displacement andvelocity.
The floating platform properties are defined in Table 1 (Robertson,et al, 2012; Coulling, et al, 2013). The wind turbine tower, blades,control algorithm, and gear box ratio were based on the NREL 5-megawatt (MW) baseline turbine for offshore systems (Jonkman,et al, 2007); however, modifications were made to the baselinewind turbine tower, blade, and nacelle values to match the 1/50th-scale model properties (Coulling, et al, 2013). The wave conditionsanalyzed in this paper are defined in Table 2. The first seven caseswere compared to data recorded in the MARIN tests to explain
Fig. 1: Side profile of the DeepCwind semisubmersible floatingwind turbine concept. The XY Z coordinates represent the referenceorigin of the DeepCwind platform. All coordinates reported in thismanuscript are with respect to the platform reference origin. Theplatform six degrees-of-freedom motion are defined as surge (X),
sway (Y ), heave (Z), roll (φ), pitch (θ), and yaw (ψ).
Fig. 2: Plan profile of the DeepCwind semisubmersible floatingwind turbine concept. For all simulation and tank data results
presented, the direction of wave propagation is aligned with theplatform X direction.

(a) (b)
Fig. 3: The 1/50th-scale DeepCwind semisubmersible model test performed at the Maritime Research Institute Netherlands (MARIN).
Table 1: Definition of the full-scale properties of the DeepCwindsemisubmersible.
Rotor Diameter 126 m
Floating Platform Mass - Mtot 13.444× 10⁶ kg
Nacelle Mass - MN 3.971× 10⁵ kg
Tower Mass - MT 3.022× 10⁵ kg
Platform Center of Mass - CM −14.4 m
Platform Inertia at CM - IXX , IY Y 8.011× 10⁹ kg·m2
Platform Inertia at CM - IZZ 1.391× 10¹⁰ kg·m2
Platform Displacement - ∀ 13.986× 10³ m3
Mooring Axial Stiffness - EA 753.6× 10⁶ N
Unstretched Mooring Line Length - L 835.5 m
Mooring Mass Density - µ 113.352 kg/m
Structural Damping (OrcaFlex) - Cv 2.0% (stiffness proportional)
Seabed Friction Coefficient - CB 1.0
Cable Drag Coefficient - Cd 1.15
Cable Added-Mass Coefficient - Ca 1.0
Mooring 1 Fairlead Position- rfairlead1 [20.43;−35.39;−14.00]T m
Mooring 1 Anchor Position- ranchor1 [418.80;−725.38;−200.00]T m
Mooring 2 Fairlead Position- rfairlead2 [−40.87; 0.00;−14.00]T m
Mooring 2 Anchor Position- ranchor2 [−837.60; 0.00;−200.00]T m
Mooring 3 Fairlead Position- rfairlead3 [20.43; 35.39;−14.00]T m
Mooring 3 Anchor Position- ranchor3 [418.80; 725.38;−200.00]T m
Table 2: Definition of the wave environments modeled. All casesassume a water density of 1025 kg/m3, no wind, and a parked rotor.
Wave Wave Spectrum
Amplitude [m] Period [s]
Case 1 H = 7.58 T = 12.10 Monochromatic
Case 2 H = 10.30 T = 12.10 Monochromatic
Case 3 H = 7.14 T = 14.30 Monochromatic
Case 4 H = 10.74 T = 14.30 Monochromatic
Case 5 H = 7.57 T = 20.00 Monochromatic
Case 6 H = 11.12 T = 20.00 Monochromatic
Operational 1 Hs = 7.04 Tavg = 12.18 JONSWAP, γ = 2.20
Operational 2 Hs = 12.00 Tavg = 19.00 JONSWAP, γ = 2.20
phenomena experienced in the basin and to compare with resultsacquired during the simulation. The final case labeled ‘Operational2’ was viewed as a severe sea-state case and was simulation-only.This case was designed to exacerbate differences between the coupledand uncoupled numerical models. All cases were run with no windpresent and the direction of wave propagation was aligned with theplatform X direction (Fig. 2). This excited the platform in the surge(X), heave (Z), and pitch (θ). For brevity, the pitch results are notpresented in this manuscript. Surge and heave results are sufficientto assess the coupled and uncoupled model characteristics for theDeepCwind system.
MODEL DEFINITION
This section breaks down the assumptions built into each numericalmodel analyzed in this paper. Each numerical model was developedusing full-scale properties of the system, except for the viscous dragcoefficients, which were implented at model scale. The numericalmodels included are: 1) a standalone uncoupled FAST simulation us-ing the B drag matrix (Coulling, et al, 2013), 2) the FAST+OrcaFlexcoupled model with a consistent implementation of Morison’s equa-tion to model the platform viscous forces, and 3) a FAST+OrcaFlexcoupled model with the B drag matrix to replace the discrete Morisonelement representation. The three numerical models were comparedto the MARIN experimental tests. A brief description of the MARIN1/50th-scale model follows first.
MARIN Tank Data Test
A 1/50th-scale Froude model based on the DeepCwind design wastested at the MARIN wave basin facility. The wind turbine tower,nacelle, rotor blade mass, and geometry were constructed to com-plement NREL’s 5-MW reference floating wind turbine (Jonkman,et al, 2007); however, the tower, rotor, and nacelle designed for the1/50th-scale model deviated from the reference turbine because ofsensor mass (Robertson, et al, 2012; Coulling, et al, 2013). Scalingissues associated with the discrete placement of sensors along thetower were resolved by developing tower properties for the numericalmodels to match those used in the wave tank experiment. The floatingplatform was based on the full-scale representation of the DeepCwindsystem, but at 1/50th-scale, as pictured in Figs. 3(a)∼3(b). Detailsregarding the scaled dimensions, mass and inertia, mooring lineproperties, and volumetric displacement for the complete system can
be found in Table 1 and in Coulling, et al, (2013), with the scalinglaws defined in Chakrabarti (1994). Though the results performed inthe MARIN DeepCwind experiment were represented at model scale,all results depicted in this paper are amplified to full scale.
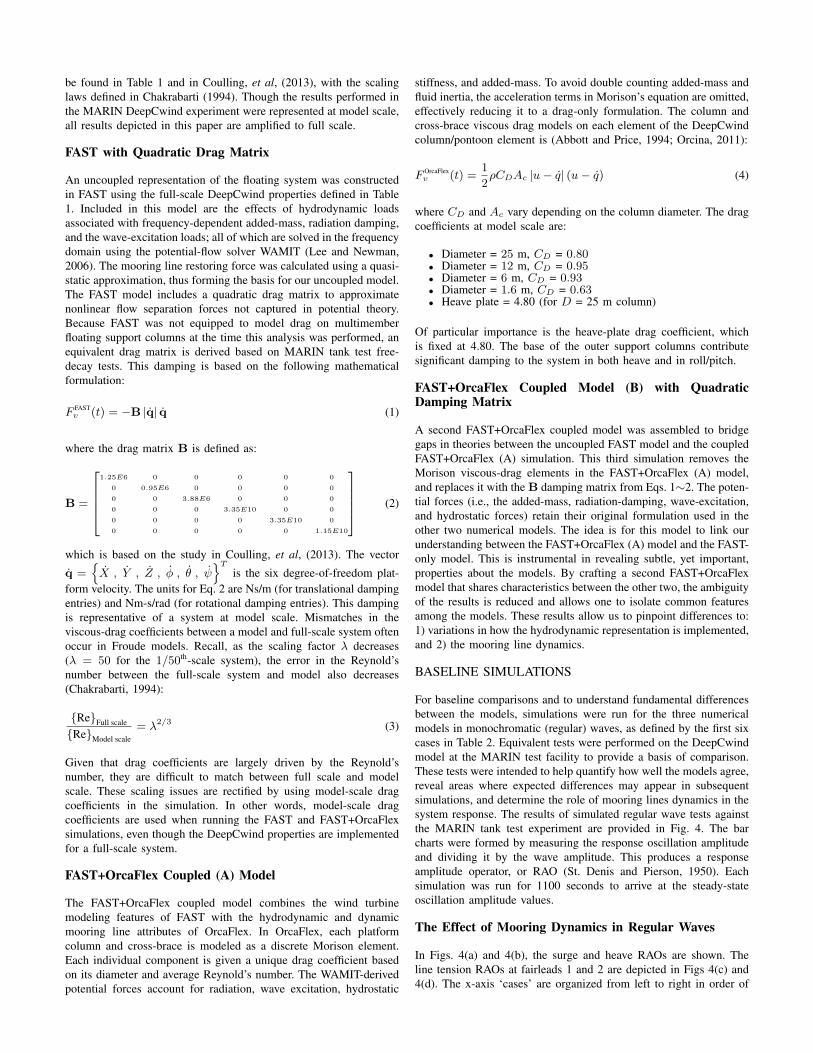
FAST with Quadratic Drag Matrix
An uncoupled representation of the floating system was constructedin FAST using the full-scale DeepCwind properties defined in Table1. Included in this model are the effects of hydrodynamic loadsassociated with frequency-dependent added-mass, radiation damping,and the wave-excitation loads; all of which are solved in the frequencydomain using the potential-flow solver WAMIT (Lee and Newman,2006). The mooring line restoring force was calculated using a quasi-static approximation, thus forming the basis for our uncoupled model.The FAST model includes a quadratic drag matrix to approximatenonlinear flow separation forces not captured in potential theory.Because FAST was not equipped to model drag on multimemberfloating support columns at the time this analysis was performed, anequivalent drag matrix is derived based on MARIN tank test free-decay tests. This damping is based on the following mathematicalformulation:
F FASTv (t) = −B |q| q (1)
where the drag matrix B is defined as:
B =
1.25E6 0 0 0 0 0
0 0.95E6 0 0 0 0
0 0 3.88E6 0 0 0
0 0 0 3.35E10 0 0
0 0 0 0 3.35E10 0
0 0 0 0 0 1.15E10
(2)
which is based on the study in Coulling, et al, (2013). The vector
q ={X , Y , Z , φ , θ , ψ
}T
is the six degree-of-freedom plat-form velocity. The units for Eq. 2 are Ns/m (for translational dampingentries) and Nm-s/rad (for rotational damping entries). This dampingis representative of a system at model scale. Mismatches in theviscous-drag coefficients between a model and full-scale system oftenoccur in Froude models. Recall, as the scaling factor λ decreases(λ = 50 for the 1/50th-scale system), the error in the Reynold’snumber between the full-scale system and model also decreases(Chakrabarti, 1994):
{Re}Full scale
{Re}Model scale= λ2/3 (3)
Given that drag coefficients are largely driven by the Reynold’snumber, they are difficult to match between full scale and modelscale. These scaling issues are rectified by using model-scale dragcoefficients in the simulation. In other words, model-scale dragcoefficients are used when running the FAST and FAST+OrcaFlexsimulations, even though the DeepCwind properties are implementedfor a full-scale system.
FAST+OrcaFlex Coupled (A) Model
The FAST+OrcaFlex coupled model combines the wind turbinemodeling features of FAST with the hydrodynamic and dynamicmooring line attributes of OrcaFlex. In OrcaFlex, each platformcolumn and cross-brace is modeled as a discrete Morison element.Each individual component is given a unique drag coefficient basedon its diameter and average Reynold’s number. The WAMIT-derivedpotential forces account for radiation, wave excitation, hydrostatic
stiffness, and added-mass. To avoid double counting added-mass andfluid inertia, the acceleration terms in Morison’s equation are omitted,effectively reducing it to a drag-only formulation. The column andcross-brace viscous drag models on each element of the DeepCwindcolumn/pontoon element is (Abbott and Price, 1994; Orcina, 2011):
F OrcaFlexv (t) =
1
2ρCDAc |u− q| (u− q) (4)
where CD and Ac vary depending on the column diameter. The dragcoefficients at model scale are:
• Diameter = 25 m, CD = 0.80• Diameter = 12 m, CD = 0.95• Diameter = 6 m, CD = 0.93• Diameter = 1.6 m, CD = 0.63• Heave plate = 4.80 (for D = 25 m column)
Of particular importance is the heave-plate drag coefficient, whichis fixed at 4.80. The base of the outer support columns contributesignificant damping to the system in both heave and in roll/pitch.
FAST+OrcaFlex Coupled Model (B) with QuadraticDamping Matrix
A second FAST+OrcaFlex coupled model was assembled to bridgegaps in theories between the uncoupled FAST model and the coupledFAST+OrcaFlex (A) simulation. This third simulation removes theMorison viscous-drag elements in the FAST+OrcaFlex (A) model,and replaces it with the B damping matrix from Eqs. 1∼2. The poten-tial forces (i.e., the added-mass, radiation-damping, wave-excitation,and hydrostatic forces) retain their original formulation used in theother two numerical models. The idea is for this model to link ourunderstanding between the FAST+OrcaFlex (A) model and the FAST-only model. This is instrumental in revealing subtle, yet important,properties about the models. By crafting a second FAST+OrcaFlexmodel that shares characteristics between the other two, the ambiguityof the results is reduced and allows one to isolate common featuresamong the models. These results allow us to pinpoint differences to:1) variations in how the hydrodynamic representation is implemented,and 2) the mooring line dynamics.
BASELINE SIMULATIONS
For baseline comparisons and to understand fundamental differencesbetween the models, simulations were run for the three numericalmodels in monochromatic (regular) waves, as defined by the first sixcases in Table 2. Equivalent tests were performed on the DeepCwindmodel at the MARIN test facility to provide a basis of comparison.These tests were intended to help quantify how well the models agree,reveal areas where expected differences may appear in subsequentsimulations, and determine the role of mooring lines dynamics in thesystem response. The results of simulated regular wave tests againstthe MARIN tank test experiment are provided in Fig. 4. The barcharts were formed by measuring the response oscillation amplitudeand dividing it by the wave amplitude. This produces a responseamplitude operator, or RAO (St. Denis and Pierson, 1950). Eachsimulation was run for 1100 seconds to arrive at the steady-stateoscillation amplitude values.
The Effect of Mooring Dynamics in Regular Waves
In Figs. 4(a) and 4(b), the surge and heave RAOs are shown. Theline tension RAOs at fairleads 1 and 2 are depicted in Figs 4(c) and4(d). The x-axis ‘cases’ are organized from left to right in order of

Case 1Case 2
Case 3Case 4
Case 5Case 6
0.0
0.2
0.4
0.6
0.8
1.0
1.2
1.4Su
rge
Res
pons
eA
mpl
itud
e[m
/m]
SurgeMARIN FAST+OrcaFlex (A) FAST+OrcaFlex (B) FAST
(a)
Case 1Case 2
Case 3Case 4
Case 5Case 6
0.0
0.2
0.4
0.6
0.8
1.0
1.2
1.4
Hea
veR
espo
nse
Am
plit
ude
[m/m
]
HeaveMARIN FAST+OrcaFlex (A) FAST+OrcaFlex (B) FAST
(b)
Case 1Case 2
Case 3Case 4
Case 5Case 6
0.0
0.5
1.0
1.5
2.0
2.5
Fair
lead
Tens
ion
Res
pons
eA
mpl
itud
e[N
/m]
×105 Cable Tension (Mooring Line 1)MARIN FAST+OrcaFlex (A) FAST+OrcaFlex (B) FAST
(c)
Case 1Case 2
Case 3Case 4
Case 5Case 6
0.0
0.5
1.0
1.5
2.0
2.5
Fair
lead
Tens
ion
Res
pons
eA
mpl
itud
e[N
/m]
×105 Cable Tension (Mooring Line 2)MARIN FAST+OrcaFlex (A) FAST+OrcaFlex (B) FAST
(d)
Fig. 4: From top-left, counter-clockwise: the RAOs for regular wave cases defined in Table 2 for surge, fairlead tension 1, fairlead tension2, and heave.
increasing wave period. Each wave period is paired with two differentwave heights (Table 2). Although the pair of wave heights aredifferent for each frequency, the RAOs in surge, Figs. 4(a), and heave,Figs. 4(b), both scale proportionally to wave height; this relationshipdemonstrates nearly linear behavior (St. Denis and Pierson, 1950).Another trend noticed in Fig. 4(b) is that the FAST+OrcaFlex (A)heave RAO overshoots the response measured in the other data setsfor cases 3 and 4 (T = 14.30 s).
The FAST+OrcaFlex (A) model, which uses a consistent imple-mentation of Morison’s equation, shows how including the relativevelocity term (u − q) in the viscous force calculation can affectthe response. The FAST+OrcaFlex (A) model compared better withthe MARIN tank test data in the heave direction than the other twoformulations using the B matrix. The drag forces on the heave platesare increased because the fluid velocity u fluctuates at frequenciesnear the DeepCwind heave resonance frequency.
The tension RAO in 4(d) does not scale proportionally to waveheight as well as the displacement RAOs. The partial differentialequation describing the dynamics for a cable demonstrates both spa-tial and temporal dependency (French, 1971); whereas the platformdisplacement RAOs can be reduced to a function of one variable
(namely, the wave height). This sensitivity to boundary conditionsmakes it difficult to characterize the tension RAO according to waveheight alone. Because fairlead 2 is oriented parallel to the directionof wave propagation, Fig. 2, it experiences greater peak loads thanthe remaining two tendons.
There is a noticeable difference between the uncoupled (FAST) andcoupled (FAST+OrcaFlex) tensions; this degree of variance is withinthe realm of what is considered reasonable for coupled and uncoupledmodels based on the assessment in Kwan and Bruen (1991) and APIRP 2SK (2005). The tension RAO in mooring line 1 shows greaterconsistency between all numerical models; however, discrepanciesbetween the two FAST+OrcaFlex models occurs for case 5 and case6 (where the wave period is T = 20.00 seconds). These differencesappear to be localized at this excitation frequency, but the exact causeis undetermined. Further study is needed to disclose the cause. Oneof the main observations noted in this regular wave study is that thevessel displacement RAOs remain approximately the same at differentwave heights with the same period, but the tension RAO can vary bya wide margin.

IRREGULAR WAVES
The special case of irregular waves is considered in the next twosimulated cases. The first set of operational wave conditions will becompared to MARIN data. A follow-up simulation was performedfor a platform in rough seas. The second irregular case presentedillustrates a special case showing the significance of the mooringline dynamics in the system response. The second case was not runfor the MARIN 1/50th-scale test.
Operational Case 1 (Hs = 7.04 m, Tavg = 12.18 s)
Operational Case 1 illustrates the response of the DeepCwind systemin irregular seas using the spectrum defined in Table 2. The timeseries plots in Figs. 5(a), 5(c), and 5(e) all show a reasonable levelof agreement between the surge and heave response for the threesimulation models and one MARIN tank-test. Accompanying eachtime series is the corresponding power spectral density (PSD) plotto its right. The data set also shows agreement within the wave-band frequencies (i.e., the region between 0.05–0.20 Hz) in Figs.5(b), 5(d), and 5(f). Differences at the low frequency range in thesurge and tension plot between the simulations and tank test canbe attributed to second-order hydrodynamic effects not captured inthe three numerical models (Coulling, et al, 2013). Figure 4(b)shows that the uncoupled FAST and coupled FAST+OrcaFlex (B)agree with one another, and this is likely due to both modelsincorporating identical damping matrix representations through Eq. 1.The alternative FAST+OrcaFlex (A), the one which uses a consistentMorison representation of the viscous forces, Eq. 4, shows greaterresponse at low surge frequencies.
The tension PSD plot for fairlead 2 in Fig. 5(f) shows significantdifferences between the MARIN results and the three numericalmodels. Although the tension amplitudes vary by a large degree,they do not impact the DeepCwind displacements compared to thesimulations. The sharp, trochoidal peak appearing at 1.67 Hz isa result of the longitudinal (axial) cable natural frequencies. Thelongitudinal cable natural frequencies are a function of the cablelength L, the cable mass per length, and the cable’s axial stiffness.The nth vibration mode can be estimated analytically (French, 1971):
fun =
n
2Lcz = {1.54 , 3.08 , 4.62} Hz (5)
where cz = [EA/µ]1/2 is the longitudinal wave speed in unitsof meters per second. Typically, only coupled models utilizing alumped-mass, finite-element analysis (FEA), or finite-differencingdecomposition of the mooring line forces are capable of capturinglongitudinal cable vibrations. There are more rigorous analyticalsolutions that are capable of modeling these effects (Irvine, 1991);however, these sophisticated catenary models are not implemented inFAST, thus the longitudinal spikes are not representable in FAST. Thelongitudinal peak in Fig. 5(f) for the two coupled models does notcoincide with the calculated solution of 1.54 Hz because a portion ofthe mooring line is laying on the seafloor, and this is not representedin the boundary conditions that derived Eq. 5 (French, 1971).
A significant discrepancy at the longitudinal frequency between theMARIN data and FAST+OrcaFlex simulations exists. These peakscan be exaggerated from the numerical scheme coupling FAST andOrcaFlex, or it can be attributed to the numerical model beingprecise enough to capture the real dynamics of the test environment.A large difference exists between the three numerical models andthe wave tank data at the peak wave frequency in Fig. 5(f). Oneexplanation for this discrepancy could be because the mooring system
was geometrically scaled to match the full-scale stiffness values, butthe dynamic (inertia) properties were not scaled accordingly. Forexample, Eq. 5 is not uniform between the model and full-scale values(Idichandy and Bhattacharyya, 2004).
Operational Case 2 (Hs = 12.00 m, Tavg = 15.00 s)
The plots in Fig. 6 illustrate the DeepCwind semisubmersible re-sponse in a larger sea-state. The researchers found the surge and heaveresponses to agree in both time, Figs. 6(a) and 6(c), and frequency,Figs. 6(b) and 6(d), within the wave-band frequencies. Because theFAST and FAST+OrcaFlex (B) models match in the heave PSDin Fig. 6(d), differences in those plots and FAST+OrcaFlex (A)model are associated with the manner in which the viscous dampingterm was formulated. The difference in the formulation of Eq. 1versus Eq. 4 does not appreciably impact the surge motion, buthas a perceptible involvement in shaping the heave response. Thisdifference is likely attributed to the significance of heave platedrag coefficient (CD=4.80) and because the wave orbital velocityu oscillates at a rate near the heave natural frequency. The inclusionof a dynamic mooring line representation does not appear to affectthe global motion in the surge or heave directions. One mechanism ofmeasuring the relative importance of a given sea-state on the globalmotion of a floating platform is through the dimensionless wave forcecoefficient (Masciola, et al, 2013):
Fi =Fi(t)
KiHs(6)
The linearized stiffness coefficient Ki considers the effective stiffnessof the mooring line (and not buoyancy); the linearized stiffness insurge KX and heave KZ are 7.09× 10⁴ N/m and 1.91× 10⁴ N/m,respectively (Robertson, et al, 2012). Likewise, Fi(t) represents thewave-excitation load as a function of time. For simplicity, Fi(t) isreduced to the root-mean-square of the wave-excitation force timeseries. Once all entities are substituted into Eq. 6, the following resultsare obtained:
• FOperational 1X = 11.61
• FOperational 2X = 9.58
• FOperational 1Z = 15.21
• FOperational 2Z = 17.53
The nondimensional wave force magnitudes do not vary significantlybetween sea-states, which highlights that the platform motion willshow similar characteristics in its response to wave forces betweenOperational Case 1 and Operational Case 2.
Differences between the coupled and uncoupled models are shownin the tension time-series plot, Fig. 6(e) and its corresponding PSDplot, Fig. 6(f). In multiple instances, both FAST+OrcaFlex modelsexperienced line loads greater than those anticipated by the uncoupledFAST model. On a few occasions, the fairlead experienced a lossin tension, such as at t = 923 seconds, for the FAST+OrcaFlex(A) model. At this instance, a snap load ensued, and the uncoupledplatform experienced greater heave motion than its coupled counter-part, suggesting that the mooring line dynamics impart short-duration,localized differences.
Another nondimensional parameter–the dimensionless mooring linetension–shows that mooring line peak tensions scale proportionallyto platform displacement in the frequency domain. In dimensionalform, the equation is (Masciola, et al, 2013):

500 600 700 800 900 1000Time [sec]
−2
0
2
4
6
8
10
Dis
plac
emen
t[m
]
Surge Displacement
MARINFAST+OrcaFlex (A)FAST+OrcaFlex (B)FAST
(a)
0 0.05 0.1 0.15 0.2 0.250
50
100
150
200
250
300
350
400
Surge PSD
Frequency [Hz]
Power
SpectralDen
sity
[m2/Hz]
0 0.5 1 1.5
10−2
100
102
[Hz]
[m2/Hz]
Log-y Scale
(b)
500 600 700 800 900 1000Time [sec]
−3
−2
−1
0
1
2
3
Dis
plac
emen
t[m
]
Heave Displacement
MARINFAST+OrcaFlex (A)FAST+OrcaFlex (B)FAST
(c)
0 0.05 0.1 0.15 0.2 0.250
5
10
15
20
25
Heave PSD
Frequency [Hz]
Power
SpectralDen
sity
[m2/Hz]
0 0.5 1 1.510
−4
10−2
100
102
[Hz][m
2/Hz]
Log-y Scale
(d)
500 600 700 800 900 1000Time [sec]
0.8
1.0
1.2
1.4
1.6
1.8
Forc
e[N
]
×106 Fairlead Tension (Mooring 2)
MARINFAST+OrcaFlex (A)FAST+OrcaFlex (B)FAST
(e)
0 0.05 0.1 0.15 0.2 0.250
2
4
6
8
10
12x 10
11 Mooring Line 2 PSD
Frequency [Hz]
Power
SpectralDen
sity
[N2/Hz]
0 0.5 1 1.5
106
108
1010
1012
[Hz]
[N2/Hz]
Log-y Scale
(f)
Fig. 5: Illustration of the platform surge (a) and heave (c) time series for Operational Case 1, Table 2. The fairlead tension in mooring line2 is pictured in (e). The corresponding power spectral density (PSD) plots are shown to the right of the time-series plots. The small inset
plot in (b), (d), and (f) shows the power spectrum across a broader frequency range.

500 600 700 800 900 1000Time [sec]
−5
0
5
10
Dis
plac
emen
t[m
]
Surge Displacement
FAST+OrcaFlex (A)FAST+OrcaFlex (B)FAST
(a)
0 0.05 0.1 0.15 0.2 0.250
50
100
150
200
250
300
350
400
450
500
Surge PSD
Frequency [Hz]
Power
SpectralDen
sity
[m2/Hz]
0 0.5 1 1.5
10−2
100
102
[Hz]
[m2/Hz]
Log-y Scale
(b)
500 600 700 800 900 1000Time [sec]
−10
−5
0
5
10
Dis
plac
emen
t[m
]
Heave Displacement
FAST+OrcaFlex (A)FAST+OrcaFlex (B)FAST
(c)
0 0.05 0.1 0.15 0.2 0.250
100
200
300
400
500
600
Heave PSD
Frequency [Hz]
Power
SpectralDen
sity
[m2/Hz]
0 0.5 1 1.510
−4
10−2
100
102
[Hz][m
2/Hz]
Log-y Scale
(d)
500 600 700 800 900 1000Time [sec]
0.0
0.5
1.0
1.5
2.0
2.5
3.0
Forc
e[N
]
×106 Fairlead Tension (Mooring 2)
FAST+OrcaFlex (A)FAST+OrcaFlex (B)FAST
(e)
0 0.05 0.1 0.15 0.2 0.250
0.5
1
1.5
2
2.5
3
3.5
4
4.5x 10
12 Mooring Line 2 PSD
Frequency [Hz]
Power
SpectralDen
sity
[N2/Hz]
0 0.5 1 1.5
106
108
1010
1012
[Hz]
[N2/Hz]
Log-y Scale
(f)
Fig. 6: Illustration of the platform surge (a) and heave (c) time series for Operational Case 2, Table 2. This example demonstrates a casewhere the platform tension varies drastically between the coupled and uncoupled numerical models. The small inset plot in (b), (d), and (f)
shows the power spectrum across a broader frequency range.

T (s) ∝ EAk
L tanh(k)q(s) (7)
where q(s) is the power spectrum of the platform displacement andk is the dimensionless elastic mooring line wave number:
k =
√s2 + s
Ldzµcz
(8)
where s = jω. The variable k exists because of the natural dynamicsof the mooring line (i.e., it captures the longitudinal cable vibrationsin Eq. 5). We find that the variance in the mooring line tensionincreases as the floating platform motion q(s) increases. As the sea-state grows, so will the value for q(s). Equation 7 highlights therelationships that exist between the platform properties and environ-ment parameters when assessing the importance of the mooring linedynamics. For most floating offshore systems, there is an implicitrelationship between the left-hand side of Eq. 7 and q(s), whichmakes it difficult to predict the role of the mooring line dynamics inthe platform response as a whole.
ASSESSMENT OF MOORING DYNAMICS ON PLAT-FORM MOTION AND CONCLUSION
This paper discusses the significance of mooring line dynamics on theloads of a semisubmersible floating offshore wind turbine using theDeepCwind geometry as a surrogate of study. To develop the coupledsemisubmersible model, FAST is combined with OrcaFlex to capturethe dynamics of the mooring lines. The results in this paper alsoconsider an uncoupled model using FAST and MARIN tank test datafor a 1/50th-scale Froude model subjected to equivalent sea-states.In total, one experiment and three simulation models were comparedwith one another. Differences between the three numerical modelsand one wave tank model were observed in irregular wave cases.These differences are largely attributed to:
1) Discrepancies in how the hydrodynamics model was imple-mented.
2) The mooring representation (uncoupled analysis versus cou-pled analysis).
3) The absence of second-order hydrodynamic effects in thenumerical models (Coulling, et al, 2013).
4) The inability of the numerical models to capture the fullcharacteristics of the wave tank model.
The quasi-static mooring line used in the uncoupled FAST modeldoes not model cable dynamics, which explains the large differencesobserved in the tension plots in Figs. 6(e)∼6(f) and RAO studiesshown in Fig. 4(d).
A key finding in this paper is that the mooring line dynamics havea limited role in influencing the surge and heave semisubmersiblemotion, but are significant when observing the tendon tension inextreme sea-states. For low sea-states, the uncoupled model providesacceptable levels of fidelity in modeling the platform motion forthe six regular and one irregular wave cases studied. However, thismodel breaks down in larger sea-states, where the effects of mooringline inertia, added-mass, and drag tend to overwhelm the staticforces/mean cable tensions. Another observation the researchers notedin this paper during the course of this investigation concerns extremetension loads, especially at the onset of a snap load. When snaploads occur, the coupled and uncoupled platform responses differ.The duration between a loss of cable tension and a snap load is short,
but is important enough to affect the outcome of the results. A snapload results in a large force being applied to the platform due to rapidcable retensioning, and this reaction explains why large differencesoccur between the coupled and uncoupled models in regions nearsnap loads. The prediction of extreme loads is an important issuewhen evaluating the survivability of a particular offshore floatingwind turbine design.
The findings in this paper are generally geometry-, platform-, and sea-state-dependent, and should not be used to characterize or interpretthe response of other semisubmersibles. Further studies are neededto ascertain exact instances and environments when mooring linenonlinearities and inertia are important. As Eq. 7 suggests, theimportance of the mooring line dynamics is difficult to diagnose,as the force is dependent on platform displacement, which is largelydriven by sea-state conditions. An important finding of this worksuggests that the mooring loads calculated using a quasi-static modelmay underpredict the dynamic response of a cable in extreme eventsituations as well as in regular wave conditions.
ACKNOWLEDGMENTS
This research was funded by the U.S. Department of Energy’s Windand Water Power Program.
REFERENCES
Abbott, MB, and Price, WA (1994). Coastal, Estuarial and HarbourEngineer’s Reference Book, Taylor & Francis, New York, NewYork, USA.
API Recommended Practice 2T (1997). Recommended Practices forPlanning, Designing, and Constructing Tension Leg Platforms,American Petroleum Institute, 254 pp.
API Recommended Practice 2SK (2005). Design and analysis of sta-tionkeeping system for floating structures, Third Edition, AmericanPetroleum Institute.
Chakrabarti, SK (1994). Offshore Structure Modeling. World Scien-tific Press, River Edge, New Jersey, USA, 470 pp.
Coulling, AJ, Goupee, AJ, Robertson, AN, Jonkman, JM, and Dagher,HJ (2013). “Validation of a FAST semisubmersible floating windturbine model with DeepCwind test data,” Journal of Renewableand Sustainable Energy, in review.
Det Norske Veritas (DNV) (2010). Recommended Practice: GlobalPerformance Analysis of Deepwater Floating Structures, DNV-RP-F205, 28 pp.
French, AP (1971). Vibrations and Waves, W.W. Norton and Com-pany, New York, NY, USA.
Idichandy, JA, and Bhattacharyya, VG (2004). “Experimental andNumerical Study of Coupled Dynamic Response of a Mini TensionLeg Platform,” Journal of Offshore Mechanics and Arctic Engi-neering, Vol. 125, pp. 318-330.
Irvine, M (1992). Cable Structures. Dover Publications, 272 pp.Jefferys, ER, and Patel, MH (1982). “On The Dynamics of Taut
Mooring Systems,” Engineering Structures, Vol. 4, No. 1, pp. 37-43.
Jonkman, JM, and Buhl Jr., ML (2005). FAST User’s Guide, NRELTechnical Report, NREL/EL-500-29798.
Jonkman, JM (2007). Dynamics Modeling and Loads Analysis ofan Offshore Floating Wind Turbine, NREL Technical Report,NREL/EL-500-41958, 208 pp.
Jonkman, JM, Butterfield, S, Musial, W, and Scott, G (2007).Definition of a 5-MW Reference Wind Turbine for Offshore SystemDevelopment,” NREL Technical Report No. TP-500-38060.
Ketchman, JJ, and Lou, YK (1975). “Application of the FiniteElement Method to Towed Cable Dynamics,” Proceedings ofMTS/IEEE OCEANS ‘75, Los Angeles, California, USA. Vol. 1,pp. 98-107.
Kwan, CT, and Bruen, FJ (1991). “Mooring Lines Dynamics: Com-parison of Time Domain, Frequency Domain, and Quasi-StaticAnalysis,” 23rd Annual Offshore Technology Conference (OTC),May 6-9, Houston, Texas, USA. Vol 3, Paper No, 6657, pp. 95-109.
Lee, CH, and Newman, JN (2006). WAMIT User Manual, Versions6.4, 6.4PC, 6.3S, 6.3S-PC, WAMIT, Inc., Chestnut Hill, Mas-sachusetts, USA.
Masciola, MD, Robertson, A, Jonkman, J, and Driscoll, FR (2011).“Investigation of a FASTOrcaFlex Coupling Module for Integrat-ing Turbine and Mooring Dynamics of Offshore Floating WindTurbines,” International Conference on Offshore Wind Energy andOcean Energy, Oct. 31 - Nov. 2, Beijing, China.
Masciola, MD, Nahon, M, and Driscoll, FR (2013). “PreliminaryAssessment of the Importance of Platform-Tendon Coupling in aTension Leg Platform,” Journal of Offshore Mechanics and ArcticEngineering, In Press.
Merchant, HC, and Kelf, MA (1973). “Non-Linear Analysis ofSubmerged Buoy Systems,” Proceedings of MTS/IEEE OCEANS1973, Vol. 1, pp. 390-395.
Orcina, Ltd. (2012). OrcaFlex Manual, Version 9.6a, 474 pp.Robertson, A, Jonkman, J, Masciola, MD, Song, H, Groupee, A,
Coulling, A, and Luan, C (2012). Definition of the semisubmersibleFloating System for Phase II of OC4, NREL Technical Report,Golden, Colorado, USA.
St. Denis, M, and Pierson, WJ (1950). “On the Motion of Ships inConfused Seas,” SNAME Transactions 61, pp. 280-332.
Wang, L, Guo, Z, and Yuan, F (2010). “Quasi-Static Three-Dimensional Analysis of Suction Anchor Mooring System,” OceanEngineering, No. 37, pp. 1127-1138.