Sources of Fecal Indicator Bacteria to Groundwater, Malibu Lagoon and the Near-Shore Ocean

Office of Water (4305T)
December 2010
Assessment of the Extra-Enteric Behavior of Fecal Indicator Organisms in Ambient Waters
December 2010 i
Disclaimer
Mention of commercial products, trade names, or services in this document or in the references
and/or endnotes cited in this document does not convey, and should not be interpreted as
conveying, official EPA approval, endorsement, or recommendation.
December 2010 ii
Acknowledgments
Questions concerning this document should be addressed to the EPA Work Assignment
Manager:
John Ravenscroft
USEPA Headquarters
Office of Water, Office of Science and Technology
1200 Pennsylvania Avenue, NW
Mail Code: 4304T
Washington, DC 20460
Phone: 202-566-1101
Email: [email protected]
Preparation of this document was conducted under EPA Contract EP-C-07-036 to Clancy
Environmental Consultants, Inc., a Tetra Tech Company. The following individuals contributed
to the development of the report:
Co-lead writer: Jeffrey Rosen Clancy Environmental Consultants, Inc.
Co-lead writer: Mark Gibson Clancy Environmental Consultants, Inc.
Co-lead writer: Timothy Bartrand Clancy Environmental Consultants, Inc.
Alexis Castrovinci ICF International
Jennifer Clancy Clancy Environmental Consultants, Inc.
Mary Clark ICF International
Elizabeth Dederick ICF International
Karen Fox Clancy Environmental Consultants, Inc.
Dean Gouveia ICF International
Kelly Hammerle ICF International
Jose Sobrinho Clancy Environmental Consultants, Inc.
Laura Tuhela-Reuning ICF International
Jennifer Welham ICF International
December 2010 iii
Contents
DISCLAIMER ................................................................................................................................................................... I
ACKNOWLEDGMENTS .................................................................................................................................................. II
CONTENTS ................................................................................................................................................................... III
LIST OF TABLES AND FIGURES .....................................................................................................................................V
1. EXECUTIVE SUMMARY ........................................................................................................................................ 1
2. BACKGROUND AND INTRODUCTION .................................................................................................................... 5
2.1 Background ................................................................................................................................................ 5 2.2 Introduction ................................................................................................................................................ 5
3. AMBIENT FACTORS AND THEIR EFFECTS ON INDICATOR PRESENCE AND BEHAVIOR .................................... 11
3.1 Introduction .............................................................................................................................................. 11 3.2 Environmental Parameters that Potentially Affect the Behavior of Fecal Indicators in Different
Geographic Regions ................................................................................................................................. 12 3.3 Effects of Environmental Parameters on Fecal Indicators in Different Geographic Regions .................. 13
3.3.1 The Great Lakes Region ................................................................................................................. 13 3.3.2 Florida ............................................................................................................................................. 15 3.3.3 Mississippi ...................................................................................................................................... 17 3.3.4 California ........................................................................................................................................ 17 3.3.5 Hawaii ............................................................................................................................................. 19 3.3.6 Guam ............................................................................................................................................... 20 3.3.7 Puerto Rico...................................................................................................................................... 21 3.3.8 Australia and New Zealand ............................................................................................................. 22
3.4 Indigenous Populations of Fecal-Associated Organisms ......................................................................... 23 3.5 Summary .................................................................................................................................................. 24
4. THE ROLE OF PHYSICAL, CHEMICAL, AND BIOLOGICAL FACTORS IN THE EXTRA-ENTERIC BEHAVIOR OF
FECAL INDICATOR ORGANISMS IN AMBIENT WATERS, SEDIMENTS, AND SOILS ..................................................... 26
4.1 Background .............................................................................................................................................. 26 4.2 Section Contents ...................................................................................................................................... 27 4.3 Description of Studies Examining Extra-Enteric Occurrence and Survival ............................................. 27 4.4 Classification of Environments ................................................................................................................ 30 4.5 Factors Influencing the Occurrence, Persistence, and Growth of Fecal Indicator Organisms ................. 31 4.6 Evidence of Extra-Enteric Growth ........................................................................................................... 33
4.6.1 Direct Observation of Growth ......................................................................................................... 34 4.6.2 Indirect Evidence of Growth ........................................................................................................... 37 4.6.3 Assessment of Conditions Supporting Growth and Identification of Data Gaps ............................ 37
4.7 Evaluation of Factors Contributing to Occurrence, Persistence, or Growth of Indicator Organisms ...... 39 4.7.1 General Parameters ......................................................................................................................... 39 4.7.2 Context-Related Parameters ............................................................................................................ 49
4.8 Modeling .................................................................................................................................................. 54 4.9 Summary and Conclusions....................................................................................................................... 55
5. ALTERNATIVE INDICATORS FOR TROPICAL AND SUBTROPICAL REGIONS ..................................................... 58
5.1 Alternative Indicators of Fecal Contamination: Microbiological ............................................................ 58 5.1.1 Clostridium perfringens .................................................................................................................. 58 5.1.2 Bacteroides ...................................................................................................................................... 59 5.1.3 Bifidobacteria .................................................................................................................................. 60 5.1.4 Coliphages ...................................................................................................................................... 60 5.1.5 Bacteroides Phages ......................................................................................................................... 62
5.2 Alternative Indicators of Fecal Contamination: Chemical Biomarkers ................................................... 62 5.2.1 Fecal Steroids .................................................................................................................................. 62

December 2010 iv
5.2.2 Optical Brighteners ......................................................................................................................... 63 5.2.3 Pharmaceuticals and Personal Care Products .................................................................................. 63
5.3 Summary .................................................................................................................................................. 64
6. REFERENCES ...................................................................................................................................................... 65
APPENDIX A .............................................................................................................................................................. A-1
APPENDIX B............................................................................................................................................................... B-1
APPENDIX C .............................................................................................................................................................. C-1

December 2010 v
List of Tables and Figures
Table 1. Classification of studies reviewed for assessing behavior of indicator organisms ...................... 29
Table 2. Conditions under which fecal indicator organism growth has been either measured or inferred in
ambient conditions ...................................................................................................................................... 34
Table 3. Settings for which temperature effects on extra-enteric fate were studied .................................. 40
Table 4. Settings for which salinity effects on extra-enteric fate ............................................................... 43
Table 5. Settings for which light and sunlight effects on extra-enteric fate were studied ......................... 43
Table 6. Settings in which suspended solids and turbidity effects on extra-enteric ................................... 46
Table 7. Settings for which rainfall and runoff effects on extra-enteric fate were..................................... 49
Table 8. Settings for which mixing and circulation effects on extra-enteric fate were studied ................. 52
Table 9. Summary of potential physical parameters that may affect the behavior of fecal indicators in
different geographic regions ..................................................................................................................... C-2
Table 10. Summary of potential chemical parameters that may affect the behavior of fecal indicators in
different geographic regions ..................................................................................................................... C-7
Table 11. Summary of potential biological parameters that may affect the behavior of fecal indicators in
different geographic regions ..................................................................................................................... C-9
Table 12. Summary of studies in growth of fecal indicator bacteria (FIB) was measured or inferred .. C-10
Table 13. Summary of laboratory studies .............................................................................................. C-15
Table 14. Range of decay and growth rates observed in laboratory studies .......................................... C-18
Table 15. Summary of studies examining the influence of temperature on persistence and growth of
indicator organisms ................................................................................................................................. C-21
Table 16. Summary of studies examining the influence of salinity on persistence and growth of indicator
organisms ................................................................................................................................................ C-26
Table 17. Summary of studies examining the influence of incident natural or artificial light on persistence
and growth of indicator organisms.......................................................................................................... C-30
Table 18. Summary of studies examining the influence of turbidity and suspended solids on the
persistence and growth of indicator organisms ....................................................................................... C-34
Table 19. Summary of studies examining the influence of rainfall and runoff on persistence and growth
of indicator organisms ............................................................................................................................. C-37
Table 20. Summary of studies examining the influence of mixing, currents and tidal effects on
persistence and growth of indicator organisms ....................................................................................... C-41
Table 21. Survey of alternative microbiological and chemical indicators of fecal contamination ........ C-44
Figure 1. Illustration of the processes determining the incidence of culturable E. coli in Lake Michigan
beach waters ................................................................................................................................................ 33

December 2010 1
1. Executive Summary
The U.S. Environmental Protection Agency (hereafter EPA) is charged with the development of
criteria and regulations to protect the public from exposure to microbiological contaminants of
fecal origin in recreational water. In 1986, EPA promulgated recreational ambient water quality
criteria based on a series of epidemiological studies that were conducted in the late 1970s and
early 1980s and apply to all waters of the United States that have a recreational use designation.
The studies were conducted in temperate fresh and marine recreational waters that were
impacted by point sources of human sewage. The criteria correspond to the increased risk of
acute gastroenteritis (gastrointestinal [GI] illness) resulting from exposure to contaminated water
as measured by the presence of E. coli or enterococci—both of which are “fecal indicator”
bacteria that grow in the gastrointestinal tract of humans and other warm-blooded animals and
are excreted in large numbers in feces—in fresh recreational waters or measures of enterococci
in marine waters. Several other epidemiological studies, most of which were conducted in
temperate regions of the world, have shown a consistent and often strong correlation between
traditional bacterial indicators and human illness. The illnesses are usually some form of acute
GI illness resulting from recreation in water contaminated by point sources of human sewage.
Nonpoint microbial pollution also represents a major source of contamination of marine and
fresh recreational waters, and other epidemiological studies have concluded that there is a poor
correlation between levels of the traditional bacterial indicators and nonpoint sources of
microbial pollution.
While the relationship between the presence of traditional fecal indicators in ambient water and
human illness has been quantified in many temperate regions, numerous researchers have
reported the presence of fecal indicator bacteria in the aquatic environment in the absence of
human fecal contamination. Although these exceptions were originally noted in tropical and
subtropical regions, they have been documented increasingly in temperate areas. Collectively,
these studies suggest that under particular conditions, fecal indicator organisms from a variety of
point and especially nonpoint sources (e.g., stormwater runoff, domestic pets, birds) can colonize
and proliferate in ambient waters and associated sand and sediment. As a consequence, routine
monitoring of fecal indicator bacteria may detect fecal indicator concentrations in excess of
federal or state water quality standards—possibly resulting in unnecessary action being taken,
such as beach advisories and closings (and also listings of ambient waters on the Clean Water
Act (CWA) 303(d) list of impaired waters).
In 2001, a group of 18 national and international experts convened the “Tropical Water Quality
Indicator Workshop” to discuss the growing body of literature and research on potential
limitations of the continued reliance on fecal indicator bacteria for assessing the microbial
quality of recreational waters in tropical and subtropical regions. The focus of the workshop was
to evaluate the problems associated with appropriate water quality standards in tropical locations,
as described and reported by experts/scientists from Hawaii, Guam, Puerto Rico, and south
Florida. The participants agreed that reliable interpretations of the current recreational water
quality standards in (sub)tropical locations may be compromised due to environmental sources of
fecal indicator bacteria. Such consensus statements represent agreements in understanding
regarding how environmental factors can control the behavior of traditional indicator
microorganisms in ambient waters and how these factors can affect the development and use of
December 2010 2
water quality criteria and standards in recreational environments. Given the importance and
relevance of that workshop, details of its objectives, goals, and other consensus statements are
summarized in Appendix A of this draft report.
Various environmental parameters can affect the behavior of fecal indicator microorganisms in
the aquatic environment. The parameters that can affect the concentration of fecal indicator
organisms include the following: temperature, rainfall, light, runoff, suspended solids, turbidity,
water depth, stratification, mixing, resuspension, pH, alkalinity, and salinity. Because these
environmental parameters may have different and potentially significant effects on the presence
of indicator microorganisms depending upon the climate (tropical, subtropical, or temperate) and
the combination of parameters, they are reviewed in this draft report. The resulting effects can
be extreme; for example, blooms of E. coli in inland water reservoirs in Australia may be
classified incorrectly as a result of recent fecal contamination. Misclassification of fecal
associated organisms as evidence of human fecal contamination as opposed to indigenous
populations may result ultimately in beach closings and unneeded, expensive, and ineffective
mitigation efforts.
A comprehensive review of the literature indicates that the most important general features of
environments influencing the growth or persistence of indicator organisms are, in order of
importance, sunlight, salinity, and temperature. Synergy between the effects of temperature and
sunlight and temperature and salinity were observed. Other factors playing important roles in the
persistence of indicator organisms are soil type and properties (for organisms in soils and
sediments or for particle-associated bacteria) and competition and predation from the indigenous
population. Growth of indicator organisms has been reported or inferred in all climate zones
(tropical, subtropical, and temperate) of concern in this draft report; in all water types (marine,
estuarine, and fresh); and in soils and the water column—with the exception of growth in the
marine water column. Absence of observations of growth in the marine water column does not
necessarily indicate there is no potential for growth. Site extensive properties (rainfall, mixing,
and watershed characteristics) play important roles in determining the occurrence of indicator
organisms and are related to extreme variability of indicator counts in the water column and
sediments.
There are several opportunities for further analyses of data in the literature survey, though data
gaps must be filled before these analyses can be conducted. First, studies exploring the kinetics
(growth and decay) of indicator organisms could be analyzed together in an attempt to ascertain
optimal conditions for growth or persistence. This analysis will require quantification of the role
of predation on observed decay rates and assembly of additional data collected in experiments in
soils and sediments, and in samples collected in regions where fecal impacts from agricultural
sources are expected. Other analyses could seek to relate indicator organism occurrence and
temporal variations to rainfall, watershed characteristics, and mixing. Challenges to the
development and execution of these analyses will be that the literature are characterized by a
number of well-studied environments and relatively few studies on other environments such as
riverine environments, and that most studies in the literature provide only qualitative data on
watershed hydrologic characteristics and fecal indicator organism loadings.

December 2010 3
Due to the documented limitations of culturable methods to detect and enumerate traditional
fecal bacteria as indicators of waterborne pathogens in tropical and subtropical regions of the
United States and abroad, a variety of alternative indicators and indicator approaches have been
proposed and assessed in recreational areas. Such alternative approaches can be divided broadly
into those that are microbiologically-based and those that involve the use of chemical markers.
This draft report reviews many of the more promising indicators and indicator approaches.
Much of the research into alternative indicators of microbial water quality is closely tied to
microbial (fecal) source tracking efforts. Notably, whether an approach is chemically- or
microbiologically-based, these alternative methods are used often in conjunction with traditional
bacterial indicators to assess their validity and utility in assessing microbial water quality.
Another promising approach to assessing microbial water quality involves the development and
use of water quality notification models—most commonly simple heuristic models that relate
precipitation or land use to water quality. These models are often used in conjunction with the
collection and enumeration of traditional microbial indicator organisms. However, a discussion
of modeling approaches and applications as related to the use of alternative indicators for
assessing microbial water quality is beyond the scope of this draft report.
Until the last decade or so, most alternative microbiological indicators to assess recreational
water quality criteria have been culturable bacteria. With the growing development and use of
molecular detection techniques (e.g., polymerase chain reaction [PCR]), a broader variety of
bacteria and now viruses (especially viruses of bacteria, called bacteriophage or phage) are now
available as potential alternatives to traditional fecal indicator bacteria. Notably, these
techniques have also given rise to the science needed to develop robust approaches to identify
and track the sources of microbial contamination, using both traditional indicator bacteria as well
as many of the novel bacteria and viruses that are discussed in this draft report. Given these
technological advances, some researchers have advocated approaches to detect so-called
indicator bacteria (e.g., Staphylococcus aureus, Vibrio vulnificus) and viruses (e.g.,
enteroviruses) that are actually or potentially pathogenic, especially to immunocompromised
persons. However, a discussion of the direct detection of pathogens to assess microbial water
quality is also beyond the scope of this draft report.
Researchers have been documenting issues and limitations associated with the use of traditional
indicator bacteria for assessing the presence of fecal contamination in recreational waters for
decades. Many of the limitations noted in this draft report were reported initially in first tropical,
then subtropical regions of the United States and abroad. It is becoming clear that sand,
sediment, and soil can serve as reservoirs of fecal indicator bacteria in many tropical,
subtropical, and temperate recreational waters. Generally, studies agree that such media provide
microenvironments that are more suitable to the survivability and (re)growth of fecal indicator
bacteria—and thus potentially for some waterborne pathogens—than the water column.
However, current EPA recreational water quality criteria and state water quality standards do not
typically require monitoring of beach sand for fecal indicator bacteria. Thus, many researchers
have questioned the validity of continued reliance on the periodic measurement of fecal indicator
bacteria in the water column as the sole means of determining the microbial quality of ambient
waters.
December 2010 4
To help address and potentially resolve these limitations, researchers have evaluated and
reported on the use of a wide variety of alternative (and increasingly sophisticated)
microbiological and chemical indicators of fecal contamination in ambient waters in a variety of
regions. Despite the limitations of current fecal indicator bacteria, there is no clear support for
the widespread use of an alternative indicator to replace current fecal indicators in ambient
waters in tropical, subtropical, or temperate regions. The 2004 National Research Council
(NRC) report, Indicators for Waterborne Pathogens, concluded “indicator approaches will still
be required for the foreseeable future because it is not practical or feasible to monitor for the
complete spectrum of microorganisms that may occur in source waters for drinking water and
recreational waters [emphasis added], and many known pathogens are difficult to detect
directly and reliably in water samples.” This fact has not changed in the six years since the NRC
committee of experts issued this key conclusion. Confidence in the development and use of
alternative indicators to supplement or potentially replace current indicators could increase,
however, as EPA and others conduct health studies that demonstrate a statistically valid
correlation between the presence of one or more alternative indicators with an increased
incidence of illness in exposed persons, thus ensuring that the use of a new indicator is based on
health risk.
U.S. Environmental Protection Agency
December 2010 5
2. Background and Introduction
2.1 Background
The EPA is charged with the development of criteria and regulations to protect the public from
exposure to microbiological contaminants of fecal origin in recreational water. The overall goal
of the current ambient water quality criteria (AWQC) for bacteria in the United States is to
provide public health protection from gastroenteritis (GI illness) associated with exposure to
fecal contamination during water-contact recreation. Periodic review of the scientific literature
and re-evaluation of emerging scientific issues including detection and enumeration
methodologies are required to meet these requirements effectively. Since EPA’s most recent
release of recreational water quality criteria in 1986, there have been significant advances,
particularly in the areas of molecular biology, microbiology, and analytical chemistry. EPA
believes that that these and other scientific and technical advances need to be considered and
evaluated for feasibility and applicability in the development of new or revised CWA Section
304(a) criteria for recreation by 2012. To this end, EPA has been conducting research and
assessing relevant scientific and technical information to provide the scientific foundation for the
development of new or revised criteria.
The enactment of the Beaches Environmental Assessment and Coastal Health (BEACH) Act of
2000 (which amended the CWA) required EPA to conduct new studies and issue new or revised
criteria—specifically for Great Lakes and coastal marine waters. To help address and fulfill the
requirements of the BEACH Act, in March 2007, EPA convened a group of 43 national and
international technical, scientific, and implementation experts from academia, numerous states,
public interest groups, EPA, and other federal agencies at a formal workshop (referred to as the
Airlie Workshop) to discuss the state of the science on recreational water quality research and
implementation issues (USEPA 2007a). In addition to the written report of the Airlie Workshop,
EPA developed a Critical Path Science Plan for Development of New or Revised Recreational
Water Quality Criteria (USEPA 2007b) by soliciting and considering the feedback, detailed
input, and recommendations from the larger group of stakeholders who represented the general
public, public interest groups, state and local government, industry, and municipal wastewater
treatment professionals. One key question posed in the Science Plan is the extent to which
indicators of waterborne pathogens perform differently in a tropical environment compared to
temperate or subtropical environments. The Science Plan emphasizes the need to better
understand the underlying causes for any differences.
The purpose of this draft report is to survey the existing knowledgebase to determine what the
available data say with regard to indicator behavior in ambient waters and what differences exist
in currently used fecal indicators when they are applied in tropical, subtropical, and temperate
regions. Additionally, potential alternative indicators will be described and their applicability in
tropical and subtropical environments will be discussed.
2.2 Introduction
Millions of people swim and recreate in coastal and inland waters in temperate, tropical, and
subtropical locations throughout the United States and its territories every year (Dorfman and

U.S. Environmental Protection Agency
December 2010 6
Stoner 2007). These polluted waterbodies can contribute to waterborne illness, especially in
children and people with compromised immune systems. Annually, an estimated 120 million
gastrointestinal illnesses are experienced globally due to contact with polluted coastal waters,
resulting in $12 billion in public health costs (Shuval 2003). It is believed that the majority of
the illnesses are caused by exposure to pathogenic bacteria and viruses of human fecal origin
(NRC 2004, USEPA 2009). The World Health Organization (WHO) has identified at least 20
pathogens found in recreational water that can cause severe health effects, including
adenoviruses, hepatitis viruses, Giardia lamblia, Cryptosporidium parvum, pathogenic
Escherichia coli, Campylobacter spp., and Salmonella spp. (WHO 2005).
Public health can be effectively protected by monitoring and controlling the microbial pathogens
that cause illness. Theoretically, regular monitoring of these microorganisms could identify
where and when concentrations reach a level associated with risk of human illness. Monitoring
results could be used to post of warnings of water contamination or to make decisions about the
closing of beaches by public health officials. However, many pathogens are difficult or costly to
collect and detect (Griffin et al. 2001). Because widespread monitoring of recreational waters
directly for all disease-causing microorganisms remains infeasible, public health and
environmental protection agencies have relied on the detection of fecal indicator organisms to
indicate the presence and magnitude of fecal material. This approach assumes that waterborne
pathogens co-occur with the fecal material and that greater quantities of fecal contamination
yield greater quantities of pathogens (NRC 2004).
The properties of ideal indicators are presented in Chapter 4 of the NRC report titled Indicators
of Waterborne Pathogens (NRC 2004). Effective indicator organisms have the following
characteristics:
a demonstrated correlation with health risk;
similar or greater survival time than the target pathogen;
similar or greater transport than the target pathogen;
presence in greater numbers than the pathogen; and
specificity to a fecal source or an identifiable source of origin.
Thus, the development of an indicator for use in recreational waters includes both the
identification of the organism that will reliably predict the presence of fecal contamination as
well as the method used to analyze the indicator. Consequently, effective indicator analysis
methods should have the following characteristics (NRC 2004):
be specific to the desired target organism;
have broad applicability;
be precise;
have adequate sensitivity;
produce rapid results;
be quantifiable;
measure viability and/or infectivity; and
be logistically feasible.

U.S. Environmental Protection Agency
December 2010 7
These indicator characteristics are supported by the World Health Organization (WHO), which
has a similar set of criteria for effective indicators of fecal contamination. Accordingly,
indicators should (WHO 2005):
be universally present in large numbers in the feces of humans and animals;
not multiply in natural waters;
persist in water in a similar manner to fecal pathogens;
be present in water in higher numbers than fecal pathogens;
respond to treatment processes in a similar fashion to fecal pathogens; and
be readily detected by simple, inexpensive methods.
The “classic” indicators include culturable total coliforms, fecal (thermotolerant) coliforms, E.
coli (an important member of the coliform group), and enterococci, all of which have been used
for decades (Field and Samadpour 2007, Fujioka 2001, Schwab 2007). However, because the
total coliform group is often found in vegetation and soil, yielding variable correlation with
public health, it is no longer widely used in recreational waters of the US and cannot be used by
Great Lakes states (Cabelli et al. 1983, USEPA 2004).
Though states set their own water quality standards, in 1986 the USEPA recommended
enterococci as recreational water fecal indicator bacteria in marine water and E. coli for
freshwater (USEPA 1986). Both bacteria are facultative anaerobes, though enterococci are Gram
positive while E. coli are Gram negative. These bacteria are highly concentrated in fecal
material and easy and inexpensive to detect. Furthermore, a series of epidemiological studies
conducted in the 1970s and 1980s (Cabelli et al. 1982, Cabelli et al. 1983, Dufour 1984)
demonstrated these indicators were correlated with gastrointestinal symptoms in swimmers at
temperate marine and freshwater beaches affected by point source fecal pollution.
The epidemiological data were generated at a small number of temperate locations with known
sources of fecal pollution and then generalized for use in all US ambient waters, regardless of
climate, geography and source of pollution. There is growing concern that these indicators may
not be effective in all climatic zones and geographic locations (for definitions of climates, refer
to Text Box 1); for example, traditional fecal indicator bacteria are observed at levels exceeding
EPA criteria in Hawaii even in the absence of fecal contamination (Fujioka et al. 1997).
Particular concerns have been raised in other tropical and subtropical regions of the US and its
territories because designated indicators appear to flourish and reproduce in many soils,
sediments, algal wrack, and other benthic systems (Solo-Gabriele et al. 2000, Desmarais et al.
2002, Byappanahalli et al. 2003, Byappanahalli and Fujioka 2004, Yamahara et al. 2007). These
inconsistencies in the behavior of E. coli and enterococci in ambient waters suggest that using
fecal indicators that have not been validated widely in diverse geographic regions could result in
significant numbers of false positive results, which could lead to warnings, violations, and
potential beach closings in the absence of actual fecal contamination of recreational waters. The
estimates for annual costs of beach closures in California alone range from $17,000,000 to
$179,000,000 per year (Pendleton 2008).
There are a number of reasons to expect that the efficacy of E. coli and enterococci as fecal
indicator bacteria may not be appropriately extrapolated from one geographic region across the

U.S. Environmental Protection Agency
December 2010 8
entire United States. As mentioned previously, indigenous populations of these traditional fecal
indicator bacteria have been found in tropical soil (Fujioka et al. 1997), which is problematic
because the use of fecal indicator organisms is predicated on the presumption that there are no
significant environmental sources of these microorganisms. There are also likely differences in
sources of fecal contamination among geographic areas and climates. While E. coli and
enterococci may be appropriate proxies for health effects in water directly affected by sewage,
epidemiological studies have shown that there is a poor correlation between levels of fecal
indicator bacteria and nonpoint sources of microbial pollution (Colford et al. 2007). Nonpoint
pollution sources to recreational water areas are diffuse and much more difficult to identify,
regulate, and mitigate. They typically include agricultural and stormwater runoff,
malfunctioning septic tanks, and fecal waste from domestic pets and wildlife, especially birds.
Although animals shed high numbers of traditional fecal indicator bacteria that can enter
recreational waters, there has been a long-held presumption that animal sources of pathogens
(including zoonotic pathogens, which infect humans but may be carried by animals) and fecal
indicator bacteria are of less public health concern than those released by humans. Nevertheless,
epidemiology data demonstrate a relationship between adverse health effects and swimming in
nonpoint source-affected waters (Haile et al. 1999).
Physical and biological factors that affect the fate and transport of traditional fecal indicator
bacteria also vary across climates. Meteorological factors such as temperature and light have
been shown to limit traditional fecal indicator bacteria persistence (Fujioka and Byappanahalli
2003, Solic and Krstuvolic 1992). Rainfall has also been associated with increased traditional
fecal indicator bacteria concentrations in surface waters (Lipp et al. 2001). Biological factors
that may differ between climates and geographic zones also affect traditional fecal indicator
bacteria survival. Predation can eliminate up to 86% of enteric bacteria released into seawater
(Iriberri et al. 1994), but predator populations, including zooplankton and protists, have spatial
variation (Piontkovski and Williams 1995). Available nutrients, which also vary spatially and
temporally, also affect fecal indicator bacteria survival in surface waters (Korhonen and
Martikainen 1991).
Text Box 1. Definitions of Climates Temperate climate—Very generally, the climatic zone of the “middle” latitudes; the variable climates between the extremes of tropical climate and polar climate. Subtropical climate—In general, a climatic zone with a climate typical of the subtropics, with warm temperatures and meager precipitation. Tropical climate—In general, a climatic zone with a climate typical of equatorial and tropical regions; that is, one with continually high temperatures and with considerable precipitation, at least during part of the year. __________ Definitions of climates come from the Glossary of Meteorology: http://amsglossary.allenpress.com/glossary/.

U.S. Environmental Protection Agency
December 2010 9
The EPA has long recognized these potential weaknesses of E. coli and enterococci as fecal
indicator bacteria in diverse and particularly subtropical and tropical regions. A “Tropical
Indicators Workshop” was convened by the EPA Office of Water, the Department of Health of
the State of Hawaii, and the Water Resources Center of the University of Hawaii in 2001 to
address these weaknesses. Experts from this workshop agreed that the environmental
characteristics of the tropics affect the relationship between indicators of fecal contamination and
health effects observed in bathers, compromising the efficacy of the EPA recreational water
quality guidelines. (For full treatment of this workshop, refer to Appendix A). According to the
Critical Path Science Plan for Development of New or Revised Recreational Water Quality
Criteria (USEPA 2007b), EPA intends to conduct epidemiological tests to determine whether
temperate-derived fecal indicator bacteria standards are appropriately extended to tropical
regions. However, because indicator persistence and behavior in tropical waters has not been
well-characterized, the EPA first requires a comprehensive literature review to determine the
extent to which current indicators may perform differently in tropical, subtropical, and temperate
environments to better understand the underlying causes for any difference (USEPA 2007b).
This is the purpose of this draft report.
This draft report reviews and summarizes research on the applicability and behavior of fecal
indicators in ambient waters and related environments in which the indicators may fail to meet
NRC (2004) and WHO (2005) criteria for effectiveness outlined above. This paper does not
discuss direct linkages or correlations between the indicators and the pathogens that ultimately
cause human illness due to exposure to fecal matter. Literature was reviewed to identify
evidence that geography, climate, and various environmental parameters influence the
effectiveness of fecal indicators. The specific search strategies and databases employed are
provided in Appendix B. Because the purpose of using indicators is to discriminate between
recreational waters that are contaminated with feces that could pose risks to humans and water
that is safe for recreational use, conditions that could result in either an indicator not being
detected when there is a risk (false negative), or in the detection of indicators in the absence of
pathogens when there is not a risk (false positive) are highlighted and explored. Persistence,
growth, and regrowth of indicators in soils, sands, and sediments are of particular concern
because the literature suggests that false positives are often the result of regrowth in sediments
(e.g., Grant et al. 2001). The rates and extent of fecal indicator (re)growth for different
conditions are compared and contrasted to determine whether differences exist based on
locations, climate classifications, salinities, and other environmental parameters.
The focus of most of the literature presented is on characterizing results of monitoring for fecal
indicators in specific climates and environments, with particular emphasis on tropical,
subtropical, and temperate climates and regions and areas characterized by different levels of
fecal impact (expected or observed significant impacts from human sewage, expected or
observed impacts from human agriculture/animal operations, and expected or observed limited
impacts from human sources). Temperate, subtropical, and tropical climates were previously
defined in Text Box 1. These definitions are very broad, and it is unlikely that the biological and
ecological processes associated with the effective use of these indicators can be attributed to such
general climate categories. It is more likely that specific processes occur at particular sites that
are related to the large-scale climatic conditions, but they may not be generalized across all
recreational waters in a particular climate category. Ashbolt et al. (1997) asserted that the
U.S. Environmental Protection Agency
December 2010 10
concentration of organisms and the relationship between indicator occurrence and concentration
to human illness are highly site-specific.
Subsequent sections of this paper document the behavior, including fate and transport, of
indicator organisms in a variety of aquatic environments. The focus is on summarizing evidence
that monitoring for indicators of fecal contamination can lead to erroneous conclusions regarding
exposure to pathogens that can cause human illness and to identify data gaps and research
opportunities to address these critical issues.
U.S. Environmental Protection Agency
December 2010 11
3. Ambient Factors and their Effects on Indicator Presence and Behavior
3.1 Introduction
The literature suggests that traditional fecal indicator bacteria (fecal coliforms, E. coli, and
enterococci) may persist and multiply independent of human fecal contamination in various
geographic locations. Studies conducted in the tropics and subtropics show proliferation of E.
coli, enterococci, and/or fecal coliforms in sediment and sand associated with inland water (Alm
et al. 2003 and 2006, An et al. 2002, Davies et al. 1995, Fujioka et al. 1999, Whitman and
Nevers 2003, Whitman et al. 2003) and coastal waters (Bonilla et al. 2007, Brownell et al. 2007,
Craig et al. 2003, Davies et al. 1995, Ferguson et al. 2005, Ghinsberg et al. 1994, Lee et al. 2006,
Oshiro and Fujioka 1995 Yamahara et al. 2007). Studies show proliferation of fecal indicator
bacteria in coastal (Grant et al. 2001) and inland vegetation (Byappanahalli et al. 2007, Rivera et
al. 1988, Whitman et al. 2003 and 2005) and that changing environmental conditions in tidally-
influenced sediments help support elevated populations of fecal indicator bacteria in water
(Bonilla et al. 2007, Desmarais et al. 2002, Solo-Gabriele et al. 2000). Recent research in the
Great Lakes region (Alm et al. 2003 and 2006, Byappanahalli et al. 2006, Whitman and Nevers
2003) demonstrates that traditional fecal indicator bacteria can also persist and possibly (re)grow
in the sand, soil, and sediment. Bacteria harbored in the sand may persist longer than in the
water because they adhere to sediment particles, unlike free bacteria in the water. Sand acts as a
natural filter that traps environmental particulates and organic matter, providing a habitat for
growth of bacteria including fecal indicator organisms. Microorganisms in the beach sand can
then be mobilized during rising tides or from storms and transported to the water column
(Yamahara et al. 2007).
To facilitate a discussion of the efficacy of indicators for waterborne pathogens in recreational
waters, it is useful to understand the effects of environmental parameters on indicators in
different geographic regions. Relevant research has been conducted over the past 20 years in
tropical, subtropical, and temperate regions to evaluate the effects of geography and climate on
indicators. Some of the most relevant environmental parameters that affect survival and
persistence of fecal indicator bacteria are temperature, salinity, and ultraviolet (UV) irradiation
(Fujioka and Byappanahalli 2003, Solíc and Krstuvolic 1992). The survival of these
microorganisms may also be enhanced due to deposition or adsorption once they are introduced
to coastal waters (Gerba and McLeod 1976). Rainfall has been associated with increased
concentrations of fecal indicators, and extreme wet weather events may overwhelm wastewater
treatment plants and result in runoff from urban and rural areas, leading to increased loading of
fecal associated microorganisms (Fujioka and Byappanahalli 2003, Lipp et al. 2001). Storms
may also result in the reintroduction of microorganisms due to resuspension (Lipp et al. 2001).
This section includes a review of studies conducted in tropical, subtropical, and temperate
climates in which the effects of environmental parameters on fecal indicator bacteria were
evaluated. The ability of fecal indicator bacteria to survive and multiply in the environment
independent of human contamination is described and followed by a short section on the effects
of environmental parameters on target pathogens. A summary section emphasizing key points
concludes this section.

U.S. Environmental Protection Agency
December 2010 12
3.2 Environmental Parameters that Potentially Affect the Behavior of Fecal Indicators
in Different Geographic Regions
Various environmental parameters can affect the behavior of fecal indicator bacteria in ambient
waters and the benthic environment. These parameters may have differing effects on the
indicator microorganisms depending upon the climate (e.g., tropical, subtropical, or temperate).
Section 4 and Appendix C include information and summary tables of both general and context-
specific parameters that may affect the occurrence, persistence, or growth of fecal indicator
organisms in environmental waters.
This paper does not exhaustively discuss the effects of environmental parameters on target
pathogens and focuses for the most part on traditional fecal indicator bacteria and other well
studied alternative indicators and pathogens. However, it is important to review some key
environmental waterborne zoonotic pathogens for the scope of this paper. For a detailed
discussion of this topic, please refer to Review of Zoonotic Pathogens in Ambient Waters
(USEPA 2009). Some of the most commonly studied environmental parameters affecting
pathogen persistence and survival in water include pH, salinity, light exposure, and temperature.
However, additional factors such as UV light (duration, intensity), rainfall, runoff, dispersal,
suspended solids, turbidity, nutrients, organic content, organic foams, water quality, biological
community in water column, water depth, stratification, mixing (e.g., wind and waves), presence
of aquatic plants, biofilms, and predation.
Because fecal indicator bacteria are considered proxies for the pathogens of concern, it is
important to point out some of the environmental conditions relevant to the six key pathogens of
concern. Although waterborne outbreaks of E. coli are not as common as foodborne (Boczek et
al. 2007), it is estimated that from 1971 to 2000 approximately 30% of waterborne diarrheal
illness was due to contact with untreated recreational water (Craun et al. 2004). One of the more
common forms of pathogenic E. coli, Enterohemorrhagic (EHEC) O157:H7 and other EHEC
variants, are zoonotic pathogens associated with severe human illnesses. Ruminants such as
cattle are considered the dominant natural reservoir; however, water has also been implicated as
a means of transmission. Due to methodological limitations, evaluation of the persistence of
EHEC in the ambient environment has remained elusive (Muniesa et al. 2006).
Campylobacter spp. has been implicated in 3% of waterborne outbreaks (1991 to 2002) and
Salmonella spp. was responsible for 0.9% of waterborne disease outbreaks (1971 to 2000)
according to Craun et al. (2004). Illness cause by Leptospira infection has been related to
unusual rainfall events (Bolin et al. 2004, Craun et al. 2004), as well as the rainy season, and in
temperate climates, peak concentrations are seen during summer and fall, due to the pathogen’s
preference for warm, humid conditions (Levett 2001). Cryptosporidium is one of the leading
causes of waterborne diarrheal outbreaks in the United States and increases in disease incidence
are correlated with run-off events (CDC 2007, Tate et al. 2000). Giardia infections have an
association with increased bather density and higher turbidity due to resuspension of cysts in the
sediments by bathers (Graczyk et al. 2007, Sunderland et al. 2007). While the risk and severity
of human illness associated with exposure to treated and untreated sewage remains the greatest
threat, the implications of human illness due to contamination with animal feces and zoonotic
pathogens should not be underestimated. It is important to remember that the aforementioned

U.S. Environmental Protection Agency
December 2010 13
waterborne pathogens are most likely to have the most debilitating effects on the elderly,
children, and immunocomprised individuals. Pathogenic E. coli has the greatest implications for
severe illness and been implicated in several deaths (USEPA 2009).
3.3 Effects of Environmental Parameters on Fecal Indicators in Different Geographic
Regions
As discussed previously, fecal indicator bacteria are present in large numbers in the feces of
humans and animals, however in order to be effective, they must, persist in water in a similar
manner to fecal pathogens, be present in water in higher numbers than fecal pathogens, and
respond to treatment processes in a similar fashion to fecal pathogens (NRC 2004, WHO 2005).
Fecal indicator bacteria that persist or grow in the aquatic environment are no longer specific to
recent fecal contamination events and thus may not be protective of public health (WHO 2005).
Effects of environmental parameters on persistence and (re)growth of indicator organisms in
tropical, subtropical, and temperate regions are discussed in subsequent subsections.
3.3.1 The Great Lakes Region
The Great Lakes Region has a temperate climate, with well-defined seasons. Areas around the
Great Lakes are moderated in temperature by the surrounding water body, but can also create
snow belts in the winter. The evaporation from the Great Lakes also increases the amount cloud
cover and thus incident solar irradiation. (http://www.city-data.com/states/Michigan-
Climate.html).
The occurrence of autochthonous (indigenous) populations of fecal indicator microorganisms is
not limited to tropical and subtropical regions. Although temperate coastal regions such as the
Great Lakes experience some environmental conditions different than sub-tropical regions,
traditional fecal indicator microorganisms including E. coli and enterococci have been shown to
persist and grow in ambient waters and associated benthic environments. Moist sand provides a
presumably suitable environment for many microorganisms including protection from sunlight, a
large surface area for biofilms, buffered temperatures, a steady supply of organic material, and
microhabitat protection from predation (Whitman and Nevers 2003). As in tropical and
subtropical regions, populations of fecal indicator microorganisms do not necessarily relate
directly to a recent fecal contamination event. The EPA Environmental Monitoring for Public
Access and Community Tracking (EMPACT) study investigated fecal indicator microorganisms
on five beaches, including four located in temperate climates: a Massachusetts ocean beach, a
Maryland estuarine beach, a Lake Michigan beach, and a Detroit riverine beach (Wymer et al.
2005). The EMPACT researchers identified several physicochemical parameters that affected
the persistence and regrowth of fecal indicator microorganisms, including but not limited to the
following: tides, sunlight, time of day of sampling, precipitation, water temperature, and air
temperature. The EMPACT study showed that the amount of sunlight can impact the water and
air temperatures, thus emphasizing the complexity involved in predicting how these
physicochemical parameters may affect the persistence and regrowth of fecal indicator
microorganisms in recreational waters.

U.S. Environmental Protection Agency
December 2010 14
Temperature has been shown to have an effect on persistence of fecal indicator microorganisms.
Historically, E. coli were thought to be unable to survive long outside of human or animal
bodies, in part due to the cooler temperatures of temperate waters—especially winter
temperatures. Wang and Doyle (1998) found that the pathogen E. coli O157:H7 can survive up
to 91 days at 8º C. Under these cooler temperatures, the bacteria entered a viable but
nonculturable (VBNC) state until temperatures warmed again, when the bacteria regained
metabolic activity. Whitman and Nevers (2003) determined that E. coli can survive winter
temperatures, including freezes, in the sands on a Lake Michigan beach. Samples of beach sand
showed a significant increase in E. coli counts between April and May. After May, E. coli
counts in the sand remained relatively stable for the rest of the summer. In addition, Vigness et
al. (2006) demonstrated that E. coli found in Lake Michigan beach sands could tolerate
temperatures as high as 44.5º C. These studies suggest that fecal indicator bacteria such as E.
coli can persist in sand in low and freezing temperatures during winter months in temperate
regions and then regrow when temperatures increase.
Humidity and water availability can also play a role in fecal indicator microorganism survival.
Vigness et al. (2006) showed that humidity affects the ability of E. coli to grow in beach sands.
Samples from a Lake Michigan beach were sterilized and inoculated with E. coli, which was
then allowed to dry under natural conditions. Upon desiccation (humidity of <5 percent), E. coli
entered a metabolically inert state but remained viable. The bacteria resumed active growth after
rehydration. Byappanhalli et al. (2006) demonstrated that higher humidity encouraged growth of
E. coli in soils of the Dunes Creek watershed on the southern shore of Lake Michigan.
Beach sand and sediments have been shown to act as habitats and reservoirs for E. coli (Ishii
2007). Whitman and Nevers (2003) examined the foreshore sand at a Chicago beach on Lake
Michigan. The sand acted as a nonpoint source of E. coli and could support an indigenous
population of E. coli for extended periods of time, regardless of additional input from humans,
animals, or lake waters. The bacteria adhered to sand particles, thus providing physical
protection to the bacteria. Beach sand replacement studies demonstrated that E. coli populations
decreased immediately after replacement but E. coli populations were re-established to
prereplacement levels in as little as two weeks. Byappanhalli et al. (2006) investigated the
occurrence of E. coli in a pristine environment in the Dunes Creek watershed on the southern
shore of Lake Michigan. Forest soil plots were covered with mesh to exclude animal and human
input. Higher concentrations of E. coli were recovered from the covered plots than from
surrounding soils. Because the plots were covered, the higher concentrations were not due to
human or animal input but were more likely due to the microclimate of the enclosure such as
higher humidity and shading. The authors suggested that higher humidity and shading are
similar to environments caused by forest canopies near river shores. Genetic analysis of the E.
coli recovered from the soils indicated that although the initial source of the E. coli was from
animals (such as birds and deer), over time lasting and genetically diverse populations in the
soils were established. Further genetic analysis suggested that the soil-borne strains of E. coli
belong to a different group than E. coli of animal origin found in the temperate coastal
environment. Therefore, soils, sediments, and sand can act as a reservoir for fecal indicator
microorganisms that are not associated with point source fecal contamination events.

U.S. Environmental Protection Agency
December 2010 15
Other biological interactions can influence the persistence and regrowth of fecal indicator
microorganisms in ambient waters. Whitman et al. (2003) investigated 10 Lake Michigan
beaches in Wisconsin, Illinois, Indiana, and Michigan and found that E. coli and enterococci
were present in up to 97% of Cladophora samples. Cladophora is considered to be a nuisance
macrophytic, green alga commonly found in the Great Lakes during the summer months. To
investigate the survival ability of E. coli and enterococci in these algae, Cladophora mats were
harvested, sun-dried, and kept at 4ºC for 6 months. Samples from the mats were then rehydrated
and incubated at 35º C—a temperature similar to exposed beach or shallow waters in summer
months. Regrowth of E. coli and enterococci occurred within 24 hours of rehydration, and stable
populations were established within 72 hours. Byappanhalli et al. (2007) studied the genetic
diversity of Cladophora-borne E. coli from the Indiana Dunes National Lakeshore of Lake
Michigan. Over 800 strains of E. coli were isolated from Cladophora mats. The E. coli isolates
represented a high degree of genetic diversity but were clearly genetically distinct from E. coli
strains of fecal origin. These studies suggest that Cladophora may be source of recurring E. coli
and enterococci for nearshore beaches.
In 2008, Zehms et al. conducted a study that looked at the seasonal variations and patterns of E.
coli in both the sand and adjacent beach water. The highest number of E. coli were observed in
the swash zone, with the highest numbers seen in the summer month, however the numbers of E.
coli varied greatly spatially which altered the relationship of the E. coli seen in the sand and that
of the overlying beach water in different locations.
3.3.2 Florida
Considered a subtropical climate with a mild temperatures and sunny days, Florida is dominated
by high humidity and abundant rainfall due to its proximity to the Atlantic and the Gulf of
Mexico, and the state's many inland lakes and ponds (http://www.city-data.com/states/Florida-
Climate.html).
A number of studies have documented the effects of various environmental parameters on fecal
indicator bacteria in Florida. Lipp et al. (2001) examined the effects of seasonal variability and
weather on fecal indicators, including fecal coliform bacteria, enterococci, Clostridium
perfringens, and coliphages in southwestern Florida. (Note, the latter two indicator organisms
are considered to be alternative in this draft report and are discussed in Sections 5.1.1 and 5.1.4,
respectively). Samples were collected from Charlotte Harbor in recreational and shellfish
harvesting waters and from sediment to determine which environmental factors affected fecal
indicators. With regard to chemical parameters, sampling sites with more freshwater influence,
and therefore lower salinity, were associated with higher levels of all fecal indicators.
Concentrations of fecal coliform bacteria, enterococci, and C. perfringens indicators were
negatively correlated with salinity in the water column, and concentrations of fecal coliform
bacteria and coliphages in sediment were also negatively correlated with salinity. In addition
negative correlations with pH and concentrations of C. perfringens and enterococci in the water
column were observed. Decreases in temperature were responsible for decreased concentrations
of fecal indicator bacteria in the water column, whereas rainfall and increased stream flow
coincided with increased abundances of fecal coliform bacteria, enterococci, and coliphages.
Sediment concentrations of enterococci were also positively correlated with rainfall. Turbidity

U.S. Environmental Protection Agency
December 2010 16
was positively correlated with concentrations of C. perfringens in the water column and
sediment.
Harwood and Rose (2004) observed sources and fate of fecal indicator organisms in Florida and
found that saltwater significantly increased decay rates of fecal coliform and enterococci
compared to freshwater. The study also found that fecal coliform decay rates were lower in
sediments than in the water column in both freshwater and saltwater, but the difference was only
significant in freshwater. Enterococci decay rates were not significantly different in sediments
compared to the water column in saltwater or freshwater, but persistence in sediments tended to
be greater posing the possibility that sediments provide refuge for bacteria from predation and
UV irradiation.
Shibata et al. (2004) studied the effects of multiple parameters on enterococci, E. coli, fecal
coliform, total coliforms, and C. perfringens. Contrary to Lipp et al. (2001), environmental
parameters such as rainfall, temperature, pH, and salinity did not appear to be significantly
correlated with change in most fecal indicator bacteria concentrations. The exception was total
coliforms for which the concentration increased significantly in warmer weather with increasing
rainfall. The authors also noted that increased concentrations of bacteria were related to close
proximity to the shoreline with the greatest concentrations found at high tide when the water
level peaks along the shore. In addition, C. perfringens concentrations were positively correlated
with turbidity. The highest concentrations of C. perfringens and total coliform were found below
seaweed, which was hypothesized to be the source of shelter from UV light, nutrients, and moist
conditions.
Desmarais et al. (2002) investigated the parameters that affect the number of E. coli, enterococci,
and C. perfringens in soil and sediments in the North Fork of the New River in Fort Lauderdale.
This study was spurred by previous research conducted in the same river that found that E. coli
numbers were elevated at high tide due to bacterial regrowth within tidally impacted soil
embankments and contamination from storm events (Solo-Gabriele et al. 2000). Desmarais et al.
(2002) documented the effects of water content in soil, amount of sediment in soil, and soil
content on fecal indicators. The highest numbers of E. coli and C. perfringens were observed
within 50 cm from the edge of the water where the moisture content was the highest. Sediments
further from the water edge had lower numbers of indicator microbes, suggesting that water
content affects sustainability of indicator populations. Changing moisture content, the addition
of sediment, and increased inactivation of indigenous microorganisms in the sediment and thus
increasing nutrient availability, and eliminating predation promoted the growth of E. coli and
enterococci. In addition, soil with higher organic content, and a greater fraction of fines,
stimulated growth of E. coli.
More recently Bonilla et al. (2007) examined the prevalence of fecal indicators ( fecal coliforms,
E. coli, somatic coliphages, F+ specific coliphages) in tidally affected beach sand with fecal
indicator bacteria counts in the overlying water. Bacteria were consistently higher in beach sand,
particularly moist sand, than corresponding water samples and both coliphage types were
routinely detected in sand, however F+ coliphages were detected less often. Interestingly, the
researchers showed that the seeding of a single sample of gull feces affected an area of the beach

U.S. Environmental Protection Agency
December 2010 17
sand of 3.1 m2, indicating that there is great heterogeneity of fecal indicator detection in beach
sand.
Another unlikely source of fecal indicator bacteria contamination actually comes from bathers
themselves. Elmir et al. (2007) studied the effects of human shedding of enterococci and
Staphylococcus aureus, a common skin pathogen, both directly from their skin and indirectly by
adherence of sand to skin. Of particular interest, the researchers found that on average humans
shed enterocci and S. aureus on the magnitude of 6 x 10⁵ to 6 x 10
6 per person during the first 15
minutes of “bathing”. The amount of bacteria that adhered to sand from the skin was small in
comparison to direct shedding from the skin. This study showed that human microbial bathing
load should be an important consideration as a non point source for recreational water quality
models.
Abdelzaher et al. (2010) recently published the first known study to examine all three classes of
pathogens (viral, protozoan, and bacterial) as well as fecal indicator bacteria (fecal coliforms, E.
coli, and enterococci) in both water and sand at a sub-tropical non-point source beach. Due to
the short study period (2 days) no significant relationship could be established between indicator
organisms and pathogens, even though the opportunistic pathogen Vibrio vulnificus and Giardia
spp. were detected as well as the presence of Human Polyomaviruses (HPyVs),which is a human
source tracking marker indicative of human urine or sewage source. Notably, these researchers
also determined that tidal height impacted microbe concentration in surface water and that sand
proved to be a reservoir of microbes that contributed to the water column, which is conclusive
with that of Bonilla et al. (2007).
3.3.3 Mississippi
Mississippi, like Florida, is considered subtropical with short winters and long, humid summers.
Carr et al. (2010) examined to what extent Salmonella spp. existed in coastal waters and
sediments and how Salmonella spp. correlated with enterococci, as well as salinity, turbidity, and
sunlight. They found that as salinity and turbidity increased, the likelihood of detecting
Salmonella spp. decreased. Likewise, as with other studies, when solar intensity increased the
chance of detecting Salmonella spp. decreased. Enterococci concentrations were also suggestive
of the levels of Salmonella spp. present. Carr and colleagues suggested that since specific
pathogen examination in environmental waters has been limited, and since fecal indicator
bacteria are used as proxies of pathogens of concern, that the rationale of Field and Samadpour
(2007) should be utilized. That rationale suggests the identification of the pathogen of concern
based upon epidemiological data, and then subsequent monitoring of those pathogens along with
fecal source tracking methods in order to permit evaluation of the existence of pathogens in that
water source.
3.3.4 California
Dependent on latitude, elevation, and proximity to the coast, California's climate can vary
widely—primarily from arid to mediterraenean. In coastal and southern parts of the state, the
influence of the ocean moderates temperature extremes, with somewhat rainy winters and dry
summers, producing a Mediterranean climate.

U.S. Environmental Protection Agency
December 2010 18
Several studies have been conducted in California investigating the effects of environmental
parameters on fecal indicator bacteria. Yamahara et al. (2007) collected beach sand along the
California coast and found that 91% of samples had detectable enterococci and 62% had
detectable E. coli. Physical parameters such as degree of wave shelter and percent fines and
chemical parameters such as moisture and organic carbon content affected fecal indicator
bacteria concentrations. For example, E. coli were more commonly found in fine sands with
high moisture and organic carbon content and at wave-sheltered beaches. Increases in
enterococci densities were found in the presence of a presumed source of fecal indicator bacteria
and were associated with the degree of human development surrounding beaches
He et al. (2007) observed the effects of ponded waters versus flowing waters, temperature,
conductivity, salinity, and nutrients on total coliform, fecal coliform, and enterococci in streams
in southern California. Fecal indicator bacteria concentrations were higher in ponded water and
sediment compared to flowing water likely due to higher nutrient levels and lower dissolved
oxygen levels in the ponded water. Increasing temperature resulted in higher concentrations of
all bacteria, whereas higher conductivity (i.e. increased salinity), had negatively impacted fecal
indicator bacteria concentrations.
Other researchers (Evanson and Ambrose 2006, Lee et al. 2006) have also found that California
beach sediments provided favorable environments for survival and growth of fecal indicator
bacteria. Evanson and Ambrose (2006) hypothesized that increased indicator bacteria
concentrations in sediment may be attributable to rainfall-induced changes in environmental
parameters such as lower salinity, increased moisture and nutrient inputs.
Santoro and Boehm (2007) measured Bacteroides (an alternative indicator; see Sec tion IV.1.2),
total coliforms, fecal coliforms, and enterococci at four coastal locations in Orange County,
California to determine whether tidal variability affected microbial pollution at beaches.
Abundance of fecal indicator bacteria (total coliforms, fecal coliforms, and enterococci) was
significantly affected by tide level, with more fecal indicator bacteria being detected at low tide
at some sampling locations. Abundance of the human-specific Bacteroides molecular marker
did not appear to be affected by tidal variability.
Rosenfeld et al. (2006) examined effects of tidal variability on fecal indicator bacteria
concentrations. The researchers observed that 50% of fecal indicator bacteria exceedances
occurred within two days of the spring tide and that bacterial concentrations were highest at
night as opposed to during the day concluding that total and fecal coliform levels were controlled
primarily by tide and that levels of enterococci were controlled primarily by the day-night cycle.
A study by Noble et al. (2004) observed the effects of sunlight on total coliforms, E. coli,
enterococci, and F+ coliphages (an alternative indicator; see Section 5.1.4) in fresh and saltwater.
Temperature and solar irradiation significantly affected indicator organism inactivation.
Sunlight was observed to increase inactivation rates by a factor of five and was found to
inactivate enterococci more quickly than E. coli and F+ coliphages. Total suspended solids and
nutrient levels did not significantly affect inactivation rates of the indicators. Inactivation rates
were similar in salt and fresh waters when tested at similar temperatures.

U.S. Environmental Protection Agency
December 2010 19
Boehm et al. (2002) also observed increased sensitivity of total and fecal coliforms and
enterococci to inactivation by sunlight which induced bacterial die-off or injury. In addition, the
effect of total rainfall on fecal bacteria concentrations was evaluated. The highest mean
concentrations of total coliforms were observed during the period with the most rainfall. This
agrees with Dwight et al. (2002) who also observed a relationship between total coliform levels
and rainfall in California. The researchers found that precipitation was significantly correlated
with water discharged from rivers, and the latter was significantly correlated with bacteria levels
at most of the beaches that were sampled Sampling sites closest in proximity to the river
discharge point had consistently higher concentrations of total coliforms than sites further from
the river discharge point
Lee et al. (2008) examined whether sediment concentration of fecal indicator bacteria persisted
longer following a storm than overlying water and whether quiescent sediments at enclosed
beaches retained higher fecal indicator bacteria than those at open beaches. At the open ocean
beach sites, although both surface water and sediments contained increased levels of enterococci
and E. coli, both returned to pre-storm levels within a week. At an enclosed beach, however,
high levels of fecal indicator bacteria persisted in the sediments regardless of antecedent
precipitation events. Even though high levels of fecal indicator bacteria were observed at the
open ocean beach, high energy outward transport of microbial contaminants in the sediments
would be facilitated by wave action, wheras the low energy environment found at the enclosed
beach may promote bacterial sorption and biofilm formation on sediment surfaces, leading to
intermittent exceedences due to resuspension events.
3.3.5 Hawaii
Although located near the tropical equator, the climate of Hawaii is more subtropical than
tropical, due to the moderating effect of the surrounding sea. There is little temperature variation
and the weather conditions tend to be fairly consistent, however, the climate of each Hawaiian
island can differ according to whether they fall on the windward side or not. Those on the
windward side experience more rain and cloud cover caused by prevailing north-easterly trade
winds.
As early as 1988, Fujioka and colleagues documented the occurrence of high fecal indicator
bacteria levels in mountainous streams originating in undeveloped areas and whose source was
purely rainwater. The early Fujioka studies explored the plausible cause of elevated fecal
indicator bacteria in these undeveloped streams and hypothesized that since there are no large
animals in the area that the bacteria were most likely from the feces of birds and rats and that
these bacteria must be persisting and multiplying in the warm, humid soil/water environment of
Hawaii. There are several studies documenting the presence, persistence, and proliferation of
fecal indicators such as E. coli and enterococci in Hawaii. Moisture, nutrient content, and pH
levels of Hawaiian soil provide a favorable environment for indicators (Fujioka and
Byappanahalli 2003). Fujioka et al. (1981) observed the effects of sunlight and salinity on fecal
U.S. Environmental Protection Agency
December 2010 20
coliforms and fecal streptococci (i.e., enterococci1) in coastal water in Oahu. The study found
that sunlight dramatically inactivated fecal indicator bacteria. Bacteria survived for days in the
absence of sunlight, but in the presence of sunlight, 90% of bacteria were inactivated within 30
to 180 minutes, depending on the type of bacteria. In addition, increasing salinity levels have
been widely documented to negatively affect the persistence of fecal indicator bacteria.
Hardina and Fujioka (1991) conducted a study to determine the source of fecal indicator bacteria
in Hawaii’s pristine streams. They concluded that soil was the primary source of fecal indicator
bacteria in the environment in Hawaii and that soil bound fecal indicator bacteria were
transported by precipitation events into the pristine streams and rivers. These results were based
on the fact that the fecal indicator bacteria, E. coli and enterococci, were found in all soil samples
and high concentrations of these same bacteria were found in stream water. The concentrations
of fecal indicator bacteria increased as the stream flowed from the mountain to the ocean in the
same manner as does the land mass area, which also had greater concentrations of fecal
indicators as the land mass increased. The warmer temperature and higher nutrient concentration
of the soils served to create a microenvironment which favored the persistence and regrowth of
fecal indicator bacteria. Fujioka and Byappanahalli (2003) also observed that rainfall was the
mechanism of transport for soil-associated fecal bacteria. Rainwater falls onto small areas of
land and the excess water forms streams. Soil-associated fecal bacteria are transported from the
streams to storm-drains. Rainfall is a crucial environmental parameter whose effects on indicator
organisms have been documented in Hawaii.
3.3.6 Guam
Guam is a tropical pacific island and due to its close proximity to the equator, it has higher
humidity and warmer temperatures than the Hawaiian Islands (Hardina and Fujioka 1991. One
of the studies conducted in Hawaii (Hardina and Fujioka 1991) was replicated in Guam to
determine if those same standards found in Hawaii would be applicable to Guam or other
tropical islands. In the Guam study (Fujioka et al. 1991), the researchers found that 66% and
88% of fresh water samples exceeded the EPA single sample standard for E. coli and
enterococci, respectively in fresh river water, supporting the earlier of work of Hardina and
Fujioka (1991). In addition, soil was also found to have high levels of both indicators and is
consistent with the findings in the Hawaii studies (Hardina and Fujioka 1991). Like Hawaii, rain
was the source water for streams and therefore fecal indicator bacteria bound to soil was
transported to fresh water streams and rivers through runoff during precipitation events. This
study also documented that several of Guam’s marine beaches also exceeded the EPA
recommended recreational water quality standards. This study showed that although some
similarities did exist with earlier Hawaii studies, there were some notable differences. First,
Guam contains few birds, which were implicated as a source of fecal indicator bacteria in Hawaii
and second, the climatic conditions of Guam are more tropical than Hawaii which is located
much further north.
1 The terms fecal streptococci, enterococci, intestinal enterococci, and Enterococcus are often used to refer to
essentially the same environmental and fecal species of bacteria (see NRC 2004 for further information). Thus, for
convenience, this draft report uses the term enterococci unless otherwise noted.
U.S. Environmental Protection Agency
December 2010 21
3.3.7 Puerto Rico
Studies conducted in Puerto Rico also contribute to the literature on influences of environmental
parameters on fecal indicators in subtropical and tropical regions. As early as 1939, Ragavachari
and Iver reported that coliforms survived for several months in natural tropical river waters.
Since then there have been numerous studies in Puerto Rico documenting the survival and
regrowth of E. coli in rain forest streams, becoming part of the natural flora (Carillo et al. 1985,
López-Torres et al. 1987, Valdéx-Collazi et al. 1987, Hazen et al. 1987). This work is supported
by work in other laboratories in Puerto Rico and the fact fecal coliforms and enterococci have
become part of the natural flora of rainforests, devoid of human and large mammalian impacts,
has become “dogma” (Toranzos 1991).
Carillo et al. (1985) observed that counts of indicators such as fecal coliforms and E. coli were
correlated with water temperature, alkalinity, nitrates plus nitrates, and total phosphorus. The
authors concluded that nutrient concentration had the most influence on the density of fecal
bacteria in the watershed. Further evidence is supported by one of the first studies to show that
fecal coliforms could grow in and on vegetation and was conducted in Puerto Rico by Rivera et
al. (1988). Samples collected from water accumulated in leaf axilae of bromeliads (an abundant
epiphyte in tropical rainforests but also native to regions throughout the Americas) at pristine
sites in a tropical rainforest were unexpectedly found to consistently contain fecal coliforms.
Subsequent identification of positive isolates demonstrated the presence of E. coli, which was
also isolated from leaf surfaces. The investigators noted that birds were not a likely source for
the presence of E. coli and hypothesized that that these bacteria may at some time have
originated from fecal sources and became capable of surviving indefinitely in tropical
environments (thus becoming part of the normal flora of some vegetation); alternatively, E. coli
could have always been part of the natural microflora of tropical regions. The authors concluded
that ambient and water temperatures and nutrient concentrations created a favorable environment
for fecal indicator bacteria.
Hartel et al. (2005) studied the survival and regrowth of enterococci in sediments in Puerto Rico.
In addition to Puerto Rico, the researchers (Hartel et al. 2005) also sampled sediments from
Georgia (sub tropical) and New Hampshire (temperate) and compared survival and regrowth of
enterococci in marine and estuarine sediments from the three regions. The locations were chosen
due to their differences in latitude, annual seasonal temperatures, and soil characteristics. The
study methodology included desiccating and rewetting sediment samples after 0, 2, 30, and 60
days to determine whether enterococci could survive and regrow. The researchers found that all
moist sediments had large concentrations of enterococci and enterococci counts decreased with
increased length of drying. Sediments from Georgia and New Hampshire contained high
concentrations of enterococci after 60 days, whereas sediment from Puerto Rico had low
numbers after 60 days. The poor survival rate in the Puerto Rican sediment was attributed to the
texture of the sediment, which contains a higher percentage of sand than sediments from New
Hampshire and Georgia as sediments with a higher percentage of clay than dry sand are expected
to have higher bacterial survival rates.

U.S. Environmental Protection Agency
December 2010 22
3.3.8 Australia and New Zealand
3.3.8.1 Sydney, Australia
The temperature in Sydney is moderated by its proximity to the ocean having warm summers
and mild winters, and rainfall spread throughout the year. Sydney is considered to have a
temperate climate. Because Sydney and Queensland have different climate types, they are
considered separately in this section.
Ashbolt and Bruno (2003) performed a study on the influence of environmental parameters
(rainfall, sunlight, and tidal variation) on thermotolerant (fecal) coliforms and enterococci counts
at three beaches. The authors found that precipitation alone was a sufficient predictor of
enterococci counts Sunlight hours and tidal variation were also sufficient predictors of
enterococci counts during dry periods with increasing number of sunlight hours contributing to a
decrease in enterococci counts. Higher fecal indicator counts were associated with rising or high
tide 70% of the time.
Craig et al. (2001, 2004) investigated the influence of water versus sediment, sediment content,
and temperature on E. coli, enterococci, and coliphages at three coastal sites in Australia.
Notably, the studies reported that in all cases, indicator decay was greater in water compared to
decay rates in sediment. E. coli had a higher decay rate than enterococci and coliphages in
overlying water and sediment at all temperatures. In sediment samples, small particle size and
high organic content were conducive to survival of indicator organisms. An inverse relationship
was observed between survival of indicator organisms and temperature.
A study by Ferguson et al. (1996) examined the influences of rainfall, sewage overflow
(resulting in increased organic matter in sediment), and salinity on concentrations of a number of
fecal indicators including fecal coliforms, fecal streptococci (a surrogate for enterococci
measurements) and C. perfringens spores in water and sediment samples from six sites in an
urban estuary in Sydney. The study found that rainfall and sewage overflow were associated
with significant increases in concentrations of all indicator organisms in water. The lowest
concentrations of most indicator microorganisms were detected at the sampling site with the
highest salinity. Fecal coliforms were the only microorganisms that increased significantly in
sediment concentrations with rainfall. Sewage overflow resulted in increased concentrations of
all indicator organisms measured in sediment.
Davies et al. (1995) studied the survival of fecal coliforms, fecal streptococci (as a surrogate for
enterococci measurements), and C. perfringens spores in marine and freshwater sediments in
Sydney. The environmental parameters investigated included predation and growth. Sediments
were collected from the bottom of a pool located below the discharge point of a storm water
drain at one of Sydney’s northern beaches and from a marine site adjacent to a deepwater treated
sewage outfall outlet. The researchers found that fecal coliforms may be capable of regrowth in
both marine and freshwater sediments. When predators were present, a net die-off of indicators
was observed. The difference between concentrations of fecal coliforms in the presence of
predators compared with concentrations in the absence of predators was greater for fecal
coliforms than for fecal streptococci. Notably, the survival of C. perfringens in sediments did
U.S. Environmental Protection Agency
December 2010 23
not appear to be affected by the presence of predators. The authors concluded that C.
perfringens can persist in sediments for undefined periods of time whereas other fecal coliforms
and fecal streptococci decayed more rapidly. An observed overall die-off effect of fecal
coliforms and fecal streptococci suggested an imbalance between predation and growth in
sediment, but this was not empirically tested.
3.3.8.2 Queensland, Australia
The climate along the Queensland coast ranges from hot and humid in the far north, to
comfortable cool temperatures in the southeast and is considered tropical/subtropical
(http://www.qldbeaches.com/climate.html). A study by Mill et al. (2006) examined the effects
of spatial and tidal variation on concentrations of total coliforms, E. coli, and enterococci. The
investigators found that tidal variation limited indicator levels in an estuarine creek where lower
tidal areas of the creek were observed to reduce the contamination of point and nonpoint source
contributions of fecal material and thus were associated with decreased concentrations of
indicator bacteria. While solar radiation was not explicitly measured, the researchers
hypothesized that solar radiation was a primary stressor at the sampling site and thus contributed
to the observed decrease in fecal indicator bacteria concentrations.
A study by Sinton et al. (2002) documented inactivation by sunlight of fecal indicators (fecal
coliforms, enterococci, E. coli, somatic coliphages, and F+ RNA coliphages) and the effects of
salinity in effluents from waste stabilization ponds and raw sewage. Over the course of two
years, the researchers observed that sunlight inactivation rates were 10-times higher than dark
inactivation rates. The overall pattern from greatest to least inactivation was enterococci, fecal
coliforms, E. coli, somatic coliphages, and F+ RNA phages. Fecal coliform and enterococci
inactivation rates were more similar in winter months than summer months. The researchers also
observed that sunlight inactivation of all indicator organisms were greater with increasing
salinity.
3.4 Indigenous Populations of Fecal-Associated Organisms
As demonstrated by the regional studies discussed previously in this section, under favorable
environmental conditions, fecal indicator organisms can persist and (re)grow outside of the
gastrointestinal tracts of humans and other warm-blooded animals. The literature presented is
consistent in demonstrating that these microorganisms are endemic to tropical, subtropical, and
temperate regions and thus, their presence in water is not necessarily an indication of recent fecal
contamination. There is evidence that the presence of traditional fecal indicators such as E. coli,
fecal coliforms, and enterococci in tropical and subtropical waters originate in soils rather than
fecal sources (Roll and Fujioka 1997, Hardina and Fujioka 1991, Fujioka et al. 1999.). The
ability of E. coli to multiply in soil and sediment was also documented in Florida and was
determined to be a function of soil moisture content as opposed to human fecal contamination
(Solo-Gabriele et al. 2000).
Interestingly, studies in colder climates have also shown fecal indicator bacteria can persist and
proliferate in the absence of fecal contamination. Gauthier and Archibald (2001) showed that
total and fecal coliforms (which include E. coli) and enterococci are commonly found in most or

U.S. Environmental Protection Agency
December 2010 24
all pulp and paper mills. Conditions in the pulp and paper production process allow coliforms
and enterococci to grow rapidly and extensively throughout the water system in the absence of
fecal matter inputs. The authors proposed that the high temperatures typical of mill water
systems likely select for thermotolerant (fecal) coliforms. Klebsiella pneumoniae, a naturally-
occurring microorganism found commonly on wood and bark, is also a total coliform bacterium
making its detection in pulp and paper mill water ineffective for assessing fecal contamination.
Sjogren (1995) showed that when a multiple antibiotic resistant strain of E. coli was applied as a
tracer to field plots of rye grass in northern Vermont, it penetrated the upper soil layers and could
be isolated at depths >30 inches and in groundwater for the duration of the 13-year study. The
strain serotype and its multiple antibiotic resistance pattern allowed it to be tracked and identified
as the original strain applied.
In addition to soils, tropical canopies can act as a natural environment for fecal indicator
bacteria. Rainwater that cascaded through the canopy of a tropical rainforest in Puerto Rico and
collected in the leaf axilae of bromeliads was sampled and found to contain E. coli and fecal
coliforms (Rivera et al. 1988). The occurrence of fecal indicator bacteria in this pristine
environment indicates that these organisms are indigenous to the native vegetation and are not of
fecal origin (Toranzos 1991). Similarly, Carillo et al. (1985) observed that Bifidobacterium spp.,
fecal coliforms, and E. coli survived and possibly became normal flora in tropical freshwater
environments in Puerto Rico. Diffusion chamber studies showed that E. coli could survive,
remain physiologically active, and regrow at rates that were dependent on nutrient levels in
ambient waters. Whitman et al. (2005) observed that fecal indicator bacteria are common in
northern pitcher plants, further establishing that E. coli and enteroccoci can survive and thrive in
temperate, terrestrial, and aquatic environments.
Inland lakes may also provide a favorable environment for fecal indicator bacteria to grow in the
absence of human fecal contamination. Researchers in Australia found that it was highly
unlikely that fecal contamination could account for massive E. coli levels in inland lakes
(Ashbolt et al. 1997, Power et al. 2005). Blooms were dominated by three encapsulated E. coli
strains, and the presence of the same three strains in bloom events in different geographical
regions of a temperate climate and at different times indicates that free-living E. coli strains are
able to persist in these water reservoirs (Power et al. 2005).
Most recently, Badgley et al. (2010) and others (Byanppanahalli et al. 2003, Craig et al. 2004,
Anderson et al. 2005, Ishii et al. 2007, Englebert et al. 2008) have shown that submerged aquatic
vegetation are reservoirs allowing for the persistence of environmental populations of fecal
indicator bacteria by providing secondary habitat, allowing for the formation of biofilms and
protection from UV irradiation. Badgley et al. (2010) found that the dominating population of
enterococci at the study site (a freshwater lake in Florida) was E. casseliflavus, which is known
to inhabit the guts of waterfowl and that surround the lake.
3.5 Summary
The scientific literature suggests general trends regarding the effects of environmental
parameters on fecal indicators in subtropical and tropical regions. For over three decades,

U.S. Environmental Protection Agency
December 2010 25
studies in Hawaii and Guam (Fujioka and Roll 1997, Fujioka et al. 1988, 1999) and Puerto Rico
(Carillo et al. 1985, Hazen et al. 1987, López-Torres et al. 1987, Toranzos 1991, Valdéx-Collazi
et al. 1987) have shown that even in the absence of fecal contamination, beach sands and
sediments, and even vegetation are known to have high concentrations of fecal indicator bacteria.
Some physical parameters such as rainfall, tidal cycle, and turbidity appear to be positively
correlated with concentrations of fecal indicator bacteria, while other physical parameters such
as temperature and sunlight are negatively correlated with fecal indicator bacteria concentrations.
Chemical parameters such as pH levels and salinity appear to be negatively correlated with
indicator concentrations, whereas other chemical parameters such as nutrient and organic content
of sediments and soils appear to be positively correlated with indicator concentrations. The
environmental parameters that are positively correlated with indicator concentrations may create
favorable conditions for indicators to persist and multiply in tropical and subtropical areas. Due
to such favorable conditions, fecal indicator bacteria may be indigenous to many of these
regions. However, it has been shown that these same environmental parameters that are
positively correlated with indicator concentrations in the tropical and subtropical regions may
also be characteristic of temperate regions such as the Great Lakes area. Therefore, indigenous
fecal indicator bacteria populations may also exist in some temperate regions.
The literature also shows that currently used fecal indicator bacteria, fecal coliforms, E. coli, and
enterococci, consistently do not meet two key criteria for fecal indicators identified by WHO
(2005). Specifically, many studies have observed proliferation of these indicators in ambient
waters, violating criterion 2. In addition, current fecal indicators may also persist, regrow, and
recover in water, violating criterion 3. For these reasons, measurements of current fecal
indicators may exceed levels associated with health risks in the absence of actual fecal
contamination. Therefore, current fecal associated bacteria and viruses may not be effective
indicators of fecal contamination and associated health risks, especially at non-point source
beaches (Colford et al. 2007). Discussion of alternative fecal indicators that could potentially
fulfill EPA and states’ needs and WHO criteria—particularly in tropical and subtropical
regions—is provided in the following section.

U.S. Environmental Protection Agency
December 2010 26
4. The Role of Physical, Chemical, and Biological Factors in the Extra-
Enteric Behavior of Fecal Indicator Organisms in Ambient Waters,
Sediments, and Soils
4.1 Background
Numerous studies (e.g., Boehm et al. 2002, Carillo et al. 1985, Hardina and Fujioka 1991, Ishii et
al. 2007) have called into question the extent to which the traditional fecal indicator bacteria are
specific to a fecal source of identifiable origin, do not grow outside the intestines of humans and
animals, and persist relative to pathogens of human and animal origin. Using either direct
measurement of persistence and growth or inference of persistence and growth, these studies
demonstrate that, in some settings, stocks, flows, and growth of the traditional fecal indicator
bacteria within the natural environment can be significant contributors to the populations of fecal
indicator organisms. As discussed below, growth of fecal indicator bacteria has been
demonstrated in controlled experiments conducted with natural marine water, fresh water,
estuarine water and sediment samples and in soils in all climate zones. Growth of fecal indicator
bacteria has also been inferred from in situ measurements of fecal indicator bacteria at numerous
sites. These extra-enteric sources of indicator organisms hamper the ability of public health
professionals and researchers to link suspected fecal contamination to identifiable and recent
sources of fecal contamination, thereby hampering direct coupling to human health outcomes
that have been determined empirically against exposure to wastewater effluents.
In this section, the defining characteristics of factors contributing to extended occurrence,
persistence, or growth of fecal indicator bacteria are assessed. The objectives of this assessment
are two-fold. First, this assessment intends to quantify, to the extent possible, the environmental
conditions under which extended occurrence, persistence, or growth may occur. Second, it
attempts to assess whether certain combinations of environmental conditions lend themselves to
extended occurrence, persistence, or growth of indicator organisms. The environmental
conditions assessed were defined based on the climate zone (tropical, subtropical, or temperate),
media (water column, sediments, or soils) and anticipated level of impact from fecal pollution
(impacted by human fecal pollution, impacted by fecal pollution from human agricultural
activities, or no expected human fecal pollution impacts). Although differences in survival of
indicator organism in different climate zones has been suggested by researchers in the past (e.g.,
Carillo et al. 1985, Fujioka et al. 1997), there is a growing consensus that, as stated by Whitman
and Nevers (2003), “Most conditions outlined for E. coli growth in tropical soil are met in the
temperate United States during summer, and differences in thermal seasonality are ecologically
limiting and quantitatively distinctive only during cooler months.”
Available scientific literature was reviewed to identify specific factors that have been observed
to influence survival of fecal indicator bacteria in aquatic systems. Data gaps in the
understanding of the influence of the parameters on fecal indicator bacteria survival were
identified and, to the extent possible, the relative influences that the various parameters and
combinations of parameters have on survival were noted. Although a meta-analysis of the
available literature might be a desired outcome of such work, it has become clear that the designs
of the numerous studies that have been conducted are generally vastly different from one
another. It is useful to summarize data that has been generated to date, but within this document,

U.S. Environmental Protection Agency
December 2010 27
there has not been a broad scale attempt to generalize across all studies. Instead, summaries of
like findings are presented, particularly for those studies that are well constrained (often those
conducted in the most controlled conditions).
4.2 Section Contents
Sections 4.3 and 4.4 provide an overview of the studies and describe how the studies were
classified. Sections 4.5 to 4.7 review and assess the chemical, biological, physical, and site-
specific features believed to influence extra-enteric fecal indicator bacteria survival. In Section
4.5, the factors influencing extra-enteric behavior of fecal indicator bacteria are discussed and
distinctions are drawn between “general” factors (i.e., properties that may be measured at a
particular location and time) and factors that are specific to sites (location-specific).
Section 4.6 summarizes the conditions under which fecal indicator bacteria growth has been
observed or inferred. The media and climatic zone in which growth occurred are identified and
media and climate zones for which no growth has been reported are also noted. The absence of
reported growth for climate zone-media combinations is not considered evidence that growth is
not possible under those conditions. Rather, the absence of reported growth indicates a data gap
and controlled experiments assessing the potential for growth under those conditions are
recommended.
Section 4.7 describes and, where possible, quantifies the influence of general and context-
specific factors on extra enteric fate of fecal indicator bacteria. First, in Section 4.7.1, the
influence of individual growth conditions on indicator organism occurrence, persistence, and
growth are assessed. Data describing the influence of growth conditions on indicator growth are
found in three types of studies, (1) systematic studies conducted in laboratory or controlled
environments; (2) in situ studies conducted in microcosms or mesocosms deployed in soils,
sediments, or waters; and (3) analyses of indicator organism concentration and ecological
parameters measured concurrently. Next, Section 4.7.2 reviews the occurrence, persistence, and
growth of indicator organisms in particular contexts. It is hypothesized that growth in any
particular ecology occurs when conditions are favorable and that the occurrence of organisms in
a particular environment reflect the extent to which that environment provides favorable growth
conditions and the fluxes of organisms in that particular environment. The roles that context-
specific site features such as land use, runoff, and mixing have on indicator organism occurrence
are reviewed and data gaps are identified.
Section 4 concludes with an assessment of the most important factors in determining extra-
enteric fecal indicator bacteria survival, a listing of major data gaps precluding a full
understanding of extra-enteric survival, and an assessment of the data needs for determining the
alternative indicators that merit further evaluation for use in criteria setting.
4.3 Description of Studies Examining Extra-Enteric Occurrence and Survival
Broadly, the studies identified in the literature may be classified as follows:

U.S. Environmental Protection Agency
December 2010 28
A. studies in which the persistence, decay, or growth of fecal indicator bacteria were
measured directly under controlled environmental conditions;
B. studies in which the persistence, decay, or growth of fecal indicator bacteria were
measured in situ in diffusion chambers or other apparatuses allowing equilibration with
the local environment;
C. studies in which the occurrence of fecal indicator bacteria was measured in situ
concurrent with observations of environmental factors that might contribute to indicator
organism occurrence;
D. microbial source tracking studies in which the presence of specific organisms, strains, or
markers are related to specific sources of fecal pollution;
E. studies describing techniques for improved detection of fecal indicator bacteria in
environmental samples or detection methods for alternative indicators;
F. studies comparing indicators;
G. modeling studies;
H. epidemiology studies; and
I. other studies.
The studies of greatest relevance to the evaluation of the extra-enteric fate of fecal indicator
bacteria are those classified as A, B, and C. The number of studies found for each category and
an alphabetical list of studies in classifications A, B, and C are provided in Table 1.
There were 35 studies in classification D, 17 in E, 23 in F, 13 in G, 18 in H, and 19 in I. Note
that some studies appear in multiple classifications and that studies for which only abstracts were
available (usually conference presentations) were not classified. The majority of studies
explored the extra-enteric behavior of the traditional fecal indicator bacteria. This is not
surprising, given that the current AWQC are based on levels of those fecal indicator bacteria
(USEPA 1986), sampling for them is required in many settings, and data on the traditional fecal
indicator bacteria are readily available. Some studies explored the extra-enteric fate of
alternative indicator organisms (e.g., Bacteroides spp., bacteriophages, Clostridium perfringens;
see Section 5 for further information). The majority of this section is devoted to specifically
address the fate of fecal indicator bacteria. Given the nature of peer-reviewed publication, it is
difficult to categorize across many types of studies from different areas, because of the fact that
researchers are often trying to demonstrate advancement of the field. Therefore, overlap in study
objectives is often difficult to assess simply based upon methodological descriptions.
Nevertheless, a synthesis of available studies reveals something about what is known, what has
been suggested, and helps to identify the data gaps and future work that is relevant to all types of
fecal indicators and markers, including newly developed alternative indicators.
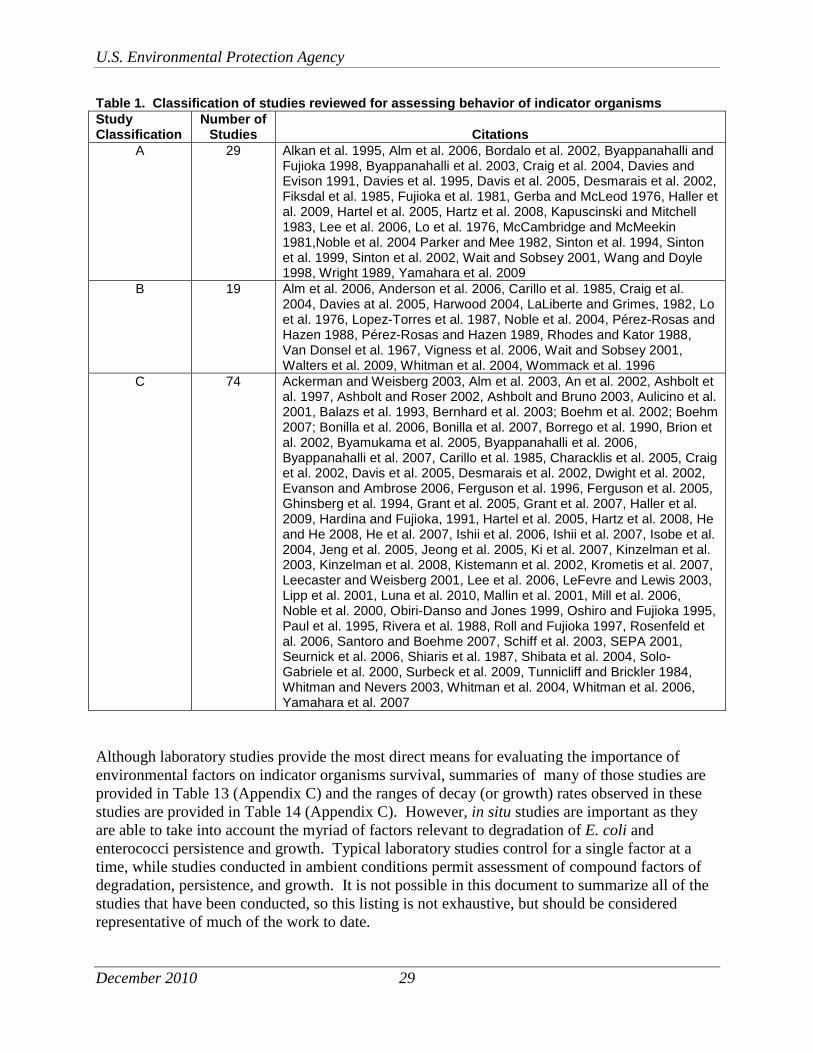
U.S. Environmental Protection Agency
December 2010 29
Table 1. Classification of studies reviewed for assessing behavior of indicator organisms
Study Classification
Number of Studies Citations
A 29 Alkan et al. 1995, Alm et al. 2006, Bordalo et al. 2002, Byappanahalli and Fujioka 1998, Byappanahalli et al. 2003, Craig et al. 2004, Davies and Evison 1991, Davies et al. 1995, Davis et al. 2005, Desmarais et al. 2002, Fiksdal et al. 1985, Fujioka et al. 1981, Gerba and McLeod 1976, Haller et al. 2009, Hartel et al. 2005, Hartz et al. 2008, Kapuscinski and Mitchell 1983, Lee et al. 2006, Lo et al. 1976, McCambridge and McMeekin 1981,Noble et al. 2004 Parker and Mee 1982, Sinton et al. 1994, Sinton et al. 1999, Sinton et al. 2002, Wait and Sobsey 2001, Wang and Doyle 1998, Wright 1989, Yamahara et al. 2009
B 19 Alm et al. 2006, Anderson et al. 2006, Carillo et al. 1985, Craig et al. 2004, Davies at al. 2005, Harwood 2004, LaLiberte and Grimes, 1982, Lo et al. 1976, Lopez-Torres et al. 1987, Noble et al. 2004, Pérez-Rosas and Hazen 1988, Pérez-Rosas and Hazen 1989, Rhodes and Kator 1988, Van Donsel et al. 1967, Vigness et al. 2006, Wait and Sobsey 2001, Walters et al. 2009, Whitman et al. 2004, Wommack et al. 1996
C 74 Ackerman and Weisberg 2003, Alm et al. 2003, An et al. 2002, Ashbolt et al. 1997, Ashbolt and Roser 2002, Ashbolt and Bruno 2003, Aulicino et al. 2001, Balazs et al. 1993, Bernhard et al. 2003; Boehm et al. 2002; Boehm 2007; Bonilla et al. 2006, Bonilla et al. 2007, Borrego et al. 1990, Brion et al. 2002, Byamukama et al. 2005, Byappanahalli et al. 2006, Byappanahalli et al. 2007, Carillo et al. 1985, Characklis et al. 2005, Craig et al. 2002, Davis et al. 2005, Desmarais et al. 2002, Dwight et al. 2002, Evanson and Ambrose 2006, Ferguson et al. 1996, Ferguson et al. 2005, Ghinsberg et al. 1994, Grant et al. 2005, Grant et al. 2007, Haller et al. 2009, Hardina and Fujioka, 1991, Hartel et al. 2005, Hartz et al. 2008, He and He 2008, He et al. 2007, Ishii et al. 2006, Ishii et al. 2007, Isobe et al. 2004, Jeng et al. 2005, Jeong et al. 2005, Ki et al. 2007, Kinzelman et al. 2003, Kinzelman et al. 2008, Kistemann et al. 2002, Krometis et al. 2007, Leecaster and Weisberg 2001, Lee et al. 2006, LeFevre and Lewis 2003, Lipp et al. 2001, Luna et al. 2010, Mallin et al. 2001, Mill et al. 2006, Noble et al. 2000, Obiri-Danso and Jones 1999, Oshiro and Fujioka 1995, Paul et al. 1995, Rivera et al. 1988, Roll and Fujioka 1997, Rosenfeld et al. 2006, Santoro and Boehme 2007, Schiff et al. 2003, SEPA 2001, Seurnick et al. 2006, Shiaris et al. 1987, Shibata et al. 2004, Solo-Gabriele et al. 2000, Surbeck et al. 2009, Tunnicliff and Brickler 1984, Whitman and Nevers 2003, Whitman et al. 2004, Whitman et al. 2006, Yamahara et al. 2007
Although laboratory studies provide the most direct means for evaluating the importance of
environmental factors on indicator organisms survival, summaries of many of those studies are
provided in Table 13 (Appendix C) and the ranges of decay (or growth) rates observed in these
studies are provided in Table 14 (Appendix C). However, in situ studies are important as they
are able to take into account the myriad of factors relevant to degradation of E. coli and
enterococci persistence and growth. Typical laboratory studies control for a single factor at a
time, while studies conducted in ambient conditions permit assessment of compound factors of
degradation, persistence, and growth. It is not possible in this document to summarize all of the
studies that have been conducted, so this listing is not exhaustive, but should be considered
representative of much of the work to date.

U.S. Environmental Protection Agency
December 2010 30
4.4 Classification of Environments
Sites at which measurements were made and from which samples were taken were classified
according to their climate zone and the expected level of impact of fecal pollution in the vicinity
of the site. Using the definitions of climate zones presented in Text Box 1, the most significant
difference between tropical and subtropical climate zones is the amount and temporal
distribution of precipitation. Based on those definitions, the following classifications were made:
South Florida is considered to have a tropical climate. This designation is consistent with
that given to the region by participants in the Tropical Water Quality Indicators
Workshop (Fujioka and Byappanahalli 2003).
Southern California is considered to have a semi-tropical climate.
Sites on the southeastern and southern coasts of Australia are considered to have a
temperate climate.
The classification of other locations referred to in this draft report was unambiguous (e.g., Puerto
Rico has a tropical climate; the Great Lakes region has a temperate climate).
It has been hypothesized that the occurrence and persistence of fecal indicator bacteria at
particular sites is related to the relative level of impact of human sources at that site (the
“continuum of contamination,” as described by Whitman et al. 2006 that may result in the
introduction of fecal contamination (both human and animal sources). As described in Section
4.7.2.1, studies (e.g., Mallin et al. 2001, Ramirez et al. 2000) have shown significant correlations
between level of anthropogenic influence as measured by land use and impervious surface
coverage estimates and concentration/occurrence of fecal indicator bacteria. To assess the
relationship between level of human impact and fecal indicator bacteria concentration, or the
extent to which data are available to assess this relationship, study areas were classified
according to their anticipated or known level of impact by human sources of fecal pollution.
Human sources were considered to be (treated and/or untreated) human sewage and fecal
indicator bacteria stemming from animal operations. Sites were given the following impact
designations:
expected or observed significant impacts from human sewage (HSI);
expected or observed impacts from human agriculture/animal operations (HAI); and
expected or observed limited impacts from human sources (LI).
Where possible, the impact designation was drawn from the studies themselves. Otherwise, the
designation was made based on descriptions of the study area provided by the authors or based
on other information regarding the study area that was drawn from other sources. In general,
receiving waters in large urbanized areas were classified as HSI. However, sites were not
classified in the absence of sufficient information in the primary literature and when the context
did not suggest an obvious choice.

U.S. Environmental Protection Agency
December 2010 31
4.5 Factors Influencing the Occurrence, Persistence, and Growth of Fecal Indicator
Organisms
Factors influencing the occurrence, persistence, and growth of fecal indicators may be grouped
as general and context-specific. General factors pertain to the life cycle of the organisms and
their influences are often assessed through the use of controlled laboratory experiments. These
experiments generally comprise the inoculation of a water sample, sediment sample, or soil
sample drawn from a particular source with a population of indicator organisms; control of
physical, chemical, and biological parameters; and direct measurement of the growth or decay of
the indicator organisms. General factors are often interrelated. For example, inactivation of
fecal coliforms in sunlight is much more rapid in marine waters than in fresh waters (Anderson et
al. 2005, Bordalo et al. 2002, Harwood et al. 2004, He et al. 2007, Jeong et al. 2005, Lipp et al.
2001, Šolić and Krstulović 1992). As listed in Table 9, Table 10, and

U.S. Environmental Protection Agency
December 2010 32
Table 11 in Appendix C, the general physical, chemical, and biological (respectively) features
that are believed to influence extra-enteric survival of indicator organism include temperature,
light, suspended solids, turbidity, salinity, pH, alkalinity, nutrients, organics, and the biological
community within the water column.
Location-specific factors are those related to the setting in which the indicator organism
concentration is measured and used to assess water quality. An illustration of the interconnected,
site-specific processes that determine the amount of culturable E. coli in Lake Michigan beach
waters was provided by Whitman et al. (2006) and is shown in Figure 1. As can be seen,
numerous features determining the net E. coli concentrations in the lake are specific to the site.
These include human and nonhuman inputs of fecal pollution, mixing intensity at the site,
characteristics of streams that transport E. coli to the receiving water, storage capacity of soils
and sediments, and morphology of the region near the beach. The authors also review the
potential for naturally occurring E. coli across sand environments, and discuss the potential for
an autochthonous source of such bacteria because of the consistent nature of measurements
observed across the study sites.
Deducing the impact a particular factor has on indicator organism occurrence, persistence, or
growth is often difficult, given the many and complex processes occurring in a particular
environment. For example, several studies noted the rapid rebound of indicator organism
concentration in the surf zone after sunset following sunny days (Boehme et al. 2003, Rosenfeld
et al. 2006, Whitman et al. 2004) but none have definitively identified the cause for the rebound.
Context-specific factors playing potential roles in the observed rebound were related to mixing
(large or small spatial scale), resuspension, loading of “fresh” indicator organisms from sources
outside the study area, repair of damaged organisms, or growth rate in the surf zone outpacing
death rate in the absence of insolation. Location-specific features that have been determined to
play a role in the extra-enteric occurrence and survival of fecal indicator bacteria include rainfall
and runoff, mixing, and land use in the vicinity of study areas (e.g., Coulliette et al. 2008,
Seurinck et al. 2006, Surbeck et al. 2010).

U.S. Environmental Protection Agency
December 2010 33
Figure 1. Illustration of the processes determining the incidence of culturable E. coli in Lake Michigan beach waters (SOURCE: Adapted from Whitman et al. 2006)
4.6 Evidence of Extra-Enteric Growth
In the literature, extra-enteric growth of fecal indicator bacteria is typically either measured
directly (increase in counts of fecal indicator bacteria) or inferred for the climate-water-medium
combinations shown in Table 2 (see also Table 12 and Table 13 in Appendix C). Again, the
absence of confirmation of growth in a particular climate-water-medium combination does not
confirm that growth cannot occur for that combination; rather, it indicates that in specific studies,
this trend was not observed.
Section 4.6.1 presents evidence of direct growth that has been observed in documented studies.
In most cases, direct observations of indicator organism growth are drawn from microcosm and
mesocosm experiments in which the growth of organisms. Section 4.6.2 describes and analyzes
studies in which authors attributed increased or slowly decreasing fecal indicator bacteria
concentrations to growth. In these studies, growth is inferred from the net change in fecal
indicator bacteria concentrations. Section 4.6.3 states the conditions under which growth is most
likely and identifies data gaps regarding extra-enteric

U.S. Environmental Protection Agency
December 2010 34
Table 2. Conditions under which fecal indicator organism growth has been either measured or inferred in ambient conditions
Medium Water Type
Climate
Tropical Subtropical Temperate
Water column
Marine
Estuarine E. coli, enterococci Total coliforms, E. coli, Salmonella spp.
Fresh E. coli, fecal coliforms Total coliforms, E. coli, enterococci
Sediments
Marine E. coli, enterococci, fecal coliforms
Fecal coliforms
Estuarine
Fresh Fecal coliforms
Soils
Marine
Fresh E. coli, enterococci E. coli, enterococci, fecal coliforms
4.6.1 Direct Observation of Growth
A range of peer reviewed studies documented growth of fecal indicator bacteria in sediments,
soils, and in the water column (for a survey of studies, refer to Appendix C, Table 12). Growth
was documented or inferred in fresh water, soils, and sediments associated with fresh water, and
soils and sediments associated with marine or estuarine waters. Growth was not documented in
the marine water column, and salinity drastically increases rates of loss of members of the fecal
coliforms (including E. coli). The lack of observations of growth specifically in marine water
columns should be treated as a data gap and not proof that growth cannot occur. Rhodes and
Kator (1988) suggest that failure to observe growth of fecal indicator bacteria in some laboratory
experiments may be a result of the harsh processes employed in preparing inocula, such as
centrifugation and washing at cold temperatures.
The majority of growth observations have been made in soils, where fecal indicator bacteria
likely benefit from protection from harsh environmental conditions and high organic matter
contents (e.g., Alm et al. 2003, Anderson et al. 2005, Bonilla et al. 2007). Growth in soils has
the potential to influence fecal indicator bacteria concentrations in the overlying water column
and in sediments, permitting the benthos to serve as a reservoir of fecal indicator bacteria. If
growth in soils by fecal indicator bacteria is mirrored by growth of pathogenic bacteria, there
could be public health risks associated with contact with the soils during recreational activity.
This has been demonstrated in the context of sand by Heaney et al. (2009), but has not been well
documented for other soil types.
Most of the studies that documented fecal indicator bacteria growth were conducted in laboratory
microcosms or in situ in diffusion chambers. Although numerous researchers have noted
shortcomings associated with such microcosm experiments (e.g., slow response of mesocosms to
changes in environmental conditions, difficulty in designing microcosms that simulate the
complex array of physical, chemical, and biological factors present in environmental waters;
Anderson et al. 2005), there is no clear alternative procedure for quantifying growth and decay in
the presence of competing processes. A few researchers have noted the importance of grazing
processes in experiments to assess growth, persistence and removal of fecal indicator bacteria

U.S. Environmental Protection Agency
December 2010 35
(e.g., Boehm et al. 2006). However, in mesocosms, grazing processes may largely be reduced
through water sample manipulation. Some researchers even prefilter the ambient water used for
mesocosm studies, thereby eliminating clearance of fecal indicator bacteria by grazers. Grazers
are likely to be an important factor in removal of fecal indicator bacteria that is not well
understood. Alm et al. (2006) found that growth (more than 3 logs) of E. coli occurred in
diffusion chambers filled with moist autoclaved soil whereas E. coli concentrations decreased in
sand adjacent to the mesocosms during the experiment. This finding indicates that conditions
(nutrients, carbon sources, temperature, and others) in the soil are favorable for growth and that
processes such as predation and soil washing by runoff reduce soil fecal indicator bacteria
concentratins and may thus mask (or inhibit) growth. Davies et al. (1995) were able to
demonstrate growth of fecal indicator bacteria in marine sediments when potential predators
were inhibited with cycloheximide. Further, the authors inferred from deviation of decay
kinetics from first-order that the die-off of the fecal coliforms reflected processes more complex
than simple inactivation. Rhodes and Kator (1988) observed markedly different growth and
decay rates in filtered and unfiltered estuarine water and attributed those differences to
competition and predation.
While the extra-enteric growth of E. coli, enterococci, fecal coliforms, and total coliforms have
been documented, the majority of growth observations have been made for E. coli. This is likely
due to the ease of using and growing cultured E. coli in the laboratory. Also, E. coli is a single
species, making quantification of the target cell easier than assessments of enterococci. In a small
number of studies, the growth, persistence, or decay of other fecal indicator bacteria (other than
E. coli, enterococci, and fecal coliforms) were reported. These studies present some interesting
findings.
growth of Clostridium perfringens was not observed under conditions in which E. coli was
documented to grow (Desmarais 2002), though C. perfringens was persistent under those
conditions; and
Bifidobacterium adolescentis did not grow in a tropical stream under conditions for which E.
coli growth was observed (Carillo et al. 1985).
In general, the lack of systematic study of alternative fecal indicator bacteria in controlled
laboratory or in situ studies is a major data gap that may need to be filled before the efficacy of
alternative indicators may be assessed.
Growth in sediments was observed at a site with a temperate climate and in marine and fresh
waters. In most cases, growth was observed directly; in other cases, growth was inferred from
deviation of indicator organism decay rate from first-order. Non-first-order decay indicates that
decreases in indicator numbers may be a net result of growth and predation or other processes
rather than inactivation alone (Davies et al. 1995).
Six studies documented growth in the water column (Carillo et al. 1985, Desmarais et al. 2002,
Hardina and Fujioka 1991, Isobe et al. 2004, Okabe and Shimazu 2007, Rhodes and Kator 1988).
Carillo and colleagues measured E. coli and Bifidobacterium adolescentis concentrations in
diffusion chambers that were suspended in a tropical stream at two locations—one known to be
impacted by sewage and a second at an elevation above suspected sources of fecal

U.S. Environmental Protection Agency
December 2010 36
contamination. E. coli was observed to increase in number over time at both sites while B.
adolescentis did not. The observed growth of E. coli at a site believed to be relatively free of
human sewage indicates that nutrient levels associated with relatively clean, unimpacted waters
were sufficient to sustain an E. coli population. Growth of total coliforms in the water column
was observed under temperate climate conditions typical of Tokyo, Japan (Okabe and Shimazu
2007). Growth was achieved in controlled laboratory investigations using unfiltered river water
and seawater. Conditions at which growth was observed were a water temperature of 10C and
salinity at or below 10 ppt. Growth was not observed at 4C and no salinity and at 20C or
above. Although fecal coliform growth was not observed at no salinity, 10C, the decay rate was
very low (0.02 d-1
), indicating the potential for a balance between growth and other processes
such as predation or intoxication. In contrast to the effect of temperature on growth observed by
Okabe and Shimazu, Rhodes and Kator (1988) observed that in in situ diffusion chamber
experiments, growth (large negative values of decay constant) of both E. coli and Salmonella
spp. was observed in the initial 2 to 3 days when temperature was greater than 18°C.
Studies of growth in soils report the ability of fecal indicator bacteria to survive adverse
environmental conditions that have previously been thought to limit their ability to persist for
long periods outside animal hosts. Ishii et al. (2007) determined that E. coli overwintered in
frozen soils and subsequently grew in soils in a Lake Superior watershed. In the course of the
study, the E. coli underwent several freeze/thaw cycles. Confirmation that E. coli regrew after
winter was made based on knowledge of loadings in the soil plots where growth was observed
and based on the genotype of E. coli observed before and after winter. Ishii et al. (2007) and
others (Bonilla et al. 2007, Craig et al. 2004, Shiaris et al. 1987) have noted that the soil
properties most conducive to growth or persistence are small particle size and sufficient organic
content.
It is important to note that optimal growth temperature may differ in the water column and in
soils. Data from systematic experiments indicate that water temperature above around 10 C are
negatively correlated with fecal coliform, E. coli, and enterococci concentrations (e.g., Craig et
al. 2004, Lipp et al. 2001). On the other hand, several authors (e.g., Hardina and Fujioka 1991,
Ishii et al. 2007) suggest that high concentrations of fecal indicator bacteria in soils compared
with those in the water column may be related to higher, more consistent temperatures
encountered in soils. Clearly, there is empirical evidence of a myriad of complex processes
relevant to bacterial growth and decay.
Other studies (Desmarais et al. 2002, Vigness et al. 2006) have demonstrated the ability of fecal
indicator bacteria to regrow in soils after dessication. Vigness and colleagues demonstrated
tolerance of dessication in sand plot experiments conducted near fresh waters. Specifically, they
demonstrated that E. coli could tolerate low sand humidity conditions (<5 percent) and can
resume active growth after rehydration. Desmarais and colleagues simulated drying-wetting
conditions such as those experienced in tidal cycles. In that study, sediments from a stream with
brackish water were dried then rehydrated in a simulation of tidal cycles. After rehydration,
significant regrowth (1.5- to 2-logs) was observed for E. coli and enterococci in both the
sediments and in the water column.

U.S. Environmental Protection Agency
December 2010 37
4.6.2 Indirect Evidence of Growth
Numerous studies have used indirect evidence to assert that growth of indicator organisms
occurs in various climates and in various media. In some cases, persistence and the presence of
conditions conducive to growth were taken as evidence that growth was likely or possible. For
example, Byappanahalli et al. (2006) consistently found E. coli in soils in a protected natural area
in a temperate climate (along the shores of Lake Michigan. In that study, numbers and
population genetics of E. coli in soils at six separate study locations were observed between the
months of March and October. The E. coli were persistent and able to regrow after soil
desiccation and re-hydration. The authors took these observations to be evidence of the potential
for growth and suggested that additional studies be performed at other temperate climate
locations, focusing on the effect of soil chemical and physical characteristics and ecological
characteristics (e.g., survival strategies, growth requirements, microbial interactions, population
genetics).
Other studies have demonstrated that observations of indicator organism decline indicate a
balance between ecological processes, including indicator organism growth, predation, the
production of substances toxic to the indicator organisms, and other processes. For example,
using in situ measurements (diffusion chamber) of fecal coliform numbers in microcosms,
Davies et al. (1995) showed a significantly longer persistence of fecal coliforms in the absence of
predators than when they were present. This finding indicates the potential for growth in suitable
ecological conditions. In the same study the authors determined that marine sediments provide a
favorable, non-starvation environment for E. coli. Both of these findings indicate the potential
for extra-enteric growth if ecological conditions are favorable.
The rapid rebound of bacteria populations after daylight hours has been advanced by researchers
as providing evidence of potential indicator organism growth. Boehm et al. (2002) suggested
that growth outpacing die-off and predation is one of several possible reasons for rapid rebound
of enterococci and other indicator bacteria after dark. Other potential explanations include
resuscitation of damaged bacteria, resupply of bacteria, or resuspension of nearshore and
foreshore bacteria by wave action (Rosenfeld et al. 2006).
Other studies (described in Section 4.7.1) have been conducted to evaluate the survival of
indicator organisms in various conditions (in situ, in light and dark, under various light sources,
etc). In those studies, decay rate constants for fecal indicator organisms kept in dark conditions
were universally very low compared with those calculated for light conditions. Under dark
conditions, it is possible that predation or other competing processes can mask the incidence of
indicator organism growth. This uncertainty over whether or not in-water-column growth occurs
over the range of environmental conditions encountered during recreational use seasons
represents a data gap that could be filled through applied research so that growth (or lack thereof)
may be separated from the other processes determining the net rate of change of indicator
organisms.
4.6.3 Assessment of Conditions Supporting Growth and Identification of Data Gaps
From the preceding observations of growth, the following conclusions may be drawn:

U.S. Environmental Protection Agency
December 2010 38
Growth of E. coli has been reported in all but one climatic condition. Although growth
has not yet been observed in the subtropical climate, there does not appear to be any
growth-related feature associated with the subtropical climate that is dissimilar enough
from those in tropical or temperate climates to preclude growth.
Growth of E. coli has been observed in all media-water combinations except in the
marine water column.
Predation by indigenous species may result in net decline of indicator organism
population despite growth.
The nutrient and carbon requirements for growth of E. coli in soils are modest (Hardina
and Fujioka 1991, Whitman et al. 2006) and growth has been observed in soils and in the
water column in areas in the absence of human sewage.
Soils with higher silt and clay content are more conducive to indicator growth than those
with high sand content.
E. coli and possibly other indicator bacteria can survive harsh environmental conditions
encountered outside intestines. These surviving organisms can then regrow in soils.
Measurement of growth in situ in fresh waters is difficult because predation, introduction
of indicator organisms from other external sources, and other processes mask the
occurrence of growth.
Four data gaps preclude a full understanding of the incidence of extra-enteric growth and the
conditions under which it occurs. First and foremost, data on the ability of alternative indicator
organisms to grow in all climate zones and in all water types is lacking. The majority of studies
reviewed in this draft report examined the occurrence and growth of traditional fecal indicator
organisms, including E. coli, enterococci, and coliforms. Systematic study of the growth of
candidate alternative fecal indicator organisms through research similar to that described above
is essential in determining the efficacy of those organisms as indicators of fecal pollution.
Second, the ability of enterococci to survive in marine environments under favorable
environmental conditions (low or no light, low or limited predation, favorable temperatures)
could be determined through focused research. Improved knowledge of enterococci growth rates
are essential for development of phenomenological models of indicator transport and fate for
marine beaches and could help explain the observed rapid rebound of enterococci numbers at
marine beaches after dark.
Third, research could be conducted to assess whether marine and relatively unimpacted fresh
waters can support indicator organism growth. Among the water column studies described
above, none documented growth in those two environments. In situ studies could be conducted
in areas such as protected stream headwaters, marine waters near protected areas, and areas
located far from known sewage discharges. Such studies could help establish whether indicator
organism growth requirements are met in relatively unimpacted waters.
Fourth, potential intra-region spatial variation of fecal indicator bacteria growth needs to be
quantified. Some studies have documented differences in growth among soils in various settings
and distances from waters. Other studies might be conducted to assess the potential for growth
as a function of depth in the water column, as a function of depth in the soil or sediment layer, or

U.S. Environmental Protection Agency
December 2010 39
from site-to-site within a given study area. Factors expected to vary spatially within study areas
are salinity, soil type, nutrient availability, temperature, and others.
4.7 Evaluation of Factors Contributing to Occurrence, Persistence, or Growth of
Indicator Organisms
The factors that influence the extra-enteric growth, persistence, and occurrence of fecal indicator
organisms can be classified as general and context-specific. General factors are growth
conditions such as temperature, salinity, solar flux, nutrient level, to name a few, which may be
measured in a sample or at a particular location. General properties are intensive properties
whose values are independent of the mass or extent of the system in which they are measured
(Wark 1983). Regardless of climate zone or other features related to a site, indicator organism
response (growth, death, persistence) to general properties will be essentially the same,
regardless of site. Extensive properties are those that are specific to a site. Context-specific
properties may influence site indicator organism concentration via loading or via their role in
establishing the intensive properties at the site. The influence of context-specific properties is
expected to vary significantly from site-to-site. For example, sewage outfalls influence indicator
organism concentration via direct discharge of indicator organisms into receiving waters and
sediments, influences on the nutrient level or substrate availability in receiving waters, changes
in the concentration of suspended particles, or because they may give rise to density currents and
increase mixing, etc. (e.g., Ashbolt and Bruno 2003, Krometis et al. 2007). The magnitude of the
effects of sewer outfalls varies from site-to-site because outfalls discharge different volumes of
water with different water qualities and because the orientation of outfalls varies from site-to-
site.
Results of research on the influence of intensive and extensive properties on indicator organism
occurrence, persistence, and possibly growth are summarized below. First, the influences of
intensive properties are reviewed. The intensive conditions most favorable to growth and
persistence in soils, sediments, and the water column are assessed and data gaps related to the
influence of intensive properties are identified. Second, the influence of extensive features on
occurrence, persistence, and growth are reviewed and assessed and data gaps related to extensive
features are identified.
4.7.1 General Parameters
The current understanding of the influence of the general (intensive) parameters found in Table
9, Table 10, and

U.S. Environmental Protection Agency
December 2010 40
Table 11 in Appendix C and combinations of these parameters on fecal indicator bacteria fate is
described below. For each parameter, the data gaps in current understanding of the effect of the
parameter in various environments are listed. Summaries of findings of studies related to each of
these parameters are presented in tabular form in Appendix C (Tables 15 to 19).
Sections for each parameter begin with a table showing the conditions under which the effect of
the particular parameter has been studied. The conditions shown include the climate zone in
which the study was conducted, the media in which studies were made, the water type in the
study (marine, estuarine, or fresh), and the degree to which the region in which the study was
conducted was impacted by human sources of fecal pollution. The impact designations (i.e.,
HSI, HAI, and LI) were described in Section 4.3.
4.7.1.1 Temperature
The conditions under which temperature influences on indicator organisms were assessed are
presented in Table 3. Summaries of findings of studies on the effect of temperature are found in
Appendix C, Table 15. As discussed below, temperature influences bacteria fate directly via
dependence of microbial kinetics (growth and inactivation rates) on temperature and indirectly
through mechanisms such as fluid motion via density currents.
Table 3. Settings for which temperature effects on extra-enteric fate were studied
Medium Water Type Impacts Climate
Tropical Subtropical Temperate
Water column Marine HSIa
X X
HAIb
LIc
X X
Estuarine HSI
X X
HAI
LI
Fresh HSI
X X
HAI
LI
X X
Sediments Marine HSI
X
HAI
LI
Estuarine HSI
HAI
LI
Fresh HSI
X
HAI
LI
Soils Marine HSI
HAI
LI
Estuarine HSI
HAI
LI
Fresh HSI
X
HAI
LI
U.S. Environmental Protection Agency
December 2010 41
a Expected or observed significant impacts from human sewage
b Expected or observed impacts from human agriculture/animal operations
c Expected or observed limited impacts from human sources
Some exceptions to the trend of increasing decay rate with increasing temperature were
previously noted in the studies reviewed in this draft report. Carillo et al. (1985) found the
densities of fecal coliforms and E. coli were positively correlated with water temperature for
studies in a tropical freshwater stream in the temperature range 21.1 to 27.1 C. He et al. (2007)
found that the influence of temperature on indicator survival in subtropical estuarine waters was
different in ponded waters than in waters that were flowing; in ponded waters, fecal coliform,
total coliform, and enterococci concentrations were positively correlated with temperature.
Whitman and Nevers (2003) determined that temperature was positively correlated with E. coli
counts in the water column at sites on Lake Michigan.
Fewer studies have been conducted on the effect of temperature in soils and sediments than the
effects in the water column. Craig et al. (2004) observed that declines in E. coli populations in
marine and river sediments were more rapid at higher temperatures within the temperature range
10 to 30 C. Whitman and Nevers (2003) found that water temperature was significantly
correlated with E. coli counts in submerged sands (correlation coefficient [r] = 0.396). In studies
of temperate soils, Whitman and Nevers found that foreshore sand E. coli counts were correlated
with temperature and water temperature. Ishii et al. (2007) observed growth of E. coli in non-
sterile soils for soil temperature above 30C.
Findings (reported in the preceding paragraph) on the influence of temperature on indicator
organisms in the water column versus the effect in soils and sediments yields a seeming
paradox—low temperature (around 10C) appears to favor persistence and growth of E. coli and
other indicator organisms in the water column whereas higher temperatures appear to favor
growth in soils and is sometimes associated with growth or slower decay in the water column. A
possible explanation for this phenomenon is the difference in microbial ecology in sands and
sediments versus that in the water column. This paradox indicates a research gap.
Several authors have noted synergy between temperature effects and effects of other general
properties on indicator organism survival. For example, in studies in marine and fresh waters,
Craig et al. (2004) determined that increased temperatures led to more rapid declines in E. coli
numbers at a given light intensity. Bordalo et al. (2002) noted that daily variations in
temperature may influence the microbial population which, in turn, influences the observed
effect of sunlight on indicator organism decay rate.
In summary, optimal survival or growth conditions for fecal coliforms, E. coli, and enterococci
in the water column appear to be at a temperature around 10C, though several contradictory
observations were found in the literature. Growth and survival in soils appears to favor higher
temperatures (> 30C), though limited data were available to make this determination. The most
significant data gaps relate to the effect of temperature on fate in soils and sediments, particularly
tropical and subtropical soils and sediments. Other data gaps are for soils and sediments in
relatively unimpacted areas and for all media in subtropical regions. The lack of data on the
temperature conditions in which growth may occur in soil is especially important, given the

U.S. Environmental Protection Agency
December 2010 42
likelihood that soils serve as indicator organism reservoirs and can be sources of the organisms
during rain events.
4.7.1.2 Salinity
The conditions under which researchers have studied the influence of salinity on fecal indicator
bacteria persistence are presented in Table 4. Summaries of findings of studies on the effect of
salinity are found in Appendix C, Table 16. Salinity influences fecal indicator bacteria survival
directly via contributions to inactivation of the organism, changes in osmotic potential, stress to
membrane structures, and indirectly through microbial competition.
The studies reviewed for this draft report generally found salinity at levels observed in seawater
to contribute to declines in fecal indicator bacteria populations. However, the specific effects of
salinity differed among fecal indicator bacteria types and with other water quality parameters
(temperature and others). In studies of the water column, Anderson et al. (2005) determined
fecal coliform decay in salt water to be approximately 15-times that observed for fresh water
under similar conditions (with the same inoculum and general properties). Bordalo et al. (2002)
made similar observations for indicators in estuarine waters; Harwood et al. (2004) for waters
from tropical sources; Lipp et al. (2001) and Jeong et al. (2005) for estuarine waters; He et al.
(2007) for ponded and flowing waters; and by Šolić and Krstulović (1992) for polluted marine
waters.
Salinity in sediments also appears to cause loss of fecal indicator bacteria populations, though
decay rates in saline sediments appear to be less than those observed in the water column
(Harwood 2004). Studies that examined the effect of salinity on survival in sediments include
Anderson et al. (2005), Davies et al. (1995), Evanson and Ambrose (2006), Harwood (2004), and
Lipp et al. (2001).
Synergy between sunlight inactivation and salinity was noted by several authors (e.g., Bordalo et
al. 2002; Šolić and Krstulović 1992). Although a mixed effect has also been absent in a range of
previous studies, the synergy is important to identify. Those researchers that did observe
synergy between sunlight inactivation and salinity found that the bactericidal effects of sunlight
were enhanced by even small increases in salinity. For example, Šolić and Krstulović found that
the greatest impacts of salinity on survival were observed in the range 10 to 15‰; increasing
salinity above 15‰ produced small changes in survival time compared with changes observed in
the lower salinity range.
In summary, salinity has a negative impact on the survival or growth of fecal coliforms, E. coli,
and enterococci in the water column and in sediments. The greatest effects appear to be in the
low salinity range; changes in salinity above 15‰ were observed to produce only small changes
in indicator organism survival. Data gaps in knowledge of the impact salinity has on indicator
organism survival are the influence of salinity on survival in the low salinity range, the influence
of salinity on survival or growth in all media in environments with limited fecal pollution
impacts, and the influence of soil salinity on indicator organism growth and the make-up of the
soil microbial population.

U.S. Environmental Protection Agency
December 2010 43
Table 4. Settings for which salinity effects on extra-enteric fate were studied
Medium Impacts Climate
Tropical Subtropical Temperate
Water column HSIa
X X X
HAIb
LIc
Sediments HIS
X X X
HAI
LI
Soils HIS
HAI
LI
a Expected or observed significant impacts from human sewage.
b Expected or observed impacts from human agriculture/animal operations.
c Expected or observed limited impacts from human sources.
4.7.1.3 Sunlight
The conditions under which researchers have studied the influence of light and sunlight on fecal
indicator bacteria survival are presented in Table 5. Summaries of findings of studies on the
effect of sunlight are found in Appendix C, Table 17. Sunlight influences indicator organism
survival directly through inactivation and direct damage to DNA and RNA in the cells, and
indirectly through changes in the microbial population. In particular, it is difficult to summarize
sunlight-based studies, because not all researchers include data in their documentation relevant to
“dose” of sunlight, i.e. measurements of PAR or other measures of solar irradiance for direct
comparison.
Table 5. Settings for which light and sunlight effects on extra-enteric fate were studied
Medium Water Type Impacts Climate
Tropical Subtropical Temperate
Water column Marine HSIa
X X X
HAIb
LIc
X X
Estuarine HSI
X
HAI
LI
Fresh HSI
X
HAI
LI
X a Expected or observed significant impacts from human sewage.
b Expected or observed impacts from human agriculture/animal operations.
c Expected or observed limited impacts from human sources.
In all studies, sunlight was seen to dramatically decrease fecal indicator bacteria concentrations
as a function of applied dose. Significant decreases in survival were noted for fecal coliforms
(Bordalo et al. 2002, Fujioka et al. 1981, Sinton et al. 1999, Šolić and Krstulović 1992),
enterococci (Boehm et al. 2002, Noble et al. 2004, Rosenfeld et al. 2006), and E. coli (Alkan et
al. 1995, Davies and Evison 1991, McCambridge and McMeekin 1981, Noble et al. 2004,

U.S. Environmental Protection Agency
December 2010 44
Rosenfeld et al. 2006, Whitman et al. 2004). In a single study of the impact of sunlight on
bacteriophages (Wommack et al. 1996), (1) decay rates were much higher for light conditions
than for dark conditions, and (2) decay rates for microcosms at the water surface were twice as
high as those for microcosms suspended 1 m below the water surface in an estuary. In general,
survival curves for indicator organisms exposed to sunlight exhibited “shoulder” behavior (e.g.,
Kapuscinki and Mitchell 1983, Sinton 2007) followed by first-order decay.
Several studies have noted temporal variations in fecal indicator bacteria concentrations related
to daily sunlight cycles. Boehm et al. (2002) used spectral analysis to distinguish between
fluctuations in enterococci concentration resulting from sunlight cycles and other causes. They
found that significant sunlight-related fluctuations occurred daily, with the lowest concentrations
of fecal indicator bacteria (enterococci) occurring in the mid-afternoon and the highest
concentration occurring after dark. An interesting finding made in that study and another study
of temporal fluctuations of indicator organisms (Rosenfeld et al. 2006) was that fecal indicator
bacteria concentrations rebounded very quickly after daylight hours. Possible explanations for
the rapid rebound are repair of damaged cells, resupply, growth, or entrainment of organisms in
mixing processes.
Researchers have examined the relationship between fecal indicator bacteria populations and
associated particles. Many studies have been conducted in soils and those related to potential
inactivation processes in aquatic systems (Fujioka et al. 1999). In source fecal contamination,
and throughout the wastewater treatment process, fecal indicator bacteria are frequently
associated with particles. The bacteria are in effect protected from UV disinfection due to this
particle association (Emerick et al. 2000). Research has been conducted to determine particle
sizes associated with shielding UV light and quantify number of particles with embedded
coliform bacteria (Emerick et al. 1999), to quantify bacteria and loss in the presence of
wastewater solids (Loge et al. 1999), and to assess the decay rates of fecal indicator bacteria in
wastewater treatment plant material (Loge et al. 2001). While there are several studies that have
examined the protection of fecal indicator bacteria from UV irradiation and other environmental
factors due to particle association, most have been conducted in either drinking water or in the
wastewater stream, and have not been conducted in ambient waters. Fries et al. (2005) did not
study decay per se, but did describe the portion of fecal indicator bacteria in an estuarine setting
associated with particles. The findings indicated that surprisingly, upwards of 40% of the fecal
indicator bacteria in the ambient waters were attached to particles, and that their settling
velocities were therefore altered due to this association. It will be important in the future to
study particle-association and the complex factors of nutrient status, and organic matter
concentrations and quality to fully understand processes related to fecal indicator bacteria
dynamics in ambient conditions.
Other important findings of studies of sunlight on fecal indicator bacteria survival include the
following:
significantly different inactivation rates have been observed between studies conducted
with artificial light sources and those conducted in natural sunlight;

U.S. Environmental Protection Agency
December 2010 45
inactivation rates reduce with water depth because the energy spectrum of light changes
with penetration depth and because of reflection and absorption of solar energy in turbid
waters; and
there is apparent synergy between (1) solar radiation and salinity (the effect of solar
radiation is enhanced in saline waters), (2) solar radiation and temperature (the effect of
solar radiation is enhanced at higher temperatures), and (3) solar radiation and the effects
of competition and predation (McCambridge and McMeekin 1981).
Data gaps in the understanding of the effects of sunlight on extra-enteric survival of indicator
organisms include the following:
the capacity of fecal indicator bacteria to repair from sunlight damage; and
the impact of sunlight on fecal indicator bacteria across a range of different climate types.
4.7.1.4 Turbidity and Suspended Solids
The conditions under which various researchers have studied the influence of suspended solids
and turbidity on indicator organism survival are presented in Table 6. Summaries of studies on
the effect of temperature are found in Appendix C, Table 18. Turbidity and suspended solids
influence indicator organism survival through reflection of sunlight (Davies et al. 1995),
adsorption and sheltering of indicator organisms (particle-associated bacteria), and possibly other
mechanisms (Characklis et al. 2005).
Studies of turbidity and total suspended solids (TSS) have either examined the extent to which
the two parameters were correlated with the concentration of indicator organisms or sought to
quantify the indicator organism load associated with settleable and non-settleable particulate
matter. Indicator organism concentrations have correlated poorly with turbidity and suspended
solids concentrations in most cases. In a study of south Florida beaches, Shibata et al. (2004)
found no correlation between turbidity and E. coli or enterococci (though Clostridium
perfringens and total coliforms were correlated with turbidity). Similarly, Jeong et al. (2005)
found no consistent correlations between fecal coliforms, E. coli, or enterococci and turbidity for
samples taken in an estuary with known human sewage impacts. However, Mallin (2001) found
significant correlation between turbidity and fecal coliforms across multiple sites in a tidally-
influenced creek while Tunnicliff and Brickler (1984) noted that in the Colorado River, fecal
coliforms were positively correlated with turbidity during storm conditions.
Several authors studied the relationship between TSS and the proportion of indicator bacteria
associated with particles. Jeng et al. (2005) determined that for samples taken during 2 storms,
9.8 to 27.5% of fecal coliforms, 21.8 to 30.4% of E. coli, and 8.3 to 11.5% of enterococci in the
water column were associated with particles. Enterococci tended to associate with small
particles and were less likely to be removed from the water column through settling. This
differential partitioning of enterococci to small particles was also noted by Krometis (2007), who
similar results for Clostridium perfringens. Although TSS has been shown to be important for
association with fecal indicator bacteria, there is little direct evidence showing that TSS serves as
a direct predictor of survival or growth of fecal indicator bacteria. Given the array of particles
that can qualify as “total suspended solids” it is likely that the chemical makeup of the solids,

U.S. Environmental Protection Agency
December 2010 46
and the quality of the organic matter within (labile vs. refractory) is more important than the total
quantity.
Important data gaps related to turbidity and suspended solids include the following:
relationship of different types of particles as a portion of the TSS signal;
carbon to nitrogen rations in a range of different suspended solids, and TSS from a range
of different environments, and the relationship to fecal indicator bacteria concentration,
survival, and growth;
their impacts in settings with limited fecal impacts in waters and sediments and in all
climate zones;
the relationship between the recession of stream hydrographs, the recession of turbidity
and TSS from peak values after storms, and the recession of fecal indicator organism
concentrations from peak values after storms for watershed of all sizes, physical
characteristics, and land uses; and
the relationship between turbidity in deep waters and net reduction in indicator counts
due to solar radiation attenuation at a particular site or in a particular water body.
Table 6. Settings in which suspended solids and turbidity effects on extra-enteric fate were studied
Medium Water type Impacts Climate
Tropical Subtropical Temperate
Water column Marine HSIa
X
HAIb
LIc
X
Estuarine HSI
X X X
HAI
X
LI
Fresh HSI
HAI
LI
X a Expected or observed significant impacts from human sewage.
b Expected or observed impacts from human agriculture/animal operations.
c Expected or observed limited impacts from human sources.
4.7.1.5 Nutrients
Because comparatively few studies have systematically investigated the influence of nutrients on
indicator organism survival, those studies are reviewed individually below.
Alm et al. (2006) concluded that ample nutrients are present in Lake Huron beach sands to
sustain growth of E. coli. In controlled laboratory microcosm studies using autoclaved beach
sand inoculated with E. coli strains previously isolated from ambient beach sand, E. coli
densities increased from 2 CFU/g to more than 2 105 CFU/g sand after 2 days of incubation at
19°C, and remained above 2 105 CFU/g for at least 35 days. In field studies using similarly
inoculated microcosms filled with sterilized beach sands, growth was observed in microcosms
but not adjacent sands. The lack of growth in adjacent sands was taken as evidence of predation
or washing of indicators from the sands.

U.S. Environmental Protection Agency
December 2010 47
The presence of sufficient nutrients for growth in unimpacted tropical soils was demonstrated by
Byappanahalli and Fujioka (1998). This study found that (1) E. coli grew on 10% soil extract
agar, (2) populations of fecal coliforms and E. coli from sewage were shown to immediately
increase by about 3-logs when simple nutrients (glucose and salts) were added to natural soil,
and (3) fecal coliforms and E. coli increased by 2-logs within 24 hours when a minimal amount
of sewage was added to cobalt-irradiated soil.
In studies in fresh waters in Lake Michigan, Byappanahalli (2003) determined that Cladophora
(macro-alga) provides a suitable environment for indicator bacteria to persist for extended
periods and to grow under natural conditions. Observed growth of E. coli and enterococci was
directly related to the concentration of algal leachate.
Carillo et al. (1985) studied growth of indicator organisms in fresh tropical waters. Correlations
between bacterial densities, nitrates, phosphates, and total phosphorus indicated that all viable
counts were related to nutrient levels, regardless of the site sampled. Sites sampled in that study
ranged from highly impacted from sewage discharge to limited expected impacts. In situ studies
in unimpacted waters indicated that nutrient levels in the water column were sufficient to sustain
significant indicator organism growth.
In studies of soils in the swash zone of marine waters, Genthner et al. (2005) determined that
entrapment may partially account for increased bacteria densities; however, biological factors
(e.g., nutrients, protection from predation) and physical factors (e.g., particulate matter, periodic
wetting and drying, protection from solar irradiation) may not only allow the enhanced survival
of bacteria but may actually provide a growth-promoting environmental niche on the beach.
In a study by Lopez-Torres et al. (1987), statistical analyses indicated a positive correlation
between concentrations of fecal coliforms and increasing concentrations of phosphates, total
phosphorus, and nitrates. This finding implies that fecal coliforms follow a familiar pattern of
association with productive environments and high nutrients—conditions that are conducive to
growth.
The following two general conclusions can be drawn from these findings:
Nutrient requirements for growth of indicators in soils and the water column are modest
and have been shown to be present in sufficient quantities for growth in relatively
unimpacted waters and soils.
High nutrient levels are associated with relatively high counts of fecal coliforms in soils.
4.7.1.6 Organic Matter
Because comparatively few studies systematically investigated the influence of organic matter on
fecal indicator bacteria survival, those studies are reviewed individually below.
Seawater samples along an area of the Tyrrhenian coast near the Tiber River mouth were
examined for coliforms, fecal streptococci (enterococci), enteroviruses, Salmonella spp.,

U.S. Environmental Protection Agency
December 2010 48
coliphages, Bacteroides fragilis phages, Pseudomonas, alophilic Vibrios, Aeromonas, and yeasts
(Aulicino et al. 2001). Their results showed that the area studied was characterized by the
presence of organic matter originating from land that can support the presence of opportunistic
pathogens and other microbial flora.
Evanson and Ambrose (2006) observed spatial differences in enterococci counts at two sites in a
tidal wetland. One site tended to undergo flowing waters whereas stagnant conditions were
generally present at the other site. Differences between sites were attributed to sediment
differences, such as organic content and finer grain size and/or discrete sources of fecal indicator
bacteria.
Ferguson et al. (2005) examined water and sediment samples for a range of fecal indicator
bacteria from six sites in an urban estuary located in Sydney, Australia. In that study, the
presence of total organic matter was associated with a significant increase in the density of both
fecal coliforms and fecal streptococci.
In a study on the effects of estuarine sediments on the survival of E. coli in marine waters in
Texas, Gerba and McLeod (1976) observed longer survival of E. coli in sediments than in the
water column and attributed the increased survival to the greater content of organic matter
present in the sediment compared with that in seawater.
Lee et al. (2006) showed that fecal indicator bacteria levels in overlying water at two beaches
were related to sediment organic content.
These studies collectively show that organic matter is associated with the occurrence and growth
of fecal indicator bacteria. Research is necessary to derive further information about the roles of
specific types of organic matter and their relationships to fecal indicator bacteria growth and
persistence. Specifically, the quality of the organic matter, including molecular weight, and
carbon to nitrogen ratios, is probably important to ascertain. In receiving waters, it is also
important to understand whether organic matter is serving as a substrate for growth, or as a
protective shield from irradiation and predation, or both.
4.7.1.7 pH and Alkalinity
Only two studies were identified that systematically investigated the influence of pH on indicator
organism survival and only one investigated alkalinity effects; these are reviewed individually
below.
Carillo et al. (1985) observed negative correlations between bacterial densities (Bifidobacterium
spp., fecal coliforms, E. coli) and pH in the range 6.2 < pH < 7.0. Studies were conducted at
multiple sites on a tropical freshwater stream. In Croatian marine waters, Šolić and Krstulović
(1992) found that the optimum pH for fecal coliform survival was between pH 6 and 7 with rapid
decline occurring both above and below this range. Carillo et al. (1985) also found that fecal
coliform and E. coli counts in the water column were correlated positively with alkalinity.
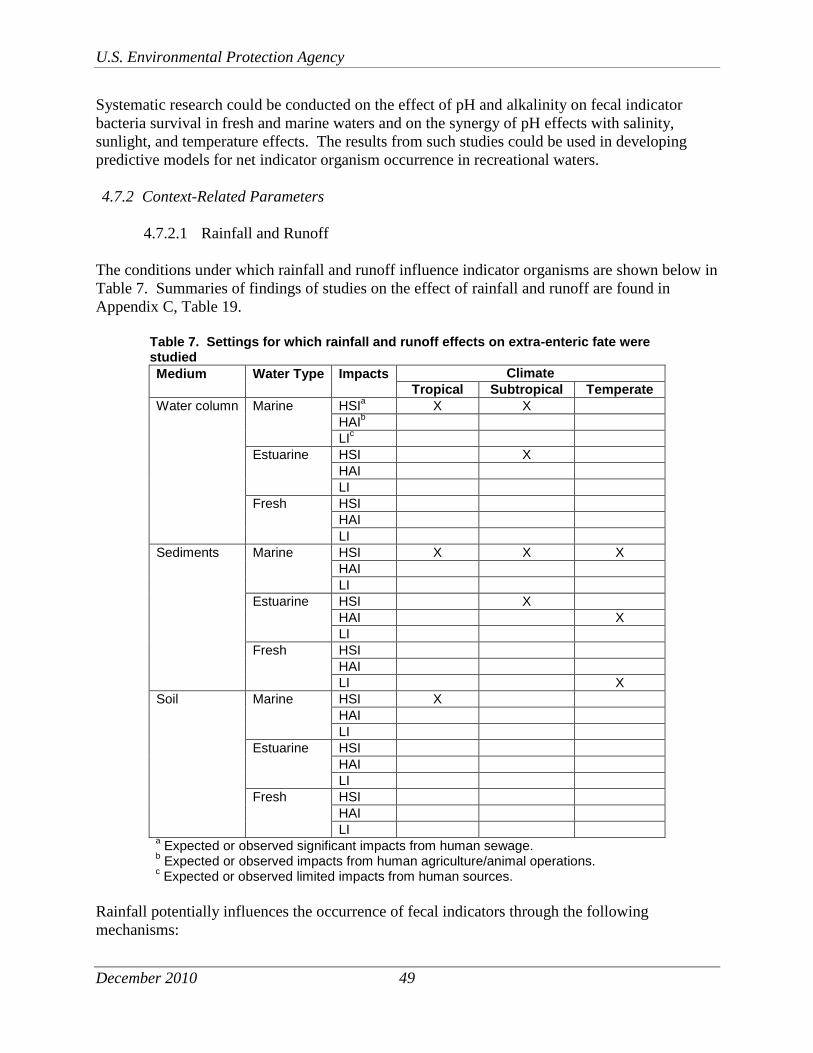
U.S. Environmental Protection Agency
December 2010 49
Systematic research could be conducted on the effect of pH and alkalinity on fecal indicator
bacteria survival in fresh and marine waters and on the synergy of pH effects with salinity,
sunlight, and temperature effects. The results from such studies could be used in developing
predictive models for net indicator organism occurrence in recreational waters.
4.7.2 Context-Related Parameters
4.7.2.1 Rainfall and Runoff
The conditions under which rainfall and runoff influence indicator organisms are shown below in
Table 7. Summaries of findings of studies on the effect of rainfall and runoff are found in
Appendix C, Table 19.
Table 7. Settings for which rainfall and runoff effects on extra-enteric fate were studied
Medium Water Type Impacts Climate
Tropical Subtropical Temperate
Water column Marine HSIa
X X
HAIb
LIc
Estuarine HSI
X
HAI
LI
Fresh HSI
HAI
LI
Sediments Marine HSI
X X X
HAI
LI
Estuarine HSI
X
HAI
X
LI
Fresh HSI
HAI
LI
X
Soil Marine HSI
X
HAI
LI
Estuarine HSI
HAI
LI
Fresh HSI
HAI
LI
a Expected or observed significant impacts from human sewage.
b Expected or observed impacts from human agriculture/animal operations.
c Expected or observed limited impacts from human sources.
Rainfall potentially influences the occurrence of fecal indicators through the following
mechanisms:

U.S. Environmental Protection Agency
December 2010 50
initiation of sewer overflows;
advection of fecal indicator organisms into stormwater conveyances and directly into
receiving water, soils, and sediments;
increase in streamflow and storm sewer flow rates; and
washing of indicator organisms from soils and sediments to down-slope soils and
sediments or into receiving waters.
Other, less-direct, influences that rainfall may have on indicator organism occurrence, survival,
decay, and growth include the following:
changes in sunlight penetration related to changes in turbidity associated with high runoff
rates and entrainment of sediments into the water column;
changes in particle concentrations with attendant change in proportion of particle-
associated bacteria;
changes in water temperature; and
advection of nutrients and carbon sources to soils, sediments, and the water column.
Although runoff, rainfall patterns, and land use are of great interest in predictions of fecal
indicator bacteria input to aquatic systems, a review of that literature is not possible within this
document. This section is merely to summarize some of the recent work in the area and to give
the reader some examples to follow for further reading. There are many mechanisms by which
rainfall and runoff may influence indicator organism occurrence and survival. As noted by
Ackerman and Weisberg (2003) although rain-based water quality warnings are attractive due to
their simplicity and the speed (relative to microbial enumeration) with which they may be issued,
the underlying relationships between rainfall and beach concentrations remains poorly
understood. Characklis et al. (2005) assert that “there is no such thing as a ‘typical’ storm.”
This assertion is based on the variability of indicator organism counts (fecal coliforms, E. coli,
enterococci, Clostridium perfringens, total coliphages, and particle concentration) among storms
that occurred after at least 3 consecutive days without appreciable rainfall and that caused stream
discharge to increase by at least a factor of 4.
Several studies have sought to identify threshold rainfall amounts at which fecal-indicator events
such as exceedances of AWQC are likely to occur. In analyses of rainfall and fecal indicator
organism concentrations observed at beaches in southern California, Ackerman and Weisberg
(2003) determined that storms with rainfall less than 2.5 mm produced no change in indicator
organism concentration above background levels and that all storms with rainfall amounts
greater than 25 mm resulted in an increase in the number of beaches failing state water quality
standards.
Other studies attempted to relate the timing of rainfall to peaks in concentrations of fecal
indicator bacteria . Ashbolt and Bruno (2003) determined that rainfall on the day of sampling (as
opposed to 24 hours prior to sampling) was the strongest predictor of enterococci counts in the
water column in marine waters near a highly-urbanized area. In contrast, Mallin et al. (2001)
and Seurnick et al. (2006) found rainfall in the 24 hours prior to sampling to have a significant
correlation with fecal coliform concentration in the water column. Ackerman and Weisberg
(2003) found that indicator organism counts in the water column peaked two days after small

U.S. Environmental Protection Agency
December 2010 51
storms and one day after large storms. Craig et al. (2002) determined that rainfall in the two
days prior to sampling was correlated to fecal coliform counts in marine sediments and LeFevre
and Lewis (2003) found that increased enterococci concentrations in sediments were observed
approximately 1 day after a rain event.
The duration of high indicator organism counts after rainfall is highly variable among sites and
from storm-to-storm. Ackerman and Weisberg (2003) found that at beaches in the City of Los
Angeles, average fecal coliform concentrations fell to background levels within 5 days of rain
events. Krometis et al. (2007) found that in a freshwater stream in North Carolina where
institutional and low density residential land use dominate the drainage, fecal coliform and E.
coli concentrations rose much more rapidly at the onset of a storm and receded much faster than
did enterococci and Clostridium perfringens. One possible explanation for the longer occurrence
of enterococci after storms is its tendency to associate with smaller, slower-settling particles
(Characklis et al. 2005; Krometis et al. 2007). In eastern North Carolina, Coulliette et al. have
demonstrated the importance of stormwater as a conduit of fecal indicator bacteria to estuarine
systems.
Data gaps related to rainfall and runoff include the influence of rainfall and runoff from
drainages with significant confined animal operation land use, the impact of rainfall and runoff
on soils indicator organism concentrations for all water types and climate zones, and systematic
studies on the influence of rainfall and runoff on indicator organism concentrations in the water
column and sediments of fresh waters. Studies of indicator organism dynamics could also be
conducted, since rainfall has been widely suggested as an important element of beach water
quality forecasting. However, as rainfall patterns can be highly regional this work typically needs
to be conducted on a small scale.
4.7.2.2 Mixing and Circulation
The conditions under which researchers have studied the influence of mixing and circulation on
indicator organism survival are presented in Table 8 and the studies in the literature pertaining to
rainfall and runoff are summarized in Appendix C, Table 20.
Mixing and circulation influence fecal indicator organism survival and occurrence directly
through transport of the organisms, dilution, and resuspension. Indirect influences on indicator
organism populations are the transport of nutrients and substrate to indicator organisms in all
media and through changes in physical and chemical properties related to indicator organism
survival and growth. Mixing occurs at many time and length scales in the natural environment.
Mixing may be related to tidal cycles, wind effects, wave action (LeFevre and Lewis 2003),
groundwater circulation, stratification or turnover of lakes, turbulence, density currents, and
numerous other causes. Boehm et al. (2002) demonstrated the dependence of indicator organism
concentration on mixing and fluid transport processes that occur on monthly, daily, hourly, and
10-minute time scales. Measured indicator organism concentrations at a given time are a result
of the net effect of these processes with different time scales.

U.S. Environmental Protection Agency
December 2010 52
Table 8. Settings for which mixing and circulation effects on extra-enteric fate were studied
Medium Water Type Impacts Climate
Tropical Subtropical Temperate
Water column Marine HSIa
X X
HAIb
LIc
Estuarine HSI
HAI
LI
Fresh HSI
X
HAI
LI
Sediments Marine HSI
X
HAI
LI
X
Estuarine HSI
X
HAI
LI
Fresh HSI
HAI
LI
Soils Marine HSI
HAI
LI
Estuarine HS
HAI
LI
Fresh HSI
X
HAI
LI
a Expected or observed significant impacts from human sewage.
b Expected or observed impacts from human agriculture/animal operations.
c Expected or observed limited impacts from human sources.
Several studies related changes in indicator organism concentrations to tidal processes. Boehm
et al. (2002) noted that the following tidal processes have the potential for influencing indicator
organism concentrations: tidal flushing of estuaries and channels, tidally-modulated near-shore
circulation patterns, exfiltration of bacteria-contaminated groundwater via tidal pumping, and the
movement of offshore wastewater fields by internal tides. Shibata et al. (2004) observed that
enterococci and Clostridium perfringens concentrations were elevated at the shoreline of a
tropical ocean beach during high tides while Solo-Gabriele et al. (2000) observed that the highest
E. coli measurements made during their study during periods between rain events were at high
tides. Jeong et al. (2005) found increased indicator counts at ebb tides at a beach in southern
California and attributed this finding to reduction in salinity attendant to ebb tides. Rosenfeld et
al. (2006) determined that contamination events at southern California beaches occurred more
frequently with larger tidal range.
Mixing and turbulence may result in the washing of indicator organisms from soils or sediments
into the water column or the resuspension of individual bacteria or particle-associated bacteria
into the water column. An et al. (2002) related the purchase of gasoline at a marina (an indicator

U.S. Environmental Protection Agency
December 2010 53
of power boat use) to levels of indicator organisms during periods with no storms. The authors
concluded that turbulence generated by boats that resuspend sediments that are laden with fecal
indicator bacteria, resulting in elevated counts in the water column. The action of waves on
beach sands may also entrain indicator organisms into the water column. Oshiro and Fujioka
(1995) associated wave action with low concentrations in near-shore sand indicator organism
concentrations. Waves were hypothesized to wash indicator organisms from soils, resulting in
low indicator organism concentration in soils near the shore than in soils further upslope.
Mixing processes and circulation processes are complex and can influence indicator organism
concentrations in myriad ways. The current understanding of the role mixing plays in the
occurrence and persistence of indicator organisms is limited and probably insufficient for a
priori prediction of the influence of mixing at sites where no data have been taken. Relatively
few studies were found in the literature dealing with mixing and circulation directly. Data gaps
related to mixing and circulation are data for all media and impact classifications for tropical
climates, data for all media and water types in areas classified as LI and HAI, and data related to
impacts in temperate climate water column and marine soils.
4.7.2.3 Land Use
Several studies were identified that directly related indicator organism occurrence and survival to
land use. Other studies that related watershed characteristics to indicator organism dynamics in a
less direct or circumstantial way are not reviewed here. In general, relating indicator organism
stocks and flows to watershed characteristics is difficult given the resolution of data usually
available. As noted by Kistemann et al. (2002), “for every situation in a watercourse, an
individual analysis has to be carried out, taking into account geographical conditions in
catchment areas as well as variability in precipitation and runoff.”
Mallin et al. (2001) analyzed several data sets within coastal North Carolina (estuaries and fresh
water) with the goal of assessing the impact of demographic, landscape, and meteorological
factors on aquatic fecal coliform bacteria pollution. On a watershed scale, an analysis of several
tidal creeks found strong correlations between mean estuarine fecal coliform bacterial counts and
watershed population, percent developed area, and especially with percent impervious surface
coverage. An analysis of rural watersheds in the coastal plain found that stream fecal coliform
counts and turbidity were both strongly correlated with rainfall in the previous 24 hours in
watersheds containing extensive industrial swine and poultry operations, as well as in watersheds
containing more traditional agriculture and cattle husbandry. In contrast to these findings, in
watersheds rich in swamp wetlands these relationships were not significant—even in watersheds
containing extensive animal production.
Ramirez et al. (2000) sampled at several marine water stations near La Parguera (southwest
Puerto Rico) because of the incidence of onshore development and stormwater runoff in their
drainages and the littoral and coastal systems at these locations. The parameters that were
measured suggest that there are effects from onshore development, with stations down-current
and those influenced by new development generally with higher concentrations of chemical and
physical constituents and higher enterococci counts. Subsequent water quality analysis showed
that areas adjacent to new development are significantly impacted.

U.S. Environmental Protection Agency
December 2010 54
Traister and Anisfeld (2007) conducted a study in a river basin and showed a strong relationship
to land use characteristics for fecal indicator bacteria, while also identifying patterns in fecal
indicator bacteria attributable to base flow versus storm flow.
Finally, Yamahara et al. (2007) found the presence of a putative bacterial source (i.e., river
discharges), the degree of wave shelter, and surrounding land use explained variation in both
enterococci and E. coli densities in beach sands along the California coast. Other parameters that
were found to influence sand E. coli density were moisture and organic carbon content.
4.8 Modeling
A range of researchers have begun to incorporate the array of literature values for fecal indicator
bacteria decay into context specific models at beaches to improve predictions of fecal indicator
bacteria concentrations given environmental conditions. An example of this approach is by Liu
et al (2006), where an assessment of processes relevant to fecal indicator bacteria fate and
transport were studied. The researchers incorporated inactivation rates factoring in sunlight,
sedimentation, and temperature, and loading from tributaries to describe dynamics of fecal
indicator bacteria. In another study, Boehm et al. 2005 constructed a modeling of enterococci
concentration in the surf zone at a marine beach incorporating transport via alongshore currents,
inactivation, and grazing. For this study, they relied on inactivation parameters from the
literature for relevant environments. The researchers also conducted specific laboratory
experiments to parameterize grazing rates. The researchers showed that dilution was the main
cause of loss of enterococci along the beach, while grazing and inactivation were less important.
Other recently available computer models for predicting surface water quality include HSPF
(Hydrologic Simulation Program-Fortran), WASP (Water quality Analysis Simulation Program),
Qual2K (river and stream water quality model) and EFDC (Environmental Fluid Dynamics
Code). These models simulate natural aquatic systems by including parameterization for
physical processes as dispersion, dilution, mixing. The models also often rely on first order
decay parameters derived from the literature, of particular high incorporation of first order decay
rates of fecal coliforms. Given the recent shift away from the fecal coliform group, and the
observation in recent years that first-order decay is rarely observed in ambient waters, it will be
necessary to conduct additional research to more fully understand the variability in the behavior
of fecal indicator bacteria, and also to incorporate more complex behavior into future computer
models. A recent paper by Liu et al. 2006, demonstrates an effort to model transport and
inactivation of E. coli and enterococci in Lake Michigan. These researchers successfully
incorporated loading data from tributaries, and inactivation as driven by sunlight, temperature
and sedimentation in a hydrodynamic modeling effort. There are a range of studies that have
been conducted additionally to try and develop more simplistic predictive and probabilistic
models (as opposed to mechanistic models of environmental processes, fate and transport). A
summary of those exercises is beyond the scope of this document. For example, Wong et al.
2009 conducted a study of Lake Michigan using a range of markers and fecal indicator bacteria
types to try and develop a relational model of viruses and indicators. These researchers and a
range of others have identified the lack of correlation between fecal indicator bacteria and viral
pathogens. This is an area of research that continues to confound our ability to measure
pathogens directly as a means for protection of public health risk.
U.S. Environmental Protection Agency
December 2010 55
4.9 Summary and Conclusions
Findings of studies assessing the impact of physical, chemical, and biological factors on the
extra-enteric extended occurrence, survival, fate, and growth of fecal indicator bacteria were
reviewed systematically in an attempt to (1) ascertain the factors most important in determining
indicator organism survival under ambient conditions; and (2) contrast the behavior of fecal
indicator bacteria in different waters (marine, estuarine, and fresh), climate zones (tropical,
subtropical, and temperate), and areas characterized by different levels of fecal impact (expected
or observed significant impacts from human sewage, expected or observed impacts from human
agriculture/animal operations, and expected or observed limited impacts from human sources).
The preceding literature review supports the following conclusions:
Fecal indicator organism die-off and decay in laboratory controlled experiments has been
generally well studied. However, it is clear that examination of single factors in
factorially designed, laboratory-based experiments is not the optimal way to assess the
behavior of fecal indicator bacteria under natural conditions. These controlled
experiments might be more relevant to wastewater and drinking water studies.
Given favorable environmental conditions, fecal indicator bacteria growth has been
shown to occur widely, except in the marine water column. This finding highlights the
importance of the appropriate selection of fecal indicator bacteria for specific
environments (i.e. the widespread use of enterococci in marine environments), and also
highlights the importance of local knowledge in interpretation of fecal indicator bacteria
data that could possibly be a direct result of reservoir populations.
Occurrence and persistence of fecal indicator bacteria in soils and sediments are
consistently greater than those observed in the water column, regardless of media,
climate, or water type. Important factors that enhanced survival of indicator organisms in
soils and sediments include the availability of nutrients and organic material, shelter from
sunlight, and the presence of conditions more favorable to the survival of the indicator
organisms than their predators. Enhanced persistence of fecal indicator bacteria in soils,
sand, and sediments is significant because fecal indicator bacteria stored or growing in
soils may be mobilized via washing of soils or resuspension. Thus, mobilized indicator
organisms represent a potentially important source of fecal indicator bacteria that is not
specific to a recent fecal contamination event, and may indicate decoupling of the fecal
indicator bacteria population from pathogens of concern.
Among intensive factors influencing the extra-enteric survival of fecal indicator bacteria,
the most important appear to be solar radiation, salinity, and temperature. Based on
findings in studies in which all three of these parameters were varied systematically, their
order of importance for fecal indicator bacteria in the water column appears to be (1)
solar radiation, (2) salinity, and (3) temperature. Synergistic effects of these three
parameters have been observed, with both temperature and salinity enhancing the effect
of sunlight. Among studies assessing the role of nutrient and organic material
availability, and particle-association of fecal indicator bacteria, the findings have been
much more variable and difficult to generalize.
Among extensive (context-specific) factors influencing the extra-enteric fate of fecal
indicator bacteria, the most important appear to be rainfall, antecedent rainfall, runoff,
U.S. Environmental Protection Agency
December 2010 56
and land use. Insufficient data are available to make general characterizations on the
influence of particular categories of land use on the fate of fecal indicator bacteria, except
to state that impervious surface causes input of fecal indicator bacteria into receiving
waters much more rapidly that non-impervious surface, reducing the potential for fecal
indicator bacteria degradation in the process. The impacts of both rainfall/runoff and
mixing on fecal indicator bacteria concentrations vary widely spatially and temporally
and impacts are realized at multiple temporal and spatial scales. There was no
consistency among studies on the time period over which wet weather contributes to
elevated water column indicator organism concentrations or the period or amount of
rainfall that was the best predictor of water column concentrations or water quality
standard exceedances. Therefore, it is vital for water quality agencies to conduct their
own assessments of the relationships between fecal indicator bacteria concentration and
rainfall amount, duration, and intensity.
Newly developed models that take into account more complex parameters are necessary o
capture the great range of variability observed in aquatic systems. Notably, models that
can incorporate a range of processes related to degradation/loss/survival/growth of fecal
indicator bacteria are likely to be superior to those that only incorporate first-order decay.
Data from the literature present several opportunities for further analysis, though data gaps must
be filled for the analyses to be conducted. Three potential topics for further research are
discussed below.
First, studies in which microbial kinetics (growth or decay) were explored under controlled
conditions could be used to compare dynamics in different climate zone-fecal impact
combinations. Appropriate statistical techniques for this analysis are analysis of covariance
(ANCOVA) and possibly nonlinear multiple regression. A potential impact of this study would
be testing of the hypothesis that a single set of environmental conditions at which survival or
growth of indicator organisms is optimal may be defined in terms of general (site-independent)
parameters, irrespective of climate zone and level or source of fecal pollution. Obstacles to this
analysis are lack of complete data on factors controlling microbial dynamics and lack of data for
many climate-zone-fecal impact combinations. As described above, observed decay is not well-
described by first-order models due to predation and competition, differences in inactivation rate
between individual and particle-associated organisms, and likely other factors. Data available in
the studies are not sufficient to allow quantification of these factors. Also, controlled
experiments have not been performed for many media-climate zone-fecal impact combinations,
particularly for waters in areas impacted by agriculture and in soils and sediments. An example
of a study similar to that proposed (but with many fewer factors explored) is presented by
Wuenschel et al. (2005).
Second, the relationship between rainfall and temporal variations in fecal indicator bacteria
concentrations could be quantified. The objective of such an analysis would be to relate timing
and magnitude of peak indicator organism occurrence to watershed characteristics. Current
research in the combined fields of hydrology and fecal indicator bacteria fate and transport will
improve our abilities to quantify loading throughout the extent of the hydrograph, and to relate
fecal indicator bacteria dynamics to antecedent rainfall, rainfall duration, and rainfall intensity.
Results from this analysis could be used to develop input to predictive models for forecasting

U.S. Environmental Protection Agency
December 2010 57
and “nowcasting” periods of exceedances of water quality standards (e.g., Frick et al. 2008).
Challenges to performing this analysis are the extreme spatial and temporal variability in
observed fecal indicator bacteria concentrations (Boehm et al. 2007), the small number of studies
available for analysis, and the general lack of complete data sets [for indicator organism counts]
for most sites (Frick et al. 2008). Examples of analyses that might be performed relating
watershed characteristics to indicator organism occurrence are refinements of regression
analyses, such as those advocated by Frick et al. (2008), or ANCOVA, as demonstrated by
Bishop et al. (2005) in their assessment of the impacts of agricultural best management practices
on stream water quality. Coulliette et al. (2009) used a space/time model of the Newport Estuary
as a means to integrate estuarine characteristics, tidal flushing, antecedent rainfall, and rainfall
duration and intensity. It may be possible in the future to combine space/time (geospatial)
models of fecal indicator bacteria concentration in large scale systems, with hydrodynamic
models.
Third, there is the potential for exploring the role that storage and growth in sands and sediments
and subsequent resuspension play in occurrence of indicator organisms in the water column. As
with indicator organisms in the water column, indicator concentrations in sediments and near-
shore soils can exhibit high variability. Among studies surveyed, the ratio of indicator organism
concentration in sediments or soils to those observed in the water column ranged from 0.076
(Brownell et al. 2007; fecal coliforms in marine environment during dry weather) to 23 (Bonilla
et al. 2007; enterococci in wet sands in the tidal zone in a marine environment) to 460 (Bonilla et
al. dry sands above the tidal zone in a marine environment). Study of these data could
potentially be used in predictive models relating contributions of indicator organisms from
sediments and soils to water column indicator concentrations under various rainfall and mixing
conditions.
Given new interest in molecular methods for quantification of fecal indicator bacteria and
pathogens it will be vital to understand the persistence of DNA/RNA signals in relation to
existing culture-based methods. This work has been initiated by a range of researchers and as
QPCR-based methods become more commonly implemented in water quality agencies, these
data will be important for interpretation of potential public health risk.
In summary, a systematic determination, through a formal meta-analysis, of the role, if any, that
climate zone, water types, and relative level of impact by fecal pollution play in the extra-enteric
fate of fecal indicator bacteria in recreational waters was hampered by the lack of data for many
climate-water type-impact level combinations. In general, the literature on this subject are
characterized by a high density of published studies conducted in specific regions (southern
California, the beaches of southern Lake Michigan and Lake Huron, beaches in the vicinity of
Sydney, Australia and in south Florida, and sands, soils, and surf-zone waters located near large
urban settings in Hawaii). There are relatively few studies in areas with limited fecal pollution
impacts, regions with high fecal pollution impacts from sources associated with confined animal
feeding operations, and river, stream or other inland water (particularly flowing water) settings.
In addition to data gaps related to regional and water quality differences, there are data gaps
related to the variability in fecal indicator bacteria at particular sites.
U.S. Environmental Protection Agency
December 2010 58
5. Alternative Indicators for Tropical and Subtropical Regions
Culturable E. coli and enterococci have several widely documented limitations as indicators of
waterborne pathogens. These traditional fecal indicator bacteria are often found in high
concentrations in animal feces, and the public health risk associated with contact with animal
feces is poorly understood. These traditional fecal indicator bacteria also survive and grow in
sand and other beach sediment (Solo-Gabriele et al. 2000, Desmarais et al. 2002, Byappanahalli
and Fujioka 2004), particularly in tropical climates. This survival and growth decouples the
fecal indicator bacteria from the fecal pollution they are intended to represent.
In response, a variety of alternative indicators and indicator approaches have been proposed and
assessed in recreational waters. Many of these are reviewed by Griffin et al. (2001), Fujioka
(2001), Savichtcheva and Okabe (2006), and more recently in Chapter 2 of EPA’s Report of the
Experts Scientific Workshop on Critical Research Needs for the Development of New or Revised
Recreational Water Quality Criteria (USEPA 2007a). Such alternative approaches can be
divided broadly into those that are microbiologically-based and those that involve the use of
chemical markers. Much of the research into alternative indicators of water quality—especially
for the use of chemicals—is tied closely to microbial (fecal) source tracking efforts (see Field
and Samadpour 2007). Not surprisingly, whether an approach is chemically- or
microbiologically-based, these alternative methods are often used in conjunction with traditional
fecal indicator bacteria to assess their validity and utility. Table 21 in Appendix C includes a
representative survey of studies (in ascending chronological order by alternative indicator used)
that have employed one or more of the alternative microbiological and chemical indicators to
assess microbial water quality in tropical, subtropical, and temperate regions reviewed in this
section.
Until the last decade or so, most alternative microbiological indicators that have been used to
assess recreational water quality criteria have been culturable bacteria. With the growing
development and use of molecular detection techniques (e.g., PCR), a broader variety of bacteria
and now viruses (especially viruses of bacteria or phages) have been identified as potential
alternatives to traditional fecal indicator bacteria. Notably, these techniques have also given rise
to the ability to identify and track the sources of microbial contamination using both traditional
indicator bacteria as well as many of the novel bacteria and viruses that are discussed
subsequently in this section. Given these technological advances, some researchers have
advocated approaches to detect so-called indicator bacteria (e.g., Aeromonas, Staphylococcus
aureus, Vibrio vulnificus) and viruses (e.g., enteroviruses) that are actually or potentially
pathogenic, especially to immunocompromised persons (Fujioka 2001, Griffin et al. 2001).
However, a discussion of the direct detection of frank and opportunistic pathogens to assess
microbial water quality is beyond the scope of this draft report.
5.1 Alternative Indicators of Fecal Contamination: Microbiological
5.1.1 Clostridium perfringens
Clostridium perfringens is a bacterial indicator that has been used to assess water quality for
decades (NRC 2004), but it is still considered widely to be an alternative indicator. C.
U.S. Environmental Protection Agency
December 2010 59
perfringens is a Gram-positive, anaerobic, rod-shaped bacterium. Oxygen tolerance of C.
perfringens has been poorly characterized in the environment: some studies show survival in
atmospheric oxygen for at least 72 hours (Rolfe et al. 1977), while others have observed cell
death after an hour in an aerobic environment (Trinh et al. 2000). However, C. perfringens
forms highly resistant endospores which limit inactivation due to physical stresses such as light,
heat, desiccation, and water and wastewater treatment processes.
Research demonstrating that C. perfringens is consistently present in sewage (Fujioka and
Shimuzura 1985) and that its density in river water is significantly correlated with the presence
of enteric pathogens (Payment and Franco 1993, Brookes et al. 2005) recommend it as an
indicator of recreational water quality. In fact, C. perfringens may be a better indicator than E.
coli and enterococci for tropical and subtropical waters because (1) it is more stable in
environmental waters than some waterborne pathogens (Medema et al. 1997); (2) its
concentration in tropical soil is orders of magnitude lower than fecal coliforms and enterococci
(Roll and Fujioka 1997); (3) it is found less often in wildlife and ruminant domestic animal feces
(Cox et al. 2005); (4) it has been used successfully to monitor sewage contaminated streams and
ocean water, particularly in Hawaii (Fujioka 2001, Fujioka and Shizumura 1985); and (5) it is
less susceptible to inactivation and degradation than fecal coliforms and enterococci, meaning
that it is offers a conservative indication of sewage (Davies et al. 1995).
Unfortunately, this extended persistence may simultaneously limit the usefulness of C.
perfringens as an alternative indicator. Because spores can survive for years (Hill et al. 1996),
their detection in environmental media can be difficult to interpret in the absence of a known
source of fecal contamination. The presence of spores could indicate normal microflora in an
environment, represent a “historical” (nonrecent) fecal contamination event, or reflect recent
fecal contamination that is relevant to public health (Mueller-Spitz et al. 2010). Persistence may
be limited in the tropics relative to temperate latitudes because rates of C. perfringens
degradation correlate significantly with exposure to radiant energy (Burkhardt et al. 2000).
However, this correlation is very weak, and the use of C. perfringens as a fecal indicator
organism remains equivocal in light of uncertainties associated with determining the age of
spores (NRC 2004). However, researchers have reported the successful use of C. perfringens to
assess microbial water quality. For example, Ferguson et al. (1996) reported C. perfringens to be
the most useful indicator of fecal pollution in water and sediment in an Australian estuarine
system. Fujioka (2001) concluded that C. perfringens is a conservative indicator that may be
used to determine whether recreational water is contaminated by fecal pollution. That is, “If
monitoring results show no or low levels of C. perfringens, one can be assured that the quality of
that recreational water is high (Fujioka, 2001).”
5.1.2 Bacteroides
Bacteroides, Gram-negative anaerobes, have also long been suggested as alternative indicators to
E. coli and enterococci (Fiksdal et al. 1985). In sewage samples, Bacteroides and fecal coliform
concentrations correlate strongly (Dick and Field 2004), and because Bacteroides are present at
more than 1,000-fold-higher densities than fecal coliforms (Fiksdal et al. 1985), Bacteroides
could serve as more sensitive indicators of human fecal contamination than fecal coliform
bacteria from a purely numerical standpoint. In fact, in a wide range of surface water samples,
U.S. Environmental Protection Agency
December 2010 60
Bacteroides concentrations were more predictive of the presence of bacterial pathogens than
traditional indicators (Savichtcheva et al. 2007).
Bacteroides have also been touted as good alternative indicators because they are strict
anaerobes and are not expected to survive for extended periods of time under aerobic conditions
(Rolfe et al. 1977). Indeed, Bacteroides have been shown to lose viability in less than a day after
exposure to environmental water (Rolfe et al. 1977, Kreader 1998). There has been some
concern that the DNA markers used to measure Bacteroides may persist long after cell death, but
at tropical water temperatures the DNA signal rapidly decays within 1 to 2 days (Okabe and
Shimazu 2007, Walters et al. 2009). This persistence is similar to that of infective enterovirus
(Walters et al. 2009).
Recent studies have demonstrated host specificity in certain 16S rRNA genes (Bernhard and
Field 2000); therefore, Bacteroides gene markers may be useful in distinguishing human from
animal fecal pollution. Universal, bovine-, swine-, dog-, and human-specific Bacteroides assays
have been developed (Carson et al. 2005, Seurinck et al. 2005, Layton et al. 2006, Kildare et al.
2007, Okabe et al. 2007, Stricker et al. 2008, Yampara-Iquise et al. 2008), but some cross-
reactivity between sources has been observed for nearly all of these assays. The bovine assays
appear to be the most specific, probably because bovine Bacteroides cluster much more tightly
than those from other hosts (Layton et al. 2006). Nevertheless, the source specificity of
Bacteroides assays is often greater than 90% (Shanks et al. 2010), and human-specific assays
have been used successfully in tropical environments to distinguish between human and non-
human fecal pollution (Betancourt and Fujioka 2006, Bonkosky et al. 2009).
5.1.3 Bifidobacteria
For many of the same reasons as Bacteroides, Bifidobacteria have been recommended as
alternative indicators. Bifidobacteria are also strict anaerobes and comprise a significant fraction
of human-intestinal bacteria (Resnick and Levin 1981). Like Bacteroides, Bifidobacteria
persistence is limited in environmental waters particularly when temperatures are warm (Resnick
and Levin 1981, Rhodes and Kator 1999, Bonjoch et al. 2009, Ottoson 2009). Also similar to
Bacteroides, many “source-specific” Bifidobacteria assays have been developed (Bernhard and
Field 2000, Nebra et al. 2003, Bonjoch et al. 2004, King et al. 2007), though many so-called
source-specific species have actually been shown to be quite cosmopolitan (Lamendella et al.
2008).
Due to early difficulties in accurate detection and enumeration by both culture and molecular
methods (Carrillo et al. 1985, Wang et al. 1996, Bernhard and Field 2000), Bifidobacteria have
received much less attention than Bacteroides in the literature. Nevertheless, Bifidobacteria
have been used in tropical streams and temperate estuaries to distinguish human from animal
fecal pollution and recent from residual pollution (Mara and Oragui1985, Carrillo et al. 1985,
Morrison et al. 2008, Mushi et al. 2010).
5.1.4 Coliphages

U.S. Environmental Protection Agency
December 2010 61
Bacteriophages (or simply phages) are nonpathogenic viruses that infect bacteria, and
bacteriophages that infect E. coli or other closely related coliforms are called coliphages. There
is a relatively extensive history of research documenting the possible uses of phages as indicators
of fecal contamination—especially indicators of waterborne viruses (e.g. Hilton and Stotzky
1973, Kott et al. 1974, Stetler 1984, Havelaar et al. 1993). Taxonomically, coliphages are very
diverse and include a total of six virus families: three families of double-stranded DNA viruses,
two families of single-stranded DNA viruses, and one family of single-stranded RNA viruses
(USEPA 2007a). Coliphages that infect via the host cell wall of E. coli are commonly called
somatic coliphages. Male-specific coliphages (also called F+ coliphages) infect E. coli by
attaching to the F-pili, hair-like appendages protruding from the host. Although somatic phages
have been explored as alternative fecal indicators (Palmateer et al. 1991; Brion et al. 2002), little
is known about the specificity of their occurrence in human or animal feces (USEPA 2007a).
Furthermore, a recent nonpoint source epidemiological study in California found that somatic
coliphages were not predictive of human health risks from bathing in marine recreational water
(Colford et al. 2007). As a result most research using coliphages as alternative indicators has
focused on male-specific coliphages.
Like anaerobic fecal bacteria, male-specific coliphages have been recommended as alternative
indicators of fecal pollution because of their prevalence and ready detection in sewage (Calci et
al. 1998) and unlikely replication outside the enteric environment even in tropical waters
(Hernandez-Delgado and Toranzos 1995, Jofre 2009). Male-specific coliphages are expected to
be particularly good indicators of pathogenic enteric viruses because of their similar size, shape,
and stability in environmental- and waste-water (Stetler 1984, Havelaar et al. 1993). Indeed,
concentrations of male-specific coliphage are significantly correlated with concentrations of
enteric viruses in surface water at both temperate and tropical latitudes (Havelaar et al. 1993,
Ogorzaly et al. 2009, Espinosa et al. 2009) and health risk associated with bathing in recreational
water (Colford et al. 2007). In persistence studies coliphage has had similar or longer survival
than many enteroviruses and noroviruses (Nasser and Oman 1999, Allwood et al. 2003, Love et
al. 2010). Coliphage persistence may be slightly shortened at tropical latitudes because
accumulated light energy speeds inactivation (Burkhardt et al. 2000), but because the
mechanisms of sunlight inactivation for coliphages and enteric viruses are similar (Fujioka and
Yoneyama 2002), this shortened persistence should not affect the relationship between indicator
and pathogens. Little is known about relative rates of inactivation of enteric viruses and
coliphage in turbid water or sediments, where the viruses are relatively protected from sunlight.
Skraber et al. (2009) demonstrated that coliphage can persist for longer than one month in
freshwater sediments. As a result, coliphages can be susceptible to the same weakness as C.
perfringens—where there is resuspension of sediment there can be difficulty in distinguishing
between recent and older contamination.
Nevertheless, male-specific coliphage may be useful in distinguishing between sewage and
animal waste. Of the four coliphage serogroups, two are usually found in animal waste, while
the other two are primarily found in human feces (Hsu et al. 1995, Griffin et al. 2000, Cole et al.
2003, Blanch et al. 2006). These serogroups have been used to confirm putative animal and
human waste in both tropical and temperate environmental waters (Griffin et al. 2000, Brion et
al. 2002, Luther and Fujioka 2004, Stewart-Pullaro et al. 2006, Griffith et al. 2009). However,
the relationship between subgroups is complicated by their differential persistence, and some
U.S. Environmental Protection Agency
December 2010 62
researchers discourage the sole use of male-specific coliphage genotyping for source tracking
(Muniesa et al. 2009).
5.1.5 Bacteroides Phages
Bacteroides phages, or viruses that specifically infect Bacteroides spp., have been used as
indicators of fecal contamination of water and sediment in Spain (Lucena et al. 1996, Tartera et
al. 1989), the United States (Chung and Sobsey 1993, McLaughlin and Rose 2006) and more
recently in an inland river in the United Kingdom (Ebdon et al. 2007). Bacteroides phages are
proposed as alternative indicators for many of the same reasons as coliphages: (1) similar size,
shape, and transport as enteric viruses; (2) apparent source specificity (Tartera and Jofre 1987,
Ebdon et al. 2007); (3) higher concentrations than enteric viruses in sewage (Tartera and Jofre
1987); (4) similar or longer survival than enteric viruses and sediment and seawater (Chung and
Sobsey 1993, Lucena et al. 2003, Mocè-Llivina et al. 2005); and 5) inability to replicate outside
the intestinal tract (Tartera et al. 1989). However, the utility of these phages as indicators is
currently limited because the diversity of phages, including their specificity for human host
strains, remains poorly characterized over a range of locations and quantification methodologies
are not fully developed (USEPA 2007).
5.2 Alternative Indicators of Fecal Contamination: Chemical Biomarkers
There are a large number of organic compounds that are specific primarily to human fecal
contamination, including chemical indicators that can be either natural products found in
human feces (e.g., fecal steroids) or synthetic chemicals found in products that are specific to
household and community waste streams (NRC 2004). However, the cost and expertise required
to analyze chemical biomarkers may limit their utility for routine water quality monitoring, and
more research is needed gain a better understanding of the transport, transformations, and
persistence of these compounds under various environmental conditions (NRC 2004).
Additionally, most chemical biomarkers have only been used for source-tracking. Few have
been associated with traditional bacterial indicators, let alone pathogens. Epidemiology studies
relating chemical biomarker concentrations with health risk will be required before their
application as indicators.
5.2.1 Fecal Steroids
Fecal steroids (i.e., sterols, stanols, stanones) have been used somewhat frequently for
differentiating between human and nonhuman sources of fecal contamination in the aquatic
environment (e.g., Nichols et al. 1993, Noblet et al. 2004, Tyagi et al. 2007, Wang et al. 2010).
The steroid used most frequently in such studies is coprostanol, which is produced by catabolism
of cholesterol in the intestinal tract of higher vertebrates and is the most abundant (~60% of the
total sterols) in human feces (Leeming et al. 1996). However, differences in dietary sterol
intake, metabolic production, and gut microbiota yield differences in sterol profiles between
humans and animals (Leeming et al. 1996), and as a result, most recent studies have used suites
of steroids to distinguish between fecal sources. Additionally, the ratio of epicocoprostanol and
coprostanol has been successfully used to determine whether or not sewage has been treated
before it reaches receiving waters (Froehner et al. 2009).

U.S. Environmental Protection Agency
December 2010 63
Steroid concentrations are significantly correlated with E. coli concentrations in temperate and
tropical Asian marine water, though this correlation appears to be seasonal and dependent upon
climatic conditions such as rainfall (Isobe et al. 2004). Although fecal sterols should be
microbially degraded in the aerobic water column in 1 to 2 weeks, they may persist on the scale
of months when deposited in the tropical and sub-tropical sediments (Bartlett 1987, Pratt et al.
2008). Indeed, bacterial indicator degradation is rapid when compared with steroid degradation
in the sediment (Pratt et al. 2008). In situations with likely resuspension of sediment, fecal
steroids may overestimate the freshness of fecal contamination. For this reason, many
researchers have not embraced the measurement of steroids alone as indicators for fecal
contamination, preferring to use this in conjunction with microbial indicators (USEPA 2007).
However, the combined use of fecal steroids and E. coli has allowed fecal source identification
that was not possible with the use of fecal indicator bacteria alone (Noblet et al. 2004).
5.2.2 Optical Brighteners
Optical brighteners may be inexpensive and potentially sensitive alternative chemical indicators,
which are detected by fluorometry. In the United States, optical brighteners are almost always
added to laundry detergents to help compensate for undesirable yellowing in clothes (Poiger et
al. 1998). Because household plumbing systems typically mix effluent from washing machines
with wastewater from toilets, the detection of optical brighteners is associated with human
sewage (Poiger et al. 1998, Boving et al. 2004).
In order to use optical brighteners as an alternative indicator of human fecal contamination, they
must be combined with use of fecal indicator bacteria counts or other microbial source tracking
methods (McDonald et al. 2006). Although researchers have documented instances of strong
fluorescent signal and high numbers of fecal enterococci (McDonald et al. 2006), cases of no
correlation between fluorometry and fecal bacteria counts have also been reported (Wolfe et al.
1995). Two key confounding factors have been interference due to the fluorescence of organic
matter (Boving et al. 2004) and photodegradation of optical brighteners (Kramer et al. 1996).
Though steps can be taken to account for the presence of fluorescing organic matter (Hartel et al.
2007, Cao et al. 2009), rapid photodegradation in sunlight may limit the utility of optical
brighteners in tropical settings, where high UV indexes may decrease optical brightener
detection.
5.2.3 Pharmaceuticals and Personal Care Products
More than 6 million pharmaceutical and personal care products (PPCPs) are commercially
available worldwide, and many have been detected in streams across the United States (Koplin et
al. 2002, Daughton 2004). Though their environmental release during manufacture, processing,
and distribution is neglible, many are released in sewage effluent (Daughton and Ternes 1999,
Ellis 2006), and their presence in surface waters is taken to be indicative of sewage
contamination (Yu and Chu 2009). As a result, PPCPs have garnered a great deal of attention
recently as potential indicators of human-specific fecal contamination, including diclofenac,
urobiline, caffeine, and triclosan. Because PPCPs represent a broad spectrum of organic
contaminants with varying susceptibilities to biodegradation, photodegradation, and wastewater
U.S. Environmental Protection Agency
December 2010 64
treatment, it is difficult to make generalized statements about their potential persistence in
surface waters (Buser et al. 1998, Daughton and Ternes 1999, Andreozzi et al. 2003, Zhang et al.
2008, Kim et al. 2009, Benotti and Brownawell 2009, Musolff et al. 2009). Furthermore, few
compounds have been correlated with traditional indicators (Peeler et al. 2006, Young et al.
2008, Haack et al. 2009, Knee et al. 2010). Much more work is needed on persistence of specific
compounds and their relationships with traditional indicators and pathogens before a PPCP will
be useful as an indicator.
5.3 Summary
Researchers have been documenting issues and limitations associated with the use of traditional
indicator bacteria for assessing the presence of fecal contamination in recreational waters for
decades, and many researchers have questioned the validity of continued reliance on the periodic
measurement of fecal indicator bacteria in the water column as the sole means of determining the
microbial quality of ambient waters.
To help address and potentially resolve these limitations, researchers have evaluated and
reported on the use of a wide variety of alternative (and increasingly sophisticated)
microbiological and chemical indicators of fecal contamination in ambient waters in a variety of
regions. In many cases, these alternative indicators and indicator approaches have focused on
microbial source tracking and related research. As a result, many researchers suggest a tiered
assessment of water quality, in which traditional fecal indicator bacteria are initially used to
identify potential contamination and alternative indicators are used in subsequent steps to
determine the source and age of the contamination. Some general approaches have been
described in the literature that rely on a set or toolbox of indicators—including alternative
indicator and indicator approaches (e.g., NRC, 2004)—to assess the microbial quality of ambient
waters. Confidence in the use of alternative indicators to supplement current indicators could
increase if EPA and others conduct health studies that demonstrate a statistically valid
correlation between the presence of one or more alternative indicators with an increased
incidence of illness in exposed persons, thus ensuring that the use of a new indicator is based on
health risk. Also, although molecular-based methods show promise for identifying human-
specific indicators and pathogens, the methods currently show wide variability both within a
single laboratory and between laboratories. Continued work is needed to validate and
standardize these methods.

U.S. Environmental Protection Agency
December 2010 65
6. References Abdelzaher A., Solo-Gabriele H., Wright M., and C. Palmer. 2008. Simultaneous concentration of bacteria and
viruses from marine waters using a layered membrane system. Journal of Environmental Quality 37:1648-1655.
Ackerman, D. and S.B. Weisberg. 2003. Relationship between rainfall and beach bacterial concentration on Santa
Monica Bay beaches. Journal of Water and Health 1:85-89.
Alkan, U., Elliott, D.J., and L.M. Evison. 1995. Survival of enteric bacteria in relation to simulated solar radiation
and other environmental factors in marine waters. Water Research 29(9):2071-2081.
Allwood, P. B., Malik, Y. S., Hedberg, C. W., and S.M. Goyal. 2003. Survival of f-specific rna coliphage, feline
calicivirus, and Escherichia coli in water: a comparative study. Applied and Environmental Microbiology 69:5707-
5710.
Alm, E.W., Burke, J., and A. Spain. 2003. Fecal indicator bacteria are abundant in wet sand at freshwater beaches.
Water Research 37:3978-3982.
Alm, E.W., Burke, J., and E. Hagan. 2006. Persistence and potential growth of the fecal indicator bacteria,
Escherichia coli, in shoreline sand at Lake Huron. Journal of Great Lakes Research 32(2):401-405.
An, Y.J., Kampbell, D.H., and G.P. Breindenbach. 2002. Escherichia coli and total coliforms in water and sediments
at lake marinas. Environmental Pollution 120:771-778.
Anderson, K.L., Whitlock, J.E., and V.J. Harwood. 2005. Persistence and differential survival of fecal indicator
bacteria in subtropical waters and sediments. Applied and Environmental Microbiology 71(6):3041-3048.
Andreozzi, R. M. R. and P. Nicklas. 2003. Pharmaceuticals in STP effluents and their solar photodegradation in
aquatic environment. Chemosphere 50:1319-1330.
Ashbolt, N.J., Dorsch, M.R., Cox, P.T., and B. Banens. 1997. Blooming E. coli, what do they mean? In Coliforms
and E. coli: Problem or Solution? The Royal Society of Chemistry, Cambridge, UK.
Ashbolt, N.J. and M. Bruno. 2003. Application and refinement of the WHO risk framework for recreational waters
in Sydney, Australia. Journal of Water and Health 1(3):125-131.
Aulicino, F.A., Orsini, I.P., Carere, M., and A. Mastrantonio. 2001. Bacteriological and virological quality of
seawater bathing areas along the Tyrrhenian coast. Journal of Environmental Health Research 11:5-11.
Badgley, B.D., Nayak, B.S., and V.J. Harwood. 2010. The importance of sediment and submerged aquatic
vegetation as potential habitats for persistent strains of enterococci in a subtropical watershed. Water Research
44:5857-5866.
Balazs, G.H., Fujioka, R., and C. Fujioka. 1993. Marine turtle faeces on Hawaiian beaches. Marine Pollution
Bulletin 26(7):392-394.
Bartlett, P. D. 1987. Degradation of coprostanol in an experimental system. Marine Pollution Bulletin 18:27-29.
Benotti, M. and B. Brownawell. 2009. Microbial degradation of pharmaceuticals in estuarine and coastal seawater.
Environmental Pollution 157:994-1002.
Bernhard, A.E. and K.G. Field. 2000. Identification of nonpoint sources of fecal pollution in coastal waters by using
host-specific 16S ribosomal DNA markers from fecal anaerobes. Applied and Environmental Microbiology
66(4):1587-1594.

U.S. Environmental Protection Agency
December 2010 66
Bernhard, A.E., Goyard, T., Simonich, M.T., and K.G. Field. 2003. Application of a rapid method for identifying
fecal pollution sources in a multi-use estuary. Water Research 37:909-913.
Betancourt, W.Q and R.S. Fujioka. 2006. Bacteroides spp. as reliable marker of sewage contamination in Hawaii’s
environmental waters using molecular techniques. Water Science Technology 54(3):101-107.
Bishop, P.L., Hively, W.D., Stedinger, J.R., Raffery, M.R., Lojpersberger, J.L., and J.A. Bloomfield. 2005.
Multivariate analysis of paired watershed data to evaluate agricultural best management practice effects on stream
water phosphorous. Journal of Environmental Quality 34:1087-1101.
Blanch, A.R., Belanche-Muñoz, L., Bonjoch, X., Ebdon, J., Gantzer, C., Lucena, F., Ottoson, J., Kourtis, C.,
Iversen, A., Kühn, I., Mocé, L., Muniesa, M., Schwartzbrod, J., Skraber, S., Papageorgiou, G.T., Taylor, H., Wallis,
J., and J. Jofre. 2006. Integrated analysis of established and novel microbial and chemical methods for microbial
source tracking. Applied and Environmental Microbiology 72:5915-5926.
Boczek, L.A., Rice, E.W., Johnston, B., and J.R. Johnson. 2007. Occurrence of antibiotic-resistant uropathogenic
Escherichia coli clonal group A in wastewater effluents. Applied and Environmental Microbiology 73:4180-4184.
Boehm, A.B., Grant, S.B., Kim, J.H., Mowbray, S.L., McGee, C.D., Clark, C.D., Foley, D.M., and D.E. Wellman.
2002. Decadal and shorter period variability and surf zone water quality at Huntington Beach, California.
Environmental Science and Technology 36:3885-3892.
Boehm, A.B., Fuhrman, J.A., Morse, R.D., and S.B. Grant. 2003. Tiered approach for identification of a human
fecal pollution source at a recreational beach: case study at Avalon Bay, Catalina Island, California. Environmental
Science Technology 37:673-680.
Boehm, A. B. 2007. Enterococci concentrations in diverse coastal environments exhibit extreme variability.
Environmental Science and Technology 41 (24):8227-8232.
Boehm, A., Griffith, J., McGee, C., Edge, T., Solo-Gabriele, H., Whitman, R., Cao, Y., Getrich, M., Jay, J.,
Ferguson, D., Goodwin, K., Lee, C., Madison, M., and S. Weisberg. 2009. Faecal indicator bacteria enumeration in
beach sand: a comparison study of extraction methods in medium to coarse sands. Journal of Applied Microbiology
107(5):1740-1750.
Bolin, C., Brown, C., and J. Rose. 2004. Emerging zoonotic diseases and water. Waterborne Zoonoses
Identification, Causes and Control. World Health Organization. Waterborne Zoonoses: Identification, Causes and
Control. Edited by J.A. Cotruvo, A. Dufour, G. Rees, J. Bartram, R. Carr, D.O. Cliver, G.F. Craun, R. Fayer,
and V.P.J. Gannon. IWA Publishing, London, UK.
Bonilla, T.D., Nowosielski, K., Esiobu, N., McCorquodale, D.S., and A. Rogerson. 2006. Species assemblages of
Enterococcus indicate sources of fecal bacteria at a south Florida recreational beach. Marine Pollution Bulletin
52:800-815.
Bonilla, T.D., Nowosielski, K., Cuvelier, M., Hartz, A., Green, M., Esiobu, N., McCorquodale, D.S., and J.M.
Fleisher. 2007. Prevalence and distribution of fecal indicator organisms in South Florida beach sand and preliminary
assessment of health effects associated with beach sand exposure. Marine Pollution Bulletin 54:1472-1482.
Bonjoch, X., Balleste, E., and A.R. Blanch. 2004. Multiplex PCR with 16S rRNA gene-targeted primers of
Bifidobacterium spp. to identify sources of fecal pollution. Applied and Environmental Microbiology 70:3171-3175.
Bonjoch, X., Lucena, F., and A.R. Blanch. 2009. The persistence of bifidobacteria populations in a river measured
by molecular and culture techniques. Journal of Applied Microbiology 107:1178-1185.
Bonkosky, M., Hernandez-Delgado, E. A., Sandoz, B., Robledo, I.E., Norat-Ramirez, J., and H. Mattei. 2009.
Detection of spatial fluctuations of non-point source fecal pollution in coral reef surrounding waters in southwestern
Puerto Rico using PCR-based assays. Marine Pollution Bulletin 58:45-54.

U.S. Environmental Protection Agency
December 2010 67
Bordalo, A.A., Onrassami, R., and C. Dechsakulwatana. 2002. Survival of faecal indicator bacteria in tropical
estuarine waters (Bangpakong River, Thailand). Journal of Applied Microbiology 93:864-871.
Borrego, J.J., Cornax, R., Moringo, M.A., Martinez-Manzanares, E., and P. Romero. 1990. Coliphages as an
indicator of faecal pollution in water. Their survival and productive infectivity in natural aquatic environments.
Water Research 24(1):111-116.
Boving, T., Meritt, D., J. and Boothroyd. 2004. Fingerprinting sources of bacterial input into small residential
watersheds: fate of fluorescent whitening agents. Environmental Geology 46:229-232.
Bower, P.A., Scopel, C.O., Jensen, E.T., Depas, M.M., and S.L. McLellan. 2005. Detection of genetic markers of
fecal indicator bacteria in Lake Michigan and determination of their relationship to Escherichia coli densities using
standard microbiological methods. Applied and Environmental Microbiology 71(12):8305-8313.
Brion, G.M., Meschke, J.S., and M.D. Sobsey. 2002. F-specific RNA coliphages: occurrence, types, and survival in
natural waters. Water Research 36:2419-2425.
Brookes, J.D., Hipsey, M.R., Burch, M.D., Regel, R.H., Linden, L.G., Ferguson, C.M., and J.P. Antenucci. 2005.
Relative value of surrogate indicators for detecting pathogens in lakes and reservoirs. Environmental Science and
Technology 39:8614-8621.
Brownell, M.J., Harwood, V.J., Kurz, R.C., McQuaig, S.M., Lubasik, J., and T.M. Scott. 2007. Confirmation of
putative stormwater impact on water quality at a Florida beach by microbial source tracking methods and structure
of indicator organism populations. Water Research 41:3747-3757.
Burkhardt, W., Calci, K., Watkins, W., Rippey, S., and S. Chirtel. 2000. Inactivation of indicator microorganisms in
estuarine waters. Water Research 34:2207-2214.
Buser, H., Poiger, T., and M.D. Muller. 1998. Occurrence and fate of the pharmaceutical drug diclofenac in surface
waters: rapid photodegradation in a lake. Environmental Science and Technology 32: 3449-3456.
Byamukama, D., Mach, R.L., Kansiime, F., Manafi, M., and A.H. Farnleitner. 2005. Discrimination efficacy of fecal
pollution detection in different aquatic habitats of a high-altitude tropical country, using presumptive coliforms,
Escherichia coli, and Clostridium perfringens spores. Applied and Environmental Microbiology 71(1):65-71.
Byappanahalli, M.N. and R.S. Fujioka. 1998. Evidence that tropical soil environment can support the growth of
Escherichia coli. Water Science and Technology 38:171-174.
Byappanahalli, M.N., Shively, D.A., Nevers, M.B., Sadowsky, M.J., and R.L. Whitman. 2003. Growth and survival
of Escherichia coli and enterococci populations in the macro-alga Cladophora (Chlorophyta). FEMS Microbiology
Ecology 46:203-211.
Byappanahalli, M. and R. Fujioka. 2004. Indigenous soil bacteria and low moisture may limit but allow faecal
bacteria to multiply and become a minor population in tropical soils. Water Science and Technology 50:27-32.
Byappanahalli, M.N., Whitman, R.L., Shively, D.A., Sadowsky, M.J., and S. Ishii. 2006. Population structure,
persistence, and seasonality of autochthonous Escherichia coli in temperate, coastal forest soil from a Great Lakes
watershed. Environmental Microbiology 8(3):504-513.
Byappanahalli, M.N., Whitman, R.L., Shively, D.A., Ferguson, J., Ishii, S., and M.J. Sadowsky. 2007. Population
structure of Cladophora-borne Escherichia coli in nearshore water of Lake Michigan. Water Research 41:3649-
3654.
CDC (U.S. Centers for Disease Control and Prevention). 2007. Cryptosporidiosis outbreaks associated with
recreational water use - five states, 2006. Morbidity and Mortality Weekly Report 56:3.

U.S. Environmental Protection Agency
December 2010 68
Cabelli, V. J., Dufour, A.P., McCabe, L.J., and M.A. Levin. 1982. Swimming-associated gastroenteritis and water
quality. American Journal of Epidemiology 115:606-616.
Cabelli, V. J., Dufour, A.P., McCabe, L.J., and M.A. Levin. 1983. A marine recreational water quality criterion
consistent with indicator concepts and risk analysis. Journal of the Water Pollution Control Federation 55:1306-
1313.
Calci, K. R., Burkhardt, W., Watkins, D.W., and S.R. Rippey. 1998. Occurrence of male-specific bacteriophage in
feral and domestic animal wastes, human feces, and human-associated wastewaters. Applied and Environmental
Microbiology 64:5027-5029.
Calderon, R.L., Mood, E.W., and A.P. Dufour. 1991. Health effects of swimmers and nonpoint sources of
contaminated water. International Journal of Environmental Health Research 1:21-31.
Cao, Y., Griffith, J. F., and S.B. Weisberg. 2009. Evaluation of optical brightener photodecay characteristics for
detection of human fecal contamination. Water Research 43:2273-2279.
Carr, M.R., Wang, S. Y., McLean, T.I., Flood, C.J., and R.D. Ellender. 2010. Salmonella rarely detected in
Mississippi coastal waters and sediment. Journal of Applied Microbiology 109:2191-2199.
Carrillo, M., Estrada, E., and T.C. Hazen. 1985. Survival and enumeration of the fecal indicators Bifidobacterium
adolescentis and Escherichia coli in a tropical rain forest watershed. Applied and Environmental Microbiology
50(2):468-476.
Carson, C. A., Christiansen, J.M., Yamara-Iquise, H., Benson, V.W., Baffaut, C., Davis, J.V., Broz, Robert R.,
Kurtz, W.B., Rogers, W.M., and W.H. Fales. 2005. Specificity of a Bacteroides thetaiotaomicron marker for human
feces. Applied and Environmental Microbiology 71:4945-4949.
Characklis, G.W., Mackenzie, M.J., Simmons, O.D. III, Likirdopulos, C.A., Krometis, L.H., and M.D. Sobsey.
2005. Microbial partitioning to settleable particles in stormwater. Water Research 39:1773-1782.
Chung, H. and M.D. Sobsey. 1993. Comparative survival of indicator viruses and enteric viruses in seawater and
sediment. Water Science and Technology 27:425-528.
Cole, D., Long, S. C., and M.D. Sobsey. 2003. Evaluation of F+ RNA and DNA coliphages as source-specific
indicators of fecal contamination in surface waters. Applied and Environmental Microbiology 69:6507-6514.
Colford, Jr., J.M., Wade, T.M., Schiff, K.C., Wright, C.C., Griffith, J.F., Sandhu, S.K., Burns, S., Sobsey, M.,
Lovelace, G., and S.B. Weisberg. 2007. Water quality indicators and the risk of illness at beaches with nonpoint
sources of fecal contamination. Epidemiology 18(1):27-35.
Cox, P., Griffith, M., Angles, M., Deere, D., and C. Ferguson. 2005. Concentrations of pathogens and indicators in
animal feces in the Sydney watershed. Applied and Environmental Microbiology 71:5929-5934.
Coulliette, A. D. and R.T. Noble. 2008. Impacts of rainfall on the water quality of the Newport River estuary
(Eastern North Carolina, USA). Journal of Water and Health. 6(4):473-482.
Coulliette, A. D., Money, E. S., Serre, M. L., and R.T. Noble. 2009. Space/time analysis of fecal pollution and
rainfall in an eastern North carolina estuary. Environmental Science and Technology. 43(10):3728–3735.
Craig, D.L., Fallowfield, H.J., and N.J. Cromar. 2001. Comparison of decay rates of faecal indicator organisms in
recreational coastal water and sediment. In Proceedings of the International Water Association, 2nd
World Water
Congress, Berlin, Germany.
U.S. Environmental Protection Agency
December 2010 69
Craig, D.L., Fallowfield, H.J., and N.J. Cromar. 2002. Enumeration of faecal coliforms from recreational coastal
sites: evaluation of techniques for the separation of bacteria from sediments. Journal of Applied Microbiology
93:557-565.
Craig, D.L., Fallowfield, H.J., and N.J. Cromar. 2003. Effectiveness of guideline faecal indicator organism values in
estimation of exposure risk at recreational coastal sites. Water Science and Technology 47(3):191-198.
Craig, D.L., Fallowfield, H.J., and N.J. Cromar. 2004. Use of macrocosms to determine persistence of Escherichia
coli in recreational coastal water and sediment and validation with in situ measurements. Journal of Applied
Microbiology 96:922-930.
Craun, G.F., Calderon, R.L., and M.F. Craun.2004. Chapter 8: Waterborne outbreaks caused by zoonotic pathogens
in the USA pp. 120-126 Waterborne Zoonoses Identification, Causes, and Control. Edited by J.A. Cotruvo, A.
Dufour, G. Rees, J. Bartram, R. Carr, D.O. Cliver, G.F. Craun, R. Fayer and V.P.J. Gannon. Published on behalf of
the World Health Organization by IWA Publishing, Alliance House, 12 Caxton Street, London SW1H 0QS, UK
Curriero, F.C., Jonanthan, A.P., Rose, J.B., and S. Lele. 2001. The association between extreme precipitation and
waterborne disease outbreaks in the United States, 1948-1994. American Journal of Public Health 91(8):1194-1199.
Daughton, C. G. and T.A. Ternes. 1999. Pharmaceuticals and personal care products in the environment: agents of
subtle change? Environmental Health Perspectives 107:907-938.
Daughton, C. G. 2004. Ground Water Recharge and Chemical Contaminants: Challenges in Communication the
Connections and Collisions of Two Disparate Worlds. Ground Water Monitoring and Remediation 24:127-138.
Davies, C. and L.M. Evison. 1991. Sunlight and the survival of enteric bacteria in natural waters. Journal of Applied
Bacteriology 70:265-274.
Davies, C.M., Long, J.A.H., Donald, M., and N.J. Ashbolt. 1995. Survival of fecal microorganisms in marine and
freshwater sediments. Applied and Environmental Microbiology, 61(5):1888-1896.
Davies, C., Kaucner, C., Altavilla, N., Ashbolt, N., Ferguson, C., Krogh, M., Hijnen, W., Medema, G., and D.
Deere. 2005. Fate and transport of surface water pathogens in watersheds. American Water Works Association
Research Foundation, Denver, CO.
Davis, K., Anderson, M.A., and M.V. Yates. 2005. Distribution of indicator bacteria in Canyon Lake, California.
Water Research 39:1277-1288.
Decho, A. 2000. Microbial biofilms in intertidal systems: an overview. Continental Shelf Research 20:1257-1273.
Dick, L.K. and K.G. Field. 2004. Rapid Estimation of Numbers of Fecal Bacteroidetes by Use of a Quantitative PCR
Assay for 16S rRNA Genes. Applied and Environmental Microbiology 70:5695-5697.
Desmarais, T.R., Solo-Gabriele, H.M., and C. J. Palmer. 2002. Influence of soil on fecal indicator organisms in a
tidally influenced subtropical environment. Applied and Environmental Microbiology 68(3):1165-1172.
Dorfman, M. and N. Stoner. 2007. Testing the waters: a guide to water quality at vacation beaches. Natural
Resources Defense Council (NRDC): Washington, DC.
Dufour, A. (ed EPA). 1984. (Environmental Protection Agency, Cincinnati, OH).
Dwight, R.H., Semenza, J.C., Baker, D.B., and B.H. Olson. 2002. Association of urban runoff with coastal water
quality in Orange County, California. Water Environment Research 74(1):82-90.
Ebdon, J., Muniesa, M., and H. Taylor. 2007. The application of a recently isolated strain of Bacteroides (GB-124)
to identify human sources of faecal pollution in a temperate river catchment. Water Research 41:3683-3690.
U.S. Environmental Protection Agency
December 2010 70
Ellis, J. 2006. Pharmaceutical and personal care products (PPCPs) in urban receiving waters. Environmental
Pollution 144:184-189.
Elmir, S.M., Wright, M.E., Abdelzaher, A., Solo-Gabriele, H.M., Fleming, L.E., Miller, G., Rybolowik, M., Shih,
M-T.P., Pillai, S.P., Cooper, J.A., and E.A. Quaye. 2007. Quantitative evaluation of bacteria released by bathers in a
marine water. Water Research 41:3-10.
Emerick, R. W., Loge, F. J., Thompson, D., and J.L. Darby. 1999. Factors influencing ultraviolet disinfection
performance part II: association of coliform bacteria with wastewater particles. Water Environmental Research.
71(6):1178-1187.
Emerick, R. W., Loge, F. J., Ginn, T., and J.L. Darby. 2000. Modeling the inactivation of particle-associated
coliform bacteria. Water Environmental Research 72:432-438.
Englebert, E.T., McDermott, C., and G.T. Kleinheinz. 2008. Effects of the nuisance algae, Cladophora, on
Escherichia coli at recreational beaches in Wisconsin. Science of the Total Environment 404:10-17.
Espinosa, A. C., Arias, C. F., Sánchez-Colón, S., and M. Mazari-Hiriart. 2009. Comparative study of enteric viruses,
coliphages and indicator bacteria for evaluating water quality in a tropical high-altitude system. Environmental
Health 8:49.
Evanson, M. and A.R. Ambrose. 2006. Sources and growth dynamics of fecal indicator bacteria in a coastal wetland
system and potential impacts to adjacent waters. Water Research 40:475-486.
Ferguson, C., Coote, B., Ashbolt, N., and I. Stevenson. 1996. Relationships between indicators, pathogens and water
quality in an estuarine system. Water Research 30(9):2045-2054.
Ferguson, D.M., Moore, D.F., Getrich, M.A., and M.H. Zhowandai. 2005. Enumeration and speciation of
enterococci found in marine and intertidal sediments and coastal water in southern California. Journal of Applied
Microbiology 99:598-608.
Field, K.G. and M. Samadpour. 2007. Fecal source tracking, the indicator paradigm, and managing water quality.
Water Research 41:3517-3538.
Fiksdal, L., Maki, J.S., LaCroix, S.J., and J.T. Stanley. 1985. Survival and detection of Bacteroides spp., prospective
indicator bacteria. Applied and Environmental Microbiology 49(1):148-150.
Frick, W.E., Ge, Z., and R.G. Zepp. 2008. Nowcasting and forecasting concentrations of biological contaminants at
beaches: a feasibility and case study. Environmental Science and Technology. 42(13):4818-4824.
Fries, J.S., Characklis, G.W., and R.T. Noble. 2006. Attachment of fecal indicator bacteria to particles in the Neuse
River Estuary, NC, USA. Journal of Environmental Engineering. 132(10):1338-1345.
Fries, J.S. Noble, R.T., and G.W. Characklis. 2008. Sediment-water exchange of Vibrio sp. and fecal indicator
bacteria: implications for persistence and transport in the Neuse River Estuary, North Carolina, USA. Journal of
Water Research. 42:941-950.
Froehner, S., Martins, R. F., M. R. Errera. 2009. Assessment of fecal sterols in Barigui River sediments in Curitiba,
Brazil. Environmental Monitoring and Assessment 157:591-600.
Fujioka, R.S., Loh, P.C., and S. Lau. 1980. Survival of human enteroviruses in the Hawaiian ocean environment:
evidence for virus-inactivating microorganisms. Applied and Environmental Microbiology. 39(6):1105-1110.
Fujioka, R.S., Hashimoto, H.H., Siwak, E.B., and R.H.F. Young. 1981. Effect of sunlight on survival of indicator
bacteria in seawater. Applied and Environmental Microbiology 41(3):690-696.
U.S. Environmental Protection Agency
December 2010 71
Fujioka, R.S. and L.K. Shizumura. 1985. Clostridium perfringens, a reliable indicator of stream water-quality.
Journal of the Water Pollution Control Federation 57:986-992.
Fujioka, R.S., Roll, B., and M. Byappanahalli. 1997. Appropriate recreational water quality standards for Hawaii
and other tropical regions based on concentrations of Clostridium perfringens. Proceedings of the Water
Environment Federation.4:405-411.
Fujioka, R.S, Sian-Denton, C., Borja, M., Castro, J., and K. Morphew. 1999. Soil: the environmental source of
Escherichia Coli and enterococci in Guam's streams. Journal of Applied Microbiology Symposium Supplement
85:83S-89S.
Fujioka, R.S. 2001. Microbial indicators of marine recreational water quality. In Manual of Environmental
Microbiology (C.J. Hurst, Chief Editor). ASM Press: Washington, DC, pages 234-243.
Fujioka, R. S. and B.S. Yoneyama. 2002. Sunlight inactivation of human enteric viruses and fecal bacteria. Water
Science and Technology 46:291-295.
Fujioka, R.S, and M.N. Byappanahalli (eds.) 2003. Proceedings and report: Tropical Water Quality Indicator
Workshop. Special Report SR-2004-01. University of Hawaii at Manoa, Water Resources Research Center.
Available online at http://www.wrrc.hawaii.edu/tropindworkshop.html.
Gauthier, F. and F. Archibald. 2001. The ecology of “fecal indicator” bacteria commonly found in pulp and paper
mill water systems. Water Research 35(9):2207-2218.
Genthner, F.J., James, J.B., Yates, D.F., and S.D. Friedman. 2005. Use of composite data sets for source-tracking in
the water column and shoreline interstitial waters on Pensacola Beach, Florida. Marine Pollution Bulletin 50:724-
732.
Gerba, C. and J.S. McLeod. 1976. Effects of sediments on the survival of Escherichia coli in marine waters.
Applied and Environmental Microbiology 32(1):114-120.
Ghinsberg, R.C., Dov, L.B., Rogol, M., Sheiberg, Y., and Y. Nitzan. 1994. Monitoring of selected bacteria and fungi
in sand and seawater along the Tel Aviv coast. Microbios 77:29-40.
Goodwin, K.D., Matragano, L., Wanless, D., Sinigalliano, C., and M.G. LaGier. 2009. A preliminary
investigation of fecal indicator bacteria, human pathogens, and source tracking markers in beach water and sand.
Environmental Research Journal. 2:395-417.
Graczyk, T.K., Sunderland, D., Tamang, L., Shields, T.M., Lucy, F.E., and P.N. Breysse. 2007. Quantitative
evaluation of the impact of bather density on levels of human-virulent microsporidian spores in recreational water.
Appl. Environ. Microbiol. 73:4095-4099.
Grant, S.B., Sanders, B.F., Boehm, A.B., Redman, J.A., Kim, J.H., Mrse, R.D., Chu, A.K., Gouldin, M., McGee,
C.D., Gardiner, N.A., Jones, B.H., Svejkovsky, J., Leipzig, G.V., and A. Brown. 2001. Generation of enterococci
bacteria in a coastal saltwater marsh and its impact on surf zone water quality. Environmental Science and
Technology 35(12):2407-2416.
Grant, S.B., Kim, J.H., Jones, B.H., Jenins, S.A., Wasyl, J., and C. Cudaback. 2005. Surf zone entrainment, along-
shore transport, and human health implications of pollution from tidal outlets. Journal of Geophysical Research 110
(C10025).
Grant, S.B., Sanders, B.F., Boehm, A.B., Redman, J.A., Kim, J.H., Mrse, R.D., Chu, A.K., Gouldin, M., McGee,
C.D., Gardiner, N.A., Jones, B.H., Svejkovsky, J., Leipzig, G.V., and A. Brown. 2007. Generation of enterococci
bacteria in a coastal saltwater marsh and its impact on surf zone water quality. Environmental Science and
Technology 35(12):2407-2416.
U.S. Environmental Protection Agency
December 2010 72
Griffin, D.W., Lipp, E.K., McLaughlin, M.R., and J.B. Rose. 2001. Marine recreation and public health
microbiology: quest for the ideal indicator. BioScience 51(10):817-825.
Griffith, J.F., Cao, Y., McGee, C.D., S.B. Weisberg. 2009. Evaluation of rapid methods and novel indicators for
assessing microbiological beach water quality. Water Research 43:4900-4907.
Gustafsson, O., Long, C.M., MacFarlane, J., and P.M. Gschwend. 2001. Fate of linear alkylbenzenes released to the
coastal environment near Boston Harbor. Environmental Science and Technology 35: 2040-2048.
Haack, S. K., Duris, J.W., Fogarty, L.R., Kolpin, D.W., Focazio, M.J., Furlong, E.T. and M.T. Meyer. 2009.
Comparing wastewater chemicals, indicator bacteria concentrations, and bacterial pathogen genes as fecal pollution
indicators. Journal of Environmental Quality 38(1): 248-258.
Hagedorn, C., Saluta, M., Hassall, A., and J. Dickerson. 2005. Fluorometric detection of optical brighteners as an
indicator of human sources of water pollution. Part II. Development as a source tracking methodology in open
waters. Environmental Detection News 2:1-13.
Haile, R. W., Witte, J.S., Gold, M., Cressey, R., McGee, C., Millikan, R.C., Glasser, A., Harawa, N., Ervin, C.,
Harmon, P., Harper, J., Dermand, J., Alamillo, J., Barrett, K., Nides, M., and G. Wang. 1999. The health effects of
swimming in ocean water contaminated by storm drain runoff. Epidemiology 10:355-363.
Haller, L., Pote, J., Loizeau, J. L., and W. Wildi. 2009. Distribution and survival of faecal indicator bacteria in the
sediments of the Bay of Vidy, Lake Geneva, Switzerland, Ecological Indicators. 9(3):540-547.
Hardina, C.M. and R.S. Fujioka. 1991. Soil: the environmental source of Escherichia coli and Enterococci in
Hawaii’s streams. Environmental Toxicology & Water Quality 6:185-195.
Hartel, P.G., Rodgers, K., Fisher, J.A., McDonald, J.L., Gentit, L.C., Otero, E., Rivera-Torres, Y., Bryant, T.L., and
S.H. Jones. 2005. Survival and regrowth of fecal enterococci in desiccated and rewetted sediments. In Proceedings
of the 2005 Georgia Water Resources Conference, held April 25-27, 2005, at the University of Georgia. Kathryn J.
Hatcher, editor, Institute Ecology, The University of Georgia, Athens, Georgia.
Hartel, P.G., McDonald, J.L., Gentit, L.C., Hemmings, S.N., Rodgers, K., Smith, K.A., Belcher, C.N., Rivera-
Torres, Y., Otero, E., and E.C. Schiro. 2007. Improving Fluorometry as a source tracking method to detect human
fecal contamination. Estuaries and Coasts 30(3):551-561.
Hartz, A., Cuvelier, M., Nowosielski, K., Bonilla, T. D. , Green, M., Esiobu, N., McCorquodale, D., and A.
Rogerson. 2008. Survival potential of Escherichia coli and enterococci in subtropical beach sand: implications for
water quality managers. Journal of Environmental Quality 37:898-905.
Harwood, V.J., Butler, J., Parrish, D., and V. Wagner. 1999. Isolation of fecal coliform bacteria from the
Diammondback Terrapin (Malaclemys terrapin centrata). Applied Environmental Microbiology 65(2):865-867.
Harwood, V.J., and J.B. Rose. 2004. Understanding the sources and fate of conventional and alternative indicator
organisms in subtropical waters. EPA STAR Grant Number: R828829. Available online at
http://cfpub.epa.gov/ncer_abstracts/index.cfm/fuseaction/display.abstractDetail/abstract/1008/report/F.
Havelaar, A. H., van Olphen, M., and Y.C. Drost. 1993. F-Specific RNA bacteriophages are adequate model
organisms for enteric viruses in fresh water. Applied and Environmental Microbiology 59:2956-2962.
He, L.-M., Lu, J. and W. Shi. 2007. Variability of fecal indicator bacteria in flowing and ponded waters in southern
California: implications for bacterial TMDL development and implementation. Water Research 41:3132-3140.
He, L.-M., and Z.-L. He. 2008. Water quality prediction of marine recreational beaches receiving watershed
baseflow and stormwater runoff in southern California, USA. Water research 42:2563-2573.
U.S. Environmental Protection Agency
December 2010 73
Heaney, C. D., Sams, E., Wing, S., Marshall, S., Brenner, K., Dufour, A. P., and T.J. Wade. 2009. Contact with
beach sand among beachgoers and risk of illness. American Journal of Epidemiology 170:164-172.
Hernandez-Delgado, E.A., Sierra, M.L., and G.A. Toranzos. 1991. Coliphages as alternate indicators of fecal
contamination in tropical waters. Environmental Toxicology and Water Quality 6(2):131-143.
Hernandez, E. A. and G.A. Toranzos. 1995. In situ replication studies of somatic and male-specific coliphages in a
tropical pristine river. Water Science and Technology 31:247-250.
Hill, R. T., Straube, W. L., Palmisano, A.C., Gibson, S.L., and R. R. Colwell. 1996. Distribution of sewage indicated
by Clostridium perfringens at a deep-water disposal site after cessation of sewage disposal. Applied and
Environmental Microbiology 62:1741-1746.
Hsu, F., Shieh, Y.-S., van Duin, J., Beekwilder, M.J., and M.D. Sobsey. 1995. Genotyping male-specific RNA
coliphages by hybridization with oligonucleotide probes. Applied and Environmental Microbiology 61:3960-3966.
Iriberri, J., Azua, I., Labirua-Iturburu, A., Artolozaga, I., and I. Barcina. 1994. Differential elimination of enteric
bacteria by protists in a freshwater system. Journal of Applied Bacteriology 77:476-483.
Ishii, S., Hansen, D.L., Hicks, R.E., and M.J. Sadowsky. 2006. Source tracking of Escherichia coli at the Duluth
Boat Club Beach: nearshore sand acts as a temporal source and sink of this fecal indicator bacterium. Poster
presented at the American Society for Microbiology 106th
General Meeting, Orlando, FL.
Ishii, S., Hansen, D.L., Hicks, R.E., and M.J. Sadowsky. 2007. Beach sand and sediments are temporal sinks and
sources of Escherichia coli in Lake Superior. Environmental Science and Technology 41(7):2203-2209.
Isobe, K., Tarao, M., Zakaria, M., Chiem, N., Minh, L., and H. Takada. 2002. Quantitative application of fecal
sterols using gas chromatography - mass spectrometry to investigate fecal pollution in tropical waters: Western
Malaysia and Mekong Delta, Vietnam. Environmental Science and Technology 36:4497-4507.
Isobe, K.O., Tarao, M., Chiem, N.H., Minh, L.Y., and H. Takada. 2004. Effect of environmental factors on the
relationship between concentrations of coprostanol and fecal indicator bacteria in tropical (Mekong Delta) and
temperate (Tokyo) freshwaters. Applied and Environmental Microbiology 70(2):814-821.
Jeng, H.C., England, A.J., and H.B. Bradford. 2005. Indicator organisms associated with stormwater suspended
particles and estuarine sediment. Journal of Environmental Science and Health 40:779-791
Jeong, Y., Grant, S.B., Ritter, S., Pednekar, A., Candelaria, L., and C. Winant. 2005. Indentifying pollutant sources
in tidally mixed systems: case study of fecal indicator bacteria from marinas in Newport Bay, southern California.
Environmental Science and Technology 39(23):9083-9093.
Jofre, J. 2009. Is the replication of somatic coliphages in water environments significant? Journal of Applied
Microbiology 106:1059-1069.
Kapuscinski, R.B., and R. Mitchell. 1983. Sunlight-induced mortality of viruses and Escherichia coli in coastal
seawater. Environmental Science and Technology 17(1):1-6.
Kay, D. Fleisher, J.M., Salmon, R.L., Jones, F., Wyer, M.D., Godfree, A.F., Zelenauch-Jacquotte, Z., and R. Shore.
1994. Predicting the likelihood of gastroenteritis from sea bathing: results from randomized exposure. The Lancet
344:905-909.
Ki, S.J., Ensari, S., and J.H. Kim. 2007. Solar and tidal modulations of fecal indicator bacteria in coastal waters at
Huntington Beach, California. Environ Manage 39:867-875.

U.S. Environmental Protection Agency
December 2010 74
Kildare, B. J., Leutenegger, C.M., McSwain, B.S., Bambic, D.G., Rajal, B.V., and S. Wuertz. 2007. 16S rRNA-
based assays for quantitative detection of universal, human-, cow-, and dog-specific fecal Bacteroidales: a Bayesian
approach. Water Research 41:3701-3715.
Kim, I., Yamashita, N., and H. Tanaka. 2009. Photodegradation of pharmaceuticals and personal care products
during UV and UV/H2O2 treatments. Chemosphere 77:518-525.
King, E. L., Bachoon, D. S., and K.W. Gates. 2007. Rapid detection of human fecal contamination in estuarine
environments by PCR targeting of Bifidobacterium adolescentis. Journal of Microbiological Methods 68, 76-81.
Kinzelman, J., Ng, C., Jackson, E., Gradus, S., and R. Bagley. 2003. Enterococci as indicators of Lake Michigan
recreational water quality: comparison of two methodologies and their impacts on public health regulatory events.
Applied and Environmental Microbiology 69(1):92-96.
Kistemann, T.C., Claben, T., Koch, C., Dangendorf, F., Fischeder, R., Gebel, J., Vacata, V., and M. Exner. 2002.
Microbial load of drinking water reservoir tributaries during extreme rainfall and runoff. Applied and Environmental
Microbiology 68(5):2188-2197.
Knee, K. L., Gossett, R., Boehm, A. B., and A. Paytan. 2010. Caffeine and agricultural pesticide concentrations in
surface water and groundwater on the north shore of Kauai (Hawaii, USA). Marine Pollution Bulletin 60, 1376-
1382.
Kolpin, D. W., Furlong, E.F., Meyer, M.T., Thurman, E. M. , Zaugg, S.D., Barber, L.B., and H.T. Buxton. 2002.
Pharmaceuticals, hormones, and other organic wastewater contaminants in US Streams 1999-2000: a national
survey. Environmental Science and Technology 36:1202-1211.
Korhonen, L. and P. Martikainen. 1991. Survival of Escherichia coli and Campylobacter jejuni in untreated and
filtered lake water. Journal of Applied Bacteriology 71:379-382.
Kramer, J.B., Canonica, S., Hoigne, and J. Kaschig, J. 1996. Degradation of fluorescent whitening agents in sunlit
natural waters. Environmental Science and Technology 30:2227-2234.
Kreader, C A. 1998. Persistence of PCR-detectable Bacteroides distasonis from human feces in river water. Applied
and Environmental Microbiology 64:4103-4105.
Krometis, L.H., Characklis, G.W., Simmons, O.D. III, Dilts, M.D., Likirdopulos, C.A., and M.D. Sobsey. 2007.
Intra-storm variability in microbial partitioning and microbial loading rates. Water Research 41:506-516.
LaLiberte, P. and D. J. Grimes. 1982. Survival of Escherichia coli in lake bottom sediment. Applied and
Environmental Microbiology 43(3):623-628.
Lamendella, R., Domingo, J. W. S., Kelty, C. , and D.B. Oerther. 2008. Bifidobacteria in feces and environmental
waters. Applied and Environmental Microbiology 74:575-584.
Layton, A., McKay, L., Williams, D., Garrett, V., Gentry, R., and G. Sayler. 2006. Development of Bacteroides 16S
rRNA Gene TaqMan-based real-time pcr assays for estimation of total, human, and bovine fecal pollution in water.
Applied and Environmental Microbiology 72:4214-4224.
Lee, C.M., Lin, T.Y, Lin, C.-C.; Kohbodi, G. A., Bhatt, A., Lee, R., and J.A. Jay. 2006. Persistence of fecal
indicator bacteria in Santa Monica Bay beach sediments. Water Research 40:2593-2602.
Leecaster, M.K. and S.B. Weisberg. 2001. Effect of sampling frequency on shoreline microbiology assessments.
Marine Pollution Bulletin 42(11):1150-1154.
Leeming, R., Ball, A., Ashbolt, N., and P. Nichols. 1996. Using faecal sterols from humans and animals to
distinguish faecal pollution in receiving waters. Water Research 30(12):2893-2900.

U.S. Environmental Protection Agency
December 2010 75
LeFevre, N.M. and G.D. Lewis. 2003. The role of resuspension in enterococci distribution in water at an urban
beach.Water Science and Technology 47:205-210.
Levett, P.N. 2001. Leptospirosis. Clinical Microbiology Reviews 14:296-326.
Lipp, E.K., Kurz, R., Vincent, R., Rodrigues-Palacios, C., Farrah, S.R., and J.B. Rose. 2001. The effects of seasonal
variability and weather on microbial fecal pollution and enteric pathogens in a subtropical estuary. Estuaries
24(2):266-276.
Liu, L., Phanikumar, M., Molloy, S.L., Whitman, R.L., Shively, D.A., Nevers, M.B., Schwab, D.J., and J.B. Rose.
2006. Modeling the transport and inactivation of E. coli and enterococci in the near-shore region of Lake Michigan.
Environmantal Science Technology 40:5022-5028.
Lo, S., Gilbert, J., and F. Hetrick. 1976. Stability of human enteroviruses in estuarine and marine waters. Applied
and Environmental Microbiology 32(2):245-249.
Loge, F.J., Bourgeous, K., Emerick, R. W., and J.L. Darby. 2001. Variations in wastewater quality parameters
influencing UV disinfection performance: relative impact of filtration. Journal Environmental Engineering.
ASCE:832-837.
Loge, F. J., Emerick, R. W., Thompson, D., and J.L. Darby. 1999. Factors influencing ultraviolet disinfection
performance part I: light penetration to wastewater particles. Water Enviromental Research 71(3):377-381.
Lopez-Torres, A. 1987. Distribution and in situ survival and activity of Klebsiella pneumoniae and Escherichia coli
in a tropical rain forest watershed. Current Microbiology 15(4):213-218.
Love, D. C., Silverman, and K.A. Nelson. 2010. Human virus and bacteriophage inactivation in clear water by
simulated sunlight compared to bacteroiphage inactivation at a Southern California beach. Environmental Science
and Technology 44:6965-6970.
Lucena, F., Araujo, R., and J. Jofre. 1996. Usefulness of bacteriophages infecting Bacteroides fragilis as index of
microorganisms of remote faecal pollution. Water Research 30(11):2812-2816.
Lucena, F., Mendez, X., Moron, A., Calderon, E., Campos, C. Guerrero, A., Cardenas, M., Gantzer, C.,
Shwartzbrood, L., Skraber, S., and J. Jofre. 2003. Occurrence and densities of bacteriophages proposed as indicators
and bacterial indicators in river waters from Europe and South America. Journal of Applied Microbiology 94:808-
815.
Luna, G. M., Vignaroli, C., Rinaldi, C., Pusceddu, A., Nicoletti, L., Gabellini, M., Danovaro, R., and F. Biavasco.
2010. Extraintestinal Escherichia coli carrying virulence genes in coastal marine sediments. Applied and
Environmental Microbiology 76:5659-5668.
Luther, K. and R.S. Fujioka. 2004. Usefulness of monitoring tropical streams for male-specific RNA coliphages,
Journal of Water and Health 2:171-178.
Maldonado, C., Venkatesan, M.I., Philips, C.R., and J.M. Bayona. 2000. Distribution of trialkylamines and
coprostanol in San Pedro shelf sediments adjacent to a sewage outfall. Marine Pollution Bulletin 40(8):680-687.
Mallin, M.A., Williams, K.E., Esham, E.C., and P.L. Lowe. 2000. Effect of human development on bacteriological
water quality in coastal watersheds. Ecological Applications 10(4):1047-1056.
Mallin, M.A., Ensign, S.H., Mciver, M.R., Shank, G.C., P.K. Fowler. 2001. Demographic, landcaspe, and
meterological factors controlling the microbial pollution of coastal waters. Hydrobiologia 460:185-193.

U.S. Environmental Protection Agency
December 2010 76
Mara, D. D., and J. Oragui. 1985. Bacteriological methods for distinguishing between human and animal faecal
pollution of water: results of fieldwork in Nigeria and Zimbabwe. Bulletin of World Health Organization 63:773-
783.
McCambridge, J. and T.A. McKeekin. 1981. Effect of solar radiation and predacious microorganisms on survival of
fecal and other bacteria. Applied and Environmental Microbiology 41(5):1083-1087.
McDonald, J.L., Hartel, P.G., Gentita, L.C., Belchera, C.N., Gates, K.W., Rodgers, K., Fisher, J.A., Smith, K.A.,
and K.A. Payne. 2006. Identifying sources of fecal contamination inexpensively with targeted sampling and
bacterial source tracking. Journal of Environmental Quality 35:889-897.
McLaughlin M.R., and J. B. Rose. 2006. Application of Bacteroides fragilis phage as an alternative indicator of
sewage pollution in Tampa Bay, Florida. Estuaries and Coasts 29:246-256.
Medema, G. J., Bahar, M., and F.M. Schets. 1997. Survival of Cryptosporidium parvum, Escherichia coli, faecal
enterococci, and Clostridium perfringens in river water: influence of temperature and autochthonous
microorganisms. Water Science and Technology 35:249-252.
Mill, A., Schlacher, T., and M. Katouli. 2006. Tidal and longitudinal variation of faecal indicator bacteria in an
estuarine creek in south-east Queensland, Australia. Marine Pollution Bulletin 52: 881-891.
Moce-Llivina, L., Lucena, F., and J. Jofre. 2005. Enteroviruses and Bacteriophages in Bathing Waters. Applied and
Environmental Microbiology 71:6838-6844.
Morrison, C. R., Bachoon, D. S., and K.W. Gates. 2008. Quantification of enterococci and bifidobacteria in Georgia
estuaries using conventional and molecular methods. Water Research 42:4001-4009.
Mueller-Spitz, S. R., Stewart, L. B., Klump, J. V., and S.L. McLellan. 2010. Freshwater Suspended Sediments and
Sewage Are Reservoirs for Enterotoxin-Positive Clostridium perfringens. Applied and Environmental Microbiology
76: 5556-5562.
Muniesa, M., Jofre, J., García-Aljaro, C., and A.R. Blanch. 2006. Occurrence of Escherichia coli O157:H7 and other
enterohemorrhagic Escherichia coli in the environment†. Environmental Science and Technology 40:7141-7149.
Muniesa, M., Payan, A., Moce-Llivina, L., Blanch, A. R., and J. Jofre. 2009. Differential persistence of F-specific
RNA phage subgroups hinders their use as single tracers for faecal source tracking in surface water. Water Research
43:1559-1564.
Musolff, A. Leschik, S., Möder, M., Strauch, G., Reinstorf, F., and M. Schirmer. 2009. Temporal and spatial
patterns of micropollutants in urban receiving waters. Environmental Pollution 157: 3069-3077.
Nasser, A. M. and S.D. Oman. 1999. Quantitative assessment of the inactivation of pathogenic and indicator viruses
in natural water sources. Water Research 33:1748-1752.
National Research Council (NRC). 2004. Indicators for waterborne pathogens. National Academies Press.
Washington, DC. 315 pp.
Nebra, Y., Bonjoch, X., and A.R. Blanch. 2003. Use of Bifidobacterium dentium as an Indicator of the Origin of
Fecal Water Pollution. Applied and Environmental Microbiology 69: 2651-2656.
Nichols, P.D., Leeming, R., Rayner, M.S., Latham, V., Ashbolt, N.J., and C. Turner. 1993. Comparison of the
abundance of the fecal sterol coprostanol and fecal bacterial groups in inner-shelf waters and sediments near
Sydney, Australia. Journal of Chromatography 643: 189-195.
U.S. Environmental Protection Agency
December 2010 77
Noble, R.T., Dorsey, J.H., Leecaster, M., Orozco-Borbon, V., Reid, D., Schiff, K., and S.B. Weisberg. 2000. A
regional survey of the microbiological water quality along the shoreline of the southern California bight.
Environmental Monitoring and Assessment 64:435-447.
Noble, R.T., Lee, I.M., and K.C. Schiff. 2004. Inactivation of indicator micro-organisms from various sources of
faecal contamination in seawater and freshwater. Journal of Applied Microbiology 96: 464-472.
Noblet, J.A., Young, D.L., Zeng, E.Y., and S. Ensari. 2004. Use of fecal steroids to infer the sources of fecal
indicator bacteria in the lower Santa Ana River watershed, California. Environmental Science and Technology 38:
6002-6008.
Obiri-Danso, K.,and K. Jones. 1999. Distribution and seasonality of microbial indicators and thermophilic
campylobacters in two freshwater bathing sites on the River Lune in northwest England. Journal of Applied
Microbiology 87:822-832.
Ogorzaly, L., Tissier, A., Bertrand, I., Maul, A., and C. Gantzer. 2009. Relationship between F-specific RNA phage
genogroups, faecal pollution indicators and human adenoviruses in river water. Water Research 43, 1257-1264.
Okabe, S., Okayama, N., Savichtcheva, O., and T. Ito. 2007. Quantification of host-specific Bacteroides–Prevotella
16S rRNA genetic markers for assessment of fecal pollution in freshwater. Applied Microbiology and
Biotechnology 74:890-901.
Okabe, S. and Y. Shimazu. 2007. Persistence of host-specific Bacteroides-Prevotella 16S rRNA genetic markers in
environmental waters: effects of temperature and salinity. Applied Microbiology and Biotechnology 76: 936-944.
Oshiro, R. and R. Fujioka. 1995. Sand, soil, and pigeon droppings: sources of indicator bacteria in the waters of
Hanauma Bay, Oahu, Hawaii. Water Science and Technology 31(5-6): 251-254.
Ottoson, J. R. 2009. Bifidobacterial survival in surface water and implications for microbial source tracking.
Canadian Journal of Microbiology 55: 642-647.
Palmateer, G.A., Dutka, B.J., Janzen, E.M., Meissner, S.M., and M.G. Sakeellaries. 1991. Coliphage and
bacteriophage as indicators of recreational water quality. Water Research 25(3): 355-357.
Parker, W.F., and B.J. Mee. 1982. Survival of Salmonella adelaide and fecal coliforms in coarse sands of the Swan
Coastal Plain, Western Australia. Applied and Environmental Microbiology 43(5): 981-986.
Paul, J.H., Rose, J.B., Jiang, S., Kellogg, C., and E.A. Shinn. 1995. Occurrence of fecal indicator bacteria in surface
waters and the subsurface aquifer in Key Largo, Florida. Applied and Environmental Microbiology 61(6): 2235-
2241.
Paul, J.H., Rose, J.B., Jiang, S.C., London, P., Shou, X., and C. Kellogg. 1997. Coliphage and indigenous phage in
Mamala Bay, Oahu, Hawaii. Applied and Environmental Microbiology 63(1): 133-138.
Payment, P., and E. Franco. 1993. Clostridium perfringens and somatic coliphages as indicators of the efficiency of
drinking-water treatment for viruses and protozoan cysts. Applied and Environmental Microbiology 59: 2418-2424.
Peeler, KA, Opsahl, S.P., and J.P. Chanton. 2006. Tracking anthropogenic inputs using caffeine, indicator bacteria,
and nutrients in rural freshwater and urban marine systems. Environmental Science and Technology 40: 7616-7622.
Pendleton, L. 2008. The economics of using ocean observing systems to improve beach closure policy. Coastal
Management 36(2): 165-178.
Perez-Rosas, N. and T.C. Hazen. 1988. In situ survival of Vibrio cholerae and Escherichia coli in tropical coral
reefs. Applied and Environmental Microbiology. 54:1-9.

U.S. Environmental Protection Agency
December 2010 78
Perez-Rosas, N. and T.C. Hazen. 1989. In situ survival of Vibrio cholerae and Escherichia coli in a tropical rain
forest watershed. Applied and Environmental Microbiology. 55:495-499.
Phillips, C.R., Venkatesan, M.I., and R. Bowen. 1997. Interpretations of contaminant sources to San Pedro Shelf
sediments using molecular markers and principal component analysis. In Molecular Markers in Environmental
Geochemistry, ed. R. P. Eganhouse, pp. 242-260. ACS Symposium Series 671, ACS, Washington, DC.
Piontkovski, S. A. and R. Williams. 1995. Multiscale variability of tropical ocean zooplankton biomass. ICES
Journal of Marine Sciences 52:643-656.
Poiger, T., Field, J.A., Field, T.M. , Siegrist, H., and W. Giger. 1998. Behavior of fluorescent whitening agents
during sewage treatment. Water Research 32:1939-1947.
Power, M.L., Littlefield-Wyer, J., Gordon, D.M., Veal, D.A., and M.B. Slade. 2005. Phenotypic and genotypic
characterization of encapsulated Escherichia coli from blooms in two Australian lakes. Environmental Microbiology
7(5):631–640.
Pratt, C., Warnken, J., Leeming, R., Arthur, M., and D. Grice. 2008. Degradation and responses of coprostanol and
selected sterol biomarkers in sediments to a simulated major sewage pollution event: A microcosm experiment
under sub-tropical estuarine conditions. Organic Geochemistry 39:353-369.
Prüss, A. 1998. Review of epidemiological studies on health effects from exposure to recreational water.
International Journal of Epidemiology 27:1-9.
Ragavachari, T.N.S. and P.V.W. Iver. 1939. Longevity of coliform organisms in water stored under natural
conditions. Indian Journal of Medical Research 26877-26883.
Ramirez, G., Minningh, H.A., Viqueira, R., Hertler, H., and C. Ferrer-Graniela. 2000. Quality in tropical waters in
relational to onshore development. In Proceedings of the WEFTC North America, 73th Annual Water
Environmental Conference.
Resnick, I. G., and M.A. Levin. 1981. Assessment of Bifidobacteria as indicators of human fecal pollution. Applied
and Environmental Microbiology 42:433-438.
Rhodes, M.W. and H. Kator. 1988. Survival of Escherichia coli and Salmonella spp. in estuariane environments.
Applied and Environmental Microbiology 54(2):2902-2907.
Rivera, S.C., Hazen, T.C., and G.A. Toranzos. 1988. Isolation of fecal coliforms from pristine sites in a tropical rain
forest. Applied and Environmental Microbiology 54(2):513-517.
Rolfe, R.D., Hentges, D.J., Barrett, J.T., and B.J. Campbell. 1977. Oxygen tolerance of human intestinal anaerobes.
American Journal of Clinical Nutrition 30:1762-1769.
Roll, B.M. and R.S. Fujioka. 1997. Sources of faecal indicator bacteria in a brackish, tropical stream and their
impact on recreational water quality. Water Science and Technology 35(11-12):179-186.
Rosenfeld, L.K., McGee, C.D., Robertson, G.L., Noble, M.A.,and B.H. Jones. 2006. Temporal and spatial
variability of fecal indicator bacteria in the surf zone off Huntington Beach, CA. Marine Environmental Research
61:471-493.
Santoro, A.E. and A.B. Boehm. 2007. Frequent occurrence of the human-specific Bacteroides fecal marker at an
open coast marine beach: relationship to waves, tides and traditional indicators. Environmental Microbiology
9(8):2038-2049.

U.S. Environmental Protection Agency
December 2010 79
Savichtcheva, O. and S. Okabe. 2006. Alternative indicators of fecal pollution: Relations with pathogens and
conventional indicators, current methodologies for direct pathogen monitoring and future application perspectives.
Water Research 40:2463-2476.
Savichtcheva, O., Okayama, N., and S. Okabe. 2007. Relationships between Bacteroides 16S rRNA genetic markers
and presence of bacterial enteric pathogens and conventional fecal indicators. Water Research 41:3615-3628.
Schiff, K.C., Morton, J., and S.B. Weisberg. 2003. Retrospective evaluation of shoreline water quality along Santa
Monica Bay beaches. Marine Environment Research 56:245-253.
Schwabb, K..J. 2007. Are existing bacterial indicators adequate for determining recreational water illness in waters
impacted by nonpoint pollution? Epidemiology 18:21-22.
Scottish Environment Protection Agency (SEPA). 2001. A Study of Bathing Waters Compliance with EC Directive
76/160/EEC: the Relationship Between Exceedence of Standards and Antecedent Rainfall.
Seigener, R. and R.F. Chen. 2002. Caffeine in Boston Harbor seawater. Marine Pollution Bulletin 44:383-387.
Seurinck, S., Defoirdt, T., Verstraete, W., and S.D. Siciliano. 2005. Detection and quantification of the human-
specific HF183 Bacteroides 16S rRNA genetic marker with real-time PCR for assessment of human faecal pollution
in freshwater. Environmental Microbiology 7:249-259.
Seurinck, S., Verdievel, M., Verstraete, W., and S.D. Siciliano. 2006. Identification of human fecal pollution sources
in a coastal area: a case study at Oostende (Belgium). Journal of Water and Health 4(2):167-175.
Shanks, O. C., White, K., Kelty, C.A., Sivaganesan, M., Blannon, J., Meckes, M. Varma, M., and R.A. Haughland.
2010. Performance of PCR-based assays targeting bacteroidales genetic markers of human fecal pollution in sewage
and fecal samples. Environmental Science and Technology 44:6281-6288.
Shiaris, M.P., Rex, A.C., Pettibone, G.W., Keay, K., McManus, P., Rex, M.A., Ebersole, J., and E. Gallagher. 1987.
Distribution of indicator bacteria and Vibrio parahaemolyticus in sewage-polluted intertidal sediments. Applied and
Environmental Microbiology 53(8):1756-1761.
Shibata, T., Solo-Gabriele, H.M., Fleming, L.E., and S. Elmir. 2004. Monitoring marine recreational water quality
using multiple microbial indicators in an urban tropical watershed. Water Research 38:3119-3131.
Shuval, H. 2003. Estimating the global burden of thalassogenic diseases: human infectious diseases caused by
wastewater pollution of the marine environment. Journal of Water and Health 1:53-64.
Sinton, L.W., Davies-Colley, R.J., and R.G. Bell. 1994. Inactivation of enterococci and fecal coliforms from sewage
and meatworks effluents in seawater chambers. Applied and Environmental Microbiology 60(6):2040-2048.
Sinton, L.W., Finlay, R.K., and P.A. Lynch. 1999. Sunlight inactivation of fecal bacteriophages and bacteria in
sewage-polluted seawater. Applied and Environmental Microbiology 65(8):3605-3613.
Sinton, L.W., Hall, C.H., Lynch, P.A., R.J. Davies-Colley. 2002. Sunlight inactivation of fecal indicator bacteria and
bacteriophages from waste stabilization pond effluent in fresh and saline waters. Applied and Environmental
Microbiology 68(3):1122-1131.
Sinton, L.W., Hall, C., and R. Braithwaite. 2007. Sunlight inactivation of Campylobacter jejuni and Salmonella
enterica, compared with Escherichia coli, in seawater and river water. Journal of Water and Health 5(3):357-365.
Sjogren, R.E. 1995. Thirteen-year survival study of an environmental Escherichia coli in field mini-plots. Water,
Air, and Soil Pollution 81:315-335.

U.S. Environmental Protection Agency
December 2010 80
Skraber, S. J. S., Italiaander, R., Husman, and A.M. Rose. 2009. Accumulation of enteric bacteria in freshwater
sediments. Journal of Water and Health 7: 372-379.
Solic, M. and N. Krstuvolic. 1992. Separate and combined effects of solar radiation, temperature, salinity and pH on
the survival of fecal coliforms in seawater. Marine Pollution Bulletin 24:411-416.
Solo-Gabriel, H.M., Wolfert, M.A., Desmarais, T.R., and J.P. Carol. 2000. Sources of Escherichia coli in a coastal
subtropical environment. Applied and Environmental Microbiology 66(1):230-237.
Stetler, R. E. 1984. Coliphages as indicators of enteroviruses. Applied and Environmental Microbiology 48:668-670.
Stewart-Pullaro, J. Daugomah, J.W., Chestnut, D.E., Graves, D.A., Sobsey, M.D. Sobsey, and G.I. Scott. 2006. F+RNA
coliphage typing for microbial source tracking in surface waters. Journal of Applied Microbiology 101:1015-1026.
Stricker, A., Wilhartitz, I., Farnleitner, A., and R. Mach. 2008. Development of a Scorpion probe-based real-time
PCR for the sensitive quantification of Bacteroides sp. ribosomal DNA from human and cattle origin and evaluation
in spring water matrices. Microbiological Research 163:140-147.
Sukias, J.P.S. and N.L. Nyugen. 2003. Inactivation of E. coli in riparian and non-riparian soils. In Diffuse Pollution
Conference Dublin, August 18-22, 2003, University College of Dublin.
Sunderland, D., Graczyk, T.K., Tamang, L., and P.N. Breysse. 2007. Impact of bathers on levels of Cryptosporidium
parvum oocysts and Giardia lamblia cysts in recreational beach waters. Water Research 41:3483-3489.
Surbeck, C.Q., Jiang, S.C., and S.B. Grant. 2010. Ecological control of fecal indicator bacteria in an urban stream.
Environmental Science and Technology. 44(2):631-637.
Tate, K.W., Atwill, E.R., George, M.R., McDougald, N.K, and R.E. Larsen. 2000. Cryptosporidium parvum
transport from cattle fecal deposits on California rangelands. Journal of Range Management 53:295-299.
Tartera, C., Lucena, F., and J. Jofre. 1989. Human origin of Bacteroides fragilis bacteriophages present in the
environment. Applied and Environmental Technology 55:2696-2701.
Tartera C. and J. Jofre. 1987. Bacteriophages active against Bacteroides fragilis in sewage-polluted waters. Applied
and Environmental Microbiology 53:1632-1637.
Traister, E. and S.C. Anisfeld. 2006. Variability of indicator bacteria at different time scales in the Upper Hoosic
River watershed. Environmental Science and Technology 40(16):4990-4995.
Trinh, S., Briolat, V., and G. Reysset. 2000. Growth response of Clostridium perfringens to oxidative stress.
Anaerobe 6(4):233-240.
Tunnicliff, B. and S.K. Brickler. 1984. Recreational water quality analyses of the Colorado River corridor in Grand
Canyon. Applied and Environmental Microbiology 48(5):909-917.
Tyagi, P., Edwards, D.R., and M.S. Coyne. 2007. Use of selected chemical markers in combination with a multiple
regression model to assess the contribution of domesticated animal sources of fecal pollution in the environment.
Chemosphere 69:1617-1624.
USEPA (U.S. Environmental Protection Agency). 1986. Ambient water quality for bacteria - 1986. EPA440/5-84-
002.
USEPA (U.S. Environmental Protection Agency). 1998. Action plan for beaches and recreational waters.
EPA/600/R-98/079.

U.S. Environmental Protection Agency
December 2010 81
USEPA (U.S. Environmental Protection Agency). 2004. Water quality standards for coastal and great lakes
recreation water; final rule. Federal Register 69(220): 7217-67243.
USEPA (U.S. Environmental Protection Agency). 2007a. Report of the experts scientific workshop on critical
research needs for the development of new or revised recreational water quality criteria. EPA 823-R-07-006.
Available online at http://www.epa.gov/waterscience/criteria/recreation.
USEPA (U.S. Environmental Protection Agency). 2007b. Critical path science plan for development of new or
revised recreational water quality criteria. EPA 823-R-08-002. Available online at
http://www.epa.gov/waterscience/criteria/recreation/plan/.
USEPA (U.S. Environmental Protection Agency). 2009. Review of zoonotic pathogens in ambient waters. Office of
Water Health and Ecological Criteria Division. EPA 822-R-09-002.
Valdes-Collazo, L., Schultz, A.J., and T.C. Hazen.1987. Survival of Candida albicans in tropical marine and fresh
waters. Applied and Environmental Microbiology 53:1762-1767.
Van donsel, D.J., Geldreich, E.E., and N.A. Clarke. 1967. Seasonal variations in surivival of indicator bacteria in
soil and their contribution to storm-water pollution. Applied Microbiology 15(6):1362-1370.
Vigness, K., Bornstein-Forst, S., and S.L. McLellan. 2006. The potential for beach sand to serve as a reservoir for E.
coli and the role of sand humidity on survival and persistence. Poster presented at the American Society
Microbiology, 106th
General Meeting, Orlando, Florida.
Wade, T.J., Pai, N., Eisenberg, J.N., and J.M. Colford, Jr. 2003. Do U.S. Environmental Protection Agency water
quality guidelines for recreational waters prevent gastrointestinal illness? A systematic review and meta-analysis.
Environmental Health Perspectives 111(8):1102-1109.
Wait, D.A. and M.D. Sobsey. 2001. Comparative survival of enteric viruses and bacteria in Atlantic Ocean seawater.
Water Science and Technology 43(12):139-142.
Walters, S.P., Gannon, V.P.J., and K.G. Field. 2007. Detection of Bacteroidales fecal indicators and the zoonotic
pathogens E. coli O157:H7, Salmonella, and Campylobacter in river water. Environmental Science and Technology
41(6): 1856-1862.
Walters, S.P. and K.G. Field. 2009. Survival and persistence of human and ruminant-specific faecal Bacteroidales in
freshwater microcosms. Environmental Microbiology 11:1410-1421.
Walters, S.P., Yamahara, K.M., and A.B. Boehm. 2009. Persistence of nucleic acid markers of health-relevant
organisms in seawater microcosms: implications for their use in assessing risk in recreational waters. Water
Research 43:4929-4939.
Wang, G. and M.P. Doyle. 1998. Survival of enterohemorrhagic Escherichia coli O157:H7 in water. Journal of Food
Protection 61(6):662-667.
Wang, J.-Z., Guan, Y.-F., Ni, H.-G., Liu, G.-J. and E.Y. Zeng. 2010. Fecal steroids in riverine runoff of the Pearl
River Delta, South China: levels, potential sources and inputs to the coastal ocean. Journal of Environmental
Monitoring 12:280-286.
Wang, R., Cao, W., and C.E. Cerniglia. 1996. PCR Detection and quantification of predominant anaerobic bacteria
in human and animal fecal samples. Applied and Environmental Microbiology 62:1242-1247.
Wark, K. 1983. Thermodynamics. 4th
edition. McGraw Hill, NY, NY.
Whitman, R.L. and M.B. Nevers. 2003. Foreshore sand as a source of Escherichia coli in nearshore water of a Lake
Michigan beach. Applied and Environmental Microbiology 69(9):5555-5562.

U.S. Environmental Protection Agency
December 2010 82
Whitman, R.L., Shively, D.A., Pawlik, H., Nevers, M.B., and M.N. Byappanahalli. 2003. Occurrence of Escherichia
coli and enterococci in Cladophora (Chlorophyta) in nearshore water and beach sand of Lake Michigan. Applied
and Environmental Microbiology 69(8):4714-4719.
Whitman, R.L., Nevers, M.B., Korinek, G.C., and N. Byappanahalli. 2004. Solar and temperature effect on
Escherichia coli concentration at a Lake Michigan swimming beach. Applied and Environmental Microbiology
70(7):4276-4285.
Whitman, R.L., Byers, S.E., Shively, D.A., Ferguson, D.M., and M. Byappanahalli. 2005. Occurrence and growth
characteristics of Escherichia coli and enterococci within the accumulated fluid of the northern pitcher plant
(Sarracenia purpurea L.). Canadian Journal of Microbiology 51:1027–1037.
Whitman, R.L., Nevers, M.B, and M.N. Byappanahalli. 2006. Examination of the watershed-wide distribution of
Escherichia along southern Lake Michigan: an integrated approach. Applied and Environmental Microbiology
72(11):7301-7310.
Wolfe, T.M. 1995. A comparison of fecal coliform densities and fluorescent intensities in Murrells Inlet, a highly
urbanized estuary, and in North Inlet, a pristine forested estuary Masters thesis, University of South Carolina.
Wong, M, Kumar, L., Jenkins, T.M., Xagoraraki, I., Phanikumar, M.S., and J.B. Rose. 2009. Evaluation of public
health risks at recreational beaches in Lake Michigan via detection of enteric viruses and a human-specific
bacteriological marker. Water Research 43(4):1137-1149.
WHO (World Health Organization). 2004. Waterborne zoonoses: identification, causes and control. Edited by J.A.
Cotruvo, A. Dufour, G. Rees, J. Bartram, R. Carr, D.O. Cliver, G.F. Craun, R. Fayer, and V.P.J. Gannon. IWA
Publishing, London, UK. ISBN: 1 84339 058 2.
WHO (World Health Organization). 2005. Guidelines for drinking-water quality. Recommendations. First
addendum to the third edition. Volume 1: 121-144. World Health Organization. Geneva, Switzerland.
Wommack, K.E., Hill, R.T., Muller, T.A., and R.R. Colwell. 1996. Effects of sunlight on bacteriophage viability
and structure. Applied and Environmental Microbiology 62(4):1336-1341.
Wright, R.C. 1989. The survival patterns of selected faecal bacteria in tropical fresh waters. Epidemiology and
Infection 103(3):603-611.
Wuenschel, M.J., Jugovich, A.R., and J.A. Hare. 2005. Metabolic response of juvenile gray snapper (Lutjanus
griseus) to temperature and salinity: physiological cost of different environments. Journal of Experimental Marine
Biology and Ecology 321:145-154.
Wymer, L., Brenner, K.P., Martinson, J.W., Stutts, W.R., Schaub, S.A., and A.P. Dufour. 2005. The EMPACT
beaches project: results from a study on microbiological monitoring in recreational waters. EPA 600-04/023.
USEPA, Office of Research and Development, National Exposure Research Laboratory.
Yamahara, K.M., Layton, B.A., Santoro, A.E., and A.B. Boehm. 2007. Beach sands along the California Coast are
diffuse sources of fecal bacteria to coastal waters. Environmental Science and Technology 41: 4515-4521.
Supporting information for beach sands along the California coast are diffuse sources of fecal bacteria to coastal
waters. Environmental Science and Technology Supplemental to 41: 4515-4521, 17 pp.
Yamahara, K.M., Waltera, S.P., and A.B. Boehm. 2009. Growth of enterococci in unaltered, unseeded beach sands
subjected to tidal wetting. Applied and Environmental Microbiology 75:1517-1524
Yampara-Iquise, H., Zheng, G., Jones, J.E., and C.A. Carson. 2008. Use of a Bacteroides thetaiotaomicron-specific
α-1-6, mannanase quantitative PCR to detect human faecal pollution in water. Journal of Applied Microbiology
105:1686-1693.
U.S. Environmental Protection Agency
December 2010 83
Young, T.A., Heidler, J., Matos-Perez, C.R., Sapkota, A. Toler, T., Gibson, K.E., Schwab, K.J., and R.U. Halden.
2008. Ab initio and in situ comparison of caffeine, triclosan, and triclocarbon as indicators of sewage-derived
microbes in surface waters. Environmental Science and Technology 42: 3335-3340.
Yu, C.-P., and K.-H. Chu. 2009. Occurrence of pharmaceuticals and personal care products along the West Prong
Little Pigeon River in east Tennessee, USA. Chemosphere 75:1281-1286.
Zehms, T.T, McDermott, C.M., and G.T. Kleinheinz. 2008. Microbial concentrations in sand and their effect on
beach water in Door County, Wisconsin. Journal of Great Lakes Research 34:524-534.
Zhang, Y., Geisen, S., and C. Gal. 2008. Carbamazepine and diclofenac: removal in wastewater treatment plants and
occurrence in water bodies. Chemosphere 73:1151-1161.
Zmirou, D., Pena, L., Ledrans, M., and A. Letertre. 2003. Risks associated with the microbiological quality of
bodies of fresh and marine water used for recreational purposes: Summary estimates based on published
epidemiological studies. Archives of Environmental Health 58(11): 703-711.
U.S. Environmental Protection Agency
December 2010 A-1
Appendix A
Summary of 2001 Tropical Indicators Workshop
In recognition of the growing body of literature and research on potential limitations of the
continued reliance on fecal indicator bacteria for assessing the microbial quality of recreational
waters in tropical and subtropical regions, on March 1-2, 2001, a group of 18 national and
international experts convened the “Tropical Water Quality Indicator Workshop” in Honolulu,
Hawaii (Fujioka and Byappanahalli 2003). Primary funding for the workshop was provided by
the EPA Office of Water; matching funds were provided by the Department of Health of the
State of Hawaii and by the Water Resources Research Center of the University of Hawaii. Given
the importance and relevance of this workshop to the sections that follow, details of objectives
and goals and outcomes are summarized in detail below. The overall goal of the workshop was
to address issues identified under the “Tropical Indicators” section of the EPA Action Plan for
Beaches and Recreational Waters (USEPA, 1998), which states the following:
Currently recommended fecal indicators may not be suitable for assessing human health
risks in the tropics. Studies have suggested that at tropical locales such as Puerto Rico,
Hawaii, and Guam, E. coli and enterococci can be detected in waters where there is no
apparent warm-blooded animal source of contamination.
Whether or not current indicator bacteria proliferate naturally in soil and water under
tropical conditions must be determined. If so, the range of conditions (such as nutrients,
temperature, pH, and salinity) under which the bacteria proliferate will be characterized
and their geographical boundaries defined. If the phenomenon is widespread under
tropical conditions, additional research will be conducted to modify approaches for
monitoring, or to develop new tropics-specific indicators. Further evaluation of
Clostridium perfringens and other microbial indicators (including coliphages) that do not
flourish naturally in the tropics will be conducted to determine their usefulness as
alternative indicators.
To meet this goal, the workshop had several objectives, including (1) to critically evaluate
published information related to sources, persistence, and multiplication of EPA-approved fecal
indicators (i.e., fecal coliforms, E. coli, and enterococci) in tropical locations and the impact of
such findings on the suitability of existing water quality criteria for these locations and (2) to
critically evaluate the use of alternative water quality indicators in tropical locations. The invited
experts were sent a guidance document, which is included as Appendix D to the workshop
proceedings and report (Fujioka and Byappanahalli 2003). The guidance document included five
questions to help focus the deliberations of the workshop participants. These questions,
reprinted below, are followed in bold text by appropriate consensus-based (i.e., acceptable to at
least 75% of experts) statements from the workshop participants, which are considered to be the
most important products of this workshop:
1. Are there sufficient experimental and monitoring data to conclude that the assumption
used in interpreting water quality standards ([i.e.,] there are no significant environmental
sources of fecal coliforms, E. coli, and enterococci) is not applicable in tropical areas
U.S. Environmental Protection Agency
December 2010 A-2
(Hawaii, Guam, Puerto Rico, south Florida) because these bacteria can be recovered in
high concentrations from ambient environments (water, soil, plants) in these areas?
Soil, sediments, water, and plants may be significant indigenous sources of indicator
bacteria in tropical waters.
2. Are there sufficient experimental and monitoring data to conclude that the EPA criteria
(E. coli, enterococci) used to assess the quality of environmental waters are not reliable in
tropical locales (Hawaii, Guam, Puerto Rico, south Florida) because the selected fecal
bacteria persist in these ambient environments and represent non-fecal contamination?
No consensus-based statement was developed or reported.
3. Are there sufficient experimental and monitoring data to conclude that the EPA
recommended recreational water quality standards are not suitable to assess the hygienic
quality of environmental waters in Hawaii, Guam, Puerto Rico, and south Florida?
The inherent environmental characteristics of the tropics affect the relationships
between indicators of fecal contamination (E. coli, fecal coliforms, enterococci) and
health effects observed in bathers, which may compromise the efficacy of EPA
guidelines.
4. Are there sufficient experimental and monitoring data to conclude that fecal indicator
bacteria (fecal coliforms, E. coli, enterococci) can multiply in tropical environments and
that bacteria from these sources are indicative of lower health risk than those from fecal
sources?
Fecal indicator bacteria (fecal coliforms, E. coli, enterococci) can multiply and
persist in soil, sediment, and water in some tropical/subtropical environments
(Hawaii, Guam, Puerto Rico, south Florida).
5. Are there sufficient experimental and monitoring data to conclude that the proposed
alternative criteria and recreational water quality standards for Hawaii and Puerto Rico
are more useful than the current EPA criteria and standards?
Recreational water quality guidelines for the tropics/subtropics should be
supplemented with additional alternative indicators (C. perfringens, coliphages) for
watershed assessment (or sanitary survey).
Although five of eighteen experts accepted the above statement, they preferred the
following alternate statement: In the absence of a predominant point source
pollution, recreational water quality guidelines for the tropics/subtropics should be
supplemented with additional alternative indicators (C. perfringens, coliphages) for
watershed assessment (or sanitary survey).
Lastly, it is important to emphasize that the focus of the workshop was to evaluate the problems
associated with appropriate water quality standards in tropical locations, as described and
reported by experts/scientists from Hawaii, Guam, Puerto Rico, and south Florida. Collectively,
the consensus statements concur with the previous reports by these experts (e.g., Byappanahalli
and Fujioka, 1998) that due to environmental sources of fecal indicator bacteria in their

U.S. Environmental Protection Agency
December 2010 A-3
respective tropical locations, reliable interpretations of the current recreational water quality
standards in tropical locations may be compromised. Thus, the consensus statements represent
agreements in understanding how environmental factors can control the fate of indicator
microorganisms and how these factors can affect the development and use of water quality
standards in tropical environments. The workshop participants also identified several overall
recommendations and research needs.
U.S. Environmental Protection Agency
December 2010 B-1
Appendix B
Literature Search Strategy and Results—Review of Fecal Indicator
Organism Behavior in Ambient Waters and Alternative Indicators for
Tropical Regions
The literature search strategy conducted in late 2007 consisted of a number of combined
approaches. Search terms and a synopsis of information needed were given to a
professional librarian to search the online DIALOG databases. To supplement the
DIALOG searches, individual authors used free search engines on the internet to find
articles pertaining to specific information needed. Experts that participated in EPA’s
Experts Scientific Workshop on Critical Research Needs for the Development of New or
Revised Recreational Water Quality Criteria2 were contacted by email and requested to
contribute literature they felt was important. The titles of literature cited in specific
reports, books, review articles, and conference proceedings were evaluated for relevance.
B.1 Initial Literature Search Strategy Conducted by Professional Librarian
Selection of DIALOG data base files used for this search:
File 155:MEDLINE(R) 1950-2007/Nov 30
(c) format only 2007 Dialog
File 266:FEDRIP 2007/Sep
Comp & dist by NTIS, Intl Copyright All Rights Res
File 144:Pascal 1973-2007/Nov W3
(c) 2007 INIST/CNRS
File 110:WasteInfo 1974-2002/Jul
(c) 2002 AEA Techn Env.
File 245:WATERNET(TM) 1971-2007Jul
(c) 2007 American Water Works Association
File 117:Water Resources Abstracts 1966-2007/Aug
(c) 2007 CSA.
File 5:Biosis Previews(R) 1926-2007/Nov W4
(c) 2007 The Thomson Corporation
File 40:Enviroline(R) 1975-2007/Oct
(c) 2007 Congressional Information Service
File 143:Biol. & Agric. Index 1983-2007/Oct
(c) 2007 The HW Wilson Co
File 6:NTIS 1964-2007/Dec W3
(c) 2007 NTIS, Intl Cpyrght All Rights Res
File 72:EMBASE 1993-2007/Dec 05
(c) 2007 Elsevier B.V.
Search strategies used for this search: #1: ANY OF THE SEARCH TERMS COMBINED WITH ANY OF THE AUTHORS: 1985-
PRESENT
2 Report from this workshop: http://www.epa.gov/waterscience/criteria/recreation/

U.S. Environmental Protection Agency
December 2010 B-2
S1 2045 (FECAL OR FAECAL)()INDICATOR? ?
S2 334552 TROPICAL OR SUBTROPICAL OR RESUSPENSION OR REGROWTH OR
INDIGENOUS
S3 50 S1 (5N) S2
S4 19961011 PY=1920:1984
S5 47 S3 NOT S4
S6 59 (DIFFERENCE? ? OR COMPAR? OR CONTRAST?) AND TEMPERATE
(S) -
TROPICAL AND WATER()QUALITY
S7 2619 BACTERIA? AND INDICATOR? ? AND (SAND OR SANDS OR
SEDIMENT? OR
BEACH OR SHORE)
S8 21488 ENVIRONMENTAL? AND (ENTEROCOCCI OR (E OR
ESCHERICHIA)()COLI)
S9 26837 AU=(FUJIOKA? OR BYAPPANAHALLI? OR ISHII S? OR ISOBE K?
OR -
ROSE J? OR SOLO-GABRIELE H? OR TORANZOS G? OR TIEDJE J?
OR
HAZEN T?)
S10 4572 AU=(CALDERON R? OR SADOWSKY M? OR GENTHNER F? OR
AKAZAWA E?
OR GERBA C? OR SLIFKO T? OR YATES M? OR MOE C? OR JAY
J?)
S11 5776949 DISPERSAL OR PH OR ALKALINITY OR TEMPERATURE OR
RAINFALL OR
SALINITY OR RUNOFF OR TURBIDITY OR NUTRIENTS
S12 422744 ORGANICS OR ORGANIC()(FOAM OR FOAMS) OR
SUSPENDED()(SOLID -
OR SOLIDS) OR WATER()QUALITY OR LIGHT (S) (INTENSITY OR
DURATION)
S13 623176 DEPTH OR STRATIFICATION OR AQUATIC()PLANTS OR BIOFILM?
? OR
PREDATION OR BIOLOGICAL()COMMUNIT? (S) (WATER()COLUMN
OR
PLANTS OR EPIPHYTIC)
S14 29926 (TOTAL OR FECAL OR FAECAL)()COLIFORMS OR
CLOSTRIDIUM()PERF-
RINGENS OR (SULFITE OR SULPHITE)()REDUCING()CLOSTRIDIA
OR
BIFIDOBATERI?
S15 52396 RHODOCOCCUS()COPROPHILUS OR BACTEROID? OR
HUMAN()ENTERIC()-
VIRUS? OR (SOMATIC OR F()SPECIFIC)()COLIPHAGE? ? OR
PLASTICS()GREASE
S16 115764 (FECAL OR FAECAL)()(STEROID? ? OR STEROL? ? OR STANONE?
?)
OR CAFFEINE OR DETERGENTS
S17 21427 S6 OR S7 OR S8) NOT S4
S19 422 S5 OR S17) AND (S9 OR S10)
S20 253 RD S19 (unique items; deduped)
#2: (Fecal set within 5 words of Tropical Set) OR Difference set: 1985-present
S1 2045 (FECAL OR FAECAL)()INDICATOR? ?
S2 334552 TROPICAL OR SUBTROPICAL OR RESUSPENSION OR REGROWTH OR

U.S. Environmental Protection Agency
December 2010 B-3
INDIGENOUS
S3 50 S1 (5N) S2
S4 19961011 PY=1920:1984
S5 47 S3 NOT S4
S6 59 (DIFFERENCE? ? OR COMPAR? OR CONTRAST?) AND TEMPERATE
(S) -
TROPICAL AND WATER()QUALITY
S27 56 S6 NOT S4
S28 89 (S27 OR S5) NOT (S9 OR S10)
S29 51 RD S28 (unique items, deduped)
#3: Bacteria set OR (Fecal set in same field as any term in Sets 11, 12, 13, 14, 15 OR
16): 2002-present
S7 2619 BACTERIA? AND INDICATOR? ? AND (SAND OR SANDS OR
SEDIMENT? OR
BEACH OR SHORE)
S1 2045 (FECAL OR FAECAL)()INDICATOR? ?
S11 5776949 DISPERSAL OR PH OR ALKALINITY OR TEMPERATURE OR
RAINFALL OR
SALINITY OR RUNOFF OR TURBIDITY OR NUTRIENTS
S12 422744 ORGANICS OR ORGANIC()(FOAM OR FOAMS) OR
SUSPENDED()(SOLID -
OR SOLIDS) OR WATER()QUALITY OR LIGHT (S) (INTENSITY OR
DURATION)
S13 623176 DEPTH OR STRATIFICATION OR AQUATIC()PLANTS OR BIOFILM?
? OR
PREDATION OR BIOLOGICAL()COMMUNIT? (S) (WATER()COLUMN
OR PLA-
NTS OR EPIPHYTIC)
S14 29926 (TOTAL OR FECAL OR FAECAL)()COLIFORMS OR
CLOSTRIDIUM()PERF-
RINGENS OR (SULFITE OR SULPHITE)()REDUCING()CLOSTRIDIA
OR
BIFIDOBATERI?
S15 52396 RHODOCOCCUS()COPROPHILUS OR BACTEROID? OR
HUMAN()ENTERIC()-
VIRUS? OR (SOMATIC OR F()SPECIFIC)()COLIPHAGE? ? OR
PLASTICS()GREASE
S16 115764 (FECAL OR FAECAL)()(STEROID? ? OR STEROL? ? OR STANONE?
?)
OR CAFFEINE OR DETERGENTS
S22 1205 S1 (S) (S11 OR S12 OR S13 OR S14 OR S15 OR S16)
S33 2814 (S7 OR S22) NOT (S4 OR S19 OR S23 OR S9 OR S10 OR S6 OR
S5)
S34 1593 RD S33 (unique items, deduped)
S39 584 S34/2002:2007
Dates: 1985-present [2002-present is more crucial]
Language: No restrictions
Descriptions of these databases are available at http://library.dialog.com/bluesheets/.
Retrieve: Titles and year

U.S. Environmental Protection Agency
December 2010 B-4
Format: MS Word
Additional information: Interested in international and domestic journals and government
reports.
Search terms:
Tropical fecal indicator*
Sub[-]tropical indicator*
Difference* temperate tropical water quality
Bacteria* indicator* sand
Bacteria* indicator* sediment*
Environmental E. coli
Environmental enterococci
Fecal indicator* AND
Dispersal
pH
Alkalinity
Temperature
Light [duration, intensity]
Rainfall
Salinity
Runoff
Suspended Solids
Turbidity
Nutrients
Organics
Organic foams
Water Quality
Biological community in water column
Water Depth
Stratification
Depth
Mixing (wind, waves, etc.)
Resuspension from sediments and sand
Regrowth
Presence of aquatic plants – epiphytic bacterial communities on plants
biofilms
Predation
fecal indicator* AND
Total coliforms
Fecal coliforms
Clostridium perfringens
sulfite-reducing Clostridia
Bifidobacterium
Rhodococcus coprophilus
Bacteroid*
U.S. Environmental Protection Agency
December 2010 B-5
Human enteric viruses
Somatic coliphages
F-specific coliphages
Bacteroide* phage
Sanitary plastics grease
Fecal steroids (sterols, stanols, stanones)
Caffeine
Detergents
Rainfall
Turbidity
Fecal indicator* resuspension
Fecal indicator* regrowth
Fecal indicator indigenous
Authors:
R. Fujioka
M. Byappanahalli
S. Ishii
K. Isobe
J.B. Rose
H. Solo-Gabriele
G.A. Toranzos
J. Tiedje
T.C. Hazen
R.L. Calderon
M.J. Sadowsky
F. Genthner
E. Akazawa
C. Gerba
T. Slifko
M. Yates
C. Moe
J.A. Jay
Specific literature requested by EPA:
1) Yamahara, K.M., Layton, B.A., Santoro, A.E., Boehm, A.B. 2007. Beach sands
along the California Coast are diffuse sources of fecal bacteria to coastal waters.
Environ. Sci. Technol. 41: 4515-4521. Supporting information for beach sands
along the California coast are diffuse sources of fecal bacteria to coastal waters.
Environ. Sci. Technol. Supplemental to 41: 4515-4521, 17 pp.
2) National Research Council (NRC). 2004. Indicators for waterborne pathogens.
National Academies Press. Washington, DC. 315 pp.
3) USEPA. 2007. Report of the experts scientific workshop on critical research
needs for the development of new or revised recreational water quality criteria.
EPA 823-R-07-006. Available online at
http://www.epa.gov/waterscience/criteria/recreation.

U.S. Environmental Protection Agency
December 2010 B-6
Partial list of specific issues and questions issues sought to be addressed from this
literature search:
What does the available data say in regards to indicator behavior in ambient
waters?
What differences exist in currently used fecal indicators when they are applied in
tropical (and possibly sub-tropical) locations versus temperate locations?
discuss and evaluate the extent to which indicator organisms and other
accompanying organisms derived from fecal sources are impacted by temperature
regime (e.g., temperate vs. tropical).
potential alternative indicators that may provide more meaningful results in
tropical environments if the current indicators are determined to be limited in
application in a tropical environment.
Examine indicator behavior in ambient water, sand, and sediments associated with
water bodies, and other aquatic micro environments, such as plant life and
biofilms [cover indicator regrowth as well as indigenous populations]
o Separate out fecal origin and established indigenous populations
1. How do potential regrowth and establishment (or extra-enteric sources) of
indicator organisms in the environment affect assessment of risk to Human
health? Are the documented cases where this has happened?
2. How does that phenomenon effect compliance? (TMDLs and compliance—could
be spending billions on TMDLs that are not required)
3. What are the differences in performance of currently used indicators in tropical
waters? Compare data for currently used versus the ones that are proposed (e.g.,
enterococcus versus Clostridium perfrignens)
4. What factors can affect both the organism and its recovery and enumeration?
5. Do data support a more appropriate indicator in these situations (potential for
regrowth and establishment) than the indicators currently recommended by EPA?
6. What differences exist in fecal indicators when applied in tropical and subtropical
areas?
Based on the review of the initial results of the literature search, the co-lead writers
reviewed a 68-page document of titles (approximately 700 titles, including many
duplicates) for immediate relevance or irrelevance (i.e., article would not be ordered).
Those found to be immediately relevant (about 150 titles) were compared to ICF’s and
CEC’s in-house library of documents and those already ordered during the literature
search and retrieval processes for the associated white papers “Review of Published
Studies to Characterize Relative Risks from Different Sources of Fecal Contamination in
Recreational Water” (USEPA, 2009a) and “Review of Zoonotic Pathogens in Ambient
Waters” (USEPA, 2009b). For those that were not immediately identified as relevant or
irrelevant, an abstract was requested (if available). This resulted in the review of about
30 abstracts, of which 7 articles were assessed to determine whether they were already
obtained or ordered elsewhere. The results of this literature review were then combined
into a library with the relevant citations from a reverse literature citation search on

U.S. Environmental Protection Agency
December 2010 B-7
several of the key studies (e.g., National Research Council’s 2004 report Indicators for
Waterborne Pathogens report; see more below). Lastly, as the white paper authors began
to review the literature, several successive literature requests, resulting in about 40
additional articles, were sent to be checked against the library and ordered if not already
possessed or ordered elsewhere.
B.2 Summary of Literature Search Results
This process resulted in a total order of 371 documents (primarily peer reviewed
scientific articles), of which a total of 285 (77 percent) were received during the
expedited writing process, not all of which could be reviewed. There are many more
papers in the peer-reviewed literature, and this by no means represents all of them. Of
the articles reviewed, 174 citations were included in the white paper.
B.3 Supplemental Literature Search Strategy
In addition to the literature search conducted by the ICF professional librarian, several
other resources were consulted. The flowing experts in the field were contacted directly
by email and asked to suggest references:
Nicholas Ashbolt, USEPA
Thomas Atherholt, New Jersey Department of Environmental Protection
Michael Beach, Centers for Disease Control and Prevention
Bart Bibler, Florida Department of Health
Alexandria Boehm, Stanford University, California
Rebecca Calderon, USEPA
Jennifer Clancy, Clancy Environmental Consultants
Jack Colford, University of California, Berkeley
Elizabeth Doyle, USEPA
Alfred Dufour, USEPA
Lee Dunbar, Connecticut Department of Environmental Protection
Lora Fleming, University of Miami School of Medicine and Rosenstiel School of Marine
and Atmospheric Sciences, Florida
Charles Hagedorn, Virginia Tech
Joel Hansel, USEPA
Lawrence Honeybourne, Orange County Health Care Agency, Santa Ana, California
Donna Francy, U.S. Geological Survey
Roger Fujioka, University of Hawaii, Manoa
Toni Glymph, Wisconsin Department of Natural Resources
Mark Gold, Heal the Bay, California
Paul Hunter, University of East Anglia, U.K.
Dennis Juranek, Centers for Disease Control and Prevention (retired)
David Kay, University of Wales, U.K.
Sharon Kluender, Wisconsin State Laboratory of Hygiene
Erin Lipp, University of Georgia
Graham McBride, National Institute of Water and Atmospheric Research, New Zealand
U.S. Environmental Protection Agency
December 2010 B-8
Charles McGee, Orange County Sanitation District, California
Harvey Minnigh, RCAP Solutions Inc.
Samuel Myoda, Delaware Department of Natural Resources
Charles Noss, USEPA
Robin Oshiro, USEPA
James Pendergast, USEPA
Linwood Pendleton, University of California, Los Angeles
Mark Pfister, Lake County Health Department, Illinois
John Ravenscroft, USEPA
Graciella Ramirez-Toro, CECIA-IAUPR
Stephen Schaub, USEPA
Mark Sobsey, University of North Carolina, Chapel Hill
Jeffrey Soller, Soller Environmental, California
Michael Tate, Kansas Department of Health and Environment
Peter Teunis, RIVM (National Institute of Public Health and the Environment),
Netherlands
Gary Toranzos, University of Puerto Rico, Rio Piedras
Timothy Wade, USEPA
John Wathen, USEPA
Stephen Weisberg, Southern California Coastal Water Research Project
David Whiting, Florida Department of Environmental Protection
Richard Zepp, USEPA
In addition to contacting experts in the field, specific reports were obtained and the titles
of the references cited in the reports were reviewed for relevance and ordered if not
already obtain or ordered elsewhere.
National Research Council (NRC). 2004. Indicators for waterborne pathogens.
National Academies Press. Washington, DC. 315 pp.
USEPA. 2007. Report of the experts scientific workshop on critical research
needs for the development of new or revised recreational water quality criteria.
EPA 823-R-07-006. Available online at
http://www.epa.gov/waterscience/criteria/recreation
Fujioka, R.S, and Byappanahalli, M.N. (eds.) 2003. Proceedings and report:
Tropical Water Quality Indicator Workshop. Special Report SR-2004-01.
University of Hawaii at Manoa, Water Resources Research Center. Available
online at http://www.wrrc.hawaii.edu/tropindworkshop.html
References cited by the Natural Resources Defense Council reviewers of the EPA
Critical Path Science Plan
Boehm et al. 2008. A sea change ahead for recreational water quality criteria
(peer review in progress).

U.S. Environmental Protection Agency
December 2010 B-9
In addition, Clancy Environmental Consultants, Inc., ICF International, Soller
Environmental, WaltJay Consulting, and EPA’s Health and Ecological Criteria Division
all maintain extensive literature databases and reference lists from previously completed
projects. All of those in house resources were also sources of literature.

U.S. Environmental Protection Agency
December 2010 C-1
Appendix C
Summary Tables of Findings on the Influence Individual Parameters have on Extra-
Enteric Occurrence and Survival of Fecal Indicator Organisms

U.S. Environmental Protection Agency
December 2010 C-2
Table 9. Summary of potential physical parameters that may affect the behavior of fecal indicators in different geographic regions
Physical Parameters Study/Year
Geographic Region
Indicator and Pathogenic Microorganism(s)
Temperature
Alkan et al. 1995 United Kingdom E. coli, enterococci
Anderson et al. 2005 Tropical E. coli, enterococci, fecal coliforms
Byappanahalli et al. 2006 Great Lakes E. coli
Carillo et al. 1985 Puerto Rico E. coli, Bifidobacterium
Craig et al. 2004 Australia E. coli
He et al. 2007 Southern California
E. coli, enterococci, total coliforms, fecal coliforms
Ishii et al. 2007 Lake Superior, Minnesota
E. coli
Isobe et al. 2004 Malaysia and Vietnam
Enterococci, fecal coliforms
Lipp et al. 2001 Southern California
Enterococci, fecal coliforms, Clostridium perfringens
Noble et al. 2004 Southern California
E. coli, enterococci, total coliforms, F+ coliphage
Okabe and Shimazu 2007
Japan Bacteroides-Prevotella, total coliforms, fecal coliforms
Rhodes and Kator 1988 Chesapeake Bay E. coli, Salmonella spp.
Seurinck et al. 2006 Belgium E. coli, fecal streptococci, Bacteroides
Shibata et al. 2004 Florida E. coli, enterococci, fecal coliforms, total coliforms, C. perfringens
Sinton et al. 2007 New Zeeland E. coli, Campylobacter jejuni, S. enterica
Šolić and Krstuvolic 1992 Croatia Fecal coliforms
Wait and Sobsey 2001 Coastal North Carolina
E. coli, Salmonella typhi, Shigella sonnei, poliovirus type 1, parvovirus
Wang and Doyle 1998 Georgia E. coli O157:H7
Whitman and Nevers 2003
Great Lakes E. coli
Whitman et al. 2004 Great Lakes E. coli

U.S. Environmental Protection Agency
December 2010 C-3
Physical Parameters Study/Year
Geographic Region
Indicator and Pathogenic Microorganism(s)
Rainfall Ackerman and Weisberg 2003
Southern California
Fecal coliforms
Ashbolt and Bruno 2003 Australia Thermotolerant coliforms, enterococci
Boehm et al. 2002 Southern California
Total coliforms
Bonilla et al. 2007 South Florida Somatic coliphages, enterococci, E. coli, fecal coliforms
Brion et al. 2002 Kentucky F-specific RNA coliphage
Characklis et al. 2005 North Carolina E. coli, C. perfringens, fecal coliforms, enterococci, total coliphages
Craig et al. 2002 Adelaide, Australia Fecal coliforms
Curriero et al. 2001 United States E. coli, Giardia, Cryptosporidium
Dwight et al. 2002 Southern California
Total coliforms
Evanson and Ambrose 2006
Southern California
E. coli, enterococci, total coliforms
Ferguson et al. 1996 Australia Fecal coliforms, enterococci, C. perfringens
Jeng et al. 2005 Lake Pontchartrain, Louisiana
E. coli, fecal coliforms
Kistemann et al. 2002 Germany E. coli, coliforms, enterococci, C. perfringens
Krometis et al. 2007 North Carolina E. coli, fecal coliforms, enterococci, C. perfringens
LeFevre and Lewis 2003 New Zeeland Enterococci
Lipp et al. 2001 Southern California
Enterococci, fecal coliforms, C. perfringens
Mallin et al. 2001 North Carolina Fecal coliforms
Paul et al. 1997 Hawaii Coliphages
SEPA 2001 Scotland Total and fecal coliforms
Shibata et al. 2004 Florida E. coli, enterococci, fecal coliforms, total coliforms, C. perfringens
Seurinck et al. 2006 Belgium E. coli, fecal streptococci, Bacteroides
Tunnicliff and Brickler 1984
Grand Canyon Fecal coliforms
Light (duration, Alkan et al. 1995 United Kingdom E. coli, enterococci
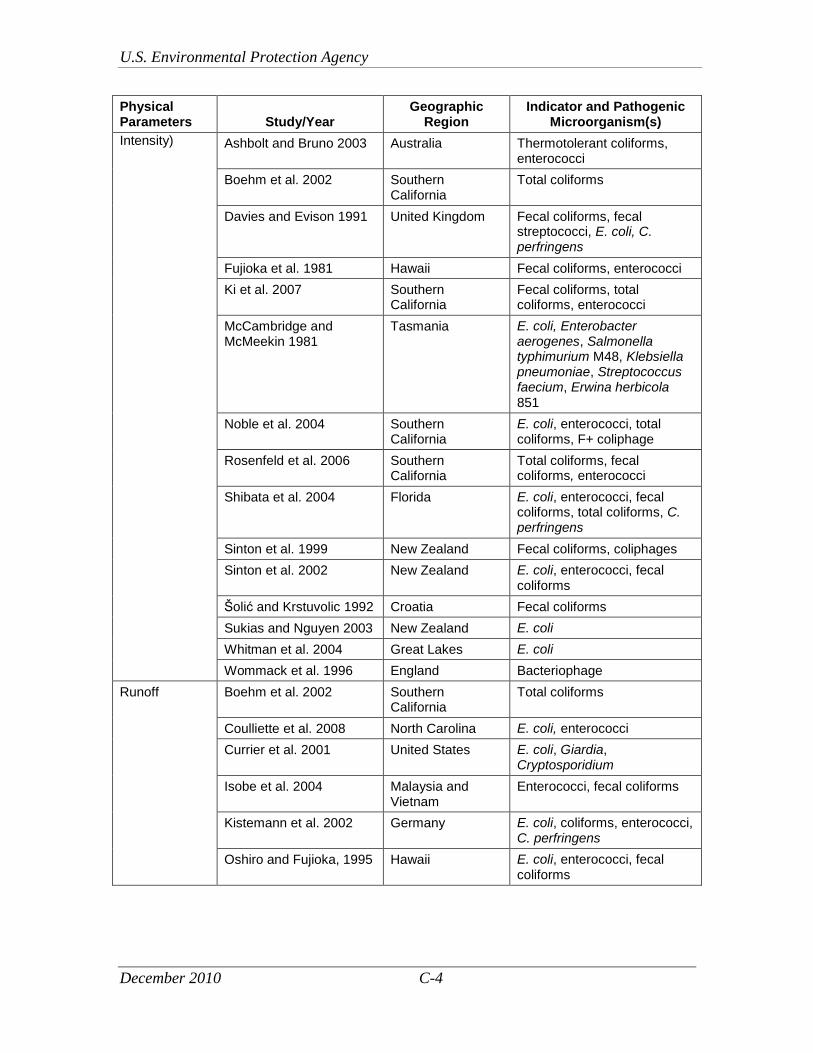
U.S. Environmental Protection Agency
December 2010 C-4
Physical Parameters Study/Year
Geographic Region
Indicator and Pathogenic Microorganism(s)
Intensity) Ashbolt and Bruno 2003 Australia Thermotolerant coliforms, enterococci
Boehm et al. 2002 Southern California
Total coliforms
Davies and Evison 1991 United Kingdom Fecal coliforms, fecal streptococci, E. coli, C. perfringens
Fujioka et al. 1981 Hawaii Fecal coliforms, enterococci
Ki et al. 2007 Southern California
Fecal coliforms, total coliforms, enterococci
McCambridge and McMeekin 1981
Tasmania E. coli, Enterobacter aerogenes, Salmonella typhimurium M48, Klebsiella pneumoniae, Streptococcus faecium, Erwina herbicola 851
Noble et al. 2004 Southern California
E. coli, enterococci, total coliforms, F+ coliphage
Rosenfeld et al. 2006 Southern California
Total coliforms, fecal coliforms, enterococci
Shibata et al. 2004 Florida E. coli, enterococci, fecal coliforms, total coliforms, C. perfringens
Sinton et al. 1999 New Zealand Fecal coliforms, coliphages
Sinton et al. 2002 New Zealand E. coli, enterococci, fecal coliforms
Šolić and Krstuvolic 1992 Croatia Fecal coliforms
Sukias and Nguyen 2003 New Zealand E. coli
Whitman et al. 2004 Great Lakes E. coli
Wommack et al. 1996 England Bacteriophage
Runoff Boehm et al. 2002 Southern California
Total coliforms
Coulliette et al. 2008 North Carolina E. coli, enterococci
Currier et al. 2001 United States E. coli, Giardia, Cryptosporidium
Isobe et al. 2004 Malaysia and Vietnam
Enterococci, fecal coliforms
Kistemann et al. 2002 Germany E. coli, coliforms, enterococci, C. perfringens
Oshiro and Fujioka, 1995 Hawaii E. coli, enterococci, fecal coliforms

U.S. Environmental Protection Agency
December 2010 C-5
Physical Parameters Study/Year
Geographic Region
Indicator and Pathogenic Microorganism(s)
Suspended solids
Characklis et al. 2005 North Carolina E. coli, enterococci, fecal coliforms, C. perfringens
Jeng et al. 2005 Lake Pontchartrain, LA
E. coli, fecal coliforms
Krometis et al. 2007 North Carolina E. coli, C. perfringens
Noble et al. 2004 Southern California
E. coli, enterococci, total coliforms, F+ coliphage
Ramirez 2000 Puerto Rico E. coli, enterococci, total coliforms, fecal coliforms
Turbidity Alkan et al. 1995 United Kingdom E. coli, enterococci
He et al. 2007 Southern California
E. coli, enterococci, total coliforms, fecal coliforms
Jeong et al. 2005 Southern California
E. coli, fecal coliforms, enterococci
Kistemann 2002 Germany E. coli, coliforms, enterococci, C. perfringens
Mallin et al. 2000 North Carolina E. coli, fecal coliforms
Shibata et al. 2004 Florida E. coli, enterococci, fecal coliforms, total coliforms, C. perfringens
Tunnicliff and Brickler 1984
Grand Canyon Fecal coliforms
Water depth Kay et al. 1994 United Kingdom Enterococci
Paul et al. 1995 Florida Fecal coliforms, enterococci, C. perfringens
Whitman and Nevers 2003
Lake Michigan, Illinois
E. coli
Stratification Craig et al. 2003 Australia E. coli, enterococci, coliphage, Salmonella
Mixing (wind, waves, tides)
Alkan et al. 1995 United Kingdom E. coli, enterococci
An et al. 2002 Oklahoma E. coli
Ashbolt and Bruno 2003 Australia Thermotolerant coliforms, enterococci
Boehm et al. 2002 Southern California
Total coliforms
Grant et al. 2005 Southern California
E. coli, enterococci, total coliforms
Jeong et al. 2005 Southern California
Total coliforms, E. coli, enterococci
Ki et al. 2007 Southern California
E. coli, enterococci, fecal coliforms, total coliforms
LeFevre and Lewis 2003 New Zeeland Enterococci
Mill et al. 2006 Australia E. coli, enterococci, total coliforms

U.S. Environmental Protection Agency
December 2010 C-6
Physical Parameters Study/Year
Geographic Region
Indicator and Pathogenic Microorganism(s)
Oshiro and Fujioka 1995 Hawaii E. coli, fecal coliforms, enterococci
Rosenfeld et al. 2006 Southern California
E. coli, enterococci, fecal coliforms
Santoro and Boehm 2007 Southern California
Total coliforms, fecal coliforms, Bacteroides
Shiaris 1987 Massachusetts Fecal coliforms, enterococci, Vibrio
Shibata et al. 2004 Florida E. coli, enterococci, fecal coliforms, total coliforms, C. perfringens
Solo-Gabriele et al. 2000 Florida E. coli
Whitman and Nevers 2003
Great Lakes E. coli
Yamahara et al. 2007 California coast Enterococci

U.S. Environmental Protection Agency
December 2010 C-7
Table 10. Summary of potential chemical parameters that may affect the behavior of fecal indicators in different geographic regions
Chemical Parameters Study/Year
Geographic Region
Indicator and Pathogenic Microorganism(s)
Resuspension from sediments and sands
LaLiberte and Grimes 1982
Minnesota E. coli
LeFevre and Lewis 2003 New Zealand Enterococci
Lipp et al. 2001 Florida Fecal coliforms, enterococci, C. perfringens, coliphages
Oshiro and Fujioka 1995 Hawaii E. coli, enterococci, fecal coliforms
Shiaris et al. 1987 Massachusetts Fecal coliforms, enterococci, Vibrio
pH Carillo et al. 1985 Puerto Rico E. coli, Bifidobacterium
He et al. 2007 Southern California
E. coli, enterococci, total coliforms, fecal coliforms
Kistemann 2002 Germany E. coli, coliforms, enterococci, C. perfringens
Parker and Mee 1982 Australia Fecal coliforms
Šolić and Krstulović 1992 Croatia Fecal coliforms
Alkalinity Carillo et al. 1985 Puerto Rico E. coli, Bifidobacterium
Salinity Anderson et al. 2005 Tropical E. coli, enterococci, fecal coliforms
Bernhard et al. 2003 Oregon 16s ribosomal DNA markers
Bordalo et al. 2002 Thailand Enterococci, fecal coliforms
Davies et al. 1995 Sydney, Australia Fecal coliforms, fecal streptococci, C. perfringens
Evanson and Ambrose 2006
Southern California
E. coli, total coliforms, enterococci
Fujioka 1981 Hawaii Fecal coliforms, enterococci
Harwood 2004 Florida Fecal coliforms, enterococci
He et al. 2007 Southern California
E. coli, enterococci, total coliforms, fecal coliforms
Lipp et al. 2001 Southern California
Enterococci, fecal coliforms, C. perfringens
Jeong et al. 2005 Southern California
E. coli, enterococci, fecal coliforms
Mallin et al. 2000 North Carolina E. coli, fecal coliforms
Okabe and Shimazu 2007
Japan Bacteroides-Prevotella, total coliforms, fecal coliforms
Sinton et al. 2002 New Zealand E. coli, enterococci, fecal coliforms
Šolić and Krstulović 1992 Croatia Fecal coliforms
Nutrients Alm et al. 2006 Great Lakes E. coli
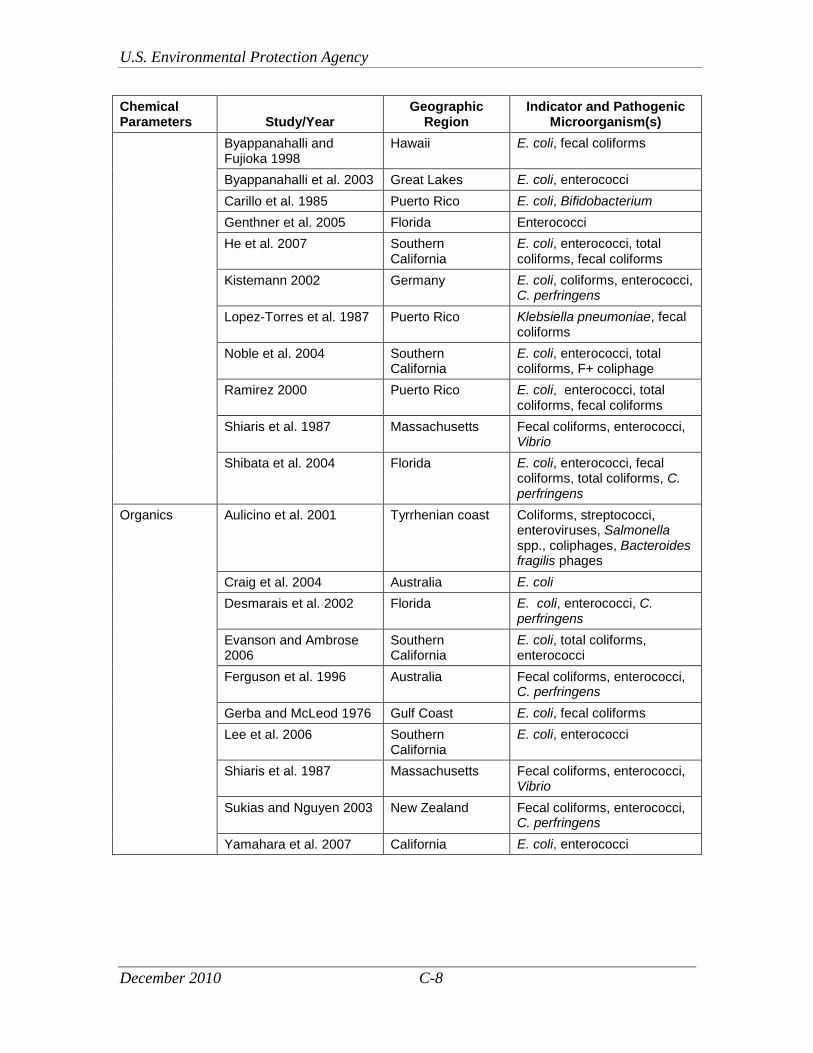
U.S. Environmental Protection Agency
December 2010 C-8
Chemical Parameters Study/Year
Geographic Region
Indicator and Pathogenic Microorganism(s)
Byappanahalli and Fujioka 1998
Hawaii E. coli, fecal coliforms
Byappanahalli et al. 2003 Great Lakes E. coli, enterococci
Carillo et al. 1985 Puerto Rico E. coli, Bifidobacterium
Genthner et al. 2005 Florida Enterococci
He et al. 2007 Southern California
E. coli, enterococci, total coliforms, fecal coliforms
Kistemann 2002 Germany E. coli, coliforms, enterococci, C. perfringens
Lopez-Torres et al. 1987 Puerto Rico Klebsiella pneumoniae, fecal coliforms
Noble et al. 2004 Southern California
E. coli, enterococci, total coliforms, F+ coliphage
Ramirez 2000 Puerto Rico E. coli, enterococci, total coliforms, fecal coliforms
Shiaris et al. 1987 Massachusetts Fecal coliforms, enterococci, Vibrio
Shibata et al. 2004 Florida E. coli, enterococci, fecal coliforms, total coliforms, C. perfringens
Organics Aulicino et al. 2001 Tyrrhenian coast Coliforms, streptococci, enteroviruses, Salmonella spp., coliphages, Bacteroides fragilis phages
Craig et al. 2004 Australia E. coli
Desmarais et al. 2002 Florida E. coli, enterococci, C. perfringens
Evanson and Ambrose 2006
Southern California
E. coli, total coliforms, enterococci
Ferguson et al. 1996 Australia Fecal coliforms, enterococci, C. perfringens
Gerba and McLeod 1976 Gulf Coast E. coli, fecal coliforms
Lee et al. 2006 Southern California
E. coli, enterococci
Shiaris et al. 1987 Massachusetts Fecal coliforms, enterococci, Vibrio
Sukias and Nguyen 2003 New Zealand Fecal coliforms, enterococci, C. perfringens
Yamahara et al. 2007 California E. coli, enterococci
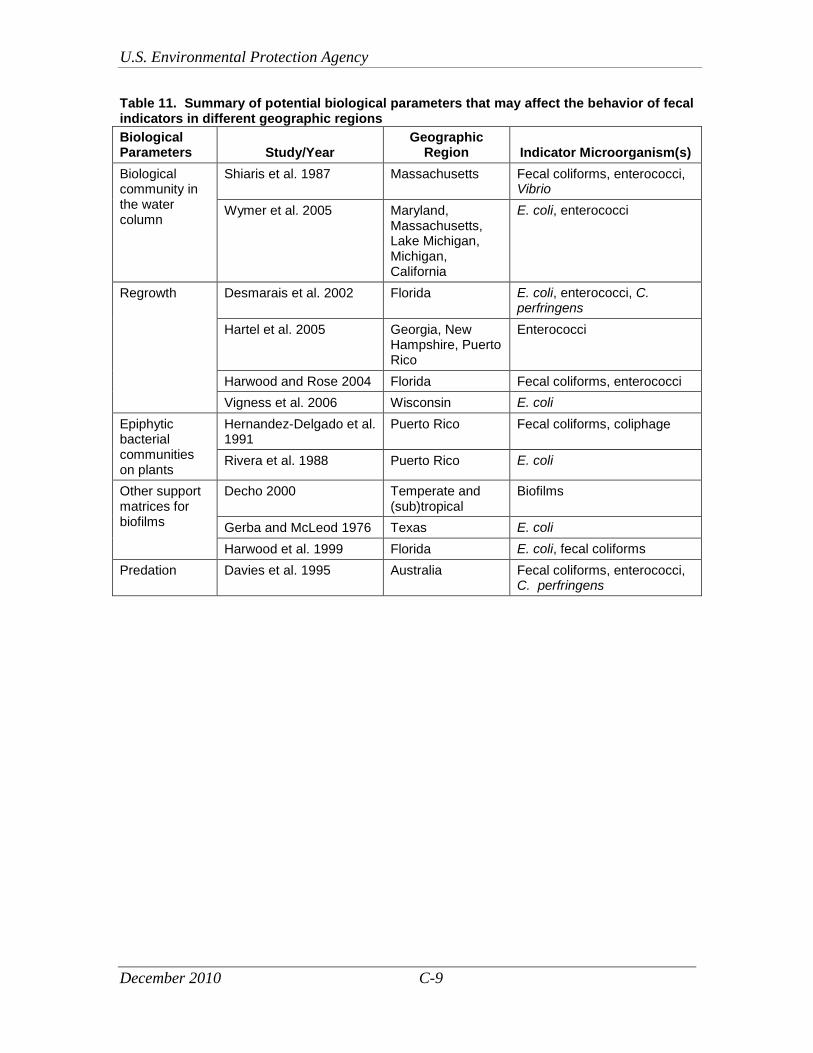
U.S. Environmental Protection Agency
December 2010 C-9
Table 11. Summary of potential biological parameters that may affect the behavior of fecal indicators in different geographic regions
Biological Parameters Study/Year
Geographic Region Indicator Microorganism(s)
Biological community in the water column
Shiaris et al. 1987 Massachusetts Fecal coliforms, enterococci, Vibrio
Wymer et al. 2005 Maryland, Massachusetts, Lake Michigan, Michigan, California
E. coli, enterococci
Regrowth Desmarais et al. 2002 Florida E. coli, enterococci, C. perfringens
Hartel et al. 2005 Georgia, New Hampshire, Puerto Rico
Enterococci
Harwood and Rose 2004 Florida Fecal coliforms, enterococci
Vigness et al. 2006 Wisconsin E. coli
Epiphytic bacterial communities on plants
Hernandez-Delgado et al. 1991
Puerto Rico Fecal coliforms, coliphage
Rivera et al. 1988 Puerto Rico E. coli
Other support matrices for biofilms
Decho 2000 Temperate and (sub)tropical
Biofilms
Gerba and McLeod 1976 Texas E. coli
Harwood et al. 1999 Florida E. coli, fecal coliforms
Predation Davies et al. 1995 Australia Fecal coliforms, enterococci, C. perfringens
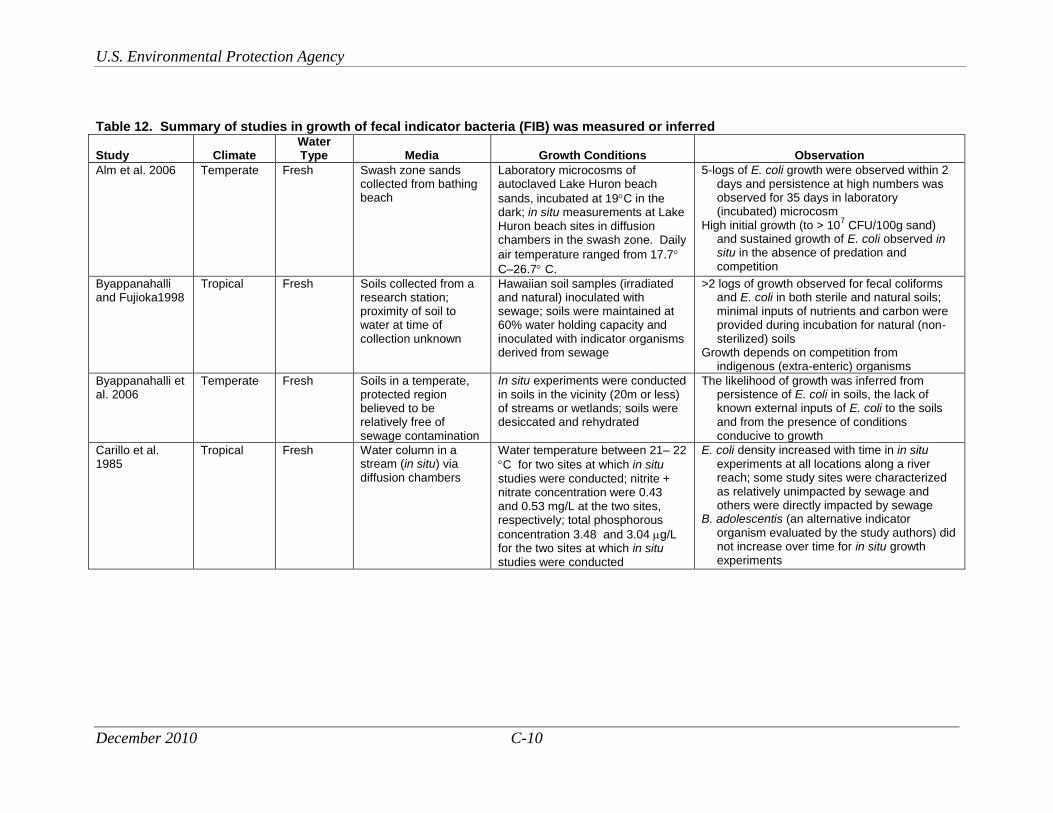
U.S. Environmental Protection Agency
December 2010 C-10
Table 12. Summary of studies in growth of fecal indicator bacteria (FIB) was measured or inferred
Study Climate Water Type Media Growth Conditions Observation
Alm et al. 2006 Temperate Fresh Swash zone sands collected from bathing beach
Laboratory microcosms of autoclaved Lake Huron beach
sands, incubated at 19C in the dark; in situ measurements at Lake Huron beach sites in diffusion chambers in the swash zone. Daily
air temperature ranged from 17.7
C–26.7 C.
5-logs of E. coli growth were observed within 2 days and persistence at high numbers was observed for 35 days in laboratory (incubated) microcosm
High initial growth (to > 107 CFU/100g sand)
and sustained growth of E. coli observed in situ in the absence of predation and competition
Byappanahalli and Fujioka1998
Tropical Fresh Soils collected from a research station; proximity of soil to water at time of collection unknown
Hawaiian soil samples (irradiated and natural) inoculated with sewage; soils were maintained at 60% water holding capacity and inoculated with indicator organisms derived from sewage
>2 logs of growth observed for fecal coliforms and E. coli in both sterile and natural soils; minimal inputs of nutrients and carbon were provided during incubation for natural (non-sterilized) soils
Growth depends on competition from indigenous (extra-enteric) organisms
Byappanahalli et al. 2006
Temperate Fresh Soils in a temperate, protected region believed to be relatively free of sewage contamination
In situ experiments were conducted in soils in the vicinity (20m or less) of streams or wetlands; soils were desiccated and rehydrated
The likelihood of growth was inferred from persistence of E. coli in soils, the lack of known external inputs of E. coli to the soils and from the presence of conditions conducive to growth
Carillo et al. 1985
Tropical Fresh Water column in a stream (in situ) via diffusion chambers
Water temperature between 21– 22
C for two sites at which in situ
studies were conducted; nitrite + nitrate concentration were 0.43 and 0.53 mg/L at the two sites, respectively; total phosphorous
concentration 3.48 and 3.04 g/L for the two sites at which in situ studies were conducted
E. coli density increased with time in in situ experiments at all locations along a river reach; some study sites were characterized as relatively unimpacted by sewage and others were directly impacted by sewage
B. adolescentis (an alternative indicator organism evaluated by the study authors) did not increase over time for in situ growth experiments

U.S. Environmental Protection Agency
December 2010 C-11
Study Climate Water Type Media Growth Conditions Observation
Davies et al. 1995
Temperate Marine Sediment drawn from the pool below a stormwater outfall and collected 0.4 km offshore and used in laboratory microcosm studies
Experiments were performed in the laboratory with two source waters; growth was evaluated in the presence and absence of predators
Fecal coliforms may grow in fresh water and marine water sediments in the absence of predators; net growth was not observed in marine sediments but was inferred based on persistence of fecal coliforms
In the presence of predators, growth in sediments is still likely, but is outpaced by predation
Because calculated fecal coliform decay rates did not exhibit first-order kinetics, the authors infer that observed decay rates are the result of a balance between growth and predation
Davies et al. 1995
Temperate Fresh Sediment drawn from a stream known to be subject to flow of raw sewage and deployed in diffusion chambers for in situ growth observation
In situ experiments performed in a freshwater stream
Because calculated fecal coliform decay rates did not exhibit first-order kinetics, the authors inferred that observed decay rates are the result of a balance between growth and predation
For fecal streptococci a first-order decay model adequately described observed counts
Desmarais et al. 2002
Tropical Estuarine Waters from a brackish creek mixed with sterile sediments
Laboratory experiments conducted with waters from a brackish creek
Within 30 hours of addition of small amounts of sterile soils to water samples, significant growth of E. coli and enterococci was observed; no growth or decline of Clostridium perfringens was observed under the same conditions
Ferguson et al. 2005
Subtropical Marine Sediments drawn from the intertidal zone of marine waters away from bird droppings
Counts of enterococci, fecal coliforms, and E. coli made in samples collected from intertidal and marine sites
High indicator levels [of all indicators]…of sediments indicate long-term survival and regrowth of indicator bacteria
Gerba and McLeod 1976
Tropical Estuarine Sediments and water column from areas known to be receiving domestic sewage pollution
Experiments were performed with and without sterilization of the media, with and without sediments mixed with waters and with and without nutrients eluted from sediments
Growth and sustained high levels of E. coli occurred in waters dosed with nutrients eluted from sediments; growth of approximately 5 logs was realized within 3 days

U.S. Environmental Protection Agency
December 2010 C-12
Study Climate Water Type Media Growth Conditions Observation
Hardina and Fujioka 1991
Tropical Fresh Water from a tropical stream with known impacts of human sewage; observations were performed in situ and in laboratory experiments
Experiments performed in the field in a tropical stream with known sewage impacts and with a
temperature range of 18 – 26C; water from the stream was allowed to diffuse to water in the test apparatus Experiments performed in the laboratory with water drawn from a tropical stream and with incubation
temperature in the range 23 – 25C
Under laboratory conditions, fecal coliforms concentration increased by more than 2 logs within two days and maintained high concentration through a third day
E. coli was observed to grow in both laboratory and field conditions during the first 24 hours of incubation; growth was greater under field conditions
Enterococci did not experience growth under laboratory or filed conditions
Although growth was observed in water, multiplication in streams was deemed unlikely to be the cause of high levels of E. coli and enterococci in streams because the residence time in streams is low and because growth conditions are less than ideal due to suboptimal temperatures, nutrients and competition with other bacteria
Hardina and Fujioka 1991
Tropical Fresh (1) Soil from the banks and 10 m away from two streams in Hawaii in a forested area and (2) soils from a grassy area approximately 200 m away from and 5 m above the stream elevation.
Soils and sediment samples were drawn at depths of 0, 16, and 36 cm; temperature and soil descriptions not provided
Circumstantial evidence led the authors to believe there is growth of E. coli and enterococci in soils and that high levels of the E. coli and enterococci in soils is the cause for high levels of FIB in streams
Evidence includes high levels of both indicators at all locations; indicator bacteria concentration increases with decreasing elevation (downstream); soils maintain a more constant warmer temperature than their environment; and soils concentrate nutrients from the water phase
Hartel et al. 2005
Temperate and tropical
Marine Sediments collected at two temperate and one tropical location; sediments had very different sand, silt, and clay contents
Laboratory experiments in which sediments were dried for 2, 30, or 60 days
A fraction of enterococci survived desiccations of 60 days in all soils; survival was poorest in Puerto Rico soils that had high sand content
Regrowth was observed in Georgia soil samples that were dry for 60 days

U.S. Environmental Protection Agency
December 2010 C-13
Study Climate Water Type Media Growth Conditions Observation
Ishii et al. 2006 Temperate Fresh Soils from (1) a partial wetland, (2) the overbanks of a river (sandy soils, low organic content), and (3) the overbank of a river on a site of a former wastewater treatment facility
In situ measurements and laboratory experiments with sediments from three sites (one from each study area)
E. coli strains appear to have naturalized in the soils studied
E. coli was observed routinely in soil samples E. coli survived winter months, including
multiple freeze-thaw cycles Growth in laboratory studies was observed in
unamended, unsterilized soils when soil
temperatures were at or above 30C
Isobe et al. 2004 Temperate Fresh Water column in a river; samples were drawn from a reach believed to be free of inputs of sewage and classified as “control sites” by the authors
In situ measurements made during one calendar year; the study area (Tokyo) has four seasons and water temperature ranged from
below 10C to above 25C
Total coliforms, E. coli, and fecal streptococci (enterococci) were detected at control sites irrespective of season
Coprostanol concentrations measured at control sites concurrent with FIB concentrations were below the detection limit, indicating that E. coli and fecal streptococci were naturally present in soils or feces of animal origin
Lee et al. 2006 Subtropical Marine Water from the water column with or without sediment present in the microcosm
Marine water overlaying approximately 10 g of autoclaved sediment and inoculated with E. coli or Enterococci
Significant growth of both E. coli and Enterococci occurred when microcosm waters were on top of a small quantity of sediments
Sediments may contribute organic content required for growth
Noble et al. 2004 Temperate Marine and Freshwater
Mesocosm seeded with range of inocula and nutrients and incubated at different temperatures
Nutrients, total suspended solids, temperature, and bacteria inocula varied factorially
Die off of E. coli and enterococci specifically related to temperature, Decay more rapid at higher temperatures.
Okabe and Shimazu, 2007
Temperate Fresh and low salinity waters
Unfiltered river water and unfiltered marine water diluted with unfiltered river water
Laboratory observations made of growth/decay of 6 fecal indicators. Fresh and seawater samples were mixed to achieve a desired salinity, inoculated with human, pig, and cow feces suspensions and maintained at target temperatures.
Total coliform growth was observed at T = 10C and salinities of 0 ppt (k = 0.11 d
-1) and 10
ppt (k = 0.07 d-1
)
Net decay of total coliforms was observed at salinities greater than 10 ppt
Net decay of fecal coliforms was observed at all salinities and temperatures, though decay rate in fresh water at water temperature of
10C was very low (0.02 d-1
)

U.S. Environmental Protection Agency
December 2010 C-14
Study Climate Water Type Media Growth Conditions Observation
Parker and Mee 1982
Temperate Soils near septic systems
Coarse sands from dunes inoculated with Salmonella adelaide
and fecal coliforms and septic tank effluent
Moisture and nutrient conditions similar to those near septic systems were maintained in sands
For most of the simulations performed, die-off of fecal coliforms and S. adelaide were minimal
Fecal coliform growth in the first 2 – 3 days was observed in all but two simulations
Rhodes and Kator 1988
Temperate Estuarine Filtered and unfiltered estuarine water inoculated with suspensions of E. coli and Salmonella spp.
In situ experiments in diffusion chambers. Growth and decay were monitored during all 4 seasons and with and without predators and competition.
E. coli and Salmonella spp. grew in filtered and unfiltered water for about 2 days after inoculation
Decay rate after the growth period was much higher in unfiltered water than in filtered water
Whitman and Nevers 2003
Temperate Fresh Foreshore beach sand at a Lake Michigan beach in Chicago, IL
Sustained and increasing concentrations of E. coli were observed in Lake Michigan foreshore beach sands. Features considered to contribute to potential growth were the moist environment and supply of nutrients with gentle groundwater circulation, protection from sunlight, and high surface area for biofilms.
E. coli concentration in sands responded (increased) to rain events and wind events, but relatively quickly fell to pre-event levels where they were maintained
E. coli concentrations in sand gradually increased during the course of a summer
E. coli recolonized beach sands that were
replaced, even though temperatures were relatively low and no rain events occurred during the observation period
Yan et al. 2010 Tropical Marine Sand inoculated with range of organisms/treaments
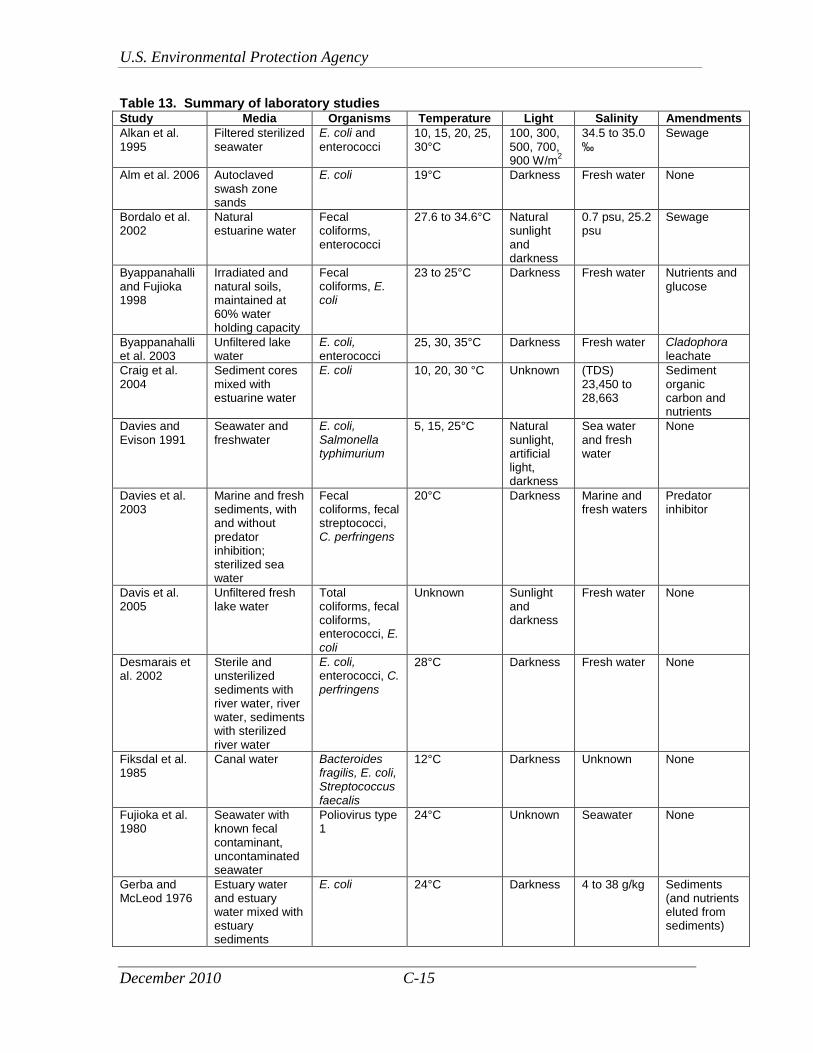
U.S. Environmental Protection Agency
December 2010 C-15
Table 13. Summary of laboratory studies Study Media Organisms Temperature Light Salinity Amendments
Alkan et al. 1995
Filtered sterilized seawater
E. coli and
enterococci 10, 15, 20, 25, 30°C
100, 300, 500, 700, 900 W/m
2
34.5 to 35.0 ‰
Sewage
Alm et al. 2006 Autoclaved swash zone sands
E. coli 19°C Darkness Fresh water None
Bordalo et al. 2002
Natural estuarine water
Fecal coliforms, enterococci
27.6 to 34.6°C Natural sunlight and darkness
0.7 psu, 25.2 psu
Sewage
Byappanahalli and Fujioka 1998
Irradiated and natural soils, maintained at 60% water holding capacity
Fecal coliforms, E. coli
23 to 25°C Darkness Fresh water Nutrients and glucose
Byappanahalli et al. 2003
Unfiltered lake water
E. coli, enterococci
25, 30, 35°C Darkness Fresh water Cladophora leachate
Craig et al. 2004
Sediment cores mixed with estuarine water
E. coli 10, 20, 30 °C Unknown (TDS) 23,450 to 28,663
Sediment organic carbon and nutrients
Davies and Evison 1991
Seawater and freshwater
E. coli, Salmonella typhimurium
5, 15, 25°C Natural sunlight, artificial light, darkness
Sea water and fresh water
None
Davies et al. 2003
Marine and fresh sediments, with and without predator inhibition; sterilized sea water
Fecal coliforms, fecal streptococci, C. perfringens
20°C Darkness Marine and fresh waters
Predator inhibitor
Davis et al. 2005
Unfiltered fresh lake water
Total coliforms, fecal coliforms, enterococci, E. coli
Unknown Sunlight and darkness
Fresh water None
Desmarais et al. 2002
Sterile and unsterilized sediments with river water, river water, sediments with sterilized river water
E. coli, enterococci, C. perfringens
28°C Darkness Fresh water None
Fiksdal et al. 1985
Canal water Bacteroides fragilis, E. coli, Streptococcus faecalis
12°C Darkness Unknown None
Fujioka et al. 1980
Seawater with known fecal contaminant, uncontaminated seawater
Poliovirus type 1
24°C Unknown Seawater None
Gerba and McLeod 1976
Estuary water and estuary water mixed with estuary sediments
E. coli 24°C Darkness 4 to 38 g/kg Sediments (and nutrients eluted from sediments)

U.S. Environmental Protection Agency
December 2010 C-16
Study Media Organisms Temperature Light Salinity Amendments
Hartel et al. 2005
Sediments from 3 locales, desiccated and rewetted
Enterococci 20 to 22°C Darkness Unknown none
Kapuscinski and Mitchell 1983
Filtered seawater
E. coli, MS2 bacteriophage,
x-174 bateriophage, T7 bacteriophage
10, 15, 23°C Natural sunlight and darkness
21 to 26 g/kg None
Lee et al. 2006 Mixtures of sterilized beach sand and beach water, washed sand and beach water or sterilized beach water
E. coli and E. faecalis
Unknown Unknown Unknown Unknown
Lo et al. 1976 Synthetic seawater
Poliomyelitus type-1, echovirus-6, coxsackievirus B-5
4, 15, 25, 37°C Unknown 10, 20, 34 ppt
None
McCambridge and McMeekin 1981
Autoclaved estuarine water
Klebsiella pneumoniae, E. coli, Salmonella typhimurium, Streptococcus faecium
22°C Direct sunlight, artificial light, darkness
Unknown None
Noble et al. 2004
Freshwater and seawater
Total coliforms, E. coli and enterococci
14°C and 20°C Direct sunlight typical of winter or summer day
Range Total suspended solids, nutrients, sewage influent, sewage effluent
Parker and Mee 1982
Coarse sands dosed with septic system effluents
Fecal coliforms and Salmonella adelaide
15°C Darkness Fresh water Septic system effluent
Stinton et al. 1994
Seawater Fecal coliforms and enterococci
10 to 19.6°C Natural sunlight, darkness
Seawater WWTP effluent and meat processing plant effluent
Stinton et al. (1999)
Seawater Fecal coliforms, enterococci, somatic coliphage, F-RNA phage, F-DNA phage, B. fragilis phage
9 to 19.0 °C Natural sunlight and darkness
Seawater Raw sewage and waste stabilization pond effluent

U.S. Environmental Protection Agency
December 2010 C-17
Study Media Organisms Temperature Light Salinity Amendments
Stinton et al. 2002
Fresh and seawaters
Fecal coliforms, enterococci, E. coli, somatic
coliphages, F-RNA phages
14°C Natural sunlight and darkness
Seawater Waste stabilization pond effluent
Wait and Sobsey 2001
Seawater, collected once in each of 4 seasons
E. coli, Salmonella typhi, Shigella sonnei, poliovirus type 1, parovirus
12, 20, 28°C Unknown 31.5 to 35 mg/L
None
Wang and Doyle 1998
Filtered, autoclaved tap water, fresh water from 3 reservoirs
E. coli O157:H7
8, 15, 25°C Unknown Conductivity (mS/m) 4.3, 11.0, 26.4, 34.1
None
Wright 1989 Well water, water from ephemeral stream, river water
Fecal coliforms, fecal streptococci, Clostridium perfringens, Salmonella
spp.
24.8 to 31.2°C Unknown Conductivity (mS/m) 8 to 66
None
Yamahara et al. 2009
Beach sands enterococci, E. coli
20°C Dark 33 ‰ (seawater)
None
Salinity (‰) is defined as the weight in grams of dissolved inorganic matter in 1 kg of seawater after all BR-
and I- have been replaced by the equivalent quantity of Cl
- and all HCO3
- and CO3
2- are converted to oxide.
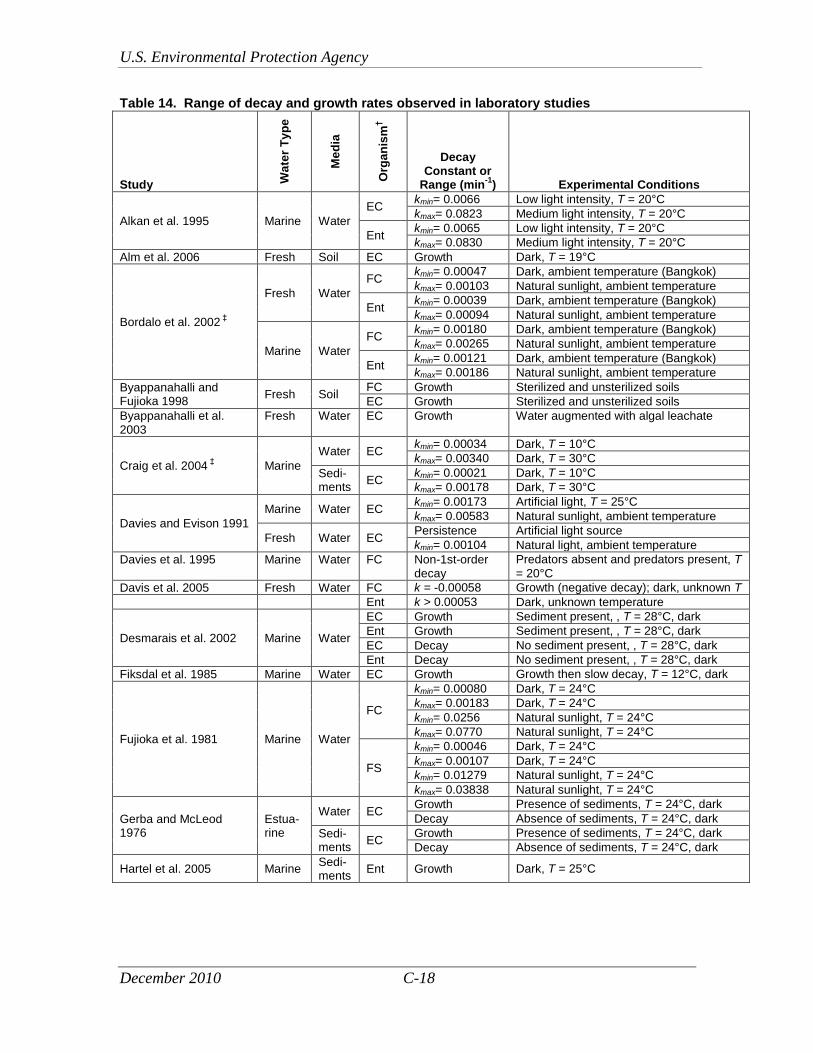
U.S. Environmental Protection Agency
December 2010 C-18
Table 14. Range of decay and growth rates observed in laboratory studies
Study Wa
ter
Ty
pe
Me
dia
Org
an
ism
†
Decay Constant or
Range (min-1
) Experimental Conditions
Alkan et al. 1995 Marine Water
EC kmin= 0.0066 Low light intensity, T = 20°C
kmax= 0.0823 Medium light intensity, T = 20°C
Ent kmin= 0.0065 Low light intensity, T = 20°C
kmax= 0.0830 Medium light intensity, T = 20°C
Alm et al. 2006 Fresh Soil EC Growth Dark, T = 19°C
Bordalo et al. 2002 ‡
Fresh Water
FC kmin= 0.00047 Dark, ambient temperature (Bangkok)
kmax= 0.00103 Natural sunlight, ambient temperature
Ent kmin= 0.00039 Dark, ambient temperature (Bangkok)
kmax= 0.00094 Natural sunlight, ambient temperature
Marine Water
FC kmin= 0.00180 Dark, ambient temperature (Bangkok)
kmax= 0.00265 Natural sunlight, ambient temperature
Ent kmin= 0.00121 Dark, ambient temperature (Bangkok)
kmax= 0.00186 Natural sunlight, ambient temperature
Byappanahalli and Fujioka 1998
Fresh Soil FC Growth Sterilized and unsterilized soils
EC Growth Sterilized and unsterilized soils
Byappanahalli et al. 2003
Fresh Water EC Growth Water augmented with algal leachate
Craig et al. 2004 ‡ Marine
Water EC kmin= 0.00034 Dark, T = 10°C
kmax= 0.00340 Dark, T = 30°C
Sedi-ments
EC kmin= 0.00021 Dark, T = 10°C
kmax= 0.00178 Dark, T = 30°C
Davies and Evison 1991
Marine Water EC kmin= 0.00173 Artificial light, T = 25°C
kmax= 0.00583 Natural sunlight, ambient temperature
Fresh Water EC Persistence Artificial light source
kmin= 0.00104 Natural light, ambient temperature
Davies et al. 1995 Marine Water FC Non-1st-order decay
Predators absent and predators present, T
= 20°C
Davis et al. 2005 Fresh Water FC k = -0.00058 Growth (negative decay); dark, unknown T
Ent k > 0.00053 Dark, unknown temperature
Desmarais et al. 2002 Marine Water
EC Growth Sediment present, , T = 28°C, dark
Ent Growth Sediment present, , T = 28°C, dark
EC Decay No sediment present, , T = 28°C, dark
Ent Decay No sediment present, , T = 28°C, dark
Fiksdal et al. 1985 Marine Water EC Growth Growth then slow decay, T = 12°C, dark
Fujioka et al. 1981 Marine Water
FC
kmin= 0.00080 Dark, T = 24°C
kmax= 0.00183 Dark, T = 24°C
kmin= 0.0256 Natural sunlight, T = 24°C
kmax= 0.0770 Natural sunlight, T = 24°C
FS
kmin= 0.00046 Dark, T = 24°C
kmax= 0.00107 Dark, T = 24°C
kmin= 0.01279 Natural sunlight, T = 24°C
kmax= 0.03838 Natural sunlight, T = 24°C
Gerba and McLeod 1976
Estua-rine
Water EC Growth Presence of sediments, T = 24°C, dark
Decay Absence of sediments, T = 24°C, dark
Sedi-ments
EC Growth Presence of sediments, T = 24°C, dark
Decay Absence of sediments, T = 24°C, dark
Hartel et al. 2005 Marine Sedi-ments
Ent Growth Dark, T = 25°C

U.S. Environmental Protection Agency
December 2010 C-19
Study
Wa
ter
Ty
pe
Me
dia
Org
an
ism
†
Decay Constant or
Range (min-1
) Experimental Conditions
Kapuscinski and Mitchell 1983
Marine Water EC
kmin= 0.02067 Natural sunlight, T = 15°C
kmax= 0.04867 Natural sunlight, T = 23°C
kmin= 0.0256 Dark, T = 15°C
kmax= 0.0770 Dark, T = 23°C
Lee et al. 2006 Marine Water EC Decay Rapid decline reported, T unknown
Growth Marine water overlying sediments
Lo et al. 1976 Marine Water PMV T90 ca. 20 wks Low salinity, T = 15°C
EV6 T90 ca. 8 wks Low salinity, T = 15°C
CB-5 T90 ca. 20 wks Low salinity, T = 15°C
McCambridge and McMeekin 1981
Estua-rine
Water EC T90 ca. 2.5 days Sunlight; non-1
st-order decay observed
T90 ca. 3 days Dark; non-1st-order decay observed
Noble et al. 2004 Marine Water
TC T90 ca. 5.0 days Seawater, T = 14°C
EC T90 ca. 4.6 days Seawater, T = 14°C
Ent T90 ca. 7.4 days Seawater, T = 14°C
Noble et al. 2004 Marine Water
TC T90 ca. 3.5 days Seawater, T = 20°C
EC T90 ca. 3.3 days Seawater, T = 20°C
Ent T90 ca. 4.8 days Seawater, T = 20°C
EC T90 ca. 0.7 days Seawater, High Solar Irradiation, T = 20°C
Ent T90 ca. 0.4 days Seawater, High Solar Irradiation, T = 20°C
Parker and Mee 1982 ‡ Fresh Soil
FC kmin < 0.00002 Unsaturated soil, T = 15°C
kmax = 0.00010 Saturated soil, T = 15°C
Sinton et al. 1994 Marine Water
FC kmin = 0.00033 Dark, cold, with sewage addition
kmax = 0.00047 Dark, warm, with sewage addition
Ent kmin = 0.00008 Dark, cold, with sewage addition
kmax = 0.00013 Dark, warm, with sewage addition
FC*
ks = 0.515 ns = 1.45
Natural sunlight, sewage added
Ent*
ks = 0.310 ns = 2.58
Natural sunlight, sewage added
Sinton et al. 1999 Marine Water
FC kmin = 0.00060 Dark, cold, with sewage addition
kmax = 0.00078 Dark, warm, with sewage addition
Ent kmax = 0.00008 Dark, warm, with sewage addition
FC*
ks = 0.47 ns = 1.23
Natural sunlight, sewage added
Ent*
ks,max = 0.27 ns = 9.47
Natural sunlight, sewage added
Sinton et al. 2002 Fresh Water
FC kmin = 0.00012 Dark, temperature unknown
kmax = 0.00027 Dark, temperature unknown
EC kmin = 0.00029 Dark, temperature unknown
kmax = 0.00038 Dark, temperature unknown
Ent kmin = 0.00020 Dark, temperature unknown
kmax = 0.00028 Dark, temperature unknown
FC*
ks,min = 0.084 ns = 1.1
Warm, raw sewage inoculums
ks,max = 0.275 ns = 3.8
Cold, wastewater stabilization pond inoculum
EC*
ks,min = 0.073 ns = 1.0
Warm, raw sewage inoculums
ks,max = 0.287 ns = 4.8
Cold, wastewater stabilization pond inoculum
Ent*
ks,min = 0.110 ns = 1.0
Cold, wastewater stabilization pond inoculum
ks,max = 0.276 Warm, wastewater stabilization pond
U.S. Environmental Protection Agency
December 2010 C-20
ns = 1.3 inoculum
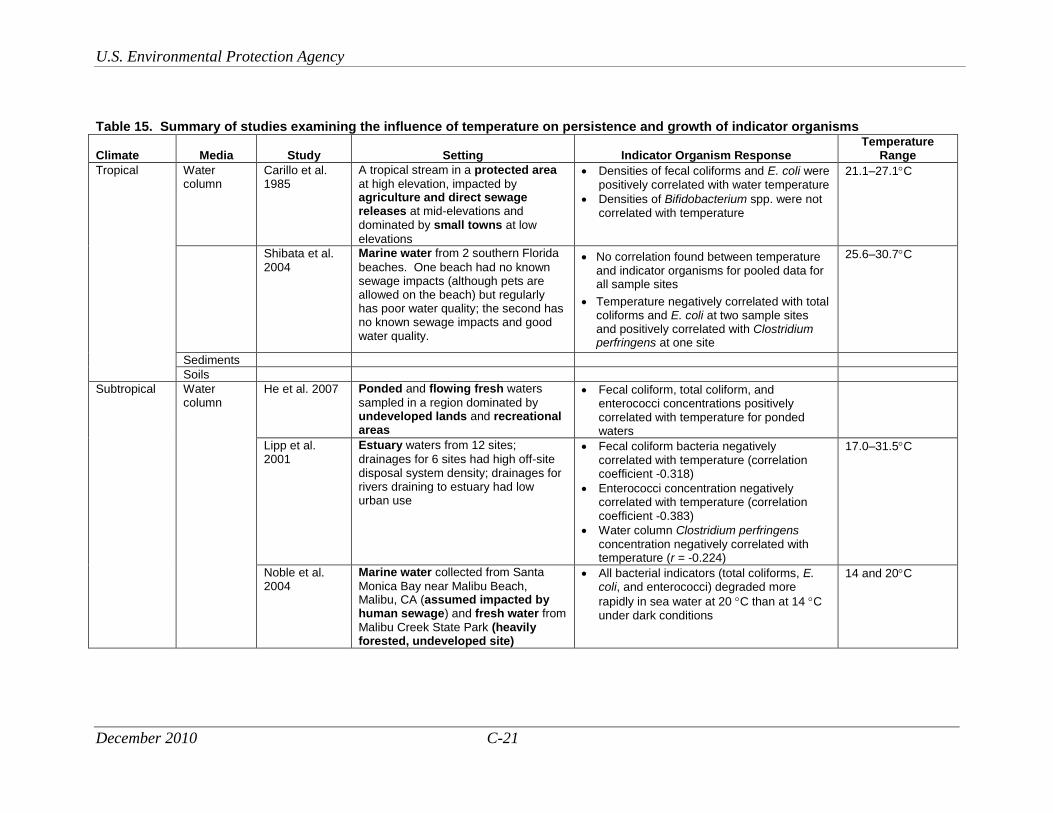
U.S. Environmental Protection Agency
December 2010 C-21
Table 15. Summary of studies examining the influence of temperature on persistence and growth of indicator organisms
Climate Media Study Setting Indicator Organism Response Temperature
Range
Tropical Water column
Carillo et al. 1985
A tropical stream in a protected area
at high elevation, impacted by agriculture and direct sewage releases at mid-elevations and dominated by small towns at low
elevations
Densities of fecal coliforms and E. coli were positively correlated with water temperature
Densities of Bifidobacterium spp. were not correlated with temperature
21.1–27.1C
Shibata et al. 2004
Marine water from 2 southern Florida
beaches. One beach had no known sewage impacts (although pets are allowed on the beach) but regularly has poor water quality; the second has no known sewage impacts and good water quality.
No correlation found between temperature and indicator organisms for pooled data for all sample sites
Temperature negatively correlated with total coliforms and E. coli at two sample sites and positively correlated with Clostridium perfringens at one site
25.6–30.7C
Sediments
Soils
Subtropical Water column
He et al. 2007 Ponded and flowing fresh waters
sampled in a region dominated by undeveloped lands and recreational areas
Fecal coliform, total coliform, and enterococci concentrations positively correlated with temperature for ponded waters
Lipp et al. 2001
Estuary waters from 12 sites;
drainages for 6 sites had high off-site disposal system density; drainages for rivers draining to estuary had low urban use
Fecal coliform bacteria negatively correlated with temperature (correlation coefficient -0.318)
Enterococci concentration negatively correlated with temperature (correlation coefficient -0.383)
Water column Clostridium perfringens concentration negatively correlated with temperature (r = -0.224)
17.0–31.5C
Noble et al. 2004
Marine water collected from Santa
Monica Bay near Malibu Beach, Malibu, CA (assumed impacted by human sewage) and fresh water from Malibu Creek State Park (heavily forested, undeveloped site)
All bacterial indicators (total coliforms, E. coli, and enterococci) degraded more
rapidly in sea water at 20 C than at 14 C under dark conditions
14 and 20C
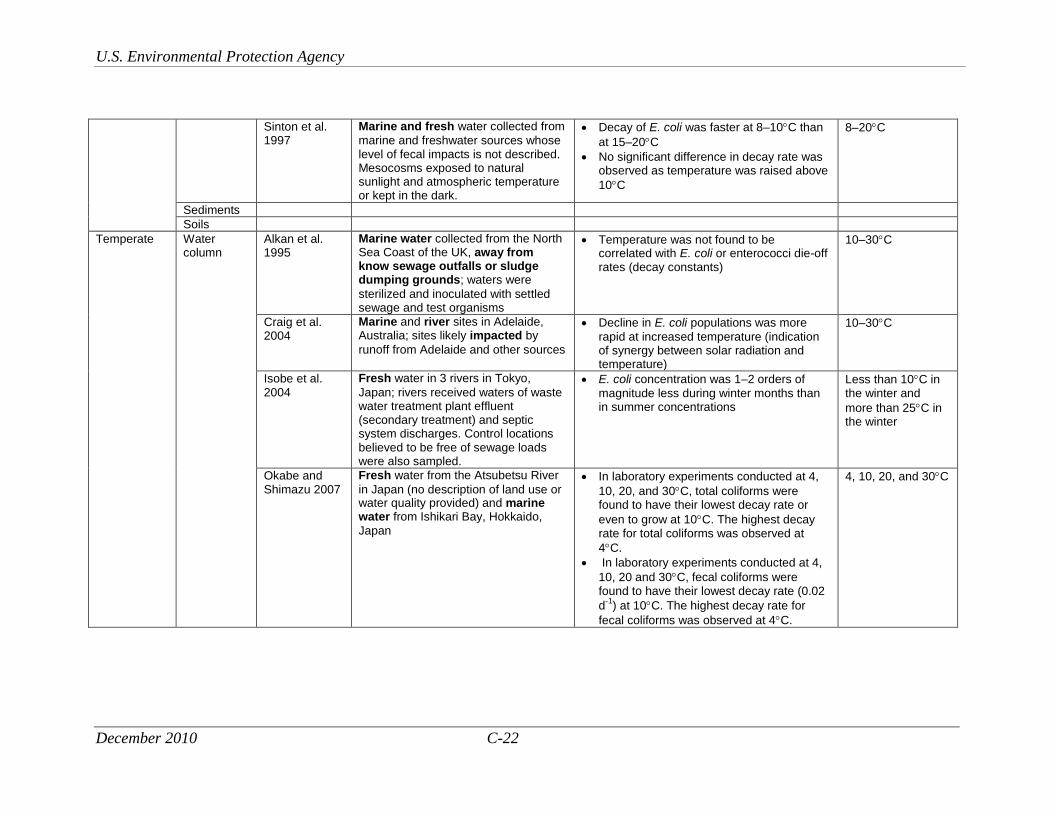
U.S. Environmental Protection Agency
December 2010 C-22
Sinton et al. 1997
Marine and fresh water collected from
marine and freshwater sources whose level of fecal impacts is not described. Mesocosms exposed to natural sunlight and atmospheric temperature or kept in the dark.
Decay of E. coli was faster at 8–10C than
at 15–20C
No significant difference in decay rate was observed as temperature was raised above
10C
8–20C
Sediments
Soils
Temperate Water column
Alkan et al. 1995
Marine water collected from the North Sea Coast of the UK, away from know sewage outfalls or sludge dumping grounds; waters were
sterilized and inoculated with settled sewage and test organisms
Temperature was not found to be correlated with E. coli or enterococci die-off rates (decay constants)
10–30C
Craig et al. 2004
Marine and river sites in Adelaide, Australia; sites likely impacted by
runoff from Adelaide and other sources
Decline in E. coli populations was more
rapid at increased temperature (indication of synergy between solar radiation and temperature)
10–30C
Isobe et al. 2004
Fresh water in 3 rivers in Tokyo,
Japan; rivers received waters of waste water treatment plant effluent (secondary treatment) and septic system discharges. Control locations believed to be free of sewage loads were also sampled.
E. coli concentration was 1–2 orders of
magnitude less during winter months than in summer concentrations
Less than 10C in the winter and
more than 25C in the winter
Okabe and Shimazu 2007
Fresh water from the Atsubetsu River
in Japan (no description of land use or water quality provided) and marine water from Ishikari Bay, Hokkaido,
Japan
In laboratory experiments conducted at 4,
10, 20, and 30C, total coliforms were found to have their lowest decay rate or
even to grow at 10C. The highest decay rate for total coliforms was observed at
4C.
In laboratory experiments conducted at 4,
10, 20 and 30C, fecal coliforms were found to have their lowest decay rate (0.02
d-1
) at 10C. The highest decay rate for
fecal coliforms was observed at 4C.
4, 10, 20, and 30C
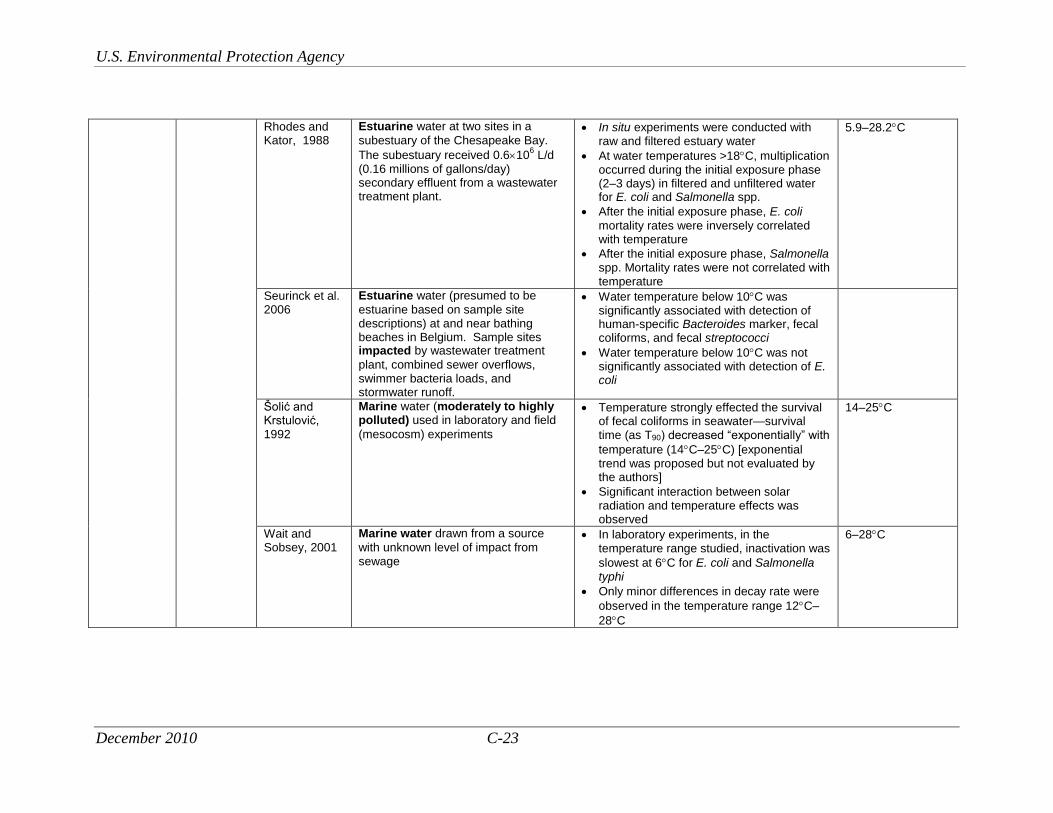
U.S. Environmental Protection Agency
December 2010 C-23
Rhodes and Kator, 1988
Estuarine water at two sites in a
subestuary of the Chesapeake Bay.
The subestuary received 0.6106 L/d
(0.16 millions of gallons/day) secondary effluent from a wastewater treatment plant.
In situ experiments were conducted with raw and filtered estuary water
At water temperatures >18C, multiplication occurred during the initial exposure phase (2–3 days) in filtered and unfiltered water for E. coli and Salmonella spp.
After the initial exposure phase, E. coli
mortality rates were inversely correlated with temperature
After the initial exposure phase, Salmonella spp. Mortality rates were not correlated with temperature
5.9–28.2C
Seurinck et al. 2006
Estuarine water (presumed to be
estuarine based on sample site descriptions) at and near bathing beaches in Belgium. Sample sites impacted by wastewater treatment
plant, combined sewer overflows, swimmer bacteria loads, and stormwater runoff.
Water temperature below 10C was significantly associated with detection of human-specific Bacteroides marker, fecal coliforms, and fecal streptococci
Water temperature below 10C was not significantly associated with detection of E. coli
Šolić and Krstulović, 1992
Marine water (moderately to highly polluted) used in laboratory and field
(mesocosm) experiments
Temperature strongly effected the survival of fecal coliforms in seawater—survival time (as T90) decreased “exponentially” with
temperature (14C–25C) [exponential trend was proposed but not evaluated by the authors]
Significant interaction between solar radiation and temperature effects was observed
14–25C
Wait and Sobsey, 2001
Marine water drawn from a source
with unknown level of impact from sewage
In laboratory experiments, in the temperature range studied, inactivation was
slowest at 6C for E. coli and Salmonella typhi
Only minor differences in decay rate were
observed in the temperature range 12C–
28C
6–28C
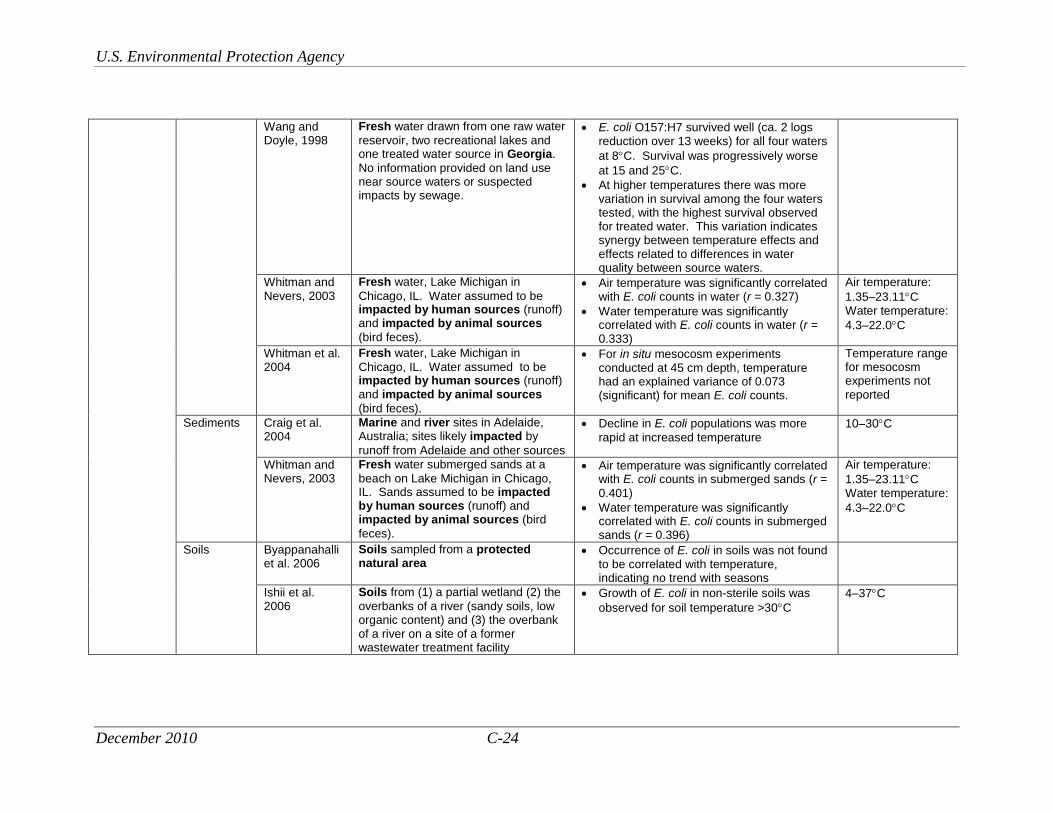
U.S. Environmental Protection Agency
December 2010 C-24
Wang and Doyle, 1998
Fresh water drawn from one raw water
reservoir, two recreational lakes and one treated water source in Georgia.
No information provided on land use near source waters or suspected impacts by sewage.
E. coli O157:H7 survived well (ca. 2 logs reduction over 13 weeks) for all four waters
at 8C. Survival was progressively worse
at 15 and 25C.
At higher temperatures there was more variation in survival among the four waters tested, with the highest survival observed for treated water. This variation indicates synergy between temperature effects and effects related to differences in water quality between source waters.
Whitman and Nevers, 2003
Fresh water, Lake Michigan in
Chicago, IL. Water assumed to be impacted by human sources (runoff) and impacted by animal sources
(bird feces).
Air temperature was significantly correlated with E. coli counts in water (r = 0.327)
Water temperature was significantly correlated with E. coli counts in water (r = 0.333)
Air temperature:
1.35–23.11C Water temperature:
4.3–22.0C
Whitman et al. 2004
Fresh water, Lake Michigan in
Chicago, IL. Water assumed to be impacted by human sources (runoff) and impacted by animal sources
(bird feces).
For in situ mesocosm experiments conducted at 45 cm depth, temperature had an explained variance of 0.073 (significant) for mean E. coli counts.
Temperature range for mesocosm experiments not reported
Sediments Craig et al. 2004
Marine and river sites in Adelaide, Australia; sites likely impacted by
runoff from Adelaide and other sources
Decline in E. coli populations was more
rapid at increased temperature 10–30C
Whitman and Nevers, 2003
Fresh water submerged sands at a
beach on Lake Michigan in Chicago, IL. Sands assumed to be impacted by human sources (runoff) and impacted by animal sources (bird
feces).
Air temperature was significantly correlated with E. coli counts in submerged sands (r =
0.401)
Water temperature was significantly correlated with E. coli counts in submerged sands (r = 0.396)
Air temperature:
1.35–23.11C Water temperature:
4.3–22.0C
Soils Byappanahalli et al. 2006
Soils sampled from a protected natural area
Occurrence of E. coli in soils was not found to be correlated with temperature, indicating no trend with seasons
Ishii et al. 2006
Soils from (1) a partial wetland (2) the
overbanks of a river (sandy soils, low organic content) and (3) the overbank of a river on a site of a former wastewater treatment facility
Growth of E. coli in non-sterile soils was
observed for soil temperature >30C
4–37C

U.S. Environmental Protection Agency
December 2010 C-25
Whitman and Nevers, 2003
Fresh water, foreshore sands, Lake
Michigan in Chicago, IL. Water assumed to be impacted by human sources (runoff) and impacted by animal sources (bird feces).
Air temperature was significantly correlated with E. coli counts in foreshore sands (r =
0.593)
Water temperature was significantly correlated with E. coli counts in foreshore sands (r = 0.592)
Air temperature:
1.35–23.11C Water temperature:
4.3–22.0C
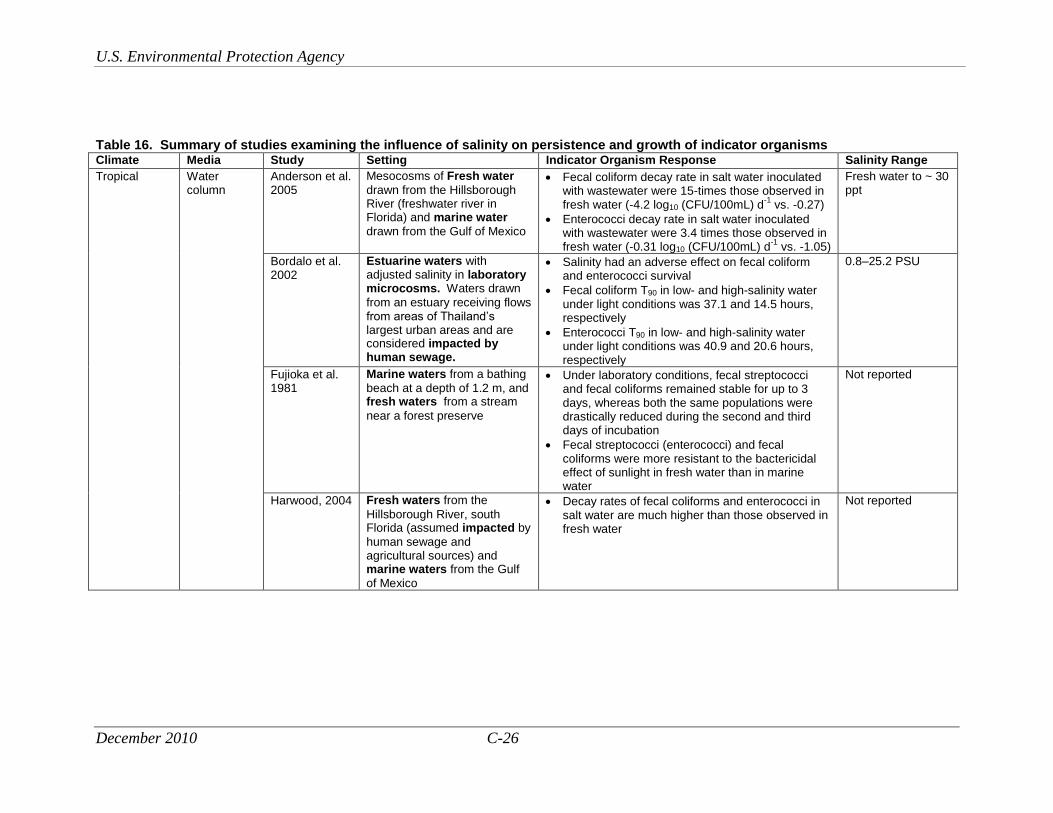
U.S. Environmental Protection Agency
December 2010 C-26
Table 16. Summary of studies examining the influence of salinity on persistence and growth of indicator organisms Climate Media Study Setting Indicator Organism Response Salinity Range
Tropical Water column
Anderson et al. 2005
Mesocosms of Fresh water
drawn from the Hillsborough River (freshwater river in Florida) and marine water
drawn from the Gulf of Mexico
Fecal coliform decay rate in salt water inoculated with wastewater were 15-times those observed in fresh water (-4.2 log10 (CFU/100mL) d
-1 vs. -0.27)
Enterococci decay rate in salt water inoculated with wastewater were 3.4 times those observed in fresh water (-0.31 log10 (CFU/100mL) d
-1 vs. -1.05)
Fresh water to ~ 30 ppt
Bordalo et al. 2002
Estuarine waters with adjusted salinity in laboratory microcosms. Waters drawn
from an estuary receiving flows from areas of Thailand’s largest urban areas and are considered impacted by human sewage.
Salinity had an adverse effect on fecal coliform and enterococci survival
Fecal coliform T90 in low- and high-salinity water under light conditions was 37.1 and 14.5 hours, respectively
Enterococci T90 in low- and high-salinity water under light conditions was 40.9 and 20.6 hours, respectively
0.8–25.2 PSU
Fujioka et al. 1981
Marine waters from a bathing
beach at a depth of 1.2 m, and fresh waters from a stream
near a forest preserve
Under laboratory conditions, fecal streptococci and fecal coliforms remained stable for up to 3 days, whereas both the same populations were drastically reduced during the second and third days of incubation
Fecal streptococci (enterococci) and fecal coliforms were more resistant to the bactericidal effect of sunlight in fresh water than in marine water
Not reported
Harwood, 2004 Fresh waters from the
Hillsborough River, south Florida (assumed impacted by
human sewage and agricultural sources) and marine waters from the Gulf
of Mexico
Decay rates of fecal coliforms and enterococci in salt water are much higher than those observed in fresh water
Not reported
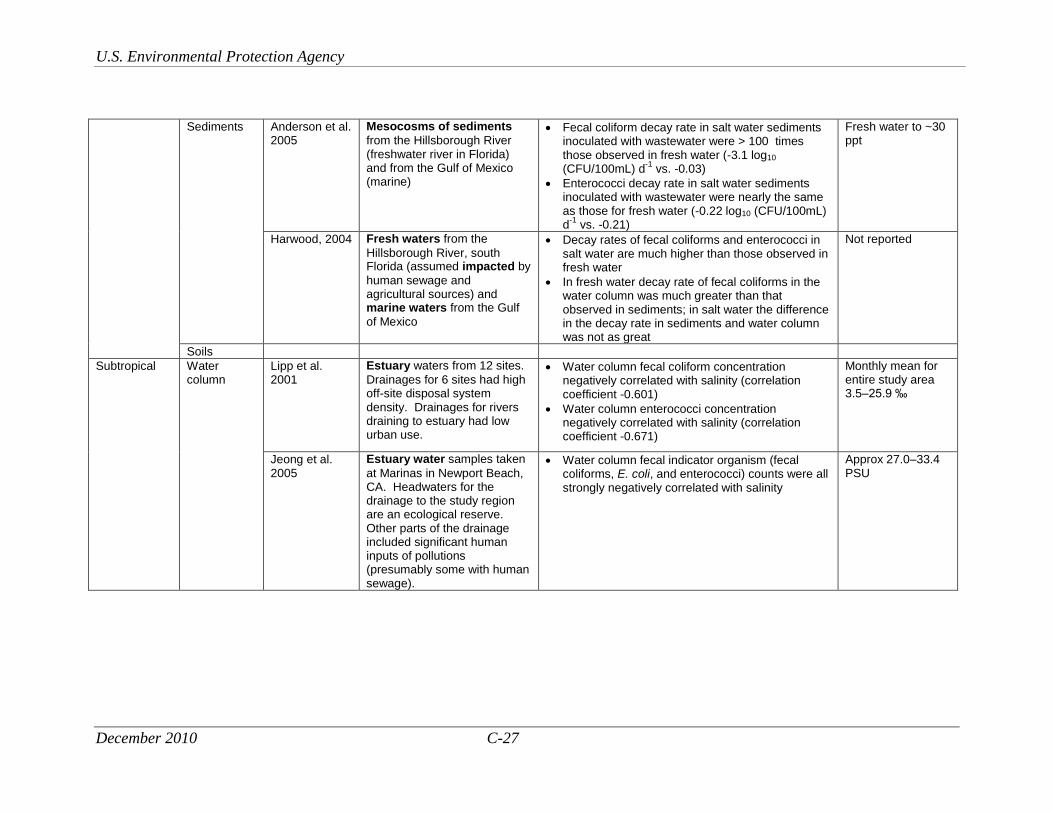
U.S. Environmental Protection Agency
December 2010 C-27
Sediments Anderson et al. 2005
Mesocosms of sediments
from the Hillsborough River (freshwater river in Florida) and from the Gulf of Mexico (marine)
Fecal coliform decay rate in salt water sediments inoculated with wastewater were > 100 times those observed in fresh water (-3.1 log10 (CFU/100mL) d
-1 vs. -0.03)
Enterococci decay rate in salt water sediments inoculated with wastewater were nearly the same as those for fresh water (-0.22 log10 (CFU/100mL) d
-1 vs. -0.21)
Fresh water to ~30 ppt
Harwood, 2004 Fresh waters from the
Hillsborough River, south Florida (assumed impacted by
human sewage and agricultural sources) and marine waters from the Gulf
of Mexico
Decay rates of fecal coliforms and enterococci in salt water are much higher than those observed in fresh water
In fresh water decay rate of fecal coliforms in the water column was much greater than that observed in sediments; in salt water the difference in the decay rate in sediments and water column was not as great
Not reported
Soils
Subtropical Water column
Lipp et al. 2001
Estuary waters from 12 sites.
Drainages for 6 sites had high off-site disposal system density. Drainages for rivers draining to estuary had low urban use.
Water column fecal coliform concentration negatively correlated with salinity (correlation coefficient -0.601)
Water column enterococci concentration negatively correlated with salinity (correlation coefficient -0.671)
Monthly mean for entire study area 3.5–25.9 ‰
Jeong et al. 2005
Estuary water samples taken
at Marinas in Newport Beach, CA. Headwaters for the drainage to the study region are an ecological reserve. Other parts of the drainage included significant human inputs of pollutions (presumably some with human sewage).
Water column fecal indicator organism (fecal coliforms, E. coli, and enterococci) counts were all strongly negatively correlated with salinity
Approx 27.0–33.4 PSU

U.S. Environmental Protection Agency
December 2010 C-28
Evanson and Ambrose, 2006
Brackish waters from tidally-influenced wetlands.
Wetlands known to be impacted by human sewage and are a suspected source of fecal indicator organisms in beach waters. Two sites were assessed—one receiving direct urban runoff and a second within the wetland.
Within the wetland, salinity was the only environmental condition correlated to water column total coliform and enterococci concentrations. Precipitation, tidal range and wind were not correlated.
Approximately 10–35 ppt
He et al. 2007 Ponded and flowing fresh
waters sampled in a region dominated by undeveloped lands and recreational areas
Fecal coliform, total coliform, and enterococci decreased with salinity for ponded waters
Fecal coliform, total coliform, and enterococci concentration showed significant correlation with temperature and conductivity combined for ponded waters
Approximately 1–9 mS/cm
Sediments Evanson and Ambrose, 2006
Brackish sediments from tidally-influenced wetlands.
Wetlands are known to be impacted by human sewage and are a suspected source of fecal indicator organisms in beach waters. Two sites were assessed—one receiving direct urban runoff and a second within the wetland.
Within the wetland, salinity was not correlated with total coliform, E. coli, and enterococci counts in the sediments
Approximately 10–35 ppt
Sediments Lipp et al. 2001
Estuary sediments from 12
sites. Drainages for 6 sites have high off-site disposal system density. Drainages for rivers draining to estuary have low urban use.
Sediments fecal coliform concentration negatively correlated with salinity (correlation coefficient -0.536)
Monthly mean for entire study area 3.5–25.9‰
Soils
Temperate Water column
Šolić and Krstulović , 1992
Marine water (moderately to highly polluted) used in
laboratory and field (mesocosm) experiments
Fecal coliform survival time (measured as T90) reduced with increasing salinity
The effect of salinity in the range 15–40 ‰ was smaller than the observed effect in the range 10-15‰
There is likely synergy between the effects of solar radiation and salinity on fecal coliform inactivation
10–40‰
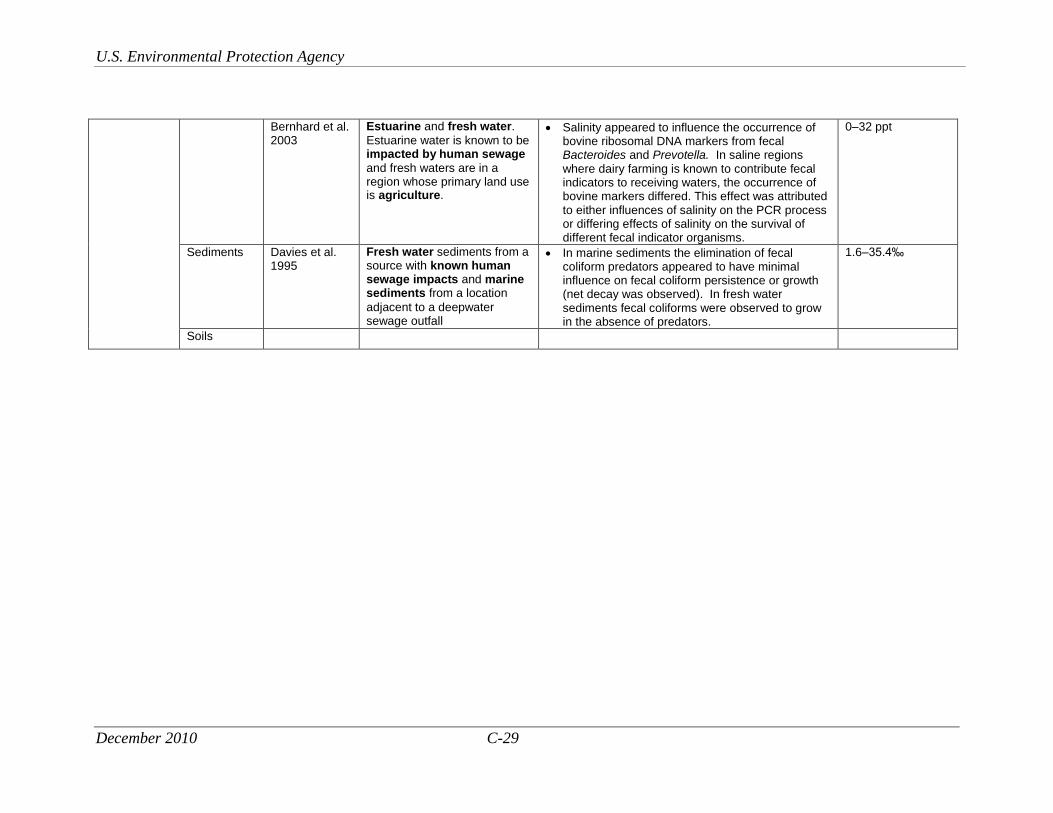
U.S. Environmental Protection Agency
December 2010 C-29
Bernhard et al. 2003
Estuarine and fresh water.
Estuarine water is known to be impacted by human sewage
and fresh waters are in a region whose primary land use is agriculture.
Salinity appeared to influence the occurrence of bovine ribosomal DNA markers from fecal Bacteroides and Prevotella. In saline regions where dairy farming is known to contribute fecal indicators to receiving waters, the occurrence of bovine markers differed. This effect was attributed to either influences of salinity on the PCR process or differing effects of salinity on the survival of different fecal indicator organisms.
0–32 ppt
Sediments Davies et al. 1995
Fresh water sediments from a source with known human sewage impacts and marine sediments from a location
adjacent to a deepwater sewage outfall
In marine sediments the elimination of fecal coliform predators appeared to have minimal influence on fecal coliform persistence or growth (net decay was observed). In fresh water sediments fecal coliforms were observed to grow in the absence of predators.
1.6–35.4‰
Soils

U.S. Environmental Protection Agency
December 2010 C-30
Table 17. Summary of studies examining the influence of incident natural or artificial light on persistence and growth of indicator organisms
Climate Media Study Setting Indicator Organism Response Solar Radiation
Range
Tropical Water column
Bordalo et al. 2002
Estuarine waters with adjusted salinity in laboratory microcosms. Waters were
drawn from an estuary receiving flows from areas of Thailand’s largest urban areas and are considered impacted by human sewage.
Sunlight had an adverse effect on fecal coliform and enterococci survival
Fecal coliform T90 in dark and light conditions for low salinity waters was 82.0 and 37.1 hours, respectively
Enterococci T90 in dark and light conditions for low salinity waters was 97.5 and 40.9 hours, respectively
Fecal coliform T90 in dark and light conditions for high salinity waters was 21.3 and 14.5 hours, respectively
Enterococci T90 in dark and light conditions for high salinity waters was 31.6 and 20.6 hours, respectively
Not reported; natural sunlight was used in experiments
Fujioka et al. 1981
Marine waters from a bathing
beach at a depth of 1.2 m, and fresh waters from a stream
near a forest preserve.
Populations of sewage-borne fecal coliforms and fecal streptococci in seawater were inactivated rapidly (within a few hours) in the presence of sunlight and persisted significantly longer in the absence of sunlight
The decline of fecal coliforms and fecal streptococci in sunlight was faster in marine waters than in fresh waters
Analysis of inactivation at various water depths indicates that the visible light spectrum is primarily responsible for inactivation, not the UV light spectrum
0–0.012 W/cn2
Sediments
Soils
Subtropical Water column
Boehm et al. 2002
Marine waters at beaches near highly urbanized region
in southern California
Indicator organism concentration falls sharply with increasing solar intensity
Indicator organism concentrations rebound quickly with decreasing solar intensity
Ki et al. 2007 Marine waters at a beach and in a coastal marsh near highly urbanized region in southern
California
Sunlight dominates the concentration dynamics of fecal indicator bacteria
Sunlight does not dominate dynamics in a coastal marsh

U.S. Environmental Protection Agency
December 2010 C-31
Rosenfeld et al. 2006
Marine waters at ankle depth,
sampled at 17 locations in a highly urbanized region and
with potential for receiving sewage from an ocean sewage outfall
Nighttime concentrations of total coliforms, E. coli, and enterococci were significantly higher than daytime concentrations
Enterococci exceedances of water quality standards (>104 CFU/100 mL) occurred overwhelmingly between sunset and sunrise
Fecal and total coliform exceedances did not follow sunrise/sunset cycles
Enterococci concentrations rebounded faster after sunset than coliform concentrations
Sinton et al. 1999
Marine water collected from a
location selected based on low coliform counts
All organisms inactivated more rapidly in sunlight than in the dark
Fecal coliform inactivation exhibited shoulder behavior
Influence of sunlight on fecal coliform decay greater than that for F+ RNA coliphages and somatic coliphages
Reported as net insolation (0–25 MJ/m
2);
experiments performed in sunlight and in dark
Sinton et al. 2002
Fresh river water collected
from a stream with low indicator counts; marine water
collected from a site with low indicator counts in Auckland, New Zealand
In dark, fresh water conditions, decay constant of indicators in waste stabilization pond effluent were greater than those in raw sewage. Predation and inhibitory substances are suggested as mechanisms for dark inactivation.
Inactivation via solar radiation increases with increasing salinity for all indicators; salinity had the least effect on enterococci
Inactivation in sunlight is around 10-times that observed in the dark for all indicators
Reported as net insolation (MJ/m
2);
experiments performed in natural sunlight and dark
Noble et al. 2004
Marine water collected from
Santa Monica Bay near Malibu Beach, Malibu, CA (assumed impacted by human sewage) and Fresh water from Malibu Creek State Park (heavily forested, undeveloped site).
For all bacterial indicators (total coliforms, E. coli, and enterococci), decay rate in sunlight was greater than that in the dark by at least a factor of 5
Sediments
Soils
Temperate Water column
Alkan et al. 1995
Marine water collected from
the North Sea Coast of the UK, away from know sewage outfalls or sludge dumping
The effect of light (as irradiance in W/m2) on
decay rate of E. coli was linear for samples at the water surface of the mesocosm
There was no die-off observed in E. coli
100–900 W/m2
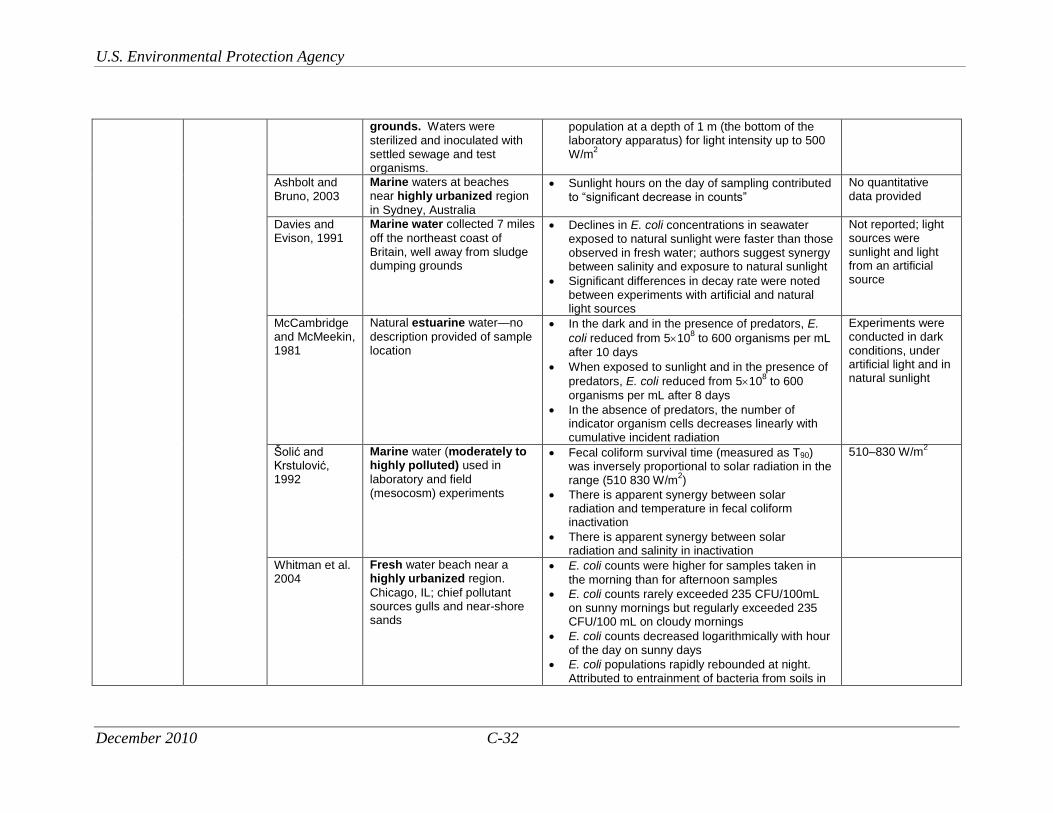
U.S. Environmental Protection Agency
December 2010 C-32
grounds. Waters were
sterilized and inoculated with settled sewage and test organisms.
population at a depth of 1 m (the bottom of the laboratory apparatus) for light intensity up to 500 W/m
2
Ashbolt and Bruno, 2003
Marine waters at beaches near highly urbanized region
in Sydney, Australia
Sunlight hours on the day of sampling contributed to “significant decrease in counts”
No quantitative data provided
Davies and Evison, 1991
Marine water collected 7 miles
off the northeast coast of Britain, well away from sludge dumping grounds
Declines in E. coli concentrations in seawater exposed to natural sunlight were faster than those observed in fresh water; authors suggest synergy between salinity and exposure to natural sunlight
Significant differences in decay rate were noted between experiments with artificial and natural light sources
Not reported; light sources were sunlight and light from an artificial source
McCambridge and McMeekin, 1981
Natural estuarine water—no
description provided of sample location
In the dark and in the presence of predators, E.
coli reduced from 5108 to 600 organisms per mL
after 10 days
When exposed to sunlight and in the presence of
predators, E. coli reduced from 5108 to 600
organisms per mL after 8 days
In the absence of predators, the number of indicator organism cells decreases linearly with cumulative incident radiation
Experiments were conducted in dark conditions, under artificial light and in natural sunlight
Šolić and Krstulović, 1992
Marine water (moderately to highly polluted) used in
laboratory and field (mesocosm) experiments
Fecal coliform survival time (measured as T90) was inversely proportional to solar radiation in the range (510 830 W/m
2)
There is apparent synergy between solar radiation and temperature in fecal coliform inactivation
There is apparent synergy between solar radiation and salinity in inactivation
510–830 W/m2
Whitman et al. 2004
Fresh water beach near a highly urbanized region.
Chicago, IL; chief pollutant sources gulls and near-shore sands
E. coli counts were higher for samples taken in
the morning than for afternoon samples
E. coli counts rarely exceeded 235 CFU/100mL on sunny mornings but regularly exceeded 235 CFU/100 mL on cloudy mornings
E. coli counts decreased logarithmically with hour of the day on sunny days
E. coli populations rapidly rebounded at night. Attributed to entrainment of bacteria from soils in
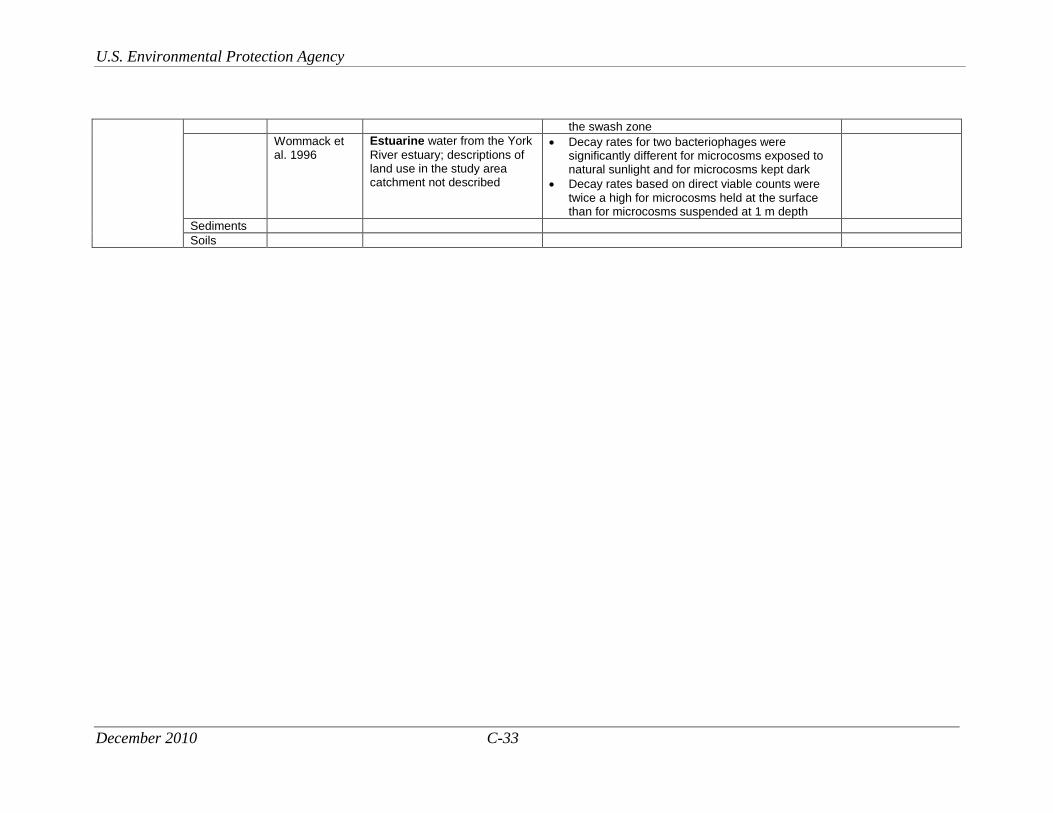
U.S. Environmental Protection Agency
December 2010 C-33
the swash zone
Wommack et al. 1996
Estuarine water from the York
River estuary; descriptions of land use in the study area catchment not described
Decay rates for two bacteriophages were significantly different for microcosms exposed to natural sunlight and for microcosms kept dark
Decay rates based on direct viable counts were twice a high for microcosms held at the surface than for microcosms suspended at 1 m depth
Sediments
Soils
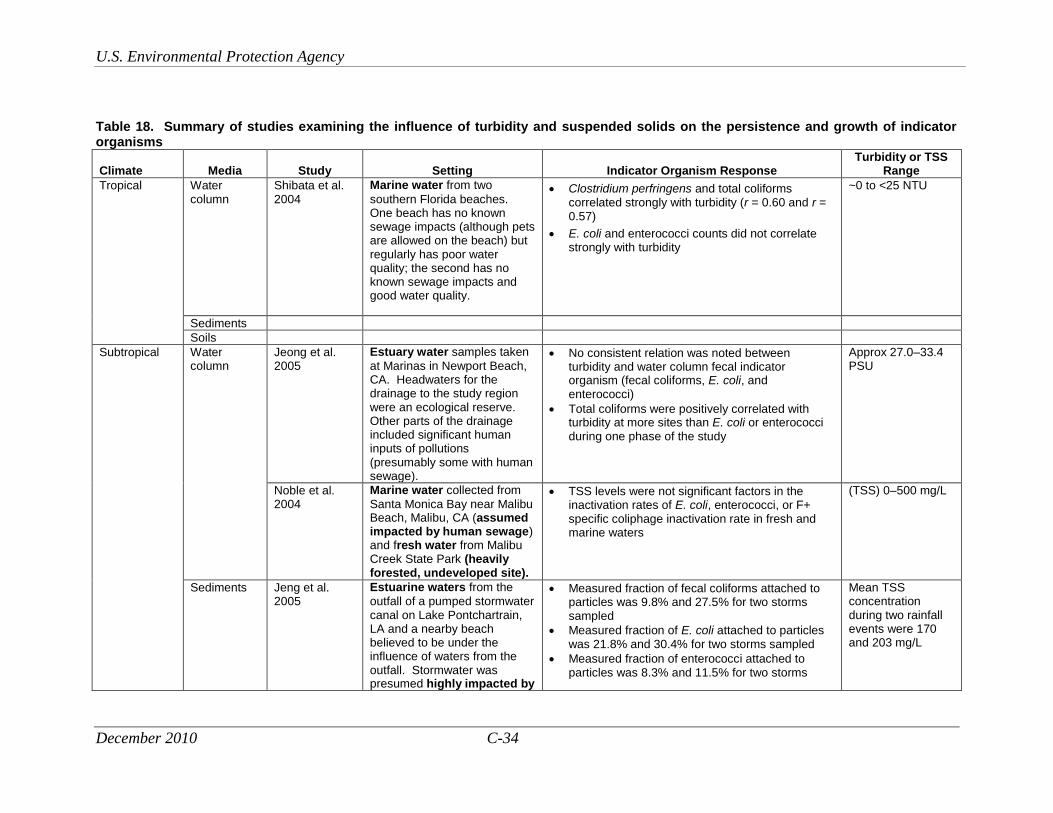
U.S. Environmental Protection Agency
December 2010 C-34
Table 18. Summary of studies examining the influence of turbidity and suspended solids on the persistence and growth of indicator organisms
Climate Media Study Setting Indicator Organism Response Turbidity or TSS
Range
Tropical Water column
Shibata et al. 2004
Marine water from two
southern Florida beaches. One beach has no known sewage impacts (although pets are allowed on the beach) but regularly has poor water quality; the second has no known sewage impacts and good water quality.
Clostridium perfringens and total coliforms correlated strongly with turbidity (r = 0.60 and r = 0.57)
E. coli and enterococci counts did not correlate strongly with turbidity
~0 to <25 NTU
Sediments
Soils
Subtropical Water column
Jeong et al. 2005
Estuary water samples taken
at Marinas in Newport Beach, CA. Headwaters for the drainage to the study region were an ecological reserve. Other parts of the drainage included significant human inputs of pollutions (presumably some with human sewage).
No consistent relation was noted between turbidity and water column fecal indicator organism (fecal coliforms, E. coli, and enterococci)
Total coliforms were positively correlated with turbidity at more sites than E. coli or enterococci during one phase of the study
Approx 27.0–33.4 PSU
Noble et al. 2004
Marine water collected from
Santa Monica Bay near Malibu Beach, Malibu, CA (assumed impacted by human sewage) and fresh water from Malibu Creek State Park (heavily forested, undeveloped site).
TSS levels were not significant factors in the inactivation rates of E. coli, enterococci, or F+ specific coliphage inactivation rate in fresh and marine waters
(TSS) 0–500 mg/L
Sediments Jeng et al. 2005
Estuarine waters from the
outfall of a pumped stormwater canal on Lake Pontchartrain, LA and a nearby beach believed to be under the influence of waters from the outfall. Stormwater was presumed highly impacted by
Measured fraction of fecal coliforms attached to particles was 9.8% and 27.5% for two storms sampled
Measured fraction of E. coli attached to particles was 21.8% and 30.4% for two storms sampled
Measured fraction of enterococci attached to particles was 8.3% and 11.5% for two storms
Mean TSS concentration during two rainfall events were 170 and 203 mg/L
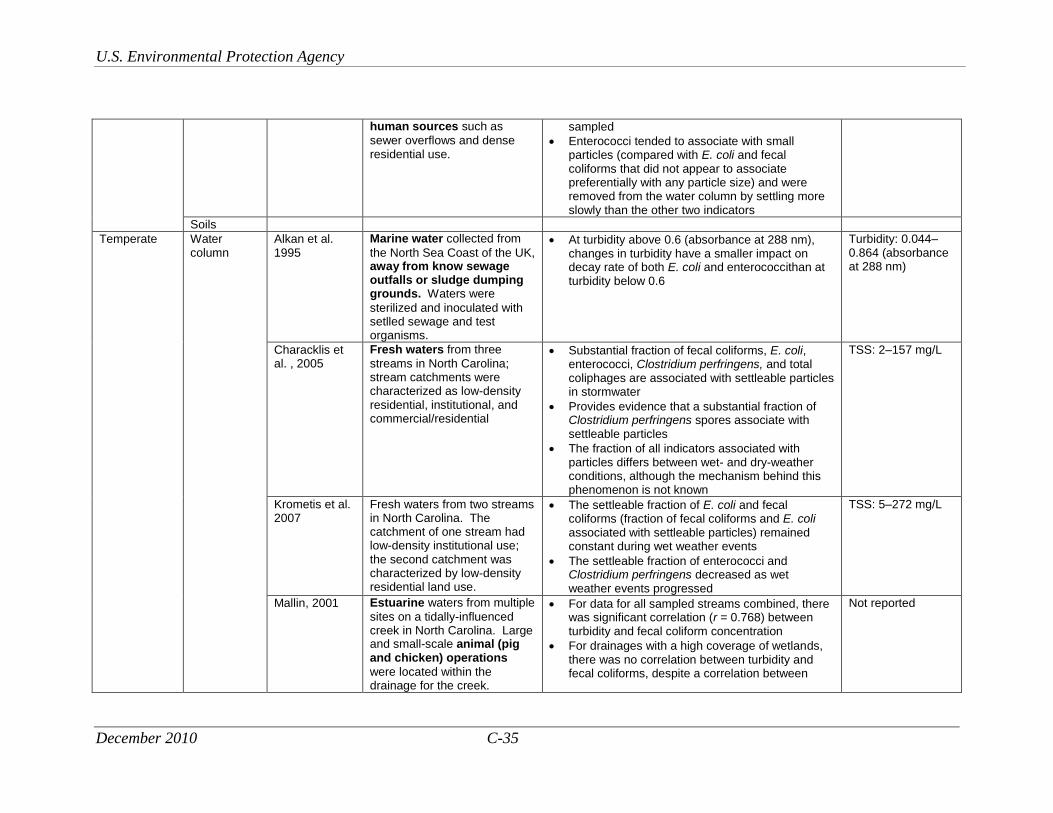
U.S. Environmental Protection Agency
December 2010 C-35
human sources such as
sewer overflows and dense residential use.
sampled
Enterococci tended to associate with small particles (compared with E. coli and fecal coliforms that did not appear to associate preferentially with any particle size) and were removed from the water column by settling more slowly than the other two indicators
Soils
Temperate Water column
Alkan et al. 1995
Marine water collected from
the North Sea Coast of the UK, away from know sewage outfalls or sludge dumping grounds. Waters were
sterilized and inoculated with setlled sewage and test organisms.
At turbidity above 0.6 (absorbance at 288 nm), changes in turbidity have a smaller impact on decay rate of both E. coli and enterococcithan at turbidity below 0.6
Turbidity: 0.044–0.864 (absorbance at 288 nm)
Characklis et al. , 2005
Fresh waters from three
streams in North Carolina; stream catchments were characterized as low-density residential, institutional, and commercial/residential
Substantial fraction of fecal coliforms, E. coli, enterococci, Clostridium perfringens, and total coliphages are associated with settleable particles in stormwater
Provides evidence that a substantial fraction of Clostridium perfringens spores associate with settleable particles
The fraction of all indicators associated with particles differs between wet- and dry-weather conditions, although the mechanism behind this phenomenon is not known
TSS: 2–157 mg/L
Krometis et al. 2007
Fresh waters from two streams in North Carolina. The catchment of one stream had low-density institutional use; the second catchment was characterized by low-density residential land use.
The settleable fraction of E. coli and fecal coliforms (fraction of fecal coliforms and E. coli associated with settleable particles) remained constant during wet weather events
The settleable fraction of enterococci and Clostridium perfringens decreased as wet weather events progressed
TSS: 5–272 mg/L
Mallin, 2001 Estuarine waters from multiple
sites on a tidally-influenced creek in North Carolina. Large and small-scale animal (pig and chicken) operations
were located within the drainage for the creek.
For data for all sampled streams combined, there was significant correlation (r = 0.768) between turbidity and fecal coliform concentration
For drainages with a high coverage of wetlands, there was no correlation between turbidity and fecal coliforms, despite a correlation between
Not reported
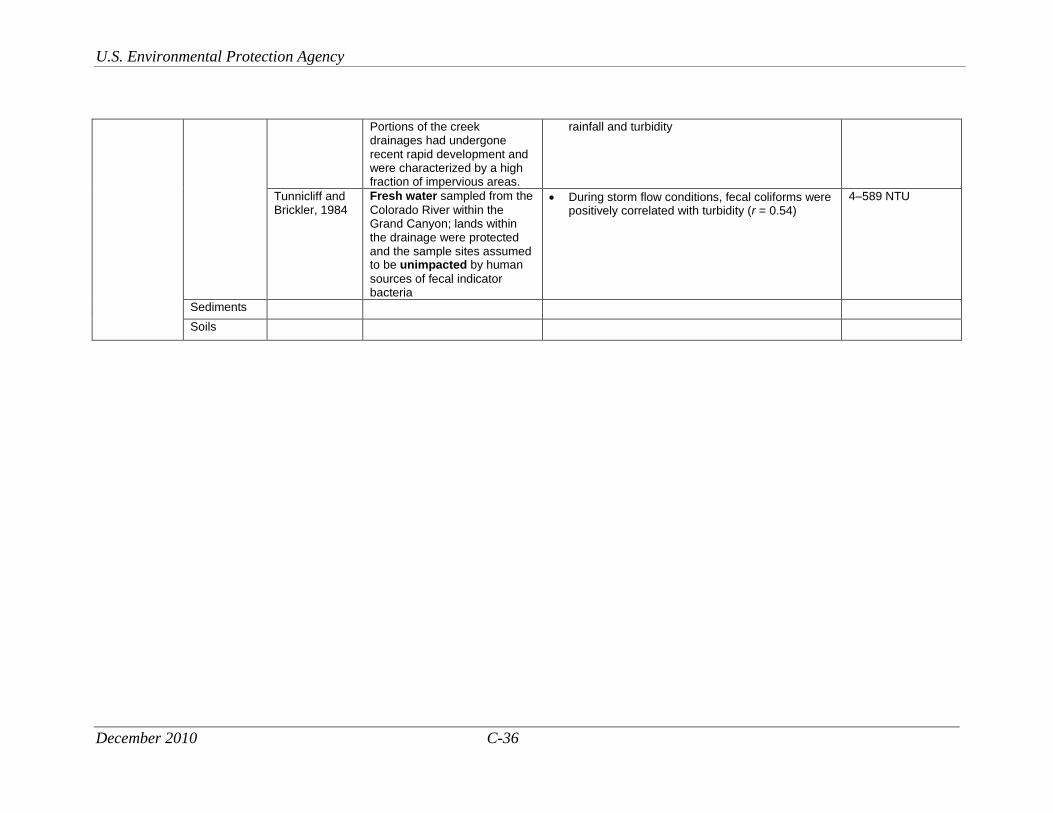
U.S. Environmental Protection Agency
December 2010 C-36
Portions of the creek drainages had undergone recent rapid development and were characterized by a high fraction of impervious areas.
rainfall and turbidity
Tunnicliff and Brickler, 1984
Fresh water sampled from the
Colorado River within the Grand Canyon; lands within the drainage were protected and the sample sites assumed to be unimpacted by human
sources of fecal indicator bacteria
During storm flow conditions, fecal coliforms were positively correlated with turbidity (r = 0.54)
4–589 NTU
Sediments
Soils

U.S. Environmental Protection Agency
December 2010 C-37
Table 19. Summary of studies examining the influence of rainfall and runoff on persistence and growth of indicator organisms Climate Media Study Setting Indicator Organism Response Rainfall
Tropical Water column
Bonilla et al. 2007
Marine waters sampled at
three south Florida beaches near large urban areas and assumed to be influenced by human sewage
Variations in rainfall and turbidity (combined) could predict 36% of the variation in somatic coliphages from the water column at one site
Not reported
Sediments Bonilla et al. 2007
Marine sediments sampled at
three south Florida beaches near large urban areas and assumed to be influenced by human sewage
At one site, rainfall and temperature could predict a significant proportion of the variance observed with enterococci in wet sands (sediments)
Not reported
Soils Bonilla et al. 2007
Marine sediments sampled at
three south Florida beaches near large urban areas and assumed to be influenced by human sewage
At two sites, rainfall or rainfall and turbidity could predict a significant proportion of the variance observed with enterococci, E. coli, and fecal
coliforms in dry sand
Not reported
Subtropical Water column
Lipp et al. 2001
Estuary waters from 12 sites.
Drainages for 6 sites had high off-site disposal system density. Drainages for rivers draining to estuary had low urban use.
Water column fecal coliform bacteria positively correlated with 7-day antecedent rainfall (correlation coefficient 0.260)
Water column enterococci concentration positively correlated with 7-day antecedent rainfall (r = 0.397)
5.1–28.1 cm/month
Ackerman and Weisberg, 2003
Marine waters from beaches
in the City of Los Angeles, CA. Beaches differed in their distance from stormwater runoff conveyances; three beaches were in protected embayments.
Every storm larger than 25 mm resulted in an increase in the number of beach sites failing water quality standards compared with dry weather and background conditions
91% of rain events between 6 mm and 25 mm resulted in an increase in the number of beaches failing state water quality standards
There was almost no increase above background of the number of beaches failing state water quality standards for storms <2.5 mm
For large storms, the highest recorded fecal coliform concentrations occurred the day after the storm
For small storms, the highest bacteria concentration occurred on the second day after the storm
Average fecal coliform concentrations returned to
0–ca 90 mm (per rain event)

U.S. Environmental Protection Agency
December 2010 C-38
background levels within 5 days of a rain event
The period between storms had a minimal effect on the relationship between rainfall and fecal coliforms
Dwight et al. 2002
Marine waters from 22 beach
sites in southern California. Due to the incidence of beach closures and land use, the area was highly-urbanized and impacted by human sewage sources.
Precipitation was strongly associated with river discharge and river discharge was associated with high total coliform levels for beaches in the vicinity of the river discharges.
Wet months were classified as those in which more than 25 mm of precipitation was recorded
Ferguson et al. 1996
Estuarine waters from sites
along the Georges River, Sydney Australia. The study area was characterized by urban use and periodic
sewage overflow events.
Rainfall was associated with significant increases in fecal coliforms, fecal streptococci, Clostridium perfringens, Aeromonas spp., and F+ RNA bacteriophages.
Not reported
Sediments Lipp et al. 2001
Estuary waters from 12 sites.
Drainages for 6 sites had high off-site disposal system density; drainages for rivers draining to Estuary had low urban use.
Sediment enterococci concentration positively correlated with 7-day antecedent rainfall (r = 0.353)
5.1–28.1 cm/month
Ferguson et al. 1996
Sediments from estuarine waters from sites along the
Georges River, Sydney Australia. The study area was characterized by urban use
and periodic sewage overflow events. Sites were between 3 and 22.5 km from outfalls.
Rainfall was not associated with significant increases in fecal streptococci, Clostridium perfringens, Aeromonas spp., and F+ RNA bacteriophages in sediments
Rainfall was associated with significant increases in fecal coliforms in sediments
Not reported
Jeng et al. 2005
Estuarine sediments from the
outfall of a pumped stormwater canal on Lake Pontchartrain, LA and a nearby beach believed to be under the influence of waters from the outfall. Stormwater presumed to be highly impacted by human sources such as
sewer overflows and dense
Concentrations of E. coli, fecal coliforms, and enterococci increased after rainfall, but the increase was not correlated with the rainfall intensity or stormwater canal pumping volume, likely because of the small number of events sampled.
Sediment enterococci concentrations tended to be higher and recede more slowly after rain events than did fecal coliform and E. coli concentrations
Two rainfall events: 4.3 mm and 29.2 mm.
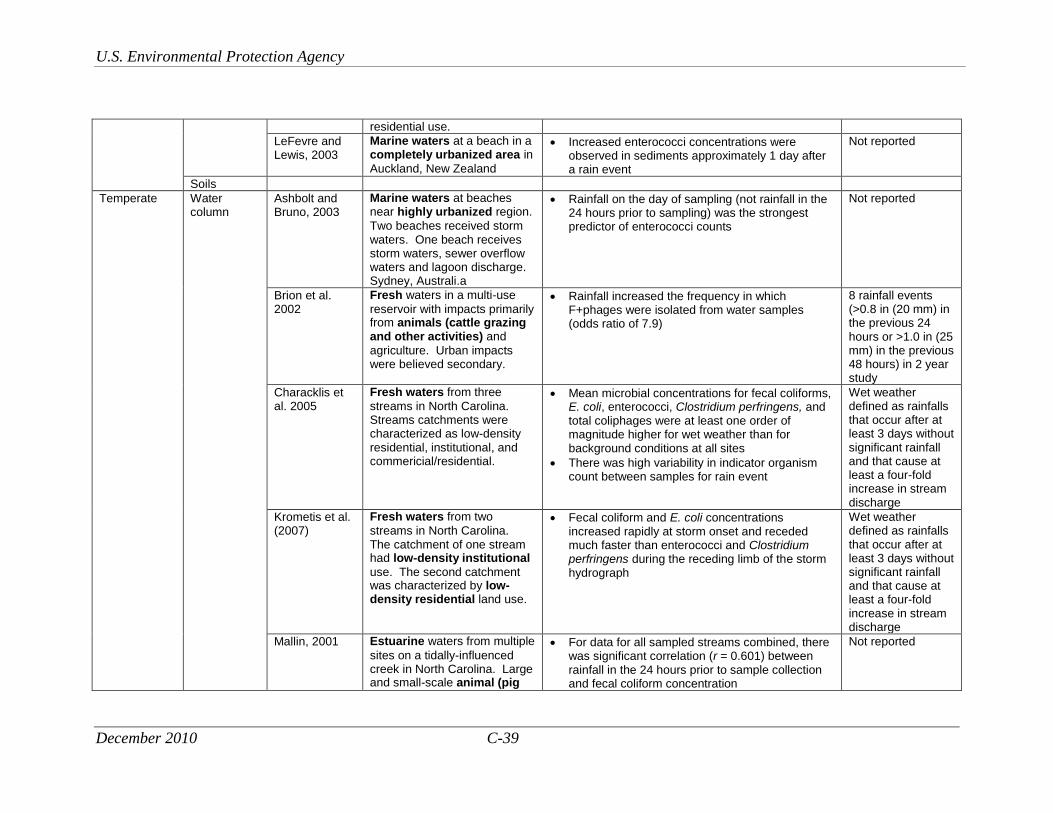
U.S. Environmental Protection Agency
December 2010 C-39
residential use.
LeFevre and Lewis, 2003
Marine waters at a beach in a completely urbanized area in
Auckland, New Zealand
Increased enterococci concentrations were observed in sediments approximately 1 day after a rain event
Not reported
Soils
Temperate Water column
Ashbolt and Bruno, 2003
Marine waters at beaches near highly urbanized region.
Two beaches received storm waters. One beach receives storm waters, sewer overflow waters and lagoon discharge. Sydney, Australi.a
Rainfall on the day of sampling (not rainfall in the 24 hours prior to sampling) was the strongest predictor of enterococci counts
Not reported
Brion et al. 2002
Fresh waters in a multi-use
reservoir with impacts primarily from animals (cattle grazing and other activities) and
agriculture. Urban impacts were believed secondary.
Rainfall increased the frequency in which F+phages were isolated from water samples (odds ratio of 7.9)
8 rainfall events (>0.8 in (20 mm) in the previous 24 hours or >1.0 in (25 mm) in the previous 48 hours) in 2 year study
Characklis et al. 2005
Fresh waters from three
streams in North Carolina. Streams catchments were characterized as low-density residential, institutional, and commericial/residential.
Mean microbial concentrations for fecal coliforms, E. coli, enterococci, Clostridium perfringens, and total coliphages were at least one order of magnitude higher for wet weather than for background conditions at all sites
There was high variability in indicator organism count between samples for rain event
Wet weather defined as rainfalls that occur after at least 3 days without significant rainfall and that cause at least a four-fold increase in stream discharge
Krometis et al. (2007)
Fresh waters from two
streams in North Carolina. The catchment of one stream had low-density institutional
use. The second catchment was characterized by low-density residential land use.
Fecal coliform and E. coli concentrations increased rapidly at storm onset and receded much faster than enterococci and Clostridium perfringens during the receding limb of the storm hydrograph
Wet weather defined as rainfalls that occur after at least 3 days without significant rainfall and that cause at least a four-fold increase in stream discharge
Mallin, 2001 Estuarine waters from multiple
sites on a tidally-influenced creek in North Carolina. Large and small-scale animal (pig
For data for all sampled streams combined, there was significant correlation (r = 0.601) between rainfall in the 24 hours prior to sample collection and fecal coliform concentration
Not reported
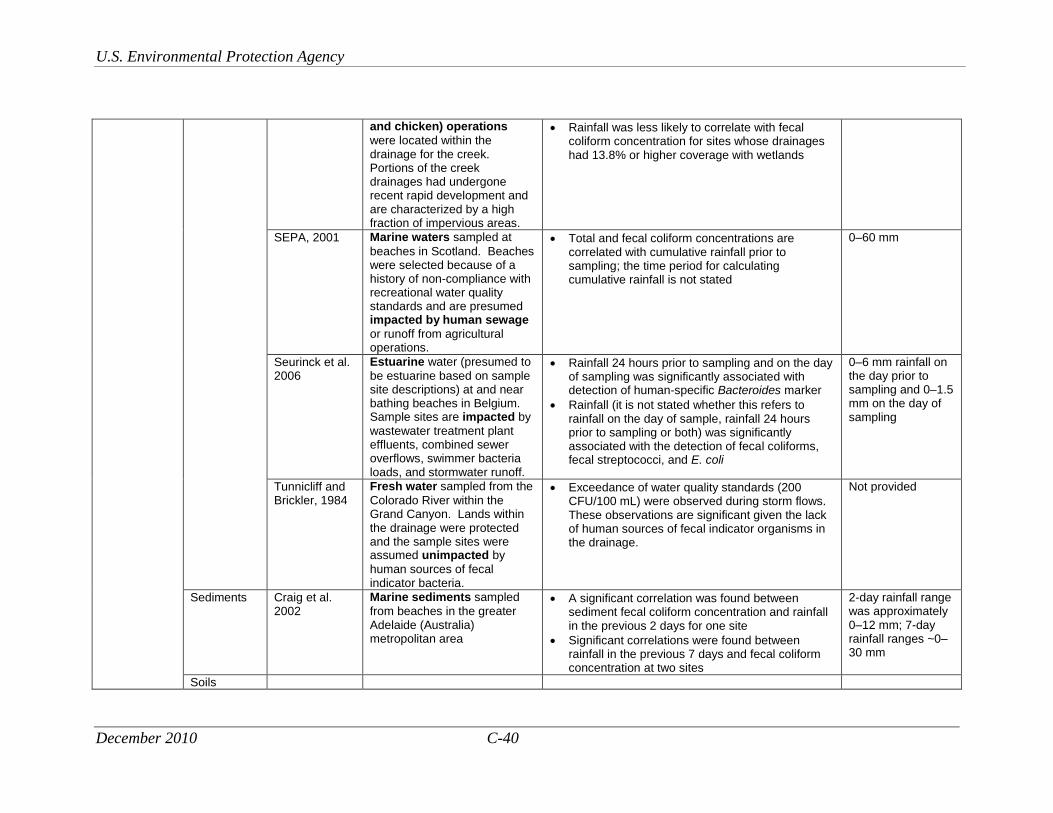
U.S. Environmental Protection Agency
December 2010 C-40
and chicken) operations
were located within the drainage for the creek. Portions of the creek drainages had undergone recent rapid development and are characterized by a high fraction of impervious areas.
Rainfall was less likely to correlate with fecal coliform concentration for sites whose drainages had 13.8% or higher coverage with wetlands
SEPA, 2001 Marine waters sampled at
beaches in Scotland. Beaches were selected because of a history of non-compliance with recreational water quality standards and are presumed impacted by human sewage
or runoff from agricultural operations.
Total and fecal coliform concentrations are correlated with cumulative rainfall prior to sampling; the time period for calculating cumulative rainfall is not stated
0–60 mm
Seurinck et al. 2006
Estuarine water (presumed to
be estuarine based on sample site descriptions) at and near bathing beaches in Belgium. Sample sites are impacted by
wastewater treatment plant effluents, combined sewer overflows, swimmer bacteria loads, and stormwater runoff.
Rainfall 24 hours prior to sampling and on the day of sampling was significantly associated with detection of human-specific Bacteroides marker
Rainfall (it is not stated whether this refers to rainfall on the day of sample, rainfall 24 hours prior to sampling or both) was significantly associated with the detection of fecal coliforms, fecal streptococci, and E. coli
0–6 mm rainfall on the day prior to sampling and 0–1.5 mm on the day of sampling
Tunnicliff and Brickler, 1984
Fresh water sampled from the
Colorado River within the Grand Canyon. Lands within the drainage were protected and the sample sites were assumed unimpacted by
human sources of fecal indicator bacteria.
Exceedance of water quality standards (200 CFU/100 mL) were observed during storm flows. These observations are significant given the lack of human sources of fecal indicator organisms in the drainage.
Not provided
Sediments Craig et al. 2002
Marine sediments sampled
from beaches in the greater Adelaide (Australia) metropolitan area
A significant correlation was found between sediment fecal coliform concentration and rainfall in the previous 2 days for one site
Significant correlations were found between rainfall in the previous 7 days and fecal coliform concentration at two sites
2-day rainfall range was approximately 0–12 mm; 7-day rainfall ranges ~0–30 mm
Soils
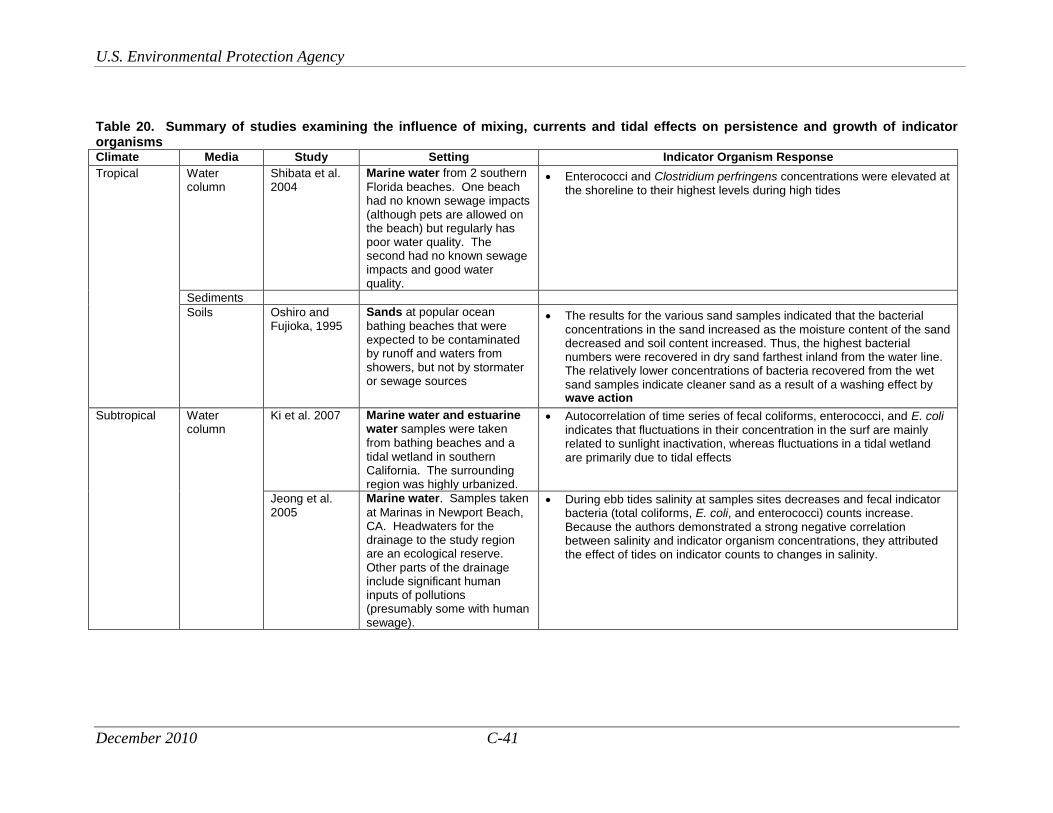
U.S. Environmental Protection Agency
December 2010 C-41
Table 20. Summary of studies examining the influence of mixing, currents and tidal effects on persistence and growth of indicator organisms Climate Media Study Setting Indicator Organism Response
Tropical Water column
Shibata et al. 2004
Marine water from 2 southern
Florida beaches. One beach had no known sewage impacts (although pets are allowed on the beach) but regularly has poor water quality. The second had no known sewage impacts and good water quality.
Enterococci and Clostridium perfringens concentrations were elevated at the shoreline to their highest levels during high tides
Sediments
Soils Oshiro and Fujioka, 1995
Sands at popular ocean
bathing beaches that were expected to be contaminated by runoff and waters from showers, but not by stormater or sewage sources
The results for the various sand samples indicated that the bacterial concentrations in the sand increased as the moisture content of the sand decreased and soil content increased. Thus, the highest bacterial numbers were recovered in dry sand farthest inland from the water line. The relatively lower concentrations of bacteria recovered from the wet sand samples indicate cleaner sand as a result of a washing effect by wave action
Subtropical Water column
Ki et al. 2007 Marine water and estuarine water samples were taken
from bathing beaches and a tidal wetland in southern California. The surrounding region was highly urbanized.
Autocorrelation of time series of fecal coliforms, enterococci, and E. coli indicates that fluctuations in their concentration in the surf are mainly related to sunlight inactivation, whereas fluctuations in a tidal wetland are primarily due to tidal effects
Jeong et al. 2005
Marine water. Samples taken
at Marinas in Newport Beach, CA. Headwaters for the drainage to the study region are an ecological reserve. Other parts of the drainage include significant human inputs of pollutions (presumably some with human sewage).
During ebb tides salinity at samples sites decreases and fecal indicator bacteria (total coliforms, E. coli, and enterococci) counts increase. Because the authors demonstrated a strong negative correlation between salinity and indicator organism concentrations, they attributed the effect of tides on indicator counts to changes in salinity.
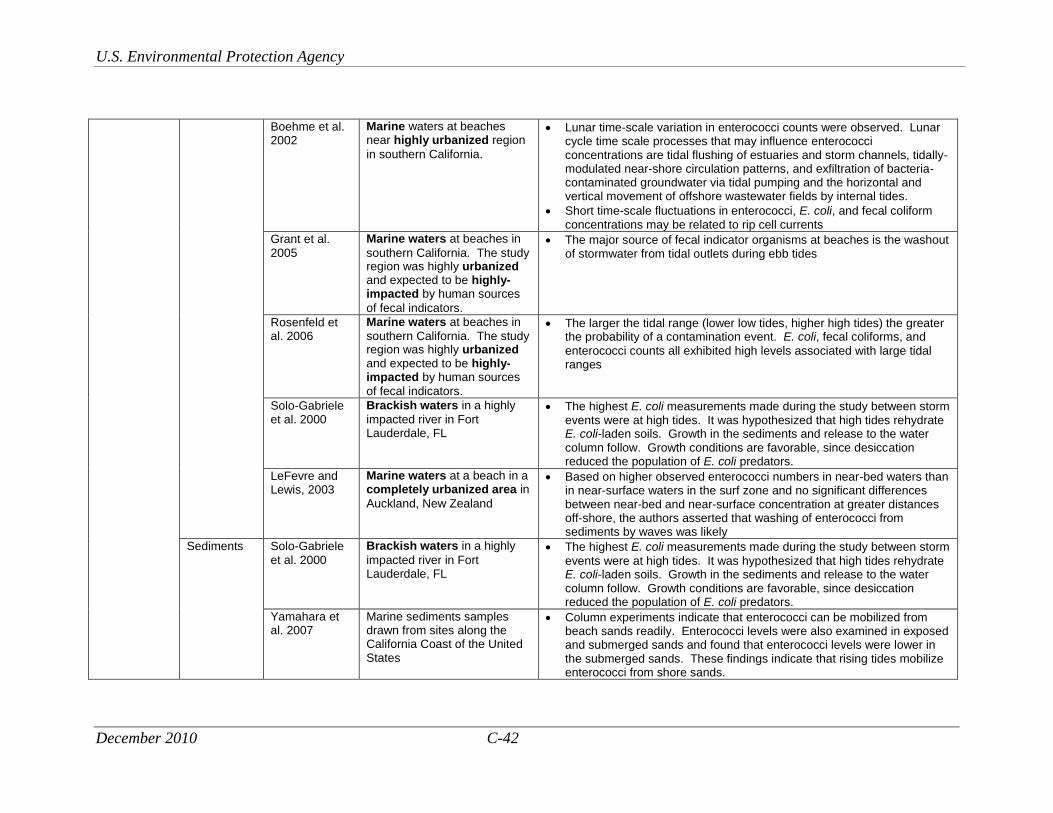
U.S. Environmental Protection Agency
December 2010 C-42
Boehme et al. 2002
Marine waters at beaches near highly urbanized region
in southern California.
Lunar time-scale variation in enterococci counts were observed. Lunar cycle time scale processes that may influence enterococci concentrations are tidal flushing of estuaries and storm channels, tidally-modulated near-shore circulation patterns, and exfiltration of bacteria-contaminated groundwater via tidal pumping and the horizontal and vertical movement of offshore wastewater fields by internal tides.
Short time-scale fluctuations in enterococci, E. coli, and fecal coliform concentrations may be related to rip cell currents
Grant et al. 2005
Marine waters at beaches in
southern California. The study region was highly urbanized and expected to be highly-impacted by human sources
of fecal indicators.
The major source of fecal indicator organisms at beaches is the washout of stormwater from tidal outlets during ebb tides
Rosenfeld et al. 2006
Marine waters at beaches in
southern California. The study region was highly urbanized and expected to be highly-impacted by human sources
of fecal indicators.
The larger the tidal range (lower low tides, higher high tides) the greater the probability of a contamination event. E. coli, fecal coliforms, and
enterococci counts all exhibited high levels associated with large tidal ranges
Solo-Gabriele et al. 2000
Brackish waters in a highly
impacted river in Fort Lauderdale, FL
The highest E. coli measurements made during the study between storm events were at high tides. It was hypothesized that high tides rehydrate E. coli-laden soils. Growth in the sediments and release to the water column follow. Growth conditions are favorable, since desiccation reduced the population of E. coli predators.
LeFevre and Lewis, 2003
Marine waters at a beach in a completely urbanized area in
Auckland, New Zealand
Based on higher observed enterococci numbers in near-bed waters than in near-surface waters in the surf zone and no significant differences between near-bed and near-surface concentration at greater distances off-shore, the authors asserted that washing of enterococci from sediments by waves was likely
Sediments Solo-Gabriele et al. 2000
Brackish waters in a highly
impacted river in Fort Lauderdale, FL
The highest E. coli measurements made during the study between storm
events were at high tides. It was hypothesized that high tides rehydrate E. coli-laden soils. Growth in the sediments and release to the water column follow. Growth conditions are favorable, since desiccation reduced the population of E. coli predators.
Yamahara et al. 2007
Marine sediments samples drawn from sites along the California Coast of the United States
Column experiments indicate that enterococci can be mobilized from beach sands readily. Enterococci levels were also examined in exposed and submerged sands and found that enterococci levels were lower in the submerged sands. These findings indicate that rising tides mobilize enterococci from shore sands.

U.S. Environmental Protection Agency
December 2010 C-43
Soils
Temperate Water column
Alkan et al. 1995
Marine water collected from
the North Sea Coast of the UK, away from know sewage outfalls or sludge dumping grounds. Waters were
sterilized and inoculated with setlled sewage and test organisms.
In the absence of mixing of a laboratory mesocosm, die-off (inactivation rate constant) was significantly related to turbidity
Higher levels of mixing yielded higher decay rates for E. coli and enterococci
Lower levels of mixing and high levels of turbidity yielded lower rates of inactivation at the bottom of the mesocosm
An et al. 2002 Fresh waters in a multi-use
reservoir in Oklahoma with relatively few fecal impacts
There was a direct relationship between amount of gasoline sold, which was related to recreational boating activity, and the resuspension of E. coli. This indicated that recreational boating activity in lake marinas may have resuspended bottom sediments with bound E. coli, and the presence of E. coli in marinas was not an indication of recent fecal
contamination.
Ashbolt and Bruno, 2003
Marine waters at beaches near highly urbanized region
in Sydney, Australia
Density currents related to differences in temperature and salinity appeared to direct primary sewage plume waters onshore
Wind effects explain peaks in enterococci counts not related to storm events
Sediments Shiaris et al. 1987
Marine sediments and overlying waters drawn from
an intertidal mud flat in Boston Harbor, MA. The harbor received sewage flows, including combined sewer overflows.
78% of the variation in levels of enterococci, E. coli, fecal coliforms, and Vibrio parahaemolyticus in sediments could be accounted for by tidal exposure (minutes per tidal cycle)
Soils Whitman and Nevers, 2003
Fresh water, foreshore sands,
Lake Michigan in Chicago, IL. Water can be assumed to be impacted by human sources (runoff) and impacted by animal sources (bird feces).
Wind speed, wave height, and wind direction were useful for predicting E. coli concentration in sand. This effect may be direct or may be the
result of the impact wind speed and direction on other physical parameters influencing E. coli counts.

U.S. Environmental Protection Agency
December 2010 C-44
Table 21. Survey contamination
of alternative microbiological and chemical indicators of fecal
Alternate Indicator Organism Climate
Environmental Medium
Water Type/ Description
Geographic Region Study
Bacteria
Bacteroides spp. (B. fragilis)
Temperate Water (culturable)
Lake Washington Ship Canal
Washington Fiksdal et al. 1985
Bacteroides-Prevotella
Temperate Water (human- and cow-specific)
Estuarine and inland streams
Oregon Bernhard and Field 2000
Bacteroides-Prevotella
(Sub)tropical Water (human-specific molecular marker)
Coastal beach
California Boehm et al. 2003
Bacteroides Temperate Water (total-, human-, and cow-specific markers)
Great Lakes beaches
Wisconsin Bower et al. 2005
Bacteroides spp.
Subtropical Water (general- and human-specific markers)
Coastal beach and inland stream
Hawaii Betancourt and Fujioka 2006
Bacteroides Temperate Water Coastal Belgium Seurinck al. 2006
et
Bacteroides (Sub)tropical Water Coastal beaches
California Colford et al. 2007
Bacteroides (Sub)tropical Water (human-specific molecular marker)
Coastal beach
California Santoro and Boehm 2007
Bacteroides Temperate Water (general, human-, ruminant-, and swine-specific markers)
Inland streams
Canada Walters al. 2007
et
Bacteroides (Sub)tropical Water and sand (human-specific molecular marker)
Coastal beaches
California Yamahara et al. 2007
Bifidobacterium adolescentis
Tropical Water (culturable)
River watershed
Puerto Rico Carillo et al. 1985
Bifidobacterium spp.
Temperate Water (human- and cow-specific)
Estuarine and inland streams
Oregon Bernhard and Field 2000
Clostridium perfringens
Tropical Water (culturable)
Freshwaters Sierra Leone Wright 1989

U.S. Environmental Protection Agency
December 2010 C-45
Alternate Indicator Organism Climate
Environmental Medium
Water Type/ Description
Geographic Region Study
C. perfringens (Sub)tropical Sediment (culturable)
Marine beach and inland stream
Australia Davies et al. 1995
C. perfringens (Sub)tropical Water (culturable)
Coastal surface waters and groundwater
Florida Paul 1995
et al.
C. perfringens (Sub)tropical Water and sediment (culturable)
Coastal estuarine
Australia Ferguson et al. 1996
C. perfringens Temperate Water and sediment (culturable)
Marine water and sediments, groundwater
Spain Lucena et al. 1996
C. perfringens (Sub)tropical Water and sediment
Estuary Florida Lipp et al. 2001
C. perfringens (Sub)tropical Water and sand (culturable)
Inland river Florida Desmarais et al. 2002
C. perfringens (Sub)tropical Water and sediment
Inland river, pond, lake
Florida Harwood and Rose 2004
C. perfringens Tropical Water and sand (culturable)
Coastal beaches
Florida Shibata et al. 2004
Bacteriophage
Bacteroides fragilis (HSP40)
Temperate Water and sediment (plaque assay)
Marine water and sediments, groundwater
Spain Lucena et al. 1996
Bacteroides (GB-124)
Temperate Water (molecular)
Inland river United Kingdom
Ebdon et al. 2007
F+ and somatic coliphage; F+ RNA coliphage
Temperate Water (plaque assay)
Great Lakes beaches
Canada Palmateer et al. 1991
Somatic coliphage
Temperate Water and sediment (plaque assay)
Marine water and sediments, groundwater
Spain Lucena et al. 1996
Coliphage (Sub)tropical Water Coastal beach, bay, inland stream and canal
Hawaii Paul 1997
et al.
Somatic coliphage
(Sub)tropical Water and sediment (plaque assay)
Coastal beach
Australia Craig et al. 2001

U.S. Environmental Protection Agency
December 2010 C-46
Alternate Indicator Organism Climate
Environmental Medium
Water Type/ Description
Geographic Region Study
F+ RNA coliphage and somatic coliphage
(Sub)tropical Water Sea, estuary, inland river, stabilization pond, sewage plant
Australia Sinton 2002
et al.
F+ RNA coliphage
(Sub)tropical Water and sediment
Inland river, pond, lake
Florida Harwood and Rose 2004
F+ RNA coliphage
(Sub)tropical Water Inland streams
Hawaii Luther and Fujioka 2004
F+ specific coliphage
(Sub)tropical Water Coastal beach and bay
California Noble et al. 2004
F+ and somatic coliphage
(Sub)tropical Water and sand (plaque assay)
Coastal beach
Florida Bonilla et al. 2007
Total coliphage; F+ and somatic coliphage; F+ RNA coliphage
Temperate Water (plaque assay and molecular)
Watershed (stream and reservoir)
Kentucky Brion et al. 2002
F+ and somatic coliphage
(Sub)tropical Water Coastal beaches
California Colford et al. 2007
Chemical
Coprostanol (Sub)tropical Water and sediment
Coastal Australia Nichols et al. 1993
Fecal sterols and linear alkyl benzenes
(Sub)tropical Sediment Coastal California Phillips et al. 1997
Coprostanol and trialkylamines
(Sub)tropical Sediment Coastal California Maldonado et al. 2000
10 fecal sterols, including coprostanol
Tropical Water and sediment
Inland and estuarine
Malaysia and Vietnam
Isobe et al. 2002
Caffeine Temperate Water Coastal bay Massachusetts Seigener and Chen 2002
Coprostanol Tropical and temperate
Water Inland rivers Vietnam and Japan
Isobe et al. 2004
Optical brighteners
Temperate Water Coastal bays
Virginia Hagedorn et al. 2005
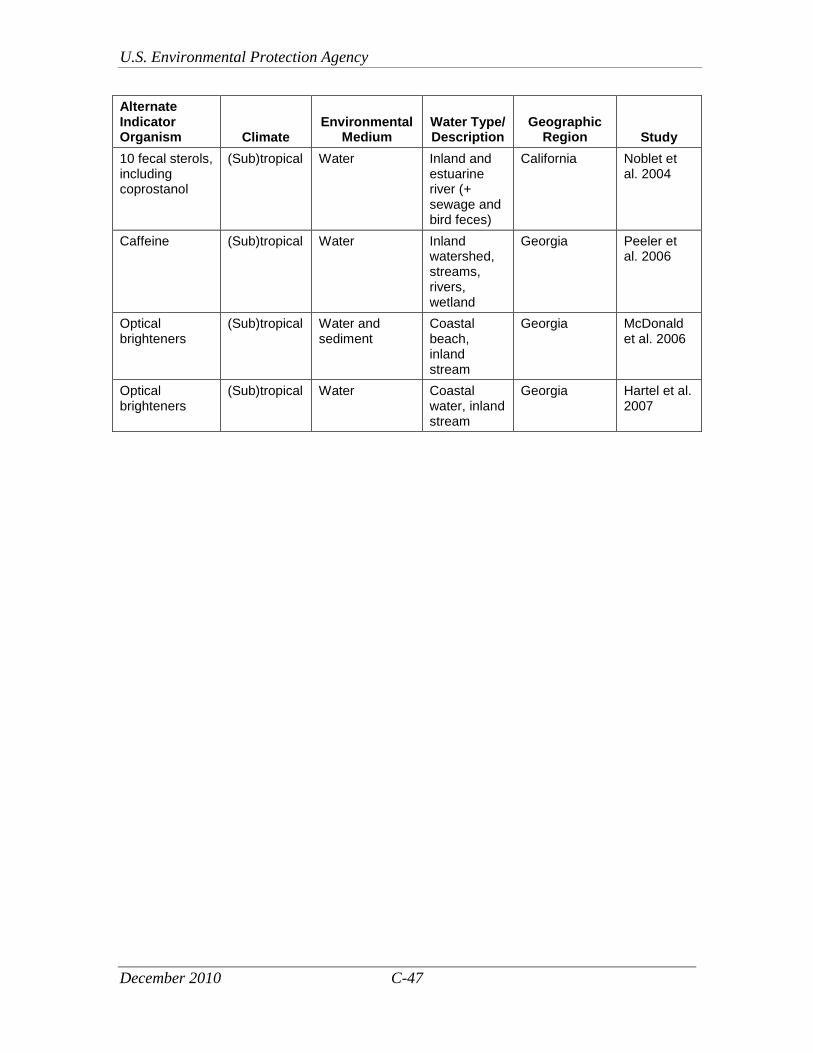
U.S. Environmental Protection Agency
December 2010 C-47
Alternate Indicator Organism Climate
Environmental Medium
Water Type/ Description
Geographic Region Study
10 fecal sterols, including coprostanol
(Sub)tropical Water Inland and estuarine river (+ sewage and bird feces)
California Noblet et al. 2004
Caffeine (Sub)tropical Water Inland watershed, streams, rivers, wetland
Georgia Peeler et al. 2006
Optical brighteners
(Sub)tropical Water and sediment
Coastal beach, inland stream
Georgia McDonald et al. 2006
Optical brighteners
(Sub)tropical Water Coastal water, inland stream
Georgia Hartel et al. 2007