Assessment of the Ethiopian Investment and Export … 18, 2012 · Assessment of the Ethiopian...
38
Assessment of the Ethiopian Investment and Export Policy Tsegabirhan W.giorgis (AAU, School of Economics,)
Transcript of Assessment of the Ethiopian Investment and Export … 18, 2012 · Assessment of the Ethiopian...

Assessment of
the Ethiopian
Investment and
Export Policy
Tsegabirhan W.giorgis
(AAU, School of Economics,)

A Statement of Gratitude
First and foremost to
National Graduate Institute for Policy Studies (GRIPS), Japan
and
Japan International Cooperation Agency(JICA)
For
Financing and Their Intellectual Leadership
Yet all weaknesses remain mine alone!
1/18/2012 Tsegabirhan W.giorgis 2
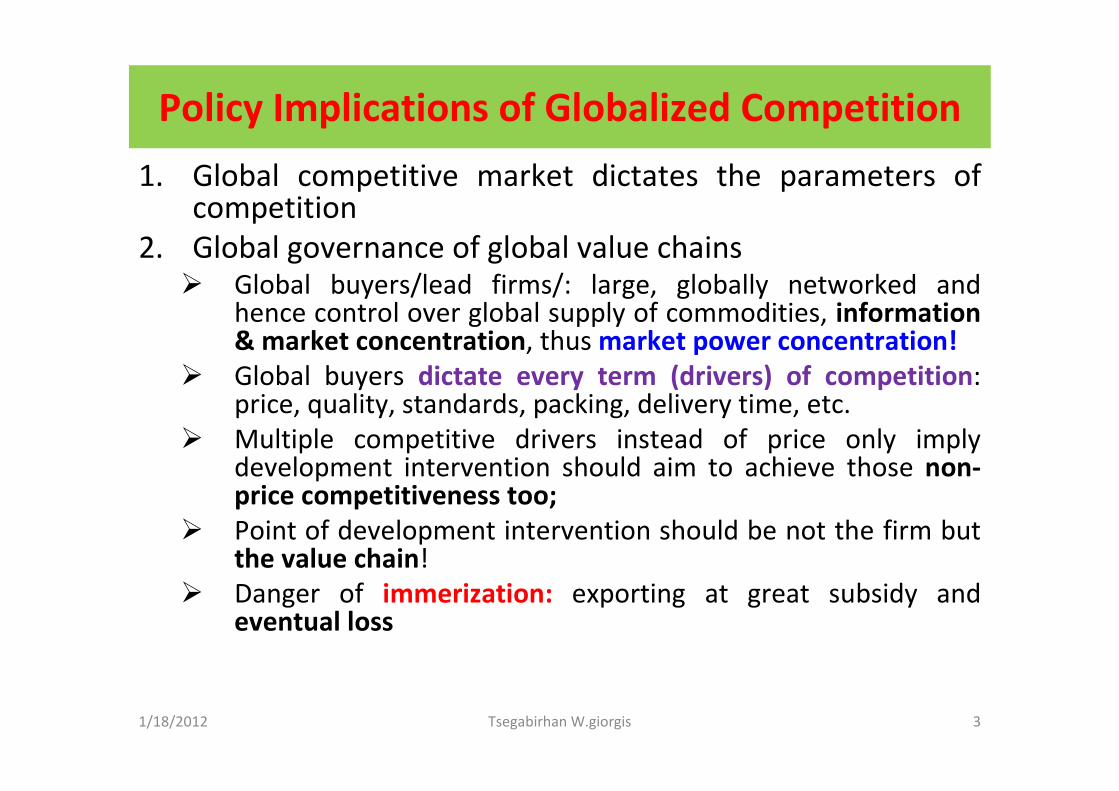
Policy Implications of Globalized Competition
1. Global competitive market dictates the parameters of competition
2. Global governance of global value chains� Global buyers/lead firms/: large, globally networked and
hence control over global supply of commodities, information & market concentration, thus market power concentration!
� Global buyers dictate every term (drivers) of competition: price, quality, standards, packing, delivery time, etc.
� Multiple competitive drivers instead of price only imply development intervention should aim to achieve those non-price competitiveness too;
� Point of development intervention should be not the firm but the value chain!
� Danger of immerization: exporting at great subsidy and eventual loss
1/18/2012 3Tsegabirhan W.giorgis

Ethiopian Investment & Export Incentives
1. Investment incentives,
a. Exemption of import duty highly used
b. Tax holidays(relief) less used related to overall
weakness in tax enforcement in the country;
2. Export schemes, (voucher, duty-drawback,
bonded warehouse) have not been used, or
at best used by few;
a. Voucher scheme relatively better and improving
over time, yet, the latest figure is <20% of
exporters
1/18/2012 4Tsegabirhan W.giorgis
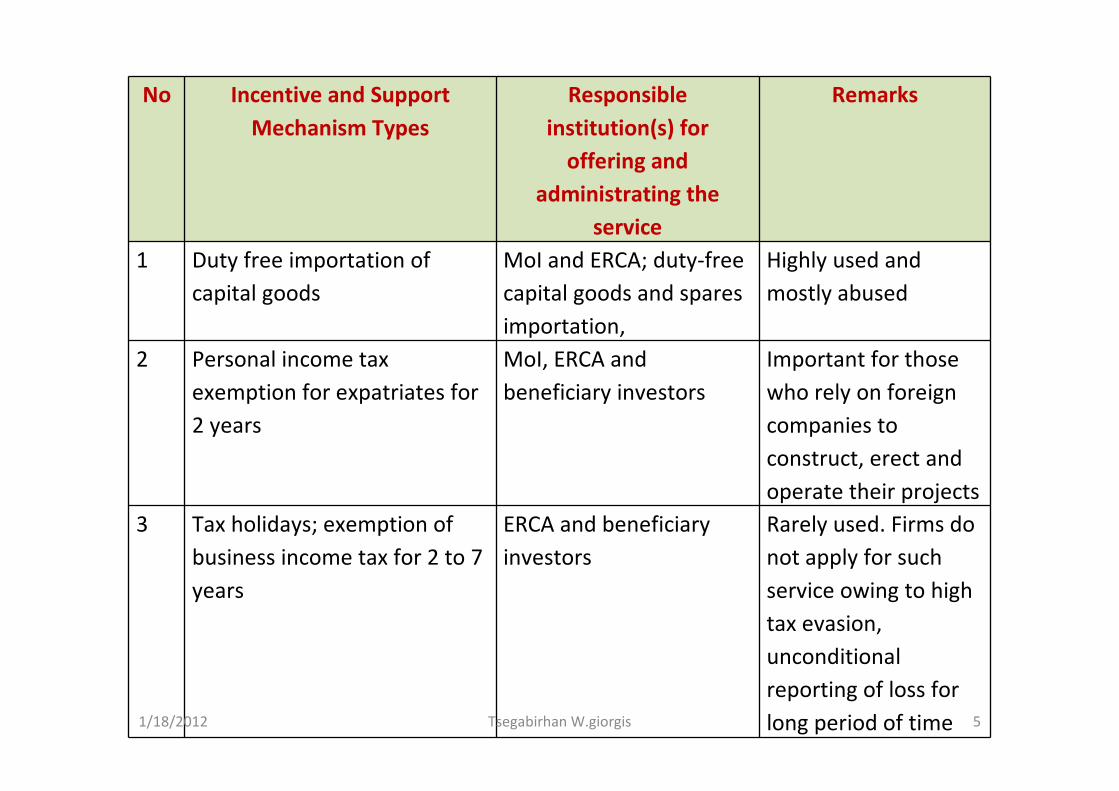
No Incentive and Support
Mechanism Types
Responsible
institution(s) for
offering and
administrating the
service
Remarks
1 Duty free importation of
capital goods
MoI and ERCA; duty-free
capital goods and spares
importation,
Highly used and
mostly abused
2 Personal income tax
exemption for expatriates for
2 years
MoI, ERCA and
beneficiary investors
Important for those
who rely on foreign
companies to
construct, erect and
operate their projects
3 Tax holidays; exemption of
business income tax for 2 to 7
years
ERCA and beneficiary
investors
Rarely used. Firms do
not apply for such
service owing to high
tax evasion,
unconditional
reporting of loss for
long period of time1/18/2012 Tsegabirhan W.giorgis 5

No Incentive and Support
Mechanism Types
Responsible
institution(s) for
offering and
administrating the
service
Remarks
4 Exemptions from indirect taxes,
VAT, Sur tax, Withholding and
excise taxes,
5 Export Promotion instruments:
Tax exemption on raw material
used for export product
• Duty exemption
• Duty Draw back scheme
• Voucher scheme
• Bonded Manufacturing
warehouse scheme
MOTI and custom
Authority
Rarely used
due to
bureaucratic
hurdles and
huge data
requirement
1/18/2012 Tsegabirhan W.giorgis 6

No Incentive and Support
Mechanism Types
Responsible institution(s) for
offering and administrating the
service
Remarks
6 Credit facility (for
investment and working
capital)
Development Bank; for instance 1.5
billion Birr Credit Facility with 7.5–
9% interest rates, 3-year grace period,
30/70 equity/loan ratio, business
itself as collateral – only 30–40% has
been utilized;
Highly used but still
complaints about
access and credit
administration
8 Industry area facilitation
(land preparation)
Federal and Regional investment
office and municipality;
Highly used
9 Human resource
development, training
Aggressive investment on higher
learning and vocational training
schools,
Dedicated institutes/agencies,
10 Production and market
linkage with foreign
investors
MOTI, dedicated agency to promote
textile and leather industries, flower
and export other commodities
11 Others: Industry Development Institutes are established to facilitate all the above and any
other problem
1/18/2012 Tsegabirhan W.giorgis 7

Voucher Usage Rate
2005
/06
2006
/07
2007
/08)
2008
/09
2009
/10 Average
Export value of exporters which
have benefitted the voucher
scheme (million) 115 209 257 279 403 253
Total Annual Export value (in
billions) 1.02 1.20 1.50 1.50 2.13 1.50
Share of voucher based
exports from total exports
(in %) 11 17 17 19 19 17 1/18/2012 8Tsegabirhan W.giorgis

Why exporters fail to use export facilities?
1. Excessive data requirement
�Detailed, absolute and perfect export plan with
long export order, with no room for adjustment
2. Control based management system in ERCA
and overall civil service of the country; while
the task requires result-oriented/based
management system, with discretionary
power of the civil servant to evaluate the
request for settlement of uses of the voucher
scheme.
1/18/2012 9Tsegabirhan W.giorgis
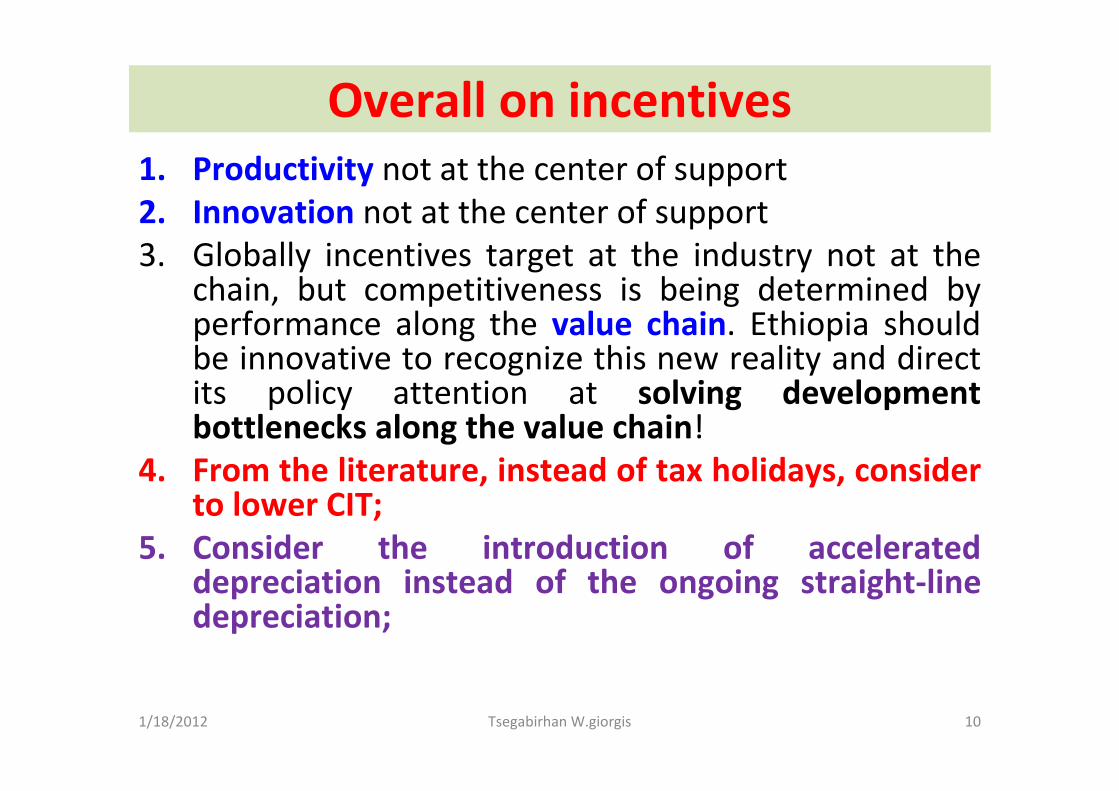
Overall on incentives
1. Productivity not at the center of support
2. Innovation not at the center of support
3. Globally incentives target at the industry not at the chain, but competitiveness is being determined by performance along the value chain. Ethiopia should be innovative to recognize this new reality and direct its policy attention at solving development bottlenecks along the value chain!
4. From the literature, instead of tax holidays, consider to lower CIT;
5. Consider the introduction of accelerated depreciation instead of the ongoing straight-line depreciation;
1/18/2012 10Tsegabirhan W.giorgis

Foregone Revenue & Costs
Foregone Revenue & Costs
1. Though there is holistic support we
concentrate on investment and export
incentive instruments and schemes
2. Foregone duty and tax elements include :
a. Import duty exemption (customs duty)
b. Forgone tax including VAT, Excise Tax, Sur Tax
& withholding tax.
1/18/2012 12Tsegabirhan W.giorgis

Annual Forgone Government Revenue, (in millions
USD)
1/18/2012 Tsegabirhan W.giorgis 13

Forgone Import Duty
1. The absolute size of foregone revenue has
been consistently increasing over the period
2004-2010
2. The foregone customs duty per additional
unit of investment has been increasing from
the order of ETB 0.01 to ETB 0.32 per one
Birr of additional investment.
1/18/2012 14Tsegabirhan W.giorgis

Forgone Import Duty to Support one Birr of Realized
Investment
1/18/2012 15Tsegabirhan W.giorgis
Foregone Tax Revenue
1. The foregone tax revenue from VAT, Excise
tax, Sur tax, Withholding tax, has been high
and increasing over time;
2. Yet, export promotion schemes are not fully
utilized. Voucher only <20% of exports. Had
these export promotion schemes were fully
used, foregone tax would have been
substantially large and increasing over time.
1/18/2012 16Tsegabirhan W.giorgis

Forgone tax (VAT + Excise + Sur + Withholding) (in Millions
USD)
1/18/2012 17Tsegabirhan W.giorgis

Share of foregone tax to Export (in %)
1/18/2012 18Tsegabirhan W.giorgis
Foregone Tax Revenue
1. But difficult to attribute all foregone tax
revenue to exports
2. What if we attribute the foregone tax
revenue to exports under three scenarios:
100%, 50% and 25% attributed to export?
1/18/2012 19Tsegabirhan W.giorgis

Foregone Tax per Additional One Dollar of Export
Year
If 100/% of
foregone
attributed to
export
If only 50% of
foregone tax
attributed to
export
If only 25% of
foregone tax
attributed to
export
2004 0.05 0.03 0.01
2005 0.35 0.18 0.09
2006 0.35 0.18 0.09
2007 0.51 0.25 0.13
2008 0.55 0.28 0.14
2009 0.63 0.32 0.16
2010 0.44 0.22 0.11 20

1/18/2012 21Tsegabirhan W.giorgis

Other costs incurred by the government
1. Holistic support for which data are not available
2. So the above assessment is based on partial figures,
3. Credit facilitation
4. Prior land allocation: No (or no access to) data on number of such land
allocation, opportunity cost of land, etc.
5. Prior access to inputs in shortage: cement, for how many and how much
6. Training, data on number of training, training duration, training cost per
trainee are not available/not accessible/;
7. Market search etc are real costs, but for which there is no ready data to
incorporate and assign it to particular sectoral/industry/ investment
8. Cost of industry development institutes: Leather, Textile, Diary & Meat,
Flower & Horticulture, and probably others
a. Establishment cost should be high
b. Running budget of Ethiopian Leather and Leather Institute for
2010/2011 was ETB 1.6 million, multiplying by 5 more developmental
institutes or taking a weighted sum of such number of institutes would
give high cost figure,
1/18/2012 22Tsegabirhan W.giorgis

Foregone & Cost
Overall the foregone duty and taxes are on the
high side.
The other costs of holistic support are expected
to be on the high side
At a time when the government direct
investment in major developmental projects
is increasing, the opportunity cost of such
foregone government revenue should
definitely be high.
1/18/2012 23Tsegabirhan W.giorgis

Benefits/Outcomes/ of the
Incentives Systems

Benefits1. Sufficiently long period to expect visible change in
contribution to GDP, investment, export, production capacity etc.
a. Investment Incentives 1993¥96 -2012(13-16 yrs)
b. Export incentives since 2001-2012 (11 years)
c. Industrial policy since 2003 (9 years)
2. Contribution of the manufacturing industry to GDP remained marginal and stagnant over time,
3. Low investment rate, of all, low investment realization rate, (< 20% for recent years)
� If investment low, then output, employment, export necessarily are low and below plans and expectations
1/18/2012 25Tsegabirhan W.giorgis

Percentage share of the manufacturing industry from
Ethiopian GDP (in %)
Industry/Ye
ar
196
2/6
3
1973/
74
19
91/
92
2002/
03
2003/
04
2004/
05
2005/
06
2006/
07
2007/
08
2008/
09
2009
/10
2010
/11
Manufacturi
ng 5.4 9.9 9.2 5.5 5.2 5.2 5.2 5.0 5.0 4.9 5.0 5.0
Large and
Medium
Scale
Manufacturi
ng2.5 5.2 5.4 3.6 3.4 3.4 3.5 3.4 3.4 3.4 3.5 3.6
Small Scale
and Cottage
Industries4.1 4.7 3.8 1.9 1.8 1.8 1.7 1.6 1.5 1.5 1.4 1.4
1/18/2012 26Tsegabirhan W.giorgis

Registered Investment by Status of Implementation
1992-
1995
1996-
2000
2001-
2005 2006 2007 2008 2009 2010
Total Capital (in
million ETB) 3.5 7.9 21.8 87.4 86.6 177.2 231.3 122.7
Share of un realized
investment (Pre-
implementation )(in
%) 42 32 69 50 86 81 93 88
Total Number of
Registered Investors 469 536 1778 6013 6336 10,672 7088 7142
Share of Pre-
implementation
(in %) 51 33 73 83 91 93 92 961/18/2012 27Tsegabirhan W.giorgis

Ethiopian Investment by Status of Implementation
1/18/2012 28Tsegabirhan W.giorgis

Realized Investment by Type (FDI & Domestic) (in ETB ‘000)
1/18/2012 Tsegabirhan W.giorgis 29

Share of Realized FDI from total Realized Investment (in %)
1/18/2012 Tsegabirhan W.giorgis 30

Average Capital Size of Realized Investment (in Million USD)
1/18/2012 Tsegabirhan W.giorgis 31

Average Capital Size (in Million USD)
1/18/2012 Tsegabirhan W.giorgis 32

Observation from the investment data
• Investment realization rate remained quite low, particularly since 2002, for recent years as low as <10%
• Average size of investment capital is low, the maximum recorded throughout was <5 million USD, size of FDI > domestic investment
• Share of Realized FDI has been increasing & exceeding domestic investment, reaching more than 90% of total realized investment in 2009 & 2010
• Thus, share of domestic investment has declined to be <10% in the recent two years (2009-2010)
1/18/2012 33Tsegabirhan W.giorgis

Conclusion and Policy Implications
• The investment and export incentives aim for price competitiveness. The global competitive market on the other hand demands more than that: quality, product differentiation, delivery time, meeting different standards, and related others.
• Sustainable price competitiveness itself critically depends upon productivity & innovation not on Investment incentives & support.
• The existing Ethiopian investment and export incentives do not target for both productivity & innovation. Thus, need for paying attention to productivity & innovation
1/18/2012 34Tsegabirhan W.giorgis

Summary and Conclusion-2
• Ethiopia needs to be innovative to recognize
the need for targeting the value chain instead
of the conventional industry; The incentives
need to be pragmatically targeted at solving
development bottlenecks along the value
chain!
1/18/2012 35Tsegabirhan W.giorgis

Summary and Conclusion-3• The overall foregone import duty and tax revenue that the
Ethiopian government has been incurring appears to be on the high side and it is increasing over time.
• As of 2010, the Ethiopian government is foregoing Birr 0.32 for each additional Birr of investment.
• Foregone tax revenue as a percentage share of exports is quite high and increasing. Increased from 5.5% in 2004 to 63% in 2009 and 44% in 2010. For each additional one US dollar export , the Ethiopian government has been foregoing more and more, $0.05 in 2004, $0.63 in 2009 and $0.44 in 2010. Yet we cannot attribute all foregone tax to exports only.
• If it were possible to estimate all types of costs of support, land, training, market search, running the service providing institutional arrangement of the government, it appears that the Ethiopian government is incurring huge costs to promote both investment and export.
1/18/2012 36Tsegabirhan W.giorgis

Summary and Conclusion-4• On the other hand, the outcomes of the
investment and export incentives appears quite limited in terms of investment, export and the resultant production capacity
• One of the major findings that deserves urgent policy attention is the low and deteriorating investment realization rate.
• Effectiveness of both investment and export incentives may be related to the effectiveness of the implementation capacity of the government, specifically to the effectiveness of the civil service
1/18/2012 37Tsegabirhan W.giorgis