Assessment of the effectiveness of biogas slurry as ...
50
NNNNNN UNIVERSITY OF YAOUNDE I FACULTY OF SCIENCE UNIVERSITE DE YAOUNDE I FACULTE DE SCIENCES DEPARTMENT OF PLANT BIOLOGY DEPARTEMENT DE BIOLOGIE ET PHYSIOLOGIE VEGETALES Dissertation presented and defended in partial fulfilment of the requirement for the award of a Professional Masters Degree in Environmental Sciences. Option: Environmental Rehabilitation and Restoration SUBMITTED BY WIRSIY EMMANUEL BINYUY Bachelor of Science in Environmental Science Registration number: 08SO770 Contact: [email protected] Tel: (237) 75184310 SUPERVISED BY: Mr NDZEREM Stephen Ndjodzeka, and Dr Ives Magloire KENGNE General Coordinator Senior Lecturer Strategic Humanitarian Services [SHUMAS] University of Yaounde I Cameroon Academic year 2012 - 2013 Assessment of the effectiveness of biogas slurry as biofertilizer for vegetable gardening in Kumbo, Cameroon: case of Solanum scabrum.
Transcript of Assessment of the effectiveness of biogas slurry as ...

NNNNNN
UNIVERSITY OF YAOUNDE I FACULTY OF SCIENCE
UNIVERSITE DE YAOUNDE I FACULTE DE SCIENCES
DEPARTMENT OF PLANT BIOLOGY DEPARTEMENT DE BIOLOGIE ET PHYSIOLOGIE VEGETALES
Dissertation presented and defended in partial fulfilment of the requirement for the award of a
Professional Masters Degree in Environmental Sciences.
Option: Environmental Rehabilitation and Restoration
SUBMITTED BY
WIRSIY EMMANUEL BINYUY Bachelor of Science in Environmental Science
Registration number: 08SO770 Contact: [email protected]
Tel: (237) 75184310
SUPERVISED BY:
Mr NDZEREM Stephen Ndjodzeka, and Dr Ives Magloire KENGNE
General Coordinator Senior Lecturer
Strategic Humanitarian Services [SHUMAS] University of Yaounde I
Cameroon
Academic year 2012 - 2013
Assessment of the effectiveness of biogas slurry as
biofertilizer for vegetable gardening in
Kumbo, Cameroon: case of Solanum scabrum.

i
DEDICATION
This work is dedicated to the following:
- my wife Sevidzem Ernestine L, my son Wirsiy Clinton-Moise and my two daughters
Wirsiy Gayle-Liza and Wirsiy Felicitas, for encouraging me and bearing my absence for
six months;
- my sister, Leinyuy Saber Emelienne for the support she gave me during the period of this
research in the North West Region and ABIYAH Angabo Moise for his fatherly love and
support

ii
ACKNOWLEDGEMENT
My special acknowledgments go to the following persons whose support in one way or other
helped in the realisation of this work:
- late Professor AMOUGOU Akoa, former Head of the Department of Plant Biology and
Associate Professor DJOCGOUE Pierre François, Coordinator of the Environmental
Science programme and other lecturers for their efforts and contribution to train us as
environmentalists. I am also grateful to all the staff of Department of Plant Biology;
- Associate Professor BELL Joseph Martin, Head of Department of Plant Biology for his
collaboration;
- Dr. Ives Magloire KENGNE, for guiding me through the conception of this research
topic and field work. His constructive critical comments during the writing of this thesis
was very helpful;
- Mr. DJUMYOM WAFO Guy Valerie PhD student for his collaboration
- the General Coordinator of Strategic Humanitarian Services (SHUMAS) for giving me
the opportunity to do this research in SHUMAS’ Integrated Organic Farm (BIOFARM)
Centre and for his support. I also thank the staff of SHUMAS who made the working
environment conducive to carryout a successful research;
- the staff of SHUMAS’ Integrated Organic Farm (BIOFARM) Centre especially Ngwa
Godwill incharge of crop unit, Wirkom Bruno, Tobias and Tize Koda Joel (former
research student on biogas system) who shared with me their knowledge and skills on
biogas plant building and usage;
- Paul Harris, a biogas expert of The University of Adelaide, Australia for providing me with
information on biogas and making constructive comments on this research;
- Michael Thomas of Future In Our Hands-UK for taking time to make comments on the draft
of this work;
- my sisters and brothers for their support;
- my whole family for always being beside me to encourage in all I do;
- all my classmates in this programme for their cooperation and team spirit that
strengthened me during periods of difficulties or trials and
- all whose names are not mentioned that were supportive; I will like to thank you too very
specially.

iii
TABLE OF CONTENTS DEDICATION ................................................................................................................................. i
ACKNOWLEDGEMENT ............................................................................................................... ii
LIST OF FIGURES ......................................................................................................................... v
LIST OF TABLES ......................................................................................................................... vi
ABSTRACT .................................................................................................................................. vii
RESUME ...................................................................................................................................... viii
CHAPTER I: GENERALITIES ...................................................................................................... 1
I.1. Introduction ........................................................................................................................... 2
I.2. Literature review ................................................................................................................... 4
I.2.1. Biogas systems for energy and biofertilizer production................................................. 4
I.2.2. Biogas system in SHUMAS’ BIOFARM and production of biogas ............................. 4
I.2.3. Comparison of digested biogas slurry as biofertilizer and undigested manure.............. 7
I.2.4. Quantities of fertilizer application.................................................................................. 8
I.2.5. Origin and botany of Solanum scabrum ........................................................................ 9
I.2.6. Morphology of Solanum scabrum ................................................................................ 10
I.2.7. Seed processing and germination problems with Solanum scabrum ........................... 10
I.2.8. Transplanting, harvesting and importance of nutrients to crop .................................... 10
I.2.9. Pests and diseases ......................................................................................................... 12
CHAPTER II: MATERIAL AND METHODS............................................................................ 13
II.1. Material .............................................................................................................................. 14
II.1.1. Location of study site .................................................................................................. 14
II.1.2. Materials ..................................................................................................................... 14
II.2. Methods ............................................................................................................................. 15
II.2.1. Experimental plot design ................................................................................................ 15
II.2.2. Soil and biogas slurry collection ..................................................................................... 17
II.2.3. Physico-chemical analysis of soil and biogas digestate samples .................................... 18
II.2.3.1. Preparation of soil and biogas slurry sample for analysis........................................ 18

iv
II.2.3.2. Determination of electrical conductivity ................................................................. 18
II.2.3.3. Determination of Phosphorus by Manual Calorimetric Method ............................. 18
II.2.3.4. Determination of Total Organic Carbon .................................................................. 19
II.2.3.5. Determination of Potassium, Calcium, Magnesium and Sodium ............................ 20
II.2.3.6. Determination of Hydrogen Potential ...................................................................... 20
II.2.3.7. Determining Total Kjeldahl Nitrogen (TKN) Analysis ........................................... 20
II.2.4. Method of processing and applying biogas slurry and chemical fertilizers.................... 20
II.2.5. Method used to nurse, transplant and measure huckleberry growth ............................... 23
II.2.6. Research plot used as a training site ............................................................................... 24
CHAPTER III: RESULTS AND DISCUSSION ......................................................................... 25
III.1. Results .............................................................................................................................. 26
III.1.1. Biogas slurry and soil sample analysis ...................................................................... 26
III.1.2. Growth rate results .................................................................................................... 26
III.1.2.1. Measurement of height of plant .............................................................................. 26
III.1.2.2. Counting of number of leaves ................................................................................ 27
III.1.2.3. Measurement of plant chosen leaf surface area ...................................................... 28
III.1.2.4. Crop yields during harvest ...................................................................................... 29
III.1.3. General observation in experiment plants during growth ......................................... 31
III.2. Discussion ......................................................................................................................... 33
III.2.1. Physicochemical characteristic of Biogas slurry and soil sample ............................. 33
III.2.2. Growth rate of plant ................................................................................................... 34
CHAPTER IV: CONCLUSION AND RECOMMENDATIONS ............................................... 36
IV.1. CONCLUSION ................................................................................................................ 37
IV.2. RECOMMENDATIONS ................................................................................................. 38
BIBLIOGRAPHY ......................................................................................................................... 39

v
LIST OF FIGURES
Fig. 1. BIOFARM Centre floating drum biogas system built in 2008 …………………........6
Fig. 2. Preparation of biogas slurry from pig dung and water ................................................6
Fig. 3. Biogas and digestate production...................................................................................7
Fig. 4. Solanum scabrum Plant ………………...……………………………………………..9
Fig. 5. Experimental plot design ……………………………………………………............16
Fig. 6. Fenced research plots with scarecrows and chosen plants to measure growth…….17
Fig. 7. Soil sample from research plot for analysis………………………………….............18
Fig. 8. Obtaining pig dung for biogas production………………………………………........21
Fig. 9. Digestate collection and drying……………………………….………………...........21
Fig. 10. Dried slurry to be used as biofertilizer……………………………………………....22
Fig. 11. Utilisation of biofertilizer in soil ………………………………………………...…..22
Fig. 12. Watering of plants in experiment plot………………………………………….........23
Fig. 13. Measuring the height of plant …………………………………….………………….24
Fig. 14. Weighing of harvested crop from experiment beds………………………….…...…24
Fig. 15. Presents plant growth rate in height in response to different quantities and types
of fertilizer application in weekly intervals…………………………………….......27
Fig. 16. Presents increase in crops’ number of leaves in response to different quantities
and types of fertilizer application on weekly intervals…………………………...…28
Fig. 17. Presents increase in crops’ chosen leaf surface area in response to different
quantities and types of fertilizer application in weekly intervals……………..…….29
Fig. 18. Number of leaves and branches in stem reduces from plant base to top……….…...32
Fig. 19. Plants develop more branches and leaves after main shoots are cut during first
Harvest………………………………………………………………………...……..32

vi
LIST OF TABLES
Table I. Average monthly and annual temperatures in°C Kumbo ………………………………..5
Table II. Scientific classification of Solanum scabrum………………………………...………….9
Table III. Importance of nutrients to crops…………………………………………………...…..11
Table IV. Indicate physico-chemical analysis results of soil and biogas slurry samples….…….26
Table V. Crop yield for 38 crops in each bed after 6 and 8 weeks of transplanting…...…….…..30
Table VI. Crop yield for 10 chosen plants when experiment ended………………………..……31
Table VII. Physical observation in Solanum scabrum with different fertilizer application.….....32

vii
ABSTRACT
This research was carried out between August 2010 and January 2011. The research had as
objective to assess the effectiveness of biogas slurry as biofertilizer for huckleberry cultivation in
Kumbo, Cameroon. To carry out this experiment, soil and biogas slurry samples were collected
for Laboratory analysis to determine their physico-chemical characteristics. The biogas slurry
was produced using pig dung. Biogas slurry was collected from the biogas outlet tank dried,
crushed and used as biofertilizer. Different quantities of biofertilizer (digestate) were applied in
each bed. This ranged from 0.5 to 3.5 kg/m2 with a variation of 0.5 kg/m
2 each. Chemical
fertilizers were also applied in some beds. Urea was applied at 0.06 kg/m2 and NPK (20-10-10)
applied at 0.12 kg/m2. One of the beds in each block served as a control without any manure or
chemical fertilizer application. The choice of application of variables on beds in each block was
obtained by complete block randomized design method. Huckleberry was nursed and
transplanted after 7 weeks immediately when biofertilizer was applied. To determine growth rate
of crops these parameters were measured per plant on weekly interval for 8 weeks: the number of
leaves produce, the surface area of a chosen leaf, the height of plant and the weight of harvested
crops.
The results obtained show that biogas slurry (digestate) after biogas production is richer in
nutrient than the soil and is therefore suitable to be used as fertilizer for soil. The quantity of
biofertilizer observed to produce good plant growth were 2.5 Kg/m2, 3.0 Kg/m
2 and 3.5 Kg/m
2
applications. The quantities of Urea and NPK (20-10-10) applied in soil never produced good
growth rate. Considering that 2.5 Kg/m2 biofertilizer application was among the best three
biofertilizer application that recorded good results and the fact that increasing biofertilizer
application entails increased cost, 2.5 Kg/m2 biofertilizer application is recommended as the best
quantity of biogas slurry application for a better cost/ production ratio.
Key words: biofertilizer, biogas slurry, huckleberry, mineralization, productivity

viii
RESUME
Ce travail de recherche mené entre Août 2010 et janvier 2011 ; avait pour objectif
d’évaluer l’efficacité des boues issues de la production du biogaz comme biofertilisant pour la
culture de la morelle noire (Solanum scabrum) a Kumbo au Cameroun. Pour cela, les échantillons
de sol et de boues de biogaz ont été analysés au laboratoire pour déterminer leurs caractéristiques
physicochimiques. Les boues de biogaz produites a base des fumiers de porc ont été collectées à
la sortie des réservoirs de vidanges, puis séchées, écrasées et utilisées comme biofertilisant. De
différentes doses de biofertilisant allant de 0,5 kg à 3,5 kg /m2
avec une variation (pas) de 0,5
kg/m2 par traitement ont été appliquées sur chaque lit. Les engrais chimiques ont également été
testés sur d’autres lits. L’urée a été utilisée en raison de 0,06 kg/m2 et le NPK (20/10/10) à 0,12
kg/m2. L’un des lits dans chaque rangé a servi de témoin sans application d’engrais. Le dispositif
expérimental était un bloc complet randomisé. La morelle noire a été semée en pépinière et
transplantée 07 semaines après, suivant l’application des biofertilisants. Les paramètres de
croissance tels que le nombre de feuilles, la surface foliaire et la taille des plantes ont été mesurés
par semaines durant une période de 08 semaines. Le poids des plantes après récolte étaient aussi
mesurés.
Les résultats obtenues montrent que les boues issues de la production de biogaz sont plus riches
en nutriment que le sol, et ainsi favorable pour utilisation come biofertilisant pour les sols. Les
biofertilisants appliqués à la dose de 2,5 Kg/m2, 3,0 Kg/m
2 et 3,5 Kg/m
2 ont produit un meilleur
rendement en termes de croissance de la plante. Les doses d’urée et de NPK (20/10/10) appliquée
n’ont pas permis d’obtenir un bon taux de croissance. En considérant que 2,5 kg/m2 de
biofertilisant a produit l’un des meilleurs rendements et que c’est plus économique en terme de
coût, il est recommandé d’utiliser les biofertilisants à la dose de 2.5 kg /m2 pour meilleur ratio
cout/production.
Mots clés : biofertilisants, boues de biogaz, morelle noire, minéralisation, productivité

1
CHAPTER I: GENERALITIES

2
I.1. Introduction
Solanum scabrum Miller, commonly called huckleberry or jamajama in Cameroon is an
important indigenous leafy vegetable in Africa (Schippers, 2000). It is the most commonly grown
indigenous vegetable in Cameroon, and commercial fields are found mostly in the western and
north western provinces of the country (Stevel, 1990; Westphal, 1981). In Cameroon,
huckleberry is exported to neighbouring countries, such as Gabon and Nigeria (Schippers and
Fereday, 1998). Huckleberry leaves and fresh shoots are used widely as a cooked vegetable and
are often referred to as spinach. The spinach can be served with cornfufu, plantains, sweet
potatoes, potatoes, yams, maize and pounded cocoyams (Ngundam, 1997). There is empirical
evidence that African leafy vegetables have several advantages and values that include high
micronutrient content, medicinal properties, several agronomic advantages and contributed to
food and nutrition security and income generation (Schippers, 2002). A major constraint to
increase huckleberry cultivation in Cameroon is the susceptibility of the crop to disease (Fontem,
1991a) among which is late blight.
Organic sources of manure, besides providing nutrients to the crop plants, also improve the
structure of the soil and give residual effects on subsequent crops (Anonymous, 1992). Soil
organic matter content and turnover are regarded as important indicators of soil fertility. For crop
production, it is of prime interest to know which immediately beneficial effects these indicators
have on land use criteria such as crop yield stability and environmental impact (Raupp, 2001).
Soil organic matter is vital to the sustainable use of soil because of its role in maintaining soil
structure, water-holding capacity, the microbial biomass and soil fauna, and in nutrient cycling
(Goulding et al., 2001).
Chemicals are widely used on many farms. Nevertheless, there is an increasing debate about their
use. Chemicals offer a quick way to increase the harvest but there are hidden costs. Safety is
perhaps the most obvious one. These chemicals are expensive. These chemicals cost money and
time and many people believe that the soil is not made healthy by the application of chemicals
(Mathew, 1986). Emma, (2002) says biogas systems produces biogas slurry (organic matter)
which is a by-product of biogas production and this slurry is a high quality fertilizer which does
not smell. This fertilizer can be spread directly on the crops at any time of the year. This slurry
can be used in the farm for it adds to production and reduces dependency on chemical fertilizer
thus increasing savings. In addition, the biogas system is an alternative source of energy that
reduces pressure on forest. In the national level, the production of biogas could help alleviate the

3
energy crisis faced by Cameroonians.There are few expertspopularizing biogas technology in
Cameroon and Africa in general (Tize, 2009). Tize also recommended in his studies that research
should be carried out to determine the right quantity of the processed biogas slurry or digestate to
be used as biofertilizer in farms.
I.1.1.General objective
The general objective is to assess the effectiveness of biogas slurry as biofertilizer for
huckleberry (Solanum scabrum) cultivation in Kumbo, Cameroon
I.1.2.Specific objectives
The specific objectives are to:
- Assess the physico-chemical characteristics of biogas slurry;
- Assess the physico-chemical characteristics of composite soil sample from experiment
site;
- Assess the effects of biogas slurry on huckleberry growth.

4
I.2. Literature review
I.2.1.Biogas systems for energy and biofertilizer production
Biogas systems are made up of four components: the inlet, the digester, the gas holder and
the outlet or expansion chamber. The inlet collects and mix dung and water in equal quantities.
This dung and water is called slurry which is then send through the bottom of the inlet by
removing the plug for the slurry to flow through the pipe into the digester. The digester is a flat-
bottom, round chamber, covered with a dome-shape concrete gas holder. The fixed dome plant
needs to be properly sealed in order to prevent any gas leakage. The bacteria thrive on the dung in
an anaerobic environment (air tight digester) and create biogas. The gas then rises and is stored in
the gas holder before being released in to a pipe. The slurry leaves through the outlet chamber
and flows into the compost pit. There exist two types of biogas systems, the dome shape that has
just been described and the floating drum which is different from the former in that the gas holder
is a floating drum. Digestion time ranges from a couple of weeks to a couple of months
depending on the feedstock and the digestion temperature. The residual slurry is removed at the
outlet and can be used as a fertilizer, which increases agricultural production especially in
vegetable growing. During the digestion process bacteria in the manure are killed, which is a
great benefit to the environment (Emma, 2002).
I.2.2. Biogas system in SHUMAS’ BIOFARM and production of biogas
Biogas is produced in the Strategic Humanitarian Services (SHUMAS) Integrated
Organic Farm (BIOFARM) Centre at Kingomen, Kumbo. The BIOFARM Centre biogas system
is a floating drum system measuring 25 m3. The system provides 18m
3 of biogas per day to
prepare food for 35 students. The temperature test showed a stable and favourable temperature
for methanisation in a psychrophile zone. Averagely in Kingomen BIOFARM centre
temperature daily variation is less than 2 °C (Tize, 2009). There are 3 ranges of temperature with
exploitable biogas production observed: psychrophile (15 – 25 °C), mesophile (25 – 55 °C) and
thermophile (55 – 75 °C) (Agu et al., 2000).

5
Table I. Average monthly and annual temperatures in °C Kumbo (Anonymous, 2007 and 2008).
Annual
Temperature
Month
2007 2008 Average
January 23,9 21,4 22,65
February 22,1 22,9 22,5
March 23,1 24,0 23,55
April 24,8 23,5 24,15
May 22,1 22,8 22,45
June 22,5 23,1 22,8
July 22,2 21,8 22
August 22 21,8 21,9
September 21,5 23,6 22,55
October 22,7 23,4 23,05
November 20 23,6 21,8
December 21,8 25,1 23,45
Total average 22,6 23,1 22,85
Optimal pH zone for methanisation to be situated around neutral. The methanogenic
bacteria are highly inhibited when the pH is inferior to 6 (Kuria and Maringa, 2008). The
discharge from digester destroys pathogens and that digestate (biogas slurry) can totally or
partially replace inorganic fertilizer (Caussade, 2006). The biogas system was set in the
BIOFARM Centre to do the following:
- produce biogas to prepare food for students;
- treat effectively animal waste for use as biofertilizer;
- produce earthworms for table birds and increase algae growth in fish pond;
- use clean energy in the place of firewood for food preparation and
- in the long run produce biopesticide from digestate to fight plant diseases.
Tize (2009) recommended in his studies that research should be carried out on the right quantity
of biogas digestate to be used as biofertilizer in various crops present in the farm.

6
Fig.1. BIOFARM Centre floating drum biogas system built in 2008.
Fig. 2. Preparation of biogas slurry from pig dung and water. a : Biogas mixing tank; b : Fresh
cow dung mixed with water to form slurry.
Pretreatment
reservoir (animal
dung mixed
withwater)
Digester
Reservoir of
discharged
biogas slurry
(digestate)
Biogas reservoir Reservoir guide
b a

7
Fig.3. Biogas and digestate production. a : Inverted drum on digester raised by biogas; b : Biogas
by-product (slurry) tank.
I.2.3.Comparison of digested biogas slurry as biofertilizer and undigested manure
In biomethanation (process of biogas-methane production), the Nitrogen compounds of
the substrate (undigested biogas slurry) undergo some mineralization. A part of NH4 becomes
ammonia that is reputed to be more accessible for plants. On the other hand, ammonia is more
volatile and is easily leached. It therefore requires some particular application conditions for
example rapid soil incorporation, cover of the tank (Schenkeh et al., 2009). Some studies have
been carried out in Denmark (Arhuus University- Peter Sørensen) on fate of slurry Nitrogen
coming from anaerobic digestion and in particular the following aspects have been analyzed: the
concerned on the one hand with manure Nitrogen transformations and losses and on the other
hand the manure Nitrogen in terms of uptake in crop, residual Nitrogen in soil and losses.
Digested slurry has been compared with the untreated slurry and it was clear that, both in case of
pig and cattle slurries, the net mineral release (as a percentage of total Nitrogen) was higher in the
case of digested slurry. The final conclusions, after the mentioned tests performed in Denmark in
order to demonstrate the better manure Nitrogen uptake, in case of digestate (rather than slurry)
used, are the following:
- Less organic Nitrogen and consequent lower risk of long-term Nitrogen leaching ;
- Higher first year utilization but lower residual Nitrogen effect ;
- More Nitrogen available for the plants and less organic matter to soil ;
- Improved infiltration and reduced greenhouse gas emission (CH4, N2O, and CO2).
When the digestate is spread on growing plants, nutrients are absorbed faster by the plants as it
infiltrates more quickly into the soil than raw slurry. This in agricultural practice means a minor
risk of plant etches and ammonia losses after application on arable land. In manure and organic
b a

8
residues, most of the Nitrogen is bound to proteins and is not directly available for plant nutrition.
During the digestion process, a part of the organic bound Nitrogen is reduced to dissolved
ammonium by deamination. As a result of this process, the ammonium rate of the total Nitrogen
content is enhanced in the digestate. The ammonium rates of total Nitrogen content of the
analysed digestates compared to the untreated manure, increase from 0.2 % to 27 %. The increase
of ammonium content depends on the hydraulic retention time in the digester like the decrease of
the organic dry matter. Applied correctly, this enhanced mineral Nitrogen content results in a
faster and better plant uptake to 23 % of the Nitrogen of raw manure is drained away. In digested
manure, the drainage averages 14 %. A study by Svensson et al., (2004) shows that more than
half of the total Nitrogen content occurred as ammonium in the biogas residue (digestate),
whereas only small amounts of mineral Nitrogen, mainly nitrate, are found in the compost. But
neither compost nor digestate can be used as the sole fertilizer in intensive grain cropping.
Digestate should be regarded as a mineral Nitrogen fertilizer. Preferably, crops with a short and
intensive period of Nitrogen uptake, like barley, are the best target for biogas residues. Due to the
low content of Phosphate, digestate must be complemented with Super Phosphate in order to
avoid Phosphate deficits in soil.
I.2.4.Quantities of fertilizer application
Studies carried out at the World Vegetable Center in Arusha, Tanzania to evaluate the
yield response of nightshade to Nitrogen fertilization presents four rates of urea fertilizer, that is
control (= no urea added), 60, 90 and 120 kg/ha that were used as treatments in the research plot.
The urea fertilizer was applied as side-dressing in two equal splits two and six weeks after
transplanting. Data on leaf, fruit and seed yield were collected at a two-week interval beginning
six weeks after transplanting and subjected to ANOVA using CoStat software. Results revealed
that fruit and seed yields increased significantly with an increase in application of urea, but
differences in leaf yield between the Nitrogen rates used were not significant. Significant
differences were observed in leaf, fruit and seed yield components between the accessions
evaluated. It is recommended that Nitrogen fertilizer should be applied at lower rates (60 kg/ha)
for leaf production of nightshade while higher rates of up to 120 kg/ha should be applied for fruit
and seed production (Onyango et al., 2009). Solanum scabrum were also planted in rows spaced
0.40 m apart with 0.25 m between plants within the row. In both seasons, field plots were
fertilized with 120 kg ha-1 of 20-10-10 (N-P-K) 7 and 49 days after transplanting (Fontem et al.,
2003).

9
I.2.5.Origin and botany of Solanum scabrum
According to Muthomi et al., (2009), Solanum scabrum occurs as a cultivated vegetable
from Liberia to Ethiopia, and south to Mozambique and South Africa. It is very common in
lowland as well as highland regions in West and East Africa. The wide range of diversity of
Solanum scabrum found especially in Nigeria and Cameroon suggests that its origin is likely to
be in the warm humid forest belt of West and Central Africa. Outside Africa, Solanum scabrum
can be found in Europe, Asia, Australia, New Zealand, North America and the Caribbean.
Solanum scabrum can be scientifically classified.
Fig.4. Solanum scabrum Plant.
Table II. Scientific classification of Solanum scabrum.
Kingdom Plantae
Subkingdom Tracheobionta
Superdivision Spermatophyta
Division Magnoliophyta
Class Magnoliopsida
Subclass Asteridae
Order Solanales
Family Solanaceae
Genus Solanum L.
Species Solanum scabrum Mill.

10
I.2.6.Morphology of Solanum scabrum
Solanum scabrum is the most common specie in West Africa and many different cultivars
can be seen, often of local importance only. Huckleberries (a common name for Solanum
scabrum) can be recognized with relative ease by its strong green or purple stem with more-or-
less tooth wings. Plants are usually about 60 cm high but could grow to 1.20 m or more. There
are both small and large leaved cultivars with different leaf shapes and the leaf colour can be
either green or dark-purple. Leaves have entire margins (rarely situated) and apices that are more
obtuse than acute. The flowers are either white or light purple and this is the only species in
Solanum with brown or dark-yellow anthers. It is also the only species whose berries remain on
the plant at maturity. Fruits are spherical and 11-17 mm broad. The dark purple fruit have a
distinct bloom when young and become glossy when they are older (Schippers, 2002).
I.2.7.Seed processing and germination problems with Solanum scabrum
Solanum scabrum berries are easy to collect since they always remain on the plant. A
popular way to extract seeds in Cameroon is for farmers to put the berries in a bag with small
holes on the bottom and hang the bag in a ventilated environment. The fruits rot and juice leak
out and the seeds dry out. The seeds are collected dry in berries and this reduces chances of
damage by mice and other rodents. Fruits could also be squashed in a container with or without
water and seeds collected and dried. From 1 Kg of Solanum scabrum berries, farmers obtain
about 40 g of seed. The number of seeds/berry varies from about 20-60 depending on variety and
conditions. Many farmers experience problems with the germination of seeds. This may be due
to: low vigour caused by inadequate removal of sugar and removal of germination inhibitors
present in the fruit. These inhibitors include Abscic acid and ethylene, which normally prevent
seeds from germinating within the fruit. The second reason is that seeds may not be dried well
enough or that seeds are kept under ambient conditions in an environment with varying humidity.
Seeds need to be very dry and kept in airtight container. Seeds can remain viable for several years
when kept dry. Seeds usually take 5-7 days to germinate but could take longer when the soil
moisture content is inadequate (Schippers, 2002).
I.2.8.Transplanting, harvesting and importance of nutrients to crop
In Kenya, Solanum scabrum was planted twice a year in all the six Kenyan districts
during the long rains (March-July) and the short rains (September-December). Harvesting started
4-5 weeks after sowing, at thinning time and thereafter harvesting was done weekly by removal

11
of young shoots resulting in subsequent ratoon crop. This type of harvesting could go on for a
period of three months, then another 2 months for seed maturity. Most of the farmers depended
on rainfall and only 20 % of farmers from the Luo community practiced irrigation using watering
cans (Abukutsa-Onyango, 2007).
Normally, yields increase with increasing nutrient concentration to a maximum, beyond which
there is no further benefit from additional nutrient. Tony, (2006) presents the importance of
nutrients to crops.
Table III. Importance of nutrients to crops (Adapted from Tony, 2006).
Function and Remarks Types of nutrient
Function of nutrient in crop Remarks
Nitrogen (N) Increase plant growth, the size
of leaves and yields Addition of Nitrogen may give dramatic
and quick response to plants, but much
Nitrogen causes much vegetative growth
with weak stems, sometimes causing
lodging and also increase the susceptibility
of plants to disease, frost and drought Phosphorus (P) Develop root growth to establish
young plants and help early
ripening
Phosphorus is best applied a little or often,
but there are no problems if excessive
amounts are applied. It is most available to
plants when the soil PH is 5.5 – 6.5. Often
deficient in tropical soil. Potassium (K) Improve plant quality, vigour
and health. It makes crops
drought resistant and gives them
the ability to store sugar and
starch. It forms chlorophyll and
also improve stomata
functioning
Too much potassium makes plants slow to
mature. Wood ash, compost and manure
are good sources of Potassium. Not
deficient in tropical soils as often as
Phosphorus
Sodium (Na) Allow plants of the
Chenopodiaceae family (beet,
spinach, etc) to develop properly
Sodium is rarely a problem and is not
easily diagnosed
Calcium (Ca) Component of cell walls and
membrane and balance organic
anions.
Magnesium (Mg) Allow chlorophyll formation
and growth, Assist in nodulation of legumes, and in the utilizations of
Phosphorus
More common in light soils with high
rainfall and in soils with low organic
matter content or excessive Potassium or
Calcium

12
I.2.9.Pests and diseases
Huckleberries and black nightshades are frequently eaten by insects but apparently people
do not mind buying leaves with holes in them (it is a sign that chemicals have not been used). In
Cameroon, ants are said to be responsible for holes. Black aphids may cause leaves to curl and
affect further growth of the plant. In some areas aphids appear to have taken over altogether and
even when they are controlled by chemicals, the characteristic curly leaves remain. Caterpillars
and occasionally grasshoppers including Zonocerus variegates can also be most problematic.
Small black beetles found at the underside of huckleberry leaves cause those leaves to twist and
fold, making them unattractive for sale. Black aphids, millipedes and snails have been reported in
Kenya. A traditional cure for pests is wood ash, spread onto the leaves. Chemicals are not always
effective against insects that are hiding underneath the leaves. Many farmers believe that the
effects of chemicals last only 24 hours and will thus harvest one day after spraying, thus causing
problems to consumers. A major disease in huckleberry was found to be Phytophtora infestans,
the late blight which is also common in tomatoes and Irish potatoes. This causes a grayish rot of
leaves and stems and drop of leaves. It is said to be particularly problematic during the rainy
season when temperatures are low. A second important disease is Cladosporium oxysporum
which can be recognized by a greyish green mould on the lower side of the leaves and the light
green-yellow colour above. Other diseases recorded include a specie of downy mildew, the eye
spot, Cercospora nigrescens and the powdery mildew, Leveillula taurica with yellow spot and
the upper surface and a white mould below (Schippers, 1998).

13
CHAPTER II: MATERIAL AND METHODS

14
II.1. Material
II.1.1. Location of study site
This research was carried out in a small village called Kingomen located in Kumbo of Bui
Division in the North West Region of Cameroon. Kingomen hosts the Strategic Humanitarian
Services’ (SHUMAS) Integrated Organic Farm, Training and Demonstration (BIOFARM) Centre
where this research was carried out. The BIOFARM Centre has a biogas system that provides
cooking energy for preparing students food and biofertilizer to increase food production. Kumbo
is located at approximately 113 km from Bamenda, the regional capital of North West Region
and the distance between Kumbo centre and the BIOFARM is approximately 30 km.
II.1.2. Materials
The following materials and equipments were used
- Spade was used for soil sample and biogas slurry collection;
- Cutlass was used for clearing research plot and fencing;
- Hammer and nails were used for plot fencing;
- Hoe was used for tilling soil;
- Digital camera of mark Sony Cyber-shot DSC-W310 was used for picture snapping;
- Measuring tape was used to measure plot size;
- Ruler was used for measuring crop height and leaf diameter and length;
- Biogas slurry was used as biofertilizer;
- Watering cans were used for crop watering;
- Scale was used to measure crop yield after harvesting;
- Calculator marked CASHO CS-8012 for data analysis and
- Laptop marked Acer was used for data analysis using excel.

15
II.2.Methods
II.2.1. Experimental plot design
Research plot was cleared and divided into three blocks and each block tilt to have ten
beds (fig.5). Each bed was flattened to have 3 m length and 1m width. Different quantities of
biofertilizer (digestate) were applied in each bed. This ranged from 0.5 to 3.5 kg/m2 with a
variation of 0.5 kg/m2 each. Chemical fertilizers were also applied in some beds. These chemical
fertilizers were urea and NPK (20-10-10). Urea was applied at 0.06 kg/m2 and NPK (20-10-10)
applied at 0.12 kg/m2. One of the beds in each block served as a control without any manure or
chemical fertilizer application. The choice of application of variables on beds in each block was
done by complete block randomized design method (Fig. 5). This plot was fenced and other
traditional methods of pest and risk management used to prevent pests attack and animal
encroachment. Scarecrows were used to chase pests like birds and animals (Fig. 6). Two blocks
were prepared at the sides of research blocks and planted with huckleberry. These two blocks
were aimed at giving animals and birds that succeeded to enter the research plot the opportunity
to consume vegetable at the outskirts of the research plot thereby sparing research plot crops from
damage. No weed was allowed to grow in the plot at anytime.

16
BLOCK B
Type and quality of
fertilizer application
0.06Kg/m2
Urea
2 . 5 kg/m 2
biofertilizer
1 .0 kg/m 2
biofertilizer
- - 0.12Kg/m2
NPK(20-10-10)
3. 5 kg/m 2
biofertilizer
0.5 kg/m 2
biofertilizer
1.5 kg/m 2
biofertilizer
3. 0 kg/m 2
biofertilizer
Control
No application
2.0 kg/m 2
biofertilizer
BLOCK A
Type and quality of fertilizer application
2.0 kg/m 2
biofertilizer
0. 5 kg/m 2
biofertilizer
Control
No application
2.5 kg/m 2
biofertilizer
3. 0 kg/m 2
biofertilizer
1. 0 kg/m 2
biofertilizer
1.5 kg/m 2
biofertilizer
- 0.12Kg/m
2
NPK(20-10-10)
0.06Kg/m2
Urea
3. 5 kg/m 2
biofertilizer
BLOCK C
Type and quality of
fertilizer application
1.5 kg/m 2
biofertilizer
0. 5 kg/m 2
biofertilizer
2.0 kg/m 2
biofertilizer
Control
No application
2 . 5 kg/m 2
biofertilizer
0.12Kg/m2
NPK(20-10-10)
-
1. 0 kg/m 2
biofertilizer
3. 5 kg/m 2
biofertilizer
0.06 Kg/m2
Urea
3. 0 kg/m 2
biofertilizer
F ig. 5 . Experimental plot design with Complete block Randomized Method

17
Fig.6. Fenced research plots with scarecrows and chosen plants to measure growth.
II.2.2.Soil and biogas slurry collection
With the use of a clean spade and knife, about 30 cm of soil sample was dug from the
research plot and stored in a clean dry plastic bag. The dug soil was thoroughly mixed and 1kg of
composite soil collected. 10 soil samples were collected from the experiment site using a zig-zag
method and a composite sample from the 10 soil samples prepared for laboratory analysis (Fig.
7). The soil samples were collected in September during the rainy season and the predominant
vegetation in this area was bracken fern plants. The research plot was relatively flat. The biogas
slurry (biofertilizer or digestate) was collected from the biogas system digester outlet and
thoroughly mixed and a sample of it also collected for laboratory analysis. The biogas slurry is
derived from biogas system processed pig dung. These samples were transported for analysis at
the Waste Water Research Laboratory in the University of Yaounde I to know their content in
Carbon, Nitrogen, Phosphorous, Potassium, Calcium, Magnesium, Sodium, conductivity, PH and
C/N.

18
Fig. 7: Soil sample from research plot for analysis. a :Soil sample collection; b : Soil sample
mixing.
II.2.3.Physico-chemical analysis of soil and biogas digestate samples
II.2.3.1.Preparation of soil and biogas slurry sample for analysis
The method used for soil extraction is Mehlich 3-Extractable Elements. 3 g of dry soil
was weighed and passed through a 2 mm sieve into 125 ml Erlenmeyer flask and 30 ml of the M3
extracting solution was added (Soil: Solution 1:10). Immediately, it was shaken on reciprocating
shaker for 5 minutes (120 oscillations per minute). The elements were analyzed in the filtrate
immediately using either an automated or manual method as described below.
II.2.3.2.Determination of electrical conductivity
Conductivity measures the capacity of ions especially dissolved inorganic solids to
transport electrical current in water. A measure of this value can give a general idea of
mineralization of water. A conductimeter HACH model was used to measure these values in the
laboratory. For each measurement, the instrument was brought to a standard electrode which was
plunged vertically into each sample. The value for conductivity was read directly on a digital
screen attached to the conductimeter by selecting the corresponding button for each parameter.
II.2.3.3.Determination of Phosphorus by Manual Calorimetric Method
2 ml of the clear filtrate or standard (0 to 10 µgml-1) phosphorus solution was pipetted
into a 25 ml volumetric flask. The sample aliquot contained less than 10 µg of phosphorus and
dilution of the filtrate with M3 was done. 15 ml of distilled water and 4 ml of solution B were
added and made to volume with distilled water and mixed. Colour developed in 10 minutes and
the absorbance was measured at 845 nm.
a b

19
II.2.3.4.Determination of Total Organic Carbon
This was done using the Dry Combustion method. A standard was prepared by adding a
range of aliquots of glucose solution to borosilicate tubes (25 mm OD) marked at 100 ml. A
convenient range of standard was 1-12 ml that equated to 2-24 mg of Organic Carbon. Tubes
containing glucose solution and a blank were dried in an oven at a temperature not exceeding 60
°C. 0.1 – 2.0 g of air-dried soil (> 0.15 mm) containing > 20 mg of Organic Carbon were added
Organic Carbon into digestion tubes. 10.0 ml of Na2Cr
2O
7 solution was added, and while
agitating 20.0 ml of 98 % H2SO4 was added cautiously so that the reaction is confined to the
bottom of the tube. It was agitated for a further 30 seconds before inserting into a pre-treated (135
°C) digestion block. Tubes were agitated occasionally to ensure all of the soil material was
exposed to the chromic acid mixture. After 45 minutes, tubes were removed from block and
allowed to cool. 50 ml of distilled or de-ionized water was added to digest and agitated with
thick-walled glass capillary tube that had a stream of air passing through it so that the samples are
thoroughly mixed. After removal from the block, the samples still contained H2SO
4 at strong
enough concentration to cause heating when water is added. When the tubes were inverted after
the addition of water, enough heat was generated to potentially cause hot chromic acid to be lost.
Agitation with the assistance of a stream of air prevented any losses. When cold, the tubes were
made up to 100 ml with distilled or de-ionized water and inverted to mix using a rubber bung.
Diluted Chromic acid mixture was decanted into 15 ml centrifuge tubes and centrifuge at 2000
rpm for 15 minutes. The absorbance of the centrifuged samples was measured at 600 nm in a 10
mm cell.
- Calculations of Total Organic Carbon
A standard curve was constructed by plotting absorbance at 600 nm against mg Carbon
present in standards. Using this curve, estimate of mg Carbon in unknown samples were
determined.
g Carbon Kg-1 soil = mg Carbon in digest/weight soil in grams
If the mg C content of samples is < 2 or > 20, analysis should be repeated with more or less
weight to bring them within the optimum range of the determination.
- Modification for saline soil
For saline soils, a separate determination of Chloride content in soil is required and expressed
as g.Cl.Kg-. The Organic Carbon content of the soil is then corrected for the Chloride content.
g.C.kg-1 soil = apparent g.C.Kg-1 soil – (g.Cl.kg-1 soil/12)

20
II.2.3.5.Determination of Potassium, Calcium, Magnesium and Sodium
This was done using the Flame Emission method. 1 to 5 ml of filtrate was pipetted into a
5 ml volumetric flask and approximately 40 ml of de-ionized water added and mixed. 1 ml of the
CsCl-LaCl3 solution was added to bring to volume with de-ionized water and mixed. Calcium,
magnesium, Potassium and Sodium elements were determined by flame test since all elements
produce different colours.
II.2.3.6. Determination of Hydrogen Potential
This represents the degree of acidity or alkalinity of water and was measured in the
laboratory using a PH meter SCHOT GERATE 818 model. In the presence of H+ ions, the
electrode of the PH meter develops an electric potential proportional to the concentration of H+
ions at the glass interface of the PH meter. The electrode of the P
H meter was plunged into a 100
ml prepared sample. A preliminary calibration of the PH meter was done using buffer solutions of
value 7.00 and 4.01. The value was read directly on the PH meter.
II.2.3.7. Determining Total Kjeldahl Nitrogen (TKN) Analysis
For the analysis of total Kjeldahl Nitrogen, 40ml of sample solution was digested using
Sulphuric acid (H2SO
4) in a Bucchi digester at 350
oC for two hours. The digested sample
obtained was then mixed with 40 % sodium hydroxide (NaOH) in a Bucchi distillatory and
distilled for 2 minutes. The distillate was collected in a beaker containing 20ml of Boric acid
(H2BO
3) 4 % colored with an indicator. The solution obtained was titrated with H
2SO
4 0.1 N until
there was a colour change from green-yellow (indicating the presence of Nitrogen) to orange (the
initial colouration). The volume of H2SO
4 used for that color change was used to that of a known
blank TKN standard to calculate the amount of TKN of the sample.
II.2.4. Method of processing and applying biogas slurry andchemical fertilizers
The biogas digestate in semi liquid form was collected from the biogas system outlet
chamber with spades in the dry season and allowed to dry by placing it on a specially prepared
disgetate space (Fig.9). This digestate took 10 days to dry after which it was crushed and kept for
use in the experiment (Fig.10). This digestate was collected for about 40 days to get the right
quantity needed for the experiment. Before application in the research plot all of the digestate
was thoroughly mixed and applied to the research plot (Fig. 11). The digestate was spread on the
various beds uniformly respecting the variations. Quantities of digestate application on each bed

21
were determined by complete block randomized design method. The application ranged from 0.5
to 3.5 kg/m2 in each bed with a variation of 0.5 kg/m
2. When the expected quantity was spread on
each bed uniformly it was then thoroughly mixed with the topsoil in each bed. The biogas
digestate was applied and well watered a day before transplanting the huckleberry seedling.
Chemical fertilizers [Urea and NPK (20-10-10)] were also applied in two beds of each block 3
days after seedlings were transplanted. Urea was applied at 0.06 kg/m2 and NPK (20-10-10)
applied at 0.12 Kg/m2 through bed dressing and covered lightly with soil to prevent Nitrogen
escaping. The control beds were also watered. Chemical fertilizer was included in the research to
give opportunity for comparative study. One of the beds in each block served as a control without
any manure or chemical fertilizer application.
Fig.8. Obtaining pig dung for biogas production.a: BIOFARM piggery attached to the biogas
system; b: biogas plant mixing tank.
Fig.9. Digestate collection and dried. a: Collection of discharged biogas slurry; b: Drying slurry.
b a
b a
22
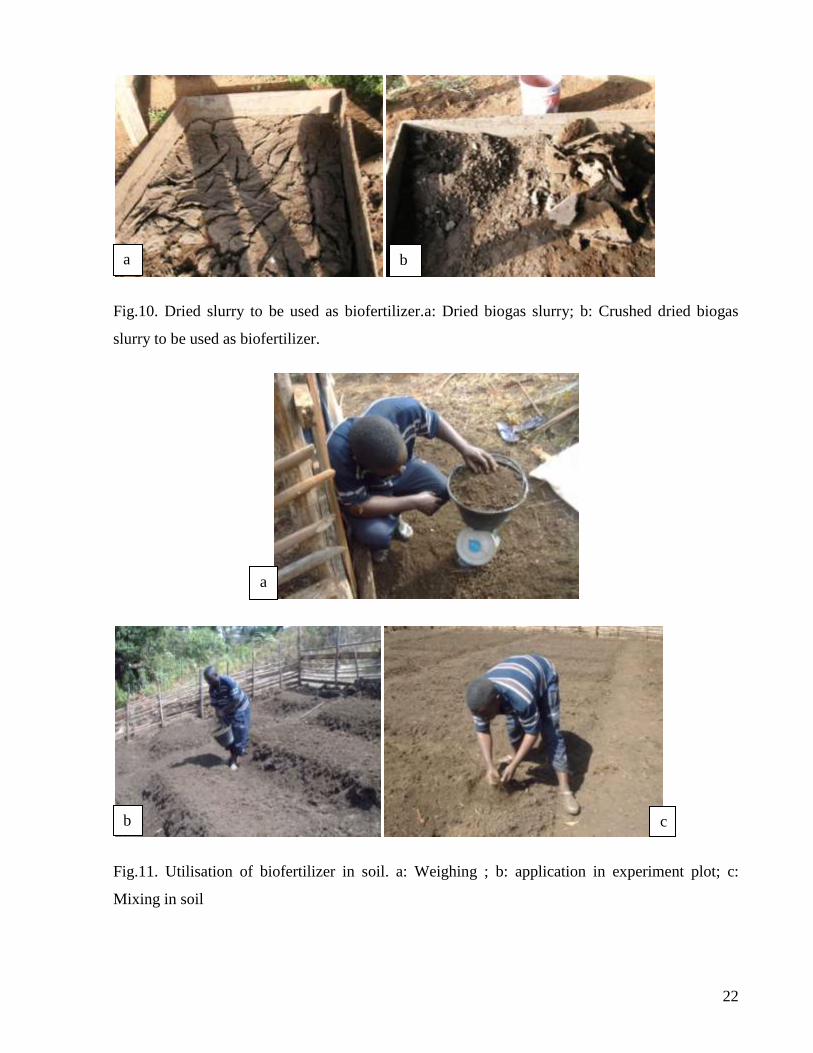
Fig.10. Dried slurry to be used as biofertilizer.a: Dried biogas slurry; b: Crushed dried biogas
slurry to be used as biofertilizer.
Fig.11. Utilisation of biofertilizer in soil. a: Weighing ; b: application in experiment plot; c:
Mixing in soil
b a
a
c b

23
II.2.5.Method used to nurse, transplant and measurehuckleberry growth
A nursery was prepared and fowl droppings applied as manure. Huckleberry seeds were
nursed. Seven weeks later, after nursing seeds, healthy seedlings were selected and transplanted
in the research plot. The selected seedlings were planted 20 cm apart from each other in the beds
to give four seedlings on the bed width and twelve seedlings on the bed length. Ten plants within
the middle rows were selected and the following parameters measured: plant height; number of
leaves produced per plant; crop yield; and length and width of chosen leaf measured weekly for a
period of eight weeks (Fig. 13 and 14). The number of leaves produced by the ten plants in each
bed was counted. Harvesting was done 6 weeks after transplanting and after the 8th
week.
Weighing was done each time harvesting was done. Watering was done on daily basis during the
first two weeks and once every two days from the third week onward every evening (Fig. 12).
Fig. 12. Watering of plants in experiment plot.

24
Fig.13. Measuring the height of plant.
Fig.14. Weighing of harvested crop from an experiment bed.
II.2.6. Research plot used as a training site
Considering that the SHUMAS’ BIOFARM Centre is a research, production, training and
demonstration centre, students learning organic agriculture and renewable energy in the centre
followed-up the experiment procedure in the experiment site closely. This was part of their
practical lessons. They received explanations and saw for themselves changes in the various
blocks with different applications. The changes were visible. The students appreciated this
research.

25
CHAPTER III: RESULTS AND DISCUSSION

26
III.1. Results
III.1.1. Biogas slurry and soil sample analysis
The physico-chemical analyses of soil sample and biogas slurry show in general that the
biogas slurry is richer than the soil in nutrients (Table IV). The pH of biogas slurry and soil
samples demonstrates that the soil is acidic while biogas slurry is basic. The conductivity of the
soil sample and biogas slurry indicates that biogas slurry is more mineralize than soil sample. The
main elements of growth which are Nitrogen, Phosporus and Potassium have a higher
concentration in biogas slurry than the soil.
Table IV. Indicate physico-chemical analysis results of soil and biogas slurry samples.
Properties
Samples
N (g/kg)
P (g/kg)
C/N TOC (g/kg)
Na (ppm)
Mg (ppm)
Ca (ppm)
K (ppm)
pH
water Cnd (µS/cm)
Biogaz 2.1 1.4 13.6 28.6 0,41 0,04 0,14 0,51 7,85 287
Soil 0.7 0.6 41.2 29.3 0,04
3 0,01 0,06 0,38 6,27 8,86
III.1.2. Growth rate results
III.1.2.1. Measurement of height of plant
Generally, all plants with biofertilizer and chemical fertilizer applications increased in
height from week 1 to week 8 as compared to control (Fig. 15). The heights of Solanum scabrum
vary according to the various types and quantity of fertilizer application. The maximum crop
height in cm obtained for 0.5 kg/m2, 1.0 kg/m
2, 1.5 kg/m
2, 2.0 kg/m
2, 2.5 kg/m
2, 3.0 kg/m
2, 3.5
kg/m2, Control, NPK and Urea applications are 13.46, 17.17, 15.25, 23.39, 27.5, 26.58, 26.53,
12.33, 13.07 and 17.7 respectively. Similar growth rates in height of plants were observed from
week 1 to week 3 and from week 4 to week 8 they were different with different applications. The
biofertilizer applications had a better growth result in height than chemical fertilizer applications.
The plant with 2.5 kg/m2 biofertilizer application recorded the highest growth. Crops with
biofertilizer application of 2.5 kg/m2, 3.0 kg/m
2 and 3.5 kg/m
2 had a great increase in height
above 25 cm from week 1 to week 8. For chemical fertilizer application in Solanum scabrum
Urea had a higher growth rate in height than NPK.

27
Fig.15. Presents plant growth rate in height in response to different quantities and types of
biofertilizer and chemical fertilizer application in weekly intervals.
III.1.2.2. Counting of number of leaves
Generally, the number of leaves in Solanum scabrum increase gradually with time with all
the different types and quantities of fertilizer application (Fig.16). Between the first week and
third week of transplanting Solanum scabrum with different fertilizer application the number of
leaves increase almost the same. After the fourth week there was a great difference. From the
fourth week to the eighth week biofertilizer application in Solanum scabrum witness a higher
increase in number of leaves than in chemical fertizer application and control.
The maximum number of leaves obtained for 0.5 kg/m2, 1.0 kg/m
2, 1.5 kg/m
2, 2.0 kg/m
2, 2.5
kg/m2, 3.0 kg/m
2, 3.5 kg/m
2, Control, NPK and Urea applications are 83, 96, 110, 150, 156, 166,
176, 58, 67 and 78 respectively. Generally the best growth rate in number of leaves was recorded
by crops with 2.0 kg/m2, 2.5 kg/m
2, 3.0 kg/m
2 and 3.5 kg/m
2 biofertilizer application respectively.
The best results were obtained with 3.5 kg/m2 biofertilizer application. The application of Urea in
Solanum scabrum produce more leaves than NPK application.
0
5
10
15
20
25
30
1 2 3 4 5 6 7 8
He
igh
t in
cm
Time in weeks
0,5 Kg/m2 biofertilizer 1,0 Kg/m2 biofertilizer 1,5 Kg/m2 biofertilizer
2,0 Kg/m2 biofertilizer 2,5 Kg/m2 biofertilizer 3,0 Kg/m2 biofertilizer
3,5 Kg/m2 biofertilizer Control No application NPK Chemical fertilizer
Urea Chemical fertilizer

28
Fig. 16. Presents increase in crops’ number of leaves in response to different quantities and types
of biofertilizer and chemical fertilizer application on weekly intervals.
III.1.2.3. Measurement of plant chosen leaf surface area
Generally, the leaf surface area of different Solanum scabrum plants increase gradually
between the fifth week and eighth week of transplanting with different fertilizer applications(Fig.
17). Biofertilizer applications in Solanum scabrum witness a higher increase in leaf surface area
than in chemical fertizer application and control. The maximum leaf surface area for various
Solanum scabrum with different applications of biofertilizer and chemical fertilizer obtained for
0.5 kg/m2, 1.0 kg/m
2, 1.5 kg/m
2, 2.0 kg/m
2, 2.5 kg/m
2, 3.0 kg/m
2, 3.5 kg/m
2, Control, NPK and
Urea were 3.95, 4.89, 5.25, 7.93, 10.04, 9.7, 3.47, 3.64 and 4.2 respectively. Generally the best
growth rate in leaf surface area was recorded by crops with 2.5 kg/m2, 3.0 kg/m
2 and 3.5 kg/m
2
biofertilizer application respectively. The best results were obtained with 3.0 kg/m2 biofertilizer
application. The application of Urea in Solanum scabrum had a higher leaf surface area increase
than NPK application
.
0
20
40
60
80
100
120
140
160
180
200
1 2 3 4 5 6 7 8
Nu
mb
er
of
leav
es
Time in weeks
0,5 Kg/m2 biofertilizer 1,0 Kg/m2 biofertilizer 1,5 Kg/m2 biofertilizer
2,0 Kg/m2 biofertilizer 2,5 Kg/m2 biofertilizer 3,0 Kg/m2 biofertilizer
3,5 Kg/m2 biofertilizer Control No application NPK Chemical fertilizer
Urea Chemical fertilizer

29
Fig. 17. Presents increase in crops’ chosen leaf surface area in response to different quantities and
types of fertilizer application in weekly intervals.
III.1.2.4. Crop yields during harvest
Each bed in the experiment block had 48 plants. 10 plants in each bed were chosen from
the middle lines to measure growth parameters of number of leaves, height of plant and leaf
surface area. Harvesting was done using a razorblade for the remaining 38 plants in each bed on
the 6th
and 8th
week after transplanting (Table V). The first harvesting was done on each crop four
steps above the ground on the plant to permit new shoots to develop and form new branches. The
second harvesting was done at the end of experiment and harvesting was done by cutting the crop
close to the ground.
The maximum crop total yield in kg for the 38 crops harvested per bed in Table V with
different applications of 0.5 Kg/m2 biofertilizer, 1.0 Kg/m
2 , 1.5 Kg/m
2, 2.0 Kg/m
2, 2.5 Kg/m
2,
3.0 Kg/m2, 3.5 Kg/m
2, Control, NPK and Urea were 0.15, 0.28, 0.34, 0.53, 0.62, 0.65, 0.80, 0.18
and 0.15 respectively. Generally the best crop yields were recorded by crops with 2.0 kg/m2, 2.5
kg/m2, 3.0 kg/m
2 and 3.5 kg/m
2 biofertilizer application. The best results were obtained with 3.5
kg/m2 biofertilizer application with yields of 0.8 kg/m
2. The applications of Urea and NPK in
Solanum scabrum produce almost similar results (0.15 and 0.18) respectively.
0
2
4
6
8
10
12
14
1 2 3 4
Surf
ace
are
a in
cm
2
Time in weeks
0,5 Kg/m2 biofertilizer 1,0 Kg/m2 biofertilizer
1,5 Kg/m2 biofertilizer 2,0 Kg/m2 biofertilizer
2,5 Kg/m2 biofertilizer 3,0 Kg/m2 biofertilizer
3,5 Kg/m2 biofertilizer Control No application
NPK Chemical fertilizer Urea Chemical fertilizer

30
Table V: Crops yield for 38 crops in each bed after 6 and 8 weeks of transplanting.
Crop yield
Application
fertilizers
Yields for 38
plants after 6
weeks of
transplanting (kg)
Yields for 38
plants after 8
weeks of
transplanting (kg)
Total yield for 38
crops after 6 and 8
weeks of
transplanting (kg)
3.5 kg/m2 biofertilizer 0.27 0.53 0.80
3.0 kg/m2 biofertilizer 0.25 0.40 0.65
2.5 kg/m2 biofertilizer 0.22 0.40 0.62
2.0 kg/m2 biofertilizer 0.20 0.33 0.53
1.5 kg/m2 biofertilizer 0.12 0.22 0.34
1.0 kg/m2 biofertilizer 0.10 0.18 0.28
0.5 kg/m2 biofertilizer 0.00 0.15 0.15
Urea 0.02 0.13 0.15
NPK (20-10-10) 0.00 0.18 0.18
Control 0.00 0.12 0.12
Harvesting of the 10 chosen plants after experiment was done by cutting the plant with the
razorblade at the base close to the soil. All the crop mass above the soil was removed. This was
done after 8 weeks when the experiment ended. The crop yield in kg for 10 crops in Table VI
harvested after experiment whose height, number of leaves and surface area were measured gave
similar results to 38 crops. Table VI shows yields with different applications of 0.5 kg/m2
biofertilizer, 1.0 kg/m2 , 1.5kg/m
2, 2.0 kg/m
2, 2.5 kg/m
2, 3.0 kg/m
2, 3.5 Kg/m
2, Control, NPK
and Urea. The results obtained were 0.05, 0.10, 0.08, 0.15, 0.20, 0.22, 0.23, 0.03, 0.05 and 0.05
respectively. Generally the best crop yields were recorded by crops with 2.5 kg/m2, 3.0 kg/m
2 and
3.5 kg/m2 biofertilizer application. The best results were obtained with 3.5 kg/m
2 biofertilizer
application with yields of 0.23 kg/m2. The applications of Urea and NPK in Solanum scabrum
produce similar results (0.05 and 0.05 respectively).

31
Table VI: Crop yield for 10 chosen plants after the end of experiment.
Crop yield
Application
fertilizers
Yields for 10 plants after 8 weeks of
transplanting when experiment ended (kg)
3.5 kg/m2 biofertilizer 0.23
3.0 kg/m2 biofertilizer 0.22
2.5 kg/m2 biofertilizer 0.20
2.0 kg/m2 biofertilizer 0.15
1.5 kg/m2 biofertilizer 0.08
1.0 kg/m2 biofertilizer 0.10
0.5 kg/m2 biofertilizer 0.05
Urea 0.05
NPK (20-10-10) 0.05
Control 0.03
III.1.3. General observation in experiment plants during growth
As plants grow old, the main stems became stronger and larger and more branches and
leaves developed on it especially at the base. Crops with much biofertilizer application were
observed to be fresher and greener than those with little or no application. Although, growth rate
was slow in crops applied with urea, the crops look fresher than those with NPK and less
biofertilizer application. The main stem leaves and branch production reduced from the base
towards the top (Fig. 18). Number of branches, leaves and leaf size increased from crops with
less biofertilizer application to crops with more biofertilizer application. No plant branch leaf was
seen to be bigger than leaves produced by the main stem. Flowering occurred in crops with 3.5
kg/m2, 3.0 kg/m
2 and 2.5 kg/m
2 biofertilizer applications from week 6 through week 8 after
transplanting.

32
Table VII. Physical observation in Solanum scabrum with different fertilizer application
Physical
characteristic
Fertilizers
application
Colour of
plant
Degree of freshness Flowering Number of
branches
3.5 kg/m2 to 2.0 kg/m
2 Very green Very fresh faster Very much
1.5 kg/m2 to 1.0 kg/m
2 Green Fresh slow Much
Urea Green Fresh slow Much
NPK Dark green Not fresh slow Few
Control Dark green Not fresh slow Few
Fig. 18. Number of leaves and branches in stem reduces from plant base to top.
Fig.19. Plants develop more branches and leaves after main shoots are cut during first harvest.
33
III.2. Discussion
III.2.1. Physicochemical characteristic of Biogas slurry and soil sample
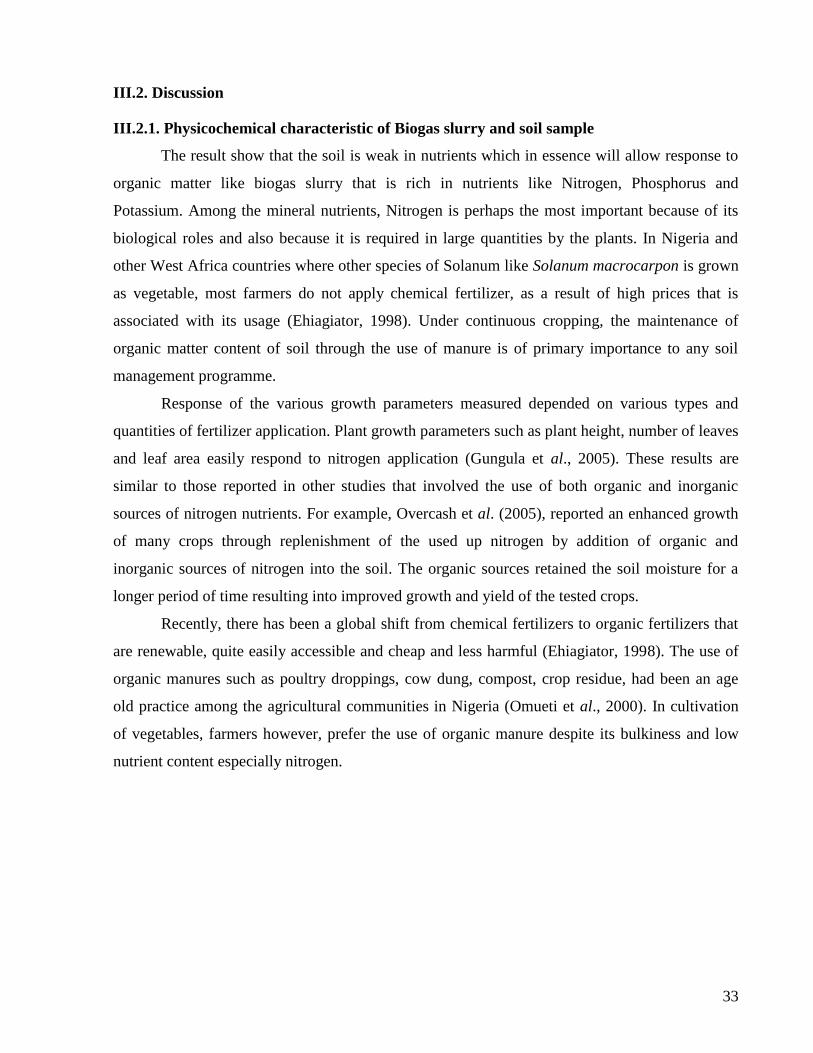
The result show that the soil is weak in nutrients which in essence will allow response to
organic matter like biogas slurry that is rich in nutrients like Nitrogen, Phosphorus and
Potassium. Among the mineral nutrients, Nitrogen is perhaps the most important because of its
biological roles and also because it is required in large quantities by the plants. In Nigeria and
other West Africa countries where other species of Solanum like Solanum macrocarpon is grown
as vegetable, most farmers do not apply chemical fertilizer, as a result of high prices that is
associated with its usage (Ehiagiator, 1998). Under continuous cropping, the maintenance of
organic matter content of soil through the use of manure is of primary importance to any soil
management programme.
Response of the various growth parameters measured depended on various types and
quantities of fertilizer application. Plant growth parameters such as plant height, number of leaves
and leaf area easily respond to nitrogen application (Gungula et al., 2005). These results are
similar to those reported in other studies that involved the use of both organic and inorganic
sources of nitrogen nutrients. For example, Overcash et al. (2005), reported an enhanced growth
of many crops through replenishment of the used up nitrogen by addition of organic and
inorganic sources of nitrogen into the soil. The organic sources retained the soil moisture for a
longer period of time resulting into improved growth and yield of the tested crops.
Recently, there has been a global shift from chemical fertilizers to organic fertilizers that
are renewable, quite easily accessible and cheap and less harmful (Ehiagiator, 1998). The use of
organic manures such as poultry droppings, cow dung, compost, crop residue, had been an age
old practice among the agricultural communities in Nigeria (Omueti et al., 2000). In cultivation
of vegetables, farmers however, prefer the use of organic manure despite its bulkiness and low
nutrient content especially nitrogen.
34
III.2.2.Growth rate of plant
The results of this study indicate that Solanum scabrum is sensitive to the availability of
the types and quantities of fertilizer application in the soil, but the magnitudes of their responses
differ. This growth rate is as a result of the absorption of nutrients available in the soil. These
nutrients are made available in the soil by micro-organism activities on organic matter. Response
of the various growth parameters measured depended on the variety of the African nightshade
and the level of compost manure applied. Plant growth parameters such as plant height, number
of leaves and leaf area easily respond to nitrogen application (Gungula et al., 2005). Our results
are similar to those reported in other studies that involved the use of both organic and inorganic
sources of nitrogen nutrients. For example, Overcash et al., (2005), reported that the organic
sources retained the soil moisture for a longer period of time resulting into improved growth and
yield of the tested crops.
Nitrogen is reportedly more responsible for plant growth than any other element. It
stimulates vegetative growth resulting in large stems and leaves. Our observations support those
reported by Edmonds and Chweya, (1997), Chweya, 1997, Schippers, 2000; and Mwai and
Schippers, (2004) where this stage of growth was reached in four to five weeks after
transplanting. The results also support the findings of Onyango et al., (1999) who reported
enhanced growth of plants grown under different organic and inorganic nitrogen sources. On the
other hand, the presence of other nutrients like Magnesium and Calcium in biogas slurry added to
soil also modified physico-chemical properties of the soil. The properties that could be modified
are pH, porosity, available of nutrients like Magnesium for chlorophyll. These elements were in
very low quantities in soil (control) and in different soil mixture (like soil plus urea and soil plus
NPK). The presence of these elements and other primary elements in biofertilizer applied on
experimental plot lead to increase in growth rate. These results confirm that increase in
biofertilizer application leads to increase growth rate.
Schilppers, (2002) reports that plant heights for solanum scabrum are usually about 60 cm
but could grow to 1.20 m or more and that there are both small and large leave cultivars with
different leaf shapes and leaf colour which can be either green or dark purple. These results
present the highest plant height after 8 weeks of transplanting to be 27.5 cm with 2.5 kg/m2
biofertilizer application. After 8 weeks of transplanting the crops still showed signs to grow
higher before flowering.

35
African nightshade plants subjected to low levels or no fortified manure application
exhibited poor growth rate associated with nitrogen deficiency. Plants suffering from nitrogen
deficiency mature earlier and their vegetative growth stage is shortened (Wolf, 1999). This report
supports the results this research obtained with the control plant. On the other hand excess
nitrogen results in lush plants with soft tissue and subsequent lateness in maturity (Wolf, 1999).
The results also confirm those reported by Indira (2005) who attributed the response of plants to
nitrogen application to enhanced nitrogen mining capacity of plants due to increased
translocation of photoassimilates brought about by faster root growth.
Schilppers in 2002 reported that in Cameroon, the optimum yield on Solanum scabrum are
obtained during the third harvest, which is about 2 months after planting. The findings of this
research confirm yields increasing from the first harvest on the six week and second harvest on
the eighth week after transplanting. Schilppers also report that a commercial farmer can obtain up
to 150-200 tones per hectare and with good management, even more from his dry-season crop of
the large-leaved type. For the dark, small-leaved type, which is very popular in West Cameroon
that this research was done on, the average yield per 1000 m2
is about 50 large bundles (of about
20 kg each) per harvest. The total yields are about 30-50 t/ha for smaller-leaved scabrum
varieties. The results of this research confirm this report by Schilppers, (2002). These results
show that the best crop yields increased with application of organic manure and the highest yield
was obtained with 3.5 kg/m2 biofertilizer application at 0.08 kg/m
2.

36
CHAPTER IV: CONCLUSION AND RECOMMENDATIONS

37
IV.1. CONCLUSION
This research had as objective to assess the effectiveness of biogas slurry as biofertilizer for
huckleberry cultivation in Kumbo, Cameroon.
The results of this research after laboratory analysis show that digestate obtained after biogas
production is richer in nutrient than the soil in the experiment plot and is therefore is suitable to
be used as fertilizer to improve soil fertility. The right quantity of digestate to be used to fertilize
has been determine by this experiment. This has been determined using huckleberry (Solanum
scabrum) vegetable grown in Kumbo and other parts of Cameroon with a high local and
international market. The quantity of biofertilizer observed to produce good huckleberry growth
were biofertilizer application of 2.5 kg/m2, 3.0 kg/m
2 and 3.5 kg/m
2. Biofertilizer application of
2.5 kg/m2
had the best growth rate in crop height. Number of leaves in crops increased most with
biofertilizer application of 3.0 kg/m2, less with biofertilizer application of 3.0 kg/m
2and least with
biofertilizer application 2.5 kg/m2. The trend was same for crop yields of 38 crops per bed that
were not selected to measure crop growth and 10 chosen crops for growth measurement.
Considering that 2.5 kg/m2
biofertilizer application was among the best three biofertilizer
application that recorded good results and the fact that increasing biofertilizer application from
2.5 kg/m2
through 3.0kg/m2 and 3.5 kg/m
2 entails increase cost, 2.5 kg/m
2 biofertilizer application
is recommended as the best quantity of biogas slurry application. Quantity of biogas slurry
application could also be increase if the biogas slurry is in large quantities. The quantities of Urea
and NPK (20,10,10) applied in soil was not enough and this needed a new studies to determined
the right quantity to be applied.
Biogas technology is not yet popular in Cameroon and in Africa as a whole but it has a
big role to play in poverty alleviation and food production. Biogas technology should be
promoted as a source of clean energy and a source of biofertilizer needed by rural communities in
developing world like Cameroon. Families in rural areas like Kingomen where this study was
carried out own some animals but lack cooking energy and money to buy chemical fertilizer that
is expensive. Biogas technology can provide energy and biofertilizer.

38
IV.2. RECOMMENDATIONS
The following recommendations are suggested for the following actors:
SHUMAS
- Popularize the results of this research to local farmers and to the public. This will
encourage local people to develop biogas systems and get biofertilizer for vegetable
gardening and energy for cooking thereby reducing dependency on scarce forest resource
and fighting climate change;
- Advocate for research to be carried out to know the right quantities of Urea and NPK (20-
10-10) that should be applied in vegetables farms locally;
- Allow farmers have access to biogas slurry from their BIOFAARM Centre to use in their
farms because sometimes biogas slurry overflows without use;
- Encourage students to carry out research on the amount of biogas slurry to be used as
biofertilizer for the cultivation of other vegetables and crops and
- Allocate land purposely for research in the BIOFARM Centre that has accessibility to
water and is suitable for research.
Local population
- The population living around Kingomen and other areas should study and engage in
practical work at the SHUMAS’ BIOFARM Centre to learn from her rich knowledge,
experience and skills on improved methods of integrated organic agriculture especially on
vegetable cultivation so as to increase food production and improve their livelihoods.
Other Non Governmental Organisations and Institutions
- Need to partner with SHUMAS and other like minded structures to share knowledge,
skills and experience on this technology in order for them to replicate it in other areas.
Government
- Considering the energy problems in rural areas, the increase in prices of chemical
fertilizer and the need to implicate local people in the fight against climate change there is
need for the government to set demonstrative biogas systems in local communities that
will help them see the potential of biogas system in energy and biofertilizer production.
- Government support SHUMAS and other like-minded institutions with funds to make
available this workable technology to local people. This will help local people get
biofertilizer for their farms and energy for cooking and go a long way to protect the
remaining forest from degradation while reducing human suffering in search of firewood.

39
BIBLIOGRAPHY
Agu S., Bonnefoy A., Devaux L., Mouilleron T., Touret H., 2000. Agriculture et effet de serre:
adaptation des pratiques agricoles, alternatives énergétiques. Rapport scientifique, Ecole
Supérieure d’Agriculture (France), 95p.
Anonymous, 1992. Vegetable Production training manual: Asian vegetable research and
development centre. Shahnua, Tainan, 16p.
Anonymous, 2007. Activity Report of the Divisional Delegation of Agriculture and Rural
Development for Bui, pp 1-12.
Anonymous, 2008.Activity Report of the Divisional Delegation of Agriculture and Rural
Development for Bui, pp 17-30.
Abukutsa-Onyango, 2007. The diversity of cultivated African leafy vegetables in three communities
in western Kenya, African Journal of Agriculture, Food, Nutrition and Development, 3(7) :
10-77.
Onyango M. and Karimi K., 2005. Response to broad leaved African Nightshade to nitrogen
application. African Crop Science society, 7: 1237-1240.
Abukutsa-Onyango Mary, 2009. Effects of N-Fertilization on yield components of Nightshadw,
Acta Hort. (ISHS), 806: 727-732.
Chweya, J.A., 1997. Genetic enhancement of indigenous vegetables in Kenya. in Traditional
African Vegetables Guarino L. (ed.). Gatersleben/Intemational Plant Genetic Resources
Institute, Rome, Italy, pp. 90-99.
Emma J., 2002. Hands on Energy, Infrastructure and Recycling-Practical Innovations for a
Sustainable. World ITDG Publishing 4: 17-22.
Edmonds J.M. and Chweya J.A., 1997. Black nightshades, Solanum nigrum L. and related species.
Proceedings of the IPGRI International Workshop on Genetic Resource of Traditional
Vegetables in Africa, Nairobi, Kenya, pp 128-147.
Ehiagiator J.O., 1998. Farmyard (FYM). Need for its adoption as an alternative to chemical fertilizer
use in Nigeria. Nig. J. Hortic. Sci., 3: 1-5.
Fontem D.A., 1991. An Inventory and Evaluation of Major Diseases of Vegetable Crops in
Cameroon. Technical Report, University of Dschang, 14 p.
Fontem D. A., 2003. Impact of fungicide applications for late blight management on huckleberry
yields in Cameroon. African Crop Science, Uganda, pp 1-18.

40
Indira C., 2005. Effect of nitrogen fertilizers on growth, yield and quality of hybrid rice (Oryza
sativa). Journal of Central European Agriculture, 6 (4):611-618.
Gungula D.T., Togun A. O. and Kling, J.G., 2005. Overview of specific organics in beneficial reuse
in land application: Journal of Environmental Quality, 34, 29-41.
Muthomi J. and MusyimiD. M., 2009.Growth responses of African nightshades (Solanum scabrum
MILL) seedlings to water deficit. Journal of Agricultural and Biological Science, Asian
Research Publishing Network, (4): 5, 16P.
Raupp J., 2001. Manure fertilization for soil, organic matter maintenance and its effects upon crops
and the environment, evaluated in a long-term trial. In: R.M Rees (ed), Sustainable
Management of soil organic matter. CABI Publishing, Wallingford, pp 123-171.
Goulding K. W. T., Rees M., 2001. The role of soil organic matter and manures in sustainable
nutrient cycling. In: R.M Rees (ed). Sustainable management of soil organic matter, CABI
Publishing, Wallingford, 3: 15-23.
Kuria J. and Maringa M., 2008.Developing simple procedures for selecting, sizing, scheduling of
materials and costing of small bio-gas units. International Journal for Service Learning in
Engineering, 3: 9-40.
Mathew Fedder, 1986. Forest Farm Husbandry. Technology Consultancy Centre, Russell Press Ltd,
Nottingham, 1: 3-11.
Mwai G. N. and Schippers, R. R., 2004Solanum florulentum Bitter: plant resources of tropical
Africa. Wageningen, The Netherlands, 2 : 11-36.
Ngundam C.F.P., 1997. The place of indigenous vegetables in the farming systems of Cameroon. In:
African Indigenous Vegetables, Workshop Proceedings, January (3)-(8): 19-77.
Onyango M. O.A., Onyango J.C., Bashir j., Niang A. and Obiero H.M., 1999. Response of Some
Traditional Vegetables in Western Kenya to organic and Inorganic fertilizer Application.
Institute of Research and Postgraduate Studies Seminars, Maseno University College, 105
p.
Opiyo A.M., 2004. Effect of nitrogen application on leaf yield and nutritive quality of black
nighshade Solanum nigrum L. Outlook on agriculture, 33(3): 209-214.
Overcash M., Sims R.C., Sims J.L. and Nieman J.K.C., 2005. Beneficial Reuse and Sustainability:
The Fate of Organic compounds in land-Applied Waste. J. Environ. Qual, 34 (1): 29 – 41.
Schippers R.R., 1998. Notes on Huckle berry, Solanum scabrum and related Black Nightshade
Species. Natural Resource Institut, Unviversity of Greenwich, 103p.

41
Schippers, R. R., 2000. African Indigenous Vegetables: An Overview of the Cultivated Species.
Chatham, UK: Natural Resource Institute/ACP-EU Technical Centre for Agricultural
Resources and Rural Cooperation, pp 511-516.
Schippers R.R., 2002. African indigenous vegetables an overview of the cultivated species. Natural
Resources Institute/ACP-EU Technical Centre for Agricultural and rural Cooperation,
Chatham, UK., pp 22-36.
Shippers R.R and Fereday N, 1998. Opportunities and constraints in the subsistence production and
marketing of indeginous vegetables in East and central Africa. NRI project report AO699,
Joint report with Dschang University, IRAD and IITA in Cameroon and Makerere
University and Kawanda Agricultural Research Institute in Uganda, 53p.
Stevels J. M. C., 1990. Legumes traditionnels du Cameroon, une etude agro-botanique. Wageningen
Agricultural University No. 90-1, Wageningen, The Netherlands, 262p.
Tize K.J., 2009. Conception, construction et test de performance d’une unite de production du
biogas de 25m3 pour l’approvisionnement d’un centre de formation a Kumbo. Mémoire
présenté pour l’obtention du diplôme d’Ingenieur Agronome, option génie rural, FASA,
Université de Dschang, Cameroun, 91p.
Tony Zinch, 2006. Growing food-A guide to food production. Springer, Dordrecht,
Netherlands,23p.
Schenkeh Y., 2009. Recommendation for AD sludge utilisation as a biofertilizer in agriculture,
EUBIA, Belgium, 33 p.
Westphal E., 1981. L’Agriculture Autochtone au Cameroun, MSc. Papers 20. landbouw-hogeschool,
Wageningen, 175 p.
Wolf B. 1999. The fertile triangle: the interrelationship of air, water and nutrients in maximizing soil
productivity. New York, USA: Food Products Press. pp 11-20.