Assessment of rainfall variability, rainwater harvesting ... of RWH Viabillity.pdf · example, with...
37
1 Assessment of rainfall variability, rainwater harvesting potential and storage requirements in Odeda Local Government Area of Ogun State in Southwestern Nigeria Isaac Idowu Balogun, Adebayo Olatunbosun Sojobiand Bosede Oyegbemijo Oyedepo Accepted Manuscript Version This is the unedited version of the article as it appeared upon acceptance by the journal. A final edited version of the article in the journal format will be made available soon. As a service to authors and researchers we publish this version of the accepted manuscript (AM) as soon as possible after acceptance. Copyediting, typesetting, and review of the resulting proof will be undertaken on this manuscript before final publication of the Version of Record (VoR). Please note that during production and pre-press, errors may be discovered which could affect the content. © 2016 The Author(s). This open access article is distributed under a Creative Commons Attribution (CC-BY) 4.0 license. Publisher: Cogent OA Journal: Cogent Environmental DOI: http://dx.doi.org/10.1080/23311843.2016.1138597 Science
Transcript of Assessment of rainfall variability, rainwater harvesting ... of RWH Viabillity.pdf · example, with...

1
Assessment of rainfall variability, rainwater harvesting potential and storage requirements in Odeda Local Government Area of Ogun State in Southwestern Nigeria
Isaac Idowu Balogun, Adebayo Olatunbosun Sojobiand Bosede Oyegbemijo Oyedepo
Accepted Manuscript Version
This is the unedited version of the article as it appeared upon acceptance by the journal. A final edited version of the article in the journal format will be made available soon. As a service to authors and researchers we publish this version of the accepted manuscript (AM) as soon as possible after acceptance. Copyediting, typesetting, and review of the resulting proof will be undertaken on this manuscript before final publication of the Version of Record (VoR). Please note that during production and pre-press, errors may be discovered which could affect the content. © 2016 The Author(s). This open access article is distributed under a Creative Commons Attribution (CC-BY) 4.0 license.
Publisher: Cogent OA
Journal: Cogent Environmental
DOI: http://dx.doi.org/10.1080/23311843.2016.1138597
Science
2
Assessment of rainfall variability, rainwater harvesting potential and storage requirements in Odeda Local Government Area of Ogun State in Southwestern Nigeria
Isaac Idowu Balogun1, Adebayo Olatunbosun Sojobi2 and Bosede Oyegbemijo Oyedepo1
1Department of Geography, University of Lagos, Akoka, Lagos, Nigeria
Isaac Idowu Balogun
e-mail: : [email protected] tel.: +234-805-229-3938
Bosede Oyegbemijo Oyedepo
e-mail: [email protected] tel.: +234-706-047-8766
2Department of Civil Engineering, Landmark University, Kwara State, Nigeria P.M.B. 1001,
Omu Aran, Nigeria
Adebayo Olatunbosun Sojobi
e-mail: [email protected]; [email protected]
tel.: +234-802-832-6364
Dow
nloa
ded
by [
97.1
23.1
92.8
8] a
t 04:
55 1
6 Ja
nuar
y 20
16

3
Assessment of rainfall variability, rainwater harvesting potential and storage requirements in Odeda Local Government Area of Ogun State in Southwestern Nigeria
Isaac Idowu Balogun1, Adebayo Olatunbosun Sojobi2 , Bosede Oyegbemijo Oyedepo1
Abstract
Rainfall variability with periodicity of 5-6 years has been demonstrated for our study area and
may be attributed to tropical and extratropical factors which operate during different months,
seasons and years. Rainfall variability in terms of coefficient of variation ranges from 24-
39% and 26-41% for the seasons and months. The mean increase of 1.63 mm/year and 1.37
mm/year experienced in the dry season months (November –April) and the wet season
months (May-October) respectively is insignificant from a water management perspective.
Hoeffding’s D statistics revealed prevalence of non-monotonic trend in all the months and
seasons. Recommended minimum and maximum storage capacity requirements for a six-
member household to maximize rainwater harvesting are 1 m3 and 6 m3 respectively. The
rainwater harvesting potential for the area of study ranges between 18.16 m3-27.45 m3 and
15.23-30.40 m3 based on the maximum error estimate and coefficient of variation methods.
Domestic rainwater harvesting has the potential to meet 27.51% -54.91% of non-potable
household water demand as well as 78.34% -156.38% of household potable water demand for
a six-member household. It is highly encouraged as a supplementary water source especially
in rural and peri-urban areas to reduce their vulnerability to acute shortage of water
infrastructure.
Keywords: climograph, domestic rainwater harvesting; rainfall variability; rainwater
harvesting potential; seasonal classification of climate; standardized precipitation index;
storage requirements; water demand
ABOUT THE AUTHORS
Isaac Idowu Balogun is a Senior Lecturer in the Geography Department of University of Lagos, Lagos State, Nigeria.
Adebayo Olatunbosun Sojobi is a Lecturer in the Department of Civil Engineering of Landmark University, Kwara State, Nigeria.
Bosede Oyegbemijo Oyedepo was an MSc Student in the Department of
Geography of University of Lagos.
Our area of research focus revolves around pragmatic solutions to environmental issues such as climate change and their impacts on water resources, environmental and resources management challenges. Rainwater harvesting as supplementary water source is one of the means to reduce the vulnerability of the populace in rural and peri-urban areas to water stress.
Dow
nloa
ded
by [
97.1
23.1
92.8
8] a
t 04:
55 1
6 Ja
nuar
y 20
16

4
PUBLIC INTEREST STATEMENT
This research has revealed the variability in rainfall with periodicity of 5-6 years in Odeda Local Government Area of Ogun State, Southwest of Nigeria. It also demonstrated the potential of harvested rainwater in meeting domestic water demands for potable and non-potable applications as well as the corresponding storage water requirements. Primary water treatment is imperative when the harvested rainwater is used for potable purposes. In order to harness this valuable resource, non-weathering roofing materials are recommended for future construction of residential buildings in rural and peri-urban areas with limited water infrastructural facilities and high rainfall.
1. Introduction
Sustainable access to water for potable and non-potable uses continues to pose a huge challenge in developing countries. Sub-Saharan Africa (SSA) alone accounts for 40% of the global population without access to safe drinking water (Sojobi, Owamah & Dahunsi, 2014). In Africa, it was estimated that 75-250 million people would be exposed to increased water stress by 2020 (Kalungu et al, 2014). This worrisome situation is further aggravated by poor water governance, extreme social inequality, population growth and climate change in Africa.
Rainwater harvesting (RWH) has been proposed as one of the options to improve water supply especially in rural and peri-urban areas of low-income countries (Opare, 2012; Cruddas et al, 2013), areas without reticulated water supply (Ndiritu, Odiyo, Makungo, Ntuli & Mwaka, 2011), water-scarce, remote and marginalized areas (Nijhof, Jantowski, Meerman & Schoemaker, 2010), areas where existing water supply is inadequate (Aladenola and Adeboye, 2010), areas with abundant annual rainfall (Ghisi & Schondermark, 2013), highly contaminated and saline coastal areas (Samaddar, Murase & Okada, 2014) as well as arid and semi-arid regions (Branco, Suassuna, Vainsencher, 2005; Abdulla & Al-Shareef, 2009).
Literature survey revealed several types of RWH which includes infield RWH (IRWH), in situ RWH, roof-based RWH (RRWH) and land-based storm-water harvesting (Abdulla and Al-Shareef, 2009; Welderufael, Woyessa & Edossa, 2011; Lebel, Fleskens, Forster, Jackson & Lorenz, 2015; Clark, Gonzalez, Dillon, Charles, Cresswell & Naumann, 2015)
Factors militating against the adoption and scaling of domestic rainwater harvesting (DRWH) include use of poor roofing materials and high cost of storage tank (Opare, 2012; Cruddas, Carter, Parker, Rowe & Webster, 2013), huge capital cost of acquisition, installation and maintenance of DRWH systems (Roebuck, Oltean-Dumbrava & Tait, 2011), limited knowledge of the potentials of RWH (Kohlitz & Smith, 2015), lack of finance, legislation and co-ordination (Mwenge Kahindra and Taigbenu, 2011), space requirements (Traboulsi H. & Traboulsi M., 2015) and poor quality of DRW (Oke & Oyebola, 2015).
In addition, lack of skills (Kalungu et al, 2014), lack of social capital (Esterhuyse, 2012), risk of water-borne diseases (Mwenge Kahinda et al, 2007; O’ Hogain et al, 2011; Roebuck et al, 2011; Dobrowsky et al, 2014a) and contaminants (Lee, Yang, Han & Choi, 2010; Mendez,
Dow
nloa
ded
by [
97.1
23.1
92.8
8] a
t 04:
55 1
6 Ja
nuar
y 20
16

5
Klenzendorf, Afshar, Simmons, Barrett, Kinney & Kirisits, 2011; Stump, Zimmermann, Schutz, Urban & Hartung, 2012; Zhang, Wang, Hou, Wan, Li, Ren & Ouyang, 2014) are concerns that need to be addressed to facilitate uptake of DRWH.
The quantity of rainwater harvested depends on monthly precipitation, roof catchment area and roof runoff coefficient (Woltersdorf, Liehr & Doll, 2015) while the quality of rainwater harvested depends on roof type, level of atmospheric pollution, geographical location, container size, catchment characteristics, land use practices, and local climate.
Several studies have been done on different issues pertaining to rainwater harvesting. For example, with respect to storage, Woltersdorf et al (2015) recommended tank size of 30 m3 for a roof size of 100 m2 while Ndiritu et al (2011) recommended a storage tank size of 40 m3 for a roof size area range between 75-150 m2. Imteaz, Adeboye, Rayburg, & Shanableh (2012) recommended a tank size of 7000 litres to achieve 100% reliability for toilet flushing and laundry.
Likewise, Biswas and Mandal (2014) observed that a 4,000 L concrete tank installed with a roof area of 40 m2 was adequate to take care of water demands of four-member household for five-month dry period while Mwenge Kahinda, Taigbenu & Boroto (2010) recommended an optimum tank size of 0.5 m3 which achieved water savings of 10-40%.
In order to achieve a good water-saving efficiency and limit financial losses, Roebuck, Oltean-Dumbrava & Tait (2012) recommended storage tank size limit of 1.2-1.5 m3. Moreover, Imteaz et al. (2013) recommended design of rainwater tank size to achieve rainwater accumulation potential (RAP) of 0.8-0.9 and as well opined that 100% reliability is unachievable even with 10,000 litre tank with 300 m2 roof area (Imteaz, Matos & Shanableh, 2014).
Besides, Boelee, Yohannes, Poda, McCartney, Cecci, Kibret & Laamrani (2013) recommended careful participatory planning, design and management of DRWH storage to minimize associated health risks while Bocanegra-Martinez, Ponce-Ortega, Napoles-Rivera, Serna-Gonzalez, Castro-Montoya & El-Hawagi (2014) presented multi-objective optimization approach to DRWH. Further, Fernandes, Terencio & Racheco (2015) proposed a threshold of 0.8 (Annual water demand/Annual harvestable rainwater) to distinguish low-to-high demand RWH applications and recommended low-storage capacity for low-demand applications.
Recent researches have also shown that the quality of DRWH can be improved by point-of-use treatment, integration of water safety plans, quarterly testing and utilization of weather-resistant materials such as ceramic tiles, public education and regular maintenance (Fry, Cowden, Watkins, Clasen & Mihelcic, 2010; Kwaadsteniet, Dobrowsky, Deventer, Khan & Cloete, 2013; Kohlitz and Smith, 2015; Thomas, Kirisits, Lye & Kinney, 2014; Zhang et al, 2014; Gwenzi, Dunjana, Pisa, Tauro & Nyamadza, 2015).
Dow
nloa
ded
by [
97.1
23.1
92.8
8] a
t 04:
55 1
6 Ja
nuar
y 20
16

6
In addition, Efe (2006) suggested primary treatment to take care of pH, TSS, Fe and colour and preference for aluminium roofing sheets compared to other materials such as corrugated, thatch, asbestos and open surface while Helmreich and Horn (2009) recommended the use of local materials, skills and equipment to reduce cost.
Furthermore, the benefits of domestic RWH have been found to include achievement of 30-87.6% water savings [Bocanegra-Martinez et al, 2014; Souza and Ghisi, 2012; Amado and Barroso, 2013], mitigation of storm runoff and conservation of potable water (Campisano, Gnecco, Modica & Palla, 2013), six-fold improvement in crop yield when RWH irrigation was combined with fertilizer applications (Biazin, Sterk, Temesgen, Abdulkedir & Stroosnijder, 2012), financial savings and cost-effective improvement of urban drainage systems (Słyś and Stec, 2014), aquifer recharge (Clark et al, 2015) and reduction of drinking water risks in highly contaminated and saline coastal areas (Samaddar et al, 2014).
Campisano et al (2013) found that frequent precipitation increases the performance of DRWH and that the water saving efficiency depends on storage tank size, demand fraction, storage fraction and climate. Also, Chao-Hsien and Yu-Chuan (2014a) observed that DRWH potential depends on climatic, building characteristics, economic and ecological factors and that with respect to climatic factors, quantity of precipitation is the most crucial factor.
In addition, Chao-Hsien and Yu-Chuan (2014b) found that effective roof area and storage capacity for DRWH varies from one climatic region to another and that failure to account for rainfall variability leads to underestimation of storage capacities. Likewise, Nnaji and Mama (2014) observed that RWH potential is a function of rainfall coefficient of variation (COV), level of water consumption and roof area per capita. The authors recommended integration of rainwater systems in bungalow residential buildings in rainforest regions of Nigeria with COV range of 0.85-1.01, where DRWH has the potential to meet 100% of domestic water demand.
Also, Bocanegra-Martinez et al (2014) demonstrated the variability in the amount of harvested rainwater with highest value recorded in September, followed by October and August and recommended year-round storage. Distribution of rainfall on monthly, seasonal and annual scales is important for planning DRWH, agriculture as well as general water applications. Understanding of seasonality pattern of rainfall is very useful for planning DRWH storage. Guhathakurta and Saji (2013) utilized seasonality index in identifying rainfall regimes while Akinsanola and Ogunjobi (2014) classified annual rainfall based on standardized annual precipitation index (Mckee, Doesken & Kleist, 1993).
Numerous studies have been done on rainwater harvesting, climate variability and rainfall pattern in Nigeria. These research efforts have focused on change detection in rainfall pattern (Ogungbenro and Morakinyo, 2014; Abaje, Ndabula & Garba, 2014), rainfall seasonality in Niger Delta on monthly and annual scales (Adejuwon, 2012), annual rainfall and temperature variability (Akinsanola and Ogunjobi, 2014), annual and monthly rainfall patterns in Ekiti State (Akinyemi, Ayeni, Faweya & Ibraheem, 2013), inter- and intra-annual rainfall variability and distribution pattern over North-West Nigeria (Ekpoh and Nsa, 2011).
Dow
nloa
ded
by [
97.1
23.1
92.8
8] a
t 04:
55 1
6 Ja
nuar
y 20
16

7
Furthermore, other research efforts have investigated quality of RWH in Delta State (Efe, 2006), quality of rainwater from different roof materials in Oyo State (Olaoye and Olaniyan, 2012), monthly rainfall trends in Nasarawa State (Ekwe, Joshua, Igwe & Osinowo, 2014), monthly rainfall distribution in Benin-Owena River Basin (Ikhile and Aifesehi, 2011), socio-demographic aspects of RWH practices in Ibadan (Lade and Oloke, 2015), DRWH practices in Enugu, uses and advantages (Ajayi and Ugwu, 2008), spatio-temporal variation and prediction of monthly rainfall over North-East Nigeria (Bibi, Kaduk & Balzter, 2014).
In addition, other researches have focused mainly on DRWH potential (Lekwot, Samuel, Ifeanyi, & Olisaemeka, 2012; Nnaji and Mama, 2014), required storage capacity for DRWH (Otti and Ezenwaji, 2013), DRWH technology (Shittu et al, 2015), monthly variability in harvestable rainwater and maximum storage requirement (Ubuoh, Ege, Ogbuji & Onifade, 2012). Oke and Oyebola (2014) advocated mobilization and motivation of house owners.
Our literature survey revealed that factors affecting rainfall variability in Southwest Nigeria can be classified as tropical and extra-tropical factors. The tropical factors include inter-tropical Discontinuity, tropical easterly jet, sea surface temperature and biogeophysical feedback mechanism while the extratropical factor include El Nino Southern Oscillation (Olaniran, 2015).
Omogbai (2010a) demonstrated that sea surface temperature of the tropical Atlantic Ocean and land-sea thermal contrast between sea surface temperature and rainfall stations are responsible for 87% of rainfall variability in Southwest Nigeria while surface location of Inter-tropical discontinuity and land surface temperature of rainfall stations are responsible for 7% and 6% of rainfall variability in Southwest Nigeria. The author also attributed the sea-surface temperature to the combined action of the cold Benguella undercurrent and Ekman transport.
Giannini, Saravanan & Chang (2003) also reported that land-atmosphere interactions amplify SST-driven signal which is responsible for interannual and interdecadal variability of rainfall while Nicholson & Grist (2001) reported deep, well developed equatorial westerlies, Africa easterly jet (AEJ) and Tropical easterly jet (TEJ) to influence rainfall variability in West Africa.
In another study, Akinsanola and Ogunjobi (2014) attributed rainfall variability to local factors such as orography, boundary layer forcing and moisture build up. Study of rainfall variability is very important because it has been found to affect rural water supply and food production in the Southwest of Nigeria (Adetayo, 2015; Ganiyu et al, 2013).
Most of the rural and peri-urban areas of Ogun State experience acute water shortage as a result of the poor water supply coverage of Ogun State Water Corporation (OSWC), the agency of government saddled with the responsibility of providing public water supply within the State. This situation is further aggravated by the poor funding of OSWC which limits expansion of water infrastructure and services, regular power outage prevalent within the
Dow
nloa
ded
by [
97.1
23.1
92.8
8] a
t 04:
55 1
6 Ja
nuar
y 20
16

8
State as well as the rapid population increase in the rural and peri-urban areas within the State (Ufoegbune, Oyedepo, Aomeso and Eniola, 2010).
Within the State, < 12.5% of the populace have access to weekly regular public water supply (Odjegba et al, 2015) while Agbelemoje and Odubanjo (2001) reported that 3% of residents within the State have access to clean and safe piped water. As a result of this ugly scenario, residents resort to other alternative sources such as private piped borehole, shallow hand-dugwells, rain, rivers/streams and water vendors (Coster & Otufale, 2014; FRN, 2000, Gbadegesin and Olorunfemi, 2007).
Sadly, our literature review revealed that most of these alternative sources are unwholesome for drinking and are contaminated by pathogens which have led to water-borne diseases such as typhoid, cholera, dysentery, hepatitis (Dahunsi, Owamah, Ayandiran and Oranusi, 2014; Otufale and Coster, 2012). Furthermore, these water sources have been found to be polluted by heavy metals such as uranium, lead (Pb), Nickel (Ni), Chromium (Cr), Cadmium (Cd), Zinc (Zn) and arsenic (Dahunsi et al, 2014; Amori, Oduntan, Okeyode and Ojo, 2013).
Majority of the residents in Odeda are middle-low income earners who rely on shallow groundwater supply of poor quality (Dahunsi et al, 2014). Consumption of the boreholes and wells in Odeda exposes the residents to chemical toxicity as a result of the contamination of the groundwater by uranium (Amakom and Jibiri, 2010) which is above the safe limit recommended by WHO (2003).
Uranium chemical toxicity has been known to cause kidney and genetic mutations, developmental malfunctions and cancer in severe cases. Bacteriological assessment of the groundwater also revealed contamination by Coliform and E. coli (Shittu, Akpan, Popoola, Oyedepo and Oluderu, 2010). The drudgery from fetching water have been found to affect the women’s health who spend an average of 1 hour daily covering about 1 km to fetch water (Otufale and Coster, 2012, Coster and Otufale, 2014).
Rainwater harvesting has been successfully deployed in Eastern part of Nigeria such as Edo State with appreciable success and is practiced by > 80% of the households (Tobin, Ediagbonya, Ehidiamen, Asogun, 2013) while between 3-6.6% in the South Western part of Nigeria (Lade and Oloke, 2015; Gbadegesin and Olorunfemi, 2007). Also, residents in Odeda rely on RWH during the wet season because of the poor quality of the shallow wells attributed to the poor sewage and sewerage and open defecation prevalent in the area (Shittu et al, 2010).
This study is, therefore, embarked upon with a view to encourage the adoption and utilization of rainwater harvesting to reduce the vulnerability of the rural and peri-urban populace to the prevalent poor water supply and also mitigate health risks associated with other water sources. Indeed, rainwater harvesting has been recommended for use to supplement other water sources and as a buffer during emergencies (Aladenola and Adeboye, 2010).
Dow
nloa
ded
by [
97.1
23.1
92.8
8] a
t 04:
55 1
6 Ja
nuar
y 20
16

9
Further, since rainwater harvesting and infrastructure is affected by rainfall variability (FAO, Worm and Hattum, 2006; Aladenola and Adeboye, 2010, Adegoke & Sojobi, 2015), the effects of rainfall variability on the rainwater harvesting potential and appropriate storage requirements were also investigated to address the inadequate water storage and RWH facilities that is rampant in the rural and peri-urban areas (Aper & Agbehi, 2010). Also, trends in the monthly, seasonal and annual rainfall were studied to ascertain if it is increasing or not.
The significance of this research is that it has incorporated rainfall variability in the calculation of rainwater harvesting potential and in the calculation of storage water requirements. In addition, as a supplementary source of water, it demonstrated the percentage of domestic water demands that can be met by rainwater harvesting for potable and non-potable purposes. Furthermore, results from this study will sensitize, encourage and guide engineers/architects in planning for DRWH in the design and construction of residential buildings.
2 Materials and Methods
2.1 Study Area
Odeda doubles as a town and headquarters of Odeda Local Government Area (LGA) in Ogun State, located in Southwestern Nigeria as shown in Figure I. It lies between longitudes 30 26’ 76’’ and 30 47’ 28’’ and latitudes 70 29’ 88’’ and 70 050 54’’. Being one of the largest LGA in Abeokuta which is the State capital, it has a population of 109, 449 based on 2006 population census. The town enjoys tropical climate with uni-modal peak rainfall between June and November, average annual and monthly rainfall of 1, 220 mm and 102 mm respectively as well as monthly maximum and minimum temperature ranges of 29-36 0C and 22-35 0C respectively (Kilanko-Oluwasanya, 2009). Southwesterly wind prevails during rainy season beginning from March to November while northwesterly wind dominates during the dry season beginning from December till March. Geologically, the town is overlaid by crystalline basement which is basically granitic rocks and is being mined commercially for construction purposes.
Dow
nloa
ded
by [
97.1
23.1
92.8
8] a
t 04:
55 1
6 Ja
nuar
y 20
16

10
Figure I. Map depicting location of Odeda LGA in South-West Nigeria
Public water supply in the town is erratic, highly unreliable and is limited to once per week while in some areas such as the GRAs, borehole is not allowed (Kilanko-Oluwasanya, 2009). Owing to the inadequate public water availability, residents rely mainly on self-supply systems such as boreholes and hand-dug wells which are often contaminated (Kilanko-Oluwasanya, 2009; Amori, Oduntan, Okeyode & Ojo, 2013) and limited in depth (Martins, Ajayi & Idowu, 2000).
2.2 Seasonal classification of climate
Our literature review showed similarity as well as disparity in seasonal climate classification used globally. Four (4) classifications were observed in literature. In addition, four seasons identified in literature namely were spring (pre-monsoon), summer (monsoon), autumn (post-monsoon) and winter (winter) as shown in Table 1. Classification (1) was adopted for Europe and Asia by Shaw, Beven, Chappell & Lamb (2010); Hu, Pan F., Pan X., Zhang, Li, Pan Z & Wey (2015), Perry (2006), Vanem and Walker (2013) while classification (2) was adopted for India by Mahajan and Dodamani (2015) and classification (3) was utilized by Sayemuzzan and Jha (2014) for USA.
Table 1. Different Global Seasonal classifications of climate from literature
Class (1) (2) (3) (4)
Seasons Months Seasons Months Seasons Months Seasons Months
Spring Mar, Apr, May Pre-monsoon MAM Spring Apr, May, Jun Spring Feb, Mar, Apr
Summer Jun, July, Aug Monsoon JJAS Summer Jul, Aug, Sep Summer May, Jun, Jul
Autumn Sep, Oct, Dec Post-monsoon Oct,Nov, Dec Fall Oct, Nov, Dec Autumn Aug, Sep, Oct
Winter Dec, Jan, Feb Winter Jan, Feb Winter Jan, Feb, Mar Winter Nov, Dec, Jan
Dow
nloa
ded
by [
97.1
23.1
92.8
8] a
t 04:
55 1
6 Ja
nuar
y 20
16

11
Climate classification (4) was utilized for our study area to depict the seasonal rainfall variability in Nigeria. The four seasons are: Spring which coincides with March Equinox comprising February, March and April (FAM), Summer which coincides with June Solstice consisting of May, June, July (MJJ), Autumn which streamlines with September Equinox [August, September, October (ASO)] and lastly, Winter which is described as December Solstice [November, December, January (NDJ)].
2.3 Data collection, methods and analysis
The rainfall and temperature data spanning 18 years from 1995-2012 was obtained from Ogun State Water Corporation which has the only weather-monitoring station in the State. Eighteen years was used owing to scarcity of available data which is prevalent in the State and in Southwest Nigeria.
Seasonality Index as described by Guhathakurta and Raji (2013) was computed as follows:
= ∑ − (1)
where = mean rainfall of month n; =mean annual rainfall
SPI as described by Akinsanola and Ogunjobi (2014) and Adegoke and Sojobi (2015) were computed as follows:
SPI = (2)
where = rainfall in each particular month, season or year depending on the time scale being used; = mean rainfall in each particular month, season or year depending on the time scale being used; = standard deviation of rainfall in each particular month, season or year depending on the time scale being used. The SI classification is shown in Table 2.
Table 2. Seasonality Index (SI) (Kanellopoulou, 2002) and Annual Standardized Precipitation Index (SPI) (Mckee et al, 1993)
Seasonality Index Standardized Annual Precipitation Index
Rainfall regime SI Classification SPI
Very equable ≤ 0.19 Near normal -0.99 to 0.99
Equable but with a definite wetter season 0.2-0.39 Moderately wet years 1.0 to 1.49
Rather seasonal with a shorter drier season 0.40-0.59 Moderately dry years -1.0 to -1.49
Seasonal 0.60-0.79 Very wet 1.5-1.99
Markedly seasonal with a long drier season 0.80-0.99 Severely dry years -1.5 to -1.99
Most rain in 3 months or less 1.00-1.19 Wet extreme ≥ +2.0
Extreme, almost all rain in 1-2 months ≥ 1.20 Dry extreme ≤ -2.0
Dow
nloa
ded
by [
97.1
23.1
92.8
8] a
t 04:
55 1
6 Ja
nuar
y 20
16

12
The rainfall data was also subjected to time series analyses on monthly and seasonal scales using statistical tests which include Mann Kendal test, linear regression, SPI and Hoeffding’s D statistics. Furthermore, the potential of rainwater to meet domestic water demands and storage requirements were also evaluated.
2.4 Trend Analyses of monthly and seasonal rainfall using Mann Kendall, Linear regression, SPI and Hoeffding’s Statistics
Mann Kendall (M-K) was used to analyse rainfall trend in the study period. For M-K rank statistics, S was computed by replacing the observations ’s by their ranks ’s such that each term was assigned a number ranging from 1 to n which reflects its magnitude relative to the magnitudes of all ther terms. For each element , the number Ni was calculated as the number of terms preceding it such that > . The parameter , as given by
Gebremichael et al (2014) was calculated as follows:
= ∑( ) − 1 (3)
± ( ) (4)
where n = number of years; = desired probability point of the normal distribution
appropriate to a two-tailed test; M-K’s significance test statistics. If lies within the range of ± , then the time series does not contain a significant trend (Kendall, 1975).
Owing to the limitations of Mann Kendall test in analysing non-monotonic trend, Hoeffding’s D statistic was also used to analyze the rainfall values for residual rainfall. The residual rainfallw as obtained by subtracting the predicted rainfall data obtained by from the linear regression equations from the observed values. The probability values for Hoeffding’s D statistic was computed using the equation provided by Blum, Kiefer and Rosenblatt (1961) as follows: ( )
+ (5)
Where n = number of years of data, D = Hoeffding’s D statistic
Hoeffding’s D statistic was also used because it is typically used to detect non-linear and non-monotonic associations na dhas been found to outperform other statistical methods (Fujita, Sato, Demasi, Sogaya, Ferreira & Miyano, 2009).
Hoeffding’s D statistic was obtained utilizing the formul provided by Santos, Takahashi, Naka & Fujita (2013) as follows:
D = ( )( ) ( ) ( )( )( )( ) (6)
Where = ( − 1)( − 2); = ( − 1)( − 2)( − 1)( − 2); (7)
Dow
nloa
ded
by [
97.1
23.1
92.8
8] a
t 04:
55 1
6 Ja
nuar
y 20
16

13
= ( − 2)( − 2)( − 1) (8)
Where = rank of ; = rank of ; known as bivariate rank = 1 + number of points with both x and y values < the ith point.
The null hypothesis of monotonic trend is rejected if P > where
= ( )( )( )( ) (9)
where = leve of significance.
Hoeffding’s measure varies from - ( , 2013), which is equivalent to -
0.0167 to 0.033. The acceptable range of was obtained by inserting the upper and lower limits of given above. The acceptable range of was found to be 1.32% to 3.87%. For our selected level of significance for our study was 2% which is within the acceptable range.
Futhermore, the annual rainfall was evaluated using Student’s t test. The formula used was given by Bluman (2013) as follows:
t = /√ (10)
where t = test value, = mean of observed values, = claimed mean, S = standard deviation of data, n = number of years of data. The degrees of freedom (df) of the data = n-1 = 17. The null hypothesis of normal distribution is rejected when t value or p-value of t is > the critical values. The significance level used was 2%.
2.5 Rainwater harvesting potential and storage requirements
Rainwater harvesting potential for our study was calculated using the monthly balance approach. The monthly harvestable rainwater (Qm) was calculated as a function of the product of mean monthly rainfall ( ), roof area (A), percentage of roof area utilized for rainwater harvesting (β) and roof runoff coefficient (C) as given in equation 5.
= x A x β x C (11)
From literatures, roof area varied from 25 m2 – 200 m2 (Islam K., Islam M., Lacoursiere & Dessborn, 2014; Biswas and Mandal, 2014; Otti and Ezenwaji, 2013; Ubuoh et al, 2012; Ndiritu et al, 2011, Woltersdof et al, 2015). Roof size area of 100 m2 was adopted for this study as recommended by Woltersdof et al (2015) and Sturm, Zimmermann, Schutz, Urban & Hartung (2009) and utilized by Otti and Ezenwaji (2013) while the β value of 0.35 suggested by Shittu, Okareh & Coker (2015) was utilized. This is low because of cost prohibition and poor planning of DRWH systems typical in Nigeria.
Furthermore, roof runoff coefficient (C) varies between 0.75-0.95 from literatures (Woltersdof et al, 2015; Roebuck, 2007; Tomaz, 2005; Fernandez et al, 2015). C value of 0.8
Dow
nloa
ded
by [
97.1
23.1
92.8
8] a
t 04:
55 1
6 Ja
nuar
y 20
16

14
was adopted for this study as utilized by Otti and Ezenwaji (2013), Shittu et al (2015) and accounts for leakage, spillage, infiltration, roof surface wetting and evaporation (Lee et al, 2000) and is within the range of 70-85% of harvestable rainfall suggested by Helmreich and Horn (2009).
Since mean monthly rainfall was utilized, it is imperative to consider the upper and lower confidence limit scenarios beside the mean case scenario owing to rainfall variability and also because mean can hide rainfall variability which occurs in real-life scenarios. Two approaches were utilized in computing the confidence limits namely confidence interval about the mean monthly rainfall as well as confidence interval using Coefficient of Variation (COV) of monthly rainfall. For the first approach, the confidence intervals for mean based on maximum error of estimate (MEE) as described by Johnson and Kuby (2012) as well as Bluman (2013) was utilized and was described as:
+ Z ( /2) √ = Upper Confidence Limit (LCL) (12)
- Z ( /2) √ = Lower Confidence Limit (LCL) (13)
where = Mean = ; Z ( /2) = Confidence coefficient; √ = Standard error of mean and
Z ( /2) √ = Maximum error of estimate (MEE), = Standard deviation of monthly
rainfall for each month, n = sample size = 18. The confidence interval adopted in our study was 0.99 which gave a confidence coefficient of 2.58 as shown in Table VIII.
Therefore, harvestable rainwater equations for the scenarios of upper confidence limit (UCL) of monthly mean rainfall and lower confidence limit (LCL) of monthly mean rainfall were obtained as:
= + x A x β x C (14)
= − x A x β x C (15)
For the second approach, harvestable rainwater equations for the upper confidence limit (UCL) of monthly mean rainfall and lower confidence limit (LCL) of monthly mean rainfall were obtained as:
= x A x β x C [1 + COV] (16)
= x A x β x C [1 - COV] (17)
and the results were shown in Table X.
3. Results and discussion
3.1 Seasonal analyses of rainfall, Seasonality Index and Annual Standardized Precipitation Index
Dow
nloa
ded
by [
97.1
23.1
92.8
8] a
t 04:
55 1
6 Ja
nuar
y 20
16

The basic seasonal rainfall and temby the climograph displayed in Fig
Figure 2. Climograph of seasonal r
Based on mean seasonal values, Auand the least contribution was by SSummer and Winter were 26.35% of 406.86 mm occurred in Autumnoccurred in Spring. Also, it was alsrainfall for throughout the period orecorded the highest seasonal rainf
The season with the lowest coefficSummer had the highest COV as shvariability index (which is COV exSpring were highly variable with inmoderately variable with index bet
Furthermore, maximum and minimacross all seasons with Autumn alstemperature.
The seasonal variation of rainfall fohighest seasonal rainfall with the ehighest rainfall. Winter recorded thBased on coefficient of slope of linrainfall, Summer recorded the high(5.4363), spring (4.5004) and the le
Table 3. Descriptive characteristics of sea
Parameters Spring Summer
Mean 141.41 214.68
15
mperature characteristics of the study area had bgure II as well as Table III.
rainfall in Odeda LGA in Ogun State, Southwe
utumn had the highest contribution of rainfall (Spring (17.35%) as shown in Table 3. Contribuand 19.81% respectively. The maximum seaso
n while the minimum seasonal rainfall of 61.15 so observed that Autumn recorded the highest sof study with the exception of year 2000 where fall.
ient of variation (COV) of 0.24 was Autumn whown in Table 3. Based on Hare’s (1983) rainfxpressed in percentage terms), rainfall in Summndex > 30%, while rainfalls in Winter and Aututween 20-30%.
mum temperature values were found to be fairlyso recording the highest maximum and highest
for Odeda is described in Figure 3. Autumn recoexception of year 2000 in which summer recordhe least amount of rainfall for most of the studynear regression equation of the line graph of seahest increasing trend of 6.6965, followed by wieast by Autumn with (1.5942).
asonal rainfall in Odeda LGA, Ogun State
r Autumn Winter
297.44 162.54
been shown
est, Nigeria
(36.49%) tions by
onal rainfall mm
seasonal Summer
while fall mer and umn were
y stable minimum
orded the ded the y period. asonal nter
Dow
nloa
ded
by [
97.1
23.1
92.8
8] a
t 04:
55 1
6 Ja
nuar
y 20
16

Maximum 206.68 353.76
Minimum 61.15 71.94
SD 45.56 82.67
COV (%) 32 39
Csx -0.08 -0.19
Figure 3. Line graph of seasonal variation
Seasonality index (SI) also revealeobtained for the area for the periodbut with a definite wetter season. Tscale and the result presented in Fi
Figure 4. SPI for Annual rainfall from 19
It was observed that dry years tookexperienced between 2006 and 201Similar to what was obtained in Figand 2005 while extremely wet yeardisplayed in Table 4.
Declining trend in rainfall after 200was attributed to low water vapourWu & Liu, 2011). The abrupt chancirculation patterns (Zhang and Liu
16
406.86 277.08
163.85 108.43
71.24 48.2
24 30
-0.11 1.17
n of rainfall in Odeda LGA, Ogun State, Nigeria
ed trend in rainfall pattern. Based on SI value ofd of study, the rainfall regime can be described Trend in rainfall was also analysed using SPI ongure 4.
995-2012 for the study area
k place between 2001 and 2005 while wet years11 which corroborated results displayed in Figugure 3, severely dry years were experienced in r was experienced in 2010 based on SPI classif
00 was also reported by Wu, Wang, Cai & Li (r and higher than normal air temperature (Liu, Lnges in rainfall was also attributed to changes inu, 2013)
f 0.27 as equable n an annual
s were ure 3. both 2001
fication
(2013) and Luo, Zhang, n regional
Dow
nloa
ded
by [
97.1
23.1
92.8
8] a
t 04:
55 1
6 Ja
nuar
y 20
16

In summary, the SPI graph in Figurainfall with a slope of 0.0838 and Based on SPI classification in Tabl2000, moderately wet years were e2003, severely dry years in 2001 an
Table 4. Classification of Annual rainfall
Classification Year Near normal 1995, 1996, 1997, 1998Moderately dry 2003 Moderately wet 2009, 2011 Severely dry 2001, 2005 Extremely wet 2010
3.2 Monthly rainfall analyses
Graph of monthly rainfall revealedsingular monthly rainfall peak contOluwasanya (2009) who reported mPrior to year 2000, September recowhile October and August recordedrespectively. Between 2001 and 202003 and 2005 while September anand 2004.
Figure 5. Graph of monthly rainfal
Between 2006-2012, highest monthwhile August recorded the highest September recorded the highest mo
17
re 4 indicated an extremely low increasing trenlikewise corroborated the changes observed usle 2, near normal rainfall took place between 19
experienced in 2009 and 2011, moderately dry ynd 2005 and extremely wet years in 2010.
based on SPI
8, 1999, 2000, 2002, 2004, 2006, 2007, 2008, 2012
d singular peaks as shown in Figure 5. The existradicts the bimodal monthly peaks reported bymonthly rainfall peaks in July and August for Aorded the highest monthly rainfall between 199d the highest monthly rainfall in 1999 and 2000005, October recorded the highest monthly rainnd November recorded the highest monthly rain
ll in Odeda LGA, Southwest Nigeria
hly rainfall occurred in October in 2006, 2009 monthly rainfall in 2008 and 2002, and July an
onthly rainfall in 2007 and 2011 respectively. T
nd in annual sing SI. 995 and years in
tence of a y Kilanko-Abeokuta. 5-1998, 0
nfall in 2001, nfall in 2002
and 2010, nd This
Dow
nloa
ded
by [
97.1
23.1
92.8
8] a
t 04:
55 1
6 Ja
nuar
y 20
16

indicates a progressive shift in maxOctober and/or August in post-200
Table 5 revealed that the months wwith COV of 41% marking the begmonth with the lowest monthly rainimplying that the intense rainfall in
Table 5. Descriptive characteristics of mo
Parameters Jan Feb Mar Apr
Mean (mm) 45.8 41.3 47.4 52.7
Max (mm) 73.5 65.8 73.7 84.8
Min (mm) 17 18.2 17 8.2
SD 15.7 12.7 16.8 19.4
COV (%) 34 31 35 37
Csx 0.38 0.46 -0.15 -0.50
Based on Hare’s rainfall variabilitywith COV (%) > 30% with the excwhich exhibited moderate variabilirainfall during the dry season montmonths.
Also, yearly variation of monthly rNovember to April (Akinyemi et a2.27mm/year with a mean of 1.63mwitnessed increasing rainfall range1.37mm/year.
Figure 6. Line graph of monthly rainfall v
This indicated higher increasing raaddition, comparison of monthly rasteep decline in monthly rainfall oc
18
ximum rainfall from September in pre-2000 per00 period.
with the highest variability of rainfall were Mayginning of intense rainfall during the rainy seasnfall variability took place in August with COVn August has been reasonably consistent.
onthly rainfall in Odeda, Ogun State, Nigeria
May Jun Jul Aug Sep Oct
63.4 69.5 81.8 97.9 101.9 97.7
107.6 121.7 126.8 140 148.8 150
23.9 23 33 66 56.9 41.4
26.1 28.8 29.5 25.4 27.7 28.7
41 41 36 26 27 29
0.12 -0.13 -0.25 -0.26 -0.07 0.04
y index (1993), all the months exhibited high vception of August, September, October and Novity between 20-30%. This indicates higher incrths and slightly increasing rainfall during the ra
rainfall was depicted in Figure 6. The dry seasoal, 2013) had increasing rainfall range of 1.19mmm/year while the wet season months of May te of 0.20mm/year to 2.28mm/year with a mean
variation for the study period
ainfall during the dry season compared to the wainfall for the study period as shown in Figure ccurred between 2000 to 2005 and then a gener
riod to
y and June on while the
V of 26%
Nov Dec
67 48.6
143.1 76.9
40.5 31
26 15.6
29 32
1.58 0.93
ariability vember reasing ainy season
on months of mm/year to
to October of
wet season. In 6 revealed ral trend of
Dow
nloa
ded
by [
97.1
23.1
92.8
8] a
t 04:
55 1
6 Ja
nuar
y 20
16

19
increase after 2005. High amount of rainfall which took place in 2000 was also reported by Perry (2006).
M-K test revealed that all the months experienced significant increasing rainfall trend with the exception of August and September as shown in Table 6. For the linear regression equation, positive slope indicates an increasing trend while negative slope indicates decreasing trend (Tabari, Marofi, Aeini, Talaee & Mohammadi, 2011). Based on the slope of linear regression as depicted in Table 6, the highest increasing trend of 2.36mm/year occurred in May, followed by 2.28mm/year in June and 2.27mm/year in November.
Table 6. Trend results for Mann Kendall, Linear Regression, SPI Tests and Hoeffding’s D Statistics for monthly rainfall
= correlation coefficient
Based on M-K test, insignificant increasing trend took place in August and September, although both have slope values of 0.78mm/year and 0.20mm/year and was also corroborated by their very low SPI values of 0.032 and 0.001 respectively as displayed in Table 6 and Figure 7. The months with the highest SPI values were February with the highest SPI value of 0.109, followed by January and December (0.98) and March (0.96). In summary, significant increasing trends took place in the dry season months of November, December, January, February and March.
M-K test revealed that all the seasons exhibited significant increasing rainfall trend with the exception of autumn which exhibited insignificant increasing rainfall trend as shown in Table 7. This was corroborated by the slope of the linear regression which indicated that summer had the highest increasing trend of 6.7mm/year, followed by winter (5.44mm/year) and spring (4.50mm/year) while autumn recorded the least increasing trend of 1.59mm/year.
Mann Kendall Linear Regression
SPI Hoeffding’s D Statistics
N tm rm Trend Slope Rcorr Slope D P{D}
Jan 18 0.18 ±0.15 Significant increase 1.55 0.34 0.098 0.1159 4.5517 0.0661
Feb 18 0.27 ±0.14 Significant increase 1.19 0.44 0.109 0.0925 3.9058 0.0661
Mar 18 0.31 ±0.13 Significant increase 1.57 0.68 0.096 0.0740 3.3952 0.0661
Apr 18 0.31 ±0.13 Significant increase 1.74 0.32 0.092 0.0765 3.4642 0.0661
May 18 0.36 ±0.12 Significant increase 2.36 0.27 0.093 0.0740 3.3952 0.0661
Jun 18 0.33 ±0.13 Significant increase 2.28 0.25 0.085 0.0742 3.4008 0.0661
Jul 18 0.19 ±0.15 Significant increase 1.95 024 0.068 0.0878 3.7761 0.0661
Aug 18 0.05 ±0.17 Insignificant increase 0.78 0.07 0.032 0.1144 4.5103 0.0661
Sep 18 0.02 ±0.17 Insignificant increase 0.20 -0.07 0.001 0.1247 4.7945 0.0661
Oct 18 0.29 ±0.13 Significant increase 0.62 -0.09 0.022 0.1258 4.8249 0.0661
Nov 18 0.19 ±0.15 Significant increase 2.27 0.15 0.090 0.1001 4.1156 0.0661
Dec 18 0.28 ±0.13 Significant increase 1.48 0.35 0.098 0.0885 3.7954 0.0661
Dow
nloa
ded
by [
97.1
23.1
92.8
8] a
t 04:
55 1
6 Ja
nuar
y 20
16

Figure 7. Comparison of monthly SPI from
Table 7. Trend results for Mann Kendall, rainfall
Mann-Kendall
Seasons N Trend
Spring 18 0.62 ±0.26 Significant increase
Summer 18 0.62 ±0.26 Significant increase
Autumn 18 0.09 ±0.16 Insignificant increase
Winter 18 0.35 ±0.13 Significant increase
Increasing trend in winter rainfall wwesterly flows (Perry, 2006). The iin Table 7 as well as Figure 8 with winter recording the highest SPI va
Further, all the seasons had negativwhich indicated preponderance of mdry seasons. SPI was able to detectand Dodamani (2005) who advocathydrological parameters.
Though MK test for monthly rainfaincrease of 1.59-6.7 mm/season, frsignificant. This was corroborated insignificant seasonal and annual rsimilar to COV range of 26%-40%seasonal rainfall respectively. The declining rainfall to the presence o
20
m 1995-2012
Linear Regression, SPI Tests and Hoeffding’s D Statisti
Linear Regression
SPI Hoeffding’s D Statistics
Slope Slope D P{D}
4.500 0.102 0.0988 4.0797 0
6.70 0.083 0.0356 2.3354 0
1.59 0.023 0.1178 4.604 0
5.44 0.116 0.0741 3.398 0
was attributed to North Atlantic Oscillation whincreasing trend results were also supported by Autumn recording the lowest SPI value of 0.0alue of 0.116 followed by spring with SPI of 0.
ve SPI values from 2000 to 2005 as shown in Fmoderately dry seasons but with few episodes t significant trends in rainfall which corroboratted the use of SPI to detect significant trends in
all showed increase of 0.20-2.36 mm/year and rom water management point of view, the increby Mazvimavi (2010) who reported statisticallainfall for Zimbabwe with a COV range of 23%
% and 24%-39% obtained in our study for monthauthor adduced the general perception of incref rainfall variability. Likewise, Tapsoba, Hache
ics for seasonal
0.0661
0.0661
0.0661
0.0661
hich causes y SPI values 023 and .102.
Figure 10, of severely ed Mahajan n
a seasonal ease is not ly %-40% hly and
easing or e, Perreault
Dow
nloa
ded
by [
97.1
23.1
92.8
8] a
t 04:
55 1
6 Ja
nuar
y 20
16

and Bobee (2004) also reported insin West Africa.
Figure 8. Comparison of Seasonal SPI fro
P {D} values for all the months anwe reject the null hypothesis ofnon-monotonic trend. Therefore, itacross all the months and seasons.
Analysis of annual rainfall by the Sthe critical value of 2.718. TherefoThus, it can be inferred that the ann
3.5 Residual Trend Analysis of sea
Residual analyses of seasonal rainfrainfall in a dry state between 1995seasonal rainfall in a wet state. Likalso between 1995 and 2000 as depduring the period of 2000 to 2005 wwet state while Spring, Summer anleast residual rainfall.
A short reversal of state was experirainfall while a short dry state was an average of five (5) year periodicnon-linearity of the rainfall pattern(2015) who observed oscillating pain Sub-Saharan West Africa.
Also, the annual residual rainfall grapproximately six (6) years which Delta, Nigeria by Ologunorisa and The most profound periodicity for
21
significant changes in rainfall for Togo and Ben
om 1995-2012
d seasons were found to be > value of 0.066f monotonic trend and accept the alternative hyt can be inferred that non-monotonic trend was
Student’s t test indicated that the t- value of 13.ore, we reject the null hypothesis of normal distnual rainfall trend is non-linear.
asonal, annual and monthly rainfall
fall revealed that Autumn recorded the least res5 and 2000 while winter experienced the higheskewise, wet states were experienced in summer picted in Figure 11. A reversal of state was expwhere Autumn recorded the highest residual ra
nd winter experienced dry states with winter rec
ienced in 2007 where winter recorded the highexperienced between 2008 and 2009. This resu
city of oscillation between the wet and dry staten. This result corroborated the findings of Ibrahattern of approximately five (5) year-periodicit
raph displayed in also revealed alternate wet anwas within the periodicity of 3-7 years reporteAdejuwon (2003) with significant clyclical pathe region was five (5) years.
nin located
61, therefore ypothesis of
ehibited
.05 was > tribution.
sidual st residual and spring
perienced ainfall in a cording the
hest residual ult depicts es indicating im et al y for rainfall
nd dry states d for Niger
attern as well.
Dow
nloa
ded
by [
97.1
23.1
92.8
8] a
t 04:
55 1
6 Ja
nuar
y 20
16
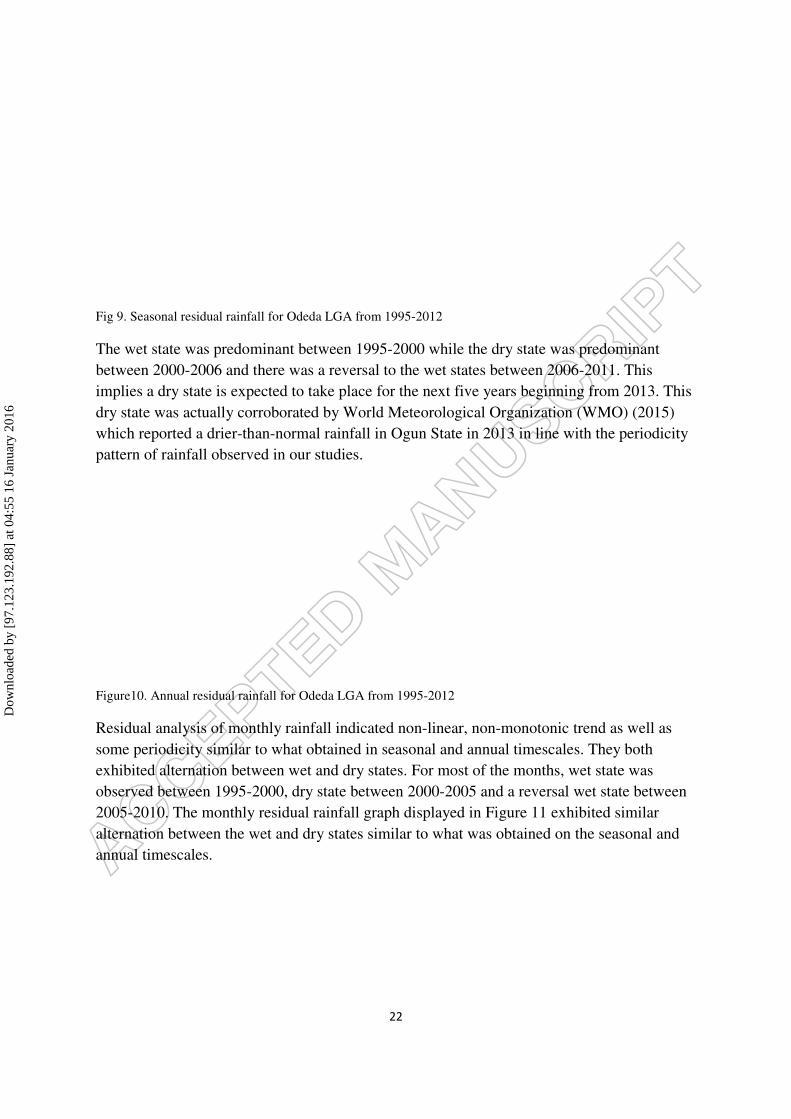
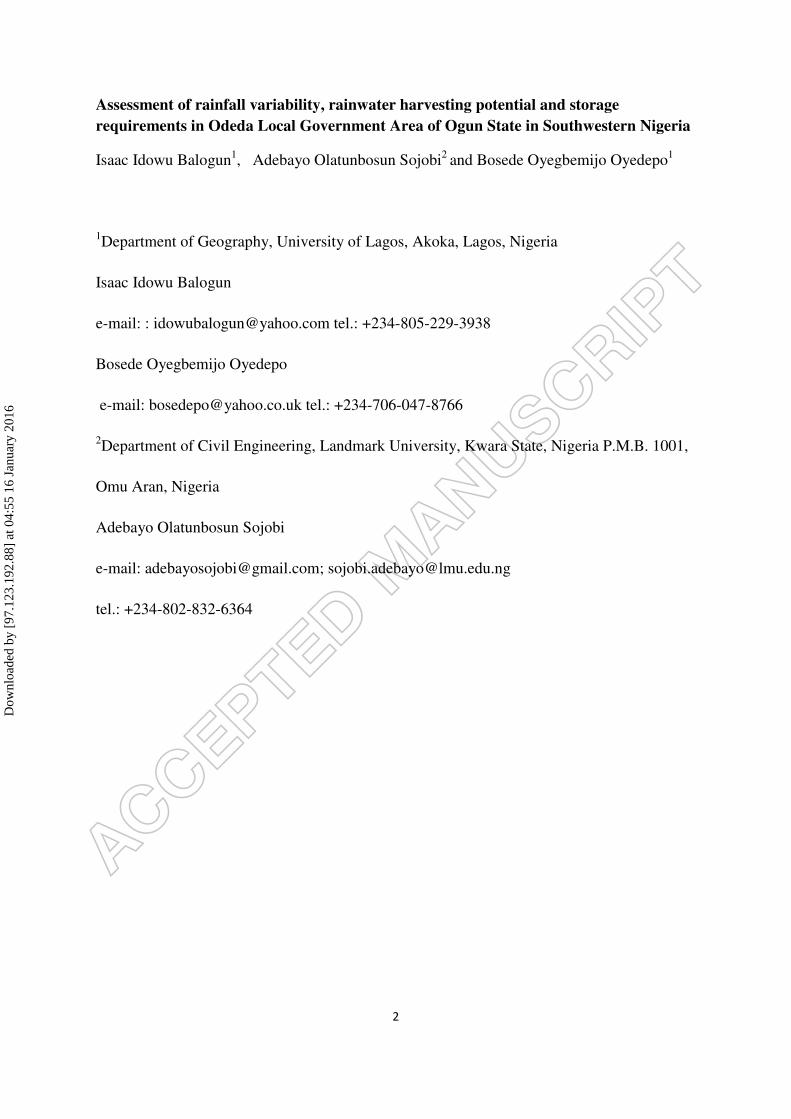
Fig 9. Seasonal residual rainfall for Odeda
The wet state was predominant betbetween 2000-2006 and there was implies a dry state is expected to tadry state was actually corroboratedwhich reported a drier-than-normalpattern of rainfall observed in our s
Figure10. Annual residual rainfall for Ode
Residual analysis of monthly rainfasome periodicity similar to what obexhibited alternation between wet aobserved between 1995-2000, dry 2005-2010. The monthly residual ralternation between the wet and dryannual timescales.
22
a LGA from 1995-2012
tween 1995-2000 while the dry state was predoa reversal to the wet states between 2006-2011
ake place for the next five years beginning fromd by World Meteorological Organization (WMOl rainfall in Ogun State in 2013 in line with thestudies.
eda LGA from 1995-2012
all indicated non-linear, non-monotonic trend abtained in seasonal and annual timescales. Theyand dry states. For most of the months, wet statstate between 2000-2005 and a reversal wet starainfall graph displayed in Figure 11 exhibited y states similar to what was obtained on the sea
ominant 1. This m 2013. This O) (2015) e periodicity
as well as y both te was ate between similar asonal and
Dow
nloa
ded
by [
97.1
23.1
92.8
8] a
t 04:
55 1
6 Ja
nuar
y 20
16

Figure 11. Monthly residual rainfal
Nicholson (2013) identified factorsfound to include African Easterly J(AWJ) and West African Westerlypredominant in the month of May-January-March, AWJ between JulySeptember.
Other factors responsible for rainfain the area of study were attributed(Barbe Lebel, Tapsoba, 2002; Eltahanticyclones over NE China (Hasteinterhemispheric SST differences (evapotranspiration which contribut
Also important are land-surface feeroughness and dust generation (Romay be implied that different forcinand years (Long and Entekhabi, 20being experienced in the area of stu
3.6 Rainwater harvesting potentia
The monthly harvestable rainwaterwere displayed in Table 8. For the September, followed by October (3was in February (1.37 m3). The cor2.85, 2.74, 2.74 m3 and 2.38, 2.31
Comparison of the monthly HRW (COV) and UCL (COV) recorded tcorresponding highest and lowest m
23
ll for Odeda LGA from 1995-2012
s responsible for interannual rainfall variabilityJet (AEJ), Tropical Easterly Jet (TEJ), African y Jet (WAWJ). According to the author, AEJ isJune before the onset of rain, TEJ was very stry-September while WAWJ was infleuntial in M
all variability on monthly, seasonal and annual d to non-linear West African Monsoon (WAM)hir E.A.B. & Gong C., 1996), Indian Ocean SSenrath and Wolter, 1992; Quan, Diaz and Fu, 2(Semazzi et al, 1996), local surface hydrology ste 27% of rainfall in West Africa (Gong and El
edback mechanisms such as soil moisture, loweowell et al, 1995). From the residual rainfall anang mechanisms operate during different month
000) and may be responsible for the rainfall varudy.
al and storage requirements
r (MHRW) for the three scenarios of UCL, MeaUCL scenario, maximum MHRW of 3.32 m3 o
3.22 m3) and August (3.17 m3) while the minimrresponding values for the mean and LCL scenand 2.25 m3 respectively.
for the different scenarios in Figure 9 revealed the highest values and lowest values respectivemonthly HRW were 3.62 m3 and 0.80 m3 respe
y and was Westerly Jet
s ong in
May-
timescales and relief
ST and 2003), global such as local ltahir, 1996).
ered surface alyses, it hs, seasons riability
an and LCL occurred in
mum MHRW narios were
that UCL ely. The ectively.
Dow
nloa
ded
by [
97.1
23.1
92.8
8] a
t 04:
55 1
6 Ja
nuar
y 20
16

24
Therefore, the recommended maximum storage capacity that should be provided for DRWH is 4 m3 while the minimum storage capacity should be approximately 1 m3
Table 8. Monthly harvestable rainwater (MHRW) based on Maximum Error Estimate of
Limits Jan Feb Mar Apr May Jun Jul Aug Sep Oct Nov Dec QUCL (m
3) 1.55 1.37 1.61 1.81 2.22 2.44 2.79 3.17 3.32 3.22 2.32 1.63 QMEAN (m
3) 1.28 1.16 1.33 1.48 1.78 1.95 2.29 2.74 2.85 2.74 1.88 1.36 QLCL (m3) 1.01 0.94 1.04 1.14 1.33 1.46 1.78 2.31 2.38 2.25 1.43 1.09
Table 9. Monthly harvestable rainwater (HRW) based on Coefficient of Variation Limits
Limits Jan Feb Mar Apr May Jun Jul Aug Sep Oct Nov Dec QUCL (m
3) 1.72 1.51 1.79 2.02 2.50 2.74 3.11 3.45 3.62 3.53 2.61 1.80 QLCL (m3) 0.85 0.80 0.86 0.93 1.05 1.15 1.47 2.03 2.08 1.94 1.14 0.93
In order to estimate monthly water demand per household, there is need to calculate per capita daily water demand. The water demand is separated into two namely: potable water demand (PWD) and non-potable water demand (NPWD). PWD covers drinking and cooking applications while NPWD covers bathing, toilet flushing and dishwashing. Sojobi et al (2015) recommended 7.5 lpcd for both drinking and cooking which covered 4.5 lpcd and 3 lpcd recommended by WHO (2004) and WHO (2005) for drinking and cooking respectively.
A total of 20 lpcd was recommended for non-potable water uses such as bathing, toilet flushing and dishwashing as shown in Table 10 excluding laundry which is usually done on weekly basis in typical Nigerian settings. Total estimated weekly per capita NPWD was 150 litres. For a thirty-day month, the estimated NPWD was 150 x 4 plus additional 40 litres (for two remaining days), which gives 640 litres.
Table 10. Water demand for various applications
Applications Water Demand (lpcd) Sources Bathing 6 WHO (2005) Toilet flushing 10 WHO (2005) Dishwashing 4 Author1 Laundry (weekly) 10 WHO (2005) Drinking and cooking 7.5 Sojobi et al (2015) 1Gurung and Sharma (2014) recommended a value of 2.5 lpcd which was considered low for a typical Nigerian setting
Leaving allowance for contingencies of 20%, the estimated per capita monthly NPWD is 768 litres. Allowance for contingencies takes care of unexpected NPWD and PWD from guests, emergencies such as ceremonies, etc. The estimated per capita monthly PWD was estimated to be 270 litres leaving room for contingencies as well. The estimated weekly per capita water demand of 202.5 lpcd exceeded the weekly minimum water requirements of 140 lpcd recommended by United Nations (UN) based on 20 lpcd for rural communities in developing countries.
Dow
nloa
ded
by [
97.1
23.1
92.8
8] a
t 04:
55 1
6 Ja
nuar
y 20
16

25
Therefore, for a six-member household comprising father, mother and four children, the total estimated monthly NPWD and PWD were 4,608 litres (4.608 m3) and 1620 litres (1.62 m3), respectively. Therefore, total estimated monthly household water demand (HHWD) for a six-member household was 6.228 m3 while total annual HHWD was 74.74 m3.
For the MEE approach, the percentage contributions of total annual water demand that can only be met by DRWH were computed for the three scenarios were shown in Table 11. For total annual NPWD, between 32.84% and 49.64% can be met by DRWH. For total annual PWD, between 93.42% and 141.20% can be met by DRWH.
Table 11. Domestic Rainwater harvesting potential (DRHP) based on MEE Limits
Scenarios Total Annual HRW (m3) % Annual NPWD % Annual PWD % Total Annual HHWD
UCL 27.45 49.64 141.20 36.73 Mean 22.45 41 115.48 30.04 LCL 18.16 32.84 93.42 24.30
This indicates that for the mean and UCL scenarios, PWD can be sufficiently met with some excess remaining and 93.42% met in the LCL scenario. In addition, this result also revealed that DRWH can only be used to complement the main water supply for the study area when used for non-potable purposes.
For the COV approach, DRWH has the potential to meet 27.51%-54.91% of the NPWD, 78.34%-156.38% of PWD, and between 20.38%-40.67% of the total annual HHWD as displayed in Table 12.
Table 12. Domestic Rainwater harvesting potential (DRHP) based on COV Limits
Scenarios Total Annual HRW (m3) % Annual NPWD % Annual PWD % Total Annual HHWD
UCL 30.40 54.91 156.38 40.67 LCL 15.23 27.51 78.34 20.38
4. Conclusions
Rainfall variability has been demonstrated for our study area and it may be attributed to
tropical and extratropical factors which operate during different months, seasons and years.
Rainfall variability in terms of COV ranges from 24-39% for the seasons and 26-41% for the
months. The dry season months (November –April) have been experiencing a mean rainfall
increase of 1.63 mm/year with a range of 1.19 -2.27 mm/year while the wet season months of
May- October recorded a mean increase of 1.37 mm/year with a range of 0.20 -2.28 mm/year.
Periodicity of five-six years was observed in the rainfall pattern in our study area which
corroborated earlier research findings.
Dow
nloa
ded
by [
97.1
23.1
92.8
8] a
t 04:
55 1
6 Ja
nuar
y 20
16

26
Though MK test revealed significant rainfall in most of the months and likewise significant
increase in Spring and Summer, from a water management perspective, the increase was not
significant, which corroborates results obtained for some countries with similar rainfall
variability. The general perception of increasing or declining rainfall may be attributed to the
presence of rainfall variability on monthly and seasonal timescales. Also, Hoeffding’s D
statistics revealed prevalence of non-monotonic trend in all the months and seasons.
Taking into account the effects of rainfall variability, the recommended minimum and
maximum storage capacity requirements for a six-member household is 1 m3 and 6 m3
respectively.
In addition, based on the maximum error estimate approach, the rainwater harvesting
potential for the area of study ranges between 18.16 m3 and 27.45 m3 while based on the
coefficient of variation approach, the rainwater harvesting potential ranges between 15.23
and 30.40 m3.
Our results also showed that domestic rainwater harvesting has the potential to meet 27.51%
to 54.91% of non-potable household water demand as well as 78.34% to 156.38% of
household potable water demand for a six-member household.
Domestic rainwater harvesting is highly encouraged as a supplementary water source
especially in rural and peri-urban areas to reduce their vulnerability to acute shortage of water
infrastructure.
The significance of this research and contribution to literature is that it has incorporated rainfall variability in the calculation of rainwater harvesting potential and in the calculation of storage water requirements taking into account the effects of rainfall variability which is often neglected in such studies. In addition, as a supplementary source of water, it demonstrated the percentage of domestic water demand that can be met by rainwater harvesting for potable and non-potable purposes. Furthermore, results from this study revealed the periodicity of rainfall pattern which characterize our study area.
Funding: The authors received no direct funding for this research.
Conflict of interest & compliance with ethical standards: The authors declare no conflict
of interest and compliance with professional ethical standards in the research.
Dow
nloa
ded
by [
97.1
23.1
92.8
8] a
t 04:
55 1
6 Ja
nuar
y 20
16

27
Acknowledgements: Ogun-Osun River Basin Development Authority is appreciated for the
supply of the rainfall data used in this study. Likewise, comments from the anonymous
reviewers are highly appreciated.
References
Abaje, I.B., Ndabula, C., Garba, A.H. (2014). Is the changing rainfall patterns of Kano State and its adverse impacts an indication of climate change? European Scientific Journal, 10(2), 192-206 Abdullah, F.A., Al-Shareef, A.W. (2009). Roof rainwater harvesting systems for household water supply in Jordan. Desalination, 243, 195–207 Adejuwon, J.O. (2012). Rainfall seasonality in the Niger Delta Belt, Nigeria. J. of Geography and Regional Planning, 5 (2), 51-60
Adegoke, C.W., Sojobi, A.O. (2015). Climate change impact on infrastructure in Osogbo metropolis, south-west Nigeria. Journal of Emerging Trends in Engineering and Applied Sciences, 6(3), 156-165
Agbelemoje A. & Odubanjo O.J. (2001). Assessment of domestic water supply sanitation in rural communities in Ijebu North Area of Ogun State, Nigeria. J. of Environmental Extension 2.
Ajayi, A.R., Ugwu, C.C. (2008). Rainwater harvesting for agriculture and domestic supply in Enugu North Agricultural Zone, Nigeria. Journal of Agricultural Extension, 12 (1), 1-12
Akinsanola, A.A., Ogunjobi, K.O. (2014). Analysis of rainfall and temperature variability over Nigeria. Global J. of Human Social Science-B. Geography, D=Geosciences, Environmental Disaster, 14 (3) 1, 1-18 Akinyemi, O., Ayeni, O.A., Faweya, O., Ibraheem, A.G. (2013). Statistical study of annual and monthly rainfall patterns in Ekiti State. Int J of Pure and Appl Sci Technol, 15 (2), 1-7
Aladenola, O., Adeboye, O. (2010). Assessing the Potential for Rainwater Harvesting. Water Resources Management, 24(10), 2129-2137. doi:10.1007/s11269-009-9542-y
Amado, M.P., Barroso, L.M. (2013). Sustainable construction: Water use in residential buildings in Portugal. International Journal of Sustainable Construction Engineering and Technology, 4(2), 14-22 Amakom C.M. & Jibiri N.N. (2010). Uranium Amori, A.A., Oduntan, O.O., Okeyode, I.C., Ojo, S.O. (2013). Heavy metal concentration of groundwater deposits in odeda region, Ogun state, Nigeria. E3 Journal of Environmental Research and Management, 4(5), 253-0259
Dow
nloa
ded
by [
97.1
23.1
92.8
8] a
t 04:
55 1
6 Ja
nuar
y 20
16

28
Aper J.A. & Agbehi S.I. (2010). Pattern of domestic water supply in Ugbokolo Community in Benue State, Nigeria. Int. J. of Water & Soil Resources, 1(1-3), 72-82 Aper J.A. & Agbehi S.I. (2011). The determining factors of rural water supply pattern in Ugbokolo Community, Benue State, Nigeria Barbe L.L., Lebel T., Tapsoba D. (2002). Rainfall variability in West Africa during the Years 1950-1990. J. of Climate, 15, 187-202 Biazin, B., Sterk, G., Temesgen, M., Abdulkedir, A., Stroosnijder, L. (2012). Rainwater harvesting and management in rainfed agricultural systems in sub-Saharan Africa – A review. Physics & Chemistry Of The Earth, 47–48, 139–151
Bibi, U.M., Kaduk, J., Balzter, H. (2014). Spatio-temporal variation and prediction of rainfall in North-Eastern Nigeria. Climate, 2, 206-222
Biswas, B.K. & Mandal, B.H. (2014). Construction and Evaluation of Rainwater Harvesting System for Domestic Use in a Remote and Rural Area of Khulna, Bangladesh. ISRN Otolaryngology, 1-6. doi:10.1155/2014/751952
Bluman, A.G. (2013). Elementary statistics. A step by step approach. 6th ed. New York: McGraw-Hill
Bocanegra-Martinez, A., Ponce-Ortega, J.M.P., Napoles-Rivera, F., Serna-Gonzalez, M., Castro-Montoya, A.J., El-Hawagi, M.M. (2014). Optimal design of rainwater collecting systems for domestic use into a residential development. Resources, Conservation and Recycling, 84, 44-56
Boelee, E., Yohannes, M., Poda, J., McCartney, M., Cecchi, P., Kibret, S., Laamrani, H. (2013). Options for water storage and rainwater harvesting to improve health and resilience against climate change in Africa. Regional Environmental Change, 13(3), 509-519 doi:10.1007/s10113-012-0287-4
Branco, A.D.M. Suassuna, J., & Vainsencher, S.A. (2005). Improving access to water resources through rainwater harvesting as a mitigation measure: the case of the Brazilian semi-arid region, Mitigation and adaptation strategies for global change, 10(3), 393-409(17).
Campisano, A., Modica, C. (2012). Regional scale analysis for the design of storage tanks for domestic rainwater harvesting systems. Water Science & Technology, 66(1), 1-8 doi:10.2166/wst.2012.171
Campisano, A., Gnecco, I., Modica, C., & Palla, A. (2013). Designing domestic rainwater harvesting systems under different climatic regimes in Italy. Water Science and Technology, 67(11), 2511-2518. doi:10.2166/wst.2013.143
Dow
nloa
ded
by [
97.1
23.1
92.8
8] a
t 04:
55 1
6 Ja
nuar
y 20
16

29
Chao-Hsien, L., & Yu-Chuan, C. (2014a). Framework for Assessing the Rainwater Harvesting Potential of Residential Buildings at a National Level as an Alternative Water Resource for Domestic Water Supply in Taiwan. Water, 6(10), 3224-3246. doi:10.3390/w6103224
Chao-Hsien L, and Yu-Chuan C (2014b) Dimensionless Analysis for Designing Domestic Rainwater Harvesting Systems at the Regional Level in Northern Taiwan. Water, 6(12), 3913-3933. doi:10.3390/w6123913
Clark, R., Gonzalez, D., Dillon, P., Charles, S., Cresswell, D., Naumann, B. (2015). Reliability of water supply from stormwater harvesting and managed aquifer recharge with a brackish aquifer in an urbanizing catchment and changing climate. Environmental Modelling and Software, 72, 117-125
Coster A.S. & Otufale G.A. (2014). Household’s water-use demand and willingness to pay for improved water services in Ijebu-Ode Local Government Area, Ogun State, Nigeria. J. of Environment & Earth Science, 4(17), 166-174
Cruddas, P., Carter, R., Parker, A., Rowe, N. & Webster, J. (2013). Tank costs for domestic rainwater harvesting in East Africa. Proceedings of ICE: Water Management, 166(10), 536-545. doi:10.1680/wama.11.00113
Dahunsi S.O., Owamah H.I., Ayandiran T.A., Oranusi S.U. (2014). Drinking water quality and public health of selected towns in South Western Nigeria. Water Qual Expo Health. DOI: 10.1007/s12403-014-0118-6
Dobrowksy, P.H., Mannel, D., De Kwaadsteniet, M., Prozesky, H., Khan, W. & Cloete, T.E. (2014a). Quality assessment and primary uses of harvested rainwater in Kleinmond, South Africa. Water SA, 40(3), 401-406. doi:10.4314/wsa.v40i3.2
Dobrowksy, P.H., Van Deventer, A., De Kwaadsteniet, M., Ndlovu, T., Khan, S., Cloete, T.E., & Khan, W (2014b). Prevalence of virulence genes associated with pathogenic Escherichia coli strains isolated from domestically harvested rainwater during low- and high-rainfall periods. Applied and Environmental Microbiology, 80 (5), 1633-1638
Efe, S.I. (2006). Quality of rainwater harvesting for rural communities of Delta State, Nigeria. Environmentalist, 26(3), 175-181. doi:10.1007/s10669-006-7829-6
Ekpoh, I.J., Nsa, E. (2011). Extreme climatic variability in North-Western Nigeria: An analysis of rainfall trends and patterns. J. of Geography and Geology, 3 (1), 51-62
Ekwe, M.C., Joshua, J.K., Igwe, J.E., Osinowo, A.A. (2014). Mathematical of monthly and annual rainfall trends in Nasarawa State, Nigeria. IOSR J. of Mathematics, 10 (1), 56-62
Eltahir E.A.B. & Gong C. (1996). Dynamics of wet and dry years in West Africa. J. of Climate, 9, 1030-1042
Dow
nloa
ded
by [
97.1
23.1
92.8
8] a
t 04:
55 1
6 Ja
nuar
y 20
16

30
Esterhuyse, P. (2012). Social capital in a rainwater-harvesting project in rural South. Irrigation and Drainage, 6195-105. doi:10.1002/ird.1690
Ewona, I.O., Osang, J.E., Udo, S.U. (2014). Trend analysis of rainfall patterns in Nigeria using regression parameters. Int. J. of Technology Enhancements and Emerging Engineering Research, 2 (5), 129-133
Falkenmark, M., Fox, P., Persson, G., & Rockstrom, J. (2001). Water harvesting for upgrading of rainfed agriculture. SIWI Report 11, Stockholm International Water Institute, Sweden, ISBN: 91-974183-0-7
Food and Agriculture Organization (2007). Report on water and sanitation in Africa.
Fernandes, L.F.S., Terencio, D.P.S., Racheco, F.A.L. (2015). Rainwater harvesting systems for low demanding applications. Science of the Total Environment, 529, 91-100
Fry, L.M., Cowden, J.R., Watkins, J.W., Clasen, T., Mihelcic, J.R. (2010). Quantifying Health Improvements from Water Quantity Enhancement: An Engineering Perspective Applied to Rainwater Harvesting in West Africa. Environmental Science and Technology, 44(24), 9535-9541. doi:10.1021/es100798j
Federal Republic of Nigeria (2000). Water supply and sanitation interim strategy note. FRN, Abuja, Nigeria
Fujita A., Sato J., Demasi M., Sogayar M., Ferreira C., Miyano S. (2009). Comparing Pearson, Spearman and Hoeffding’s D measure for gene expression association analysis. J. of Bioinformatics & Computational Biology, 7, 663-684
Ganiyu M.O., Akinniran Y.N., Adeyemo S.A. (2013). Rainfall pattern and trend on arable crops production in Oyo State, Nigeria (1990-2009). World Rural Observ. 5 (2): 7-11
Gbadegesi N.N. & Olorunfemi F. (2007). Assessment of rural water supply management in selected rural areas of Oyo State, Nigeria
Gebremichael, A., Ourashi, S., Mamo, G. (2014). Analysis of seasonal rainfall variability for agricultural water resource management in Southern region. Ethiopia Journal of Natural Sciences Research, 4 (11), 56-79
Ghis, E., Schondermark, P.V. (2013). Investment feasibility analysis of rainwater use in residences. Water Resources Management, 27(7), 2555-2576 DOI: 10.1007/s11269-013-0303-6
Giannini A, Saravanan R., Chang P. (2003). Oceanic forcing of Sahel in interannual and to interdecadal time scales. Science, 302, 1027-1030
Gong C., Eltahir E. (1996). Sources of moisture for rainfall in West Africa. Water Resourc Res., 32, 3115-3121
Dow
nloa
ded
by [
97.1
23.1
92.8
8] a
t 04:
55 1
6 Ja
nuar
y 20
16

31
Guhathakurta, P., Saji, E. (2013). Detecting changes in rainfall pattern and seasonality index vis-à-vis increasing water scarcity in Maharashtra. J. Earth Syst. Sci., 122 (3), 639-649
Gurung, T.R., & Sharma, A. (2014). Communal rainwater tank systems design and economies of scale. Journal of Cleaner Production, 67, 26-36
Gwenzi, W., Dunjana, N., Pisa, C., Tauro, T., Nyamadzawo, G. (2015). Water quality and public health risks associated with roof rainwater harvesting systems for potable supply: Review and perspectives. Sustainability of Water Quality and Ecology (in press), http://dx.doi.org/10.1016/j.swaqe.2015.01.006
Hare, F.K. (1983). Climate and desertification. Revised analysis (WMO-UNDP). WCP-44, 5-20, Geneva, Switzerland Hastenrath S., Wolter K. (1992). Large-scale patterns and long-term trends of circulation variability associated with Sahel rainfall anomalies. J. Meteor. Soc. Japan, 70, 1045-1055
Helmreich, B., & Horn, H. (2009). Opportunities in rainwater harvesting. Desalination, 248, 118-124
Hu, Q., Pan, F., Pan, X., Zhang, D., Li, Q., Pan, Z., Wei, Y. (2015). Spatial analysis of climate change in Inner Mongolia during 1961-2012. China Applied Geography, 60, 254-260 Ibrahim Y., Balzter H., Kaduk J.& Tucker C.J. (2015). Land degradation assessment using residual trend analysis of GIMMS NDVI3g, soil moisture and rainfall in Sub-Saharan West Africa from 1982 to 2012. Remote Sensing, 7, 7471-5494
Ikhile, C. I., Aifesehi, P. E. E. (2011). Geographical distribution of average monthly rainfall in the western section of Benin-Owena River Basin, Nigeria. African Research Review, 5 (4), 493-500
Imteaz, M., Adeboye, O., Rayburg, S., & Shanableh, A. (2012). Rainwater harvesting potential for southwest Nigeria using daily water balance model. Resources, Conservation & Recycling, 62, 51-55. Available from: Environment Complete, Ipswich, MA. Accessed August 11, 2015.
Imteaz, M.A., Ahsan, A. & Shanableh, A. (2013). Reliability analysis of rainwater tanks using daily water balance model: variations within a large city. Resources, Conservation and Recycling, 77, 37-43
Imteaz, M.A., Matos, C. & Shanableh, A. (2014). Impacts of climatic variability on rainwater tank outcomes for an inland city, Canberra. International Journal of Hydrology Science and Technology, 4(3), 177-191
Islam, K.Z., Islam, M. S., Lacoursiere, J.O., Dessborn (2014). Low Cost Rainwater Harvesting: An Alternate Solution to Salinity Affected Coastal Region of Bangladesh American Journal of Water Resources, 2(6), 141-148
Dow
nloa
ded
by [
97.1
23.1
92.8
8] a
t 04:
55 1
6 Ja
nuar
y 20
16

32
Johnson, R & Kuby, P. (2012). Elementary statistics. USA: Cengage Learning
Kalungu J.W., Filho W.L., Mbuge D.O., Cheruiyot H.K. (2014). Assessing the impact of rainwater harvesting technology as adaptation strategy for rural communities in Makueni County, Kenya. In W.L. Filho (Ed.): Handbook of Climate Change Adaptation (Pp. 1-17). doi: 10.1007/978-3-642-40455-9-221-23-1
Kanellopoulou, E.A. (2002). Spatial distribution of rainfall seasonality in Greece. Weather, 57, 215-219
Kendall, MG. (1975). Ranked Correlation Methods. London: Griffin
Kilanko-Oluwasanya, G.O. (2009). Better safe than sorry: Towards appropriate water safety plans for urban self-supply systems. [Unpublished PhD Dissertation]. Cranfield University, UK
Kohlitz, J.P., & Smith, M.D. (2015). Water quality management for domestic rainwater harvesting systems in Fiji. Water Science & Technology: Water Supply, 15(1), 134-141. doi:10.2166/ws.2014.093
Kwaadsteniet, M., Dobrowsky, P., Deventer, A., Khan, W., & Cloete, T. (2013). Domestic Rainwater Harvesting: Microbial and Chemical Water Quality and Point-of-Use Treatment Systems. Water, Air & Soil Pollution, 224(7), 1-19. doi:10.1007/s11270-013-1629-7
Lade, O., Oloke, D. (2015). Rainwater harvesting in Ibadan City, Nigeria: Socio-economic survey and common water supply practices. American J. of Water Resources, 3 (3), 61-72
Lebel, S., Fleskens, L., Forster, P.M., Jackson, L.S., Lorenz, S. (2015). Evaluation of In Situ Rainwater Harvesting as an Adaptation Strategy to Climate Change for Maize Production in Rainfed Africa. Water Resour Manage (In press) DOI 10.1007/s11269-015-1091-y Lee, J.Y., Yang, J.S., Han, M., & Choi, J. (2010). Comparison of the microbiological and chemical characterization of harvested rainwater and reservoir water as alternative water resources. Science of the Total Environment, 408 (4), 896-905. Lekwot, V.E., Samuel, I.O., Ifeanyi, E., & Olisaemeka, O. (2012). Evaluating the potential of rainwater harvesting as a supplementary source of water supply in Kanai (Mali) district of Zangon-katak local government area of Kaduna State, Nigeria. Global Advanced Research J. of Environmental Science and Technology, 1(3), 38-45
Liu, E, Luo, Y.L., Zhang, R.H., Wu, Q.H., Liu, L.P. (2011). Regional atmospheric anomalies responsible for the 2009e2010 severe drought in China. Journal of Geophysical Research, 116, D21114. http://dx.doi.org/10.1029/2011JD015706. Long M., Entekhabi D. (2000). Interannual variability in rainfall, water vapour flux, and vertical motion over West Africa. J. of Climate, 13, 3827-3841
Dow
nloa
ded
by [
97.1
23.1
92.8
8] a
t 04:
55 1
6 Ja
nuar
y 20
16

33
Mahajan, D.R., Dodamani, B.M. (2015). Trend Analysis of Drought Events Over Upper Krishna Basin in Maharashtra. Aquatic Procedia, 4, 1250 – 1257 Martino, G., Fontana, N., Marini, G., Singh, V. (2013). Variability and Trend in Seasonal Precipitation in the Continental United States. J Hydrol Eng, 18(6), 630–640.
Martins, O., Ajayi, O., & Idowu, O.A. (2000). Factors influencing yields of boreholes in Basement Complex aquifers of South-western Nigeria. Nigeria Journal of Science, 34, 295-300 Mazvimavi D. (2010). Investigating changes over time of annual rainfall in Zimbabwe. Hydrol. Earth Syst. Sci., 14, 2671-2679 McKee, T.B., Doesken, NJ.., & Kleist, J. (1993, January). The relationship of drought frequency and duration to time scales. 8th Conf. on Appld. Climatology 179-184, Jan. 17-22, Anaheim, California Mendez, C.B., Klenzendorf, J.B., Afshar, B.R., Simmons, M.T., Barrett, M.E., Kinney, K.A. & Kirisits, M.J. (2011). The effect of roofing material on the quality of harvested rainwater. Water research, 45, 2049-2059 Mwenge Kahinda, J., Taigbenu, A.E., Boroto, J.R. (2007). Domestic rainwater harvesting to improve water supply in rural South Africa. Physics and Chemistry of The Earth - Parts A/B/C, 32(15-18), 1050-1057. doi:10.1016/j.pce.2007.07.007
Mwenge Kahinda, J., Taigbenu, A., & Boroto, R. (2010). Domestic rainwater harvesting as an adaptation measure to climate change in South Africa. Physics and Chemistry of The Earth - Parts A/B/C, 35(13/14), 742-751. doi:10.1016/j.pce.2010.07.004
Mwenge Kahinda, J., & Taigbenu, A. (2011). Rainwater harvesting in South Africa: Challenges and opportunities. Physics & Chemistry of The Earth - Parts A/B/C, 36(14/15), 968-976. doi:10.1016/j.pce.2011.08.011
Ndiritu, J., Odiyo, J.O., Makungo, R., Ntuli, C., Mwaka, B. (2011). Yield-reliability analysis for rural domestic water supply from combined rainwater harvesting and run-of-river abstraction. Hydrological Sciences Journal/Journal Des Sciences Hydrologiques, 56(2), 238-248. doi:10.1080/02626667.2011.555766
Nicholson S.E. & Grist J.P. (2001). A conceptual model for understanding rainfall variability in the West African Sahel on interannual and interdecadal timescales. Int. J. of Climatology, 21, 1733-1757
Nicholson S.E. (2013). The West African Sahel: A review of recent studies on the rainfall regime and its interannual variability. ISRN Meteorology, 1-32
Nijhof, S., Jantowski, B., Meerman, R., & Schoemaker, A. (2010). Rainwater harvesting in challenging environments: Towards institutional frameworks for sustainable domestic water supply. Waterlines, 29(3), 209-219. doi:10.3362/1756-3488.2010.022
Dow
nloa
ded
by [
97.1
23.1
92.8
8] a
t 04:
55 1
6 Ja
nuar
y 20
16

34
Nnaji, C., & Mama, N. (2014). Preliminary Assessment of Rainwater Harvesting Potential in Nigeria: Focus on Flood Mitigation and Domestic Water Supply. Water Resources Management, 28(7), 1907-1920. doi:10.1007/s11269-014-0579-1
Nwude, E.C. (2013). The politics of minimum wage in Nigeria: The unresolved issues. Asian J Emprical Research, 3 (4), 477-492
Odjeba E.E., Idowu OA, Ikenweiwe N.B., Martins O., Sadeeq A.Y. (2015). Public perception of potable water supply in Abeokuta Southwest Nigeria. J. Appl. Sci. Environ. Manage., 19(1), 5-9
Ogungbenro, S.B., Morakinyo, T.E. (2014). Rainfall distribution and change detection across climatic zones in Nigeria. Weather and Climate Extremes, 5-6, 1-6
O'Hogain, S., McCarton, L., McIntyre, N., Pender, J., & Reid, A. (2011). Physicochemical and microbiological quality of water from a pilot domestic rainwater harvesting facility in Ireland. Water & Environment Journal, 25(4), 489-494. doi:10.1111/j.1747-6593.2010.00244.x
Oke, M., & Oyebola, O. (2014). Assessment of rainwater harvesting potential and challenges in Ijebu Ode, southwestern part of Nigeria for strategic advice. Scientifica Annals of ‘Al I. Cuza” University of IAŞI LX (2), http://dx.doi.org/10.15551/scigeo.v60i2.345
Olaniran O.J. Rainfall anomalies in Nigeria: The contemporary understanding. Geog. Dept., University of Ilorin Inaugural lecture, Kwara State, Nigeria
Olaoye, R.A., & Olaniyan, O.S. (2012). Quality of rainwater from different roof material. Int. J. of Engineering and Technology, 2 (8), 1413-1421
Ologunorisa T.E. & Adejuwon J.O. (2003). Annual rainfall trends and periodicity in the Niger Delta, Nigeria. J. of Meteorology, 28 (276), 41-51
Omogbai, B.E. (2010a). Rain days and their predictability in South-western region of Nigeria. J. Hum. Ecol. 31 (3): 185-195
Omogbai, B.E. (2010b). An empirical prediction of seasonal rainfall in Nigeria. J. Human Ecol., 32 (1), 23-27
Opare, S. (2012). Rainwater harvesting: an option for sustainable rural water supply in Ghana. Geojournal, 77(5), 695-705. doi:10.1007/s10708-011-9418-6
Otti, V.I., Ezenwaji, E.E. (2013). Enhancing community-driven initiative in rainwater harvesting in Nigeria. Int. J. of Engineering and Technology, 3 (1), 73-79
Otufale G.A. & Coster A.S. (2012). Impact of water scarcity and drudgery of water collection on women’s health in Ogun of Nigeria. J. Hum Ecol, 39(1), 1-9
Dow
nloa
ded
by [
97.1
23.1
92.8
8] a
t 04:
55 1
6 Ja
nuar
y 20
16

35
Perry, M. (2006). Spatial analysis of trends in the UK climate since 1914 using gridded datasets. Climate Memorandum No. 21, National Climate Information Centre, UK
Quan X.-W., Diaz H.F., Fu C.-B.(2003). Interdecadal change in the Asia-Africa summer monsoon and its associated changes in global atmospheric circulation. Global & Planetary Change, 37(3-4), 171-188 Roebuck, R.M. (2007). A whole life costing approach for rainwater harvesting systems: an investigation into the whole life cost implications of using rainwater harvesting systems for nonpotable applications in new-build developments in the UK. [Unpublished PhD Dissertation]. University of Bradford, UK Roebuck, R.M., Oltean-Dumbrava, C., & Tait, S. (2012) Can simplified design methods for domestic rainwater harvesting systems produce realistic water-saving and financial predictions? Water & Environment Journal, 26(3), 352-360. doi:10.1111/j.1747-6593.2011.00295.x
Roebuck, R.M., Oltean-Dumbrava, C., & Tait, S. (2011). Whole life cost performance of domestic rainwater harvesting systems in the United Kingdom. Water & Environment Journal, 25(3), 355-365. doi:10.1111/j.1747-6593.2010.00230.x
Rowell D.P., Folland C.K., Maskell K, Ward N. (1995). Variability of Summer rainfall over tropical North Africa (1906-92). Observations & Modelling Quart. J. Roy. Meteor. Soc., 121, 669-70
Sammadar, S., Murase, M., & Okada, N. (2014). Information for disaster preparedness: A social network approach to rainwater harvesting technology dissemination. Int. J. Disaster Risk Sci, 5, 95-109
Santos S.D., Takahashi D.Y., Naka A., Fujita A. (2013). Comparative study of statistical methods used to identify dependencies between gene expression signals. Briefings in Bioinformatics, 1-13. Sayemuzzaman, M., Jha, M. (2014). Seasonal and annual precipitation time series trend analysis in North Carolina, United States. Atmospheric Research, 137, 183–194 Semazzi F.H.M., Mehta V., Sud Y.C. (1988). An investigation of the relationship between sub-Saharan rainfall and global sea surface temperatures. Atmos-Ocean, 26, 118-138
Shaw, E.M., Beven, K.J., Chappell, N.A. & Lamb. R. (2010). Hydrology in practice. US: CRC Press
Shittu O.B., Akpan I., Popola T.O.S., Oyedepo J.A. & Oluderu I.B. (2010). Application of GIS-Rs in bacteriological examination of rural community water supply and sustainability problems with UNICEF assisted borehole: A case study of Alabata community, South-western Nigeria. J. of Public Health & Epidemiology, 2(9), 238-244
Dow
nloa
ded
by [
97.1
23.1
92.8
8] a
t 04:
55 1
6 Ja
nuar
y 20
16

36
Shittu, O. I., Okareh, O. T., & Coker, A.O. (2015). Development of rainwater harvesting technology for securing domestic water supply in Ibadan, Nigeria. Int. Res. J. of Engineering Science, Technology & Innovation, 4 (1), 32-37
Słyś, D., & Stec, A. (2014). The Analysis of Variants of Water Supply Systems in Multi-Family Residential Building. Ecological Chemistry & Engineering S / Chemia I Inzynieria Ekologiczna S, 21(4), 623-635. doi:10.1515/eces-2014-0045
Sojobi AO, Owamah HI, Dahunsi SO (2014) Comparative study of household water treatment in a rural community in Kwara State Nigeria. Nigerian J. of Technology, 33(1): 134-140
Sojobi, A.O., Dahunsi, S.O., Afolayan, A.O. (2015). Assessment of the efficiency of disinfection method for improving water quality. Nigerian Journal of Technology, 34(4), 907-915.
Souza, E.L., & Ghisi, E. (2012). Potable Water Savings by Using Rainwater for Non-Potable Uses in Houses. Water, 4(3), 607-628 Stump, B., McBroom, M., & Darville, R. (2012). Demographics, practices and water quality from domestic potable rainwater harvesting systems. Journal of Water Supply: Research & Technology-AQUA, 61(5), 261-271. doi:10.2166/aqua.2012.007
Sturn, M., Zimmermann, M., Schutz, K., Urban, W., & Hartung, H. (2009). Rainwater harvesting as an alternative water resource in rural sites in central northern Namibia. Physics and Chemistry of the Earth, 34, 776-785
Tabari, H., Marofi, S., Aeini, A., Talaee, P.H., & Mohammadi, K. (2011). Trend analysis of reference evapotranspiration in the western half of Iran. Agricultural and Forest Meteorology, 151, 128-136
Tapsoba D., Hache M., Perreault L., Bobee B. (2004). Bayesian rainfall variability analysis in West Africa along cross sections in space-time grid boxes. J. of Climate, 17, 1069-1082 Thomas, R.B., Kirisits, M.J., Lye, D.J., & Kinney, K.A. (2014). Rainwater harvesting in the United States: a survey of common system practices. Journal of Cleaner Production, 75, 166-173 Tobin E.A., Ediagbonya T.F., Ehidiamen G., Asogun D.A. (2013). Assessment of rainwater harvesting systems in a rural community of Edo State, Nigeria. J. of Pub. Health & Epidemiology, 5(12), 479-487 Tomaz, P., 2005. Aproveitamento de água da chuva para áreas urbanas e fins não potáveis. Navegar, São Paulo, Brazil (in Portuguese) Traboulsi, H., & Traboulsi, M. (2015). Rooftop level rainwater harvesting system. Appl. Water Sci. (In press) DOI 10.1007/s13201-015-0289-8
Dow
nloa
ded
by [
97.1
23.1
92.8
8] a
t 04:
55 1
6 Ja
nuar
y 20
16

37
Ubuoh, A., Ege, C.A., Ogbuji, S., & Onifade, S. (2012). Potentials of domestic rainwater harvesting in Kwa Ibom State, Nigeria using supply side approach. J. of Environmental Science and Resource Management, 4, 1-9
Ufoegbune G.C., Oyedepo J.A., Awomeso, Eruola A.O. (2010). Spatial analysis of municipal water supply in Abeokuta metropolis, South Western Nigeria. Proceedings, Vienna, REAL CORP, 1267-1273
Vanem, E., & Walker, S.-E. (2013). Identifying trends in the ocean wave climate by time series analyses of significant wave height data. Ocean Engineering, 61, 148–160
Welderufael, W.A., Woyessa, Y.E., & Edossa, D.C. (2011). Hydrological impact of rainwater harvesting in the Modder river basin of central South Africa. Hydrology and Earth System Sciences Discussions, 8(3), 5051-5081. doi:10.5194/hessd-8-5051-2011
WHO (2004). Water requirements, impinging factors, and recommended intakes. World Health Organization, Geneva. Accessed June 30, 2015.
WHO (2005). Minimum water quantity needed for domestic uses. World Health Organization, Geneva. Accessed June 30, 2015.
Woltersdorf, L., Liehr, S., & Döll, P. (2015). Rainwater Harvesting for Small-Holder Horticulture in Namibia: Design of Garden Variants and Assessment of Climate Change Impacts and Adaptation. Water, 7(4), 1402-1421. doi:10.3390/w7041402
Worm J. & Hattum T.V. (2006). Rainwater harvesting for domestic use. http://journeytoforever.org/farm_library/AD43.pdf Accessed December 14, 2015
Wu, F., Wang, X., Cai, Y., & Li, C. (2013). Spatio-temporal analysis of precipitation trends under climate change in the upper reach of Mekong River Basin. Quarternary International (In press), 1-10. http://dx.doi.org/10.1016/j.quaint.2013.05.049
World Meteorological Organization (2015). The Climate in Africa. WMO, Geneva Switzerland. http://www.wmo.int/pages/prog/wcp/wcdmp/documents/1147_EN.pdf
Zang, C., & Liu, J. (2013). Trend analysis for the flows of green and blue water in the Heihe River basin, northwestern China. J. of Hydrology, 502, 27-36
Zhang, Q., Wang, X., Hou, P., Wan, W., Li, R., Ren, Y., & Ouyang, Z. (2014). Quality and seasonal variation of rainwater harvested from concrete, asphalt, ceramic tile and green roofs in Chongqing, China. Journal of Environmental Management, 132, 178-187
Dow
nloa
ded
by [
97.1
23.1
92.8
8] a
t 04:
55 1
6 Ja
nuar
y 20
16