
Assessment of Radionuclide Release from Contaminated Concrete … · Contaminated Concrete at the...
45
1 BNL-74697-2005-IR Assessment of Radionuclide Release from Contaminated Concrete at the Yankee Nuclear Power Station Terry Sullivan March 2004 Environmental Sciences Department Environmental Research & Technology Division Brookhaven National Laboratory P.O. Box 5000 Upton, NY 11973-5000 www.bnl.gov Managed by Brookhaven Science Associates, LLC for the United States Department of Energy under Contract No. DE-AC02-98CH10886
Transcript of Assessment of Radionuclide Release from Contaminated Concrete … · Contaminated Concrete at the...

1
BNL-74697-2005-IR
Assessment of Radionuclide Release from Contaminated Concrete at the Yankee Nuclear
Power Station
Terry Sullivan
March 2004
Environmental Sciences Department Environmental Research & Technology Division
Brookhaven National Laboratory
P.O. Box 5000 Upton, NY 11973-5000
www.bnl.gov
Managed by Brookhaven Science Associates, LLC
for the United States Department of Energy under Contract No. DE-AC02-98CH10886
2
DISCLAIMER
This report was prepared as an account of work sponsored by an agency of the United States Government. Neither the United States Government nor any agency thereof, nor any of their employees, nor any of their contractors, subcontractors, or their employees, makes any warranty, express or implied, or assumes any legal liability or responsibility for the accuracy, completeness, or any third party’s use or the results of such use of any information, apparatus, product, or process disclosed, or represents that its use would not infringe privately owned rights. Reference herein to any specific commercial product, process, or service by trade name, trademark, manufacturer, or otherwise, does not necessarily constitute or imply its endorsement, recommendation, or favoring by the United States Government or any agency thereof or its contractors or subcontractors. The views and opinions of authors expressed herein do not necessarily state or reflect those of the United States Government or any agency thereof.

Calculation Title Page
Assessment of Radionuclide Release from Contaminated Concrete at the Yankee Nuclear Power Station
Title
YA-CALC-00-001-04
Calculation Number
Executive Summary
Yankec Atomic Energy Company (YAEC) is considering allowing portions of existing structures at t l~e Yankee Nuclear Power Station (YNPS) to remain on site at the time of
license termination. Accordingly, release of residual radioactive coiltaminants (i.e., H-3, C-14, Co-60, Ni-63, Sr-90, and Cs-137) from remaining subsurface concrete structures
(Darman, 2004) and dose due to that release must be evaluated. Analyses were performed using DUST-MS to assess the rate of release for each radionuclide from the concrete, based upon an assumed concentration of 1 pCilg and a concrete density of 2.5 g/cm3. Using the same assumptions that were applied to the soil DCGL calculation (and where appropriate, the same input parameters), RESRAD was used to calculate thc dose from water pathways. Values for selected RESRAD input parameters were chosen to
match the release rate calculated by DUST-MS. The results indicated that Cs-137 yielded the highest dose.
Approvals (Print & Sign Name)
Preparer: Terrence Sullivan (BNL) Date:
Reviewer: Estella Keefer Date:
Reviewer: Joseph Bisson Date:
Reviewer: Peter Littlefield Date:
Reviewer: Alice Carson Date:
Approval (Cognizant Manager): Greg Babineau Date:
DCM FORM 1.5-1A

Table o f Contents
Purpose ................................................................................................................................ 4 Summary of Results ............................................................................................................ 4 References ........................................................................................................................... 5 Method of Calculation ........................................................................................................ 6 Body of Calculation ............................................................................................................ 7 . . ................................................................................. 1.0 Contaminat~on Source 7
.................................................................................... 1.1 Contamination Data 7 . . . 1.2 Contaminant Distributions ........................................................................ 11
2.0 Modeling Release from Contaminated Concrete ...................................... 12 2.1 Overview ................................................................................................... 12 2.2 ............................................................................... Modeling Approaches 13
............................................................................... Instantaneous Release 13 Diffusion-Controlled Release ................................................................. 15 Difhsion Profiles And Their Impact On Data Collection ........................ 23
................................................ Modeling the Source Term For RESRAD 26 .................................. Matching DUST-MS and RESMD Release Rates 26
..................... Selection Of Contaminated Zone Geometry For RESRAD 28 Dilution Effects ......................................................................................... 29 Saturated Zone Kd ..................................................................................... 30
......................................................................... RESRAD Dose Modeling 30 ................................................................................................ 5.0 Conclusion 33
..................................................................................................................... Appendix A 35 Appendix B ....................................................................................................................... 37
List of Figures Figure 1 13-3 Contamination data between the Spent Fuel Pit and the Ion Exchange - Pit ................................................................................................... . . lo
...................................... Figure 2 Rotated View of H-3 levels in concrete near the SFP. 10 Figure 3 Conceptual model for diffusion release through coilcrete into porous media.. . l 6 Figure 4 FI-3 releasc rate (pCi/y) over ten years for a six-foot wall uniformly
contaminated to 1 pCi/g using a diffusion coefficient, D = 5.5E-07 cn~*/s. ............. I8 Figure 5 Modeled distributions of H-3 for 1,2.5 and 6 foot thiclc concrete segments .... 21 Figure 6 H-3 diffusion profile after one year for a one-foot thiclc wall with a uniform
initial concentration of 1 pCi/g. ................................................................................ 24 Figure 7 Cs-137 diffusion profile after one year from a one-foot thick wall with a uniform . . .
lnltlal concentration of 1 pCi/g. ................................................................................ 25 Figure 8 H-3 diffusion profile aftcr one year for a six-foot thick wall with a uniform
initial concentration of 1 pCi/g. ............................................................................... 25
List of Tables
Table 1 Dimensions of subsurface structures after removal of above grade sections. ...... 9 Table 2 Length of longest side of each facility listed in Table 1 ............................ .14 Table 3 Maximum concentration for instantaneous release and fractional release for release controlled by sorption on the backfill from concrete homogeneously contaminated to 1 pCi/g ........................................................................................................................... 15 Table 4 Concrete diffusion coefficients selected from the literature for evaluation of
release ....................................................................................................................... 17 Table 5 Average fractional release and total release from all subsurface facilities for
initial uniform contamination of 1 pCi/g in all walls and floors ............................... 19 Table 6 Average fractional release and total release from all subsurface facilities for
initial uniform contaniination of 1 pCi/g in the first inch of the walls and floors. ... 20 ....................... Table 7 Contamiilated zone geometry factors and source concentration. 3 1
Table 8 RESRAD input values changed from soil DCGL calculatiolls ........................... 32 Table 9 Peak well concentration and dose for release for all subsurface structures
uniformly contaminated to 1 pCi/g throughout the wall thickness for each radionuclide ............................................................................................................... 32
Table 10 Measured concentrations in the first inch ofthe concrete and projected dose for contamination ill the first inch at each surface and no contamination in the interior of the walls. ................................................................................................................... 33

Purpose
Yankee Atomic Energy Company (YAEC) is considering allowing portions of existing structures to remain on site at the time of license termination. Analyses of core bores talten from the Spent Fuel PitIIon Exchange Pit wall have indicated the presence of H-3, C-14, Co-60, Ni-63, Sr-90, and Cs-137 (Dannan, 2004) Release of residual radioactive contaminants, co~isisting of H-3, C-14, Co-60, Ni-63, Sr-90, and Cs-137, froin subsurface concrete structures that may be left in place at the Yankee Nuclear Power Statiou (YNPS) is the subject of this assessment. Analyses were performed to assess the rate of rclease from the concrete and the resulting dose in the groundwater pathway.
Summary of Results
A two-prong approach was taken: (I) to determine the source term from the concrete to the groundwater and (2) to determine the dose from this source term. Two mechanisms were considered in determining the source term: diffusive release from the concrete and sorption onto bacltfill and soil that surround the facilities. Diffusive release was found to be the rate-limiting step for all six radionuclides in the analysis.
Additional analyses were performed to determine the impact that contaminant distribution in the walls has on release rate. These analyses showed that for every radionuclidc except H-3 (that is, C-14, Co-60, Ni-63, Sr-90, and Cs-137), the peak release rate was only affected by the concentralion within the first inch of the wall. Therefore, the effect of having a non-uniform distribution in concentration through thc thiclmess of the wall is minimal for these radionuclides. Tritium has a higher concrete diffusion coefficieilt than the othcr radionuclides addressed. Accordingly, release of H-3 from concrete is influenced by concentrations within the first few inches of the wall.
Using a concentration of 1 pCi1g and a concrete density of 2.5 &m3. the total release to the subsurface was estimated for each radionuclide. Values for RESRAD input parameters were selected to match the release rate calculated by DUST-MS. Using the same assumptions that were used for the soil DCGL calculations, MSRAD was used to calculate the water pathway dose. Cesium-137 yielded the highest resulting dose. Estimates of the dose were made using measured data of contaminant concentrations in the first inch of concrcte.

References [Atkinson, 19861 Atltinson, A,, Nelson, K., Valentine, T.M.: "Leach test characterization of cement-based
nuclear waste forms", Nuclear and Chemical Waste Management, Vol. 6 (1986), 241 - 253.
[Crank, 19561 Crank, J., The Maihematics ofDzflusion, Oxford University Press, UK, 1956.
[Dannan, 20041, J. Darmsu~, Internal Communication, AP-083 1, "IX-Pit Sample Plan Close-Out", January 7, 2004.
[Freeze, 19791 Freeze, R.A., J.A. Cherry, Groundwater, Prentice-Hall Inc., Englewood Cliffs, NJ, 1979.
[Habayeb, 19851 Habayeb, M.A., "Carbon-14 Releases from Solidified IRN-150 Moderator Resin Wastes," Nuclear and Chemical Waste Management, Vol. 5, p. 351-357, 1985.
[Jakob, 19991 Sakob, A., F.-A. Sarott and P. Spieler, "Diffusion and sorption on hardened cement pastes - experiments and inodeling results", Paul Scherer Institute. PSI-Bericht Nr. 99-05 ISSN 1019-0643, August 1999.
[Matsuzuru, 19771 Matsuzuru, H.et.al., "Leaching behavior of Cesium-137 in cement-waste composites," Health Physics,Vol. 32. p. 529, 1977.
[Matsuzuu, 19791 Matsuzuru, H. N. Moriyama, and A. Ito, "Leaching behavior of Tritium from a Hardened Celnelit Paste," Annals of Nuclear Energy, Vol. 6, pp. 417-423, 1979.
[Seriie, 20011 Seme, J., "Selected Diffusion Coefficients for Radionuclides in Cement", personal communication. January 10,2001.
[Sullivan, 19881 Sullivan, T.M., C.R. Kempf, C.J. Suen, and S.F. Mughabghab, "Low-Level Radioactive Waste Source Term Model Development and Testing," NUREGICR-5204, BNL- NUREG-52 160, Brookhaven National Laboratory, 1988.
[Sullivan, 19931 Sullivan, T.M., "DUST: Disposal Unit Source Term -Data Input Guide," NUREGICR- 6041, BNL-NUREG-52375, Brookhaven National Laboratory, 1993.

[Szanto, 20021 Szhnt6, Zs., fi. Svingor, M. Molnir, L. Palcsu, I. Fut6, Z. Szucs. "Diffusion of 3 ~ , 9 9 ~ c , 125 36
I, Cl and 8 5 ~ r in granite, concrete and bentonite," Journal of Radioanalytical and Nuclear Chemistry, Vol. 252, No. 1 (2002) 133-138.
[YA 20041 YA-CALC-01-002-03, "Derived Concentration Guideline Levels for Soil at the Yankee Rowe Site," January 2004.
[Yu, 20011 Yu, C, A.J. Zielen, J.J. Cheng, D.J. LePoire. E. Gnanapragasam, S. Kamboj, J. Aruisli, A. Wallo 111, W.A. Williams, and 14. Peterson, "Users Manual for RESRAD Version 6," ANLIEAD-4, Argonne National Laboratory, 2001.
Method of Calculation
YNPS is undergoing decontamination and decommissioning (D&D) and, eventually, license termination. The objective for decommissioning YNPS is to reduce residual radioactivity to levels that permit release of the site for unrestricted use in accordance with the Nuclear Regulatory Cornmission's (NRC's) site releasc criteria set forth in 10CFR20, Subpart E.
Yankee Rowe has identified five structures that may partially remain at the time of license termination:
a. Primary Auxiliary Building (PAB) Primary Drain Collection Tank (PDCT) Cubicle
b. PAB Gravity Drain Tauk (GDT) Cubicle c. Spent Fuel Pit (SFP) d. Waste Disposal Building (WDB) Cubicles e. Elevator Pit
Because these partial structures may contain residual radioactivity, the possible dose attributable to these structures must be evaluated. Evaluating the dose depends on knowing the distribution of radionuclides in the remaining material and the potential mechanisms by which radionuclides in the material could reach groundwater. Therefore, this calculation addresses the potential release of radionuclide coritanlination from subsurface concrete structures and the associated dose.

Body of Calculation
1.0 Contamination Source
1.1 Contamination Data Two cores were taken from the wall between the Spent Fuel Pit (SFP) and the north compartment of the Ion Exchange Pit (IX Pit). The cores were taken at an elevation approximately 5 feet from the IX Pit floor. At this elevation, the concrete wall was exposed to contaminated water on both the SFP side and the north cornpartmelit of the IX Pit side. For the purpose of this calculation, both sides of all concrete walls are considered to be contaminated. Although in the case of thc SFPIIX Pit wall, this represents actual conditions, in other cases, only one side of the wall was exposed to contaminated water. Therefore, the assumed concentration profile represents a worst case. The SFP wall ranges in thickness from 4.5 feet at the bottom to 6 feet at the top. Removal of the wall down to an elevation of 1022'-8" is planned, and thus the thickness of the remaining portions of the wall will be less than 6 feet. I-Iowever, for conservatism, the wall will be considered to have a constant thickness of 6 feet, when evaluating potential releases.
Concentration data are available for H-3 levels in the wall around the SFP as depicted in Figures 1 and 2 (Dannan, 2004). Concentration data for other radionuclides ('3-137, Co-60, C-14, Ni-63, and Sr-90) are available from a one-inch sample talten at the interface with the SFP (Darman, 2004). Measurable levels of H-3 were found throughout the entire core of the wall between the IX Pit and the SFP. The average H-3 concentration throughout the entire thickness of the concrete wall was 25 pCilg (Dar~nan, 2004). The average within one-foot of the SFP and IX pit was greater than 50 pCi/g. Several radionuclides, including Cs-137, (20-60. Ni-63, Sr-90, and C-14, wcre found within the first inch of the interface of the wall and the SFP. Contamination levels ranged from 1075 pCi1g for Cs-137 to 0.9lpCiIg for Sr-90.
In addition, frisker data are available and provide insight on the distribution of contaminants. other than H-3, in the concrete. Frisker measurements were taken on the surfaces of one-inch segments from the core samples of the wall between the SFP and IX Pit (see Figures I and 2). Contamination levels greater than 350,000 dpmI100 cm2 were identified on the SFP-side surface of the first one-inch segment of the core (Darman, 2004). The other surface of this segment (that is, one-inch deep into the SFPIIX wall) showed less than 15,000 dpmi100 cm2-more than an order of magnitude less. On the second one-inch segment of the core, contamination levels continued to decline with a maximum value less than 3500 dpmllOO cin2. Frisker results at the far surface of the second one-inch core segment (approximately 2 inches from the SFP surface) showed background radiation levels.
Assuming a linear change in concentration between the two frisker measurements in each sample, the average concentration is one-half the value of the frislter measurement on each side of the core. Therefore, in the first inch, the average value is greater than 187,500 dpin1100 cin2 (0.5 x (350,000 + 15,000)). While in the second inch, the average

value is less than 1800 dpml100 cm2 (0.5 x (3500 + background, which is assumed to be less than 100 dpmll00 cm2). This suggests that more than 98% of the activity (1 00 x 187,500/(187,500 + 1800)) is within the first inch of concrete, with the remainder in the second inch. Although frisker measurements do not reoresent the contamination levels of a particular radionuclide, the previously described distribution of contamination is assuned to be representative of each of the radionuclides under consideration with the exception of H-3 (e.g., Cs-137, Co-60, C-14, Ni-63, and 9-90), Figures 1 and 2 (Darman, 2004) show the measured H-3 contamination data obtained from the cores in the SFPIIX Pit wall.
To calculate the magnitude of the source, the maximum potential volume of contaminated concrete is also needed. Dimensions of the walls for facilities that may be left in silu are shown in Table 1. To estimate the mass of colicrete, the density of concrete is needed. Since a site-specific value is not known, a conservative density of 2.5 g/cm"or the concrete has been assumed.

Table 1 Dimensions of subsurface structures after removal of above grade sections.
1 I I 1
*References for wall dimensions are provided in Appendix A.

Figure 1 H-3 Contamination data between the Spent Fuel Pit and the Ion Exchange Pit
01-01-01 25.7 pCi/g
Depth illto
Wall H-3 pCi/g
01-02-1 1 7.3 pCi/g
North
SFP Depth into
H-3 pCi1g Wall
1r
IX Pit
SFP-CB-0 1 SFP-CB-02 TX Pit
Figure 2 Rotated View of H-3 levels in concrete near the SFP.
SFP
p - ~ ~ ~ ~
~ ~ ~~
~
-
-- ~-
~
~ ~ -~~
0 42.8
30" 7.3-~~ ~
0" 25.7--~-
02-01 -01 49.9 pCilg
02-02-1 2 6.8 pCi1g
.- , ~ -~~ ~dv
T.. < ~ . 3
- .?.
1:
'1:' -~ ~ ~
~
04>%7- ~ - 04 -
03
-
02
- 01
. ,
03
- '.
02
-
01
/ i +: ,
I
i -60" Thick
Concrete Wall
1
v
~ ~ ~ ~ p p ~ p
-~ ----
.< ~ ~~~ --~p
\
"-~-~~

The total volume and mass of the floors and walls in Table 1 are 410 m3 and 1.02E+09 g (1.02E+06 kg), respectively. From Table 1, approximately 300 n13 (the sum of the volumes of tlie four SFP walls plus floor) of the total 410 m3 of concrete is associated with the SFP, and thus the SFP contributes more than 73% of the total volume of contaminated concrete.
As indicated by frisker data from the SFPIIX Pit wall, radionuclides such as (2-14, Co-60, Ni-63, Sr-90, and Cs-137 are mainly present within the first inch of concrete. Thus, to determine the magnitude ofthe source associated with these radionuclides, thc volume and mass of this portion of the concrete is needed. As indicated in Table 1, the voluine that represents this portion oTwalls is approximately 25 m3, and the mass of this portion is 6.17E+07 g (6.17E+04 kg). The ratio of this poition of the wall volume to the total wall volume is 0.06. This value will be used when calculating the amount of contamination released from the first inch of concrete.
1.2 Contaminant Distributions
For evaluating diffusion releases, two profiles were considered for all radionuclides:
a) Uniform throughout the entire width of the wall b) Non-uniform based on ineasured data.
For the uniform distribution model, the source estimatc is normalized to an initial concentration of 1 pCi/g
For the model addrcssing non-uniform distributions of contaminants, tlie peak concentration is normalized to 1 pCiig, and both surfaces are assumed to be contaminated symmetrically about the centerline of the wall. Two lion-uniform distribution were devcloped-the first for H-3 and a second for radionuclides other than H-3 (that is, C-14, Co-60, Ni-63, Sr-90, and Cs-137). The first distribution is that displayed in Figures 1 and 2 for H-3. The second distribution assumes that all of the contamination is within the first inch of concrete. For the second distribution, a homogeneous distribution of 1 pCi1g is assumed in that first inch of wall thickness.
Using an initial concentratioii of 1 pCi1g siinplifies the calculation of thc actual annual releases and subsequent doses. Subsequently, a calculation is made by scaling the results for I pCi/g by the actual ineasured values.

2.0 Modeling Rclease from Contaminated Concrete
2.1 Overview
The coilcreie will eventually release radionuclides to the surrounding backfill and these radionuclides will undergo sorption during their movement through the backfill to a receptor (e.g., drinking water and irrigation) well. Therefore, the radionuclide concei~tration in the well is a function of the release rate from the concrete and the transport to the well. Three models were considered:
The first model assumes that the concrete releases the entire inventory instantly and the well concentration is controlled by sorption in the backfill. This may be reasoilable for radionuclides that have high sorption coefficieilts.
The second model examines assumes that release is controlled by the concrete and that everything released from the concrete gets to the well instantly. This is a reasonable assumptioil for radionuclides that do not exhibit much sorption on the backfill or that are released slowly from the concrete.
The third model assumes that whatever is released through the concrete must be transported to a well. This conceptual approach considers release and transport, whereas the first two consider only release.
All three of these approaches will be considered where appropriate. The results of the first two models, sorption-controlled and diffusion-controlled rclease, will be compared and the approach that has the lowest release rates will be used to calculate release rate information needed for RESRAD simulations. The lowest release rate is used because both of these processes (release from the concrete and transport to the well) need to occur before contaminants can reach a well. Thereforc, the rate-limiting step is the process with the lowest release rate.
An important outcome of modeling diffusion-controlled releases is the identification of a diffusion profile that can be used to help develop characterization data needs. An analysis of these diffusion profiles is presented in Section 2.2.5.

2.2 Modeling Approaches 2.2.1 Instantaneous Release
Using the mass from Table 1 of 1.02E+09 g, the concrete would contain 1.02E+09 pCi if the walls were homogeneously contan~iclated to 1 pCi/g. Assuming instantaneous equilibrium with thc backfill and the water, the concentration in the contaminated zone, C,,, can be calculated from the following equation (Yu, 2001):
Where:
M, = activity released, 1.02E+09 pCi A = area perpendicular to flow in the contaminated zone (m2) T = thickness parallel to flow in the contaminated zone (m) p =lo00 conversion factor for m3 to liters Rd = retardation coefficient = 1 +pKd/v (dimensionless) p = bullc density = 1.5 1 g/cm3 Kd = distribution coefficie~~t (cm3/g)
7 = saturated zone porosity = 0.43 (dimensionless)
The specified parameter values for bulk density and porosity were those values used in dose assessments performed using RESRAD for soil contamination at Yankee Rowe (YA 2004).
In calculating the area perpendicular to flow, all five remaining structures were assumed to be oriented in the direction of groundwater flow for conservatism. This orientation provides the least amount of water flow through the concrete and, therefore, results in the lowest amount of dilution. Considering the information in Table 1 and selecting the longest side of each facility (l,), this length, L, can be calculated:
Table 2 contains the value of 1, for each building, the wall thickness for the two conlining walls of that building, and the value of L. Length of longest sides for each facility in Table 1.

Table 2 Length of longest sides for each facility in Table 1.
Location
PAB PDCT PAB GDT
This total length, L, is the sunlmation of the longest sides of each structure, and is equal to 26.7 In, the length that will be backfillcd. Using this value for the length and using the total volume of the walls given in Table 1,410 m3, the area perpendicular to flow is 15.4 m2.
11 (ft) Wall One Thickness
In order for a comparison with the diffusion release model to be made, the fraction of the total inventory that is captured by the well must be determined. Assuming that depletion effects are not important unless the total inventory is released, the total inventoly delivered to the well within the first year, which is equivalent to the release rate, can be calculated from (Yu, 2001),
Wall Two Thickness
15.50 15.50
SFP WDB Cubicles Elevator Pit L (total in ft) L (total in m)
I, = C,, x Vd x A x P (pCi1y) (3)
33.67 14.00 9.00 87.67 26.7
6 1
1.08 10.83 3.3
Where:
(ft) 1.75
1 6 1
1.08 10.08 3.07
C,, =the concentration in the contaminated zone (pCill) Vd = Darcy Velocity in the saturated zone = K,,*H ~250 .6 mly
When H = hydraulic gradient = 0.1 mlm, (YA, 2004); and K,, = the saturated hydraulic conductivity in the saturated zone =2506 m/y (YA, 2004)
A = area perpendicular to flow in the contaminated zone (m2) p =I000 conversion factor for m3 to liters
(ft) 1 1
If I , exceeds the total inventory available for release, it is liinited to the total inventory.
Table 3 presents the contaminated zone concentration, total and fractional relcase results for the above parameters.

Table 3 Maximum concentration for instantaneous release and fractional release for release controlled by sorption od the backfill from concrete homogeneously contaminated to 1 pCi/g.
* Mean values used in Yankee Rdwe assessment for soil DCGLs (YA, 2004). ** Value in contaminated zone. depletion would occur in less than 1 year. Therefore, the average concentration in the well, which can be calculated as the inventory (pCi) divided by the voluinetric flow raik (Ily), is 230 pCi/l for tlie year. This is less than the contaminated zone value.
If the contamination is limited to the first inch of concrete, the associated inventory would be 0.06 of the inventory of the full wall contamination. and the inventory released would decrease similarly. Thus, the fractional release would remain the sanle.
Fractional Release in the first
2.2.2 Diffusion-Controlled Release
Radionuclide
Previous estilnates of release rates assumed that the entire inventory was instantaneously released from the concrete into the contacting water. This is a very conservative assumption, as there are several stQdies that show that release from concrete is not instantaneous but is controlled by diffusion or solubility (Sullivan, 1993). Therefore, a more realistic conceptual model fdr estimating release from tlie coiitaminated concrete assumes that diffusion is the rate-controlling mechanism. A one-dimensional finite difference inodel was set up to reptesent the system as shown in Figure 3. The DUST- MS code was used to perform the analysis (Sullivan, 1993).
Contaminated zone concentration**
(C,, pCiIl, Eqn (1))
Kd* (cmJig)
Diffusion coefficients of ions in phre water are generally around 1 .OE-05 cm2/s (Freeze, 1979). In porous media, such as sdil, the effective diffusion coefficient is much slnaller than in pure water because of the lbnger paths caused by particles in the porous media. For a wide range of ions in porousinedia, reductions by a factor of 0.5 to 0.01 are frequently observed (Freeze, 1979). I11 the porous medialwater regions surrounding the concrete, the diffusion coefficient has set to 1.OE-06 cm2/s (Freeze, 1979) to provide rapid transport away from the co~icrete and thereby enhance the predicted rate of release. This value is in the middle oftlie range of observed values (Freeze, 1979). The diffusion coefficient of each radionuclide inthe concrete is discussed later.
Release rate ( 1 C y
Eqn (2))

Porous Media / Water
I
Concrete - 1-6 ft Porous Medial
Figure 3 Conceptual model for diffusion release through concrete into porous media
For large computational cells sizes, finite difference models are known to over-predict diffusion releases at boundaries having sharp changes in diffusion coefficients. To overcome this, the concrete was modeled with 300 computational cells. All simulations used a 0.01 cm cell for the first 50 and last 50 cells. The cell size for the internal 200 computational volumes was adjusted to match the desired distance. For example, for a one-foot thick wall (30.48 cm), there were 50 cells of 0.01 cm, 200 cells of 0.1474 cm, and 50 cells of 0.01 cm for a total thickness of 30.48 cm and a total of 300 cells.
Thc non-homogeneous distribution for H-3 was modeled using the data in Figure 2. A non-homogeneous distribution for the remaining nuclides used a uniform concentration in concrete within the first inch of both wall surfaces and zero concentration in the remaining thickness of concrete.
Contamination is assumed to exist in the walls and floors of the five structures listed in Table 1. Table 1 contains seven different thicknesses (1 ft, 1.08 ft, 1.17 ft, 1.75 ft, 2.5 ft, 3 ft, and 6 ft.) and release calculations were performed for each thickness. Release rate estimates were calculated using the one-dimensional finite differencc computer code, DUST-MS (results for each wall and floor in the five buildings are presented in Appendix B, and summarized in Table 4). Release from the concrete is assumed to be controlled by diffusion. The initial distribution of contaminants was assumed to be a uniform concentration of 1 pCi/g.
2.2.2.1 Experimental Diffusion Coefficients
Studies have been conducted for the diffusion in concrete of the radionuclides under consideration at YNPS (H-3, C-14, Co-60, Ni-63, Sr-90, and Cs-137). In general of these radionuclides, 1-1-3 diffuses the fastest and C-14 diffuses at the slowest rate. Literature values for H-3 diffusion range from 6.0E-09 cm2/s to 5.5E-07 cm2/s (Matsuzuro, 1976; Serne, 2001; Szanto, 2002). For the purposes of analysis, a diffusion coefficient (D,) of 5.5E-07 cm2/s will be used as the base case. This is the highest value and will provide an upper bound on diffusive releases.
Diffusion coefficients in concrete for Cs-137 range from 4.0E-11 cm2/s to 3.0E-09 cm2/s (Atkinson, 1986). Diffusion coefficients for Co-60 range from 5.0E-12 cm2/s to 4.OE-11 cm2/s (Muurinen, 1983). Diffusion coefficients for Sr-90 range from

1 .OE-11 cm2/s to 5.2E-10 cm2/s in Portland cement (Sullivan, 1988). Diffusion coefficients for Ni-63 range from 8.7E-10 cm2/s to 1.1E-09 cm2/s in concrete (Jakob, 1999). An average diffusion coefficient for Ni-63 in concrete is given as 5.0E-10 cm2/s (Serne, 2001). Although higher values have been found for many of thesc radionuclides in different concretes eilcapsulatiilg radioactive wastes, these values are not relevant to this situation, as the radioactivity in the wastes is known to degrade concrete performance (Sullivan, 1988) and thus are not representative of the concrete at YNPS. The highest value in each of the ranges was used in inodeliiig releases from the concrete.
In the chemical environment associated with concrete, carbon is not readily transported through the concrete because carboil will form carbonates. Experiments have cstimated diffusion coefficients based on leaching data. The estimated diffusion coefficie~~t values range from 7.OE-15 cm2/s to 1 .OE-12 cm2/s (Habeyab, 1985: Serne, 2001). These values suggest that C-14 is not mobile in concrete systems. For this study, a value 1.OE-12 cm2/s was used. This will provide an upper bound estimate of C-14 releases.
Table 4 summarizes the values selected for modeling diffusion from concrete.
2.2.2.2 Predicted Release Rates And Cumulative Release For Homogeneously Contaminated Walls
Table 4 Concrete diffusion cocfficients selected from the literature for evaluation of release
Figure 4 presents the release rate for H-3 in pCiIy over a ten-year period from a six-root thick wall initially contaminated unifoinlly to 1 pCi/g. Other radionuclides had similar release curves but at lower magnitudes due to their lower diffusion coefficients. Thc release rate in Figure 4 declines rapidly bctwecn years 1 and 2 due to the high initial leach rate caused by the sharp gradient. For this reason, the first year release rate, which is the maximum, is used in developing a source term for RESRAD calculations. In general, the release rate from a solid source that maintains the external boundary at zero coi~centraiion is greatest initially and decreases by the square root of time adjusted for decay until depletion effects occur (Crank, 1956). The general trend of decreasing release rates over time is evident in Figure 4.
Radionuclide
H-3 C-14
CO-60 Ni-63 Sr-90
(3-137
Diffusion Coefficient (cm2/s)
5.5E-07 1.OE-12 4.OE-11 1.1E-09 5.2E-10 3.OE-09

0 2 4 6 8 10 Time (years)
Figure 4 H-3 release rate (pCi/y) over ten years for a six-foot thick wall uniformly contaminated to 1 pCi/g using a diffusion coefficient, D = 5.5E-07 cm2/s.
Appendix B presents the first year fractional rclease rate and total annual release rate froin each wall and floor in the fivc subsurface facilities for H-3, Cs-137, Co-60, Sr-90, C-14, and Ni-63. The last row oltliese tablcs presents the averagc fractional release from the entire facility and the total release (Ci). The average fractional release is the total release divided by the total inventory. Thus, it is most heavily weighted by the facilities with the largest volume of concrete which in this case is the SFP. The fractional release rate is the percentage of the total inventory that is released. The total release rate is the peak annual release rate (City) for concrete uniformly contaminated to 1 pCiIg. Table 5 summarizes the results and is the summation of releases from all walls and floors.

Table 5 Average fractional release and total release from all subsurface facilities for initial uniform contamination of 1 pCi/g in all walls and floors.
I Radionuclide Average fractional release 1 Peak Release Rate I
Con~paring the results from Table 3 and 5 for peak release rates, it is seen that the release rates for each radionuclide are lower in the diffusion-controlled transport model t11an in the sorption-limited transport model. This implies that release to the wells cannot be faster than the rate supplied by diffusion from the concrete. The reason that diffusion is rate-controlling is due primarily to the high flow velocity in the saturated zone that leads to more than 4E+06 liters of water per year passing through the contaminated zone. This high flow rate is effective in "flushing" the system in the sorption-limited case leading to higher predicted releases than for diffusion-controlled transport. Therefore, the diffusion-controlled release rates in Table 5 are used for developing parameters for RESRAD to calculate dose.
As shown in the tables in Appendix B the pealc release rate per unit surface area is relalively constant for the diffusion model. This implies that it is the amount of surface area that is critical to estimating release. Most of the contamination released within the first year resides within one inch of the surface; therefore, having a thicker wall with uniform contamination does not impact the amount of contamination released.
2.2.2.3 Predicted Release Rates For Walls Contaminated Uniformly For The First Inch
Characterization data indicate that for C-14, Co-60, Ni-63, Sr-90, and Cs-137 the contamination is confined within two inches of the surface and 98% of the inventory is within 1 inch of the surface. This is consistent with lower diffusion rates of these contaminants into the concrete as compared to that of H-3, which shows a much larger spatial distribution of conlaminants. Calculations were performed for each wall thicknes3 and cach radionuclide having a uniformly contaminated zone of one inch thickness. In these models, the outer inch had contamination of 1 pCi/g while the intcrior section had a concentration of 0 pCiJg.
Comparing Tables 5 and 6, the predicted maximum release rates are nearly identical for all radionuclides except for H-3. This indicates all of the release is constrained to contamination residing within 1 inch of ihe wall for eve~ything except H-3. Also supporting this conclusio~~ is that on average for all of the wall thicknesses, although the volumc of the wall within 1 inch of the surface is 0.06 of the total wall volume, the

fraction of these radionuclides released is much less than 0.06 of the total inventory of these radionuclides contained within the total wall thickness.
For the case assuming 1-inch thickness of contamination, the predicted total release of H-3 in the first year is approxin~ately one-half(46%) the amount predicted when contamination is assumed throughout the entire wall. However, this distribution is not appropriate for H-3 as it is lu~own that H-3 is not confined to the first inch of concretc, as seen in Figures 1 and 2.
Table 6 Average fractional release and total release from all subsurface facilities initial uniform contamination of 1 pCi/g in the first inch of the walls and floors.
I Radionuclide I Average fractional release / Peak Release Rate 1
for
2.2.2.4 Predicted Release Rates For Spatially Varying Initial Conditions
The preceding analysis suggests that releases from the concrete due to spatial variability in concentration will not influence the peak release rate for any radionuclide other than EI-3 unless the variability occurs ovcr the first inch. To exarninc the impact of spatial variability on release of H-3, the data presented in Figures 1 and 2 were used to generate the distributions shown in Figure 5. Figure 5 contains a unique c w e for each of the 3 wall thicknesses. In all cases, symmetry is assumed about the centerline of the wall. The distributions for all three thicknesses are similar Tor the first six inches as this contains only measured data. After six inches, the concentration for the one-foot thick wall decreases more slowly than for the thicker walls. This is due to the measured concentrations, Figure 2, and assumed symmetry about the mid-plane of each wall, . Thc symmetry assumption for the one-foot wall requircs the concentration at 12 inches to equal to the surface concentration. The surface concentration is higher than the measured concentration at 12 inches. The second curve is the concentration distribution for the 2.5-foot thick wall. It is identical to that of the 6-foot thick wall for the first 1.25 feet. After that, the concentrations used to simulate the 2.5 feet wall increase due to symmetry. The third curve is for the 6-foot thick wall and is based on the data in Figures 1 and 2. In these simulations, the concentrations are normalized to the peak value, which is set to 1 pCiJg. Therefore, there is less total mass in the system as comparcd to the homogeneous distribution of 1 pCi1g throughout the wall thickness. The concentration in the first inch of the wall in the non-homogeneous distribution case is 59% of the peak valuc.

Simulations were made for 1,2.5, and 6 foot thick walls. In each case, the peak release rate occurrcd in the first year and was between 820 pCi/y - 830 pCi/y. This suggests that even for H-3, the first year's release is controlled by the distribution in the first six inches. The non-homogeneous distribution rclease rate is 65% of the value obtained for the l~omogeneous case, which had a peak release rate of 1270 pCi/y. The average concentration in the first six inches of the non-homogeneous case is 0.67 pCi/g. This suggests that the release is approximately proportional to the total mass available, or average concentration, in the first six inches.
I 0 ..................................................................... 8 0
0 10 20 30 40 50 60 70
Depth
Figure 5 Modeled distributions of H-3 for 1,2.5 and 6 foot thick concrete segments
2.2.2.5 Predicted Well Concentrations As A Function Of Transport Distance
The most coinplete inodeling approach is to use the predicted diffusio~l release rates as a flux to thc bacltfill and then calculate transport through the backfill as a function of distance. These calculations are presented to obtain an estimate of the impacts of transport after release. However, they will not be used in estimating releases for RESRAD as discussed later. The maximum distance to a well would be one-half the distance ofthe hypothetical length of the contaminated zone parallel to the aquifer (26.7 m). The simulations used the mean Kd values (Table 2) and saturated zone properties used in thc Yankee Rowe analysis for soil contamination. The source was assumed to decrease only due to radioactive decay. For a homogeneous distribution of contaminants

in the source zone and diffusion-controlled release, the decrease in the source will always be greater than for decay alone.
The modeling results showed essentially no decrease in concentration for H-3, C-14, and Sr-90 at a distance of 13.3 m. This is due to the lower Kd values and high flow velocity. These contaminants are moving several to hundreds of meters per year, and there is no time for decay prior to reaching the well.
The three remaining radionuclides (Ni-63, Co-60, and Cs-137) are moving less than 1 niiy due to sorption and undergo decay prior to reaching the monitoring point. Co-60 showed an order of magnitude decrease in peak concentration between the wall and a monitoring point approximately 13 meters downstream. Cs-137 and Ni-63 peak concentrations decreased by a factor of 5 and 2, respectively, over this distance. The decrease in concentration is correlated with the half-life of the radionuclide, duration of the sourcc, and the distribution coefficient.
Due to the complexity of picking an appropriate geometry and distance to a receptor well that is representative of the five subsurface structures and the fact that the peak concentration does not change substantially for most radionuclides, this approach will not be used to estimate source term concentrations in RESRAD calculations.
2.2.2.6 Discussion
Modeling was performed to asscss whether it is sorption on the backfill or diffusion from the concrete that controls the rate of radionuclide release. The results indicate that diffusion is the rate controlling mechanism for all radionuclides in this study.
A series of diffusion calculations were performed to examine the affects of contaminant spatial distribution in the walls and to examine the impacts of wall thickness on peak release rates. The wall thickness did not impact the total release rate. Analysis showed that for all radionuclides, except H-3, diffusion release was controlled by the first inch of contaminated concrete. In fact, in simulations, the predicted peak release did not differ for a concrete wall with a one-inch thick contaminated zone at the surface versus a wall that was uniformly contaminated. For 1-1-3, the distribution of contamination did make a difference. The peak release rate for the non-homogeneous case was reduced by the ratio of the inventory in the first six inches of the wall for the non-homogeneous case to that in the wall for the holnogeneous case.
Modeling of the inputs of sorption after release was investigated but is not used in the determination of source term and dose.
The analyses suggest that the impacts of a non-uniform contanlinant distribution are minimal for every radionuclide except H-3. For H-3 lower releases did occur, but this was primarily due to less mass available for release with the non-homogeneous distribution. For this reason, the values obtained for a homogeneous distribution of

contaminants throughout the wall thickness, Table 5, are used as the basis for calculating the source term for use in RESRAD.
2.2.3 Diffusion Profiles And Their Impact On Data Collection
It is important to detennine what characterization data are necessary in order to calculate peak release rates in a system where these rates are controlled by diffusio~s. To address this consideration, modeling was performed for diffusion releases with a uniform initial concentration of 1 pCi/g throughout the wall. Profiles were generated for 1 and 6-foot thick walls for H-3 and Cs-137. Previous results demonstrated that for a uniform initial concentration, the peak release occurs in the first ycar (Figure 4). Therecore, the diffusion profiles in the concrete arter 1 year will provide guidance about the depth of the diffusion front, and therefore, the depth to which characterization information is required.
Figure 6 prcsents the diffusion profile for H-3 in a one-foot thick wall. The figure displays concentration versus depth from the surface up to 6 inches. Symmetry is assumed about ihe midpoint (6 inches) due to the uniform initial conditioil in the concrete. Examining the figure, the boundary concentration dropped from 1 pCi/g initially to 0.4 pCi1g. From the surface, the concentration incrcases gradually reaching a maximum of 0.93 pCi/g after 4 or 5 inches. The concentration remains constant from this point until the 6 inch distance. The drop from 1 pCi1g to 0.93 pCi1g represents radioactive decay over the timc step.
Figurc 7 presents a similar diffusion profile for Cs-137 in a 1-foot thick wall. In this case, the surface concentration decreases to less than 0.03 pCi/g and rises to almost 1 pCi/g over the first % inch. After this, the concentration remains constant to the 6 inches represented in the graph. Radioactive decay for Cs-137 over one-year reduces the initial concentration of 1 pCi1g to 0.975 pCilg in the central core ofthe concrete after one year.
Figure 7 shows that most of the release for Cs-137 comes from within the first % inch of the surface. The frisker data suggest that the concentration is not homogeneous in the first inch of the concrete and that it may decrease by a factor of 10 or more between the surfacc and one-inch into the concrete. In this case, using thc assumption of a homogeneous distribution over the one-inch section will be non-conservative. Assuming that the decrease in concentration is linear it czus be shown that the surface concentration can not exceed twice the average concentration. Therefore, the use of a homogeneous distribution may lead to an underestimate by approximately a factor of 2.
Figure 8 presents the diffusion profile for H-3 in a six-foot thick wall. The graph displays the concentration from the surface to the midpoint olthe wall at 36 inches. The results are almost identical to those from the one-foot wall (Figure 6).
As shown in Figures 6 and 8, if 13-3 contamination is not within the first four or five inches of the surface, it will not contribute to the peak release that occurs in the first year. Therefore, characterization data at deeper depths are not as important in determining

dose. As sl~own in Figure 7, if Cs-137 contamination does not reside within the first inch, it will not impact the peak release. This is because Cs-137 has the highest diffusion coefficient of all of the contaminants nlodeled, with the exceptio~i of H-3.
~-
~ ~~ ~ - - ~ - ~ ~ ~~~~~ ~ ~ ~~~ ~ -
Initial condition 1 pCi/g at all locations. - ~ ~~ ~
Wall thickness 12 inches Symmfiff-~ ~- -------- ~
~~ occurs~about-the-midplane at 6 inches. - - ~
~~ ~~ ~~ ---- ~~~
~ ~ ~~ ~~ ------ ~-
-~ ~ ~ - ~~- ~~~~-~ ~~ ~ -
! 0.0 r-
0 1 2 3 4 5 6
Distance (inches)
Figure 6 H-3 diffusion profile after one year for a one-foot thick wall with a uniform initial concentration of 1 pCi/g.

L 0.7 - ~~~~- ~ - - ~ ~ - ~ - ~ ~
- .~ Initial ~-~ condition ipCilga1 all !ociation_s_. ~ ---
C o Wall thickness 12 inches. Symmetry 9 0.5 occurs aboutthe midplane~atV3 inches;-- ~~.~~~ ~~~~
e ~ ~~ - - ~ ~
0
0.3 ~- ~ ~ ---- ~
0.0 C-- .- 0 1 2 3 4 5 6
Distance (inches)
Figure 7 Cs-137 diffusion profile after one year from a one-foot thick wall with a uniform initial concentration of 1 pCi/g.
~ ~~~ . ~ -
s Initial condition 1 pCi/g at all locations. . W a ll~tAEknesS72~inc hFs; Symet ry~~- -~~~ b _ occurs about the midplane-at36 inchs.
0.0 ~L 0 5 10 15 20 25 30 35
Distance (inches)
Figure 8 H-3 diffusion profile after one year for a six-foot thick wall with a uniform initial concentration of 1 pCi/g.

The preceding conclusions are based on a uniform distribution of contaminants. If the concentrations within the concrete vary greatly from the assumed distribution, these conclusions inay not be valid. If the non-uniform distribution was substantially different from the measured values shown in Figures 1 and 2 (for example, pe& conccntsation in the interior is 10 times the surface concentration) it is conceivable that the peak release could be higher than for the uniform case. However, this is not likely as thc data suggcst that H-3 diffuses relatively rapidly througl~ concrete and this would tend to s~nooth out any large differences in concentration.
3.0 Modeling the Source Term For RESRAD
The modeling performed above suggests that the concrete mil l control release. However, RESRAD assumes that ihe source is controlled by the sorption properties of thc contaminated zone. This conceptual model differences require adjustments to be made in the release rate parameter values to in&e the calculations in RESRAD match the desired release rates from DUST. In addition, RESRAD assumes that the contaminated zone is above the water table, whereas in this case, it is assumed to be in the water table. This requires adjustment of the parameters used in the soil DCGL analysis (YA, 2004).
3.1 Matclting DUST-MS and RESRAD Release Rates
The release model from DUST-MS does not match that found in RESRAD. Therefore, a method to make the DUST-MS predicted release consistent with that of RESRAD is needed. This is accomplished by examining the release equatioiis in RESRAD and choosing a release rate parameter, Kd, that guarantees the desired release rate is used in RESRAD. The following equations describe 110w this is accomplished. RESRAD assumes that release is controlled by the following equation (Yu, 2001),
Where:
R(t) = the time-dependent release rate (pCi/y) L(t) = the leach rate (l/y) for the contaminant pb = the bulk density of the source zone (kg/m3) A = the area of the contaminated zone (m2) T = the thickness of the contaminated zone (m) S(t) = the average concentration of the radionuclide available for leaching @Ci/kg)
The desired leach rate is the valuc calculated by DUST-MS for each different wall thickness. The RESRAD Leach Rate, L (t), is calculated from the following expression (Yu, 2001),

I = infiltration rate (inly) 0 =moisture content in the conlamii~ated zone Rdcr = retardation coefficient in the contaminated zone (dimensionless)
The moisture content in RESRAD is calculated from the following expression (Yu, 2001).
Where:
q = porosity of the contaminated zone (dimensionless) I = infiltration rate (mly) KSat = saturated hydraulic conductivity of the contaminated zone (mly) b = empirical 'b' parameter depending on soil type (0.975 from [YA, 20041)
The infiltration rate is calculated as a function of precipitation, irrigation, evapotranspiration coefficient, and run-off from the following (Yu, 2001)
I = (1-Ce)((l-Cr)Pr + Ir) (7)
Where:
Ce = evapotranspiration coefficient = 0.625 (YA, 2004) Cr = run-off coefficient = 0.6 (YA, 2004) Pr = annual precipitation = 1.2 mly (YA, 20041, and Jr = irrigation rate = 0.435 mly (YA, 2004)
Using the above values, the infiltration rate is calculated to be 0.34 d y .
The rctardation coefficient is represented by the equation
Where:
Kd = distribution coefficient (in3/kg)
The geometry of the contaminated zone is determined by the dimeilsions of the subsurface structures. Therefore, the best way to match the release rate from DUST-MS and RESRAD is to adjust the distribution coefficient. Substituting the expressions into the equation for release rate one obtains the following:

Assuming that the thickness of the unsaturated zone does not change and using the expression for Rdcz yields
Solvillg for Kd yields:
Using an initial concentration of 1 pCi/g in the contaminated zone, the area of the source zonc and the leach rate R(t) calculated from DUST-MS; the appropriate value for the contaminated zone Kd was calculated and used in RESRAD. Calculated contamination zone Ka values are presented after the discussion of RESRAD dose calculations.
3.2 Selection Of Contaminated Zone Geometry For RESRAD
RESRAD treats the source of contamination as a single region. Therefore, for modeling purposes, the different building structures are lumped together in a single source. RESRAD requires three parameters to define the geometry of the contaminated zone: area, thiclmess, and length parallel to aquifer flow. Previously, in the section that calculates instantaneous relcase, the geometry was defined for the backfill region within the walls of the subsurface structure. This is not appropriate for defining a source zone co~nposed of the walls and floors of the buildings and therefore, different geometry parameters are calculated for this case.
The most conservativc assumption is that all of the facilities are lined up with the longest dimensio~l in the direction of flow. Including the wall thickness and length in Table 2, the distance parallel to flow is 33.1 ~n (26.7 m + 3.3m + 3.07m). The area of the source zone is calculated as the area of the floors plus the area of the walls in the plane of the floors. This was calculated by adding the wall thickness to the widths of the walls in Table 1 and summing for all facilities. The area obtained using this procedure is 143.5 m2. The volume of the contaminated structures is 410 m3 (Table 1). Thc effective height of the contaminated zone is obtained by dividing the volu~ne of the contaminated structures by the area. This procedure results in an effective lleight of 2.86 m. These values are slightly different than in Section 2.2.2.5 due to the differences in conceptual models. In Section 2.2.2.5, the effects of sorption were examined and the conservative assumption was that the shortest distance between the source and the receptor well was the sum of the lengths of the buildings parallel to flow. In this section, the more conservative assumption is to use the total length parallel to tlow, which includes the thickness of the walls. Due to the selection of the mass balance model in RESRAD, which places all of the rcleased mass into the receptor well, this difference in distance does not sigllificantly impact results.

3.3 Dilution Effects RESRkD allows a choice between two models for examining dilution effects that occur when the flow from the unsaturated zone enters the saturated zone. The first is the mass balance model and the second is the non-dispersion model. YNPS selected the non- dispersion model when calculating soil derived concentration guideline limits (DCGLs).
The mass balance model is independent of the radionuclide and assumes that the entire source released from the contaminated zone enters thc well. Dilution occurs if the amount of water passing through the contaminated zone is less than the well pumping volume. Numerically, the dilution factor, F is expressed as:
Where:
I = thc infiltration rate (mly), A = area of the contaminated zone perpendicular to inliltration (m2), and U, = the well pumping rate (m3/y)
However, when the source is in the saturated zone, the proper values for the dilution expression are the aquifer flow through the source and the area perpendicular to flow.
Using the parameter values used in the soil DCGL analysis, the site-specific infiltration rate was calculated from the input parametcrs to be 0.34 m/y (Section 4.1) and the area of contaminated structures to he 143.5 m2 (Section 4.2). The flow through the facility as calculated by RESRAD is the product of the infiltration rate and cross-sectional area and equals 48.8 m31y. The pumping rate used in previous analyses (YA, 2004) is 1323 m31y. Therefore, using Eqn. 12, the RESRAD calculated dilution factor would be 0.037. In contrast, the saturated zone flow rate is 250.6 mly and the area perpendicular to flow is 12.3 m2. Thus, the amount of water flowing through the contaminated zone in the conceptual model used in this analysis is 3085 m31y, not 48.8 Since the actual flow rate (3085 mily) exceeds the pumping rate (1323 m31y), the dilution factor should be set to 1.
I l thc assumption that the entire inventory is placed uniformly in the water flowing past the contaminated zone in the aquifer is used, the dilution factor calculated by RESRAD needs to be manipulated by proper choice of input parametcrs. RESRAD calculates the concentration leaving the contaminated zone, C,,, as the release rate divided by the water volume.
R = the release rate (City)

The well concentration in the absence of an unsaturated zone is the concentratio11 in the contaniinated zone multiplied by the dilution factor.
To make the well concentration equal to the value that is appropriate for a contaminated zone in the saturated zone, U, must be set to the volume of water that flows through the contaminated zone, 3085 n131y. This value is used in the RESRAD simulations for well pumping rate in thc concrete analysis.
The dilution factor for the non-dispersion iuodel depends on aquifer flow and geometrical arguments that are not applicable for a source in the sat~uated zone. Therefore, this model is not recommended for this application. I11 addition, the RESRAD manual states that the non-dispersion model should not bc used for source zones less than 1000 m2 due to geometrical assumptions that are not appropriate for a small contamination zone. Thus use of the Mass Balance method is appropriate.
3.4 Saturated Zone Kd
The source is located in the saturated zone and therefore, further dilution, by accounting for the distributioil coefficient, is not warranted. Conceptually, this is equivalent to taking the release inventory and in~inediatcly placing it in the well. For the first set of model calculations, a Kd of 0 is used in the contaminated zone.
This is conservative. However, the modeling in the previous section indicates that dilution will not be important for radionuclides (H-3, C-14, and Sr-90) that move relatively fast in the soil and will lead to no more than a factor of 10 decrease in concentration for the other radionuclides in the simulation (Co-60, N-63, and Cs-137). In addition, due to the location of the source zone in the saturated zone and the models in RESRAD. it is difficult to calculate the travel froin the source, illrough clean fill, to the well.
4.0 RESRAD Dose Modeling
Using the release rates calculated by DUST-MS and the above assumptions pertaining to geometry (area and volume), well pump rate, zero Kd in the saturated zone, and distribution coefficient in the contaminated zone, RESRAD was used in the deterministic mode to calculate peak dose.
A few parameter values used in the analysis are different than those used by YNPS in calculating soil DCGLs (YA, 2004). These were changed to fit the conditions being simulated for release controlled by diffusion from concrete in the saturated zone.
In calculating soil DCGLs, the cover thickness is zero. However, in this analysis, the depth to the water table will be at least 2 feet and, because of the assumption that the source is in the aquifer, a cover thickness of 2 feet (0.6 m) is used. In the soil DCGLs.

the depth for root penetration was 1.17 m and the unsaturated zone thickness was 1.82 in. Therefore, the roots did not penetrate the saturated zone. Retaining the root depth value used in the soil DCGL analysis implies the roots penetrate the saturated zone. The root depth value of 1.17 n~ will be changed to 0.5 m for the analysis. This prevents the non- water pathways from bcing non-zero, which is appropriate for the conditions being modeled, because most of the contamination will be bound in the concrete and unavailable for release to plants even if the roots were near the concrete.
A second difference between the assu~nption used in the analyses ofthe soil DCGLs and the concrete release model is that the water table drop rate is set to zero. In the soil DCGL analysis (YA, 2004), a RESRAD default value of 0.001 inly was used. The soil DCGL analysis had a 1.8 m unsaturated zone and the results were not sensitive to the water table drop rate. In the current analysis, the unsaturated zone has zero thickness and a non-zero water table drop rate causes a non-zero unsaturated zone thickness to form. This leads to RESRAD calculating transport through the unsaturated zone to reach the aquifer. This effect is not desired because the source is assumed to reside in the saturated zone.
The saturated zone Kd's were set to zero. This assumption was used to provide an upper bound on well concentrations. The analysis of release and transport presented earlier suggests that sorption does not have a major effect on well concentrations and will cause a decrease of less than a factor of 10 for all radionuclides.
The contaminated zone geometry was changed to fit thc conditions for release from subsurface facilities. This permits the use of a soil concentration of 1 pCi1g to be used in the contaminated zone to represent concrete contamination of 1 pCi/g. To obtain predicted dose at other concentrations, the RESRAD results need to bc scaled to the actual contamination levels fomld during characterization work. Contaminated zone parameters are presented in Table 7.
Table 8 summarizes all values. other than source term geometry (Table 7) and contaminated zone Kd (Table 9), used in the current analyses that differ from the values used in the soil DCGL analyses (YA, 2004).
Table 7 Contaminated zone geometry factors and source concentration.
Volurne (m')
410
Concentration ( ~ C i k )
1
Thickness (m)
2.86
Area (mL)
143.5
Length parallel to flow (m)
33.3

Table 9 suinmarizes the results for the peak well concentrations predicted by RESRAD and dose using the release rates calculated for diffusion-controlled release, Table 5, and the parameters used in the YNPS analysis for soil DCGLs with the exceptions discussed above. In addition, the contaminated zone Kd values calculated using the procedure described above are presented. The fractional release rates fiom the diffusion calculations in DUST-MS and those obtained in RESRAD using the Kd value and Eqn. 4 are supplied for comparison. The agreement between the DUST-MS and RESRAD release rates indicates that RESRAD is using the desired source strength for the calculation.
Table 9 Peak well concentration and dose for release for all subsurface structures uniformly contaminated to 1 pCi/g throughout the wall thickness for each radionuclide.
* Fractional release rate is equivalent to the RESRAD parameter, Leach Ratc, Eqn (4).
The results in Table 9 indicate that if thc entire set of walls and floors is contaminated uniformly to 1 pCi/g with each radionuclide. Cesium-137 and Sr-90 are predicted to have the largest dose. Modeling of diffusion-controlled release from the concrete for these radionuclides demonstrated that even if the contamination is limited to the first inch of concrete, the peak release rate does not change.

In the sample SFP-CB-02-01-01 (Darman, 2004) average concentrations were measured for the first inch of concrete. These values, and the prqjected dose for each radionuclide if all walls and floors were contaminated to the measured levels are shown in Table 10. The prqjected dose for each nuclide (colu~nn 3 of Table 10) was obtained by multiplying the dose for contami~lation at 1 pCiIg (column 3 in Table 9) by the corresponding measurcd concentration.
Table 10 Measured concentrations in the first inch of the concrete and prqiected dose for contamination in the first inch at each surface and no contamination in the interior of the walls.
Radionuclide 1 Measured Concentration I Projected Dose
With the measured contamination levels, Cs-137 dominates the projected dose. All other doses are less than 1 mremdy at the measured concentration levels.
The 1-1-3 dose presented in Table 10 may not be conservative as the measured concentration data show an increase up to six inches into the concrete. The peak value at 6 inches is less than a factor of 2 higher than the value in Table 8. To account for the difference between the surface and peak concentration, the projected dose is increased by a factor of 2. The resulting dose is less than 0.1 mremly and therefore, at these levels, 1-1-3 is not of great concern.
5.0 Conclusion
Release of residual radioactive contaminants (i.e., H-3, C-14, Co-60, Ni-63, Sr-90, and Cs-137) from subsurface concrete structures at the YNPS and the associated annual doses have been evaluated. Therc are five different structures that may rcmain at license te~inination, and all may havc concrete containing residual radioactivity. Most of the concrete walls and floors that may remain are below the water table. Thus, for these analyses it is assumed that the entire facility is below the water table. Analyses were performed to assess the rate controlling release mechanism in the groundwater pathway. Two ~nechanisms were considered, diffusive release from the concrete and sorption onto backfill and soil that surrounds the facilities. Diffusive release was found to be the rate- limiting step for all six radionuclides in the analysis. Further analyses were performed to determine the impact of the contaminant distribution in the walls on release rate. The analyses showed that for every radionuclide except H-3, the peak release rate was irnpacted only by the concentrat~on within the first inch of the wall. Thereforc, the impact of having a non-homogeneous concentration distribution is minimal. Tritium, which has a higher concrete diffusion coefficient than the other radionuclides, has release

rates that were influenced by concentrations within the first few inches of thc wall. Based on a concentration of 1 pCiIg and a concrete density of 2.5 g/cm3, the total release to the subsurface was estimated for each radionuclide. Values of RESRAD input parameters were selected to match the release rate calculated by DUST-MS. RESRAD then calculated the water pathway dose using the same assumptions used in the soil DCGL calculations performed for YNPS. The dose results for 1 pCi/g showed that Cs- 137 and Sr-90 had the highest doses. Using measured data of existing contaminant concentrations in the first inch of concrete, estimates of the dose were made. Cs-137 dominated the dose and had a predicted dose greater than 200 mremly, based upon the measured concentrations in the concrete sample. All other radionuclides had a predicted dose of less than 1 mrem/y.
For diff~~sion-controlled release, the peak release rate is expected in the first year of the analysis. Examinations of the H-3 diffusion profile after one year suggest that only contan~ination within the first five inches will impact release. This was true for both the 1 and 6 foot wall thicknesses that were simulated. Evaluations were performcd for Cs-137 as well. Cs- 13 7 had the second highest diffusion coefficient in the simulations and can be used as a surrogate for the other radionuclides, except H-3. The Cs-137 diffusion profile at 1 year showed that only contamination within the first half-inch of wall thickness will impact peak release. This suggests that characterization data should focus on the first inch for all radionuclides except H-3 and should focus on the first five inches for H-3. Outside of this region, confirmatory data should be collected to dctermine if the uniform concentration assumption used in these analyses is appropriate.

Appendix A Yankee Rowe Reference Drawings for Facility Component Dimensions

Table A1 : Yankee Rowc Reference Drawings for Facility Component Dimensions
Height: Yankea Drawing No. 9699-FM-57A
Width: Yankes Drawing Nos. 9699-FC-40D & 9699-RC-40A
References for rlimcnsions:
Height: Yankee Drawing No. 9699-FM-57A
Widdl: Yankee Drawing Nos. 9699-FC-40D & 9699-RC-40A
ReCcrences for dimensions:
I-lcight: Yarlkec Drawing No. 9699-FC-45B
Rcfcrence for all dimensions: Yankee Drawing No. 9699-PC-5OC
Reference for all dimensions: Yankcc Drawing No. 9699-FC-43C wall 2 via11 3
wall 4
6.50 6.50 6.50
7.83 9.00 9.00
1 .00 1.08 1.08

Appendix B
Release Rates for Each Wall and Floor Section Calculated Using the DUST-MS Code

Table B1: DUST-MS Predicted diffusion-controlled release of H-3
* Total Inventory for uniform contamination at 1 pCi/g is 1.02E-03 Ci. ** The last row contains the average fractional release rate (Cily) and the total release rate (Ci) in the first year, the year of peak release. The total release is the sum of all preceding values in the column. The average release rate is the total release rate divided by the total inventory.
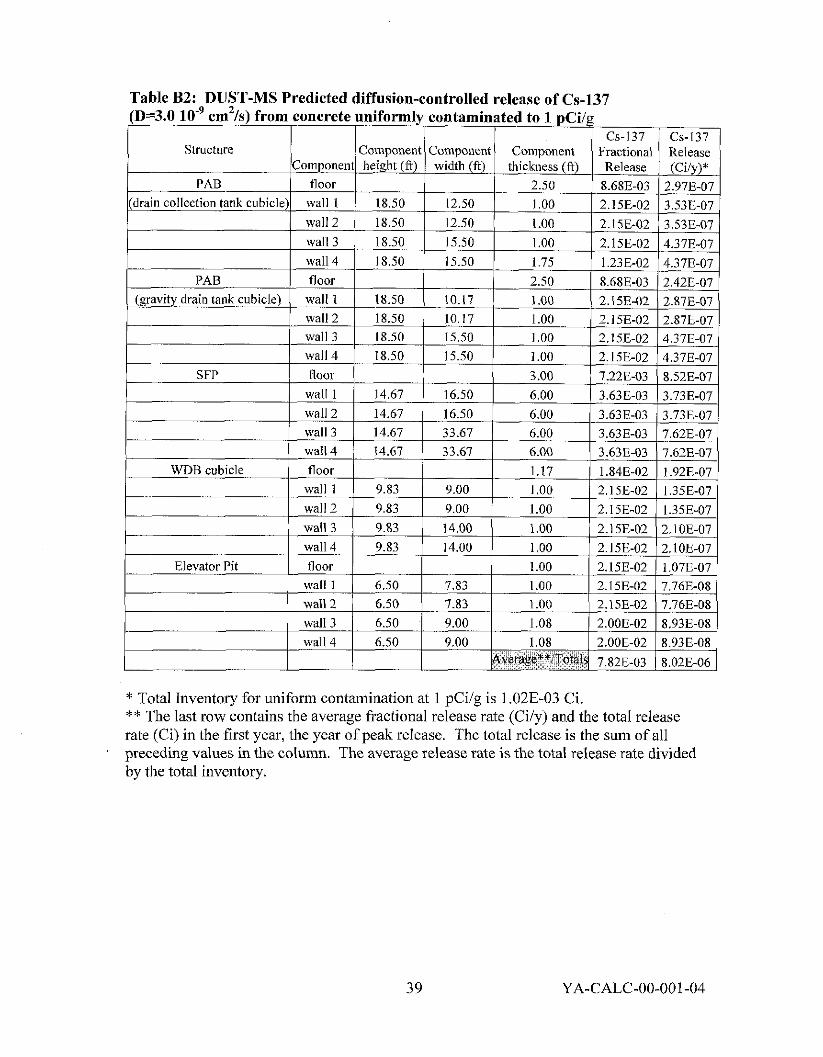
Table B2: DUST-MS Predicted diffusion-controlled release of Cs-137
* Total Inventory for uniform contamination at 1 pCi/g is 1.02E-03 Ci. ** The last row contains the average fractional release rate (Cily) and the total release rate (Ci) in the first year, the year of peak release. The total release is the sum of all preceding values in the column. The average release rate is the total release rate divided by the total inventory.

Table B3: DUST-MS Predicted diffusion-controlled release of Co-60
* Total Inventory for u~liform contamination at 1 pCi/g is 1.02E-03 Ci. * I ' The last row contains the average fractional release rate (Cily) and the total release rate (Ci) in the first year, the year of peak release. The total release is the sum of all preceding values in the column. The average release rate is the total release rate divided by the total inventory.

Table B4: DUST-MS Predicted diffusion-controlled release of C-14 (D=1.0 10 12 cm21s) from concrete uniformly contaminated to 1 pCi/g
* Total Inventory for uniform contamination at 1 pCi/g is 1.02E-03 Ci. ** The last row contains the average fractional release rate (Cily) and the total releasc rate (Ci) in the first year, the year of peak release. The total release is the sum of all preceding values in the column. The average release rate is the total release rate divided by the total inventory.

Tablc B5: DUST-MS Predicted diffusion-controlled release of Sr-90 (D=5.2 10 10 cm2/s) from concrete uniformly contaminated to 1 pCilg
* Total Inventory for uniform contamination at 1 pCi1g is 1.02E-03 Ci. ** The last row contains the average fractional release rate (Cily) and the total releasc rate (Ci) in the first year, the year of peak release. The total release is the sum of all preceding values in the colunm. The average release ratc is the total rclease rate divided by the total inventory.

Table B6: DUST-MS Predicted diffusion-controlled release of Ni-63 (D=l. l 10-9 cm21s) from concrete uniformly contaminated to 1 pCi1g
* Total Inventory for uniform contamination at 1 pCiIg is 1.02E-03 Ci. ** Thc last row contains the average fractional release rate (Cily) and the total release rate (Ci) in the first year, the year of peak release. The total release is the sum of all preceding values in the column. The average release rate is the total release rate divided by the total inventory.


