Assessment of Ports for Offshore Wind Development in the ... of Ports... · ASSESSMENT OF PORTS FOR...
176
ASSESSMENT OF PORTS FOR OFFSHORE WIND DEVELOPMENT IN THE UNITED STATES Client U.S. Department of Energy Document No. 700694-USPO-R-03 Issue E Status Final Classification Published Date 21 March 2014 Author C. Elkinton, A. Blatiak, H. Ameen Checked by N. Baldock, D. Soares Approved by P. Dutton Garrad Hassan America, Inc. Registered in America No. 94-3402236 Registered Office: 9665 Chesapeake Drive, Suite 435, San Diego, California 92123 USA
Transcript of Assessment of Ports for Offshore Wind Development in the ... of Ports... · ASSESSMENT OF PORTS FOR...

ASSESSMENT OF PORTS FOR OFFSHORE WIND DEVELOPMENT IN THE UNITED STATES
Client U.S. Department of Energy Document No. 700694-USPO-R-03 Issue E Status Final Classification Published Date 21 March 2014
Author C. Elkinton, A. Blatiak, H. Ameen
Checked by N. Baldock, D. Soares
Approved by P. Dutton
Garrad Hassan America, Inc. Registered in America No. 94-3402236 Registered Office: 9665 Chesapeake Drive, Suite 435, San Diego, California 92123 USA

IMPORTANT NOTICE AND DISCLAIMER
1 This document has been prepared on behalf of the Client to whom the document is addressed and who has entered into a written agreement with Garrad Hassan America, Inc. (hereafter, “GL GH”), a GL Group (the “Group”) member issuing this document. To the extent permitted by law, neither GL GH nor any Group company assumes any responsibility whether in contract, tort including without limitation negligence, or otherwise howsoever, to third parties (being persons other than the Client), and no company in the Group other than GL GH shall be liable for any loss or damage whatsoever suffered by virtue of any act, omission or default (whether arising by negligence or otherwise) by GL GH, the Group or any of its or their servants, subcontractors or agents. This document must be read in its entirety and is subject to any assumptions and qualifications expressed therein as well as in any other relevant communications in connection with it. This document may contain detailed technical data which is intended for use only by persons possessing requisite expertise in its subject matter.
2 This document is protected by copyright and may only be reproduced and circulated in accordance with the
Document Classification and associated conditions stipulated or referred to in this document and/or in GL GH’s written agreement with the Client. No part of this document may be disclosed in any public offering memorandum, prospectus or stock exchange listing, circular or announcement without the express and prior written consent of GL GH. A Document Classification permitting the Client to redistribute this document shall not thereby imply that GL GH has any liability to any recipient other than the Client.
3 This document has been produced from information relating to dates and periods referred to in this document.
This document does not imply that any information is not subject to change. Except and to the extent that checking or verifying information or data is expressly agreed within the written scope of its services, GL GH shall not be responsible in any way in connection with erroneous information or data provided to it by the Client or any third party, or for the effects of any such erroneous information or data whether or not contained or referred to in this document.
4 This report is being disseminated by the U.S. Department of Energy. As such, the document was prepared in
compliance with Section 515 of the Treasury and General Government Appropriations Act for Fiscal Year 2001 (Public Law 106-554) and information quality guidelines issued by the U.S. Department of Energy. Though this report does not constitute “influential” information, as that term is defined in DOE’s information quality guidelines or the Office of Management and Budget's Information Quality Bulletin for Peer Review (Bulletin), the study was reviewed both internally and externally prior to publication. For purposes of external review, the study benefited from the advice and comments of a panel of offshore wind industry stakeholders. That panel included representatives from private corporations and national laboratories.

KEY TO DOCUMENT CLASSIFICATION
Strictly Confidential : For disclosure only to named individuals within the Client’s organization.
Private and Confidential : For disclosure only to individuals directly concerned with the subject matter of the document within the Client’s organization.
Commercial in Confidence : Not to be disclosed outside the Client’s organization.
GL GH only : Not to be disclosed to non-GL GH staff
Client’s Discretion : Distribution for information only at the discretion of the Client (subject to the above Important Notice and Disclaimer and the terms of GL GH’s written agreement with the Client).
Published : Available for information only to the general public (subject to the above Important Notice and Disclaimer).
© 2014 Garrad Hassan America, Inc.

Document No. 700694-USPO-R-03 Assessment of Ports for Offshore Wind Development in the United States Issue: E Final
REVISION HISTORY
Issue Issue Date Summary
A 23 September 2013 Initial issue for DOE and industry review
B 16 October 2013 Revised based on Client and Industry Panel feedback, Executive Summary issued as Final
C 30 December 2013 Issued to Client for review
D 10 February 2014 Issued for final review
E 21 March 2014 Issued as Final
Garrad Hassan America, Inc. Page i

Document No. 700694-USPO-R-03 Assessment of Ports for Offshore Wind Development in the United States Issue: E Final
ACKNOWLEDGEMENTS
GL GH thanks the U.S. Department of Energy for its generous support of this work, which was conducted under Award Number DE-EE0005369. We are especially grateful for the oversight from Michael Hahn, Gretchen Andrus, Gary Norton, and Cash Fitzpatrick. The authors wish to recognize the following key contributors to this report: Axel Barrio, Tim Cutting, Chris Garrett, Briant Happ, James Harris, Anton Kempenaar, Tom O’Neill, Matthew Rogers, Fernando Sevilla, Alexis Storey, and Tom Visentin. The authors wish to thank the following people and organizations for contributing information, discussion, and feedback to this report and to the Offshore Wind Port Readiness assessment tool: Jay Borkland and Chet Myers, Apex Companies, LLC on behalf of the New Bedford Marine Commerce Terminal; Bill White, Massachusetts Clean Energy Center on behalf of the New Bedford Marine Commerce Terminal; Eric Hines, LeMessurier on behalf of Massachusetts Clean Energy Center; Marlin Peterson, Gloucester County Improvement Authority on behalf of the Port of Paulsboro, NJ; Lance Kenworthy, North Carolina State Ports Authority on behalf of the Port of Morehead City, NC; John G. Peterlin III, Port of Galveston; Eric Geyer, Roseburg Shipping Terminal, Coos Bay, OR; Martin Callery, Port of Coos Bay; David Gutheil, Port of Cleveland, OH; Kevin Pearce and Steve Geiger, Arcadia Windpower; Bruce Hamilton, Navigant Consulting; Steven Kopits, Douglas-Westwood; Paul Murphy, Clint Plummer, and Chris van Beek, Deepwater Wind; Doug Copeland, EDF Renewable Energy; Aaron Smith and Ben Maples, NREL; Rick Palmer, Weeks Marine; Fara Courtney, US Offshore Wind Collaborative; Brian O’Hara, Southeastern Coastal Wind Coalition; Victoria Pebbles and Amanda Sweetman, Great Lakes Commission; and Paul Williamson, Maine Ocean & Wind Industry Initiative.
Garrad Hassan America, Inc. Page ii

Document No. 700694-USPO-R-03 Assessment of Ports for Offshore Wind Development in the United States Issue: E Final
CONTENTS
EXECUTIVE SUMMARY ............................................................................................................................................ XIII
1 INTRODUCTION ................................................................................................................................................. 1 1.1 Background .............................................................................................................................................. 1 1.2 Market Potential ....................................................................................................................................... 1 1.3 Previous Studies ...................................................................................................................................... 2
1.3.1 Massachusetts ......................................................................................................................... 2 1.3.2 Great Lakes .............................................................................................................................. 2 1.3.3 Maryland .................................................................................................................................. 2 1.3.4 North Carolina .......................................................................................................................... 2
1.4 Study Objectives ...................................................................................................................................... 3 1.5 Report Structure ....................................................................................................................................... 3
PART I: PORT REQUIREMENTS .................................................................................................................................. 5
2 OFFSHORE WIND FARM CHARACTERISTICS ............................................................................................... 6 2.1 Wind Turbines .......................................................................................................................................... 6
2.1.1 Wind Turbine Tower ................................................................................................................. 7 2.1.2 Nacelle and Blades .................................................................................................................. 7
2.2 Wind Turbine Foundations ....................................................................................................................... 8 2.2.1 Steel Monopile Structures ........................................................................................................ 8 2.2.2 Gravity Base Structures ......................................................................................................... 10 2.2.3 Jacket Structures ................................................................................................................... 12
2.3 Electrical Balance of Plant ..................................................................................................................... 14 2.3.1 Inter-Array Cables .................................................................................................................. 14 2.3.2 Offshore Substation ............................................................................................................... 14 2.3.3 Export Cables ......................................................................................................................... 16
3 OFFSHORE WIND FARM INSTALLATION ACTIVITIES ................................................................................ 18 3.1 Wind Turbine Rotor Installation .............................................................................................................. 18
3.1.1 Single Blade Lift ..................................................................................................................... 18 3.1.2 Bunny-ears Lift ....................................................................................................................... 18 3.1.3 Full Rotor Lift .......................................................................................................................... 19 3.1.4 Full Wind Turbine Installation ................................................................................................. 20 3.1.5 Floating Turbine Installation ................................................................................................... 21
3.2 Foundation Installation ........................................................................................................................... 21 3.2.1 Steel Monopile Structures ...................................................................................................... 21 3.2.2 Gravity Base Installation......................................................................................................... 24 3.2.3 Jacket Structures ................................................................................................................... 25
3.3 Subsea Array Cables ............................................................................................................................. 27 3.4 Offshore Substation ............................................................................................................................... 28
3.4.1 Substation Foundation Installation ......................................................................................... 28 3.4.2 Substation Topside Load-out ................................................................................................. 28 3.4.3 Substation Topside Installation .............................................................................................. 29
Garrad Hassan America, Inc. Page iii

Document No. 700694-USPO-R-03 Assessment of Ports for Offshore Wind Development in the United States Issue: E Final
3.5 Subsea Export Cable ............................................................................................................................. 29
4 INSTALLATION VESSELS .............................................................................................................................. 33 4.1 Types of Vessels Used on Offshore Wind Farms in Northern Europe ................................................... 33
4.1.1 Floating Deck Barge with Crane ............................................................................................. 33 4.1.2 Shearleg Crane barge ............................................................................................................ 34 4.1.3 Semi-Submersible Heavy Lift Vessel ..................................................................................... 35 4.1.4 DP2 Heavy Lift Cargo Vessels ............................................................................................... 36 4.1.5 Leg-Stabilized Crane Vessel .................................................................................................. 37 4.1.6 Self-Propelled or Towed Jack-Up Craft .................................................................................. 38
4.2 Assumed U.S. Installation Vessel Scenarios ......................................................................................... 40 4.2.1 Scenario 1: Utilize Existing U.S.-built Vessels........................................................................ 40 4.2.2 Scenario 2: Utilize Non-U.S.-built Vessels from Northern Europe .......................................... 41 4.2.3 Scenario 3: New Build U.S. Vessels ...................................................................................... 45 4.2.4 Heavy Lift Cargo Vessels ....................................................................................................... 45 4.2.5 How Vessel Availability Dictates Port Requirements .............................................................. 46
5 OFFSHORE WIND FARM PORT REQUIREMENTS ........................................................................................ 47 5.1 Types of Port Usage Addressed ............................................................................................................ 48 5.2 Port Logistics ......................................................................................................................................... 48 5.3 Component Storage ............................................................................................................................... 49 5.4 Bearing Capacity .................................................................................................................................... 50
5.4.1 Increasing Bearing Capacity .................................................................................................. 50 5.4.2 Cranage & Ground Bearing Pressure .................................................................................... 51
5.5 Component Load-out ............................................................................................................................. 53 5.5.1 Roll-on and Roll-off................................................................................................................. 53 5.5.2 Lift-on and Lift-off ................................................................................................................... 54 5.5.3 Crawler Cranes ...................................................................................................................... 54 5.5.4 Quayside Cranes ................................................................................................................... 56
5.6 Port Haulage (Quay Transportation) ...................................................................................................... 57 5.6.1 Self-Propelled Modular Transporters ..................................................................................... 57
5.7 Wind Turbines ........................................................................................................................................ 58 5.7.1 Wind Turbine Blades .............................................................................................................. 59 5.7.2 Wind Turbine Nacelle ............................................................................................................. 62 5.7.3 Wind Turbine Tower ............................................................................................................... 64 5.7.4 Wind Turbine Port Criteria ...................................................................................................... 66
5.8 Wind Turbine Support Structures ........................................................................................................... 69 5.8.1 Steel Monopile Structures ...................................................................................................... 69 5.8.2 Monopile Structure Port Criteria ............................................................................................. 71 5.8.3 Jacket Structures ................................................................................................................... 72 5.8.4 Jacket Structure Port Criteria ................................................................................................. 75 5.8.5 Concrete Gravity Base Structures .......................................................................................... 75
5.9 Substation .............................................................................................................................................. 80 5.9.1 Topside Port Requirements .................................................................................................... 80 5.9.2 Substation Foundation Port Requirements ............................................................................ 81 5.9.3 Self-installing Substation Port Requirements ......................................................................... 81
Garrad Hassan America, Inc. Page iv

Document No. 700694-USPO-R-03 Assessment of Ports for Offshore Wind Development in the United States Issue: E Final
5.10 Wind Farm Electrical Plant ..................................................................................................................... 81 5.10.1 Array Cables .......................................................................................................................... 81 5.10.2 Export Cable .......................................................................................................................... 82
5.11 Operation & Maintenance ...................................................................................................................... 84 5.12 Port Requirements for Floating Offshore Wind Turbines ....................................................................... 85 5.13 Miscellaneous Port Requirements ......................................................................................................... 85
PART II: U.S. OFFSHORE WIND PORT ASSESSMENT TOOL ................................................................................. 86
6 PORT ASSESSMENT TOOL ............................................................................................................................ 87 6.1 Introduction: Purpose of the Tool ........................................................................................................... 87 6.2 Gap Analysis and Estimated Costs ........................................................................................................ 87
6.2.1 Tool Functionality Overview ................................................................................................... 88 6.2.2 Port Assessment Tool Assumptions ....................................................................................... 91
PART III: CASE STUDIES: ANALYSIS OF 6 PORTS AROUND THE COUNTRY ..................................................... 92
7 INTRODUCTION ............................................................................................................................................... 93 7.1 Ports Assessment Tool Application ........................................................................................................ 93
8 OPPORTUNITY ASSESSMENT ....................................................................................................................... 95 8.1 Summary of Methodology ...................................................................................................................... 95 8.2 Assumptions .......................................................................................................................................... 98
9 COST-BENEFIT PREVIEW ............................................................................................................................ 100 9.1 Overview .............................................................................................................................................. 100 9.2 Assumptions ........................................................................................................................................ 100
10 CASE STUDIES .............................................................................................................................................. 101 10.1 Case Study Port Selection ................................................................................................................... 101 10.2 Presentation of Results ........................................................................................................................ 102 10.3 North Atlantic: New Bedford, Massachusetts ....................................................................................... 102
10.3.1 Background and Current Conditions .................................................................................... 102 10.3.2 Results ................................................................................................................................. 104 10.3.3 Discussion ............................................................................................................................ 107
10.4 North Atlantic: Paulsboro, New Jersey ................................................................................................. 108 10.4.1 Background and Current Conditions .................................................................................... 108 10.4.2 Results ................................................................................................................................. 109 10.4.3 Discussion ............................................................................................................................ 113
10.5 South Atlantic: Morehead City, North Carolina .................................................................................... 114 10.5.1 Background and Current Conditions .................................................................................... 114 10.5.2 Results ................................................................................................................................. 114 10.5.3 Discussion ............................................................................................................................ 118
10.6 Gulf of Mexico: Galveston, Texas ........................................................................................................ 118 10.6.1 Background and Current Conditions .................................................................................... 118
Garrad Hassan America, Inc. Page v

Document No. 700694-USPO-R-03 Assessment of Ports for Offshore Wind Development in the United States Issue: E Final
10.6.2 Results ................................................................................................................................. 119 10.6.3 Discussion ............................................................................................................................ 123
10.7 Pacific: Coos Bay, Oregon ................................................................................................................... 124 10.7.1 Background and Current Conditions .................................................................................... 124 10.7.1 Results ................................................................................................................................. 124 10.7.2 Discussion ............................................................................................................................ 128
10.8 Great Lakes: Cleveland, Ohio .............................................................................................................. 128 10.8.1 Background and Current Conditions .................................................................................... 128 10.8.2 Results ................................................................................................................................. 129 10.8.3 Discussion ............................................................................................................................ 133
11 TRENDS AND COMMONALITIES ................................................................................................................. 135 11.1 Gap Analysis ........................................................................................................................................ 135 11.2 Opportunity Assessment ...................................................................................................................... 138 11.3 Cost-Benefit Assessment ..................................................................................................................... 138
12 CONCLUSIONS .............................................................................................................................................. 140
13 REFERENCES ................................................................................................................................................ 142
APPENDIX A TOOL DIAGRAMS & FUNCTIONS ..................................................................................... 143
APPENDIX B GROUND IMPROVEMENT COST MODEL ......................................................................... 145
APPENDIX C PORT IMPROVEMENTS – CIVIL CONSIDERATIONS ....................................................... 146
Garrad Hassan America, Inc. Page vi

Document No. 700694-USPO-R-03 Assessment of Ports for Offshore Wind Development in the United States Issue: E Final
TABLE OF TABLES
Table 1: Summary of Typical Key Component Specs and Port Requirements xv
Table 4-1: Specifications of Potential U.S.-Flagged Lift Vessels 40
Table 4-2: Specifications – Marmac 300 42
Table 4-3: Specifications for Select 2nd Generation European Heavy Lift Vessels 43
Table 4-4: Vessel Specification for the BBC – Elbe 45
Table 5-1: Advantages and Disadvantages of Different Methods for Increasing the Bearing Capacity 51
Table 5-2: Generic Wind Turbine Specifications 58
Table 5-3: Port Requirements as a Function of Wind Turbine Size – Blades 67
Table 5-4: Port Requirements for as a Function of Wind Turbine Size – Nacelles 68
Table 5-5: Port Requirements for as a Function of Wind Turbine Size – Towers 69
Table 5-6: Port Requirements for as a Function of Wind Turbine Size – Monopile Foundations 72
Table 5-7: Port Requirements as a Function of Wind Turbine Size – Jacket Structures 75
Table 5-8: Port Requirements as a Function of Wind Turbine Size – GBS Structures (40 m design depth) 76
Table 5-9: Summary of Port Requirements for Gravity Base Construction on Barges 79
Table 5-10: Summary of Port Requirements for Gravity Base Construction in Dry Dock 80
Table 5-11: Summary of Port Requirements for Substation Topside 80
Table 5-12: Summary of Manufacturing Port Requirements for Array Cable 82
Table 5-13: Summary of Staging Port Requirements for Array Cable 82
Table 5-14: Summary of Manufacturing Port Requirements for Export Cable 84
Table 5-15: Summary of Staging Port Requirement for Export Cable 84
Table 6-1: Overview of Gap Analysis and Information Required for Gap Analysis 88
Table 8-1: Cumulative Regional Number of Projects and Project Capacities 97
Table 8-2: Basic Project Assumptions 98
Table 10-1: Available Port Information – New Bedford, MA 1 103
Table 10-2: Gaps and Corresponding Costs in Port Capability – Port of New Bedford, MA 104
Table 10-3: Annual Investment and Revenue, Port of New Bedford, MA 106
Table 10-4: Available Port Information – Port of Paulsboro, NJ 1 108
Table 10-5: Gaps and Corresponding Costs in Port Capability – Port of Paulsboro, NJ 109
Table 10-6: Annual Investment and Revenue, Port of Paulsboro, NJ 112
Table 10-7: Available Port Information – Morehead City, NC 114
Table 10-8: Gaps and Corresponding Costs in Port Capability – Port of Morehead City, NC 115
Table 10-9: Summary of Cost Benefit Analysis – Morehead City, NC 117
Garrad Hassan America, Inc. Page vii

Document No. 700694-USPO-R-03 Assessment of Ports for Offshore Wind Development in the United States Issue: E Final
Table 10-10: Available Port Information – Galveston, TX 119
Table 10-11: Gaps and Corresponding Costs in Port Capability – Port of Galveston, TX 120
Table 10-12: Summary of Cost Benefit Analysis – Galveston, TX 122
Table 10-13: Available Port Information – Roseburg Shipping Terminal, Coos Bay, OR 124
Table 10-14: Gaps and Corresponding Costs in Port Capability – Roseburg Shipping Terminal, Coos Bay, OR 125
Table 10-15: Available Port Information – Port of Cleveland, OH 129
Table 10-16: Gaps and Corresponding Costs in Port Capability for port of Cleveland, OH 130
Table 10-17: Summary of Cost Benefit Analysis – Cleveland OH, Great Lakes (2015 – 2030) 133
Table 11-1: Test Case Scenario Configurations 135
Table C-1: Allowable Foundation Pressure per the 2006 International Building Code 147
Table C-2: Laydown yard unit pricing in terms of square feet of laydown yard surface area. 148
Table C-3: Laydown yard unit pricing in terms of cost per square foot per unit strength improvement. 148
Table C-4: Quayside unit pricing in terms of linear feet of sheet pile wall. 150
Table C-5: Cost for sheet piling only, driven into seabed at toe of existing sheet pile wall (assume 30’ sheet pile wall height and use of dolly pile to accomplish underwater driving). 151
Table C-6: Quayside deck unit pricing in terms of square feet of concrete deck surface area (for use when varying 33’ concrete deck width). 151
Table C-7: Quayside retrofit pricing in terms of cost per square foot per unit strength improvement. 151
Table C-8: Harbor dredge and rock infill unit pricing in terms of surface dredge area. 153
Table C-9: Harbor dredge (no infill) in terms of dredging volume. 153
Garrad Hassan America, Inc. Page viii

Document No. 700694-USPO-R-03 Assessment of Ports for Offshore Wind Development in the United States Issue: E Final
TABLE OF FIGURES
Figure 1: Estimated Incremental Capacity per Annum for U.S. Offshore Wind Industry – Moderate Growth Scenario xvii
Figure 2: Test Case Scenario Results xviii Figure 2-1: Various Components of an Offshore Wind Farm 6
Figure 2-2: Principal Components of an Offshore Wind Turbine 7
Figure 2-3: Wind Turbine Nacelle and Rotor 8
Figure 2-4: Wind Turbine Substructure Concept – Monopile 9
Figure 2-5: Wind Turbine Substructure Concept – Gravity Base Structure 11
Figure 2-6: Wind Turbine Substructure Concept – Jacket (pre-piled & post-piled) 13
Figure 2-7: Cross-Section of Inter-array Cable 14
Figure 2-8: Export Cable Technology vs. Distance 15
Figure 2-9: Offshore Substation on Jacket Foundation 16
Figure 2-10: Components of a HVDC Export Cable 17
Figure 3-1: Illustration of a Single Blade Lift 18
Figure 3-2: Illustration of a Bunny-ears Lift 19
Figure 3-3: Illustration of a Full Rotor Lift 20
Figure 3-4: Illustration of a Full Wind Turbine Installation 20
Figure 3-5: Monopiles being loaded onto a Deck Barge by Shearleg Cranes 21
Figure 3-6: Steel Monopile being driven by a Menck Hydrohammer – Jack-up Excalibur 22
Figure 3-7: Piling Frame on Excalibur Awaiting a Floating Monopile 23
Figure 3-8: Pre-Installation of the Jacket Piles through a Re-usable Template 25
Figure 3-9: Lifting and Placement of the Jacket Structure on Pre-installed Pin-piles 26
Figure 3-10: Subsea Remotely Operated Vehicle (ROV) 28
Figure 3-11: Substation Topside Installation (heavy-lift crane vessel) 29
Figure 3-12: Export Cable Installation Vessel (Henry P. Lading) 30
Figure 3-13: Subsea Cable Plow Burying Cable at Shore 31
Figure 3-14: Cable Works at a Wind Turbine 31
Figure 4-1: Deck Barge with Spud-Legs, and Crawler Crane 34
Figure 4-2: Shearleg Crane-vessel Working in Tandem with a Jack-up Piling Vessel 35
Figure 4-3: Semi-Submersible Heavy Lift Vessel – Jacket installation, by Thialf 36
Figure 4-4: Jumbo Javelin Installing Transition Piece, Anholt Offshore Wind Farm, Denmark 37
Figure 4-5: Leg-stabilized Crane Vessels A2Sea Sea Energy / Sea Power 38
Garrad Hassan America, Inc. Page ix

Document No. 700694-USPO-R-03 Assessment of Ports for Offshore Wind Development in the United States Issue: E Final
Superior Energy Services, “265’ Class Boats” Figure 4-6: Potential U.S.-Flagged Lift Vessels 41
Figure 4-7: Marmac 300 42
Figure 4-8: Representative 2nd Generation European Heavy Lift Vessels 44
Figure 4-9: BBC Elbe 45
Figure 5-1: Nacelle Storage at Port 49
Figure 5-2: Heavy-Lift Liebherr Crawler Cranes 52
Figure 5-3: Load Distribution under Tracks of a Heavy Crawler-Crane, with Stone Layer 53
Figure 5-4: Ro-Ro Capable Heavy Lift Cargo Vessel (Happy Buccaneer) 54
Figure 5-5: Crawler Crane, Showing Key Components and Dimension 55
Figure 5-6: Crawler Cranes Transporting a Steel Monopile 56
Figure 5-7: Nacelle on Trailer of Self-Propelled Modular Transporters 57
Figure 5-8: Wind Turbine Blade Transport Vehicle 59
Figure 5-9: Wind Turbine Blade Storage (single frame) 60
Figure 5-10: Wind Turbine Blade Storage (multiple frames) 60
Figure 5-11: Port Cranage Blade Load Out 60
Figure 5-12: Three Blade Load Out 60
Figure 5-13: Full Rotor Assembly in Port 62
Figure 5-14: Port Cranage Nacelle Load-out 63
Figure 5-15: Crawler Crane Nacelle Load-out 63
Figure 5-16: Tower Section Transportation 64
Figure 5-17: Tower Section Storage 64
Figure 5-18: Tower Section Vessel Cranage Load-out 65
Figure 5-19: Monopile Transportation on the Quay 70
Figure 5-20: Jacket Transportation on the Quay 73
Figure 5-21: Jacket Storage on the Quay 73
Figure 5-22: Jacket Load-out onto Deck Barges 74
Figure 5-23: Construction of GBS on the Quay (Thornton Bank) 77
Figure 5-24: Eide 5 Heavy-Lift Barge Picks a GBS off a Construction Barge 78
Figure 5-25: GBS Construction in a Dry-dock Facility 79
Figure 5-26: ABB’s High-voltage Manufacturing Facility in Sweden 83
Figure 6-1: Port Assessment Tool Input Selection Description 89
Figure 6-2: Layout of the Port Assessment Tool 90
Figure 7-1: U.S. Map Showing Coastal Regions and Specific Ports Studied 93
Garrad Hassan America, Inc. Page x

Document No. 700694-USPO-R-03 Assessment of Ports for Offshore Wind Development in the United States Issue: E Final
Figure 7-2: Port Assessment Tool Application Flow Diagram 94
Figure 8-1: Estimated Cumulative Capacity of U.S. Offshore Wind Industry – Moderate Growth Scenario 96
Figure 8-2: Estimated Incremental Capacity per Annum for U.S. Offshore Wind Industry – Moderate Growth Scenario 96
Figure 8-3: Estimated Number of Projects and Capacity Installed per Year – Moderate Growth Scenario 97
Figure 10-1: Cost Benefit Summary for the Port of New Bedford, MA 107
Figure 10-2: Cost Benefit Summary for the Port of Paulsboro, NJ 113
Figure 10-3: Cost Benefit Summary for Port of Morehead City, NC 118
Figure 10-4: Cost Benefit Summary for Port of Galveston, TX 123
Figure 10-5: Cost Benefit Summary – Port of Cleveland, OH 134
Figure 11-1: Test Case Scenario Results 136
Garrad Hassan America, Inc. Page xi

Document No. 700694-USPO-R-03 Assessment of Ports for Offshore Wind Development in the United States Issue: E Final
LIST OF ABBREVIATIONS
Abbreviation Meaning AC Alternating Current CPT Cone Penetration Test DC Direct Current DOE United States Department of Energy DP Dynamic Positioning EOHT Electric Over-Head Travelling GBS Gravity Base Structures GL GH GL Garrad Hassan American, Inc. HLCV Heavy Lift Cargo Vessels HVAC High-Voltage Alternating Current HVDC High-Voltage Direct Current LOA Length Over All Lo-Lo Lift-on and Lift-off mLAT Meters above Lowest Astronomical Tide O&M Operations and Maintenance OLC Offshore Logistics Company Ro-Ro Roll-on and Roll-off ROV Remotely Operated Vehicle SEP Self-Elevating Platform SPMT Self-Propelled Modular Transporter Tonne Metric ton, equal to 1,000 kg or 2,204.6 pounds TP Transition Piece WTG Wind Turbine Generator
Garrad Hassan America, Inc. Page xii

Document No. 700694-USPO-R-03 Assessment of Ports for Offshore Wind Development in the United States Issue: E Final
EXECUTIVE SUMMARY
As offshore wind energy develops in the United States, port facilities will become strategic hubs in the offshore wind farm supply chain because all plant and transport logistics must transit through these facilities. Therefore, these facilities must provide suitable infrastructure to meet the specific requirements of the offshore wind industry. As a result, it is crucial that federal and state policy-makers and port authorities take effective action to position ports in the offshore wind value chain to take best advantage of their economic potential. The U.S. Department of Energy tasked the independent consultancy GL Garrad Hassan (GL GH) with carrying out a review of the current capability of U.S. ports to support offshore wind project development and an assessment of the challenges and opportunities related to upgrading this capability to support the growth of as many as 54 gigawatts of offshore wind installed in U.S. waters by 2030. The GL GH report and the open-access web-based Ports Assessment Tool resulting from this study will aid decision-makers in making informed decisions regarding the choice of ports for specific offshore projects, and the types of investments that would be required to make individual port facilities suitable to serve offshore wind manufacturing, installation and/or operations. The offshore wind industry in the United States is still in its infancy and this study finds that additional port facilities capable of supporting offshore wind projects are needed to meet the anticipated project build-out by 2030; however, no significant barriers exist to prevent the development of such facilities. Furthermore, significant port capabilities are in place today with purpose-build port infrastructure currently being built. While there are currently no offshore wind farms operating in the United States, much of the infrastructure critical to the success of such projects does exist, albeit in the service of other industries. This conclusion is based on GL GH’s review of U.S. ports infrastructure and its readiness to support the development of proposed offshore wind projects in U.S. waters. Specific examples of facility costs and benefits are provided for five coastal regions (North Atlantic, South Atlantic, Gulf of Mexico, Great Lakes, and Pacific) around the country. GL GH began this study by identifying the logistical requirements of offshore wind ports to service offshore wind. This review was based on lessons learned through industry practice in Northern Europe. A web-based port readiness assessment tool was developed to allow a capability gap analysis to be conducted on existing port facilities based on the identified requirements. Cost models were added to the assessment tool, which allowed GL GH to estimate the total upgrade cost to a port over the period 2014-2030 based on a set of regional project build-out scenarios. Port fee information was gathered from each port allowing an estimate of the potential revenue to the port under this same set of scenarios. The comparison of these revenue and improvement cost figures provides an initial indication of the level of offshore wind port readiness. To facilitate a more in-depth infrastructure analysis, six ports from different geographic regions, with varied levels of interest and preparedness towards offshore wind, were evaluated by modeling a range of installation strategies and port use types to identify gaps in capability and potential opportunities for economic development. Commonalities, trends, and specific examples from these case studies are presented and provide a summary of the current state of offshore wind port readiness in the U.S. and also illustrate the direction some ports have chosen to take to prepare for offshore wind projects. For example, the land area required for
This study finds that additional
port facilities capable of supporting
offshore wind projects are
needed to meet the anticipated
project build-out by 2030; however,
no significant barriers exist to
prevent the development of
such facilities
Garrad Hassan America, Inc. Page xiii

Document No. 700694-USPO-R-03 Assessment of Ports for Offshore Wind Development in the United States Issue: E Final
wind turbine and foundation manufacturing is substantial, particularly due to the large size of offshore wind components. Also, the necessary bearing capacities of the quayside and storage area are typically greater for offshore wind components than for more conventional cargo handling. As a result, most U.S. ports will likely require soil strength improvements before they can fully support offshore wind project construction. This Executive Summary describes each of these three steps: the development of port requirements, the development of the Port Assessment Tool, and the analysis of the 6 case study ports using the tool. The Executive Summary concludes with a brief discussion of key overall results and market opportunities. Part I: Port Requirements The first task in this study was to identify the logistical requirements for moving offshore wind project components through a port facility. This information was largely informed by GL GH’s knowledgebase developed through support of installed offshore wind projects in Europe. In keeping with the mission of this study, these requirements were then shared with a panel of industry stakeholders for review and comments were integrated. In addition, GL GH held a series of workshops, webinars, and interviews to discuss port usage with port operators, vessel operators, project developers, economic development interests, and other industry stakeholders around the country. A summary of the logistical requirements is presented in Table 1 below; additional details are provided in subsequent sections of this report. In addition, the report discusses offshore wind farm components, installation methodologies, vessels, and the implications and impacts of each of these on the port requirements in more detail. However, the requirements listed in Table 1 are very dependent on the technologies employed and so the values presented should be taken as generic. Full functionality has been provided in the Port Assessment Tool to vary these values depending on the technologies and methodologies employed. An in-depth port assessment should be carried out based on specific needs of a given project. One notable example is the requirement for jack-up barges to be able to jack up at the quayside. Given that several of the vessels likely to be utilized for the turbine erection in early projects will be foreign-flagged, the turbine components will need to be transported from the port to the waiting installation vessel by a Jones Act-compliant feeder barge. Given the size and weight of the turbine components and delicacy of the transfer from one vessel to the other, this feeder barge will likely need to jack up before components can be transferred to the installation vessel. Similarly at the quayside, if the vessel is required to be stable during load-out to enable the components to be transferred and sea-fastened safely, the feeder barge may need to jack up at the quayside. The cost implications of retrofitting a facility to include this capability are significant and are expected to influence a port’s decision about the economic benefit of such improvements.
The cost implications of the
expected use of jack-up feeder
barges could be significant if vessels are
required to jack up at quayside
Garrad Hassan America, Inc. Page xiv

Document No. 700694-USPO-R-03 Assessment of Ports for Offshore Wind Development in the United States Issue: E Final
Table 1: Summary of Typical Key Component Specs and Port Requirements
Component Parameter Units1,2 Wind Turbine Size [MW]
4 5 6 7 8
Wind Turbine
Rotor Diameter m 120 135 150 164 175 Blade Length m 59 66 73 80 85 Quayside Storage Area (one blade per frame – up to three blades) m2 363 440 527 615 696
Nacelle and Frame Bearing Pressure t/m2 7 8 10 7 (3) 8
Tower Bearing Pressure t/m2 6 7 8 9 10
Monopile Foundation
Monopile mass (20 m LAT depth) t 500 788 1,076 - - Bearing Pressure Under Storage Blocks t/m2 13 20 27 - -
Jacket Foundation
Bearing Pressure Under Storage Blocks t/m2 - 13 14 16 17
Gravity Based
Structure Foundation
(GBS) 4
Total Mass Without Ballast t - - 5,970 8,009 9,691 Quayside Construction Area (per GBS) m2 - - 3,481 4,398 5,625
Bearing Pressure (quayside construction and storage) t/m2 - - 12 11 10
Minimum Width of Dry Dock for Construction m - - 45 52 61
Minimum Construction Barge Width m - - 43 50 59
Substation
Topside Mass t 500 – 4000 tonnes at approx. 6.5 tonnes per MW Foundation - Generally same as for turbines, or jacket if required
Bearing Pressure t/m2 Typically 2-9 t/m2, dependent on design 1. All masses given in metric tonnes (t) 2. Unit conversion:
1 m = 3.28 ft 10,000 m2 = 2.47 acres 1 metric tonne = 1.10 short tons 1 t/m2 = 204.82 lb/ft2
3. It is assumed that an additional self-propelled modular transporter (SPMT) vehicle will be utilized, thereby increasing the bearing area.
4. Gravity Base Structure Foundations were not considered for 4 or 5 MW turbines, given the likelihood of developers to opt for jacket foundation technologies, considering the relative economics of the two concepts.
Part II: U.S. Offshore Wind Port Assessment Tool GL GH has developed a U.S. focused port readiness assessment tool consisting of a web-based user interface around a mathematical model and set of databases. The Port
Garrad Hassan America, Inc. Page xv

Document No. 700694-USPO-R-03 Assessment of Ports for Offshore Wind Development in the United States Issue: E Final
Assessment Tool was developed on the basis of current and anticipated technology trends and installation techniques for the offshore wind industry. The two main objectives of the Port Assessment Tool are:
• To provide a publicly available tool that can be used by all stakeholders of the U.S. offshore wind industry to assess port readiness for offshore wind
• To serve this study in assessing the current status of the port infrastructure and readiness for offshore wind, in the form of opportunity assessments, cost-benefit analyses, and case studies
The Port Assessment Tool has been developed for multiple stakeholders, including port authorities, project developers, original equipment manufacturers, and other entities providing services to the offshore wind industry. For example, the developer of an offshore wind project can use the Port Assessment Tool to identify the nearest suitable staging port, or a port authority may wish to assess the suitability of its facilities to service regional offshore wind farm developments, while gaining some insight to the number of cost of infrastructure improvements required to better service these developments. The Port Assessment Tool includes databases of port characteristics informed by the port owners, vessel specifications informed by GL GH’s knowledgebase and by a parallel DOE-funded study conducted by Douglas-Westwood, and generic turbine component characteristics informed by GL GH’s knowledgebase and industry trends. Going forward, port owners have the ability to update their port information and/or add facilities within The Port Assessment Tool using private login details. This assessment tool is freely available at www.OffshoreWindPortReadiness.com. Part III: Case Studies: Analysis of 6 Ports Around the Country In order to investigate port readiness for offshore wind construction and operations and to illustrate use of The Port Assessment Tool, GL GH carried out a series of case studies on representative ports in each of the coastal regions of the U.S. In keeping with other work conducted on behalf of the DOE, ports in five regions were selected for analysis. These regions are defined such that they include the following states:
• North Atlantic: Maine, New Hampshire, Massachusetts, Rhode Island, Connecticut, New York, New Jersey, Delaware, Maryland
• South Atlantic: Virginia, North Carolina, South Carolina, Georgia, Florida (Atlantic Coast)
• Gulf of Mexico: Florida (Gulf Coast), Alabama, Mississippi, Louisiana, Texas
• Pacific: California, Oregon, Washington
• Great Lakes: Minnesota, Wisconsin, Illinois, Indiana, Michigan, Ohio, Pennsylvania, New York
The web-based open-access
assessment tool developed by GL GH allows users
to identify suitable ports in the
project vicinity and allows ports
to prioritize areas of improvement
Garrad Hassan America, Inc. Page xvi

Document No. 700694-USPO-R-03 Assessment of Ports for Offshore Wind Development in the United States Issue: E Final
GL GH interviewed personnel from ports in each of the five regions identified and selected six ports for further analysis based in part on previous interest/investment in the port for use by the offshore wind industry. The selection of these ports is not intended to represent an endorsement of these facilities or constitute a recommendation over other nearby ports; rather, the results presented below should be interpreted as being representative of the capabilities and opportunities in these regions. The selected ports provided information on current port capabilities and specifications. These data were added to the Port Assessment Tool, which was used to conduct the analyses summarized below. This study considered the three primary operations for which port facilities are needed when constructing and operating an offshore wind project: manufacturing, construction staging, and O&M. For this study, the category of manufacturing was further subdivided into turbine manufacturing, foundation manufacturing, and offshore substation manufacturing. To be consistent with other DOE-funded studies focused on the infrastructure and supply chain opportunities for offshore wind in the United States, this study uses the same set of technology and deployment assumptions developed by Douglas-Westwood, Navigant, and the National Renewable Energy Laboratory1 for use in their studies. Specifically, GL GH has based its analysis on the ‘moderate growth’ scenario defined as an installed capacity of 28 GW in U.S. waters by 2030. Regional project deployment projections for this scenario are shown in Figure 1 below. Table 2 presents the assumed offshore wind project configurations throughout the study period.
Source: GL GH, Navigant
Figure 1: Estimated Incremental Capacity per Annum for U.S. Offshore Wind Industry – Moderate Growth Scenario
1 See the Market Acceleration section of the DOE’s Offshore Wind Research and Development website, http://wind.energy.gov/offshore_wind.html.
Garrad Hassan America, Inc. Page xvii

Document No. 700694-USPO-R-03 Assessment of Ports for Offshore Wind Development in the United States Issue: E Final
Table 2: Basic Project Assumptions
Commissioning Year 2016 – 2017 2018 – 2022 2022 – 2030 Distance to Port <160 km (87 Nm) Can be >160 km Can be >160 km Project Capacity ~ 250 MW ~ 500 MW ~ 500 MW Turbine Capacity 4 MW 6 MW 8 MW Water Depth 20 m 30 m 30 m Offshore Substations 1 x 250 MW 1 x 500 MW 1 x 500 MW GL GH conducted a gap analysis on the six selected ports by analyzing the upgrade costs required at each facility for a set 5 test cases and 5 port uses. The results of these 25 different configurations are summarized in Figure 2.
Source: GL GH
Note: Results for the ports of New Bedford, MA and Paulsboro, NJ assume that all currently planned near term facility upgrades have been completed.
Figure 2: Test Case Scenario Results
Definition of Test Cases
Test Case 1 2 3 4 5Total project capacity [MW] 300 300 296 296 500Number of wind turbines 75 75 37 37 62Wind turbine capacity [MW] 4 4 8 8 8Foundation type Monopile GBS Jacket GBS JacketWater Depth [m] 20 40 40 40 40
Cost to Fill Gap [$k]
Test Case 1 2 3 4 5 1 2 3 4 5Foundation Manufacturing 0 0 0 0 0 130 0 320 0 320Offshore Substation Manufacturing 0 0 0 0 0 2,680 2,680 2,680 2,680 2,680Staging - foundation & cables 0 0 0 0 0 0 0 0 0 0Staging - turbines 0 0 0 0 0 400 400 150 150 150Operations & Maintenance 0 0 0 0 0 0 0 0 0 0
Test Case 1 2 3 4 5 1 2 3 4 5Foundation Manufacturing 170 0 300 0 300 60 400 1,240 710 1,240Offshore Substation Manufacturing 3,090 3,090 3,090 3,090 3,090 640 640 640 640 640Staging - foundation & cables 0 0 0 0 0 60 400 1,790 710 1,790Staging - turbines 130 130 190 190 190 2,670 2,670 80 80 80Operations & Maintenance 0 0 0 0 0 0 0 0 0 0
Test Case 1 2 3 4 5 1 2 3 4 5Foundation Manufacturing 6,200 3,370 14,460 8,300 15,640 4,860 0 9,470 0 10,690Offshore Substation Manufacturing 4,110 4,110 4,110 4,110 4,110 3,560 3,560 3,560 3,560 3,560Staging - foundation & cables 6,880 4,060 15,150 9,000 16,330 0 0 0 0 0Staging - turbines 13,550 13,550 11,230 11,230 12,840 6,630 6,630 9,590 9,590 11,230Operations & Maintenance 0 0 0 0 0 0 0 0 0 0
COOS BAY, OR CLEVELAND, OH
NEW BEDFORD, MA PAULSBORO, NJ
MOREHEAD CITY, NC GALVESTON, TX
Garrad Hassan America, Inc. Page xviii

Document No. 700694-USPO-R-03 Assessment of Ports for Offshore Wind Development in the United States Issue: E Final
The results show that all six ports evaluated are well suited to host O&M activities and that little-to-no investment is required to close any gaps identified related to full O&M support. O&M ports are assumed to need to accommodate crew transfer and service vessels, while larger jack-up or heavy-lift vessels would be deployed out of a port designed to accommodate these vessels such as a construction staging port. As such, many large and small ports around the country can be expected to see a similar result and be able to support offshore wind project O&M needs with little or no upgrade cost required. This is advantageous to projects in that each one can then select one or more O&M ports that are in close proximity to the project site. By contrast, today’s ports generally require additional investment before they can serve as staging ports for offshore wind projects. The most common infrastructure improvement required is related to increasing the bearing capacity of the storage area and quayside. Based on the information gathered from ports around the country, typical bearing capacities are on the order of 5 t/m2, whereas turbine nacelles require bearing capacities of between 7 and 10 t/m2, depending on the size of the turbine. Furthermore, foundations require additional bearing capacity, with jackets needing between 10 and 20 t/m2 and monopiles needing bearing capacities that can exceed 20 t/m2. The most expensive gap identified by these results is related to the ability of jack-up vessels to jack up at the quayside. In ports where the seabed does not yet support jacking up, the costs of upgrading the seabed make turbine staging the most expensive operation for these ports. This study has assumed that seabed improvements would be made without changing the channel depth, thus requiring that material be removed by dredging before amendments can be added to strengthen the seabed. Summary From this work, the following key conclusions are drawn:
• Overall, the level of interest in U.S. ports supporting a domestic offshore wind industry is high.
• The physical requirements for offshore wind projects are more onerous than for traditional cargo. The most common example of this is the ground bearing capacity within the storage area and quayside; most U.S. ports require soil strength improvements before they can fully support project construction.
• The anticipated project deployment between now and 2030 will require between 1 and 5 ports per region. In some regions, facilities with significant functionality already exist, however improvements are expected at any port wanting to support staging and manufacturing operations.
• While there are currently no offshore wind farms installed in the United States, much of the required infrastructure already exists to serve other industries.
• The shortage of heavy-lift crane vessels will require U.S. ports to use onshore cranes to load and off-load vessels, thereby resulting in a larger ground bearing strength requirement when compared with typical European staging ports.
• Most U.S. ports can already support O&M activities such as crew transfer and service vessels.
The most common
infrastructure improvement
required is related to increasing the bearing capacity
of the storage area and
quayside.
Many large and small ports around the
country can be expected to see a similar result and
be able to support offshore wind
project O&M needs with little or
no upgrade cost required
Garrad Hassan America, Inc. Page xix

Document No. 700694-USPO-R-03 Assessment of Ports for Offshore Wind Development in the United States Issue: E Final
• The improvements required to support offshore wind will not typically preclude a port from continuing to service more traditional cargo. Given that the contracts with staging ports are expected to be for approximately 2 years, whereas ports typically require long-term commitments on the order of 10 to 20 years or more in order to designate specific facilities to an activity such as offshore wind staging, having the ability to support multiple industries is considered beneficial.
• In areas where SPMTs are to be used, a bearing capacity of 10 t/m2 is recommended to allow storage and transportation of wind farm components. On the other hand, to support the lifting and/or movement of onshore cranes, either in the storage area or at the quayside, additional ground strength is likely required and will be determined by the size of the load and specifications of the crane.
• At this early stage in the U.S. offshore wind industry, port designers may want to opt to design ports for added flexibility to best meet the project needs. For example, strengthening the storage area beyond the 10 t/m2 minimum allows cranes, SPMTs, and other technologies to lift and move component as needed. Early projects may benefit from this additional flexibility to accommodate the preferences of installation contractors and to facilitate viable solutions to unexpected logistic challenges.
It is clear that significant opportunities exist for port facilities that can provide support to the build-out and maintenance of offshore wind projects in the United States. These opportunities are summarized as follows:
• To achieve the DOE’s moderate growth scenario of 28 GW of offshore wind in the United States by 2030 as mapped out by Navigant, GL GH estimates that 20 projects (10 GW) are needed in the North Atlantic region, 4 projects (2 GW) in the South Atlantic, 8 projects (4 GW) in the Gulf of Mexico, 16 projects (8 GW) along the Pacific coast, and 8 projects (4 GW) in the Great Lakes.
• If capacities on this order of magnitude are developed, multiple port facilities within a given region will be required to meet the demand. In the Pacific region, a minimum of 5 staging ports will be required to meet the high demand in the latter years of the study period. The North Atlantic will require a minimum of 4 staging ports, the Gulf Coast and Great Lakes regions will each require a minimum of 3 staging ports. Lastly, in the South Atlantic, a minimum of 1 staging port will be required.
• Assuming these deployment levels, the number of actual ports would likely be larger since they often require close proximity to projects to minimize vessel transit time.
As U.S. ports and offshore wind developers look to work together on specific projects, they will encounter synergies and challenges. The challenges they face will include identifying sources of funding for the facility improvements required, and addressing ports’ typical desire to engage in long-term partnerships on the order of 10-20 years. Early projects will especially feel these challenges as they set the precedent for these partnerships in the United States. This study seeks to provide information about gaps, costs, and opportunities to aid these discussions. Given the level of interest from U.S. ports and the capabilities available today, GL GH finds that sufficient port infrastructure exists or can be developed to meet anticipated long term offshore wind energy project deployment.
To achieve 28 GW by 2030, GL GH
determined minimum regional
requirements:
North Atlantic: 20 projects (10 GW)
4 staging ports
South Atlantic: 4 projects (2 GW)
1 staging port
Gulf Coast: 8 projects (4 GW)
3 staging ports
Pacific: 16 projects (8 GW)
5 staging ports
Great Lakes: 8 projects (4 GW)
3 staging ports
Garrad Hassan America, Inc. Page xx

Document No. 700694-USPO-R-03 Assessment of Ports for Offshore Wind Development in the United States Issue: E Final
1 INTRODUCTION
This report was written for the U.S. Department of Energy (DOE or the “Client”) in partial fulfillment of the deliverables requested as part of Subtopic 5.1 “Optimized Ports Assessment” of DOE’s initiative “Removing Market Barriers in U.S. Offshore Wind.” In preparing this report, GL Garrad Hassan (GL GH) reviewed and evaluated the readiness of U.S. port infrastructure to support projected growth in the offshore wind industry in the United States over the period 2015-2030. This report, which was written under DOE Award Number DE-EE0005369, summarizes this study. 1.1 Background
In its 2008 report entitled “20% Wind Energy by 2030” [1], the DOE suggested that 20% of the nation’s electricity needs could be met by wind power generation by 2030. Given that the same report estimated that wind energy contribution in 2008 was between 1% and 2% of national electricity consumption, it is clear that a major ramp-up in wind project development is required if this aim is to be realized. Given the large area of U.S. territorial waters, the generally higher mean wind speeds offshore and the coastal locations of many energy demand centers, offshore wind power has the potential to become a significant contributor to these aims and to general wind energy expansion in the U.S. to 2030 and beyond. This report provides background into offshore wind port usage and then analyzes the capability of the current port infrastructure in the United States to support the targeted growth in offshore wind capacity in years 2015 – 2030 as described by a recent DOE report, written by Navigant Consulting, entitled “U.S. Offshore Wind Manufacturing and Supply Chain Development” [2]. The DOE supply chain report outlines three potential market demand growth scenarios for the U.S. offshore wind industry, considering high, moderate and low growth of the industry within the United States. For the purpose of this study, GL GH has modeled the ‘moderate growth’ DOE scenario defined in [2] as 28 GW installed capacity by 2030. GL GH considers the high, moderate, and low growth deployment levels put forth in [2] to be scenarios rather than projections for market development. The actual growth path followed by the industry will depend, among other things, on numerous political, technical, and social factors. Thus the information provided in this report is intended to provide guidance on the port infrastructure needs required to meet the moderate growth scenario of 28 GW installed offshore in the United States by 2030. It is not intended to represent GL GH’s or DOE’s projection of market development. 1.2 Market Potential
In order to meet the DOE’s high growth scenario of 54 GW installed capacity by 2030, the United States (U.S.) offshore wind industry will have to drastically expand its capacities over the coming years, particularly in terms of the provision of onshore port infrastructure aimed at the construction and operation of offshore wind projects. Port facilities are strategic hubs in the offshore wind farm supply chain, since all plant and transport logistics must transit through these facilities. Therefore, these facilities must provide suitable infrastructure in order to meet the specific requirements of the offshore wind industry. It is therefore crucial that Federal and State policy-makers and port authorities take effective action to position ports in the offshore value chain in order to best exploit their economic potential.
Garrad Hassan America, Inc. Page 1 of 153

Document No. 700694-USPO-R-03 Assessment of Ports for Offshore Wind Development in the United States Issue: E Final
1.3 Previous Studies
A number of previous studies have evaluated the readiness of a specific port or several ports near a specific project to support offshore wind activities. To GL GH’s knowledge, however, there has yet to be a study that takes a broader, national view. The present study seeks to fill this gap. Brief summaries of previous port readiness studies related to offshore wind are provided below. 1.3.1 Massachusetts
The Massachusetts Clean Energy Center commissioned an assessment of Massachusetts ports to identify facilities capable of supporting offshore wind projects in the Commonwealth. The consulting firm Tetra Tech EC prepared a report [3] in early 2010 that identified the South Terminal at the Port of New Bedford, MA as the recommended staging port in Massachusetts. The report included a financial analysis of the capital costs associated with the recommended port improvements and projected facility operating expenses and incomes. 1.3.2 Great Lakes
In September of 2010, the Great Lakes Wind Collaborative prepared a report [4] evaluating the ability of ports along the St. Lawrence Seaway to support onshore and offshore wind projects in the Great Lakes and their willingness to do so. The report also provides a description of each port in the area. 1.3.3 Maryland
The Maryland Energy Administration commissioned a review of the capabilities of ports within the state with a specific focus on the ability to support offshore wind projects in the region. The study [5], conducted by Kinetik Partners LLC, identified Dundalk Marine Terminal and Sparrows Point Shipyard Industrial Complex as top candidates for handling the needs and cargo for offshore wind projects. A cluster-based approach to facility development was recommended, involving turbine and component manufacturers, construction contractors, and other parts of the supply chain. 1.3.4 North Carolina
Researchers at North Carolina State University conducted an assessment of ports in North Carolina to evaluate their ability to serve as staging ports for offshore wind projects, and reviewed facility improvements necessary to enable the ports to support such projects [6]. That study reviewed turbine and vessel considerations and focused on the physical requirements for ports. Ultimately, the study recommended the ports of Morehead City and Wilmington for consideration as potential staging and maintenance facilities, with a slight preference for Morehead City due to its centralized location.
Garrad Hassan America, Inc. Page 2 of 153

Document No. 700694-USPO-R-03 Assessment of Ports for Offshore Wind Development in the United States Issue: E Final
1.4 Study Objectives
The primary goals of this study are (i) to develop an understanding of the existing port infrastructure capabilities available to support offshore wind energy projects in the United States, and (ii) to identify high-impact-per-cost opportunities for improving domestic ports to meet increasing demands from the offshore wind industry. Through this work and resulting report GL GH seeks to inform the economic development discussions between ports, project developers, and other stakeholders required to facilitate these improvements. From the outset, GL GH recognized that stakeholder engagement would be critical to achieving these primary goals and would allow the deliverables from this study to be most useful to the industry. Therefore, intelligence and feedback were solicited from a variety of industry stakeholders at several key stages of the study. These included:
• Feedback was sought from the offshore wind industry and port operators during the information gathering exercise aimed at describing and quantifying the requirements of port facilities for offshore wind activities;
• An early release of the Port Assessment Tool was shared with an industry review panel for review and comment before the tool was finalized and made available to the public;
• A draft of the final report was reviewed by a panel of industry and other key stakeholders consisting of project developers, port operators, vessel operators, consultants, academia, national laboratories, and government agencies.
1.5 Report Structure
The report is divided in three parts. Part I provides an introduction to key concepts related to offshore wind project deployment used throughout the remainder of the report. This part of the report also covers all port requirements for offshore wind industry and is intended primarily to benefit ports looking to support offshore wind activities within their facilities. Within Part I, Section 2 introduces the characteristics of an offshore wind farm, including details of the types of components that port handlers will encounter; Section 3 provides an overview of installation activities, describing the practical implications of what is required to build an offshore wind farm, along with real-life examples taken from Europe; the vessels required for offshore wind are discussed in Section 4. The above background information is then applied in Section 5 where port requirements are specifically described for standard component sizes. The remaining logistics for offshore wind are included in Section 5.13, which lists miscellaneous port requirements not considered elsewhere. Part II of this report covers the Port Assessment Tool, developed to assess the suitability of a port facility to meet a set of imposed project requirements, thereby identifying potential deficiencies and required areas for investment in order to meet the logistical requirements of the offshore wind farm industry. Section 6 describes the methodology adopted by GL GH to develop a publicly available tool, with which anyone already involved in or interested in the U.S. offshore wind industry may assess an individual port for offshore wind readiness. Part III of the report discusses a set of case studies conducted to illustrate the use of the tool and provide some relevant examples of port readiness for offshore wind in the U.S. The application of the tool in this context is described in Section 7 The gap analysis methodology described in Section 8 was utilized by GL GH to perform some preliminary opportunity assessments. A cost-benefit preview was also undertaken, as described in Section 9. Results obtained from the Port Assessment Tool and the cost benefit results for sample ports for five regions of the U.S. are summarized in Section 10. Section 11 outlines the trends and commonalities and Section 12 provides the key conclusions of the study.
Garrad Hassan America, Inc. Page 3 of 153

Document No. 700694-USPO-R-03 Assessment of Ports for Offshore Wind Development in the United States Issue: E Final
A set of appendices at the end of the document provide additional information on the functions behind the Port Assessment Tool and the ways that the tool calculates costs. Further discussion of the tool and the functions and assumptions within it is provided in the user documentation accessed through the tool website: www.offshorewindportreadiness.com.
Garrad Hassan America, Inc. Page 4 of 153

Document No. 700694-USPO-R-03 Assessment of Ports for Offshore Wind Development in the United States Issue: E Final
PART I: PORT REQUIREMENTS
Garrad Hassan America, Inc. Page 5 of 153

Document No. 700694-USPO-R-03 Assessment of Ports for Offshore Wind Development in the United States Issue: E Final
2 OFFSHORE WIND FARM CHARACTERISTICS
Figure 2-1 presents a diagrammatic representation of an offshore wind farm. Equipment is split between the offshore and onshore environments, with the installation, commissioning and operation of the former requiring specialist vessels that are required to operate out of port facilities.
Source: GL GH
Figure 2-1: Various Components of an Offshore Wind Farm
The following sections give a brief overview of the main components an offshore wind project. 2.1 Wind Turbines
For the purposes of this study, GL GH has considered wind turbines with power ratings ranging between 4 MW and 8 MW, the likely range of turbine sizes that would be principally used in the U.S. working towards its 54 GW of wind power scenario. Figure 2-2 presents a typical upwind offshore wind turbine. The primary components of an offshore wind turbine are labeled.
Garrad Hassan America, Inc. Page 6 of 153

Document No. 700694-USPO-R-03 Assessment of Ports for Offshore Wind Development in the United States Issue: E Final
Source: GL GH
Figure 2-2: Principal Components of an Offshore Wind Turbine
2.1.1 Wind Turbine Tower
The tower structure is usually a tubular section, which connects the flanged connection at the top of the foundation unit or transition piece to the nacelle. The tower structure is likely to consist of up to four tapering steel tubular sections, which are lifted into place and bolted together. 2.1.2 Nacelle and Blades
The nacelle typically houses the drivetrain and many of the power electronic and control components of the turbine. The general architecture of a typical gear-driven wind turbine nacelle is illustrated in Figure 2-3. The nacelle is usually installed at the site as a single unit, with the hub pre-installed. The wind turbine blades are then bolted onto the hub. However, larger machines (in the 5 MW range) have opted for a full rotor installation, which comprises the hub and blades being preassembled onshore and installed on the nacelle offshore.
Blade
Nacelle
Transition piece
Tower
Garrad Hassan America, Inc. Page 7 of 153

Document No. 700694-USPO-R-03 Assessment of Ports for Offshore Wind Development in the United States Issue: E Final
Source: www.nordex.dk
Figure 2-3: Wind Turbine Nacelle and Rotor
2.2 Wind Turbine Foundations
The offshore wind farm market is now entering its third decade; over this time several types of foundation have actually been deployed while a far greater variety have been proposed but as yet remain unproven or as demonstration units. The foundation types described below represent the technologies in common use today and include steel monopile structures, gravity base structures and jacket structures. 2.2.1 Steel Monopile Structures
Monopile structures have been proven as economic solutions in Europe across various soil conditions and water depths. Steel monopile foundations feature in 73% of all operational offshore projects, and will be used in 75% of projects currently under construction or contracted. Hence, steel monopiles offer a well understood design solution, though the recent industry-wide issues surrounding grouted joints indicate that this aspect requires improvement. Solutions for the grouted joint design of new build monopile foundations have been proposed (and in the case of shear keys, successfully implemented), so it is likely that monopiles will provide an economic and efficient solution in the future. The monopile foundation benefits from the combined advantages of simplicity of fabrication, and ease of installation. In addition, the monopile structure, due to its simplicity, offers potentially good resistance against the fatigue loads produced from the wind turbine. A monopile foundation consists of a single steel pile, which is embedded into the sea bed. Figure 2-4 below shows a typical monopile foundation design. The depth of pile penetration into the sea bed and the pile diameter and wall thickness are determined principally by the maximum water depth and rated capacity of the wind turbine.
Garrad Hassan America, Inc. Page 8 of 153

Document No. 700694-USPO-R-03 Assessment of Ports for Offshore Wind Development in the United States Issue: E Final
The maximum water depth is that which corresponds to the highest probable combination of high tide and storm surge. The exposure of the site (in terms of the extremity of the wind and wave climate) and the ground conditions at the site will also influence the size of the monopile required, including the depth of pile penetration. The size of the wind turbine is related to its installed capacity and hence the larger the machine, the larger the pile diameter and the greater the ground penetration will tend to be.
Source: GL GH
Figure 2-4: Wind Turbine Substructure Concept – Monopile
Typically, the turbine tower is mounted onto the foundation via a transition piece which itself is fixed onto the pile using a specialized grouted joint. The purpose of the grouted joint is to take up any misalignment tolerances that inevitably occur during installation of the monopile, and provide continuity of structural load transfer between the monopile and the turbine tower. The level of the top of the transition piece, or more specifically the level of the platform, is determined by the necessity to maintain adequate clearance over the crests of waves during storm conditions. On exposed sites with high tidal ranges this can place the platform up to 20 m or more above the water level shown on navigation charts.
J-tube
Garrad Hassan America, Inc. Page 9 of 153

Document No. 700694-USPO-R-03 Assessment of Ports for Offshore Wind Development in the United States Issue: E Final
The J-tube, illustrated in Figure 2-4 above, is a steel tube at the base of the foundation that protects the electrical cable leading either from the turbine to the next turbine or from the turbine to the substation. Monopile weights vary with water depth and turbine size, as well as wave climate severity, and soil strengths, and have typically ranged between 250 and 500 tonnes to date. Heavier monopiles are likely in the future, potentially as heavy as 1000t or more as the design limits are pushed. A disadvantage of the monopile is that, at the sizes which can be relatively easily installed by piling, there is a lack of structural stiffness in deeper waters to maintain the structural resonant frequency range required by turbine manufacturers. This type of structure is therefore well suited for sites ranging in water depth from 0 m to 35 m, although with large turbines, the limiting water depths in which the maximum installable monopile diameter is usable will be slightly less than for smaller turbines. 2.2.2 Gravity Base Structures
Gravity Base Structures (GBS) typically take one of the two forms illustrated in Figure 2-5. Although steel GBS foundations have been proposed, those which have been deployed to date have been made of concrete, for reasons of fabrication cost. Hence, this type of structure is sometimes termed a Concrete Gravity Structure or Concrete Gravity Base Structure. Concrete gravity bases of both narrow shaft and conical form have been used on a number of offshore wind farms in Northern Europe, with approximately 168 installed to date and 90 being planned for construction. Most of these foundations have been of the narrow shaft form, with six foundations at the Belgian Thornton Bank Project being of the conical design. To date, all GBS foundations for wind turbines, except those of Thornton Bank (consisting of just six turbines at approximately 25 m of water depth), have been installed in rather shallow waters. As a result, the required lifting capacity has been well below 2,000 tonnes, ensuring that the transport and installation of the foundation could be executed using inexpensive barges customized for the installation process. For some projects, such as Middelgrunden just outside Copenhagen (Denmark), the foundations were manufactured in a dry dock and transported to the site partly submerged, thus reducing the required lifting capacity.
Garrad Hassan America, Inc. Page 10 of 153

Document No. 700694-USPO-R-03 Assessment of Ports for Offshore Wind Development in the United States Issue: E Final
Source: GL GH
Figure 2-5: Wind Turbine Substructure Concept – Gravity Base Structure
Based on available information from the Thornton Bank project, it is evident that new methods must be considered to ensure relatively swift and continuous transport and installation processes. These processes need to be more independent of wave height and frequencies. Each variant of the GBS has inherent advantages and disadvantages, while there are also benefits and limitations common to the GBS concept in general. The main technical limitation of GBS foundations is their sensitivity to ground conditions. They are not suitable for sea beds with very soft deposits, due to failure under the extreme loading which tends to dominate GBS design. The usual way of accounting for sensitivity to soft deposits is to dredge to a more competent layer. Another ground condition-related issue affecting GBS foundations arises from their inherent stiffness. Assuming acceptable ground conditions, concrete gravity bases can be much stiffer than monopiles, giving rise to higher structural natural frequencies. This may lead to structural natural frequencies outside the target frequency window for the wind turbine. This problem is magnified at locations where rock head occurs very close to the sea bed and is overlaid with sand, providing a near rigid support to the base. To reduce the overall size of the foundation pad of the structure, it is advantageous to ensure that the foundation is installed at a level below the surrounding sea bed, where the soil bearing capacity generally is increased. Scour protection is essential but the amount of protection can be reduced if skirts are installed at the circumference of the foundation pad penetrating into the sea bed. However, the presence of very stiff clay, the laying of a stone filter bed prior to the installation, as well as boulders, can lead to significant difficulties in achieving the intended level of skirt penetration into the sea bed.
Garrad Hassan America, Inc. Page 11 of 153

Document No. 700694-USPO-R-03 Assessment of Ports for Offshore Wind Development in the United States Issue: E Final
The principal advantage of gravity type concepts is that they avoid the need for driving or drilling into a relatively elevated rock head. Gravity solutions are heavily reliant on good quality soil data to minimize risks; without such data, this benefit is reduced. This can be mitigated to some extent by a dredging and ground improvement operation (with its associated costs). Before adoption of any gravity solution as a preferred structural solution, detailed data pertaining to the cyclic performance of the soils would be required, the likes of which would necessitate a fairly comprehensive program of soils laboratory testing. Even when detailed geotechnical data are available, it is possible that the presence of significant soft silt layers may preclude the use of GBS-type foundations. 2.2.3 Jacket Structures
A general jacket foundation form is illustrated in Figure 2-6. Jacket structures appear to be favored for the support of wind turbines in the 5 MW to 7 MW range. Fabrication complexity, especially at the interface with the tower, is a specific issue that needs to be resolved, though several forms of simplified transition structure are in development, which avoids this complexity. Alternative forms of transition structure are also often dictated by design for natural frequency limits. In recent years, jacket structures have been developed to support REpower 5M wind turbines at the Beatrice demonstrator site off northeastern Scotland, at the Alpha Ventus wind farm in the German North Sea and at the Ormonde wind farm in the Irish Sea. These deployments cover a wide range of water depths, from approximately 20 m at Ormonde, to 30 m at Alpha Ventus, to 45 m at the Beatrice demonstration site. Together, these three sites indicate that jacket foundations are viable options for larger wind turbines, such as the RE5M, in a fairly broad range of water depths. Beatrice and Alpha Ventus were commissioned in 2007 and 2010, respectively; Ormonde was fully operational at the start of 2012.
Garrad Hassan America, Inc. Page 12 of 153

Document No. 700694-USPO-R-03 Assessment of Ports for Offshore Wind Development in the United States Issue: E Final
Source: GL GH
Figure 2-6: Wind Turbine Substructure Concept – Jacket (pre-piled & post-piled)
The nature of the jacket concept lends itself to a considerable number of variant geometries. These include shortened jackets which do not emerge above sea level, 3- and 4-legged jackets, jackets which might be piled in-leg, alternative leg inclination angles and so on. Secondary steelwork such as boat landings, working and intermediate access platforms are mounted on the main lattice and would be entirely pre-installed at the fabrication yard. J-tubes are generally mounted to the brace members and are enclosed within the lattice. In addition to the geometry options noted above, a significant design and fabrication decision involves the inclusion ofcastings at nodes. The use of castings enables the stress concentration factors at joints to be reduced, leading to a reduction in material. These savings need to be offset against the increased cost of providing the castings together with potential program constraints on the delivery of castings. To date only one prototype with cast nodes is known; this is a test structure for a proposed variable base jacket so that the castings used are standardized for different structures. A significant installation decision is whether to utilize pre-installed piles or post-installed piles. The use of pre-installed piles negates the need for pile sleeves, saving an appreciable amount of steelwork. This form of solution would utilize a sea bed template through which the piles are installed. Once the piles are installed, the jacket is then lowered onto the piles and levelled by jacking the jacket structure level, reacting against the pile tops. The jacket structure is then grouted into place on the piles. The pile-jacket interface may also be achieved by swaging in some circumstances. The suitability of the pile for swaging would have to be examined in terms of strength or fatigue endurance.
Garrad Hassan America, Inc. Page 13 of 153

Document No. 700694-USPO-R-03 Assessment of Ports for Offshore Wind Development in the United States Issue: E Final
In the post-piled case, the jacket structure is first placed on the sea bed, resting on mud-mats on its underside; the piles are then driven through the pile sleeves, the structure leveled and grouted in place. 2.3 Electrical Balance of Plant
2.3.1 Inter-Array Cables
The inter-array cables connect the wind turbines into strings and then connect the strings to the offshore substation platform(s). The cables between adjacent wind turbines are relatively short in length and depend on the wind farm layout. The cables between the offshore substation and the wind turbine strings are typically longer. At present, inter-array cables in Europe are typically operated at a voltage level of 33 kV; in the United States, 33 kV or 34.5 kV is expected to be the norm. Typical conductor diameters range from 120 mm2 to 630 mm2 depending on usage and capacity; this range of cable could carry between approximately 20 MW and 35 MW. In the future, it is expected that cables will be operated at around 66 kV, which would enable savings through the use of fewer wind farm array circuits. Figure 2-7 below shows a typical cross-section of a 3-core cable with fiber optic communications medium (9). The steel wire outer armoring (13) provides mechanical protection for the cable.
Source: http://www.zttcable.com.hk/en/submarine.htm
Figure 2-7: Cross-Section of Inter-array Cable
2.3.2 Offshore Substation
Whether an offshore wind farm has an offshore or onshore substation depends primarily on the size of the wind farm, distance from shore and distance from the grid connection point. Typically, wind farms farther than approximately 10 km from land have substations offshore. The substation accommodates the transformers required to increase the distribution voltage (33 kV or above) of the inter array cables to a higher voltage of typically 110 – 245 kV. From the offshore substation, the export cables then carry the power to the landfall location. As wind farm capacities increase and move farther offshore, there is a requirement for increased electrical equipment ratings and hence, for larger substations. When wind farms are located at substantial distances from shore, the
Garrad Hassan America, Inc. Page 14 of 153

Document No. 700694-USPO-R-03 Assessment of Ports for Offshore Wind Development in the United States Issue: E Final
losses in the electrical system can become significant. To minimize losses as far as possible, voltages are stepped up, for example from 33 kV to 115 kV. Power Export Technology: HVAC or HVDC
Eventually, when distances are large, transporting power with reasonable losses using High-Voltage Alternating Current (HVAC) becomes technically challenging and may justify the use of High-Voltage Direct Current (HVDC) technology, which is a step change in the size of the required electrical infrastructure. Figure 2-8 presents an approximation for the optimization of the power export technology as a function of the distance from the shore and the capacity of the wind farm. If the power is to be exported from the wind farm using HVDC, a separate offshore platform may also be installed to house the plant which converts the alternating current (AC) that is generated by the wind turbines to direct current (DC) for the transmission of power to shore.
Figure 2-8: Export Cable Technology vs. Distance
The approach of utilizing several substations for large projects and for projects with HVDC output is considered to be a likely trend as the European offshore wind industry progresses and projects move farther offshore. Assuming a wind farm layout with multiple AC step-up substations rather than a single substation, shorter lengths of array cable with lower voltages and losses, as well as a reduced weight per substation can be achieved. Having a separate HVDC substation reduces individual topside weight and therefore enables quicker and cheaper installation. The tendency to divide substation tasks across a number of substation units will limit the growth of substation size, though this is difficult to predict as the optimal breakdown is site specific. Substation Foundation
The substation(s) require foundations on which to place the topside that contains the equipment mentioned above. Options for the foundation design are similar to those for turbine foundations but the topside weights involved mean that the substation foundations are often significantly larger.
Garrad Hassan America, Inc. Page 15 of 153

Document No. 700694-USPO-R-03 Assessment of Ports for Offshore Wind Development in the United States Issue: E Final
The substation foundation unit is likely to use one of the design concepts described above for the wind turbines, most probably a jacket structure. Figure 2-9 below shows typical configuration for a jacket mounted offshore substation.
Source: GL GH
Figure 2-9: Offshore Substation on Jacket Foundation
The installation of the offshore substation support structures will be as described in 3.4.1. 2.3.3 Export Cables
The export cables transmit the electricity from the offshore substation(s) to the designated onshore landfall point. AC export cables are similar to the array cables, although the insulation requirements are more significant. Therefore the dimensions of a 132 kV 500 mm2 cable are greater than those of a 33 kV 500 mm2 cable. HVDC cables are much simpler, as shown in Figure 2-10 below, although in most cases two will be required: a send and return or positive and negative.
Garrad Hassan America, Inc. Page 16 of 153
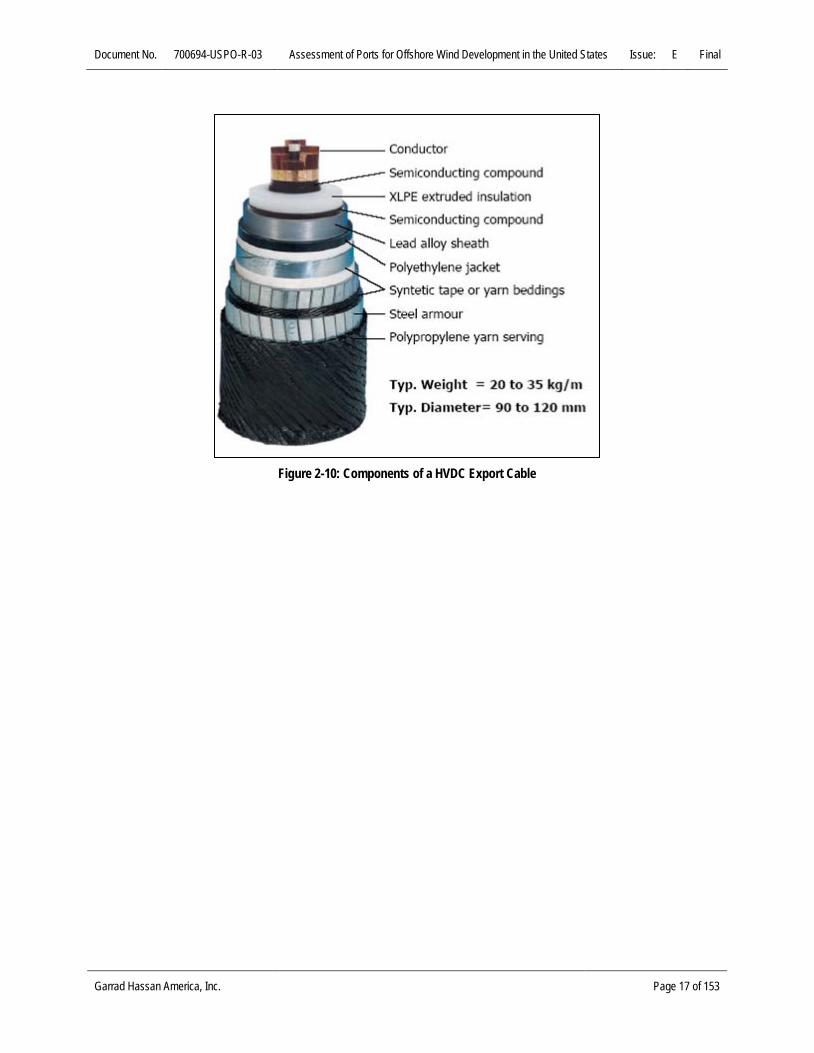
Document No. 700694-USPO-R-03 Assessment of Ports for Offshore Wind Development in the United States Issue: E Final
Figure 2-10: Components of a HVDC Export Cable
Garrad Hassan America, Inc. Page 17 of 153

Document No. 700694-USPO-R-03 Assessment of Ports for Offshore Wind Development in the United States Issue: E Final
3 OFFSHORE WIND FARM INSTALLATION ACTIVITIES
3.1 Wind Turbine Rotor Installation
To date, the majority of wind turbines have been installed with single blade lifts; however, in a few isolated cases, two of the three wind turbine blades were pre-attached to the nacelle prior to load-out onto the installation vessel, with the objective of minimizing offshore working. For larger wind turbine sizes there is some market movement towards full rotor lifts in order to reduce loading on the gearbox. It is not yet clear which approach will become the predominant installation strategy for large wind turbines. The following sections detail the different methodologies. 3.1.1 Single Blade Lift
The nacelle and three wind turbine blades are loaded out as four individual components onto the transportation or installation vessel and sea-fastened into position. On arrival at the site, the nacelle is lifted into place and bolted into position. The three blades are then individually lifted into position and connected to the nacelle’s hub.
Major Components Demonstration
Source: www.dongenergy.com
Figure 3-1: Illustration of a Single Blade Lift
3.1.2 Bunny-ears Lift
For this installation method, two of the three wind turbine blades are connected to the nacelle in the construction or staging port. The result resembles ‘bunny ears’ hence the method’s name. The nacelle, complete with two wind turbine blades is then loaded out onto a transportation or installation vessel and sea-fastened into position. The third wind turbine blade is loaded separately. Upon arrival at the site, the nacelle complete with two wind turbine blades is
Garrad Hassan America, Inc. Page 18 of 153

Document No. 700694-USPO-R-03 Assessment of Ports for Offshore Wind Development in the United States Issue: E Final
lifted into place and bolted into position. The third wind turbine blade is then lifted into position, pointing vertically downwards, and connected to the nacelle’s hub.
Major Components Demonstration
Source: NordseeWind
Figure 3-2: Illustration of a Bunny-ears Lift
There has been an industry move away from the ‘bunny ears’ installation methodology due to the potential logistical limitation of transporting the configuration to the wind farm site (port over-head obstructions, etc.), as well as issues surrounding atypical loading of the gearbox during transit to the wind farm site. 3.1.3 Full Rotor Lift
In this method, all three blades are mounted to the rotor hub onshore. The rotor, complete with blades, and nacelle are loaded onto the transportation or installation vessel and sea-fastened into position. On arrival at the site, the nacelle is lifted into place and bolted into position. The rotor assembly is then lifted into position. GL GH has assumed full rotor lift for wind turbine generator (WTG) installation.
Garrad Hassan America, Inc. Page 19 of 153

Document No. 700694-USPO-R-03 Assessment of Ports for Offshore Wind Development in the United States Issue: E Final
Major Components Demonstration
Source: http://193.88.185.141/Graphics/
Figure 3-3: Illustration of a Full Rotor Lift
3.1.4 Full Wind Turbine Installation
This method involves a complete assembly of the wind turbine onshore, which is then loaded out onto a transportation or installation vessel and sea-fastened into position. On arrival at the site, the complete assembly is lifted onto the foundation unit and fixed.
Major Components Demonstration
Source: www.scaldis-smc.com
Figure 3-4: Illustration of a Full Wind Turbine Installation
Garrad Hassan America, Inc. Page 20 of 153

Document No. 700694-USPO-R-03 Assessment of Ports for Offshore Wind Development in the United States Issue: E Final
3.1.5 Floating Turbine Installation
This final method is still in the prototype stage and is mentioned here for completeness but has not been evaluated quantitatively during the course of this study. Floating turbine installation consists of installing the fully assembled turbine on the floating foundation and then towing the entire assembly out to site. On arrival at the site, the foundation is ballasted and anchored to the ocean floor. 3.2 Foundation Installation
3.2.1 Steel Monopile Structures
The majority of foundations installed to date have been steel monopiles. The advantages of this foundation type are that it is relatively cheap to manufacture, requires little or no sea bed preparation, and can be installed with one simple piling operation in a wide range of soil conditions. Transportation to Site
The method employed for transporting the monopiles from the manufacturer’s facilities to either a staging port or the offshore wind farm site greatly affects the offshore installation operations.
Source: Bonn & Mees website
Figure 3-5: Monopiles being loaded onto a Deck Barge by Shearleg Cranes
Monopiles can be transported in a number of ways including:
• Plugging the pile and floating it to site, using its own buoyancy;
• Loading one or more piles onto the deck of the installation barge / jack-up; and
Garrad Hassan America, Inc. Page 21 of 153

Document No. 700694-USPO-R-03 Assessment of Ports for Offshore Wind Development in the United States Issue: E Final
• Using a feeder vessel to transport the piles out to the site. Feeder vessels can be:
• Towed deck barges, with or without spud-legs – this requires dynamic offshore lifts (cheap spud-legs offer some stability for offshore lifts, multiple vessel options);
• Jack-up barges (“static” offshore lifts, more expensive than deck barges);
• Floating crane vessels, with or without heave-compensated cranage (costly); and
• Cargo vessels with or without cranes fitted (fast, but dynamic lifts). Impact Driving Steel Monopiles
Source: Burbo Bank Wind Farm website
Figure 3-6: Steel Monopile being driven by a Menck Hydrohammer – Jack-up Excalibur
The usual monopile installation methodology is to use a jack-up vessel as a piling guide, and to use the onboard crane to both lift the pile into a guide-frame (also called the piling gate), and place the hammer on top for pile-driving, as shown in Figure 3-6. Lifting the pile vertical usually requires cranage with a lift capacity in excess of the weight of the pile. Two exceptions to this vessel crane lift-capacity limitation exist:
• A technique called semi-buoyant lifting, in which the pile is plugged and the lift-weight seen by the installation crane is reduced. This technique potentially allows installation vessels with relatively small lift capacities to install heavy foundations. It does however require complicated marine operations planning and supervision, and is not a preferred technique for most installation sites.
• A specialist piling frame, for example as seen fitted to jack-up Excalibur in Figure 3-7, which has a jack-up pile-guide which lifts and rotates the pile into the vertical, independently of the crane.
Garrad Hassan America, Inc. Page 22 of 153

Document No. 700694-USPO-R-03 Assessment of Ports for Offshore Wind Development in the United States Issue: E Final
Source: CRG, Gunfleet Sands Wind Farm
Figure 3-7: Piling Frame on Excalibur Awaiting a Floating Monopile
If the installation vessel does not have cranage in excess of the weight of the pile, it is possible to use a different vessel which does have the required cranage in conjunction with the installation vessel as a piling barge. Monopile diameters installed to date have varied from 4 m upwards and diameters of 6.5 m or larger are being discussed for installation in wind farms in the future, with forged piling hammer anvil diameters being the limiting factor. At present there is an effective limit of approximately 7 m diameter. There are plans to synchronize multiple hammers on one pile, which would remove the upper limit, meaning the larger turbines in deeper water could take advantage of monopile foundations, before requiring recourse to jackets or other designs, though this technique is still in the prototype stage and has yet to be successfully demonstrated on large offshore wind turbine monopiles. A key design factor is usually fatigue life. Great care must be taken regarding the planned driving sequence during monopile design, as driving the pile too hard could reduce the fatigue life of the monopile below that needed for the 20-year wind turbine design life operation. Drive-Drill-Drive Technique
The ground conditions of some sites include layers of harder material which cannot be driven through without damaging the pile. The installation technique in these circumstances is drive-drill-drive. This technique consists of driving the pile down to the harder layer, before using a large-diameter reverse circulation drill, to remove the upper layer, and then drilling through the hard layer, generally at a slightly smaller diameter than the pile to ensure subsequent good contact between the pile and the soil. The drill is then removed and the pile is driven down to its target depth. This technique is clearly far more time-consuming than simply driving the pile, and given the fact that jacket-leg piles can be made far more robust, and driven through harder sub-strata, it would appear logical to revert to jacket foundations if monopiles cannot be driven. However, given the large cost differential between the monopile and steel
Garrad Hassan America, Inc. Page 23 of 153

Document No. 700694-USPO-R-03 Assessment of Ports for Offshore Wind Development in the United States Issue: E Final
tubular jacket-structures, and the sea bed preparation which they sometimes require, it is often economical to carry out drilling operations rather than to install jackets. This same reverse circulation drilling equipment is often required as a contingency, if site investigation shows great local variations in ground conditions, or in areas where there are known to be glacial till deposits, as glacial scouring often entrains large boulders, which may require drilling, to allow the pile to achieve target depth. Rock-Socketed Monopiles
It is possible to fit steel monopiles in rock. A similar drill to that described for drive-drill-drive installation is used to drill a hole slightly larger in diameter than the monopile. The monopile is then lowered into the socket, and is grouted in place. Two early offshore wind farms have installed monopiles in this way to date – Blythe in the UK, and Yttre Stengrund in Sweden. This technique is considerably slower than impact piling. However, it shares the advantage that there is no requirement for sea bed preparation at most sites. It has a further advantage that no piling noise is generated, so there are some sites where this technique may afford the opportunity to install foundations during periods during which the project environmental assessment has concluded that piling noise would be unacceptable. This significant advantage must be offset against the likelihood that there will be environmental constraints placed on the discharge of the drill uprisings. During drive-drill-drive operations at early wind farms off North Wales, foundation contractors were allowed to discharge the cuttings straight over the side of the barge, to form an added layer of scour protection around the bottom of the pile. This allowed large plumes of turbid water to form, and with the strong currents at the site, the impact would have been felt well downstream from these sites. It has been shown that this had little measurable material environmental impact in this case and it is understood that it may be accepted in future developments, and may form a test-case for other sites, although there may be stricter constraints placed on works by other jurisdictions. 3.2.2 Gravity Base Installation
The installation method for GBS foundations depends on their design and construction. The difficulty with offshore GBS installation lies in the weight of the structure. To handle this weight, several methodologies are available, namely:
• If the GBS is constructed on the quayside (or transported to the quayside once constructed), a sufficiently powerful heavy lift crane vessel is required to lift the GBS directly from the port and transport it to the site for installation. Alternatively, multiple GBSs can be loaded onto a barge using the heavy lift vessel, then transported to the site, where the heavy lift vessel is used again to lower them onto the sea bed.
• If the GBS is constructed on a barge, the barge needs to be taken to the site, where a sufficiently powerful heavy lift crane vessel is required to lift it from the barge and onto the sea bed.
• If the GBS was constructed in a dry dock, there are two options for transportation to the site and installation. The GBS can be made semi-buoyant and towed to site, using a barge with a frame/support structure, or a crane vessel supporting the weight of the GBS. Alternatively, the GBS can be made fully buoyant and towed to site using an appropriate barge or vessel. Once at the site, the GBS can then be lowered and ballasted.
Garrad Hassan America, Inc. Page 24 of 153

Document No. 700694-USPO-R-03 Assessment of Ports for Offshore Wind Development in the United States Issue: E Final
Often, the ground at the site needs to be prepared before the GBS can be placed on the sea bed. In order to improve the soil bearing capacity, dredging is often performed to remove the layer of quaternary deposits, as discussed in Section 2.2.2. 3.2.3 Jacket Structures
Two vessels are usually required for jacket foundation installation. It is assumed that pin-pile installation precedes jacket installation by an adequate lead-time, thereby removing any conflict between the two operations. Pin-pile Load-out
The pin-piles are loaded out onto a small jack-up vessel using a crawler crane. It is generally assumed that the barge can accommodate up to four pin-piles (one foundation set). Further to these, a pin-pile template is loaded out. All items are sea-lashed to the deck as part of the vessel’s seaworthiness preparations. Pin-pile Installation
A degree of sea bed leveling may be required prior to the arrival of the jacket and this would be undertaken using dredging equipment with high-resolution sonar. The requirement for sea bed dredging will be wholly driven by the results of any geological campaign at individual turbine locations. Assuming that pin-piles are pre-installed, a piling template is lowered onto the sea bed. The template is assumed to be part of the jack-up spread and is re-usable for each turbine location. Piles are individually lowered into the pile-guides and a suitable hydraulic hammer is used to drive them to their design depth.
Figure 3-8: Pre-Installation of the Jacket Piles through a Re-usable Template
Hydraulic hammer
Pin Pile
Temporary template
Garrad Hassan America, Inc. Page 25 of 153

Document No. 700694-USPO-R-03 Assessment of Ports for Offshore Wind Development in the United States Issue: E Final
These hydraulic hammers are designed to operate with mobile power supplies that are hired in conjunction with the hammer. Jacket Installation
Following the installation of pin-piles at the majority of foundation locations, jacket lattice structures are installed. Jackets are transferred by crawler crane or self-propelled modular transporter (SPMT), as discussed further in this report, from their respective storage area to a large floating barge. Jackets are sea-fastened to the deck, and the barge transits to site. Prior to the installation of each jacket, it is assumed that the pin-piles are cleaned using a high-pressure remote operated vehicle jet. This is to ensure that all marine growth and dirt is removed from the piles, prior to the grouting of the jacket’s leg spigots into place. Connection of pin-piles and jacket space-frame would be achieved through in-situ grouting between a pile sleeve and the pin-pile, or using a swaging operation. Grouting of the pile involves pumping cement grout into the annulus between the pile and the spigot. The grout is high strength structural cement which when fully hardened (approximately 28 days) provides a solid connection between the pile and the lattice structure. This operation would be conducted by a separate vessel spread, freeing the installation vessel to continue jacket installation at the subsequent turbine locations. Swaging involves deploying a specialized tool inside the pin-pile. Water is pumped through this tool at very high pressure, which forces the pile to expand and deform outwards into a specially cut groove on the inside wall of the pile sleeve. This process usually takes approximately 2 hours per pile and has the benefit of avoiding the use of cement grout, while avoiding the generation of any significant noise. However, there remain questions about the effectiveness of this process for structures subject to high levels of fatigue; GL GH has therefore assumed a grouted connection.
Figure 3-9: Lifting and Placement of the Jacket Structure on Pre-installed Pin-piles
Garrad Hassan America, Inc. Page 26 of 153

Document No. 700694-USPO-R-03 Assessment of Ports for Offshore Wind Development in the United States Issue: E Final
3.3 Subsea Array Cables
Array cables are pre-cut into lengths to match the required cable routing and then stored in the manufacturing port or transported to the staging port. Once a string of foundations has been laid, the array cabling for those foundations is loaded out onto the array cabling vessel using crawler cranes. A cable barge or a specialist cable installation vessel is mobilized to the project site. The cables are supplied either on cable reels or as a continuous length. The vessel transits to site and takes up station adjacent to a wind turbine structure and either holds station on Dynamic Positioning (DP) or sets out a mooring pattern using anchors. A cable end is then floated off from the cable reel on the vessel towards the wind turbine structure and connected to a pre-installed messenger line in the J-tube. The messenger line allows the cable to be pulled up the J-tube. The cable is then pulled up the J–tube in a controlled manner with careful monitoring. When the cable reaches the cable termination point, the pulling operation ceases and the cable joint is then made. The cable is laid away from the J-tube towards the J-tube on the second wind turbine structure. The cable installation vessel would either move under DP control or by hauling on its anchors, redeploying the anchor pattern as required. If the cable is being buried simultaneously with the laying of the cable, this would be achieved by means of a subsea cable plow or jet-assisted plow. Alternatively, the cable would be laid into a trench in the sea bed and buried later using a Remotely Operated Vehicle (ROV) which is purpose built for cable burial. Figure 3-10 presents the Global Marine 'Eureka' ROV, an example of this type of vehicle. When the cable installation vessel nears the J-tube on the second wind turbine structure, the cable end is taken from the reel, ready for pulling up the second J tube. The cable end is attached to the messenger line from the bell-mouth of the second J-tube. A tow wire is taken from the cable installation vessel and connected to the messenger line at the top of the J–tube and the pulling operation is repeated in the same manner as was employed at the first J-tube. It is probable that a 'lay loop' of cable would be laid on the sea bed close to the second J-tube to accommodate the slack, or over-length allowance (as the final cable end is released from the cable drum). The cable burial ROV is launched and then positions itself over the cable to be buried. The ROV is likely to be a tracked vehicle and the ROV may have to temporarily deploy ramps onto the cable to allow the ROV to safely track over the cables without damaging the cable. Once in position over the cable, the burial process can commence. The target burial depth is likely to be 1-2 m. Burial would be achieved using specialized burial tools which are fitted to the ROV.
Garrad Hassan America, Inc. Page 27 of 153

Document No. 700694-USPO-R-03 Assessment of Ports for Offshore Wind Development in the United States Issue: E Final
Source: www.mpi-offshore.com
Figure 3-10: Subsea Remotely Operated Vehicle (ROV)
When the main burial operation of each array cable has been completed, it is necessary to revisit the exposed ends of the cable lying on the sea bed surface close to each of the J-tube exit points. Three potential options exist to protect these end sections of cable, namely:
• Option 1: Use diver intervention with hand-held jetting lances and air lift devices to manually excavate trenches close to the J-tube ends of the cable. This option is subject to suitable ground conditions.
• Option 2: Use concrete mattresses, which are lifted and placed over the cable sections to protect the cables. This methodology is sometimes supplemented with the use of sandbags to stabilize the edges of the mattresses.
• Option 3: Use grout bags, which are placed empty over the lengths of cable and then inflated with structural grout. The grout then cures to provide an effective over cover protection system for the cables. This approach requires diver assistance.
3.4 Offshore Substation
3.4.1 Substation Foundation Installation
The substation foundation is generally a jacket foundation, although monopile and concrete gravity structures have been used to date. Installation will be realized in a similar manner to the wind turbine foundations, though sometimes the heavy lift vessel used for the topside installation is also used for the foundation, as the foundation has to be larger. 3.4.2 Substation Topside Load-out
The sub-station is usually manufactured at a port facility close to the wind farm project site. Fabrication is likely to be undertaken some way from the quayside, therefore it is necessary for the substation topside to be transported to the quayside using SPMTs and lifted onto the heavy-lift vessel.
Garrad Hassan America, Inc. Page 28 of 153

Document No. 700694-USPO-R-03 Assessment of Ports for Offshore Wind Development in the United States Issue: E Final
3.4.3 Substation Topside Installation
The heavy–lift crane vessel installs the sub-station topside directly onto the sub-station foundation as shown in Figure 3-11. This can be done in a single lift or in separate lifts of deck and sub-modules. After placement of the topside, fastening and welding operations are carried out by crews accessing the structure by work boats.
Source: www.offshore-energy.co
Figure 3-11: Substation Topside Installation (heavy-lift crane vessel)
3.5 Subsea Export Cable
There are two potential methods by which the export cables can be installed:
• Installing the cables from the wind farm to shore; or
• Installing the cables from shore to the wind farm. Due to the lengths of cable involved, it is envisaged that the cables would be installed using a subsea cable plow, which would bury the cables simultaneously with the laying of the cable from the main cable installation vessel. The cable would be stored in either a static cable tank or a powered cable carousel. The cable installation vessel would also be equipped with cable handling equipment to control the tension during the cable lay and to provide holdback to control the rate of cable pay-out. The cable installation vessel is likely to be a DP vessel or a barge using a mooring pattern of anchors. The DP vessel would be self-positioning; however, a barge would use up to eight anchors in a mooring pattern to control position and would haul against these anchors to move along the export cable route. The cable installation barge would also have to utilize pre-installed ground anchors at the shore for cable handling operations close to the shore. These barges are typically flat bottomed, which allows them to operate in very shallow waters and also to safely 'ground' on a receding tide. An example of such vessel is shown in Figure 3-12.
Garrad Hassan America, Inc. Page 29 of 153

Document No. 700694-USPO-R-03 Assessment of Ports for Offshore Wind Development in the United States Issue: E Final
Source: www.marinetraffic.com
Build year 1930
Type DP Cable Installation
Length [m] 82
Turntable capacity [t] 1800
Figure 3-12: Export Cable Installation Vessel (Henry P. Lading)
The following procedure is used to install the export cables from the shore landing point to the offshore wind farm:
• The cable installation vessel arrives at a location close to the shore landing point, approaching the shore at high tide.
• The cable end is passed from the cable installation vessel and connected to a tow wire from an onshore winch. The cable end is then floated off from the vessel and towed towards the shore. When the cable end reaches the beach a series of portable roller sets are laid on the beach to reduce friction and allow the cable end to be pulled up to the cable onshore jointing chamber.
• The cable end is then secured with a strain termination at the joint transition pit.
• The subsea cable plow is then carefully deployed to the sea bed. The cable installation vessel slowly moves away from the shore, establishing catenaries for both the tow wire to the subsea plow and the export cable.
• The subsea cable plow is then launched from the cable installation vessel and the simultaneous laying and burial of the cable commences with the vessel moving away from the shore. Figure 3-13 shows a cable plow burying cables at the shore being pulled towards the host barge, which has been deliberately grounded on the beach before re-floating at high tide and moving away towards the wind farm, simultaneously laying and burying the subsea cable.
• The plow cuts a narrow trench in the sea bed, typically 250 mm wide, and buries the cable to a target depth of 1-2 m.
• With the cable installation vessel at its closest acceptable position to the offshore substation, typically 50 m to 70 m away, the cable installation vessel recovers the subsea cable plow onto its deck.
Garrad Hassan America, Inc. Page 30 of 153

Document No. 700694-USPO-R-03 Assessment of Ports for Offshore Wind Development in the United States Issue: E Final
Source: www.vsmc.nl
Figure 3-13: Subsea Cable Plow Burying Cable at Shore
• With the plow recovered on deck, the cable is then released from the cable pathway in the plow and the cable end is floated off from the vessel towards the substation structure. A roller quadrant is often suspended from the crane on the cable installation vessel during this cable handling operation to facilitate safe and careful handling.
Source: en.86wind.com
Figure 3-14: Cable Works at a Wind Turbine
Garrad Hassan America, Inc. Page 31 of 153

Document No. 700694-USPO-R-03 Assessment of Ports for Offshore Wind Development in the United States Issue: E Final
• At the substation, the cable is connected to the end of the messenger line exiting the J-tube’s bell-mouth.
• The cable is then pulled up the J-tube in a controlled manner with careful monitoring of cable tension during the complete operation.
• When the cable reaches the cable termination point, the pulling operation ceases and a strain restraint is connected to the cable end.
• This installation procedure leaves a section of cable unburied from the point of subsea plow recovery to the J-tube bell-mouth. This section of cable is then buried at a later date using a post lay burial ROV, usually as part of the scope of work for the array cables.
It is anticipated that each export cable could be installed over a two-week period during a time of the year when the ocean climate is relatively benign (e.g. early in the summer months), assuming 24 hour working.
Garrad Hassan America, Inc. Page 32 of 153

Document No. 700694-USPO-R-03 Assessment of Ports for Offshore Wind Development in the United States Issue: E Final
4 INSTALLATION VESSELS
4.1 Types of Vessels Used on Offshore Wind Farms in Northern Europe
This section details specifics about types of vessels used in offshore wind farm construction, including limitations, and roles in construction. 4.1.1 Floating Deck Barge with Crane
The cheapest floating lift-craft is formed by placing a land-based crane onto a deck barge. This is the most common type of vessel used to support river, coastal, and estuarine marine construction projects. The 360º rotational capability of the crane, coupled with a reasonable lift capacity, potentially greater than 100 t, makes it a versatile vessel, although allowable load capacities have been known to be reduced as a result of placing a mobile crane on a barge in this fashion. This type of vessel is often used for piling and maintenance of ports and harbors. Grabs, grapples or dragline buckets can be fitted to the crane for rock-armor handling, dredging, or material handling duties and man-cradles allow inspection of marine structures. The barge can be fitted with retractable legs called spud-legs. When the crane is towed into position by a tug, the legs are lowered to the sea bed, and this both positions the craft and, if the legs are clamped, provides some additional stability when lifting – but should in no way be considered as an equivalent to the stability provided by the legs of a jack-up. Deck barges are the most basic of craft, and any additional equipment to enhance their capability must be added to the deck of the barge. This often includes items among the following:
• Accommodation, storage, containerized diving-support units, and office units;
• Generators, compressors, fuel bowsers, scour protection, and grouting equipment and materials; and
• Mooring winches, anchors, mooring cable, or array cable, etc. The limited stability of this configuration of craft means that it is unsuitable to act in the role of the principal installation vessel. However, craft of this type will often be used for a multitude of small roles on any offshore construction site, and may fulfill the role of a feeder vessel, although offshore unloading will most likely be carried out by the main installation vessel in all but the most benign sea conditions.
Garrad Hassan America, Inc. Page 33 of 153
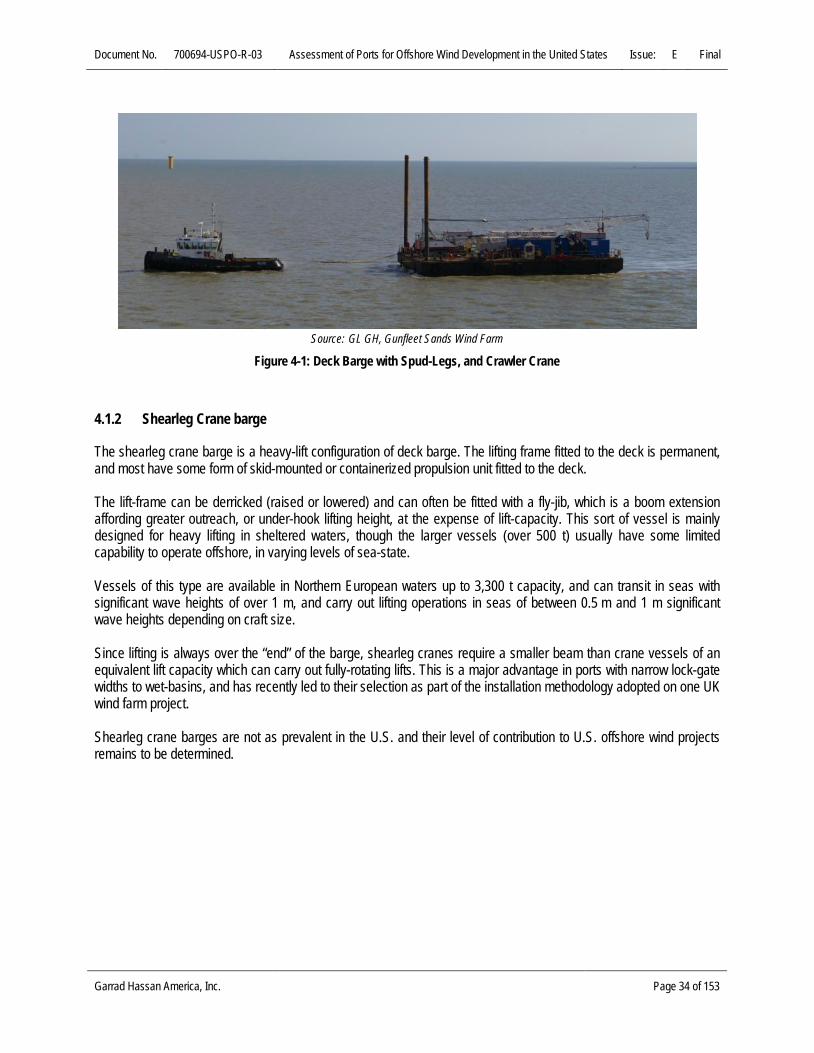
Document No. 700694-USPO-R-03 Assessment of Ports for Offshore Wind Development in the United States Issue: E Final
Source: GL GH, Gunfleet Sands Wind Farm
Figure 4-1: Deck Barge with Spud-Legs, and Crawler Crane
4.1.2 Shearleg Crane barge
The shearleg crane barge is a heavy-lift configuration of deck barge. The lifting frame fitted to the deck is permanent, and most have some form of skid-mounted or containerized propulsion unit fitted to the deck. The lift-frame can be derricked (raised or lowered) and can often be fitted with a fly-jib, which is a boom extension affording greater outreach, or under-hook lifting height, at the expense of lift-capacity. This sort of vessel is mainly designed for heavy lifting in sheltered waters, though the larger vessels (over 500 t) usually have some limited capability to operate offshore, in varying levels of sea-state. Vessels of this type are available in Northern European waters up to 3,300 t capacity, and can transit in seas with significant wave heights of over 1 m, and carry out lifting operations in seas of between 0.5 m and 1 m significant wave heights depending on craft size. Since lifting is always over the “end” of the barge, shearleg cranes require a smaller beam than crane vessels of an equivalent lift capacity which can carry out fully-rotating lifts. This is a major advantage in ports with narrow lock-gate widths to wet-basins, and has recently led to their selection as part of the installation methodology adopted on one UK wind farm project. Shearleg crane barges are not as prevalent in the U.S. and their level of contribution to U.S. offshore wind projects remains to be determined.
Garrad Hassan America, Inc. Page 34 of 153

Document No. 700694-USPO-R-03 Assessment of Ports for Offshore Wind Development in the United States Issue: E Final
Source: Alpha Ventus Website
Figure 4-2: Shearleg Crane-vessel Working in Tandem with a Jack-up Piling Vessel
4.1.3 Semi-Submersible Heavy Lift Vessel
This type of vessel has been developed by the oil and gas industry to carry out placement of oil rig modules in harsh offshore conditions. The hull can be flooded, greatly increasing the deadweight of the craft, and it is designed so that this ballasting operation dramatically lowers the period of roll of the craft. This change in vessel dynamics effectively “tunes out” the effects of waves on the craft, and therefore the problem of inopportune wave periods leading to resonance can be avoided. It sits effectively motionless in the water, unaffected by all but the harshest wave states. Clearly the huge structure presents a large surface to the wind, but again, the overall stability is such that even delicate lifting operations can be carried out in deep water during relatively strong wind conditions.
Garrad Hassan America, Inc. Page 35 of 153

Document No. 700694-USPO-R-03 Assessment of Ports for Offshore Wind Development in the United States Issue: E Final
Source: Alpha Ventus Website
Figure 4-3: Semi-Submersible Heavy Lift Vessel – Jacket installation, by Thialf
4.1.4 DP2 Heavy Lift Cargo Vessels
Cargo vessels deliver loads rapidly and cheaply around the world, and by fitting heavy cranes to the vessel, they can collect and deliver cargo from ports without adequate crane capacity to handle the cargo. Often these are individual machines or transformers, and are described as project cargo. Some of these vessels have been fitted with dynamic positioning, which means that they have the capacity to both deliver components rapidly to offshore sites, at speeds of 15-20 knots, and also to lift and position them accurately. Essentially DP is a computer-controlled system which compares Global Positioning Satellite actual location data with the desired position of the vessel set by the helmsman, and takes control of all vessel propulsion to pilot the vessel to the desired location. Being ships, their hull form is far sleeker that the majority of crane vessels. This may prove advantageous in wind project development in the North American Great Lakes, as some vessels of this category, with 800 t lift capacity, are known as “Seawaymax”; i.e. narrow enough to pass from the Atlantic through the locks on the St Lawrence River and into the Great Lakes. A large number of companies operate heavy-lift cargo vessels (HLCV), with the largest project cargo vessels fitted with twin 900 t cranes capable of 1,800 t tandem lifts. At least two of these vessels are also equipped with DP2 – Jumbo Javelin (see Figure 4-4) and Jumbo Fairplayer – although only the former has been used in a minor role to date on offshore wind farm installation (placement of transition pieces in Hs <1.5 m).
Garrad Hassan America, Inc. Page 36 of 153

Document No. 700694-USPO-R-03 Assessment of Ports for Offshore Wind Development in the United States Issue: E Final
Source: http://www.jumbomaritime.nl/site/en/news/mediagallery/anholtoffshorewindfarm/images
Figure 4-4: Jumbo Javelin Installing Transition Piece, Anholt Offshore Wind Farm, Denmark
With their high transit speeds, heavy-lift capacity, and lower day-rates than other equivalent lift-capacity vessels, it is likely that this type of vessel will see a greater role in future wind farms. Heave-compensation systems have been retrofitted to these vessels, and offshore vessel-to-vessel transfers have been affected in wave states far from calm. This suggests they could find favor as feeder-vessels as wind farms move farther offshore. DP2 HLCVs have been used successful by the oil and gas industry for a wide variety of offshore installation duties. In addition to transition piece transport and installation pictured in Figure 4-4 above, these vessels are candidates for jacket installation, during which the vessel carries not only the jacket structure but also the pin-piles, piling spread, and grouting spread. Likewise, tripod installation would appear to be another potential application. The two-crane tandem lift configuration largely avoids problems with the limited under-hook height with which many single-crane vessels struggle with deeper water structures. These vessels however lack the stability necessary to install wind turbines, so jack-ups will continue to dominate in this role. 4.1.5 Leg-Stabilized Crane Vessel
To date, only two vessels of this class have entered the wind farm installation fleet and both are owned by A2Sea – Sea Energy and Sea Power. These were standard ships before they were retrofitted with legs, and pedestal-mounted Demag cc 2600 crawler crane upper-works, in a 400 t lift-configuration. This adaption has proven to be a versatile low-budget installation craft, which was ideal to install wind turbines in the shallower sites of the early wind farms.
Garrad Hassan America, Inc. Page 37 of 153

Document No. 700694-USPO-R-03 Assessment of Ports for Offshore Wind Development in the United States Issue: E Final
The stabilization legs are a hybrid between the passive spud-legs, which are clamped in position, and jack-legs, which actively jack the vessel out of the water. There is some level of downward pressure exerted by the legs, which helps to react the lifted loads. The origins of the vessels mean that they have good hydrodynamic hull forms and transit rapidly and economically. This has allowed some sites to collect turbines from the manufacturer’s load-out facility and deliver them straight to site in reasonable cycle-times, with the attendant saving the costs of a construction mobilization and storage port. As a result, these vessels have taken on feeder vessel duties on at least one recent project.
Source: Vestas website
Figure 4-5: Leg-stabilized Crane Vessels A2Sea Sea Energy / Sea Power
The 24 m maximum working water depth means that the future prospects of leg-stabilized crane vessels in the installation marketplace are limited. They may well be used for turbine, or possibly transition piece installation in shallow areas of future sites, but they are more likely to find on-going work in the O&M vessel fleet for the existing wind farms which they helped to install, and where they have the leg-length to operate. 4.1.6 Self-Propelled or Towed Jack-Up Craft
These two distinct types of vessel have been placed under a single heading for simplicity because both fulfill similar roles and besides their means of propulsion have similar capacities. This type of vessel has been in use in the marine construction and offshore oil-rig maintenance and conversion marketplaces for many years. Early wind farms used jack-up vessels for virtually every conceivable task, largely because the wind farms were smaller than those under construction at present and it was more economical to use one versatile vessel for all tasks, than to mobilize a number of customized vessels to carry out specific roles. At larger future sites, greater specialization of roles and site-optimized vessels can be anticipated. The towed jack-up (or self-elevating platform, SEP) is a deck barge retrofitted with jack-legs. Many are fitted with permanent cranes, but since they were designed to be customized for each new site, the existing crane can be upgraded, within the limits of the leg jacking capacity.
Garrad Hassan America, Inc. Page 38 of 153

Document No. 700694-USPO-R-03 Assessment of Ports for Offshore Wind Development in the United States Issue: E Final
There are a number of propulsion types:
• Propelled;
• Dynamically positioned; and
• Towed. Leg-jacking mechanisms can be:
• Hydraulic pin-jacked;
• Pneumatically gripped; or
• Rack and pinion drive. The leg structures themselves can be:
• Tubular;
• Rectangular; or
• Lattice type. Upgrading of leg lengths can be undertaken, considering the following limitations; leg loading and tolerances, wave loading, overhead restrictions when in the harbor or shallow waters (considering crane operation). The appropriate leg length will be a compromise between these competing factors. Upgrading by re-craning is, however, commonly carried out, either by adding a crane to supplement the lift capacity of the crane already fitted or replacing the existing crane with a larger one. The stable base provided by a jack-up is equivalent to working onshore, and onshore lift specifications can be used (except when lifting from floating plant, or some other dynamic lifting is required). This makes them ideal for installing the nacelles and blades of turbines, which are the most precise lifts required anywhere on a project, and they effectively dominate this area of work. If there are vessel shortages in the next decade, jack-up vessels will probably be restricted to turbine installation work, and attract a premium, while floating solutions will be used for the majority of other activities. The ever increasing water depths and foundation and turbine weights have rendered obsolete the vessels which carried out the first offshore installations in water depths of less than 25 m. The minority of vessels with longer legs, and a number of new-build vessels are joining the marketplace with capacities to carry out the larger 5 MW class turbine installation work in 30-45 m deep waters. There is still a gulf in market capability between the large areas of UK Round 3 sites which are over 45 m deep and the number of vessels capable of operating at these sites. It is noteworthy that lattice-legged jack-ups are the vessel of choice for the oil and gas industry for water depths of over 50 m, in part due to reduced wave loading on the legs. One design appears to have a very good mix of leg length to overall size and that is the Gusto NG2500x – a relatively small barge, but with 60 m working capacity in benign waters, and 48 m in harsh conditions. The vessel appears to lack the freeboard to work in harsh seas, without having the decks awash, largely due to the fact that it is a small vessel and retains the proportions of the rest of the NG class of vessels. Modifications could, however, address this issue. Costing just over $100M, with the ability to work in any depth in the UK Round 3 sites during the summer months, it would appear to be able to fill the market gap relatively economically.
Garrad Hassan America, Inc. Page 39 of 153
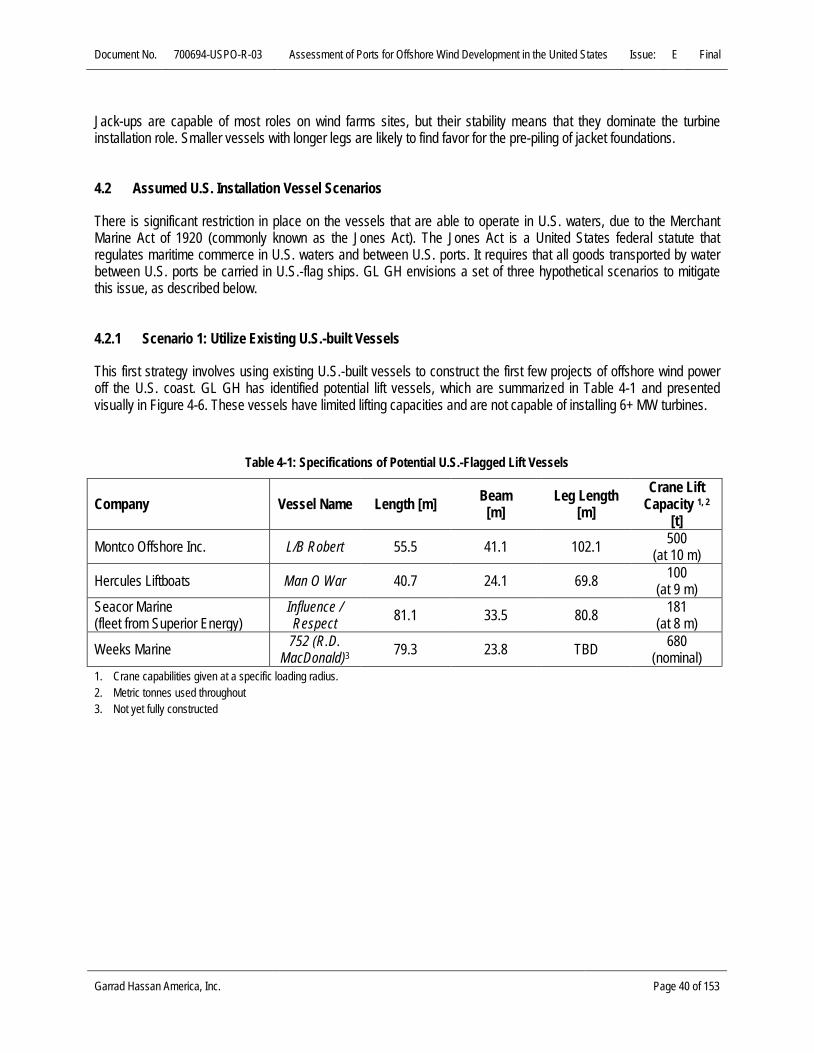
Document No. 700694-USPO-R-03 Assessment of Ports for Offshore Wind Development in the United States Issue: E Final
Jack-ups are capable of most roles on wind farms sites, but their stability means that they dominate the turbine installation role. Smaller vessels with longer legs are likely to find favor for the pre-piling of jacket foundations. 4.2 Assumed U.S. Installation Vessel Scenarios
There is significant restriction in place on the vessels that are able to operate in U.S. waters, due to the Merchant Marine Act of 1920 (commonly known as the Jones Act). The Jones Act is a United States federal statute that regulates maritime commerce in U.S. waters and between U.S. ports. It requires that all goods transported by water between U.S. ports be carried in U.S.-flag ships. GL GH envisions a set of three hypothetical scenarios to mitigate this issue, as described below. 4.2.1 Scenario 1: Utilize Existing U.S.-built Vessels
This first strategy involves using existing U.S.-built vessels to construct the first few projects of offshore wind power off the U.S. coast. GL GH has identified potential lift vessels, which are summarized in Table 4-1 and presented visually in Figure 4-6. These vessels have limited lifting capacities and are not capable of installing 6+ MW turbines.
Table 4-1: Specifications of Potential U.S.-Flagged Lift Vessels
Company Vessel Name Length [m] Beam [m]
Leg Length [m]
Crane Lift Capacity 1, 2
[t]
Montco Offshore Inc. L/B Robert 55.5 41.1 102.1 500 (at 10 m)
Hercules Liftboats Man O War 40.7 24.1 69.8 100 (at 9 m)
Seacor Marine (fleet from Superior Energy)
Influence / Respect 81.1 33.5 80.8 181
(at 8 m)
Weeks Marine 752 (R.D. MacDonald)3 79.3 23.8 TBD 680
(nominal) 1. Crane capabilities given at a specific loading radius. 2. Metric tonnes used throughout 3. Not yet fully constructed
Garrad Hassan America, Inc. Page 40 of 153

Document No. 700694-USPO-R-03 Assessment of Ports for Offshore Wind Development in the United States Issue: E Final
L/B Robert1
Man O War2
Respect / Influence3
1. www.montcooffshore.com/Robert 2. www.marinelink.com
Superior Energy Services, “265’ Class Boats” Figure 4-6: Potential U.S.-Flagged Lift Vessels
4.2.2 Scenario 2: Utilize Non-U.S.-built Vessels from Northern Europe
The Jones Act states that any foreign flag vessel cannot load cargo or passengers in one U.S. port and deliver them to another U.S. port. The offshore economic zone is considered a U.S. port in the above argument. Therefore, according to GL GH’s understanding, the Jones Act would allow for advanced, specialized Northern European installation vessels to carry out works on the construction of offshore wind farms using U.S.-built vessels as ‘feeder’ vessels. This strategy is likely to incur high costs and would only be necessary for the installation of the initial ~1.0 GW of offshore wind capacity, after which the market would be sufficient in size to justify the construction of vessels in the U.S. In order to carry out this strategy, U.S.-flagged vessels would interact with the staging port or manufacturing port (if appropriate) to transport turbine components to site. Such vessels would likely be barges, depending on the capability of the port. Once at the project location, these feeder vessels will likely need to jack up to facilitate safe off-loading of the project components. These feeder vessels are expected to need to jack up at the quayside, either to provide a stable platform for the use of the on-board crane, or to get the legs out of the way while loading components. Ports should therefore expect to need to maintain a suitable location for vessels to jack up alongside the quay. One example of a non-jack-up feeder barge is detailed in Table 4-2 and shown in Figure 4-7 below.
Garrad Hassan America, Inc. Page 41 of 153

Document No. 700694-USPO-R-03 Assessment of Ports for Offshore Wind Development in the United States Issue: E Final
Table 4-2: Specifications – Marmac 300
Company Vessel Name Length [m] Beam [m]
Cargo Capacity 1 [t]
McDonough Marine Service Marmac 300 91 30 10,000 1. Cargo capacity defined at load line.
Source: www.mcdonoughmarine.com/ocean_marmac300
Figure 4-7: Marmac 300
Due to the development of the offshore wind industry in Northern Europe, several highly specialized vessels have been designed for installation of turbines, foundations, and substations. Several second generation vessels have been selected and detailed in Table 4-3 and shown in Figure 4-8 below, in order serve as examples for the types of vessels that could be utilized in this strategy.
Garrad Hassan America, Inc. Page 42 of 153

Document No. 700694-USPO-R-03 Assessment of Ports for Offshore Wind Development in the United States Issue: E Final
Table 4-3: Specifications for Select 2nd Generation European Heavy Lift Vessels
Company DP 1 Vessel Name
Length [m]
Beam [m]
Leg Length [m]
Crane Lift Capacity 2
[t]
RWE, OLC (Offshore Logistics Company) Y Victoria
Mathias 100 40 78 1000 (at 25 m)
Seajacks Y Zaratan 81 41 85 800 (at 24 m)
Fred Olsen Windcarrier Y Brave Tern 131 39 58 800 (at 24 m)
Jack-up Barge BV N JB-117 75.9 40 80 1000 (at 22 m)
MPI Offshore Y Adventure 138.6 40.8 72.5 1000 (at 26 m)
1. Dynamic positioning. 2. Given at a specific loading radius.
Garrad Hassan America, Inc. Page 43 of 153

Document No. 700694-USPO-R-03 Assessment of Ports for Offshore Wind Development in the United States Issue: E Final
Victoria Mathias1 Zaratan2
Brave Tern3 JB1174
1. www.rwe.com/web/cms/en/86182/rwe-innogy 2. www.seakjacks.com/zaratan 3. www.windcarrier.com/transport-and-installation-jack-up-vessels 4. www.heavyliftspecialist.com
Figure 4-8: Representative 2nd Generation European Heavy Lift Vessels
Garrad Hassan America, Inc. Page 44 of 153

Document No. 700694-USPO-R-03 Assessment of Ports for Offshore Wind Development in the United States Issue: E Final
4.2.3 Scenario 3: New Build U.S. Vessels
GL GH assumes that from 2016, the U.S. offshore wind industry would have constructed installation vessels. The types of vessels will have similar specifications to the second generation of vessels being commissioned in Northern Europe, as described above. 4.2.4 Heavy Lift Cargo Vessels
It is worth discussing the need to utilize HLCVs (see further discussion in Section 4.1.4), although it is assumed the U.S. vessel industry will have many such vessels that are Jones Act compliant. Typically, HLCV are used to transport wind farm components from the manufacturing port to the staging port. Advantages of using a staging port have been discussed above and can include a more efficient construction strategy, assuming components are being manufactured in different locations. Also, the staging port is usually closer to the wind farm site, meaning the charter duration of costly installation vessels is reduced. An example of a heavy lift cargo vessel is detailed below. It should be noted that alternatively, a barge such as that described in the previous section, may also be used for transportation. This does depend, however, on the load out method and/or cranes available on the quayside.
Table 4-4: Vessel Specification for the BBC – Elbe
Company Vessel Name Length [m]
Width [m]
Crane Capacity1 [t]
Cargo Capacity2 [t]
BBC Chartering BBC – Elbe 143.1 22.8 3 x 80 (at 18 m) 17,500
1. Given at specific loading radius. 2. At load line.
Source: www.bbc-chartering.com
Figure 4-9: BBC Elbe
Garrad Hassan America, Inc. Page 45 of 153

Document No. 700694-USPO-R-03 Assessment of Ports for Offshore Wind Development in the United States Issue: E Final
HLCVs vary both in cargo capacity and lift capacity, each of which affects the ability to transport components. In particular for offshore wind, lift capacity can become a limitation for larger turbine sizes, foundations, and nacelles. 4.2.5 How Vessel Availability Dictates Port Requirements
When heavy lifts are required for projects in Europe, whether it be for a nacelle, GBS, tripods, etc., shearleg crane barges (see Section 4.1.2) have often been utilized rather than relying on onshore cranes. A typical scenario would be for the component to be delivered by SPMTs to the quayside, where it would then be lifted onto the transport vessel by that vessel’s on-board crane (e.g. turbine installation vessel or HLCV) or by a separate crane vessel (e.g. shearleg crane barge). In the U.S., however, these heavy lift vessels are not as available and so more work will be shifted to the onshore cranes. The need for onshore cranes to be able to lift and transport components around the port is likely to result in a higher ground strength requirement for U.S. ports, at least at the quayside. As is discussed further in Sections 10.3 and 10.4 below, two U.S. ports that are currently undertaking renovations specifically in order to be able to support offshore wind have both recognized this additional requirement but have taken two different approaches to accommodating it. The New Bedford Marine Commerce Terminal in Massachusetts designed its quayside and storage area for 60 t/m2 and 100 t/m2, respectively, in order to allow crawler cranes to lift and carry components anywhere on the site. The Port of Paulsboro, New Jersey, designed the quayside for 7.3 t/m2 with the expectation that additional and less expensive load-spreading techniques would be used to facilitate the heavy lifts required. The storage area at the Port of Paulsboro can accommodate loads up to 24 t/m2.
Garrad Hassan America, Inc. Page 46 of 153

Document No. 700694-USPO-R-03 Assessment of Ports for Offshore Wind Development in the United States Issue: E Final
5 OFFSHORE WIND FARM PORT REQUIREMENTS
The preceding chapters provided an overview of the types of equipment, transportation and installation vessels, and installation methodologies employed during the construction of an offshore wind farm. Each of these areas has implications on the port requirements, with these implications coming in many forms. The following sections provide an assessment of the current suitability, and potential for future development, for port infrastructure based on the aforementioned key considerations. Port infrastructure services the offshore wind industry in numerous ways. Different requirements are imposed on port infrastructure by:
• Manufacturing facilities; and
• Staging facilities. Although each facility may handle the same components, there may be differing requirements on storage durations and handling at intermediate stages of construction, which may lead to different crane specifications and therefore quayside loadings. For each type of item being produced or installed, it is therefore necessary to consider what port infrastructure is needed at both manufacturing and construction phases. In some cases there are intermediate requirements during possible relocation of sub-components between specialized manufacturing facilities. The report therefore clearly identifies the differing requirements for each port facility. In the following sections the technical aspects of each type of physical requirement placed upon a port by a particular component are systematically assessed, from manufacture to installation, with the port assessment criteria identified. In terms of maritime limitations, some technical requirements stem from the physical dimensions of the vessels used for either the construction phase or for transportation (as logistical elements of the supply chain); in these contexts the following items need to be considered:
• Vessel beam;
• Laden and un-laden draft;
• To a lesser extent, their overall length; and
• Overhead clearance. Other hard technical limits result from the dimensions and weight of wind farm components, at the various stages of assembly at which they are transported between manufacturing and construction facilities (pre-staging ports), where the following factors need to be considered:
• Physical size range of components, for each project to be supported from each port;
• Length, breadth, and height required – not only of the component itself, but of the area surrounding it in any storage areas to allow access for the lifting and other mechanical handling plant required to move it; and
• Numbers of components that will likely require storage during conventional project programs. These limitations are discussed in the following sections to allow port authorities, manufacturers and developers to assess the suitability of the facility for certain operations.
Garrad Hassan America, Inc. Page 47 of 153

Document No. 700694-USPO-R-03 Assessment of Ports for Offshore Wind Development in the United States Issue: E Final
5.1 Types of Port Usage Addressed
This study considered the three primary operations for which port facilities are needed when constructing and operating an offshore wind project: Manufacturing, Staging, and O&M. Specifically, information was gathered to describe and quantify the requirements of port facilities for the following activities:
• Assembly and storage of offshore wind turbines and associated components;
• Fabrication and storage of support structures for offshore wind turbines (foundations);
• Assembly and storage of balance of plant infrastructure;
• Base to support offshore installation activities; and
• Base to support operation and maintenance activities. For each of the above activities, GL GH has detailed the technical requirements related to the transport, storage and assembly requirements. This was done by establishing typical profiles for major components (monopiles, jackets, wind turbines etc.), or activities (operations & maintenance, etc.) based on industry knowledge and best-practice. The analysis includes areas where specialized facilities are required (dry-docks, heavy lift equipment, etc.). The study also details the potential requirements of the offshore industry, taking into consideration future trends in offshore wind technology, e.g. wind turbine size, foundation concepts, etc. 5.2 Port Logistics
Before assessing the ability of port infrastructure for handling offshore wind farm components, it is necessary to have a thorough appreciation of the most common methods by which wind farm components are handled within the port facilities and when loading-out to transport and installation vessels. Large wind farm components are generally manufactured in proximity to port facilities, given the large distances likely travelled to the wind project site and the difficulties of handling such equipment. There are a number of methods for the delivery of wind farm components from the original equipment manufacturers’ premises to the offshore wind farm site. The generally applicable options include:
1 Loading and off-loading of components onto quayside storage areas in ports, at the manufacturer’s and staging site respectively;
2 Loading of components onto a transport vessel or barge at the manufacturer’s premises and off-loading onto a floating barge in a sheltered harbor near the offshore wind farm site, to be stored, awaiting transfer to the installation vessel;
3 Loading of the components onto a transport vessel or barge at the manufacturer’s premises, and off-loading onto the installation vessel at the offshore wind farm site – known as feeder vessel duties; or
4 Loading of the components directly onto the installation vessel at the manufacturer’s premises, and installation at the offshore wind farm site.
For the purposes of assessing port facilities, the assumption is that Option 1 is the preferred option for transportation of WTG components from a manufacturer’s facility to a developer’s staging harbor. Options 2 to 4 become relevant when considering staging of foundation and array cable installation and mobilization from the developer’s staging harbor.
Garrad Hassan America, Inc. Page 48 of 153

Document No. 700694-USPO-R-03 Assessment of Ports for Offshore Wind Development in the United States Issue: E Final
5.3 Component Storage
Wind turbine components are large structures, which impose significant requirements for storage space at ports. This section will discuss storage methodologies and describe the assumptions made pertaining to storage in the tables in Sections 5.7, 5.8 and 5.9.
Source: www.mlm.uk.com
Figure 5-1: Nacelle Storage at Port
It is assumed that components will be raised off the ground during storage, as shown in Figure 5-1 above. This enables SPMTs to maneuver underneath, jack-up to take the weight of the component, and transit to the quayside for load-out. A sufficient gap must therefore be left for the SPMT beneath the component. The typical method to achieve this is to use short metal columns to raise the component off the ground and baulk timbers to distribute the load to the ground. It has been assumed that baulk timbers are 30 cm by 30 cm and can distribute load nearly uniformly over their area. For simplicity, the assumed bearing width of the four timbers has been approximated to 1 m. Timbers have been assumed to be cut to required length, and it is assumed that four timbers may fit width-wise under each column support. As such, the bearing areas may be calculated using the length and width of the beams, which is the methodology that was used to calculate the bearing areas for components in the port requirements in this report. It is assumed that blades are stored in stacks of three and the frames are supported by 4 m long blocks at both ends. For nacelles, it is assumed that four columns would support the structure and would rest on timbers the length of half of the nacelle. The transition pieces are assumed to rest on a frame, which rests on four columns, the weight distributed over two pieces of baulk timber as long as the diameter of the transition piece. The monopile foundations are assumed to be stored on ten columns at five points along the foundation, each column resting on a 4 m long piece of baulk timber. Lastly, the jacket foundations are assumed to be stored upright or on their sides, each of the four contact points resting on 12 m2 pallets. It should be noted, however, that it is not recommended for the jackets to be stored at the staging port, but loaded immediately onto a barge from the manufacturing port and kept there until ready for installation. Jacket foundations are particularly fragile and this method avoids double handling and potential damage.
Garrad Hassan America, Inc. Page 49 of 153

Document No. 700694-USPO-R-03 Assessment of Ports for Offshore Wind Development in the United States Issue: E Final
In the early days of U.S. offshore wind development, it is expected that numerous components will be delivered to the staging port from Europe rather than from a local manufacturing facility. This longer transit time will likely result in a requirement to store more components at the staging port in order to provide sufficient buffer during construction. As a result, U.S. ports would need larger storage areas than are common in Europe staging ports. 5.4 Bearing Capacity
The results of this study identified ground bearing capacity as one of the critical elements in port readiness and the most consistent factor requiring improvement for U.S. ports looking to support offshore wind projects. As such, some additional discussion of bearing capacity at U.S. ports is warranted. The bearing capacity discussed in this report is the ability of the ground surface to support the weight of a specific component. The component (e.g. a nacelle) will exert a downward force on the ground distributed over the area where that component is in contact with the ground. This is the bearing pressure and the larger the bearing area for a given component, the lower the bearing pressure. The soil bearing capacity is the maximum bearing pressure that soil can support before failure occurs. A factor of safety is included in the bearing capacity values included in port specifications. GL GH surveyed ports from different parts of the country and found that the typical port reported a ground bearing capacity between 5 and 10 tonnes per spare meter (5 t/m2 = 1,030 psf). As is discussed later in this section, this range is likely to be sufficient for current and next-generation turbine components but is insufficient for turbine foundations. GL GH considers 10 t/m2 to be the minimum recommended bearing capacity for offshore wind ports. As is discussed above in Section 4.2.5, additional consideration should be given to accommodating higher loads due to the lifting requirements at the quayside. 5.4.1 Increasing Bearing Capacity
Ports considering increasing the bearing capacity in order to handle offshore wind components will need to consider the bearing capacity required and the size of the area to strengthen, both at the quayside and in the storage area. Options include strengthening specific points (sometimes called “hard points”), for example where cranes are to be mounted or stationed, while leaving other areas at a lower bearing capacity is a lower cost solution; strengthening large areas to the minimum capacity and relying on other load spreading techniques, such as SPMTs, to reduce the bearing pressure of heavy components; and strengthening the quayside and storage area to a capacity sufficient to accept all components and transportation methods. The advantages and disadvantages of various approaches are outlined in Table 5-1 below.
Garrad Hassan America, Inc. Page 50 of 153

Document No. 700694-USPO-R-03 Assessment of Ports for Offshore Wind Development in the United States Issue: E Final
Table 5-1: Advantages and Disadvantages of Different Methods for Increasing the Bearing Capacity
Approach Advantages Disadvantages Do not strengthen site • Minimal cost to port • May make port unsuitable for offshore
wind projects • Developer will need to lease additional
load-spreading equipment (e.g. SPMTs) • The need for additional load-spreading
could slow the loading/unloading of components and thus reduce thru-put
• There is likely a limitation to the weight of components that can be received
Strengthen hard points only • Low cost solution • Quayside cranes can lift all components
• Vessel may need to move during loading or unloading to allow crane to reach all components
• This may slow down the loading and unloading, reducing port thru-put
Strengthen the whole site to 10 t/m2 minimum
• Components can be transported anywhere on site using SPMTs
• Additional load-spreading solution required for heavier components (e.g. foundations)
• Crane loads at quayside may require additional load-spreading
Strengthen the quayside only accommodate highest pressure needed (> 10 t/m2)
• Vessel does not need to move during loading or unloading
• This helps maximize thru-put
• Additional load-spreading solution required in storage area
• Expensive Strengthen entire site to accommodate highest pressure needed (> 10 t/m2)
• Offers greatest flexibility for transportation and storage of components
• More transportation options available (e.g. crawler cranes) in addition to SPMTs
• Port can more easily accommodate heavier foundations
• Most expensive, most time consuming construction
Increasing the bearing capacity of the soil requires removal of the native soil and/or the addition of engineered fill. The typical location of port facilities is such that native soil conditions are likely to consist of clayey or silty soils as a result of natural soil conditions along waterways (i.e. deposition of low strength silts and clays along shorelines and river deltas), high groundwater tables, a history of hydraulic fill of dredged material in the lands surrounding the port, or historic infill of waterways. To assess existing subgrade conditions, a geotechnical study must be completed as part of design work for any port improvement project. 5.4.2 Cranage & Ground Bearing Pressure
Most of the cargos handled in the general cargo areas of ports around the world are limited to loads that can be handled by large harbor cranes.
Garrad Hassan America, Inc. Page 51 of 153
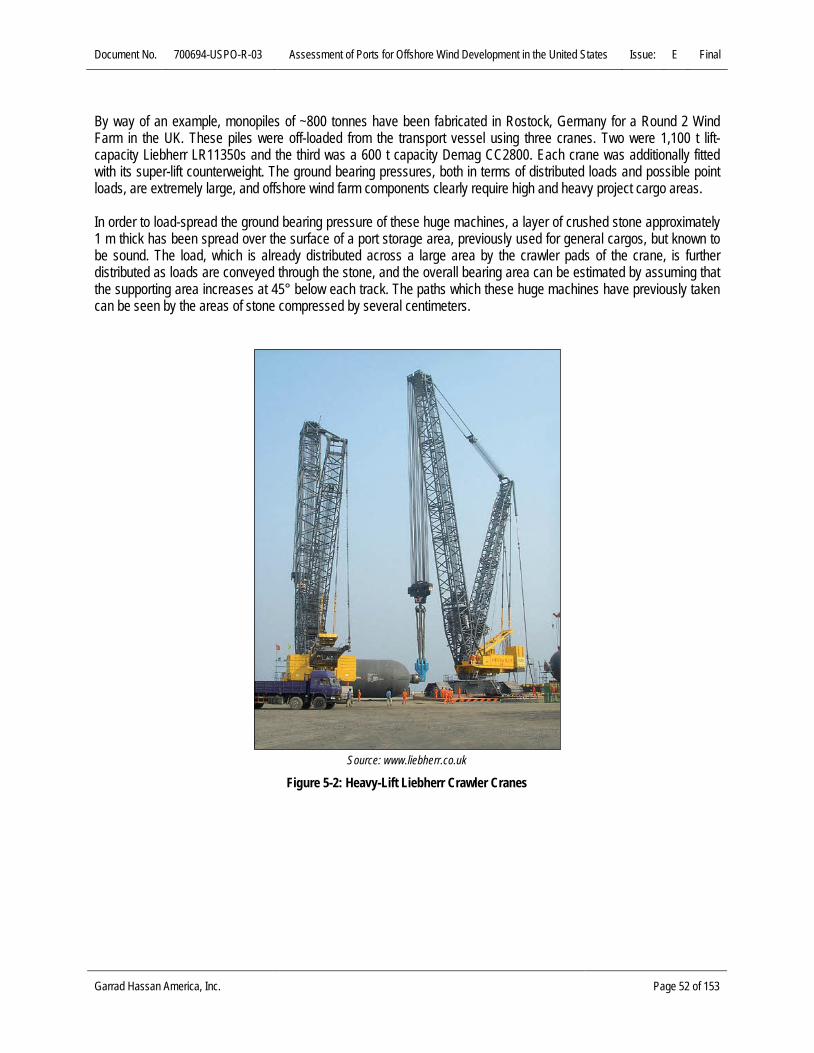
Document No. 700694-USPO-R-03 Assessment of Ports for Offshore Wind Development in the United States Issue: E Final
By way of an example, monopiles of ~800 tonnes have been fabricated in Rostock, Germany for a Round 2 Wind Farm in the UK. These piles were off-loaded from the transport vessel using three cranes. Two were 1,100 t lift-capacity Liebherr LR11350s and the third was a 600 t capacity Demag CC2800. Each crane was additionally fitted with its super-lift counterweight. The ground bearing pressures, both in terms of distributed loads and possible point loads, are extremely large, and offshore wind farm components clearly require high and heavy project cargo areas. In order to load-spread the ground bearing pressure of these huge machines, a layer of crushed stone approximately 1 m thick has been spread over the surface of a port storage area, previously used for general cargos, but known to be sound. The load, which is already distributed across a large area by the crawler pads of the crane, is further distributed as loads are conveyed through the stone, and the overall bearing area can be estimated by assuming that the supporting area increases at 45° below each track. The paths which these huge machines have previously taken can be seen by the areas of stone compressed by several centimeters.
Source: www.liebherr.co.uk
Figure 5-2: Heavy-Lift Liebherr Crawler Cranes
Garrad Hassan America, Inc. Page 52 of 153

Document No. 700694-USPO-R-03 Assessment of Ports for Offshore Wind Development in the United States Issue: E Final
Original port ground level
CRUSHED STONE
CRAWLER CRANE Load-spreading under tracks
Source: GL GH
Figure 5-3: Load Distribution under Tracks of a Heavy Crawler-Crane, with Stone Layer
The laying of a stone layer certainly adds a small additional load to the surface of the port area used, and has cost implications, but provides significant load-spreading benefits, and protects expensive concrete decking and other existing surfaces from damage. In the following discussions on the ground bearing pressures required of port areas used for monopile construction, mobilization and staging areas, the ground pressures quoted are indicative, as clearly there is the opportunity to vary the thickness of a protective layer above the existing port ground level, which then varies the ground pressure experienced. 5.5 Component Load-out
The loading of transportation and installation vessels from port facilities can be completed in a number of ways, but the more common method used to date involves the rolling and lifting of components onto the deck or into the holds of the vessel, by techniques termed, “Roll-on and Roll-off” (Ro-Ro) and “Lift-on and Lift-off” (Lo-Lo). The practicalities and implications of both techniques are reviewed in the following sections. 5.5.1 Roll-on and Roll-off
“Roll-on and Roll-off” has significant implications with regard to vessel, port infrastructure, and mechanical plant selection. Ro-Ro is most commonly associated with passenger car ferries, where both commercial vehicles and private cars are loaded and unloaded onto the vessel by driving on and off ramps using a customized port access device called a link-span. Many onshore wind farm components can be transported using Ro-Ro vessels, however, large offshore components are unlikely to be transported using ferries, as their components are generally larger than even the largest freight transport for which the ferries and link-spans are designed; they are also too large to be road-hauled via infrastructure designed for similarly-sized vehicles. However, this methodology is applicable to loading and unloading components which may be transported by barge, and some cargo vessels have decks which can be used for Ro-Ro cargos. While some ports may not have permanent Ro-Ro berths, it is possible to accommodate this facility by using a mobile Ro-Ro ramp. This is a highly specialized piece of equipment, as it enables extension of a port’s capability beyond that of its fixed infrastructure. There are some general cargo vessels and heavy-lift cargo vessels which have aft and/or bow ramps designed for Ro-Ro cargos. Some vessels are designed with reinforced decks, and will only accommodate the Ro-Ro cargos as deck loads, while others have more elaborate arrangements for accommodating the cargo below deck.
Garrad Hassan America, Inc. Page 53 of 153

Document No. 700694-USPO-R-03 Assessment of Ports for Offshore Wind Development in the United States Issue: E Final
Source: photos2.marinetraffic.com
Figure 5-4: Ro-Ro Capable Heavy Lift Cargo Vessel (Happy Buccaneer)
5.5.2 Lift-on and Lift-off
The term Lo-Lo is an abbreviation of the descriptive term “Lift-on and Lift-off”. Lo-Lo has traditionally been the most common way to load ships, and port facilities will often have cranage designed to accommodate the most common cargo passing through. Before giving further consideration to the relative merits and technical requirements of each of the above, some background on cranes, their safe usage, and the associated terminology, is necessary. 5.5.3 Crawler Cranes
While the basic principles of the operation of cranes may be self-evident, the use of cranage can be complex.
Garrad Hassan America, Inc. Page 54 of 153

Document No. 700694-USPO-R-03 Assessment of Ports for Offshore Wind Development in the United States Issue: E Final
Source: GL GH
Figure 5-5: Crawler Crane, Showing Key Components and Dimension
Crane manufacturers publish specifications of their equipment with the most important information being the tabular performance sheet, detailing what load can be safely lifted at each particular lifting radius. The lifting radius is defined as the horizontal component of the distance between the center of rotation of the crane and the vertical line drawn down through the center of the crane boom tip (see Figure 5-5). The center of gravity of the load will hang directly below this point. Cranes often have a number of boom tip sheaves (the term used for a pulley on lifting equipment). For the crane’s maximum lift, the maximum number of falls of rope (the term used to describe the number of turns around the pulley system) will be twice the number of boom sheaves. The pulley arrangement is known as the reeving of the crane. Since one end of the rope can be seen to be anchored to the boom tip, this provides part of the active pulley system, while the other end does not contribute to the lifting; it simply provides a link with the main hoist winch. A significant difference between onshore and offshore crane operations is that onshore crane owners may well have a fleet of cranes which all have a hoist rope of the same diameter and interchangeable hook blocks. Offshore cranes tend to have a main hoist block, which is simply re-reeved, rather than replaced with a lighter block, as optimizing lift efficiency is not as vital (for offshore) as the robustness of the equipment. As manufacturers are aware of these differences, a major difference in how a safe working load is defined in practice has evolved; this is potentially dangerous if cranes are used by staff from different industries. Offshore crane manufacturers quote the safe working load after having deducted the hook block weight, but crawler and mobile crane load radius charts quote the total lifted load, from which the weight of the particular hook block must be deducted before finding the maximum safe working load that can be lifted (defined as the lifting tackle and weight of the item being lifted). The oil and gas industry have occasionally been involved in lifts using onshore cranes fitted to jack-up barges. Unfamiliarity with onshore practice can lead staff from this industry to overestimate either the load which can be lifted, or the radius at which a particular load can be lifted.
Garrad Hassan America, Inc. Page 55 of 153

Document No. 700694-USPO-R-03 Assessment of Ports for Offshore Wind Development in the United States Issue: E Final
One valuable feature of a crawler crane, as opposed to offshore or mobile cranes, is its ability to lift a load and to track forward, thereby transporting the load while suspended, an operation known as “pick and carry”. This potentially enables the use of a single crawler crane both to load and to transport turbine components around a staging yard, and avoids the expense of SPMT units. The cost penalty is that the transit speed of a laden crawler crane is extremely low; therefore any additional time requirement for chartering transport/installation vessels, and any associated equipment and personnel, will increase costs. This pick and carry technique has been utilized in some European ports and is being considered by U.S. ports looking to support offshore wind projects.
Source: www.dongenergy.com
Figure 5-6: Crawler Cranes Transporting a Steel Monopile
As with SPMT movements, crawler crane pick and carry operations will be specific to each port facility, which will have to consider gentle gradients and turning radii and significant headroom. Again, if large numbers of components require storage, further assessment of crane track loads on haul routes between the storage facilities and the quayside will be required and will likely require a greater level of ground strength. 5.5.4 Quayside Cranes
The freight which is loaded on and off ships by crane within port facilities varies dramatically. Some bulk material cargos require the use of grabs, and ships often have internal hoppers and conveyor discharge systems built in, which link to similar onshore conveyors and then to bulk storage areas. This type of arrangement is suitable for aggregates, for other granular minerals (such as grain), for traditional fuels (such as coal), and, increasingly, for wood chips and pellets for biomass heating systems. Cranes dedicated to this application tend to be highly specialized, with relatively light lift capacities, but fast cycling capability (both hoist speeds and slew-rates); they would be unsuitable for lifting any heavy turbine components.
Garrad Hassan America, Inc. Page 56 of 153

Document No. 700694-USPO-R-03 Assessment of Ports for Offshore Wind Development in the United States Issue: E Final
Most “transit” cargos pass inland, through ports, and are therefore “packaged” in such a way as to be suitable for forwarding as either road or rail freight. This again places a low upper limit on the maximum capacity of offloading cranage, as individual lorries or rail-wagons do not have capacities of higher than a few tens of tonnes. Again, there is a high-speed requirement, as a large number of small components will be required to be offloaded and loaded in the shortest possible time, in order to minimize the ship’s time in port. However, many areas adjacent to quays have had rails fitted for offloading cranes, which are no longer in regular use. Generally, these cranes run along reinforced concrete beams, which are intermittently supported by piles and may well have useful load bearing capacity, either for lifting or as haulage routes. Another advantage is that precise civil works, carried out as reinforcement for the crane rails, are likely to be documented, so their strength will be known; this is often not the case with the quayside deck strengths of older port facilities. 5.6 Port Haulage (Quay Transportation)
5.6.1 Self-Propelled Modular Transporters
Some offshore projects have managed to avoid the need for heavy cranage at the port facilities by loading turbines and foundation components onto SPMTs. The components can then be loaded by utilizing Ro-Ro ship-type vessels or transport barges loaded from Ro-Ro link-spans, or the SPMTs can deliver the component to the quayside where it is then lifted onto the vessel using an onshore or onboard crane. In Europe, SPMTs have been a common means of transporting large offshore wind components between the quayside and the storage area. Common forms of SPMTs have individual two-axle units with a load carrying capability of up to 30 metric tonnes per axle (t/axle) and can be arranged side-by-side or end-to-end in a rolling transporter for extremely large loads.
Source: www.ale-heavylift.com
Figure 5-7: Nacelle on Trailer of Self-Propelled Modular Transporters
Garrad Hassan America, Inc. Page 57 of 153

Document No. 700694-USPO-R-03 Assessment of Ports for Offshore Wind Development in the United States Issue: E Final
Whether this type of unloading arrangement will be possible will be specific to each port facility and will be highly dependent on the type of transportation/installation vessel utilized. Port facilities also have to consider gentle gradients, turning radii and several meters of headroom. If large numbers of components require storage, further assessment of the storage-deck strengths and axle loads of haul routes between the storage facilities and Ro-Ro storage areas will be required. The standard assumption is that the use of SPMTs to carry components to and from the storage area allows a ground bearing capacity of 10 tonnes per square meter in the storage area to suffice for all offshore wind components. For heavy components, additional axels can be added to keep the bearing pressure within this limit. Despite the complexities of this transport method, it avoids the need for cranage, which can result in significant savings and may require additional ground improvements. Additional cost will result from storage frames, which will be required to be far enough off the ground for the SPMTs to roll underneath and jack the load on and off. 5.7 Wind Turbines
Before assessing the suitability of port infrastructure for the siting of wind turbine manufacturing facilities, it is necessary to have a thorough appreciation of the methods by which turbine components are handled. The size of offshore turbines, and the difficulty of moving them on the majority of onshore transport infrastructure, has led manufacturers to locate their premises adjacent to port facilities suitable for their load-out. GL GH has developed five generic wind turbine options which allow for the assessment of port facilities against differing technological requirements. Table 5-2 presents the proposed generic wind turbine specifications, which are considered to be representative of current and future technological trends.
Table 5-2: Generic Wind Turbine Specifications
Parameter Wind Turbine Size [MW]
4 5 6 7 8
Rotor diameter [m] 120 135 150 164 175
Blade length [m] 59 66 73 80 85
Blade weight [t] 19 23 28 34 40
Nacelle weight [t] 162 239 330 390 450
Tower length [m] 66 74 81 88 94
Tower weight [t] 185 215 250 280 310 This section reviews the major issues regarding storage and load-out of wind turbines and their principal components from a manufacturer’s port facility or a staging port. The following key issues are considered in the definition of port requirements and are thus central to this report:
• Port storage and logistic requirements; and
Garrad Hassan America, Inc. Page 58 of 153

Document No. 700694-USPO-R-03 Assessment of Ports for Offshore Wind Development in the United States Issue: E Final
• Interactions with appropriate transportation vessels. The focus is on the general philosophy and principles of how offshore wind turbine components are handled on the ground, and how they are lifted (including the associated equipment requirements). Consideration should be given to the technical specifications, whether the port is used as a marshaling yard, as well as the requirements placed upon installation vessels which in turn drive port infrastructure requirements. 5.7.1 Wind Turbine Blades
Onshore Transportation and Storage
Transportation and storage of wind turbine components at the manufacturing facility shall be required prior to load-out and transport to the pre-staging harbor. Blades are manufactured under the cover of a fabrication facility which has suitable gantry cranes to lift and transfer the blades to bespoke trolleys, which are themselves used to ship the blades to a long/medium-term storage area. Figure 5-8 presents a wind turbine blade transport vehicle.
Source: www.renewableenergyfocus.com
Figure 5-8: Wind Turbine Blade Transport Vehicle
Long/medium-term storage of blades requires a large lay-down area, with single or multiple blades held within two frames, one located at the hub and one located along the blade span, as presented below.
Garrad Hassan America, Inc. Page 59 of 153

Document No. 700694-USPO-R-03 Assessment of Ports for Offshore Wind Development in the United States Issue: E Final
Source: www.windpowermonthly.com
Source: www.fotolibra.com
Figure 5-9: Wind Turbine Blade Storage (single frame) Figure 5-10: Wind Turbine Blade Storage (multiple frames)
Where space is limited, multiple blades can be stored in larger frames as presented in Figure 5-10. The size of the storage frames will be determined by the capabilities of the vessel used to transport the wind turbines from the manufacturer’s port to the staging port. Load-out
Load-out of wind turbine blades will be undertaken by vessel-based cranage or, in the case of non-self-propelled transport barges, port-based cranage. The transport vessel shall be required to moor against the quayside to allow for the efficient transfer of the blades from the quayside to the vessel. Where the blades are being loaded using a single crane, specialist spreader beams will be required to provide two points of contact on the blade, while retaining a manageable under-hook height, as presented in Figure 5-11.
Source: duluthshippingnews.com
Source: wireropeexchange.files.wordpress.com
Figure 5-11: Port Cranage Blade Load Out Figure 5-12: Three Blade Load Out
Blades may also be transported as they are stored, in large bespoke transportation frames which can accommodate three wind turbine blades (Figure 5-12).
Garrad Hassan America, Inc. Page 60 of 153

Document No. 700694-USPO-R-03 Assessment of Ports for Offshore Wind Development in the United States Issue: E Final
Summary of Port Requirements for Blades
The following key parameters need to be investigated when assessing port facilities for wind turbine blade manufacture, storage and transportation:
• Fabrication facility: Blade length is a major driver for the fabrication facility. A number of blades may be fabricated in parallel, requiring facilities that are wider than the sum of the fabrication molds used to pre-lay the carbon fiber-reinforced plastic that constitutes the blade structure. Since turbine blades are made of lightweight composites, light internal cranage (overhead gantry) will suffice for the transfer of the blades to their transport trolleys.
• Load-out: Large heavy-lift cargo vessels are best used for these cargos, as they are increasingly fitted with container-twist-locked frames and loaded in groups of three at a time, which requires significant cranage lift-weight and outreach only found on larger heavy-lift crane vessels.
• Quayside: There is only a light-weight requirement for haulage, but since for maneuvering it is likely that a 2-bogey unit will be used, which concentrates load and therefore increases the requirement for deck strength. The maximum individual length of a blade will dictate the quayside length, and multiple blade storage alongside the vessel to be loaded will be required.
• Depth: Blades are generally carried long distances as deck cargo on heavy-lift cargo vessels. These large transportation vessels will have a significant draft requirement within the port facility.
• Mobile Cranage: Wind turbine blades today weigh in the order of tens of metric tonnes, however, these weights are likely to increase as technology trends push towards larger offshore machines. It is likely that transport vessels will load-out significant numbers of blades however blade weights are well within the capacity of suitable mobile cranage.
Specific Port Requirements
A number of turbines, particularly the larger machines, have been designed to have the whole rotor pre-assembled before installation. This operation can either be conducted by transporting the hub and blades separately, and assembling the rotor on the deck just prior to installation, or by loading the pre-assembled rotor, as presented in Figure 5-13. Many installation vessels have at least two cranes, and there is considerable time available for the rotor to be assembled by another crane while the main crane is carrying out the two tower lifts and the nacelle lift.
Garrad Hassan America, Inc. Page 61 of 153

Document No. 700694-USPO-R-03 Assessment of Ports for Offshore Wind Development in the United States Issue: E Final
Source: www.renewableenergyworld.com
Figure 5-13: Full Rotor Assembly in Port
A rotor is a very bulky object, and, to date, only smaller rotors have been transported to the site by installation vessels with more than one rotor per cycle. Feeder vessels have been adopted in many cases to transport these unwieldy items to the site. The rotor has been transported to the site with its axis vertical, and requires specialist hub lifting equipment (as it needs a 90° twist during lift). While this is a complex lifting procedure, it has been carried out successfully by all of the major 5 MW turbine manufacturers offshore, and it appears that this rotor lift will remain the preferred assembly option for large turbines. 5.7.2 Wind Turbine Nacelle
Onshore Transportation and Storage
Wind turbine nacelles are manufactured under the cover of a fabrication facility which has suitable gantry cranes to lift and transfer components that constitute the nacelle (gearboxes, generators, etc.). Upon leaving the fabrication facility, nacelles are usually transported around the port facility using SPMTs, as shown in Figure 5-7. Bespoke frames are mounted on the tower-top flange which provides support for the lay-down of the nacelles. The nacelle is pre-assembled before offshore transportation. It will be watertight and effectively complete when leaving the manufacturer’s facility. For offshore wind turbines, though the components themselves may have been sourced from specialist manufacturers worldwide, the final assembly of turbine nacelles occurs adjacent to the water
Garrad Hassan America, Inc. Page 62 of 153

Document No. 700694-USPO-R-03 Assessment of Ports for Offshore Wind Development in the United States Issue: E Final
Load-out
Load-out of wind turbine nacelles will be undertaken by vessel-based cranage or, in the case of non-self-propelled transport barges, port-based cranage, as presented in Figure 5-15. The transport vessel shall be required to moor against the quayside. The frame mounted on the tower-top flange may be used to ensure that the connection between the nacelle and the deck is of adequate structural strength to tolerate the accelerations which the cargo will endure during transit. The weight of this frame therefore needs to be considered in any load-out lift. It can have a further function, which is to speed connection to rolling and floating transport. There will be some form of bolted or welded connection on the underside, which is designed to marry with a pre-installed mating part, fitted to a structurally sound area of the deck. This ensures rapid assembly and offshore removal of sea lashings, and helps to precisely align the cargo with the under deck stiffening of the vessel’s structure.
Source: www.vattenfall.co.uk
Source: www.renewableenergyfocus.com
Figure 5-14: Port Cranage Nacelle Load-out Figure 5-15: Crawler Crane Nacelle Load-out
The sea-lashing frame may also form a lifting cradle, to which lifting tackle on a custom spreader beam arrangement attach, for swift lifting during loading and unloading. This optional functionality may add considerable weight to the frame, and it may be preferable simply to attach lifting tackle to the upper structure of the nacelle. Summary of Port Requirements for Nacelles
The following key parameters need to be investigated when assessing port facilities for wind turbine nacelle manufacture, storage, and transportation:
• Fabrication facility: Fabrication facilities for the final assembly of nacelles will require cranes individually capable of handling the largest components. Electric Over-Head Travelling (EOHT) crane capacity of up to 75 t may be required for the movement of components within the facility. The nacelles will likely be built with the capability for SPMTs to maneuver underneath the nacelle’s tower-top flange crane, jack-up and transit out of the facility.
• Haul: A maximum ground bearing pressure resulting from the use of SPMTs of 10 t/m2 has been assumed and this will be a requirement of all haul routes from storage areas to load-outs.
Garrad Hassan America, Inc. Page 63 of 153

Document No. 700694-USPO-R-03 Assessment of Ports for Offshore Wind Development in the United States Issue: E Final
• Storage: Nacelles are principally stored on frames, with the frame bolted to the nacelle at the tower/nacelle transition.
• Load-out: It is vital in this case that any quayside can accommodate heavy-lift cargo vessels, as components will be being sourced worldwide, so both material input and delivery of manufactured items may well involve large cargo vessels.
• Quayside: Nacelles are usually transported by SPMT so it will be possible to vary the number of units used to ensure that ground bearing pressure is within acceptable limits.
• Depth: Nacelles are generally carried long distances as deck cargo on heavy-lift cargo vessels, possibly the same vessels used to transport blades. These large transportation vessels will have a significant draft requirement within the port facility.
• Sea bed: Large offshore wind farm installation vessels may well collect turbines from manufacturer’s premises so jack-up capacity will be required of the quayside. Measurements of the soil strength adjacent to the quayside will be needed to ensure that layering of sub strata does not include thin hard layers of soils overlaying weaker soils to avoid jack-up leg punch-through.
• Mobile Cranage: The largest offshore nacelles today weigh in excess of 300 t, however, these weights are likely to increase as technology trends push towards larger offshore machines. It is likely that transport vessels will load-out significant numbers of nacelles. Multiple 350 t mobiles would provide adequate capacity for load out.
• Ro-Ro: Rolling load out is far cheaper than lifting in some circumstances, so this capacity is desirable. 5.7.3 Wind Turbine Tower
Onshore Transportation and Storage
Wind turbine towers are manufactured under the cover of a fabrication facility with a production line set-up where steel plates are rolled into tower cans, which are in turn welded together into tower sections. Bespoke trolleys can be used to lift the tower sections and transport these around the port facility, as shown in Figure 5-16.
Source: earthandindustry.com
Source: www.mlm.uk.com
Figure 5-16: Tower Section Transportation Figure 5-17: Tower Section Storage
Garrad Hassan America, Inc. Page 64 of 153

Document No. 700694-USPO-R-03 Assessment of Ports for Offshore Wind Development in the United States Issue: E Final
Storage of the towers involves laying them on their sides with bespoke frames providing support at either end and in the middle of the tower section (depending on tower section length), as presented in Figure 5-17. Load-out
Load-out of wind turbine towers is undertaken by vessel-based cranage or, in the case of non-self-propelled transport barges, port-based cranage. Towers are usually fitted with lift frames at either end of the tower sections which provide lift points for the lifting frames. The frames also allow for towers sections to be stacked on board the heavy lift transport vessel, as presented in Figure 5-18.
Source: upload.wikimedia.org
Figure 5-18: Tower Section Vessel Cranage Load-out
As the tower is vertical when fitted, rather than engage in offshore up-ending during the final installation, it is best if the tower is transferred to the offshore site in an upright position. However, as depicted in Figure 5-18, during transportation of tower components from the manufacturer’s facility to the staging harbor, it is usual to transport the tower section horizontally. The upper flange of each tower section has bolted connections which are designed to take the considerable thrust loads of the turbines, so these form ideal points for locating lifting attachments. These are usually fitted to the tower sections before being loaded onto the deck of the installation barge and left in place; they are only removed (and stored until arrival of the next towers) once the tower has been installed in position. Offshore, the towers are heavy and long, and, with the rolling movements of a vessel, are capable of exerting significant loads on the transport vessel’s deck. As stated above, the towers are often transported in a vertical position. Ideally, if the whole tower were to be fitted together, this would require only one offshore lift. However, the very long and heavy structure may be too heavy for the crane to lift when in one piece; therefore, transportation in smaller sections is necessary.
Garrad Hassan America, Inc. Page 65 of 153

Document No. 700694-USPO-R-03 Assessment of Ports for Offshore Wind Development in the United States Issue: E Final
Other considerations include whether or not it is economical to design a deck frame substantial enough to react to the considerable loads which sea transits could inflict on the deck, and the difficulty of finding local deck areas with sufficient capacity to accommodate frameworks to withstand these loads from the lower tower flange bolts to bulkheads below decks. Summary of Port Requirements for Towers
The following key parameters need to be investigated when assessing port facilities for wind turbine tower manufacture, storage, and transportation:
• Workshop: Workshops with adequate headroom under the cranage will be necessary to ensure the tower bases can be lifted from rolling equipment. Towers require conical rolling, and rolling is more onerous than for cylindrical piles, and tower walls are far thinner so the equipment required is much smaller.
• Rail: The welding of cans will benefit from rails to align cans. Rail-mounted rollers will only require lightweight capacities, as tower walls are much thinner than piles.
• Length: Transportation will probably be via barges, but may use HLCVs so the length of the latter has been used as the limit, but this may be reduced if barges to be used are <100 m.
• Quayside: Towers are light but long components and require length but lightweight ground bearing pressure.
• Depth: Transportation will probably be via barges, but may use HLCVs so the draft of the latter has been used as the limit, this but may be reduced if barges are used.
• Mobile: It is becoming increasingly common to install complete towers offshore to reduce offshore operations, so a large crane capacity may be required.
• Ro-Ro: If rolling load-outs can be used, these may well reduce costs, though this is a desirable feature of the port, rather than a hard limit. The diameters of towers are larger than the height of lorry-trainers (16’ 6” in the UK), so Ro-Ro quays designed for haulage with restricted headroom are unsuitable – hence the requirement for unrestricted headroom.
• Haul: Tower sections may well be transported by SPMT or heavy haulage trailer, a minimum of which will be used to save costs, which may lead to them imparting up to 10 t/m2. This is not a hard limit, as a greater numbers of axles will greatly reduce this value.
• Storage: Tower sections are relatively cheap and may be ordered well in advance of the contract installation, as there is little cost and it reduces the risk of late delivery if production delays occur on a tight timetable. They will then require storage in large numbers and, if laid down, will require individual access for lifting and thus large areas. They are not typically stacked when stored horizontally. If space is at a premium they can be stored upright, at the cost of additional cranage, so this must not be taken as a hard limit.
5.7.4 Wind Turbine Port Criteria
Table 5-3 through Table 5-5 summarize the port requirements for individual wind turbine components. These criteria should be taken forward when assessing the suitability of a port facility to accommodate wind turbine manufacture, storage, and load-out.
Garrad Hassan America, Inc. Page 66 of 153

Document No. 700694-USPO-R-03 Assessment of Ports for Offshore Wind Development in the United States Issue: E Final
Table 5-3: Port Requirements as a Function of Wind Turbine Size – Blades
Component Parameter Wind Turbine Size [MW]
4 5 6 7 8
Blade
Rotor diameter [m] 120 135 150 164 175
Hub diameter [m] 3 4 4 4 5
Blade length [m] 59 66 73 80 85
Blade mass [t] 19 23 28 34 40
Chord length [m] 4 5 5 6 6
Quayside for storage 1 [m2] 363 440 527 615 696
Bearing area (2 contact blocks under frame) [m2] 16 18 20 22 24 Bearing pressure under blocks (3 blades stacked) [t/m2] 3.6 3.8 4.2 4.6 5.0
Fabrication workshop length [m] 69 76 83 90 95
Reinforced area for mobile crane load-outs [t] 76 92 112 136 160
Haul route strength between quayside and storage [t/axle] 7.8 8.6 9.6 10.8 12
Haul route strength between quayside and storage [t/m2] 10 10 10 10 10 1. Assumes 1 m buffer around blade
Garrad Hassan America, Inc. Page 67 of 153

Document No. 700694-USPO-R-03 Assessment of Ports for Offshore Wind Development in the United States Issue: E Final
Table 5-4: Port Requirements for as a Function of Wind Turbine Size – Nacelles
Component Parameter Wind Turbine Size [MW]
4 5 6 7 8
Nacelle
Nacelle mass [t] 162 239 330 390 450
Storage, lift, and sea lashing frame mass [t] 16 24 33 39 45
Total mass [t] 178 263 363 429 495
Nacelle width [m] 5.2 6.3 7.4 8.5 9.6
Nacelle length [m] 13 16 18 20 21
Nacelle storage area 1 [m2] 111 146 185 226 270
Number of SPMTs width wise 1 1 1 2 2
Number of lengths of baulk timber 2 2 2 3 3
Nacelle bearing area [m2] 27 31 35 59 64
Bearing pressure (baulk timber under columns) [t/m2] 7 8 10 7 8
Min number of SPMT axles for nacelle 8 11 15 18 20 1. Assumes 1 m buffer around nacelle
Garrad Hassan America, Inc. Page 68 of 153

Document No. 700694-USPO-R-03 Assessment of Ports for Offshore Wind Development in the United States Issue: E Final
Table 5-5: Port Requirements for as a Function of Wind Turbine Size – Towers
Component Parameter Power [MW]
4 5 6 7 8
Tower
Tower length [m] 66 74 81 88 94
Tower mass [t] 185 215 250 280 310
Tower diameter [m] 5.00 5.50 6.00 6.25 6.75
Number of sections 2 2 2 2 2
Section length [m] 33 37 41 44 47
Section mass [t] 93 108 125 140 155
Storage Area per Section1 [m2] 245 291 340 380 427
Bearing Area [m2] 16 16 16 16 16
Bearing Pressure [t/m2] 6 7 8 9 10 1. Assumes horizontal storage and a 1 m buffer around tower section It should be noted that tower dimensions and masses will depend on hub height, which is always site specific. Here GL GH has made a generic assumption that tower length will be 6 m greater than the rotor radius in order to provide clearance of the working platform at the base of the tower. 5.8 Wind Turbine Support Structures
The following sections detail the port requirements for the common wind turbine foundation technologies detailed in Section 2.2. 5.8.1 Steel Monopile Structures
Given the relative size of monopiles and transitions pieces, compared to other foundation solutions, it is possible to manufacture and transport these to staging harbors using heavy-lift transport vessels. Once mobilized at the staging port, suitable installation vessels are used to transport the foundations to the wind farm site for installation. The present section therefore details the port requirements for manufacturing facilities as well as staging points.
Garrad Hassan America, Inc. Page 69 of 153

Document No. 700694-USPO-R-03 Assessment of Ports for Offshore Wind Development in the United States Issue: E Final
Source: www.weldex.co.uk
Figure 5-19: Monopile Transportation on the Quay
• Width: The access channel width requirement should be qualified by stating that port access widths are customarily quoted as being the widest beam of two equally sized vessels which can pass through the narrowest part of the port approaches, whether this is the port’s dredged access channel, harbor entrance or other restriction.
• Heavy-lift cargo vessel drafts: It will be necessary for heavy transport to transit the monopiles between the manufacturer and the staging port if the monopiles are fabricated overseas. The transportation of monopiles using heavy lift cargo vessels will require that about 9.5 m to Chart Datum of water.
• Installation vessel drafts: It will be necessary for installation (jack-up) vessels to transit the monopiles between the staging port and the wind farm site. The transportation of monopiles using heavy lift cargo vessels will require that about 5.8 m to Chart Datum of water.
• Headroom: The headroom requirement for the installation port was based upon the assumption that there is a strong possibility that a jack-up vessel or feeder barge will be used to carry the monopile from the port, and carry out the installation. During marine transit the legs are above the water, so they are unlikely to be able to pass under many bridge decks and power lines. For this reason it is important that the vessel options be well understood when considering available staging ports for a project. Overhead clearance of at least 40 m or more is typically required. There is no such requirement for the manufacturing base.
• LOA: There is a range of overall lengths for heavy lift cargo vessels approaching 170 m, so to ensure “future-proofing” it is suggested that a figure of 170 m LOA port access be used, as this will be adequate for all but a small minority of these vessels.
• Quayside: The usual method of transport of monopiles is SPMT units imposing ground bearing pressures of approximately 20 t/m². As has been previously stated, this is not an absolute limit but is a reasonable capacity which will be able to accommodate most types of units.
Garrad Hassan America, Inc. Page 70 of 153

Document No. 700694-USPO-R-03 Assessment of Ports for Offshore Wind Development in the United States Issue: E Final
• Mobile crane: If the cranage is placed so that the outriggers are adjacent to the quay wall, the sheet piling in an unsupported quay wall would experience loadings which may be enough to collapse most quays. It is customary for monopiles to be lifted by two cranes in a lift configuration referred to as being “top-and-tailed”. The individual lift-weights are reduced by half, so figures of 1,000 t have been included to cover various anticipated lift configurations. The lift-weight of transition pieces is significantly less than that of their associated monopiles. There is therefore a reduced cranage requirement of 400 t.
• Sea bed: The sea bed adjacent to the quayside will have a finite capacity to support loads, and may or may not be suitable to support a jack-up vessel if it wanted to self-load from the quayside using the on-board crane.
• Haul routes: The exact transit routes by which heavy loads are to transit from any storage areas to the quayside need to be defined, and the deck strength of any paved areas assessed to ensure that they are sufficient to support SPMTs and their payload.
• Storage: Areas which are used for long-term storage of monopiles will be required to have sufficient deck strengths to accommodate the feet loads of storage frames. SPMT loading and unloading methodology is to pass under the load to be lifted and then jack on their upper load-bed raise-up and lift the payload. After transit to the destination, the jacks are lowered and the load is then again supported on the ground by the frame, and the SPMT is free to move out from under the load. Transition pieces are usually stored vertically, which avoids damage to paintwork. This means that the plan area required is about 10 m x 10 m to allow access around the structure.
5.8.2 Monopile Structure Port Criteria
Table 5-6 summarizes the port requirements for monopile structures. These criteria should be taken forward when assessing the suitability of a port facility to accommodate monopile manufacture, storage, and load-out.
Garrad Hassan America, Inc. Page 71 of 153
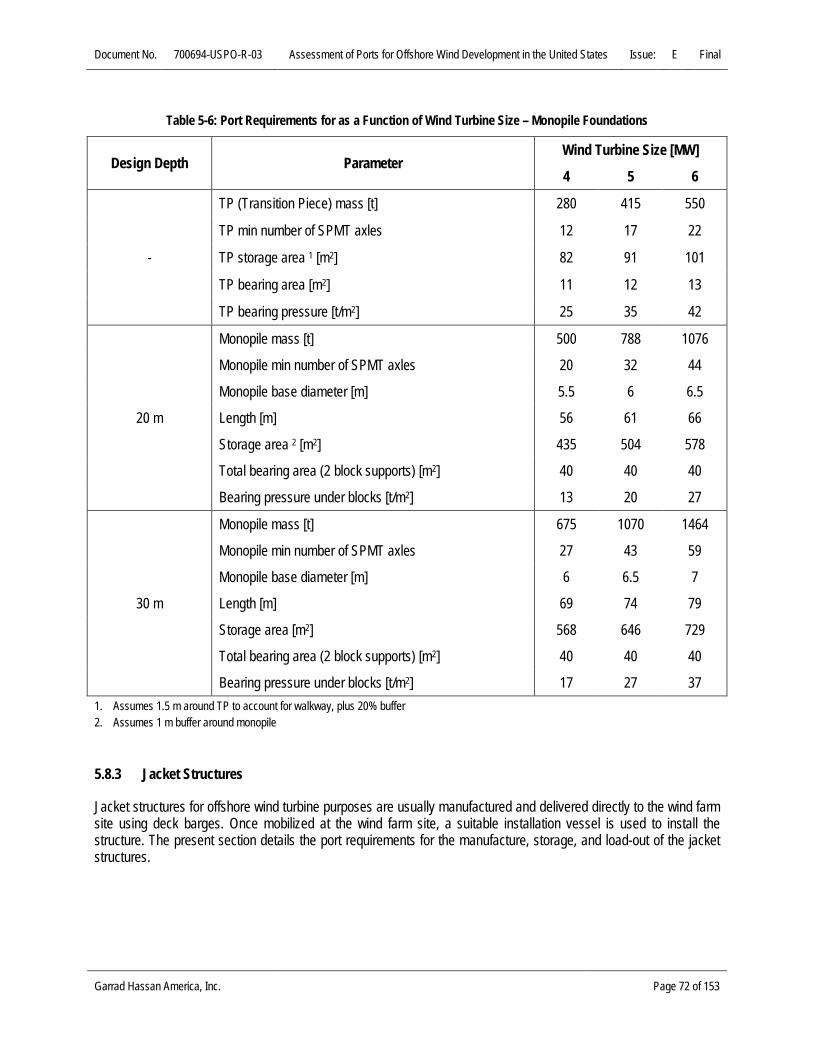
Document No. 700694-USPO-R-03 Assessment of Ports for Offshore Wind Development in the United States Issue: E Final
Table 5-6: Port Requirements for as a Function of Wind Turbine Size – Monopile Foundations
Design Depth Parameter Wind Turbine Size [MW]
4 5 6
-
TP (Transition Piece) mass [t] 280 415 550
TP min number of SPMT axles 12 17 22
TP storage area 1 [m2] 82 91 101
TP bearing area [m2] 11 12 13
TP bearing pressure [t/m2] 25 35 42
20 m
Monopile mass [t] 500 788 1076
Monopile min number of SPMT axles 20 32 44
Monopile base diameter [m] 5.5 6 6.5
Length [m] 56 61 66
Storage area 2 [m2] 435 504 578
Total bearing area (2 block supports) [m2] 40 40 40
Bearing pressure under blocks [t/m2] 13 20 27
30 m
Monopile mass [t] 675 1070 1464
Monopile min number of SPMT axles 27 43 59
Monopile base diameter [m] 6 6.5 7
Length [m] 69 74 79
Storage area [m2] 568 646 729
Total bearing area (2 block supports) [m2] 40 40 40
Bearing pressure under blocks [t/m2] 17 27 37 1. Assumes 1.5 m around TP to account for walkway, plus 20% buffer 2. Assumes 1 m buffer around monopile 5.8.3 Jacket Structures
Jacket structures for offshore wind turbine purposes are usually manufactured and delivered directly to the wind farm site using deck barges. Once mobilized at the wind farm site, a suitable installation vessel is used to install the structure. The present section details the port requirements for the manufacture, storage, and load-out of the jacket structures.
Garrad Hassan America, Inc. Page 72 of 153

Document No. 700694-USPO-R-03 Assessment of Ports for Offshore Wind Development in the United States Issue: E Final
Source: www.utilityweek.co.uk
Figure 5-20: Jacket Transportation on the Quay
Source: www.bifab.co.uk
Figure 5-21: Jacket Storage on the Quay
Garrad Hassan America, Inc. Page 73 of 153
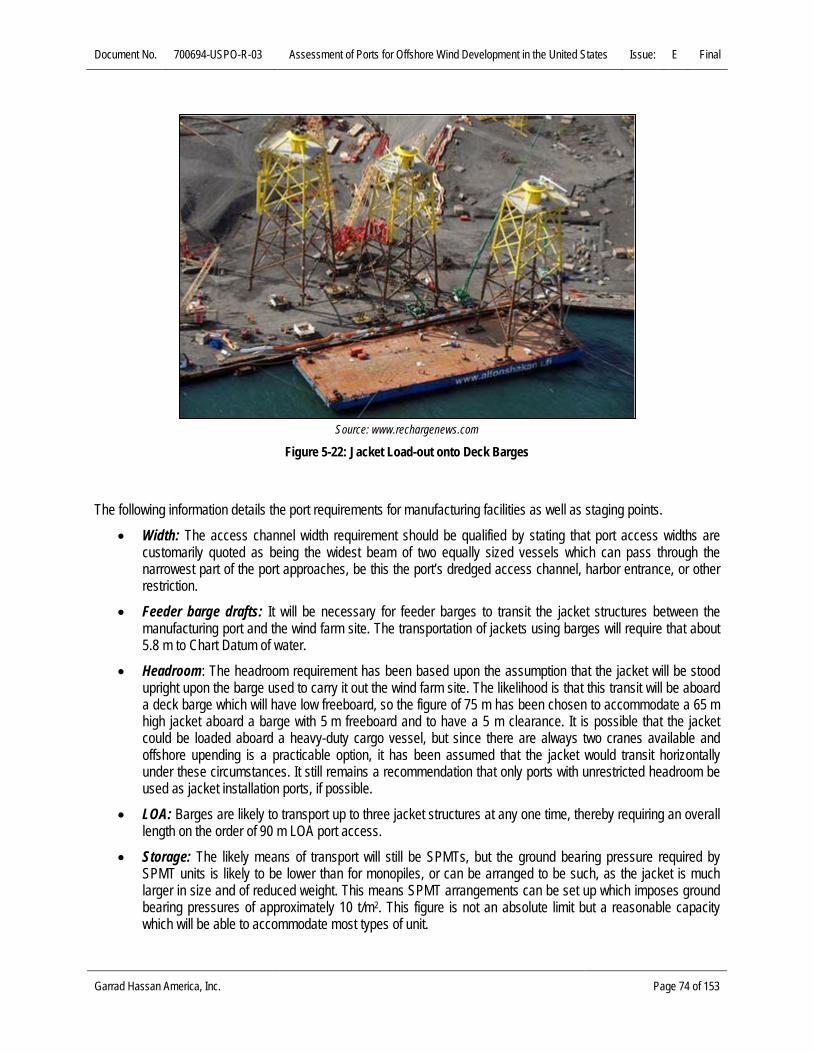
Document No. 700694-USPO-R-03 Assessment of Ports for Offshore Wind Development in the United States Issue: E Final
Source: www.rechargenews.com
Figure 5-22: Jacket Load-out onto Deck Barges
The following information details the port requirements for manufacturing facilities as well as staging points.
• Width: The access channel width requirement should be qualified by stating that port access widths are customarily quoted as being the widest beam of two equally sized vessels which can pass through the narrowest part of the port approaches, be this the port’s dredged access channel, harbor entrance, or other restriction.
• Feeder barge drafts: It will be necessary for feeder barges to transit the jacket structures between the manufacturing port and the wind farm site. The transportation of jackets using barges will require that about 5.8 m to Chart Datum of water.
• Headroom: The headroom requirement has been based upon the assumption that the jacket will be stood upright upon the barge used to carry it out the wind farm site. The likelihood is that this transit will be aboard a deck barge which will have low freeboard, so the figure of 75 m has been chosen to accommodate a 65 m high jacket aboard a barge with 5 m freeboard and to have a 5 m clearance. It is possible that the jacket could be loaded aboard a heavy-duty cargo vessel, but since there are always two cranes available and offshore upending is a practicable option, it has been assumed that the jacket would transit horizontally under these circumstances. It still remains a recommendation that only ports with unrestricted headroom be used as jacket installation ports, if possible.
• LOA: Barges are likely to transport up to three jacket structures at any one time, thereby requiring an overall length on the order of 90 m LOA port access.
• Storage: The likely means of transport will still be SPMTs, but the ground bearing pressure required by SPMT units is likely to be lower than for monopiles, or can be arranged to be such, as the jacket is much larger in size and of reduced weight. This means SPMT arrangements can be set up which imposes ground bearing pressures of approximately 10 t/m2. This figure is not an absolute limit but a reasonable capacity which will be able to accommodate most types of unit.
Garrad Hassan America, Inc. Page 74 of 153

Document No. 700694-USPO-R-03 Assessment of Ports for Offshore Wind Development in the United States Issue: E Final
• Mobile crane: If the cranage is placed so that the outriggers are adjacent to the quay-wall, the sheet piling in an unsupported quay-wall would experience loadings which may be enough to collapse most quays. It is unlikely that the jacket structure will be lifted by a single crane, and two cranes and spreader beams are envisaged. The maximum leg weight will be in the order of 700 t, so with half-load per crane a figure of 350 t has been taken.
• Haul routes: The exact transit routes by which heavy loads are to transit from any storage areas to the quayside need to be defined, and the deck strength of any paved areas assessed to ensure that they are sufficient to support SPMTs and their payload. The transport of jacket structures will require considerable width and turning circles.
5.8.4 Jacket Structure Port Criteria
Table 5-7 summarizes the port requirements for jacket structures of 40 m design depth. These criteria should be taken forward when assessing the suitability of a port facility to accommodate jacket manufacture, storage, and load-out.
Table 5-7: Port Requirements as a Function of Wind Turbine Size – Jacket Structures
Component Parameter Wind Turbine Size [MW]
5 6 7 8
Jacket
Jacket mass [t] 609 684 759 834
Pin-piles (x4) mass [t] 284 328 372 416
Number of SPMT axles 25 28 31 34
Jacket leg separation [m] 25 23 20 18
Height (leg base to TP) [m] 58 58 58 58
Storage area (laid down) 1 [m2] 1740 1601 1392 1253
Storage area (standing) 1 [m2] 750 635 480 389 Bearing area (4 block supports to distribute load) [m2] 48 48 48 48
Bearing pressure under blocks [t/m2] 13 14 16 17 1. Assumes 20% buffer around structure 5.8.5 Concrete Gravity Base Structures
As described in Section 2.2.3, Gravity Base Structures (GBS) transmit wind turbine loads to the sea bed using the weight of the structure to provide lateral stability. This simple concept makes GBS suitable for a range of water depths, though are generally considered most economical below 30 m. However, on the other hand, due to their size, they are difficult to handle and are therefore transported directly to the wind farm project site from the chosen manufacturing facility.
Garrad Hassan America, Inc. Page 75 of 153

Document No. 700694-USPO-R-03 Assessment of Ports for Offshore Wind Development in the United States Issue: E Final
Table 5-8 displays generic specifications of GBS at an assumed design depth of 40 m LAT, or typically 30 mLAT. These are example specifications of generic foundations and are intended only to inform port requirements. As discussed in Section 2.2.3, much of the experience of gravity bases at offshore wind farms are at relatively shallow depths of <25 m, but the range at which GBS designs are considered most applicable are in deeper waters.
Table 5-8: Port Requirements as a Function of Wind Turbine Size – GBS Structures (40 m design depth)
Parameter Type Parameter
Power [MW]
6 7 8
General Parameters
Total mass without ballast [t] 5970 8009 9691
Diameter [m] 39 46 55
Area of base [m2] 1260 1777 2506
Quayside Construction Parameters
Clearance around base during construction [m] 10 10 10
Construction area (per GBS) [m2] 3481 4398 5625
Bearing area (quayside construction and storage)1 [m2] 504 711 1002
Bearing pressure (quayside construction and storage) [t/m2] 12 11 10
Number of SPMT axles required to transport GBS 239 320 388
Dry Dock Construction Parameters
Unballasted bearing pressure distributed [t/m2] 5 5 4
Clearance around base during dry dock construction [m] 3 3 3
Minimum width of dry dock [m] 45 52 61
Barge Construction Parameters
Clearance around base during barge construction [m] 2 2 2
Minimum barge width [m] 43 50 59
Barge length [m] 100 100 100
Harbor area (per barge) [m2] 4300 5031 5900
Barge draft [m] 5 5 5 1. Assumes that the mass of the structure rests on storage blocks that cover 40% of the area It is clear from these specifications that the biggest requirement that GBS foundations impose upon ports is their sheer size, particularly their weight. To date, three methodologies have been developed for GBS construction. Each of these methods has its advantages and disadvantages and their appropriateness varies with GBS design and port capabilities. The methods are described below with the port requirements for each concept.
Garrad Hassan America, Inc. Page 76 of 153

Document No. 700694-USPO-R-03 Assessment of Ports for Offshore Wind Development in the United States Issue: E Final
GBS Construction on Quayside
Construction on the quayside will often require reinforcement of the quay as both the total weight and the bearing pressure applied are significant. An example of a project where reinforcement was required is Thornton Bank, located in Belgian waters.
Source: www.seco.be
Figure 5-23: Construction of GBS on the Quay (Thornton Bank)
Construction of GBS adjacent to the quayside allows the structure to be lifted directly for installation using a heavy lift vessel such as the Rambiz or Svanen. The wall of the quayside may need to be reinforced due to the forces imposed on it during this load-out. If it is not possible to site the substantial construction area required adjacent to the quayside then SPMTs can be used to haul the GBS for load-out. Average bearing pressure for the port is the weight of the un-ballasted structure divided by the area – typically approximately 60 kPa or 6 t/m2. In addition, if transport by SPMTs is necessary, the weight of the GBS will be distributed through the wheels of the SPMT with an axle load of up to 30 t per axle. Whether this is acceptable for individual ports is dependent on quayside but load spreading can help meet this requirement. The following criteria need to be investigated when constructing GBS on the quayside:
• Width: The largest of the heavy-lift vessels used to install GBS structures is Svanen at 71.8 m beam, so a limit of 73 m has been selected to give minimum clearance.
• Headroom: The headroom requirement has been based upon the assumption that a large shearleg vessel will be used to carry out the installation. Svanen requires clearance of over 100 m, so it cannot realistically pass under any marine structures. Therefore, unlimited headroom is specified.
• Depth: The largest of the heavy-lift vessels used to install GBS structures is Svanen, with a lift capacity of 8,700 t and a 6 m fully laden draft.
Garrad Hassan America, Inc. Page 77 of 153

Document No. 700694-USPO-R-03 Assessment of Ports for Offshore Wind Development in the United States Issue: E Final
• GBS fabrication area: The installation port is usually the point of manufacture of the GBS. A large area is required for GBS fabrication, as these structures tend to have plan areas of at least 30 m square. An area of 45 m x 45 m or ~2,000 m2 per base gives a 15 m clearance around the base.
GBS Construction on Barges
Barges are an attractive option for the construction of GBS structures, as they can be used in almost any port due to their minimal draft requirements. This construction method is viable for GBS as long as a barge large enough for the foundation can be found. Bearing in mind that the example base diameters given previously are representative of gravity bases on fairly strong soils (350 kPa allowable bearing pressure), the area can increase to the point where extremely large barges are required to accommodate construction.
Source: www.lorc.dk
Figure 5-24: Eide 5 Heavy-Lift Barge Picks a GBS off a Construction Barge
Where barges are used, installation can be performed from a variety of vessels including existing heavy-lift vessels such as the Eide 5 barge used on Nysted or Rambiz used on Thornton Bank. As the construction occurs on barges, the GBS units can be towed on the construction barge to the wind farm site for installation, which removes the requirement for the installation vessel to interact with the port facility. The criteria to be investigated when constructing GBS on the quayside are outlined in Table 5-9.
Garrad Hassan America, Inc. Page 78 of 153

Document No. 700694-USPO-R-03 Assessment of Ports for Offshore Wind Development in the United States Issue: E Final
Table 5-9: Summary of Port Requirements for Gravity Base Construction on Barges
Port access channel of suitable width for construction barges (30 m standard barge width, increasing with GBS size) Water depth suitable for construction barge (>5 mLAT)
Significant port space available for long-term rent (several barges at >30 m x 100 m) GBS Construction in Dry Dock
Construction of GBS within dry dock facilities with a float-out of the structure reduces the requirement for large installation vessels capable of lifting the whole GBS, thereby reducing vessel costs. Dry dock space is more expensive then general port space, but extremely large GBS designs can be constructed in dry docks as the float-out allows some or all of the weight to be taken by the buoyancy of the GBS, thereby reducing required crane size.
Source: www.ableuk.com
Figure 5-25: GBS Construction in a Dry-dock Facility The challenge with dry dock construction is producing at a sufficient rate for commercial installation considering the limited availability of suitable dry docks. Installation vessels for this construction method depend on the buoyancy of the design. The criteria to be investigated when constructing GBS in dry dock are outlined in Table 5-10.
Garrad Hassan America, Inc. Page 79 of 153

Document No. 700694-USPO-R-03 Assessment of Ports for Offshore Wind Development in the United States Issue: E Final
Table 5-10: Summary of Port Requirements for Gravity Base Construction in Dry Dock
Port access channel of suitable width for installation vessels (>73 m)
Port access channel with unlimited headroom
Water depth suitable for installation vessels (>6 mLAT)
Large dry dock of width greater than the GBS 5.9 Substation
As outlined in Section 3.4, the offshore substation consists of a topside containing the electrical equipment and a foundation which supports the topside. 5.9.1 Topside Port Requirements
Table 5-11 below outlines the specifications of existing offshore substations in Europe. Substations are extremely heavy items and as such tend to pose similar port requirements as GBS foundations due to their size. As discussed in Section 3.4, the topside will typically be lifted directly off the quayside for installation by a heavy-lift installation vessel such as Rambiz or Svanen. The installation port must be able to accommodate such large vessels. If a separate port is used for manufacture and assembly, but not installation, then the manufacturing port must also be able to handle heavy-lift vessels, or have a large enough crane in port to load-out onto a transport vessel. Due to the difficulty of handling large substations, they will typically be installed directly from the manufacturing port. As with GBS foundations, the typical transport methodology for substation topsides within the port is via SPMT due to the large weights of the substations (typical load per axle of an SPMT is 30 t/m2). Smaller substation topsides may also be carried within the port by crawler crane, but this becomes problematic as larger sizes are reached. As discussed previously, dividing tasks using multiple substations may limit the substation size. This is demonstrated by the example of Borwin 1 given below, where the substation, weighing 3200 t, is only performing the AC to DC conversion, the voltage already having been stepped up by the Bard 1 substation. The criteria to be investigated when constructing the topside of an electrical substation are outlined in Table 5-11.
Table 5-11: Summary of Port Requirements for Substation Topside
Port access channel of suitable width for installation vessels (>73 m )
Port access channel with unlimited headroom (based on Svanen)
Water depth suitable for installation vessels (>6 mLAT)
Quayside reinforced for assembly and storage of SS (>2,500 t @ 20 t/m2)
Garrad Hassan America, Inc. Page 80 of 153

Document No. 700694-USPO-R-03 Assessment of Ports for Offshore Wind Development in the United States Issue: E Final
5.9.2 Substation Foundation Port Requirements
The first approach in selecting a substation foundation is to verify whether the wind turbine foundation design can be reused (possibly scaled up or slightly modified), which will reduce costs. The lower the substation’s weight, the smaller the change in design required for the substation foundation compared to the wind turbine foundations. This results in less costly manufacturing and installation, which is another advantage to the splitting of voltage step-up and AC-to-DC conversion tasks discussed above. In deeper waters or in cases of very large substation weights where the project’s turbine foundation cannot be viably used for the substation, jacket foundations are often selected. While this report provides figures for foundation port requirements, substation foundations will typically be larger and heavier. Also, they are less tapered, due to the large area of the substation. 5.9.3 Self-installing Substation Port Requirements
Notable deviations from the above requirements are self-installing and floating substation designs. Self-installing designs come with an incorporated jacking foundation, where the legs can simply jack up at site to secure the substation in place. Floating designs can be attached to pre-laid anchors upon installation. Both designs require only transport to site, which can be done by tug, after they are placed in the water at the port. As such, port requirements are reduced to either the crane capacity to place the substations in the water, a sufficient slipway, or a dry dock within which to construct the substation. 5.10 Wind Farm Electrical Plant
Electrical cabling for an offshore wind farm includes both the inter-array cables connecting strings of wind turbines to the substation and the export cables connecting the offshore substation to the onshore substation. Both cables can be produced by a single manufacturing port facility. Where a staging port is used, the cable vessels and cable handling impose similar requirements as encountered at the manufacturing port. 5.10.1 Array Cables
Array cables are significantly lighter than export cables, weighing approximately 10 kg/m. The total weight of array cables for a project ranges between 100 and 1000 tonnes, depending on the size of the wind farm. It is more common for array cables to be stored at a staging port as they are lighter, can be transported in shorter lengths, and are more flexible and therefore less onerous to handle. In addition to being wound onto an on-board carousel, turntable, or cable tank, array cables can also be lifted pre-wound from the port to the vessel deck. By lifting the cables on drums, using the staging port becomes more practical. For array cabling, the advantage of using a staging port is that it allows the cabling to be transported using a HLCV rather than a specially equipped cable vessel. Such a vessel can travel faster, with lower fuel burn. To load a pre-wound cable drum onto a vessel requires a heavy crane lift, so the port must be able to accommodate a heavy crane to achieve this. Alternatively, a heavy lift cargo vessel may be able to pick up the array cables pre-wound using its on-board crane. Where pre-wound cable drums are used, each will be loaded with enough cable to connect at least a string of wind turbines. The total load out of array cable may be split across a number of drums.
Garrad Hassan America, Inc. Page 81 of 153
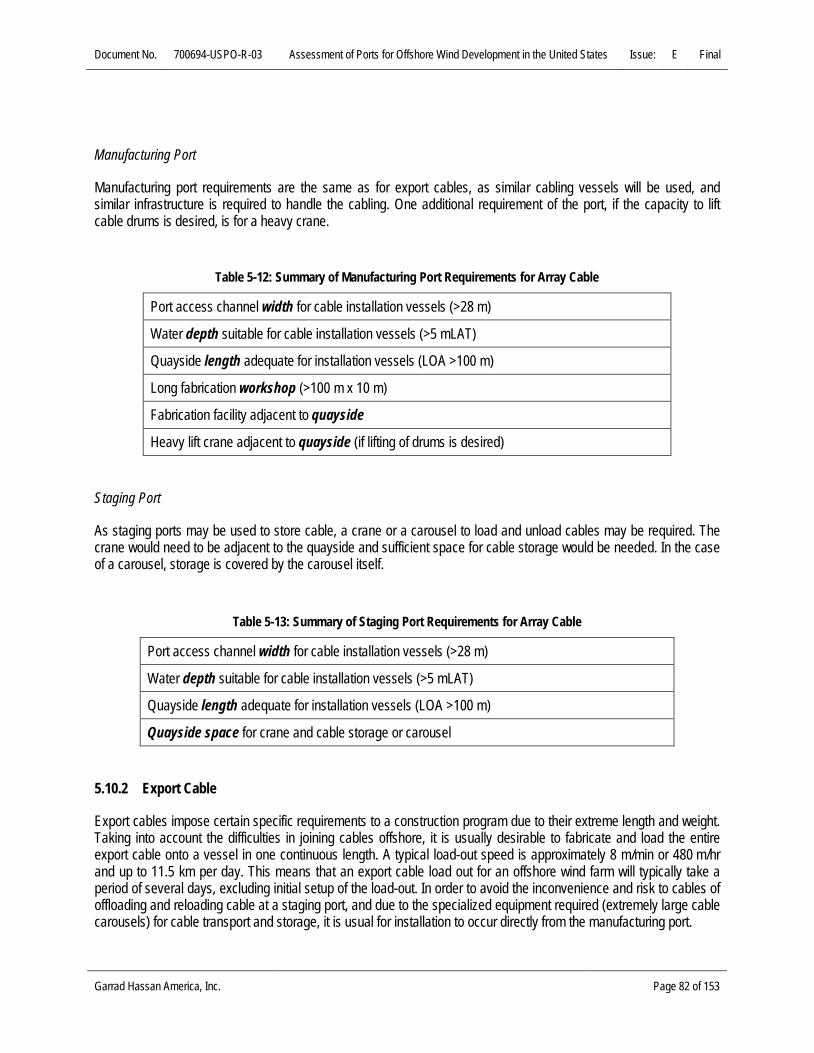
Document No. 700694-USPO-R-03 Assessment of Ports for Offshore Wind Development in the United States Issue: E Final
Manufacturing Port
Manufacturing port requirements are the same as for export cables, as similar cabling vessels will be used, and similar infrastructure is required to handle the cabling. One additional requirement of the port, if the capacity to lift cable drums is desired, is for a heavy crane.
Table 5-12: Summary of Manufacturing Port Requirements for Array Cable
Port access channel width for cable installation vessels (>28 m)
Water depth suitable for cable installation vessels (>5 mLAT)
Quayside length adequate for installation vessels (LOA >100 m)
Long fabrication workshop (>100 m x 10 m)
Fabrication facility adjacent to quayside
Heavy lift crane adjacent to quayside (if lifting of drums is desired) Staging Port
As staging ports may be used to store cable, a crane or a carousel to load and unload cables may be required. The crane would need to be adjacent to the quayside and sufficient space for cable storage would be needed. In the case of a carousel, storage is covered by the carousel itself.
Table 5-13: Summary of Staging Port Requirements for Array Cable
Port access channel width for cable installation vessels (>28 m)
Water depth suitable for cable installation vessels (>5 mLAT)
Quayside length adequate for installation vessels (LOA >100 m)
Quayside space for crane and cable storage or carousel 5.10.2 Export Cable
Export cables impose certain specific requirements to a construction program due to their extreme length and weight. Taking into account the difficulties in joining cables offshore, it is usually desirable to fabricate and load the entire export cable onto a vessel in one continuous length. A typical load-out speed is approximately 8 m/min or 480 m/hr and up to 11.5 km per day. This means that an export cable load out for an offshore wind farm will typically take a period of several days, excluding initial setup of the load-out. In order to avoid the inconvenience and risk to cables of offloading and reloading cable at a staging port, and due to the specialized equipment required (extremely large cable carousels) for cable transport and storage, it is usual for installation to occur directly from the manufacturing port.
Garrad Hassan America, Inc. Page 82 of 153

Document No. 700694-USPO-R-03 Assessment of Ports for Offshore Wind Development in the United States Issue: E Final
Source: www.abb.co.uk
Figure 5-26: ABB’s High-voltage Manufacturing Facility in Sweden
Manufacturing Port
As discussed above, the majority of export cable installations will be performed by transiting to the site directly from the manufacturer. The demands export cable manufacturers place on ports are driven by the availability of premises for fabrication near the quayside for direct load-out of cables, and for large areas for the manufacturing of cables. In addition, the ground must have reasonable strength to withstand the weight of the cables (these are closely coiled, with an AC cable weighing approximately 75 kg/m). For a cabling manufacturing site, a surface area of ~70,000 m2 is recommended, though this will vary significantly depending on estimated rates of production. Storage of cables will usually utilize turntables measuring approximately 30 m in diameter with a bearing pressure of 10 t/m2 at capacity. As such, the storage area may need to be reinforced, but this can be a distance away from the quayside loading area as long as there is a direct path for feeding the cable to the vessel. Cable laying vessels used on offshore wind farms have lengths of up to 130 m, so a minimum length of port quayside of 150 m is recommended for safety, though most cable vessels are less than 100 m. Due to the long load-out time, the cabling port must have sufficient draft for the fully laden vessel at low tide.
Garrad Hassan America, Inc. Page 83 of 153

Document No. 700694-USPO-R-03 Assessment of Ports for Offshore Wind Development in the United States Issue: E Final
Table 5-14: Summary of Manufacturing Port Requirements for Export Cable
Port access channel width for cable installation vessels (>28 m)
Water depth suitable for cable installation vessels (>5 mLAT)
Quayside length adequate for installation vessels (LOA >100 m)
Long fabrication workshop (>100 m x 10 m)
Fabrication facility adjacent to quayside It should be noted that cabling manufacturers will often serve the telecoms markets as well, so manufacturing port requirements are often intended to match the needs of submarine communications installation as well. Staging Port
While the cable installation vessel will typically load out from the manufacturing port, it is good practice to ensure that the staging port also meets the cable vessels’ draft, length and breadth requirements. This is in case of refueling and restocking or weather delays in the staging port, though restocking can be handled by offshore supply vessels. Occasionally it may be advantageous to store the cable at the staging port to enable transfer between a transit vessel and an installation vessel. However, this is not typical.
Table 5-15: Summary of Staging Port Requirement for Export Cable
Port access channel width for cable installation vessels (>28 m)
Water depth suitable for cable installation vessels (>5 mLAT)
Quayside length adequate for installation vessels (LOA >100 m) 5.11 Operation & Maintenance
The service technicians and vessels should be based as close as possible to the project site so as to reduce transportation time. The harbor used as a base for scheduled maintenance and minor intervention needs to be able to accommodate all vessels (typically 15 to 25 m LOA, 2 m draft) and does not necessarily need specific quayside equipment. However, it is important that this harbor be accessible close to 100% of the time and that it not be significantly restricted by tidal constraints or lockgate limitations. Furthermore, if a helicopter is to be employed within the access strategy, the infrastructure to support this may be best positioned adjacent to the port-base where possible, although helicopter ports farther inland may also be considered. The harbor required for major intervention operations, typically involving a jack-up rig, does not necessarily need to be located in close proximity to the site. By way of an example, one successful solution utilized in Europe involves a replacement gearbox being loaded onto a jack-up barge in a Danish or German harbor and then installed in a turbine located in the UK. After the exchange, the faulty gearbox stays on the jack-up barge until it is back in Denmark or
Garrad Hassan America, Inc. Page 84 of 153
Document No. 700694-USPO-R-03 Assessment of Ports for Offshore Wind Development in the United States Issue: E Final
Germany and then sent for repair. This scenario could be enacted in the U.S. regardless of whether replacement parts are shipped from overseas, are deployed from a storage facility in the U.S., or are manufactured domestically. This latter option is expected to be more prevalent as the offshore wind supply chain is further established in the United States. Harbor facilities used for major intervention must be able to accommodate the jack-up barges used in the industry (130 m LOA, 12 m draft, with sufficient ground bearing capacity to allow jacking-up at the quayside). 5.12 Port Requirements for Floating Offshore Wind Turbines
Floating offshore wind turbines share many of the same port requirements as for fixed offshore turbines; however, there are some key exceptions:
• Overhead clearance: Floating turbines may be assembled in port and then towed to site. Assuming the typical 25 m clearance below the bottom of the rotor arc (blade tip in lowest position to mean water level), the overhead clearance requirements for towing the 4-8 MW turbines discussed in this report will range from approximately 145 m to 200 m. This precludes most if not all ports with bridges or overhead wires between the port and open water.
• Channel Width: The vessel spread required for towing floating wind turbines may require tugs to be arrayed in front, behind, and to either side of the turbine while in transit. This is likely to require at least 75 m of channel width.
• Channel Depth: During transit, floating turbines are not expected to require especially deep channels – 10 m is likely sufficient. During construction, however, the required depth at the quayside may be greater. While the depth requirement will depend on the floating technology utilized, the technologies in development today can be deployed from the port at minimal draft: spars can be towed horizontally to deeper water before being up-ended for final turbine installation, semi-submersibles can be negatively ballasted so they ride higher in the water for deployment, and tension-leg platforms can also be towed out from port within typical draft requirements.
5.13 Miscellaneous Port Requirements
It is assumed that existing port facilities will be able to support the needs of construction and manufacturing in terms of the following:
• Office space;
• Car parking;
• Internet facilities;
• Heating;
• Water;
• Electrical supply;
• Security; and
• Radar and communications.
Garrad Hassan America, Inc. Page 85 of 153

Document No. 700694-USPO-R-03 Assessment of Ports for Offshore Wind Development in the United States Issue: E Final
PART II: U.S. OFFSHORE WIND PORT ASSESSMENT TOOL
Garrad Hassan America, Inc. Page 86 of 153
Document No. 700694-USPO-R-03 Assessment of Ports for Offshore Wind Development in the United States Issue: E Final
6 PORT ASSESSMENT TOOL
GL GH designed and developed a mathematical model, on behalf of the U.S. DOE, to assess port readiness for Offshore Wind in the U.S. The tool, referred herein as the Port Assessment Tool, was developed on the basis of current and anticipated technology trends and installation techniques for the offshore wind industry. 6.1 Introduction: Purpose of the Tool
The two main objectives of the Port Assessment Tool are:
• To provide a publicly available tool which can be used by all stakeholders of the U.S. offshore wind industry to assess and plan for port readiness for offshore wind; and
• To serve this study in assessing the current status of the port infrastructure and readiness for offshore wind, in the form of opportunity assessments, cost-benefit analyses, and case studies. Results can be found in Section 10.
The tool can be accessed at the following web address: www.OffshoreWindPortReadiness.com. The Port Assessment Tool was developed for multiple stakeholders, including port authorities, developers, original equipment manufacturers, and other entities providing services to the offshore wind industry. For example, the developer of an offshore wind farm can use the Port Assessment Tool to identify the nearest suitable staging port, or a port authority may wish to assess the suitability of its facilities to service regional offshore wind farm developments, while gaining some insight to the number of cost of infrastructure improvements required to better service said developments. The Port Assessment Tool provides a starting point for identifying opportunities in pairing port facilities with offshore wind projects along with the strengths and weaknesses of these pairings. It provides a “ballpark” estimate of the costs associated with upgrading a given port for the needs of a given project. Every project and port facility are unique and the Port Assessment Tool is not intended to replace the full and detailed engineering process that must occur in order to truly understand the actual costs of such upgrades. 6.2 Gap Analysis and Estimated Costs
The Port Assessment Tool performs a gap analysis considering the current capabilities of the port against those required for the identified demand. An example of this might be a developer considering the staging of wind turbines prior to installation. It is a requirement that the bearing pressure imposed on the port storage and quayside areas does not exceed the maximum ground bearing capacity of the port. Following the identification of a port and a specific wind turbine model, the tool will compare the ground bearing capacity required to store the wind turbine components against the known ground bearing capacity of the selected port. Where storage ground bearing capacity is insufficient, the tool will flag a gap. The magnitude of this gap is used in conjunction with built-in cost functions to provide the user with an approximate cost to close that gap. See Appendix B for further explanation of these cost functions. The cost functions utilized in this study are intended to capture typical values for materials and labor associated with the various improvements. Excluded from these estimates are engineering and development, permitting, management, alternative approaches to facility design, and auxiliary costs such as the cost of disposal of excavated
Garrad Hassan America, Inc. Page 87 of 153

Document No. 700694-USPO-R-03 Assessment of Ports for Offshore Wind Development in the United States Issue: E Final
material. While the actual costs will therefore be higher than the values provided, the values provided can be used as order-of-magnitude estimates of the cost required to upgrade a particular facility. In summary, the Port Assessment Tool provides stakeholders with the capability to assess the suitability of ports and estimate the costs of required improvements. It should be noted that the same default cost functions are used for each port. Therefore, it is recommended that detailed studies be carried out in the form of a full port assessment during project development. An overview of the gaps that are analyzed within the Port Assessment Tool is presented in Table 6-1:.
Table 6-1: Overview of Gap Analysis and Information Required for Gap Analysis
Port Characteristic / Capability Vessel Characteristics Required
Gap Costed (Y/N) Notes/Reference
Port quayside area [m2] Yes
Port quayside bearing pressure [t/m2] Yes
Port quayside length [m] Length [m] Yes
Port quayside water depth [m] Draft [m] Yes
Port quayside jack-up suitability [Y/N] Is it a jack-up? [Y/N] Yes
Port storage bearing pressure [t/m2] Yes
Port floating storage area [m2] Yes
Haul route width, length [m] Yes
Haul route bearing pressure [t/m2] Yes
Port dry dock area [m2] Yes
Port workshop area [m2] No At the expense of the manufacturer
Port minimum channel width [m] Beam [m] No Unable to cost – look for alternative vessel/port
Port minimum overhead clearance [m] Air draft [m] No Unable to cost – look for alternative vessel/port
6.2.1 Tool Functionality Overview
The Port Assessment Tool can assess the suitability of a port (or multiple ports) to carry out a certain type of operation for an offshore wind farm project with specific installation vessels. The inputs for the analysis of individual ports are illustrated in Figure 6-1 below.
Garrad Hassan America, Inc. Page 88 of 153

Document No. 700694-USPO-R-03 Assessment of Ports for Offshore Wind Development in the United States Issue: E Final
Figure 6-1: Port Assessment Tool Input Selection Description
The Port Assessment Tool mirrors the above input selection, as shown in the layout, taken from the homepage and shown in Figure 6-2 below.
Port Name
•Choose from list or click on map
Wind Farm Charactistics
•Turbine size •Number of
turbines •Foundation
type •Water depth
Port Type
•Manufacturing (turbine, foundation, or substation)
•Staging (turbine or foundations and array cables)
•Operations and Mainenance
Vessels
•Choose vessels based on selected port type and function
Garrad Hassan America, Inc. Page 89 of 153

Document No. 700694-USPO-R-03 Assessment of Ports for Offshore Wind Development in the United States Issue: E Final
Source: GL GH
Figure 6-2: Layout of the Port Assessment Tool
The Port Assessment Tool provides default values for the majority of input parameters and cost assumptions, based on current industry practices, however flexibility has been incorporated to allow stakeholders to modify input parameters. Users have the ability to customize component and facility information and cost assumptions to better match the known information from a given project and facility. Stakeholders may select one of twenty-one different port uses, as illustrated in Appendix A. Port requirements are calculated by the Port Assessment Tool for each use with these requirements compared to the real-life port offerings using the gap analysis methodology described in Section 6.2, resulting in a summary of gaps and associated cost estimates to mitigate the identified gaps. The Port Assessment Tool includes a database of port characteristics, informed by the port owners. The capability has been included for port owners to update their port information within The Port Assessment Tool using private
Garrad Hassan America, Inc. Page 90 of 153
Document No. 700694-USPO-R-03 Assessment of Ports for Offshore Wind Development in the United States Issue: E Final
login details. A high-level overview of The Port Assessment Tool and the steps required to perform a gap analysis is presented in Figure in Appendix A. An overview of the gap analysis calculated in the tool and the required information are given in Table 6-1:. A detailed user guide explaining how to use The Port Assessment Tool, in a step-by-step process, can be found at following web address: http://www.offshorewindportreadiness.com/.
6.2.2 Port Assessment Tool Assumptions
The Ports Assessment Tool has been developed to allow stakeholders to assess individual ports for specific offshore wind projects, technologies, and installation methodologies, by providing the functionality to input project specific parameters. However, default values for all these parameters are specified in the tool for stakeholders that may not have sufficient knowledge to specify all parameters, but wish to conduct a high-level assessment. To inform these default values, the stakeholder must select several project characteristics;
• Select among five wind turbine sizes: 4, 5, 6, 7, and 8 MW.
• Select among 3 types of foundations: monopile (for 4, 5, and 6 MW turbines), jackets (for 6, 7, and 8 MW turbines), and GBS (for all turbine sizes).
• Select the water depth: 20 m (only for monopile foundations), 30 m (for all three foundation types), or 40 m (for jackets and GBS). These are typical water depths for current European projects.
The high-level assumptions employed within The Ports Assessment Tool include;
• Wind turbine blades are transported in a frame where three blades are stored on top of each other.
• The jacket foundation is four-legged and includes four pin-piles.
• The port minimum required channel width should be twice the beam of the vessel with the largest beam.
• The port minimum overhead clearance should be at least 10 m, for the vessel with the largest air draft.
• The quayside length should be at least equal to the overall length of the vessel with the longest length.
• A minimum of 1 m under keel clearance is required at the quayside for the vessel with the deepest draft.
• The project developer will lease required equipment, such as SPMTs and cranes, at its expense if it is not already available at the port facility.
Garrad Hassan America, Inc. Page 91 of 153

Document No. 700694-USPO-R-03 Assessment of Ports for Offshore Wind Development in the United States Issue: E Final
PART III: CASE STUDIES: ANALYSIS OF 6 PORTS AROUND THE COUNTRY
Garrad Hassan America, Inc. Page 92 of 153

Document No. 700694-USPO-R-03 Assessment of Ports for Offshore Wind Development in the United States Issue: E Final
7 INTRODUCTION
In order to investigate port readiness for offshore wind construction and operations, GL GH has applied the Port Assessment Tool on a regional level around the coast of the U.S. In keeping with other work conducted on behalf of the DOE, e.g. [2], five regions were selected for analysis: North Atlantic, South Atlantic, Gulf of Mexico, Pacific, and the Great Lakes. Figure 7-1 highlights the specific states that compose these regions.
Source: GL GH
Figure 7-1: U.S. Map Showing Coastal Regions and Specific Ports Studied
7.1 Ports Assessment Tool Application
GL GH has developed a methodology to assess port readiness for anticipated installed capacity for the period 2014-2030, for each of five regions around the U.S. coast. The methodology involves the identification of suitable port facilities to service the offshore wind potential in each region. Offshore wind potential, in terms of cumulative installed capacity has been informed from a report prepared on behalf of the DOE by Navigant Consulting and entitled “U.S. Offshore Wind Manufacturing and Supply Chain Development” [2]. This cumulative potential has been developed into discrete projects, with projects characteristics informed by the technology trends also described in [2]. Following the identification of representative regional ports, GL GH utilized the Port Assessment Tool to undertake a gap analysis for each year within the period 2014-2030, considering the number of discrete ports installed in the respective year. The gap analysis provided the total number of gaps to be mitigated for the respective port, as well as costs to remedy these. This investment cost was taken forward, with the respective port’s tariff information, to provide an overview of the year-on-year investment needed and expected revenue for each port. This allowed the cost and
Garrad Hassan America, Inc. Page 93 of 153

Document No. 700694-USPO-R-03 Assessment of Ports for Offshore Wind Development in the United States Issue: E Final
benefit of any investment in the port, over the 2014-2030 period, to be estimated. A high-level overview of the process is illustrated in Figure 7-2 below.
Figure 7-2: Port Assessment Tool Application Flow Diagram
The assessment methodology described above enables the implications of offshore wind market growth on the individual case study ports to be determined.. In addition, the results indicate the status of current infrastructure in each region, relative to projected offshore wind development. The following sections discuss the above methodology in greater detail.
Inputs: - Port information,
dimensions, facilities
- Port tariff - Market projection
Opportunity Assessment:
- Gap analysis TOOL APPLIED
Cost Benefit Assessment:
- Net revenue
Port Readiness Assessment
Garrad Hassan America, Inc. Page 94 of 153

Document No. 700694-USPO-R-03 Assessment of Ports for Offshore Wind Development in the United States Issue: E Final
8 OPPORTUNITY ASSESSMENT
8.1 Summary of Methodology
GL GH has analyzed the ability of the current port infrastructure in the United States to support offshore wind capacity projected to be installed from 2014 – 2030, under growth scenarios described by a recent DOE report prepared by Navigant Consulting and entitled “U.S. Offshore Wind Manufacturing and Supply Chain Development” [2]. The DOE supply chain report outlines three potential market demand growth scenarios for the U.S. offshore wind industry, considering high, moderate, and low growth of the industry within the United States. For the purpose of this study, GL GH has modeled the ‘moderate growth’ DOE scenario defined in [2] as GW installed capacity by 2030. GL GH considers the high, moderate, and low growth deployment levels put forth in [2] to be scenarios for analysis rather than projections for market development. The actual growth path followed by the industry will depend, among other things, on numerous political, technical, and social factors. Thus the information provided in this report is intended to provide guidance on the port infrastructure needs to meet the moderate growth scenario of 28 GW installed offshore in the United States by 2030. It is not intended to represent GL GH’s or DOE’s projection of market development. The estimated incremental annual capacity for the U.S. offshore wind industry has been subdivided geographically among five regions, namely: North Atlantic, South Atlantic, Gulf of Mexico, Pacific, and Great Lakes. GL GH has split the total modeled capacity for each region into a discrete number of projects per year and assessed the capability of the selected port in each region to undertake the required installation activities for these projects. Figure 8-1 shows the projected cumulative capacity for the U.S. offshore wind industry under the moderate growth scenario, while Figure 8-2 shows the corresponding year-by-year capacity additions per region. The installed capacity in each year corresponds to project commissioning. It is assumed therefore that the project begins construction in the preceding year. The North Atlantic region shows the most significant increase in capacity due to relatively shallow waters, a met-ocean climate that most closely mirrors that of northern Europe, and close proximity to manufacturing facilities as they develop. This region is closely followed by the Pacific, which has been assumed to deploy projects utilizing floating technology. At a slower rate than the North Atlantic and the Pacific regions, the Great Lakes and the Gulf of Mexico see certain development; however, this is inhibited by sea ice and hurricanes, respectively. Under this scenario, the South Atlantic region is the least developed due to the exposure to hurricanes and the challenges they present.
Garrad Hassan America, Inc. Page 95 of 153

Document No. 700694-USPO-R-03 Assessment of Ports for Offshore Wind Development in the United States Issue: E Final
Source: GL GH, Navigant
Figure 8-1: Estimated Cumulative Capacity of U.S. Offshore Wind Industry – Moderate Growth Scenario
Source: GL GH, Navigant
Figure 8-2: Estimated Incremental Capacity per Annum for U.S. Offshore Wind Industry – Moderate Growth Scenario
Garrad Hassan America, Inc. Page 96 of 153

Document No. 700694-USPO-R-03 Assessment of Ports for Offshore Wind Development in the United States Issue: E Final
GL GH subdivided the incremental capacity addition per year into discrete projects using the assumptions made in Section 8.2. The resultant number of projects installed per year and cumulative number of projects are shown in Figure 8-3.
Source: GL GH
Figure 8-3: Estimated Number of Projects and Capacity Installed per Year – Moderate Growth Scenario
In total, under the moderate growth scenario, the following projects and capacities are installed by 2030.
Table 8-1: Cumulative Regional Number of Projects and Project Capacities
Region Total Projects Total Capacity North Atlantic 20 10,000 MW South Atlantic 4 2,000 MW Gulf of Mexico 8 4,000 MW Pacific 16 8,000 MW Great Lakes 8 4,000 MW TOTAL 56 28,000 MW
The results of this analysis are presented in Sections 11.1 and 11.2 below.
Garrad Hassan America, Inc. Page 97 of 153

Document No. 700694-USPO-R-03 Assessment of Ports for Offshore Wind Development in the United States Issue: E Final
8.2 Assumptions
To supplement the market demand projections developed in the DOE supply chain report [2] and in order to be able to evaluate a discrete number of projects per region per annum, GL GH has made a number of assumptions, as outlined in Table 8-2.
Table 8-2: Basic Project Assumptions
Commissioning Year 2016 – 2017 2018 – 2022 2022 – 2030 Distance to Port <160 km (87 Nm) Can be >160 km Can be >160 km Project Capacity ~ 250 MW ~ 500 MW ~ 500 MW Turbine Capacity 4 MW 6 MW 8 MW Water Depth 20 m 30 m 30 m Offshore Substations 1 x 250 MW 1 x 500 MW 1 x 500 MW
The DOE’s supply chain report assumes that 40% of offshore wind components will be manufactured domestically in 2015, with this figure reaching 53% by 2030 [2]. The U.S. onshore wind industry domestically sources 67% of components [2], therefore while WTG capacities remain below 5 MW, it may be possible to source components from inland onshore manufacturers. However, once WTG capacities exceed 5 MW, port-based manufacturing facilities will be necessary as it becomes difficult to transport large components by road. According to [2], a single component plant (e.g. nacelle-manufacturing facility) typically becomes commercially viable when installed capacity exceeds 300 MW/annum. Employing the moderate growth scenario, GL GH assumes that a single component plant will be functioning on the Atlantic coast by 2019, another on the Pacific coast by 2021, and one each located in the Great Lakes and the Gulf of Mexico by 2023. Similarly, full WTG manufacturing facilities are predicted to be feasible once capacity reaches approximately 800 MW/annum; therefore, GL GH predicts that this will be available by 2024 and 2026 on the Atlantic and Pacific coasts, respectively. The domestic or international sourcing of components will affect the definition of ‘port type’, e.g. whether it is a manufacturing or staging facility. GL GH assumes that offshore substations will be sourced from specialist facilities in the near- to mid-term. The following assumptions have been made for the purposes of the assessment presented here;
• It is assumed that a 25% buffer of components will be stored in the port prior to being transported to the offshore wind farm site for installation.
• It is assumed that wherever possible, all foundations and array cables will be stored on barges (floating storage), while standing storage will be used for jackets.
• It is assumed that monopile foundations are used for WTGs of 4 MW capacity and jacket foundations are utilized for WTG capacity greater than 4 MW.
• It is assumed that a given port facility can support activities associated with a maximum of 500 MW of capacity at a given time.
• Array cables are assumed to be installed by vessels equivalent to the Augustea AMT Explorer cable-laying barge.
Garrad Hassan America, Inc. Page 98 of 153

Document No. 700694-USPO-R-03 Assessment of Ports for Offshore Wind Development in the United States Issue: E Final
• In years 2014 – 2015, foundations and WTGs are assumed to be installed by vessels currently capable of operating in U.S. waters, such as the Weeks Marine R. D. MacDonald. Beyond 2016, it is anticipated that a 2nd generation U.S.–flagged WTG installation vessel with specifications similar to the European MPI Adventure will be available for both foundation and WTG installation.
Garrad Hassan America, Inc. Page 99 of 153

Document No. 700694-USPO-R-03 Assessment of Ports for Offshore Wind Development in the United States Issue: E Final
9 COST-BENEFIT PREVIEW
9.1 Overview
The costs and benefits of identified potential investment opportunities has been evaluated, taking into consideration the planned and future offshore wind potential within the respective geographic region. The aim of this analysis was to identify attractive investments, while highlighting potential opportunities for future investment based on projected market growth for the U.S. offshore wind industry. This was done by comparing the total port investment against the total expected financial benefits over 2014-2030 time period. The financial benefits were calculated using docking, storage, and wharfage fees provided by each port. Total fee-based revenue was then calculated assuming 2013 costs and converted to a net present value for the study period. The costs to the port were determined using the methodology described in Section 8 above. The results of this analysis are presented in Section 11.3 below. This analysis compares fee-based revenue with facility improvement costs. Other factors such as taxes and operating expenses are not included. These are left to the port owner to add in order to complete the analysis for that specific facility. 9.2 Assumptions
The assumptions outlined in Section 8.2 have also been used for this analysis for consistency. Some of the further assumptions that were made to carry out this analysis are:
• Barges are used for storing foundations and array cables where floating storage is available.
• It is assumed that all components will be stored for one month.
• No operations and maintenance activities have been taken into account.
• It is assumed that open storage will be used and no handling will be required.
• When the port is used for foundation manufacturing, port storage is assumed to be used for jackets and pin-piles as capturing the cost of rental/ lease of warehouse was not possible.
• Export cables are assumed to go straight to the site from the manufacturer for all port types.
• Further assumptions regarding the capacity of vessels and the time required for various operations have been made on the basis of project size.
Garrad Hassan America, Inc. Page 100 of 153

Document No. 700694-USPO-R-03 Assessment of Ports for Offshore Wind Development in the United States Issue: E Final
10 CASE STUDIES
The methodologies described in the three preceding sections were applied to six ports covering the five coastal regions defined in Section 7. The primary objectives of this analysis were to demonstrate the utility of the Ports Assessment Tool and to make a preliminary assessment of the current state of the infrastructure of U.S. ports in the context of offshore wind readiness. 10.1 Case Study Port Selection
In preparing to conduct a quantitative assessment of port readiness for U.S. ports, GL GH interviewed personnel from multiple ports from each coastal region. The level of interest in supporting offshore wind projects was found to be high and many of the ports interviewed put themselves forward as good candidates for this type of work. This can be considered an encouraging sign that offshore project developers will be able to find suitable partners with which to develop this critical infrastructure. An assessment of all U.S. ports was beyond the scope of this work. Instead GL GH selected 1-2 ports from each of the five coastal regions identified above as facilities representative of that region. The ports selected for assessment are:
• North Atlantic: New Bedford, MA
• North Atlantic: Paulsboro, NJ
• South Atlantic: Morehead City, NC
• Gulf of Mexico: Galveston, TX
• Pacific: Coos, Bay, OR
• Great Lakes: Cleveland, OH Given the high level of projected activity in the North Atlantic region (see Figure 8-1 above), two ports were selected for that region. The results presented for these ports (see Sections 10.3.2 and 10.4.2) are meant to illustrate the requirements if only that port was used for this region. In reality, it is expected that multiple ports will be needed and utilized for this and other regions. The case study ports were chosen from approximately 50 candidate facilities around the country on the basis of a variety of factors, including:
• Geographic region;
• Previous interest/investment in the port for use by the offshore wind industry; and
• Data availability, including port dimensions, tariffs, etc.
NOTE: The selection of these ports is not intended to represent an endorsement of these facilities or constitute a recommendation over other nearby ports. Rather, the results presented below should be interpreted as being representative of the region and an example of the capabilities of that region. Offshore project developers, component manufacturers, and other port users are encouraged to evaluate individual port facilities according to their specific needs.
Garrad Hassan America, Inc. Page 101 of 153
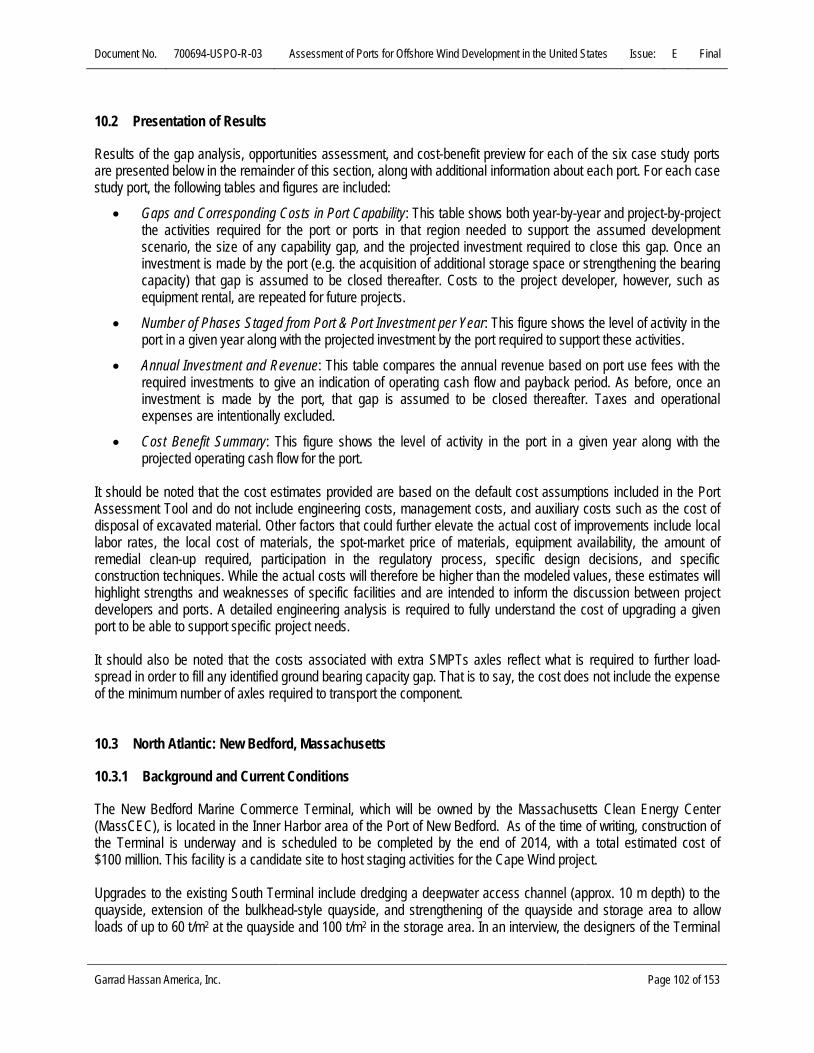
Document No. 700694-USPO-R-03 Assessment of Ports for Offshore Wind Development in the United States Issue: E Final
10.2 Presentation of Results
Results of the gap analysis, opportunities assessment, and cost-benefit preview for each of the six case study ports are presented below in the remainder of this section, along with additional information about each port. For each case study port, the following tables and figures are included:
• Gaps and Corresponding Costs in Port Capability: This table shows both year-by-year and project-by-project the activities required for the port or ports in that region needed to support the assumed development scenario, the size of any capability gap, and the projected investment required to close this gap. Once an investment is made by the port (e.g. the acquisition of additional storage space or strengthening the bearing capacity) that gap is assumed to be closed thereafter. Costs to the project developer, however, such as equipment rental, are repeated for future projects.
• Number of Phases Staged from Port & Port Investment per Year: This figure shows the level of activity in the port in a given year along with the projected investment by the port required to support these activities.
• Annual Investment and Revenue: This table compares the annual revenue based on port use fees with the required investments to give an indication of operating cash flow and payback period. As before, once an investment is made by the port, that gap is assumed to be closed thereafter. Taxes and operational expenses are intentionally excluded.
• Cost Benefit Summary: This figure shows the level of activity in the port in a given year along with the projected operating cash flow for the port.
It should be noted that the cost estimates provided are based on the default cost assumptions included in the Port Assessment Tool and do not include engineering costs, management costs, and auxiliary costs such as the cost of disposal of excavated material. Other factors that could further elevate the actual cost of improvements include local labor rates, the local cost of materials, the spot-market price of materials, equipment availability, the amount of remedial clean-up required, participation in the regulatory process, specific design decisions, and specific construction techniques. While the actual costs will therefore be higher than the modeled values, these estimates will highlight strengths and weaknesses of specific facilities and are intended to inform the discussion between project developers and ports. A detailed engineering analysis is required to fully understand the cost of upgrading a given port to be able to support specific project needs. It should also be noted that the costs associated with extra SMPTs axles reflect what is required to further load-spread in order to fill any identified ground bearing capacity gap. That is to say, the cost does not include the expense of the minimum number of axles required to transport the component. 10.3 North Atlantic: New Bedford, Massachusetts
10.3.1 Background and Current Conditions
The New Bedford Marine Commerce Terminal, which will be owned by the Massachusetts Clean Energy Center (MassCEC), is located in the Inner Harbor area of the Port of New Bedford. As of the time of writing, construction of the Terminal is underway and is scheduled to be completed by the end of 2014, with a total estimated cost of $100 million. This facility is a candidate site to host staging activities for the Cape Wind project. Upgrades to the existing South Terminal include dredging a deepwater access channel (approx. 10 m depth) to the quayside, extension of the bulkhead-style quayside, and strengthening of the quayside and storage area to allow loads of up to 60 t/m2 at the quayside and 100 t/m2 in the storage area. In an interview, the designers of the Terminal
Garrad Hassan America, Inc. Page 102 of 153

Document No. 700694-USPO-R-03 Assessment of Ports for Offshore Wind Development in the United States Issue: E Final
stated that the intent was to enable the use onshore cranes to transport components throughout the facility. Specifically, the quayside and storage area were designed to support a Liebherr LR11350 crane lifting a 500 tonne load at a radius of 30 meters. The storage area is adjacent to the quayside, allowing the heaviest components to be stored near the quayside and transported by crane; lighter components, such as blades, could be stored in a secondary storage location. The designers of the Terminal opted to strengthen the quayside to accommodate the use of large crawler cranes based on their assessment of the unlikely near-term availability of purpose-built turbine installation vessels with onboard cranes. Further, these cranes need to be able to move about on the quayside to complete the loading and unloading without the need to relocate the vessel. Additional layers of aggregate stone were placed on top of the entire storage area to increase its bearing capacity such that these same cranes could move components between the quayside and storage area. The expectation at this facility is that a project developer or installation contractor would lease one or more crane that can load and unload vessels and manage the stored components. The use of SPMTs is also considered but these are not expected to be used exclusively. Table 10-1 below shows the key information for the port of New Bedford, Massachusetts, assuming that the upgrades now underway have been completed.
Table 10-1: Available Port Information – New Bedford, MA 1
Access
Access channel width [m] 33.5 2 Water depth [m] 9.1 Overhead clearance [m] Unrestricted Heavy duty quayside length [m] 304.8
Quaysides Heavy duty quayside area [m2] 68,796 Heavy duty quayside capacity [tonnes/m2] 20 3 Sea bed suitable for jacking-up Yes
Storage
Open storage [m2] 114,323 Ground bearing capacity [tonnes/m2] 20 4 Haul route width [m] 15.2 Haul route capacity [tonnes/m2] 20 4 Floating storage [m2] Not at this time
Fabrication Workshop Area
Workshop available - Workshop length [m] - Workshop area [m2] -
1. These values assume that all planned facility upgrades have been completed. 2. The opening in the hurricane barrier is 45.7 m (150 ft) and a maximum beam of 33.5 m has been assumed. The minimum channel width
requirement of twice the vessel beam was not applied to the hurricane barrier opening. 3. The quayside is designed for 20 t/m2 uniform loads and 60 t/m2 crane track loads. 4. The storage area and integrated haul route are designed for 20 t/m2 uniform loads and 100 t/m2 crane track loads.
Garrad Hassan America, Inc. Page 103 of 153

Document No. 700694-USPO-R-03 Assessment of Ports for Offshore Wind Development in the United States Issue: E Final
Due to missing information, gaps related to fabrication workshop area cannot be calculated. 10.3.2 Results
Opportunity Assessment
Table 10-2 shows the gaps and corresponding costs necessary to meet the moderate growth scenario of 10 GW of offshore wind capacity for the North Atlantic region of the United States (2014 – 2030) – no gaps were identified. The New Bedford Marine Commerce Terminal has been analyzed as one of two sample ports within the region. Table 10-2 outlines the modeled projects per year to attain this level; also included are the assumed foundation and port type, complying with the assumptions from the DOE moderate growth scenario [2]. In addition, the number of ports necessary to support offshore wind development in the region is given so as to assess whether using just the New Bedford Marine Commerce Terminal is sufficient for the estimated market.
Table 10-2: Gaps and Corresponding Costs in Port Capability – Port of New Bedford, MA
YEAR
ANNUAL ACTIVITY PORT GAP
Configuration Capacity (MW)
Foundations Assumptions
No. of
Ports Type Type Size Cost
($‘000s)
2014 62 x 4MW (Phase 1) 250
Monopile, 20m water
depth 1
Staging: Foundations
/Cables
- - -
Port Channel width
13 m (vessel
dependent) - 2
2015 Phase 2 - - 1 Staging: WTGs - - -
2016 83 x 6MW (Phase 1) 500 Jackets, 30m
water depth 1 Staging:
Foundations / Cables
- - -
2017 Phase 2 - - 1 Staging: WTGs - - -
2018 83 x 6MW (Phase 1) 500 Jackets, 30m
water depth 1 Staging:
Foundations / Cables
- - -
2019 Phase 2 - - 1 Staging: WTGs - - -
20193 83 x 6 MW (Phase 1) 500 Jackets, 30m
water depth 1 Foundation Manufacturing - - -
2020 Phase 2 - - 1 Staging: WTGs - - -
20203 124 x 8MW (Phase 1) 2 x 500 Jackets, 30m
water depth 2 Foundation Manufacturing - - -
2021 Phase 2 - - 2 Staging: WTGs - - -
20213 62 x 8MW (Phase 1) 500 Jackets, 30m
water depth 1 Foundation Manufacturing - - -
Garrad Hassan America, Inc. Page 104 of 153

Document No. 700694-USPO-R-03 Assessment of Ports for Offshore Wind Development in the United States Issue: E Final
YEAR ANNUAL ACTIVITY PORT GAP
Configuration Capacity (MW)
Foundations Assumptions
No. of
Ports Type Type Size Cost
($‘000s)
2022 Phase 2 - - 1 Staging: WTGs - - -
20223 62 x 8MW (Phase 1) 500 Jackets, 30m
water depth 2 Foundation Manufacturing - - -
2023 Phase 2 - - 2 Staging: WTGs - - -
20233
124 x 8MW (Phase 1) 2 x 500 Jackets, 30m
water depth 2 Foundation Manufacturing - - -
2024 Phase 2 - - 2 Staging: WTGs - - -
20243
124 x 8MW (Phase 1) 2 x 500 Jackets, 30m
water depth 2 Foundation Manufacturing - - -
2025 Phase 2 - - 2 Staging: WTGs - - -
20253
124 x 8MW (Phase 1) 2 x 500 Jackets, 30m
water depth 2 Foundation Manufacturing - - -
2026 Phase 2 - - 2 WTG Manufacturing - - -
20263
124 x 8MW (Phase 1) 2 x 500 Jackets, 30m
water depth 2 Foundation Manufacturing - - -
2027 Phase 2 - - 2 WTG Manufacturing - - -
20273
124 x 8MW (Phase 1) 2 x 500 Jackets, 30m
water depth 2 Foundation Manufacturing - - -
2028 Phase 2 - - 2 WTG Manufacturing - - -
20283 124 x 8 MW (Phase 1) 2 x 500 Jackets, 30m
water depth 2 Foundation Manufacturing - - -
2029 Phase 2 - - 2 WTG Manufacturing - - -
2030 - - - - - - - - Total Port Authority Investment ($’000s): 0
Total Developer Investment ($’000s): 0 1. Cost on the developer 2. It is assumed that vessels with beams within the channel and access width requirements will be available 3. Additional port(s) used for the next project in the same year
Garrad Hassan America, Inc. Page 105 of 153

Document No. 700694-USPO-R-03 Assessment of Ports for Offshore Wind Development in the United States Issue: E Final
Cost-Benefit Assessment
The summary of all the costs and benefits for the New Bedford Marine Commerce Terminal with the cash flow for each year can be found in Table 10-3 below.
Table 10-3: Annual Investment and Revenue, Port of New Bedford, MA
NEW BEDFORD MARINE COMMERCE TERMINAL
Year Price Escalation Factor
Revenue per Annum[$000's]
Port Investment CapEx [$000's]
Operating Cash flow [$000's]
2014 1.0 438 0 438 2015 1.0 366 0 366 2016 1.0 822 0 822 2017 1.0 733 0 733 2018 1.0 822 0 822 2019 1.0 702 0 702 2020 1.0 733 0 733 2021 1.0 706 0 706 2022 1.0 769 0 769 2023 1.0 769 0 769 2024 1.0 706 0 706 2025 1.0 769 0 769 2026 1.0 669 0 669 2027 1.0 706 0 706 2028 1.0 669 0 669 2029 1.0 669 0 669 2030 1.0 0 0 0
TOTAL ($’000s) 11,048 Figure 10-1 below presents the assumed installed capacity serviced by the Port of New Bedford with the estimated annual operating cash flow, defined here as the port operator’s revenue minus any year-on-year investment costs.
Garrad Hassan America, Inc. Page 106 of 153
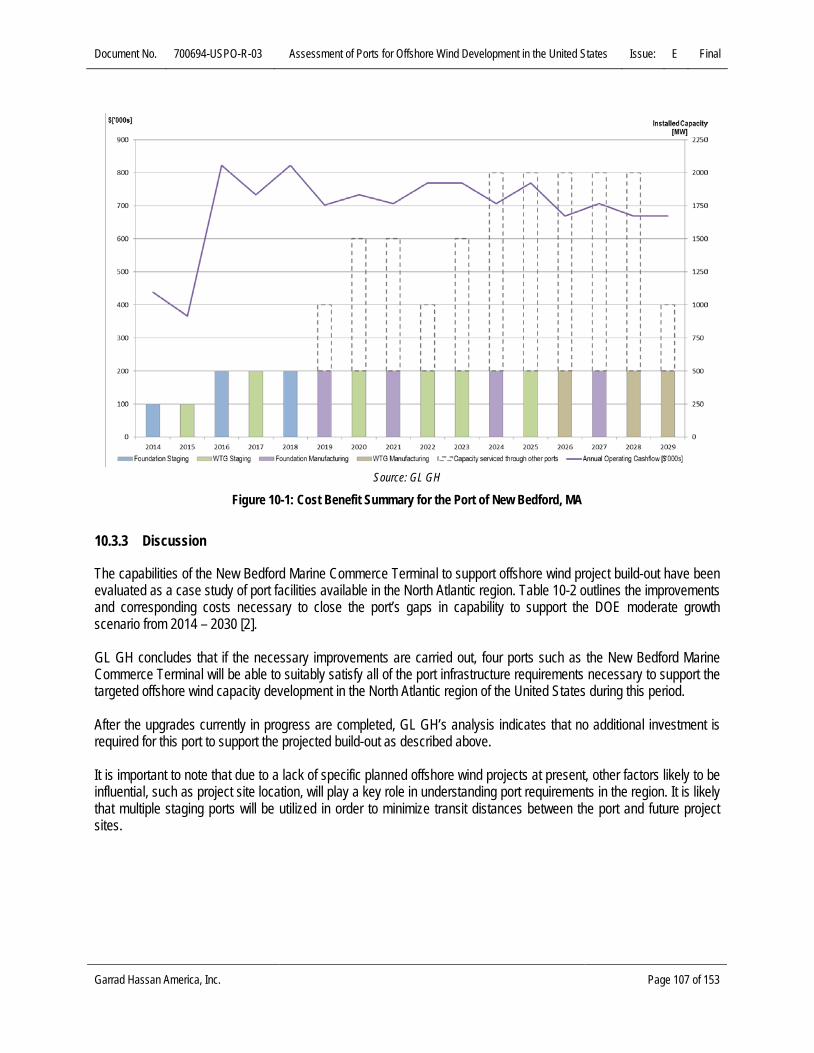
Document No. 700694-USPO-R-03 Assessment of Ports for Offshore Wind Development in the United States Issue: E Final
Source: GL GH
Figure 10-1: Cost Benefit Summary for the Port of New Bedford, MA
10.3.3 Discussion
The capabilities of the New Bedford Marine Commerce Terminal to support offshore wind project build-out have been evaluated as a case study of port facilities available in the North Atlantic region. Table 10-2 outlines the improvements and corresponding costs necessary to close the port’s gaps in capability to support the DOE moderate growth scenario from 2014 – 2030 [2]. GL GH concludes that if the necessary improvements are carried out, four ports such as the New Bedford Marine Commerce Terminal will be able to suitably satisfy all of the port infrastructure requirements necessary to support the targeted offshore wind capacity development in the North Atlantic region of the United States during this period. After the upgrades currently in progress are completed, GL GH’s analysis indicates that no additional investment is required for this port to support the projected build-out as described above. It is important to note that due to a lack of specific planned offshore wind projects at present, other factors likely to be influential, such as project site location, will play a key role in understanding port requirements in the region. It is likely that multiple staging ports will be utilized in order to minimize transit distances between the port and future project sites.
Garrad Hassan America, Inc. Page 107 of 153

Document No. 700694-USPO-R-03 Assessment of Ports for Offshore Wind Development in the United States Issue: E Final
10.4 North Atlantic: Paulsboro, New Jersey
10.4.1 Background and Current Conditions
The Paulsboro Marine Terminal, also referred to as the Port of Paulsboro, is under construction on a 0.5 km2 (130 acres) area that once housed a BP oil terminal and a Dow Chemical plant. The new facility will contain 2 ship berths and is designed primarily to handle break-bulk cargo, although the port owners have also expressed an interest in attracting offshore wind projects or component manufacturers to the port. The state of New Jersey has provided $200 million to construct the new facility. In designing the facility, the port owners have opted to reduce construction costs low by building the quayside for a 7.3 t/m2 bearing capacity with the expectation that additional load-spreading techniques would be used to allow the lifting and transportation of components. The storage area has an estimated bearing capacity of 24 t/m2. Table 10-4 shows the key information for the Port of Paulsboro, New Jersey, assuming that the upgrades now underway have been completed.
Table 10-4: Available Port Information – Port of Paulsboro, NJ 1
Access
Access channel width [m] 265 Water depth [m] 13.2 Overhead clearance [m] 53 Heavy duty quayside length [m] 330
Quaysides Heavy duty quayside area [m2] 16,700 Heavy duty quayside capacity [tonnes/m2] 7.3 Sea bed suitable for jacking-up Yes
Storage
Open storage [m2] 400,000 Ground bearing capacity [tonnes/m2] 24 Haul route width [m] 240 Haul route capacity [tonnes/m2] 24 Floating storage [m2] 37,000
Fabrication Workshop Area
Workshop available - Workshop length [m] - Workshop area [m2] -
1. These values assume that all planned facility upgrades have been completed. Fabrication workshops have not been built at this facility, and thus gaps related to fabrication workshop area cannot be calculated at this time.
Garrad Hassan America, Inc. Page 108 of 153

Document No. 700694-USPO-R-03 Assessment of Ports for Offshore Wind Development in the United States Issue: E Final
10.4.2 Results
Opportunity Assessment
Table 10-5 below shows the gaps and corresponding costs necessary to meet the moderate growth scenario of 10 GW of offshore wind capacity for the North Atlantic region of the United States (2014 – 2030). The Port of Paulsboro, New Jersey has also been analyzed as a sample port within the region. Table 10-5 outlines the modeled projects per year to meet this level; also included are the assumed foundation and port type, complying with the assumptions from the DOE moderate growth scenario [2]. The resultant gaps in port capability are stated along with the corresponding cost necessary to close the gap. In addition, the number of ports necessary to support offshore wind development in the region is given so as to assess whether using just the Port of Paulsboro is sufficient for the estimated market. The improvements needed at the Port of Paulsboro in order to meet the designated build-out scenario are minimal. They relate to increasing the soil bearing capacity at the quayside. Most of the costs identified in the table below are assumed to be costs to be borne by the offshore wind project developer. During the interview with the Port of Paulsboro conducted for this study, the port recognized that the bearing capacities of the quayside was less than the typical minimum value of 10 t/m2 recommended by GL GH. The port explained that this had been a conscious decision and that load spreading devices would be used to reduce component loads to within acceptable limits. GL GH accepts this explanation.
Table 10-5: Gaps and Corresponding Costs in Port Capability – Port of Paulsboro, NJ
YEAR ANNUAL ACTIVITY PORT GAP
Configuration Capacity (MW)
Foundations Assumptions
No. of
Ports Type Type Size Cost
($‘000s)
2014 62 x 4MW (Phase 1) 250
Monopile, 20m water
depth 1
Staging: Foundations
/Cables
Large area for storage
12,500 sqm 4,4201
Port overhead clearance
56 m (vessel
dependent) -
2015 Phase 2 - - 1 Staging: WTGs
Quayside bearing
pressure capacity
2.7 t/sqm 440
Extra SPMT axles for load
spreading 3 5101
2016 83 x 6MW (Phase 1) 500 Jackets, 30m
water depth 1 Staging:
Foundations / Cables
Large area for storage
30,000 sqm 10,6001
2017 Phase 2 - - 1 Staging: WTGs
Extra SPMT axles for load
spreading 6 1,0101
2018
83 x 6MW (Phase 1) 500 Jackets, 30m
water depth 1 Foundation Manufacturing
Large area for storage
30,000 sqm 10,6001
Garrad Hassan America, Inc. Page 109 of 153

Document No. 700694-USPO-R-03 Assessment of Ports for Offshore Wind Development in the United States Issue: E Final
YEAR ANNUAL ACTIVITY PORT GAP
Configuration Capacity (MW)
Foundations Assumptions
No. of
Ports Type Type Size Cost
($‘000s)
2019 Phase 2 - - 1 Staging: WTGs
Extra SPMT axles for load
spreading 6 1,0101
20192
83 x 6MW (Phase 1) 500 Jackets, 30m
water depth 1 Foundation Manufacturing
Extra SPMT axles for load
spreading 8 1,3401
2020 Phase 2 - - 1 Staging: WTGs
Extra SPMT axles for load
spreading 6 1,0101
20202 124 x 8MW (Phase 1) 2 x 500 Jackets, 30m
water depth 2 Foundation Manufacturing
Extra SPMT axles for load
spreading 9 3,0201
2021 Phase 2 - - 2 Staging: WTGs
Extra SPMT axles for load
spreading 6 2,0201
20212 62 x 8MW (Phase 1) 500 Jackets, 30m
water depth 1 Foundation Manufacturing
Extra SPMT axles for load
spreading 9 1,5101
2022 Phase 2 - - 1 Staging: WTGs
Extra SPMT axles for load
spreading 6 1,0101
20222 62 x 8MW (Phase 1) 500 Jackets, 30m
water depth 1 Foundation Manufacturing
Extra SPMT axles for load
spreading 9 1,5101
2023 Phase 2 - - 1 Staging: WTGs
Extra SPMT axles for load
spreading 6 1,0101
20232 124 x 8MW (Phase 1) 2 x 500 Jackets, 30m
water depth 2 Foundation Manufacturing
Extra SPMT axles for load
spreading 9 3,0201
2024 Phase 2 - - 2 Staging: WTGs
Extra SPMT axles for load
spreading 6 2,0201
20242 124 x 8MW (Phase 1) 2 x 500 Jackets, 30m
water depth 2 Foundation Manufacturing
Extra SPMT axles for load
spreading 9 30201
2025 Phase 2 - - 2 Staging: WTGs
Extra SPMT axles for load
spreading 6 2,0201
20252 124 x 8MW (Phase 1) 2 x 500 Jackets, 30m
water depth 2 Foundation Manufacturing
Extra SPMT axles for load
spreading 9 3,0201
2026 Phase 2 - - 2 WTG Manufacturing
Extra SPMT axles for load
spreading 6 2,0201
20262 124 x 8MW (Phase 1) 2 x 500 Jackets, 30m
water depth 2 Foundation Manufacturing
Extra SPMT axles for load
spreading 9 3,0201
Garrad Hassan America, Inc. Page 110 of 153

Document No. 700694-USPO-R-03 Assessment of Ports for Offshore Wind Development in the United States Issue: E Final
YEAR ANNUAL ACTIVITY PORT GAP
Configuration Capacity (MW)
Foundations Assumptions
No. of
Ports Type Type Size Cost
($‘000s)
2027 Phase 2 - - 2 WTG Manufacturing
Extra SPMT axles for load
spreading 6 2,0201
20272 124 x 8MW (Phase 1) 2 x 500 Jackets, 30m
water depth 2 Foundation Manufacturing
Extra SPMT axles for load
spreading 9 3,0201
2028 Phase 2 - - 2 WTG Manufacturing
Extra SPMT axles for load
spreading 6 2,0201
20282 124 x 8MW (Phase 1) 2 x 500 Jackets, 30m
water depth 2 Foundation Manufacturing
Extra SPMT axles for load
spreading 9 3,0201
2029 Phase 2 - - 2 WTG Manufacturing
Extra SPMT axles for load
spreading 6 2,0201
2030 - - - - - - - -
Total Port Authority Investment ($,000): 440
Total Developer Investment ($’000s): 70,820 1Cost on the developer 2Additional port(s) used for the next project in the same year Cost-Benefit Assessment
The summary of all the costs and benefits for the Port of Paulsboro with the cash flow for each year is presented in Table 10-6 below.
Garrad Hassan America, Inc. Page 111 of 153

Document No. 700694-USPO-R-03 Assessment of Ports for Offshore Wind Development in the United States Issue: E Final
Table 10-6: Annual Investment and Revenue, Port of Paulsboro, NJ
PORT OF PAULSBORO
Year Price Escalation Factor
Revenue per Annum[$000's]
Port Investment CapEx [$000's]
Operating Cash flow [$000's]
2014 1.0 950 440 510 2015 1.0 363 0 363 2016 1.0 1,362 0 1,362 2017 1.0 707 0 707 2018 1.0 1,362 0 1,362 2019 1.0 1,167 0 1,167 2020 1.0 707 0 707 2021 1.0 1,362 0 1,362 2022 1.0 1,167 0 1,167 2023 1.0 707 0 707 2024 1.0 985 0 985 2025 1.0 669 0 669 2026 1.0 669 0 669 2027 1.0 985 0 985 2028 1.0 985 0 985 2029 1.0 547 0 547 2030 1.0 547 0 547
TOTAL ($’000s) 14,801 Figure 10-2 below presents the assumed installed capacity serviced by the Port of New Bedford with the estimated annual operating cash flow, defined here as the port operator’s revenue minus any year-on-year investment costs.
Garrad Hassan America, Inc. Page 112 of 153
Document No. 700694-USPO-R-03 Assessment of Ports for Offshore Wind Development in the United States Issue: E Final
Source: GL GH
Figure 10-2: Cost Benefit Summary for the Port of Paulsboro, NJ
10.4.3 Discussion
The capabilities of the Port of Paulsboro, New Jersey to support offshore wind project build-out have been evaluated as a case study of port facilities available in the North Atlantic region. Table 10-5 outlines the improvements and corresponding costs necessary to close the port’s gaps in capability to support the DOE moderate growth scenario from 2014 – 2030 [2]. Work at Paulsboro is already under way to improve facilities in preparation for the offshore wind development likely to take place in the North Atlantic region. GL GH concludes that if the necessary improvements are carried out, the peak construction period will require that four ports such as Paulsboro be able to suitably satisfy all of the port infrastructure requirements necessary to support the targeted offshore wind capacity development in the North Atlantic region of the United States during this period. It is important to note that due to a lack of specific planned offshore wind projects at present, other factors likely to be influential, such as project site location, will play a key role in understanding port requirements in the region. It is likely that multiple staging ports will be utilized in order to minimize transit distances between the port and future project sites.
Garrad Hassan America, Inc. Page 113 of 153

Document No. 700694-USPO-R-03 Assessment of Ports for Offshore Wind Development in the United States Issue: E Final
10.5 South Atlantic: Morehead City, North Carolina
10.5.1 Background and Current Conditions
The Port of Morehead City has commissioned studies on offshore wind and the port requirements to support these projects. The facility, which offers deep-water access and close proximity to the open ocean, currently handles break-bulk and bulk cargo but is considered to be under-utilized. The port owners are looking at offshore wind as a potential new source of revenue and jobs. Table 10-7 below shows the key information for the Port of Morehead City, North Carolina.
Table 10-7: Available Port Information – Morehead City, NC
Access
Access channel width [m] 411 Water depth [m] 13.7 Overhead clearance [m] Unrestricted Heavy duty quayside length [m] 1,188
Quaysides Heavy duty quayside area [m2] 40,469 Heavy duty quayside capacity [tonnes/m2] 12.7 Sea bed suitable for jacking-up Yes
Storage
Open storage [m2] 161,800 Ground bearing capacity [tonnes/m2] 17.09 Haul route width [m] 152 Haul route capacity [tonnes/m2] 3.9 Floating storage [m2] 27,870
Fabrication Workshop Area
Workshop available No Workshop length [m] - Workshop area [m2] -
10.5.2 Results
Opportunity Assessment
Table 10-8 below shows the gaps and corresponding costs necessary to meet the moderate growth scenario of 2 GW of offshore wind capacity for the South Atlantic region of the United States (2014 – 2030). The Port of Morehead City, North Carolina has been analyzed as the sample port within the region. Table 10-8 outlines the modeled projects per year to meet this level; also included are the assumed foundation and port type, complying with the assumptions from the DOE moderate growth scenario [2].
Garrad Hassan America, Inc. Page 114 of 153

Document No. 700694-USPO-R-03 Assessment of Ports for Offshore Wind Development in the United States Issue: E Final
The resultant gaps in port capability are stated along with the corresponding cost necessary to close the gap. In addition, the number of ports necessary to support offshore wind development in the region is given so as to assess whether using just the Port of Morehead City is sufficient for the estimated market. The improvements needed at the Port of Morehead City, NC in order to meet the designated build-out scenario are minimal. They relate to increasing the soil bearing capacity of the haul route. Most of the costs identified in the table below are assumed to be costs to be borne by the offshore wind project developer.
Table 10-8: Gaps and Corresponding Costs in Port Capability – Port of Morehead City, NC
YEAR ANNUAL ACTIVITY PORT GAP
Configuration Capacity (MW)
Foundations Assumptions
No. of Ports Type Type Size Cost
($‘000s)
2014 - - - - - - - -
2015 - - - - - - - -
2016 - - - - - - - -
2017 - - - - - - - -
2018 - - - - - - - -
2019 - - - - - - - -
2020
62 x 8MW (Phase 1) 500 Jackets, 30m
water depth 1 Staging:
Foundations / Cables
Large area for storage 27,500 sqm 9,7201
2021 Phase 2 - - 1 Staging: WTGs
Extra SPMT axles for load spreading 6 1,0101
Storage area bearing pressure (load spreading)
0.3 t/sqm 101
Haul route bearing pressure capacity 6.1 t/sqm 150
2022 - - - - - - - -
2023 62 x 8MW (Phase 1) 500 Jackets, 30m
water depth 1 Staging:
Foundations / Cables
Large area for storage 27,500 sqm 9,7201
2024 Phase 2 - - 1 Staging: WTGs
Extra SPMT axles for load spreading 6 1,0101
Storage area bearing pressure (load spreading)
0.3 t/sqm 101
2025 - - - - - - - -
Garrad Hassan America, Inc. Page 115 of 153

Document No. 700694-USPO-R-03 Assessment of Ports for Offshore Wind Development in the United States Issue: E Final
YEAR ANNUAL ACTIVITY PORT GAP
Configuration Capacity (MW)
Foundations Assumptions
No. of Ports Type Type Size Cost
($‘000s)
2026 62 x 8MW (Phase 1) 500 Jackets, 30m
water depth 1 Staging:
Foundations / Cables
Large area for storage 27,500 sqm 9,7201
2027 Phase 2 - - 1 Staging: WTGs
Extra SPMT axles for load spreading 6 1,0101
Storage area bearing pressure (load spreading)
0.3 t/sqm 101
2028 62 x 8MW (Phase 1) 500 Jackets, 30m
water depth 1 Staging:
Foundations / Cables
Large area for storage
27,500 sqm 9,7201
2029 Phase 2 - - 1 Staging: WTGs
Extra SPMT axles for load spreading 6 1,0101
Storage area bearing pressure (load spreading)
0.3 t/sqm 101
Total Port Authority Investment ($,000): 150
Total Developer Investment ($’000s): 42,960 1Cost on the developer Cost-Benefit Assessment
The summary of all the costs and benefits for the Port of Morehead City with the cash flow for each year is presented in Table 10-9 below.
Garrad Hassan America, Inc. Page 116 of 153

Document No. 700694-USPO-R-03 Assessment of Ports for Offshore Wind Development in the United States Issue: E Final
Table 10-9: Summary of Cost Benefit Analysis – Morehead City, NC
PORT OF MOREHEAD CITY
Year Price Escalation Factor
Revenue per Annum[$000's]
Port Investment CapEx [$000's]
Operating Cash flow [$000's]
2014 0.0 0 0 0 2015 0.0 0 0 0 2016 0.0 0 0 0 2017 0.0 0 0 0 2018 0.0 0 0 0 2019 0.0 0 0 0 2020 1.0 972 150 822 2021 1.0 1,077 0 1,077 2022 1.0 0 0 0 2023 1.0 972 0 972 2024 1.0 1,077 0 1,077 2025 1.0 0 0 0 2026 1.0 972 0 972 2027 1.0 1,077 0 1,077 2028 1.0 972 0 972 2029 1.0 1,077 0 1,077 2030 1.0 0 0 0
TOTAL ($’000s) 8,046 Figure 10-3 below presents the assumed installed capacity serviced by the Port of Morehead City with the estimated annual operating cash flow, defined here as the port operator’s revenue minus any year-on-year investment costs.
Garrad Hassan America, Inc. Page 117 of 153

Document No. 700694-USPO-R-03 Assessment of Ports for Offshore Wind Development in the United States Issue: E Final
Source: GL GH
Figure 10-3: Cost Benefit Summary for Port of Morehead City, NC
10.5.3 Discussion
The capabilities of the Port of Morehead City, North Carolina to support offshore wind project build-out have been evaluated as a case study of port facilities available in the South Atlantic region. Table 10-16 outlines the improvements and corresponding costs necessary to close the port’s gaps in capability to support the DOE moderate growth scenario from 2014 – 2030 [2]. GL GH concludes that if the necessary improvements are carried out, one port such as Morehead City will be able to suitably satisfy all of the port infrastructure requirements necessary to support the targeted offshore wind capacity development in the South Atlantic region of the United States during this period. It is important to note that due to a lack of specific planned offshore wind projects in the region at present, other factors likely to be influential, such as project site location, will play a key role in determining port requirements in the region. It is anticipated that multiple staging ports will be utilized in order to minimize transit distances between the port and future project sites. 10.6 Gulf of Mexico: Galveston, Texas
10.6.1 Background and Current Conditions
Table 10-10 below shows the key information for the Port of Galveston, Texas.
Garrad Hassan America, Inc. Page 118 of 153
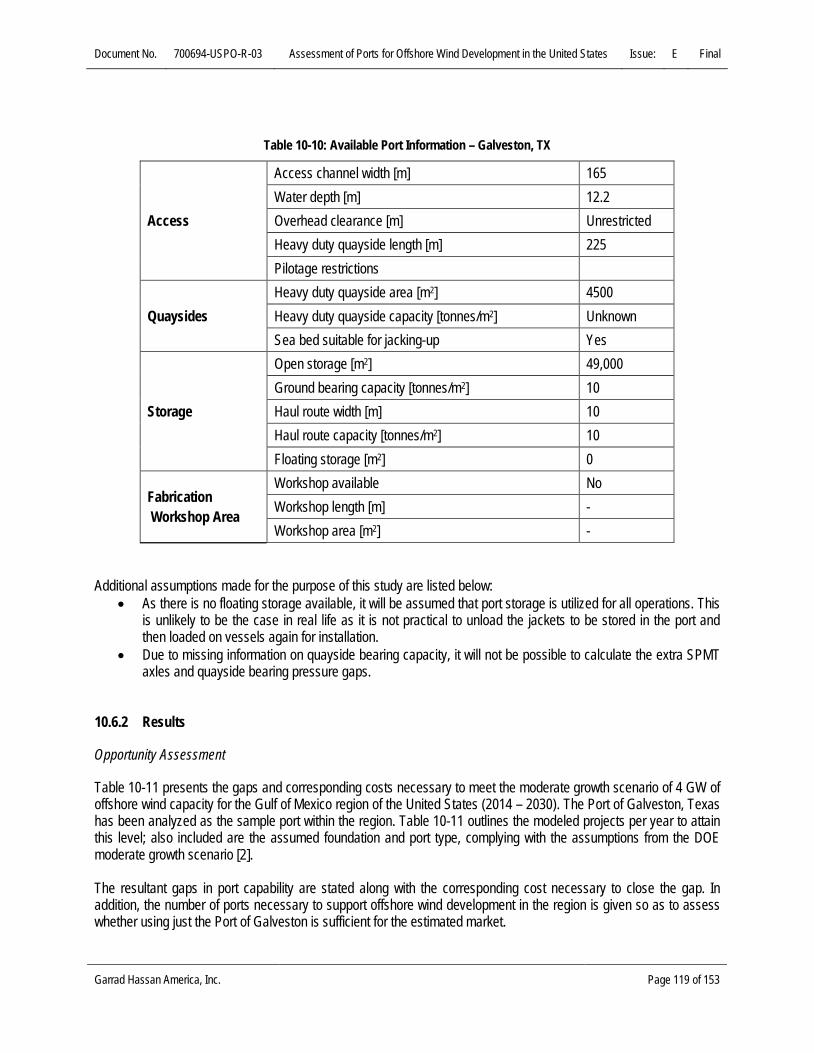
Document No. 700694-USPO-R-03 Assessment of Ports for Offshore Wind Development in the United States Issue: E Final
Table 10-10: Available Port Information – Galveston, TX
Access
Access channel width [m] 165 Water depth [m] 12.2 Overhead clearance [m] Unrestricted Heavy duty quayside length [m] 225 Pilotage restrictions
Quaysides Heavy duty quayside area [m2] 4500 Heavy duty quayside capacity [tonnes/m2] Unknown Sea bed suitable for jacking-up Yes
Storage
Open storage [m2] 49,000 Ground bearing capacity [tonnes/m2] 10 Haul route width [m] 10 Haul route capacity [tonnes/m2] 10 Floating storage [m2] 0
Fabrication Workshop Area
Workshop available No Workshop length [m] - Workshop area [m2] -
Additional assumptions made for the purpose of this study are listed below:
• As there is no floating storage available, it will be assumed that port storage is utilized for all operations. This is unlikely to be the case in real life as it is not practical to unload the jackets to be stored in the port and then loaded on vessels again for installation.
• Due to missing information on quayside bearing capacity, it will not be possible to calculate the extra SPMT axles and quayside bearing pressure gaps.
10.6.2 Results
Opportunity Assessment
Table 10-11 presents the gaps and corresponding costs necessary to meet the moderate growth scenario of 4 GW of offshore wind capacity for the Gulf of Mexico region of the United States (2014 – 2030). The Port of Galveston, Texas has been analyzed as the sample port within the region. Table 10-11 outlines the modeled projects per year to attain this level; also included are the assumed foundation and port type, complying with the assumptions from the DOE moderate growth scenario [2]. The resultant gaps in port capability are stated along with the corresponding cost necessary to close the gap. In addition, the number of ports necessary to support offshore wind development in the region is given so as to assess whether using just the Port of Galveston is sufficient for the estimated market.
Garrad Hassan America, Inc. Page 119 of 153

Document No. 700694-USPO-R-03 Assessment of Ports for Offshore Wind Development in the United States Issue: E Final
The improvements needed at the Port of Galveston, TX in order to meet the designated build-out scenario are significant. They relate to increasing the areas available for turbine storage and jacket storage at the quayside, as well as increasing the width of the haul route. The remaining costs identified in the table below are assumed to be costs to be borne by the offshore wind project developer.
Table 10-11: Gaps and Corresponding Costs in Port Capability – Port of Galveston, TX
YEAR ANNUAL ACTIVITY PORT GAP
Configuration Capacity (MW)
Foundations Assumptions
No. of
Ports Type Type Size Cost
($‘000s)
2014 - - - - - - - -
2015 - - - - - - - -
2016 - - - - - - - -
2017 - - - - - - - -
2018 83 x 6MW (Phase 1) 500 Jackets, 30m
water depth 1 Staging:
Foundations / Cables
Quayside area for load out 250 sqm 310
Haul route width 10.3 m 190
Storage area bearing pressure (load spreading)
1.3 t/sqm 201
2019 Phase 2 - - 1 Staging: WTGs
Storage area bearing pressure (load spreading)
5.1 t/sqm 501
2020 - - - - - - - -
2021 62 x 8MW (Phase 1) 500 Jackets, 30m
water depth 1 Staging:
Foundations / Cables
Quayside area for load out 900 sqm 1,100
Haul route width 0.7 m 20
Load spreading 4.3 t/sqm 501
2022 Phase 2 - - 1 Staging: WTGs Load spreading 7.4 t/sqm 401
2023 124 x 8MW (Phase 1) 2 x 500 Jackets, 30m
water depth 2 Foundation Manufacturing
Storage area bearing pressure (load spreading)
4.3 t/sqm 1001
2024 Phase 2 - - 2 Staging: WTGs
Storage area bearing pressure (load spreading)
7.4 t/sqm 701
2025 62 x 8MW (Phase 1) 500 Jackets, 30m
water depth 1 Foundation Manufacturing
Storage area bearing pressure (load spreading)
4.3 t/sqm 501
Garrad Hassan America, Inc. Page 120 of 153

Document No. 700694-USPO-R-03 Assessment of Ports for Offshore Wind Development in the United States Issue: E Final
YEAR ANNUAL ACTIVITY PORT GAP
Configuration Capacity (MW)
Foundations Assumptions
No. of
Ports Type Type Size Cost
($‘000s)
2026 Phase 2 - - 1 Staging: WTGs
Storage area bearing pressure (load spreading)
7.4 t/sqm 401
2027 124 x 8MW (Phase 1) 2 x 500 Jackets, 30m
water depth 2 Foundation Manufacturing
Storage area bearing pressure (load spreading)
4.3 t/sqm 1001
2028 Phase 2 - - 2 Staging: WTGs
Storage area bearing pressure (load spreading)
7.4 t/sqm 801
20282 62 x 8MW (Phase 1) 500 Jackets, 30m
water depth 1 Foundation Manufacturing
Storage area bearing pressure (load spreading)
4.3 t/sqm 501
2029 Phase 2 - - 1 Staging: WTGs
Storage area bearing pressure (load spreading)
7.4 t/sqm 401
2030 - - - - - - - -
Total Port Authority Investment ($’000s): 1,620
Total Developer Investment ($’000s): 700 1Cost on the developer 2 Additional port(s) used for the next project in the same year Note that due to the missing information, it was not be possible to calculate the extra SPMT axles and quayside bearing pressure gaps in the table above. Cost-Benefit Assessment
The summary of all the costs and benefits for the Port of Galveston with the cash flow for each year is presented in Table 10-12 below.
Garrad Hassan America, Inc. Page 121 of 153

Document No. 700694-USPO-R-03 Assessment of Ports for Offshore Wind Development in the United States Issue: E Final
Table 10-12: Summary of Cost Benefit Analysis – Galveston, TX
PORT OF GALVESTON
Year Price Escalation Factor
Revenue per Annum[$000's]
Port Investment CapEx [$000's]
Operating Cash flow [$000's]
2014 0.0 0 0 0 2015 0.0 0 0 0 2016 0.0 0 0 0 2017 0.0 0 500 -500 2018 1.0 1,748 0 1748 2019 1.0 899 0 899 2020 1.0 0 1,120 -1,120 2021 1.0 1,406 0 1,406 2022 1.0 687 0 687 2023 1.0 477 0 477 2024 1.0 687 0 687 2025 1.0 477 0 477 2026 1.0 687 0 687 2027 1.0 487 0 487 2028 1.0 687 0 687 2029 1.0 687 0 687 2030 1.0 0 0 0
TOTAL ($’000s) 7,299 Figure 10-4 below presents the assumed installed capacity serviced by the Port of Galveston with the estimated annual operating cash flow, defined here as the port operator’s revenue minus any year-on-year investment costs.
Garrad Hassan America, Inc. Page 122 of 153

Document No. 700694-USPO-R-03 Assessment of Ports for Offshore Wind Development in the United States Issue: E Final
Source: GL GH
Figure 10-4: Cost Benefit Summary for Port of Galveston, TX
10.6.3 Discussion
The capabilities of the Port of Galveston, Texas to support offshore wind project build-out have been evaluated as a case study of port facilities available in the Gulf of Mexico region. Table 10-11 outlines the improvements and corresponding costs necessary to close the port’s gaps in capability to support the DOE moderate growth scenario from 2014 – 2030 [2]. GL GH concludes that if the necessary improvements are carried out, three ports such as the Port of Galveston will be able to suitably satisfy all of the port infrastructure requirements necessary to support the targeted offshore wind capacity development in the Gulf of Mexico region of the United States during this period. The required improvement cost for the Port of Galveston is projected to be approximately $6.4M for an estimated net profit of $1.6M, assuming 2013 prices. In order to carry out this analysis, port storage was assumed for all operations, as there is no floating storage available. This option is not practical for jacket foundations and it is expected that multiple staging ports will have to be used to address storage needs, or alternative floating storage areas used. It is important to note that due to a lack of specific planned offshore wind projects in the region at present, other factors likely to be influential, such as project site location, will play a key role in determining port requirements in the region. It is anticipated that multiple staging ports will ultimately be utilized in order to minimize transit distances between the port and future project sites.
Garrad Hassan America, Inc. Page 123 of 153

Document No. 700694-USPO-R-03 Assessment of Ports for Offshore Wind Development in the United States Issue: E Final
10.7 Pacific: Coos Bay, Oregon
10.7.1 Background and Current Conditions
The Port of Coos Bay is currently in discussion with Principle Power, the developer of a floating offshore wind foundation and a recipient of U.S. DOE funding for its offshore wind demonstration project off of Coos Bay, Oregon. No terminal yet exists that is capable of supporting offshore wind projects at the port, although the port and Principle Power have developed designs for the deployment of that floating technology. In order to model this port for the purposes of this study, information from the Port of Coos Bay and the nearby deepwater Roseburg Shipping Terminal was utilized. Table 10-13 below shows the key information for the Roseburg Shipping Terminal, Port of Coos Bay, Oregon.
Table 10-13: Available Port Information – Roseburg Shipping Terminal, Coos Bay, OR
Access
Access channel width (m) 91.4 Water Depth (m) 11.3 Overhead Clearance (m) - Heavy Duty Quayside Length (m) 79.2
Quaysides Heavy Duty Quayside Area (m2) 800 Heavy Duty Quayside Capacity (tonne/m2) 4.88 Seabed suitable for jacking-up No
Storage
Open Storage (m2) 708,200 Ground Bearing Capacity (tonne/m2) 4.88 Haul Route Width (m) Unrestricted Haul route Capacity (tonne/m2) 9.98 Floating Storage (m2) 0 1
Fabrication Workshop Area
Workshop available - Workshop Length (m) - Workshop Area (m2) 18,615
1. As there is no floating storage available, it will be assumed that port storage is utilized for all operations. This is unlikely to be the case in actuality as it is not considered practical to unload jacket foundations to be stored in the port and then reloaded on vessels for installation.
10.7.1 Results
Opportunity Assessment
Table 10-14 below shows the gaps and corresponding costs necessary to meet the moderate growth scenario of 8 GW of offshore wind capacity for the Pacific region of the United States (2014 – 2030). The Port of Coos Bay, OR has been analyzed as the sample port within the region.
Garrad Hassan America, Inc. Page 124 of 153

Document No. 700694-USPO-R-03 Assessment of Ports for Offshore Wind Development in the United States Issue: E Final
Table 10-14 outlines the modeled projects per year to attain this level; also included are the assumed foundation and port type, complying with the assumptions from the DOE moderate growth scenario [2]. The resultant gaps in port capability are stated along with the corresponding cost necessary to close the gap. In addition, the number of ports necessary to support offshore wind development in the region is given so as to assess whether just using a facility such as the Roseburg Shipping Terminal is sufficient for the estimated market.
Table 10-14: Gaps and Corresponding Costs in Port Capability – Roseburg Shipping Terminal, Coos Bay, OR
YEAR ANNUAL ACTIVITY PORT GAP
Configuration Capacity (MW)
Foundations Assumptions
No. of
Ports Type Type Size Cost
($‘000s)
2014 - - - - - - - - 2015 - - - - - - - - 2016 - - - - - - - - 2017 - - - - - - - -
2018 83 x 6MW (Phase 1) 500
Jackets, 40m water
depth 1
Staging: Foundations /
Cables
Quayside area for load out
4,050 sqm 4,940
Quayside bearing pressure 5.1 t/sqm 610
Seabed suitable for jacking up - 6,490
Haul route bearing pressure 0.2 t/sqm 10
Extra SPMT axles for load spreading 9 1,5101
Storage area bearing pressure (load spreading)
1.8 t/sqm 40*
Storage area bearing pressure
increase 5.1 t/sqm 2,740
2019 Phase 2 - - 1 Staging: WTGs
Quayside length for vessel 12.2 m 150
Extra SPMT axles for load spreading 6 1,0101
Storage area bearing pressure (load spreading)
5.1 t/sqm 501
2020 62 x 8MW (Phase 1) 500
Jackets, 40m water
depth 1
Staging: Foundations /
Cables
Quayside area for load out 900 sqm 1,100
Extra SPMT axles for load spreading 11 1,8401
Storage area bearing pressure (load spreading)
4.3 t/ sqm 701
Garrad Hassan America, Inc. Page 125 of 153
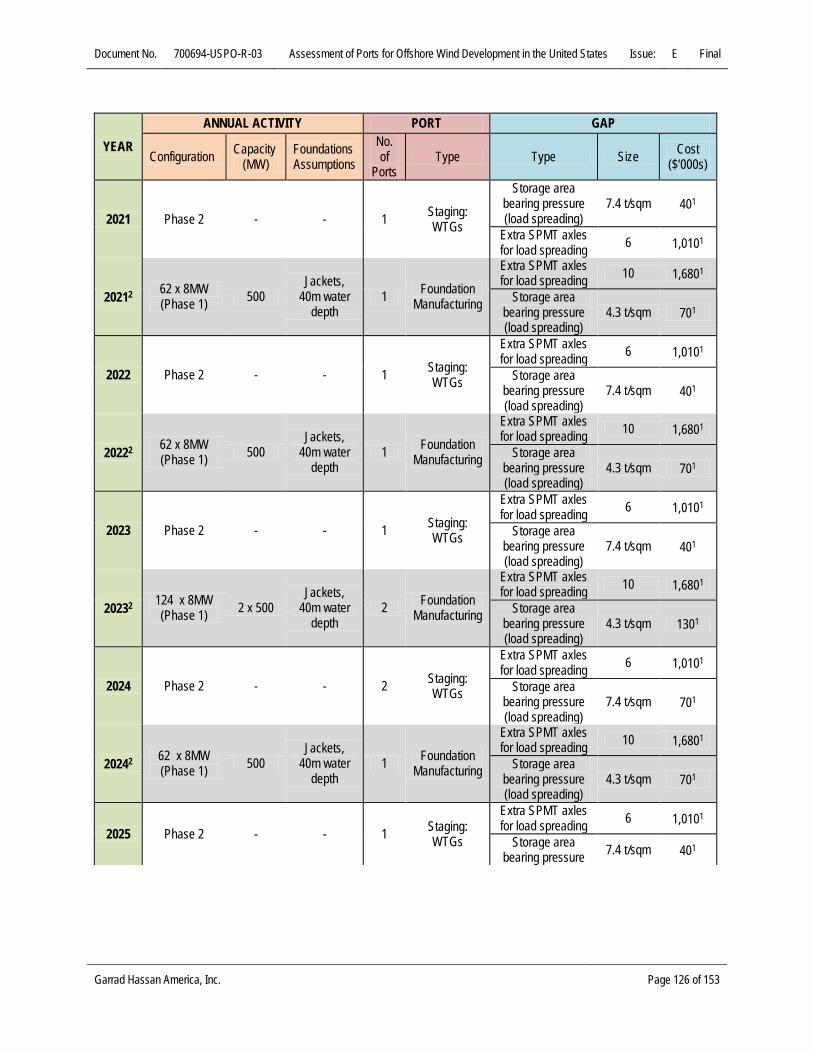
Document No. 700694-USPO-R-03 Assessment of Ports for Offshore Wind Development in the United States Issue: E Final
YEAR
ANNUAL ACTIVITY PORT GAP
Configuration Capacity (MW)
Foundations Assumptions
No. of
Ports Type Type Size Cost
($‘000s)
2021 Phase 2 - - 1 Staging: WTGs
Storage area bearing pressure (load spreading)
7.4 t/sqm 401
Extra SPMT axles for load spreading 6 1,0101
20212 62 x 8MW (Phase 1) 500
Jackets, 40m water
depth 1 Foundation
Manufacturing
Extra SPMT axles for load spreading 10 1,6801
Storage area bearing pressure (load spreading)
4.3 t/sqm 701
2022 Phase 2 - - 1 Staging: WTGs
Extra SPMT axles for load spreading 6 1,0101
Storage area bearing pressure (load spreading)
7.4 t/sqm 401
20222 62 x 8MW (Phase 1) 500
Jackets, 40m water
depth 1 Foundation
Manufacturing
Extra SPMT axles for load spreading 10 1,6801
Storage area bearing pressure (load spreading)
4.3 t/sqm 701
2023 Phase 2 - - 1 Staging: WTGs
Extra SPMT axles for load spreading 6 1,0101
Storage area bearing pressure (load spreading)
7.4 t/sqm 401
20232 124 x 8MW (Phase 1) 2 x 500
Jackets, 40m water
depth 2 Foundation
Manufacturing
Extra SPMT axles for load spreading 10 1,6801
Storage area bearing pressure (load spreading)
4.3 t/sqm 1301
2024 Phase 2 - - 2 Staging: WTGs
Extra SPMT axles for load spreading 6 1,0101
Storage area bearing pressure (load spreading)
7.4 t/sqm 701
20242 62 x 8MW (Phase 1) 500
Jackets, 40m water
depth 1 Foundation
Manufacturing
Extra SPMT axles for load spreading 10 1,6801
Storage area bearing pressure (load spreading)
4.3 t/sqm 701
2025 Phase 2 - - 1 Staging: WTGs
Extra SPMT axles for load spreading 6 1,0101
Storage area bearing pressure 7.4 t/sqm 401
Garrad Hassan America, Inc. Page 126 of 153

Document No. 700694-USPO-R-03 Assessment of Ports for Offshore Wind Development in the United States Issue: E Final
YEAR
ANNUAL ACTIVITY PORT GAP
Configuration Capacity (MW)
Foundations Assumptions
No. of
Ports Type Type Size Cost
($‘000s)
20252 124 x 8MW (Phase 1) 2 x 500
Jackets, 40m water
depth 2 Foundation
Manufacturing
Extra SPMT axles for load spreading 10 1,6801
Storage area bearing pressure (load spreading)
4.3 t/sqm 1301
2026 Phase 2 - - 2 WTG Manufacturing
Extra SPMT axles for load spreading 6 1,0101
Storage area bearing pressure (load spreading)
7.4 t/sqm 701
20262 124 x 8MW (Phase 1) 2 x 500
Jackets, 40m water
depth 2 Foundation
Manufacturing
Extra SPMT axles for load spreading 10 1,6801
Storage area bearing pressure (load spreading)
4.3 t/sqm 1301
2027 Phase 2 - - 2 WTG Manufacturing
Extra SPMT axles for load spreading 6 1,0101
Storage area bearing pressure (load spreading)
7.4 t/sqm 701
20272 124 x 8MW (Phase 1) 2 x 500
Jackets, 40m water
depth 2 Foundation
Manufacturing
Extra SPMT axles for load spreading 10 1,6801
Storage area bearing pressure (load spreading)
4.3 t/sqm 1301
2028 Phase 2 - - 2 WTG Manufacturing
Extra SPMT axles for load spreading 6 1,0101
Storage area bearing pressure (load spreading)
7.4 t/sqm 701
20282 186 x 8MW (Phase 1) 3 x 500
Jackets, 40m water
depth 3 Foundation
Manufacturing
Extra SPMT axles for load spreading 10 1,6801
Storage area bearing pressure (load spreading)
4.3 t/sqm 1901
2029 Phase 2 - - 3 WTG Manufacturing
Extra SPMT axles for load spreading 6 1,0101
Storage area bearing pressure (load spreading)
7.4 t/sqm 1101
2030 - - - - - - - - Total Port Authority Investment ($’000): 16,040 Total Developer Investment ($’000s): 28,520
1. Cost on the developer 2. Additional port(s) used for the next project in the same year
Garrad Hassan America, Inc. Page 127 of 153

Document No. 700694-USPO-R-03 Assessment of Ports for Offshore Wind Development in the United States Issue: E Final
Cost-Benefit Assessment
Port usage fees were not available for the Roseburg Shipping Terminal or the Port of Coos Bay, so the cost-benefit results cannot presented here. 10.7.2 Discussion
The capabilities of the Roseburg Shipping Terminal and the Port of Coos Bay, OR to support offshore wind project build-out have been evaluated as an example of port facilities available in the Pacific region. Table 10-14 outlines the improvements and corresponding costs necessary to close the port’s gaps in capability to support the DOE moderate growth scenario from 2014 – 2030 [2]. GL GH concludes that if the necessary improvements are carried out, five facilities such as the Roseburg Shipping Terminal would be needed to meet peak construction demand and suitably satisfy all of the port infrastructure requirements necessary to support the targeted offshore wind capacity development in the Pacific region of the United States during this period. The required improvement cost would be approximately $16 million. The analysis identified a gap in the ability of the seabed at the quayside to support jack-up vessels, and as such, a significant amount of the port investment required will be used to strengthen the seabed at the quayside. It was also found that the quayside area needed to be expanded to meet the requirements for offshore wind operations. This also contributed to the relatively high port investment required. In order to carry out this analysis, port storage was assumed for all operations as there is no floating storage available. This option is not practical for jacket foundations and it is expected that multiple staging ports will have to be used to address storage needs, or alternative floating storage areas used. It is important to note that due to a lack of specific planned offshore wind projects at present, other factors likely to be influential, such as project site location, will play a key role in understanding port requirements in the region. It is likely that multiple staging ports will be utilized in order to minimize transit distances between the port and future project sites. 10.8 Great Lakes: Cleveland, Ohio
10.8.1 Background and Current Conditions
Table 10-15 below shows the key information for the Port of Cleveland, Ohio.
Garrad Hassan America, Inc. Page 128 of 153

Document No. 700694-USPO-R-03 Assessment of Ports for Offshore Wind Development in the United States Issue: E Final
Table 10-15: Available Port Information – Port of Cleveland, OH
Access
Access channel width [m] 23.8 Water depth [m] 7.92 Overhead clearance [m] 35.5 Heavy duty quayside length [m] 225.6 Other: Restrictions on vessel sizes in the Great Lakes / St. Lawrence Seaway System; lake ice
Quaysides Heavy duty quayside area [m2] 52,600 Heavy duty quayside capacity [tonnes/m2] 4.88 Sea bed suitable for jacking-up Unavailable
Storage
Open storage [m2] 125,400 Ground bearing capacity [tonnes/m2] 4.88 Haul route width [m] 7.62 Haul route capacity [tonnes/m2] 4.88 Floating storage [m2] 16,100
Fabrication Workshop Area Workshop available No Workshop length [m] - Workshop area [m2] -
Additional assumptions made for the purpose of this study are listed below:
• It was assumed that the sea bed is not suitable for jacking up at the quayside. • GL GH has assumed that vessels similar to second generation European vessels will be built and used in
Great Lakes to overcome the restrictions on vessel sizes transiting through the Great Lakes St. Lawrence Seaway System.
10.8.2 Results
Opportunity Assessment
Table 10-16 below shows the gaps and corresponding costs necessary to meet the moderate growth scenario of 4 GW of offshore wind capacity for the Great Lakes region of the United States (2014 – 2030). The Port of Cleveland, Ohio has been analyzed as the sample port within the region. Table 10-16 outlines the modeled projects per year to attain this level; also included are the assumed foundation and port type, complying with the assumptions from the DOE moderate growth scenario [2]. The resultant gaps in port capability are stated along with the corresponding cost necessary to close the gap. In addition, the number of ports necessary to support offshore wind development in the region is given so as to assess whether using just the Port of Cleveland is sufficient for the estimated market.
Garrad Hassan America, Inc. Page 129 of 153

Document No. 700694-USPO-R-03 Assessment of Ports for Offshore Wind Development in the United States Issue: E Final
The improvements needed at the Port of Cleveland, OH in order to meet the designated build-out scenario are significant, especially considering the limited build-out potential. The required costs relate primarily to increasing the soil bearing capacity of the quayside, along the haul route, and in the storage area; strengthening the seabed to be suitable for jacking up; widening the haul route, and supplying load-spreading in the storage area. Other costs identified in the table below are assumed to be borne by the offshore wind project developer. The need for seabed improvements stems from the unknown bearing capacity in front of the quayside. GL GH has assumed that without this information, the cost for improving the seabed must be included in gap analysis.
Table 10-16: Gaps and Corresponding Costs in Port Capability for port of Cleveland, OH
YEAR ANNUAL ACTIVITY PORT GAP
Configuration Capacity (MW)
Foundations Assumptions
No. of Ports Type Type Size Cost
($‘000s)
2014 - - - - - - - -
2015 - - - - - - - -
2016 - - - - - - - -
2017 - - - - - - - -
2018 83 x 6MW (Phase 1) 500 Jackets, 30m
water depth 1 Staging:
Foundations / Cables
Large area for storage 30,000 sqm 10,6001
Port channel width 57.8 m (vessel
dependent) -
Port Overhead Clearance
42.4 m (vessel
dependent) -
2019 Phase 2 - - 1 Staging: WTGs
Quayside bearing pressure capacity 5.1 t/sqm 460
Haul route width 3.8 m 40
Storage area bearing pressure 5.1 t/sqm 3,470
Haul route bearing pressure
capacity 5.1 t/sqm 110
Seabed suitable for jacking up - 6,490
Extra SPMT axles for load spreading 6 1,0101
Storage area bearing pressure (load spreading)
5.1 t/sqm 501
2020 - - - - - - - -
Garrad Hassan America, Inc. Page 130 of 153

Document No. 700694-USPO-R-03 Assessment of Ports for Offshore Wind Development in the United States Issue: E Final
YEAR ANNUAL ACTIVITY PORT GAP
Configuration Capacity (MW)
Foundations Assumptions
No. of Ports Type Type Size Cost
($‘000s)
2021
62 x 8MW (Phase 1) 500 Jackets, 30m
water depth 1 Staging:
Foundations / Cables
Large area for storage 27,500 sqm 9,7201
2022 Phase 2 - - 1 Staging: WTGs
Haul route bearing pressure
capacity 0.2 t/sqm 10
Quayside bearing pressure capacity 0.2 t/sqm 10
Haul route width 2.2 m 40
Storage area bearing pressure 0.2 t/sqm 20
Storage area bearing pressure (load spreading)
7.4 t/sqm 401
Extra SPMT axles for load spreading 6 1,0101
2023 124 x 8MW (Phase 1) 2 x 500 Jackets, 30m
water depth 2 Foundation Manufacturing
Extra SPMT axles for load spreading 9 3,0201
Storage area bearing pressure (load spreading)
4.3 t/sqm 1001
2024 Phase 2 - - 2 Staging: WTGs
Storage area bearing pressure (load spreading)
7.4 t/sqm 801
Extra SPMT axles for load spreading 6 2,0201
2025 62 x 8MW (Phase 1) 500 Jackets, 30m
water depth 1 Foundation Manufacturing
Storage area bearing pressure (load spreading)
4.3 t/sqm 501
Extra SPMT axles for load spreading 9 1,5101
2026 Phase 2 - - 1 Staging: WTGs
Storage area bearing pressure (load spreading)
7.4 t/sqm 401
Extra SPMT axles for load spreading 6 1,0101
2027 124 x 8MW (Phase 1) 2 x 500 Jackets, 30m
water depth 2 Foundation Manufacturing
Storage area bearing pressure (load spreading)
4.3 t/sqm 1001
Extra SPMT axles for load spreading 9 3,0201
Garrad Hassan America, Inc. Page 131 of 153

Document No. 700694-USPO-R-03 Assessment of Ports for Offshore Wind Development in the United States Issue: E Final
YEAR ANNUAL ACTIVITY PORT GAP
Configuration Capacity (MW)
Foundations Assumptions
No. of Ports Type Type Size Cost
($‘000s)
2028 Phase 2 - - 2 Staging: WTGs
Storage area bearing pressure (load spreading)
7.4 t/sqm 801
Extra SPMT axles for load spreading 6 2,0201
20282 62 x 8MW (Phase 1) 500 Jackets, 30m
water depth 1 Foundation Manufacturing
Storage area bearing pressure (load spreading)
4.3 t/sqm 501
Extra SPMT axles for load spreading 9 1,5101
2029 Phase 2 - - 1 Staging: WTGs
Storage area bearing pressure (load spreading)
7.4 t/sqm 401
Extra SPMT axles for load spreading 6 1,0101
2030 - - - - - - - - Total Port Authority Investment ($’000s): 10,650 Total Developer Investment ($’000s): 38,090
1Cost on the developer 2Additional port(s) used for the next project in the same year Cost-Benefit Assessment
The summary of all the costs and benefits for the Port of Cleveland with the cash flow for each year is presented in Table 10-17 below.
Garrad Hassan America, Inc. Page 132 of 153

Document No. 700694-USPO-R-03 Assessment of Ports for Offshore Wind Development in the United States Issue: E Final
Table 10-17: Summary of Cost Benefit Analysis – Cleveland OH, Great Lakes (2015 – 2030)
PORT OF CLEVELAND
Year Price Escalation Factor
Revenue per Annum[$000's]
Port Investment CapEx [$000's]
Operating Cash flow [$000's]
2014 0.0 0 0 0 2015 0.0 0 0 0 2016 0.0 0 0 0 2017 0.0 0 0 0 2018 1.0 753 10,570 -9,817 2019 1.0 280 0 280 2020 1.0 0 0 0 2021 1.0 574 80 494 2022 1.0 211 0 211 2023 1.0 148 0 148 2024 1.0 211 0 211 2025 1.0 148 0 148 2026 1.0 211 0 211 2027 1.0 148 0 148 2028 1.0 148 0 148 2029 1.0 211 0 211 2030 1.0 0 0 0
TOTAL ($’000s) -7,606 Figure 10-5 below presents the assumed installed capacity serviced by the Port of Cleveland with the estimated annual operating cash flow, defined here as the port operator’s revenue minus any year-on-year investment costs. 10.8.3 Discussion
The capabilities of the Port of Cleveland, Ohio to support offshore wind project build-out have been evaluated as a case study of port facilities available in the Great Lakes region. Table 10-16 outlines the improvements and corresponding costs necessary to close the port’s gaps in capability to support the DOE moderate growth scenario from 2014 – 2030 [2]. GL GH concludes that if the necessary improvements are carried out, three ports such as Port of Cleveland, OH will be able to suitably satisfy all of the port infrastructure requirements necessary to support the targeted offshore wind capacity development in the Great Lakes region of the United States during this period.
Garrad Hassan America, Inc. Page 133 of 153

Document No. 700694-USPO-R-03 Assessment of Ports for Offshore Wind Development in the United States Issue: E Final
Source: GL GH
Figure 10-5: Cost Benefit Summary – Port of Cleveland, OH
The noted loss is mostly attributed to the significant estimated costs required to improve the port to meet the requirements of offshore wind components. Additional surveys of the seabed conditions are required to confirm the need for such improvements. In this case, it is clear that a more rigorous full economic development assessment is needed to determine how offshore wind projects can best to utilize the Port of Cleveland’s resources. The analysis identified a gap in the ability of the seabed at the quayside to support jack-up vessels, and as such, more than half of the port investment required will be used to strengthen the seabed at the quayside. At the time of the assessment, information about the suitability of the seabed was not available, and thus it was assumed that the maximum amount of upgrade work would be needed. It is recommended that the port carries out a full investigation into the condition and strength of the seabed at the quayside, which could reduce initial investment requirements. It is important to note that due to a lack of specific planned offshore wind projects at present, other factors likely to be influential, such as project site location, will play a key role in understanding port requirements in the region. It is likely that multiple staging ports will be utilized in order to minimize transit distances between the port and future project sites.
Garrad Hassan America, Inc. Page 134 of 153

Document No. 700694-USPO-R-03 Assessment of Ports for Offshore Wind Development in the United States Issue: E Final
11 TRENDS AND COMMONALITIES
This section discusses trends and commonalities observed during the course of completing this study. Before discussing the results of the analysis conducted on the six case study ports, it is interesting to note that during the course of this work GL GH had the opportunity to interact with many ports spanning all regions of the country. Most of these were aware of the potential for offshore wind projects in their region, had thought about what this could mean for their facility, and were interested in getting involved. Not unexpectedly, most ports considered their facility particularly well suited to providing the necessary services. This is seen as a positive sign that this critical component of the infrastructure needed to facilitate the growth of this industry considers involvement in offshore wind projects to be an attractive opportunity. The results presented in Section 10 above and also in this section confirm this sentiment. 11.1 Gap Analysis
In order to gain insight into the current status of U.S. port infrastructure and its ability to meet the needs of offshore wind projects, GL GH developed set of project configurations that cover small and large projects using current and future technologies. These scenarios were then applied to the six case study ports (see Section 10) and analyzed using the Port Assessment Tool. The results form a snapshot of the current abilities of U.S. ports to support a variety of different activities and project requirements. These scenarios are outlined in Table 11-1 and the results are shown as heat maps in Figure 11-1. The color scales are consistent across all the ports and illustrate the estimated level of investment required to enable the port to support the required activities, with green and red corresponding to lower and higher costs, respectively.
Table 11-1: Test Case Scenario Configurations
Test Case 1 2 3 4 5 Total project capacity [MW] 300 300 296 296 500 Number of WTGs 75 75 37 37 62 Wind turbine generator capacity [MW] 4 4 8 8 8 Foundation type Monopile GBS Jacket GBS Jacket Water Depth [m] 20 40 40 40 40
Garrad Hassan America, Inc. Page 135 of 153

Document No. 700694-USPO-R-03 Assessment of Ports for Offshore Wind Development in the United States Issue: E Final
Source: GL GH
Figure 11-1: Test Case Scenario Results
As stated in Section 10.1, each case study port was selected because it is among the facilities in that region considered to have the highest levels of readiness for support of offshore wind. Therefore, the results presented in Figure 11-1 above capture trends that, at the time of this study, are considered to be representative of the maximum port capabilities and minimum improvement needs around the country. The results show that all six ports evaluated are well suited to host O&M activities and that little-to-no investment is required to close any gaps identified related to full O&M support. Given the requirements for an O&M port (see Section 5.11), assuming that an O&M port needs to accommodate crew transfer and service vessels but not necessarily larger jack-up or heavy-lift vessels, and neglecting for the moment the importance of the close proximity of O&M ports to the project site, many large and small ports around the country can be expected to see a similar
Definition of Test Cases
Test Case 1 2 3 4 5Total project capacity [MW] 300 300 296 296 500Number of wind turbines 75 75 37 37 62Wind turbine capacity [MW] 4 4 8 8 8Foundation type Monopile GBS Jacket GBS JacketWater Depth [m] 20 40 40 40 40
Cost to Fill Gap [$k]
Test Case 1 2 3 4 5 1 2 3 4 5Foundation Manufacturing 0 0 0 0 0 130 0 320 0 320Offshore Substation Manufacturing 0 0 0 0 0 2,680 2,680 2,680 2,680 2,680Staging - foundation & cables 0 0 0 0 0 0 0 0 0 0Staging - turbines 0 0 0 0 0 400 400 150 150 150Operations & Maintenance 0 0 0 0 0 0 0 0 0 0
Test Case 1 2 3 4 5 1 2 3 4 5Foundation Manufacturing 170 0 300 0 300 60 400 1,240 710 1,240Offshore Substation Manufacturing 3,090 3,090 3,090 3,090 3,090 640 640 640 640 640Staging - foundation & cables 0 0 0 0 0 60 400 1,790 710 1,790Staging - turbines 130 130 190 190 190 2,670 2,670 80 80 80Operations & Maintenance 0 0 0 0 0 0 0 0 0 0
Test Case 1 2 3 4 5 1 2 3 4 5Foundation Manufacturing 6,200 3,370 14,460 8,300 15,640 4,860 0 9,470 0 10,690Offshore Substation Manufacturing 4,110 4,110 4,110 4,110 4,110 3,560 3,560 3,560 3,560 3,560Staging - foundation & cables 6,880 4,060 15,150 9,000 16,330 0 0 0 0 0Staging - turbines 13,550 13,550 11,230 11,230 12,840 6,630 6,630 9,590 9,590 11,230Operations & Maintenance 0 0 0 0 0 0 0 0 0 0
COOS BAY, OR CLEVELAND, OH
NEW BEDFORD, MA PAULSBORO, NJ
MOREHEAD CITY, NC GALVESTON, TX
Garrad Hassan America, Inc. Page 136 of 153

Document No. 700694-USPO-R-03 Assessment of Ports for Offshore Wind Development in the United States Issue: E Final
result and be able to support offshore wind project O&M needs immediately. This is advantageous to projects in that there is a good chance that the nearest ports to the project are also suited to typical O&M activities. By contrast, today’s ports generally require additional investment before they can serve as staging ports for offshore wind projects. The figure also captures the expected result that the smallest investments are needed at the ports where upgrades for offshore wind have already been implemented. The most common infrastructure improvement required is related to increasing the bearing capacity of the storage area and quayside; it comes as no surprise that U.S. ports appear to have been designed with ground bearing capacities sufficient for the cargo that makes up the bulk of its business. Unless the native soil has additional strength, additional bearing capacity is not typically included due to the cost of making such improvements. Based on the information gathered from a sample of ports around the country, typical bearing capacities are on the order of 5 t/m2, whereas turbine nacelles require bearing capacities of between 7 and 10 t/m2, depending on the size of the turbine. Furthermore, foundations require additional bearing capacity, with jackets needing between 10 and 20 t/m2 and monopiles needing bearing capacities greater than 20 t/m2. See the Executive Summary or Section 5 for a full set of port requirements. The most expensive gap identified by these results is related to the ability of jack-up vessels to jack up at the quayside. In ports where the seabed does not yet support jacking up, e.g. Coos Bay and Cleveland, the costs of upgrading the seabed make turbine staging the most expensive operation for these ports. This study has assumed that seabed improvements would be made without changing the channel depth, thus requiring that material be removed by dredging before amendments can be added to strengthen the seabed. It should be noted that it is not typical that a port will have assessed the seabed in the harbor and quantified the seabed bearing capacity. This assessment would need to occur before a jack-up vessel can operate at the quayside. As mentioned above, two of the case study ports showed very high improvement costs within the study period. As the seabed bearing capacity at these or the other case study ports is not known, increased uncertainly must be assumed for these specific results. Gaps related to overhead clearance, channel width, and channel depth are not costed as they are assumed to be prohibitively expensive. The other significant gap contributing to the higher cost of upgrading a staging port is the need for additional storage space within the facility. Ultimately, however, the cost of acquiring the space in the first place is not the driver; rather, the cost that drives this improvement is that of upgrading the bearing capacity of the additional space. Other trends observed from the results shown in Figure 11-1 are the following:
• GBS foundations carry the lowest storage costs due to the assumption that they are fabricated on barges and stored in the harbor. If these foundations are assumed to be stored onshore, the cost of required upgrades increases by an order of magnitude, almost exclusively due to the need for load-spreading transportation, e.g. SPMTs,
• Larger turbines and larger projects require greater improvement costs due to the heavier loads and larger storage area requirements.
• The cost of improvements for storing foundations and cables varied between the five project configurations as expected but was consistent across all six ports for each project configuration and was governed primarily by the floating storage space required to store the foundations.
• Improvement costs for offshore substation manufacturing depends more on the water depth at the quayside and any dredging required to accommodate offshore substation transport vessels than on the specific project configuration.
Garrad Hassan America, Inc. Page 137 of 153
Document No. 700694-USPO-R-03 Assessment of Ports for Offshore Wind Development in the United States Issue: E Final
• While manufacturing facilities may not yet be in place at the ports reviewed, there are no limitations to the development of such facilities.
11.2 Opportunity Assessment
Based on DOE’s moderate growth scenario in which 28 GW of offshore wind capacity are developed in the U.S. by 2030, components for 56 projects would be fabricated, staged, deployed, installed, and maintained between 2014 and 2030. Most if not all of these activities will be based out of U.S. ports. As such, there is a significant opportunity for ports in each region of the country to participate in this growth. When this growth scenario was evaluated using the Port Assessment Tool, the results showed that 4 of the 5 regions would require a minimum of 2 ports similar to those evaluated to be available simultaneously for staging and some component fabrication. Given the high growth rate in the later years of the study period, the Pacific region would require at least 3 ports to be available. A greater number of ports are expected to be tapped to support O&M activities. This assessment does not account for the location of the projects, and as such, it is left to the project developer to incorporate the distance between the staging port and the project site in the detailed analysis of ports available to support that specific project. It can be expected that such project-specific evaluations provide opportunities for more than two (or three in the case of the Pacific region) ports to be active in each region given the cost and time savings available by utilizing a staging port in close proximity to the project location. GL GH has observed that states often appear quite interested in becoming the dominant infrastructure centers in their regions. While this is understandable since this can mean added jobs and associated income for a state, GL GH advises that it is neither practicable nor efficient for each state to develop port infrastructure and capabilities in isolation from other offshore wind needs in the region. This is true especially at this early and critical stage of the offshore wind industry’s growth. GL GH instead encourages states to approach port infrastructure planning and development on a regional basis as this will better serve the needs of the projects. 11.3 Cost-Benefit Assessment
Following the gap analysis and opportunity assessment described above, GL GH gathered tariffs from the six case study ports and applied the applicable fees to the regional project deployment scenarios. The resulting combinations of improvement costs and potential fee-based revenue provide examples of the type of cost-benefit assessment that should be conducted by a port interested seeking to participate in offshore wind projects. The following observations were made from the cost-benefit comparisons resulting from the six case studies:
• The structure and fees of one port’s tariff may differ from another’s. The small number of tariffs reviewed showed generally consistent equivalent total fees for a given project.
• The actual fees are one of the key factors that project developers will use to evaluate the suitability of a port for their particular project and this competitive pricing should be considered where possible.
• In regions where less total capacity is envisioned, significant port improvement costs – e.g. seabed strengthening for jack-ups – may lead to an unfavorable investment as indicated by investment costs that outweigh the expected revenue through 2030. Alternative solutions that avoid these high improvement costs should be considered. For the case of seabed improvement, it is noted that until site-specific geotechnical assessments are completed, the suitability for jack-up vessels remains unknown. This type of assessment is
Garrad Hassan America, Inc. Page 138 of 153

Document No. 700694-USPO-R-03 Assessment of Ports for Offshore Wind Development in the United States Issue: E Final
standard practice before the use of such vessels is approved (e.g. by a marine warranty surveyor or certified verification agent).
• For ports that do not need strengthening of the seabed, the revenue outweighs the improvement costs by the completion of the first project.
Garrad Hassan America, Inc. Page 139 of 153

Document No. 700694-USPO-R-03 Assessment of Ports for Offshore Wind Development in the United States Issue: E Final
12 CONCLUSIONS
As offshore wind energy develops in the U.S. port facilities will become strategic hubs in the offshore wind farm supply chain, because all plant and transport logistics must transit through these facilities. Therefore, these facilities must provide suitable infrastructure to meet the specific requirements of the offshore wind industry. As a result, it is crucial that federal and state policy-makers and port authorities take effective action to position ports in the offshore wind value chain to take best advantage of their economic potential. The U.S. Department of Energy tasked the independent consultancy GL Garrad Hassan (GL GH) with carrying out a review of the current capability of U.S. ports to support offshore wind project development and assessing the challenges and opportunities related to upgrading this capability to support the growth of as many as 54 gigawatts of offshore wind installed in U.S. waters by 2030. The GL GH report and the open-access web-based Ports Assessment Tool resulting from this study will aid decision-makers in making informed decisions regarding the choice of ports for specific offshore projects, as well as the types of investments that would be required to make individual port facilities suitable to function as manufacturing, installation and/or operations hubs. GL GH held a series of workshops, webinars, and interviews to gather information on ports and port use from ports, vessel operators, project developers, economic development interests, and other industry stakeholders around the country. Then, using a set of regional project build-out scenarios between now and 2030, GL GH mapped out the necessary national port infrastructure that would be required to support industry growth under the various scenarios. To facilitate a more in-depth infrastructure analysis, six ports from different geographic regions, with varied levels of interest and preparedness towards offshore wind, were evaluated by modeling a range of installation strategies and port use types to identify gaps in capability and potential opportunities for economic development. In addition to this Report, an important outcome of this study was the development of a Web-based port assessment tool, which allows the user to identify ports that are well-suited to specific project needs. Port operators are also able to use this tool to identify areas in which additional investments are required at their facility to support offshore wind installation and/or maintenance. This assessment tool is freely available to the public at www.OffshoreWindPortReadiness.com. From this work, the following key conclusions are drawn:
• Overall, the level of interest in U.S. ports towards involvement in offshore wind projects is high.
• The physical requirements for offshore wind ports are often more onerous than for more traditional cargo. The most common example of this is the ground bearing capacity in the storage area and at the quayside; most U.S. ports will require soil strength improvements before they can fully support offshore wind project construction.
• In areas where SPMTs are to be used, a bearing capacity of 10 t/m2 is recommended to allow storage and transportation of wind farm components. On the other hand, to support the lifting and/or movement of onshore cranes, either in the storage area or at the quayside, additional ground strength is likely required and will be determined by the size of the load and specifications of the crane.
• Sufficient port infrastructure exists or must be developed to meet anticipated project deployment between 2014 and 2030. While there are as yet no offshore wind farms installed in the United States, much of the infrastructure critical to the success of such projects does exist, albeit in the service of other industries.
• Some level of improvement is typically required to enable ports to support staging and manufacturing operations. The most common upgrades are to address additional ground bearing capacity and expanding the available storage space.
Garrad Hassan America, Inc. Page 140 of 153

Document No. 700694-USPO-R-03 Assessment of Ports for Offshore Wind Development in the United States Issue: E Final
• Most ports can serve as O&M ports with little-to-no improvements required, assuming that only crew transfer and service vessels need to interface with such ports.
• The improvements required to support offshore wind will not typically preclude a port from continuing to service more traditional cargo. Given that ports typically require long-term commitments on the order of 10 or 20 years or more in order to designate specific facilities to an activity such as offshore wind staging, having the ability to support multiple industries is considered beneficial, especially during the early years.
• The shortage of heavy-lift crane vessels will require U.S. ports to use onshore cranes to load and off-load vessels, thereby resulting in a larger ground bearing strength requirement when compared with typical European staging ports.
• At this early stage in the U.S. offshore wind industry, port designers may want to opt to design ports for added flexibility to best meet the needs of the first projects. For example, strengthening the storage area beyond the 10 t/m2 minimum allows cranes, SPMTs, and other technologies to lift and move component as needed. With the limited experience in the U.S. installing offshore wind turbines, projects may benefit from this additional flexibility to accommodate the preferences of installation contractors and to facilitate viable solutions to unexpected logistic challenges.
It is clear that significant opportunities exist for port facilities that can provide support to the build-out and maintenance of offshore wind projects in the United States. These opportunities are summarized as follows:
• To achieve the DOE’s moderate growth scenario of 28 GW of offshore wind in the United States by 2030, GL GH estimates that 20 projects (10 GW) are needed in the North Atlantic region, 4 projects (2 GW) in the South Atlantic, 8 projects (4 GW) in the Gulf of Mexico, 8 projects (4 GW) in the Pacific, 16 projects (8 GW) along the Pacific coast, and 8 projects (4 GW) in the Great Lakes.
• If capacities on this order of magnitude are developed, multiple port facilities within a given region will be required to meet the demand for services. In the Pacific region, a minimum of 3 staging ports will be required to meet the high demand in the latter years of the study period. In the North Atlantic, Gulf Coast, and Great Lakes regions will need a minimum of 2 staging ports in order to keep up with the modeled demand. Lastly, in the South Atlantic, a minimum of 1 staging port is required.
• Assuming the same level of build-out, the number of ports actually developed is expected to be larger than these minimums given the need for ports and projects to be located in close proximity in order to minimize vessel transit time.
As U.S. ports and offshore wind developers look to work together on specific projects, they will encounter synergies and challenges. The challenges they face will include identifying sources of funding for the facility improvements required, and addressing ports’ typical desire to engage in long-term partnerships on the order of 10-20 years. Early projects will feel these challenges most severely as they will set the precedent for these partnerships become established in the United States. This study seeks to provide information about gaps, costs, and opportunities to aid these discussions. Given the level of interest from U.S. ports and the capabilities available today, GL GH finds that sufficient port infrastructure exists or can be developed to meet anticipated project deployment between 2014 and 2030.
Garrad Hassan America, Inc. Page 141 of 153

Document No. 700694-USPO-R-03 Assessment of Ports for Offshore Wind Development in the United States Issue: E Final
13 REFERENCES
[1] U.S. Department of Energy, “20% Wind Energy by 2030 – Increasing Wind Energy’s Contribution to U.S.
Electricity Supply”, doc ref: DOE/GO-102008-2567, July 2008, published online: http://www.nrel.gov/docs/fy08osti/41869.pdf.
[2] Navigant Consulting, Inc., “U.S. Offshore Manufacturing and Supply Chain Development”, doc ref: DE-EE0005364, 22 February 2013, published online: http://www1.eere.energy.gov/wind/pdfs/us_offshore_wind_supply_chain_and_manufacturing_development.pdf.
[3] Tetra Tech EC, “Port and Infrastructure Analysis for Offshore Wind Energy Development”, February 2010, published online: http://www.masscec.com/content/port-and-infrastructure-analysis-offshore-wind-energy-development.
[4] Great Lakes Wind Collaborative, “The Role of the Great Lakes-St. Lawrence Seaway Ports in the Advancement of the Wind Energy Industry”, September 2010, published online: http://www.glc.org/energy/wind/pdf/GLWC-PortSurvey-2010-web.pdf.
[5] Kinetik Partners, “Analysis of Maryland Port Facilities for Offshore Wind Energy Services”, 19 December 2011, published online: http://energy.maryland.gov/documents/AnalysisofMarylandSteelFacilitiesforSufficiencytoSupport.pdf.
[6] Edge, B.L., et al, “North Carolina Port Capabilities for Offshore Wind Farms”, Draft Final Report, NC State University, Undated.
Garrad Hassan America, Inc. Page 142 of 153
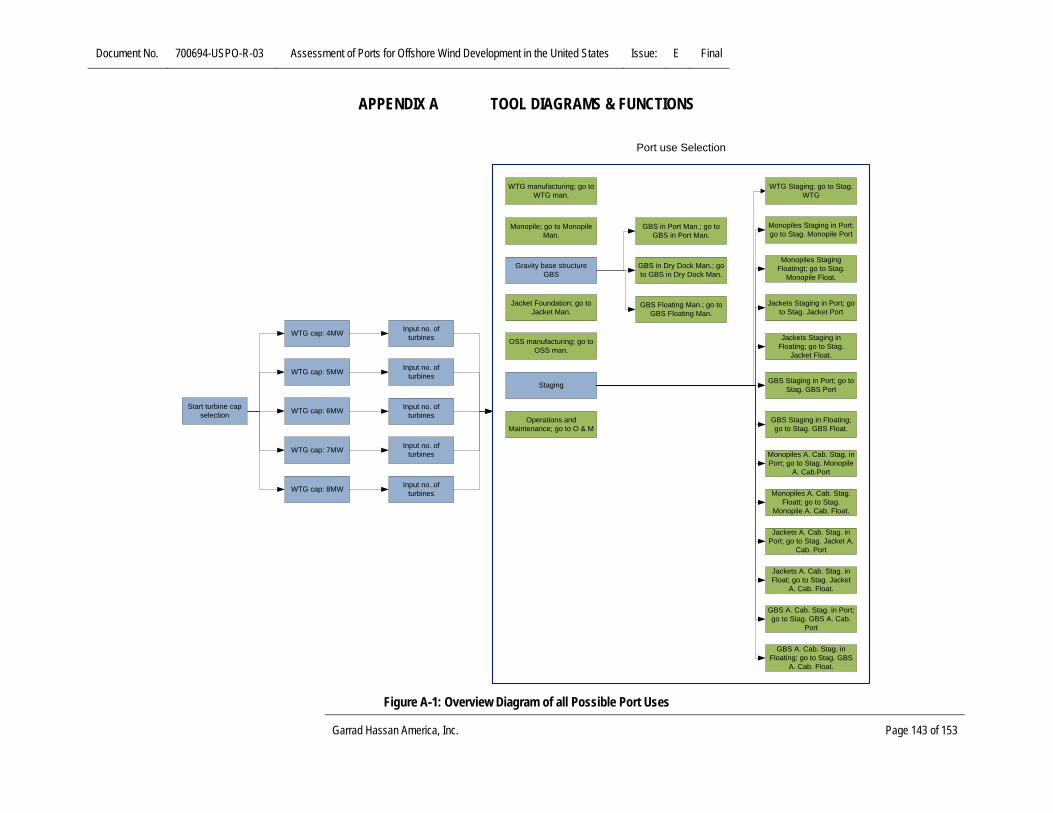
Document No. 700694-USPO-R-03 Assessment of Ports for Offshore Wind Development in the United States Issue: E Final
APPENDIX A TOOL DIAGRAMS & FUNCTIONS
Start turbine cap selection
WTG cap: 4MW
WTG cap: 5MW
WTG cap: 7MW
Input no. of turbines
Input no. of turbines
Input no. of turbines
WTG manufacturing; go to WTG man.
OSS manufacturing; go to OSS man.
Staging
Operations and Maintenance; go to O & M
Monopile; go to Monopile Man.
Gravity base structure GBS
GBS in Port Man.; go to GBS in Port Man.
GBS in Dry Dock Man.; go to GBS in Dry Dock Man.
GBS Floating Man.; go to GBS Floating Man.
WTG Staging; go to Stag. WTG
Monopiles Staging in Port; go to Stag. Monopile Port
Monopiles Staging Floatingt; go to Stag.
Monopile Float.
Jackets Staging in Port; go to Stag. Jacket Port
Jackets Staging in Floating; go to Stag.
Jacket Float.
GBS Staging in Port; go to Stag. GBS Port
GBS Staging in Floating; go to Stag. GBS Float.
Monopiles A. Cab. Stag. in Port; go to Stag. Monopile
A. Cab.Port
Monopiles A. Cab. Stag. Floatt; go to Stag.
Monopile A. Cab. Float.
Jackets A. Cab. Stag. in Port; go to Stag. Jacket A.
Cab. Port
Jackets A. Cab. Stag. in Float; go to Stag. Jacket
A. Cab. Float.
GBS A. Cab. Stag. in Port; go to Stag. GBS A. Cab.
Port
GBS A. Cab. Stag. in Floating; go to Stag. GBS
A. Cab. Float.
WTG cap: 6MW Input no. of turbines
WTG cap: 8MW Input no. of turbines
Jacket Foundation; go to Jacket Man.
Port use Selection
Figure A-1: Overview Diagram of all Possible Port Uses
Garrad Hassan America, Inc. Page 143 of 153

Document No. 700694-USPO-R-03 Assessment of Ports for Offshore Wind Development in the United States Issue: E Final
User selection of wind farm characteristics:- Select WTG capacity [MW]- Select Number of WTG [-]- Select Foundation type
(Depend on WTG capacity) - Select Water depth
(depends on foundation type)[m]
User selects port type:- WTG Manufacturing- Foundation manufacturing- OSS Manufacturing- Staging
-WTG-Foundations-Foundations & Array Cabling
- O&M
Tool shows suitable vessels for the port type based on the selected port type and the Jones act requirement
This is fed in from the excel tool which states the vessel suitability
User selects one vessel for each vessel type from the list of suitable vessels for the port use.
The vessel list is dynamic, i.e. New vessels can be added to the list after the tool is finalized
User selects Port from the map or drop down list or selects multiple ports for comparison.
The Port list is dynamic, i.e. New ports can be added to the list after the tool is finalized
The user can change the default project characteristics and components sizes for each parameter separately.
If the user does not change this, the default values will be used.
The user can change the default unit costs for each gap separately.
If the user does not change this, the default values will be used.
The gaps are calculated by the tool automatically. So when a user makes a change to the settings the new gap analysis are calculated and shown directly.
The tool shows the results of the gap analysis and the possible costs to resolve the gap analysis
User selects wind farm and project characteristics
User can change the default values of the components and unit costs Gaps are calculated automatically User Sees the Results
Figure A-2: High-level Diagram of the Port Assessment Tool
Garrad Hassan America, Inc. Page 144 of 153
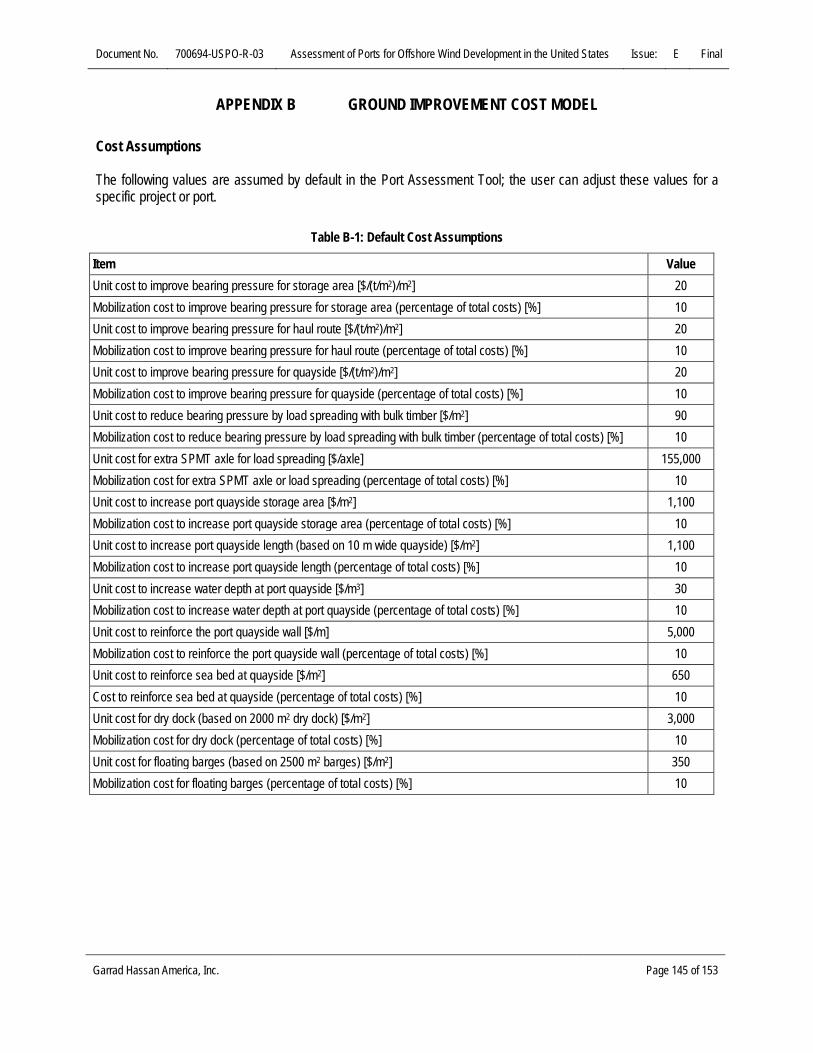
Document No. 700694-USPO-R-03 Assessment of Ports for Offshore Wind Development in the United States Issue: E Final
APPENDIX B GROUND IMPROVEMENT COST MODEL
Cost Assumptions The following values are assumed by default in the Port Assessment Tool; the user can adjust these values for a specific project or port.
Table B-1: Default Cost Assumptions
Item Value Unit cost to improve bearing pressure for storage area [$/(t/m2)/m2] 20 Mobilization cost to improve bearing pressure for storage area (percentage of total costs) [%] 10 Unit cost to improve bearing pressure for haul route [$/(t/m2)/m2] 20 Mobilization cost to improve bearing pressure for haul route (percentage of total costs) [%] 10 Unit cost to improve bearing pressure for quayside [$/(t/m2)/m2] 20 Mobilization cost to improve bearing pressure for quayside (percentage of total costs) [%] 10 Unit cost to reduce bearing pressure by load spreading with bulk timber [$/m2] 90 Mobilization cost to reduce bearing pressure by load spreading with bulk timber (percentage of total costs) [%] 10 Unit cost for extra SPMT axle for load spreading [$/axle] 155,000 Mobilization cost for extra SPMT axle or load spreading (percentage of total costs) [%] 10 Unit cost to increase port quayside storage area [$/m2] 1,100 Mobilization cost to increase port quayside storage area (percentage of total costs) [%] 10 Unit cost to increase port quayside length (based on 10 m wide quayside) [$/m2] 1,100 Mobilization cost to increase port quayside length (percentage of total costs) [%] 10 Unit cost to increase water depth at port quayside [$/m3] 30 Mobilization cost to increase water depth at port quayside (percentage of total costs) [%] 10 Unit cost to reinforce the port quayside wall [$/m] 5,000 Mobilization cost to reinforce the port quayside wall (percentage of total costs) [%] 10 Unit cost to reinforce sea bed at quayside [$/m2] 650 Cost to reinforce sea bed at quayside (percentage of total costs) [%] 10 Unit cost for dry dock (based on 2000 m2 dry dock) [$/m2] 3,000 Mobilization cost for dry dock (percentage of total costs) [%] 10 Unit cost for floating barges (based on 2500 m2 barges) [$/m2] 350 Mobilization cost for floating barges (percentage of total costs) [%] 10
Garrad Hassan America, Inc. Page 145 of 153

Document No. 700694-USPO-R-03 Assessment of Ports for Offshore Wind Development in the United States Issue: E Final
APPENDIX C PORT IMPROVEMENTS – CIVIL CONSIDERATIONS
INTRODUCTION GL GH has prepared a cost analysis tool to estimate the potential cost of port facility improvements that may be required to facilitate the handling of offshore wind project components at U.S. ports. Key port areas examined include lay down yards, quayside infrastructure, and harbor seabed improvements. Based upon user inputted information, the tool generates cost estimates to assist developers, port facility owners or other stakeholders in gauging the potential cost of port improvements associated with offshore wind farm construction. RESULTS OF THE ANALYSIS Tool Development
The port improvement cost analysis tool was developed utilizing cost data averaged across the United States from the fourth quarter of 2012 as obtained from RSMeans Online cost estimation software. With RSMeans unit pricing, the port facility improvement cost estimates were developed by analyzing individual work components, assigning appropriate quantities, and summarizing cost data. With overall Project pricing for a particular set of parameters (reviewed in greater detail below), unit pricing was derived to allow developed costs to be applied over a range of potential site conditions. Port Facility Geotechnical Conditions
Geotechnical conditions at port facilities can vary widely by region and specific port location as a result of the varying geology of shorelines upon which ports are built. Subgrade soils may consist of existing natural soils or bedrock materials with varying strength properties or of historical fill materials (from port activity or neighboring developments) that may have been utilized to raise port elevations or infill waterways or wetlands. Historic fill areas and existing areas of low soil quality (such as wetlands) may have low bearing strength/high settlement potential and require substantial improvements prior to use. The geotechnical conditions of the seabed within the harbor or waterway adjacent to the port is another important consideration. Dredging activity may be required to facilitate the passage of large ships and the strength of seabed soils that would support jack-up vessels (which may be utilized in the loading and offloading of offshore wind turbine components) would require evaluation. Thick layers of low-strength soil seabed materials may necessitate removal and replacement of those materials to improve seabed bearing capacity. In an attempt to generalize soil types which may be present at a standard port facility, GL GH selected three soil types consisting of hydraulic fill, clay/silt, and sand. Each soil type has assumed load bearing properties (presented in Table C-1) that correspond to specific subgrade improvement profiles designed to facilitate expected loading of 2,048 lb/ft2 (10 tonnes/m2). The subgrade improvements must be capable of meeting the expected loading criteria with an appropriate factor of safety of 1.5 or 3,072 lb/ft2 (15 tonnes/m2).
Garrad Hassan America, Inc. Page 146 of 153

Document No. 700694-USPO-R-03 Assessment of Ports for Offshore Wind Development in the United States Issue: E Final
Table C-1: Allowable Foundation Pressure per the 2006 International Building Code2
Soil Case Soil Type Allowable Foundation
Pressure [lb/ft2]
Required Bearing Capacity [lb/ft2]
Required Improvement in Bearing Capacity [lb/ft2]
1 Hydraulic fill 500* 3,072 2,572 2 Clay or silt 1,500 3,072 1,572 3 Sand 2,000 3,072 1,072
*Assumed variable for hypothetical existing hydraulic fill materials. Given the wide variety of seabed and shoreline conditions where dredging activities and quayside improvements may occur, a single generalized improvement profile has been considered for these areas. Upon evaluation of actual site conditions, improvement criteria may be adjusted as necessary to meet Project requirements. Based on soil types detailed above, subgrade profiles were outlined which consisted of all or several of the following components including (from bottom to top) geotextile fabric, open-graded drainage rock, geotextile fabric, crushed miscellaneous base, and concrete or asphalt; placement of which is to follow removal of existing subgrade soils to corresponding depths. In the case of fine grained soil conditions within hydraulic fill or clay/silt soils, geotextile fabric was utilized in an effort to bridge over existing soils of poor quality and provide a physical barrier to prevent the migration of existing soils into open-graded drainage rock (limiting settlement of drainage rock into soft subgrade materials). Subgrade improvements beyond surficial grading/compaction have not been considered as part of this analysis. The open graded drainage rock provides an avenue for high groundwater levels to efficiently drain from subgrade materials. The drainage rock was utilized within the hydraulic fill and clay/silt subgrade profiles due to the greater depth of improvement required and the increased likelihood of encountering groundwater at greater depths. A second geotextile layer separates the open graded drainage rock from the overlying crushed miscellaneous base (maintaining a clear drainage channel and limiting settlement). The crushed miscellaneous base adds bearing strength to the system along with providing the final wearing surface or asphalt/concrete subgrade. The typical location of port facilities is such that soil conditions are likely to consist of clayey or silty soils as a result of natural soil conditions along waterways (i.e. deposition of low strength silts and clays along shorelines and river deltas), high groundwater tables, a history of hydraulic fill of dredged material in the lands surrounding the port, or historic infill of waterways. To assess existing subgrade conditions, a geotechnical study must be completed as part of design work for any port improvement project discussed within this report. For ports of unknown subgrade conditions, lower strength soils consisting of hydraulic fill or clay/silt may be assumed until geotechnical studies can be completed to confirm otherwise. Laydown Area To facilitate assembly, handling, and storage of offshore wind turbine components, construction of adequate laydown yard facilities are often required. These areas must be of sufficient strength to accommodate loads applied in the storage of various components in addition to those of the material handling and delivery equipment. Three subgrade improvement scenarios are outlined below that correspond to potential soil conditions as reviewed above. Hydraulic Fill Subgrade
Based on assumed conditions of low strength hydraulic fill soils and high groundwater, a subgrade profile was outlined which consisted of (from bottom to top) geotextile fabric, 28” of open-graded drainage rock, geotextile fabric,
2 International Building Code 2006, International Code Council, Inc. Dated January 2006.
Garrad Hassan America, Inc. Page 147 of 153

Document No. 700694-USPO-R-03 Assessment of Ports for Offshore Wind Development in the United States Issue: E Final
24” of crushed miscellaneous base, and 8” of asphalt. This subgrade profile corresponds to a total 58” cut in existing site soils and no subgrade improvements beyond surficial grading/compaction have been considered. An alternate option was also included which replaces the asphalt with 12” of crushed miscellaneous base to serve as the wearing layer. Clay/Silt Subgrade
Based on assumed conditions of medium strength clay/silt soils and high groundwater, a subgrade profile was outlined which consisted of (from bottom to top) geotextile fabric, 12” of open-graded drainage rock, geotextile fabric, 12” of crushed miscellaneous base, and 6” of asphalt. This subgrade profile corresponds to a total 28” cut in existing site soils and no subgrade improvements beyond surficial grading/compaction have been considered. An alternate option was also included which replaces the asphalt with 10” of crushed miscellaneous base to serve as the wearing layer. Sand Subgrade
Based on assumed conditions of high strength sand soils and no groundwater influence, a subgrade profile was outlined which consisted of (from bottom to top) 12” of crushed miscellaneous base and 6” of asphalt. This subgrade profile corresponds to a total 16” cut in existing site soils and no subgrade improvements beyond surficial grading/compaction have been considered. An alternate option was also included which replaces the asphalt with 10” of crushed miscellaneous base to serve as the wearing layer.
Table C-2: Laydown yard unit pricing in terms of square feet of laydown yard surface area.
Hydraulic Fill Clay/Silt Sand Laydown Yard Unit Pricing [$/ft2] 18.27 10.78 7.32 Deduct for Aggregate Surface in lieu of Asphalt [$/ft2] [0.67] [1.13] [1.14]
Table C-3: Laydown yard unit pricing in terms of cost per square foot per unit strength improvement.
Hydraulic Fill Clay/Silt Sand Required Improvement in Bearing Capacity [lb/ft2] 2,287 1,287 787 Unit Pricing per Unit Strength Increase in Bearing Capacity [$/ft2/unit strength increase (lb/ft2)]
0.00710 0.00686 0.00683
Assumptions/Clarifications To create standardized subgrade improvement profiles suitable for a variety of potential soil conditions, GL GH assumed multiple factors as follows:
Garrad Hassan America, Inc. Page 148 of 153

Document No. 700694-USPO-R-03 Assessment of Ports for Offshore Wind Development in the United States Issue: E Final
• Existing Soil Existing sand and clay/silt soil bearing capacities as defined in Table C-2 are assumed parameters
obtained from the 2006 International Building Code and will require confirmation with geotechnical studies.
The bearing strength of existing hydraulic fill soils has been assumed at a value of 500 psf.
• Design Scalability Unit pricing guidelines are approximations based upon theoretical soil improvement profiles that may
be required to support design loads. Subgrade improvement measures beyond the depth of improvement noted within the soil improvement
profiles have not been considered. Unit pricing is estimated around a narrow set of parameters and is not fully scalable across all soil
conditions. As such: The relationship between unit strength improvement and overall improvement cost is not
necessarily linear as different stabilization approaches may be utilized across a range of subgrade strengths.
The cost of improvement for low-strength subgrade soils may follow an exponential cost increase rather than a linear cost increase. Extremely low strength soils may require subgrade ground improvements and result in large cost increases.
The cost of improvement for high-strength subgrade soils would not decrease linearly to zero as high strength subgrade soils must still be prepared/supplemented and paved.
• Existing Lot The existing area where the laydown yard is located is undeveloped land with light vegetative growth.
• Excavation Spoil Spoil materials from excavated areas are non-contaminated and require no special disposal criteria. GL GH notes that contaminated soils may be present given the potential of historic use of dredged
materials as hydraulic fill or previous industrial use of the land. Spoil materials will be disposed of for the cost of trucking only assuming that facilities are available to
accept spoils at no cost. Trucking for spoil materials assumes a 20 mile round trip.
• Backfill Gravel is to be delivered via truck from a local quarry within a 10 mile radius (20 mile round trip) of the
Project. Alternatives may be available for more economical transport of aggregate to port locations including
rail, barge, and freighter.
• Engineering and management costs are not included. Quayside Development Adequate quayside facilities must be present to accommodate vessels and facilitate loading/unloading of offshore wind components. Quayside development detailed herein is broken into two components, the sheet pile wall
Garrad Hassan America, Inc. Page 149 of 153

Document No. 700694-USPO-R-03 Assessment of Ports for Offshore Wind Development in the United States Issue: E Final
(inclusive of wall installation, capping, and tie backs) and the concrete deck (inclusive of excavation, backfill, and concrete pavement). Quayside Wall
The sheet pile wall at the quayside is to consist of standard sheet pile wall segments driven across the full length of the wall to a depth of 20’ into the seabed. The wall is to be tied back to concrete blocks (deadman anchors) spaced at 15’ intervals. A full length concrete capping beam has also been included to top out the sheet pile wall. The sheet pile wall is designed to a total height of 56’ with a 7’ freeboard at high water level and a 13’ free board at low water level (resulting in water depths of 29’ at high water level and 23’ at low water level). Quayside Deck
Land based soils immediately adjacent to the sheet pile wall are to be excavated to a depth of 7’ below the top of the wall and a width of 33’ (as measured perpendicularly from the wall). Based on assumed conditions of high groundwater, a subgrade profile was outlined which consisted of (from bottom to top) geotextile, 24” of open-graded drainage rock, geotextile, 48” of crushed miscellaneous base, and 12” of concrete. This subgrade profile corresponds to a total 82” cut in existing site soils and no subgrade improvements beyond surficial grading/compaction have been considered. Additionally, an option to complete a retrofit of an existing quayside is presented below following the soil improvement profiles generated for the laydown yard (which correspond to hydraulic fill, clay/silt, and sand soils). This option includes soil improvement only with the existing wall remaining in place. Existing Quayside Improvements In consideration of an existing quayside area requiring improvement, additional pricing has been outlined for retrofit work. The retrofit considers an existing sheet pile wall with unimproved soils within the location of the quayside deck. Construction of a 33’ deck was then assumed utilizing the soil improvement profiles (hydraulic fill, clay/silt, and sand) as outlined above with the exception of the use of 12” of concrete (in lieu of the asphalt utilized within the laydown yard profiles) and the corresponding increase in depth of the subgrade cut. No subgrade improvements beyond surficial grading/compaction have been considered within these profiles. An additional improvement scenario is provided within Table C-5 where dredging adjacent to an existing quayside sheet pile may compromise the embedment of the existing wall. To protect embedment depth, a new sheet pile wall (at a total height of 30’) was considered to be driven into the seabed (underwater) directly in front of the existing wall. The use of additional piling to strengthen an existing sheet pile wall will require engineering studies to determine specific design parameters and ensure adequate structural integrity of the overall system.
Table C-4: Quayside unit pricing in terms of linear feet of sheet pile wall.
Unit Cost [$/LF] Quayside Wall 2,526
Quayside Deck (new) 869 Quayside Deck (retrofit) – Hydraulic Fill 695
Quayside Deck (retrofit) – Clay/Silt 465 Quayside Deck (retrofit) – Sand 356
Garrad Hassan America, Inc. Page 150 of 153

Document No. 700694-USPO-R-03 Assessment of Ports for Offshore Wind Development in the United States Issue: E Final
Table C-5: Cost for sheet piling only, driven into seabed at toe of existing sheet pile wall (assume 30’ sheet pile wall height and use of dolly pile to accomplish underwater driving).
Unit Cost [$/LF] Sheet Piling 1,500.00
Table C-6: Quayside deck unit pricing in terms of square feet of concrete deck surface area (for use when varying 33’ concrete deck width).
Unit Cost [$/ft2] Quayside Deck (new) 26.33
Quayside Deck (retrofit) – Hydraulic Fill 21.05 Quayside Deck (retrofit) – Clay/Silt 14.09
Quayside Deck (retrofit) – Sand 10.80
Table C-7: Quayside retrofit pricing in terms of cost per square foot per unit strength improvement.
Hydraulic Fill Clay/Silt Sand Required Improvement in Bearing Capacity [lb/ft2] 2,572 1,572 1,072 Unit Pricing per Unit Strength Increase in Bearing Capacity [$/ft2/unit strength increase (lb/ft2)]
0.00818 0.00896 0.0101
Assumptions/Clarifications
To create standardized quayside infrastructure pricing suitable for a variety of port conditions, GL GH assumed multiple factors as follows:
• Tidal Range The difference between low tide and high tides has been assumed as 6’ maximum (tidal ranges vary
by location and reduced low tide levels may necessitate taller sheet pile walls with deeper embedment to provide deeper seabed conditions adjacent to the quayside).
• Concrete blocks (deadman anchors sized as cubes of 48” height, 48” depth, and 48” width) are located 33’ away from the sheet pile wall and are tied back to the wall with threaded anchor rods at 15’ intervals.
• The concrete capping beam is sized at a 40” height, 40” depth, and a width that spans the full length of the sheet pile wall.
• Sheet wall pile segments are assumed to be shore driven.
• Existing Soil Existing sand and clay/silt soil bearing capacities as defined in Table C-1 are assumed parameters
obtained from the 2006 International Building Code and will require confirmation with geotechnical studies.
The bearing strength of existing hydraulic fill soils has been assumed at a value of 500 psf.
• Design Scalability
Garrad Hassan America, Inc. Page 151 of 153

Document No. 700694-USPO-R-03 Assessment of Ports for Offshore Wind Development in the United States Issue: E Final
Unit pricing guidelines are approximations based upon theoretical soil improvement profiles that may be required to support design loads.
Subgrade improvement measures beyond the depth of improvement noted within the soil improvement profiles have not been considered.
Unit pricing is estimated around a narrow set of parameters and is not fully scalable across all soil conditions. As such: The relationship between unit strength improvement and overall improvement cost is not
necessarily linear as different stabilization approaches may be utilized across a range of subgrade strengths.
The cost of improvement for low-strength subgrade soils may follow an exponential cost increase rather than a linear cost increase. Extremely low strength soils may require subgrade ground improvements and result in large cost increases.
The cost of improvement for high-strength subgrade soils would not decrease linearly to zero as high strength subgrade soils must still be prepared and/or supplemented, and paving would still be necessary.
• Excavation Spoil Spoil materials from excavated areas are non-contaminated and require no special disposal criteria. GL GH notes that contaminated soils may be present given the potential of historic use of dredged
materials as hydraulic fill or previous industrial use of the land. Spoil materials will be disposed of for the cost of trucking only assuming that facilities are available to
accept spoil at no cost. Trucking for spoil materials assumes a 20 mile round trip.
• Backfill Gravel is to be delivered via truck from a local quarry within a 10 mile radius (20 mile round trip) of the
Project. Alternatives may be available for more economical transport of aggregate to port locations including
rail, barge, and freighter.
• In the event that dredging could impact the stability of an existing wall, an assumption has been made that stabilization of the existing wall can be performed by installing a new sheet pile wall in front of the existing one. Sheet pile installation into the seabed at the toe of an existing sheet pile wall has been assumed to require under-water pile driving, necessitating use of dolly piles to drive the pile to avoid submerging driving equipment. This additional cost has been estimated at $200/lf and included in Table C-5 above.
• Component handling crane or equipment not included.
• Seabed dredging adjacent to quayside not included.
• Engineering and management costs are not included. Harbor Seabed Improvement The loading, unloading, and assembly of offshore wind turbine components may require the use of jack-up vessels in the harbor adjacent to quayside infrastructure. Seabed improvements consisting of dredging and rock infill may be necessary to improve the bearing capacity of the existing seabed to allow for adequate jack-up vessel stability.
Garrad Hassan America, Inc. Page 152 of 153

Document No. 700694-USPO-R-03 Assessment of Ports for Offshore Wind Development in the United States Issue: E Final
Harbor Dredging and Rock Infill
Seabed conditions can vary widely as a result of regional geology and the deposition of silts, clays, and sands from natural or manmade sources. As a result, soils with suitable strength parameters may be located at varying depths below the seabed. Based on suitable soil conditions located at an assumed depth of 16’ below seabed, improvements including dredging the full 16’ depth and subsequently infilling the remaining void with open graded drainage rock were considered.
Table C-8: Harbor dredge and rock infill unit pricing in terms of surface dredge area.
Unit Cost [$/ft2] Harbor Dredge & Rock Infill 58.95
Table C-9: Harbor dredge (no infill) in terms of dredging volume.
Unit Cost [$/yd3] Harbor Dredge (no infill) 22.79
Assumptions/Clarifications
To create standardized dredge and rock infill pricing suitable for a variety of site conditions, GL GH assumed multiple factors as follows:
• Mechanical dredge equipment is to be utilized for dredging activities.
• Dredged soil materials: Dredged soil materials are non-contaminated and are assumed to be dumped 20 miles at sea in a
manner complying with all applicable regulations. GL GH notes that contaminated soils may be present in the seabed to be dredged as a result of
historical discharge of pollutants into waterways upstream of the port location. Such contamination would require special disposal criteria.
• Rock Infill Gravel is to be delivered via truck from a local quarry within a 10 mile radius (20 mile round trip) of the
Project. Gravel is to be transferred to barges which will convey the gravel from shore to dredge location. Alternatives may be available for more economical transport of aggregate to port locations including
rail, barge, and freighter.
• Engineering and management costs are not included.
Garrad Hassan America, Inc. Page 153 of 153