Assessment of Nutritional Status in Sri Lankan Children ... · Assessment of Nutritional Status in...
50
Assessment of Nutritional Status in Sri Lankan Children: Validity of Anthropometry Cutoffs? Pujitha Wickramasinghe MBBS (Col), DCH, MD (Paed), PhD (Col) Professor in Paediatrics Faculty of Medicine University of Colombo
Transcript of Assessment of Nutritional Status in Sri Lankan Children ... · Assessment of Nutritional Status in...

Assessment of Nutritional Status in Sri Lankan Children: Validity of Anthropometry Cutoffs?
Pujitha WickramasingheMBBS (Col), DCH, MD (Paed), PhD (Col)
Professor in PaediatricsFaculty of Medicine
University of Colombo

142.5 152 183 280.9 273 378 470721
875
1260
2820
3926
56
59.7
63.565
66.268.2 69.1 69.5 69.6
71.1
73.6 73.874.8
40
45
50
55
60
65
70
75
80
0
500
1000
1500
2000
2500
3000
3500
4000
4500
1955 1960 1965 1970 1975 1980 1985 1990 1995 2000 2005 2010 2015
Life
Exp
ect
ancy
(Ye
ars)
GD
P P
er
Cap
ita
(USD
)
Year
GDP Per Capita and Life Expectancy in Sri Lanka 1955 - 2015
GDP per capita Life Expectancy
Source: World Bank database
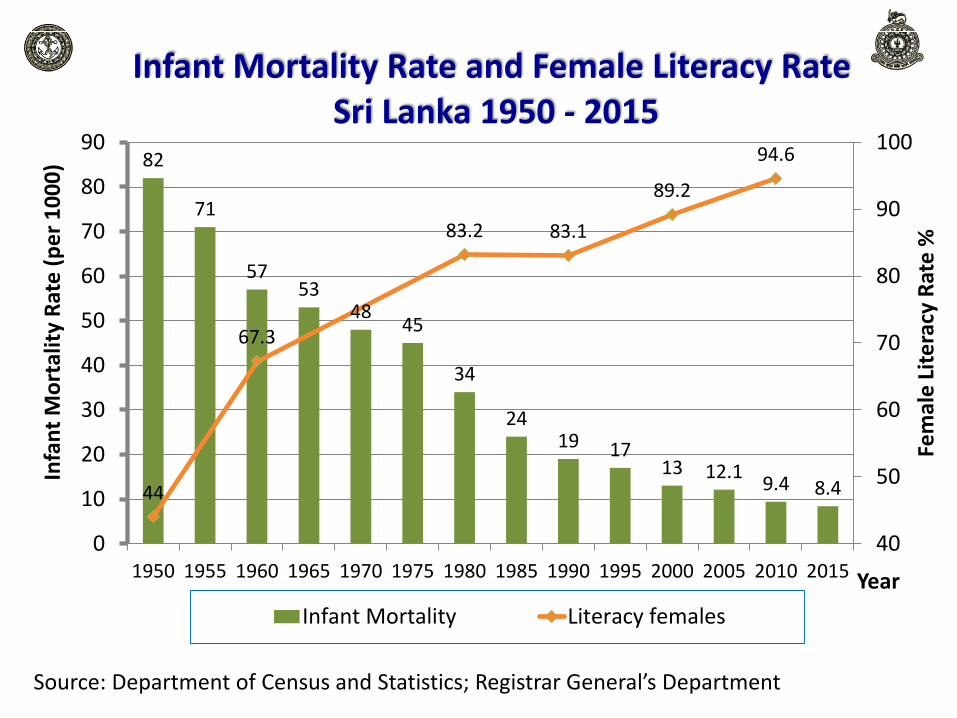
82
71
5753
4845
34
2419 17
13 12.19.4 8.444
67.3
83.2 83.1
89.2
94.6
40
50
60
70
80
90
100
0
10
20
30
40
50
60
70
80
90
1950 1955 1960 1965 1970 1975 1980 1985 1990 1995 2000 2005 2010 2015
Fem
ale
Lit
era
cy R
ate
%
Infa
nt
Mo
rtal
ity
Rat
e (
pe
r 1
00
0)
Year
Infant Mortality Rate and Female Literacy Rate Sri Lanka 1950 - 2015
Infant Mortality Literacy females
Source: Department of Census and Statistics; Registrar General’s Department

Change in Disease Patterns in the World

Source:Epidemiological Unit
51
53
55
57
59
61
63
65
67
69
71
73
75
77
79
81
83
85
87
89
91
93
95
97
99
01
03
Year
0
2
4
6
8
10
12
14
16
Ra
te
p
er 1
00
,0
00
p
op
ula
tio
n
0
10
20
30
40
50
60
70
80
90
100
DP
T3
C
ov
era
ge
(%
)
D
PT3 C
ove ra
g e
EPI
Source:Epidemiological unit
51
53
55
57
59
61
63
65
67
69
71
73
75
77
79
81
83
85
87
89
91
93
95
97
99
01
03
05
Year
0
5
10
15
20
25
Ra
te
p
er 1
00
,0
00
p
op
0
10
20
30
40
50
60
70
80
90
100
DP
T3
C
ov
era
ge
(%
)
D
PT3 C
ove ra
g e
EPI
Source:Epidemiological Unit
51
53
55
57
59
61
63
65
67
69
71
73
75
77
79
81
83
85
87
89
91
93
95
97
99
01
03
05
Year
0
5
10
15
20
Ra
te
p
er 1
00
,0
00
p
op
ula
tio
n
0
10
20
30
40
50
60
70
80
90
100
DP
T3
C
ov
era
ge
(%
)
D
PT3 C
ove ra
g e
EPI
Diptheria
Polio
Source:Epidemiological unit
51
53
55
57
59
61
63
65
67
69
71
73
75
77
79
81
83
85
87
89
91
93
95
97
99
01
03
05
Year
0
20
40
60
80
100
Co
ve
ra
ge
(%
)
0
10
20
30
40
50
60
70
80
90
100
Ra
te
p
er 1
00
,0
00
p
op
Me
a
sle
s C
ove ra g e
Measles
Source:Epidemiological Unit
66
67
68
69
70
71
72
73
74
75
76
77
78
79
80
81
82
83
84
85
86
87
88
89
90
91
92
93
94
95
96
97
98
99
00
01
02
03
04
05
Year
0
50
100
150
200
250
300
Ra
te
pe
r 1
00
,00
0 l
ive
bir
th
s
0
10
20
30
40
50
60
70
80
90
100
% M
oth
ers
p
ro
te
cte
d
% M
o
thers
Pro
tec te dEPI
Neonatal tetanus
Whooping cough
Tetanus
Sri Lanka: Communicable Disease

Sri Lanka: NCD Country Profile 2014 (WHO)
NCDs are estimated to account for 75% of all deaths
World Health Organization, NCD country profile, 2014
Total Population: 21 098 000Income Group: Lower MiddleUrban population: 15.1%Proportion between 30-70 years: 46.7%

Sri Lanka: NCD Country Profile 2014 (WHO)

Sustainable development goals identify prevention and control of NCD as a core priority
Preventing the main risk factor, “obesity” is important
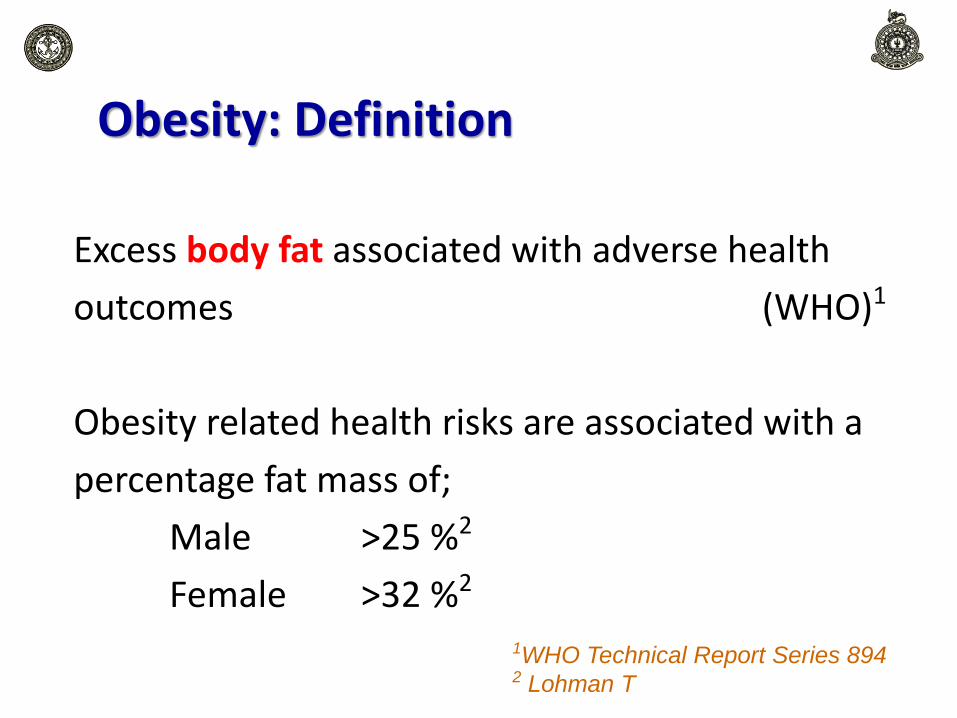
Obesity: Definition
Excess body fat associated with adverse health
outcomes (WHO)1
Obesity related health risks are associated with a
percentage fat mass of;
Male >25 %2
Female >32 %2
1WHO Technical Report Series 8942 Lohman T


ROC curves to determine %FM of MetS
Fat mass associated with MetSMale 28.6%
(sensitivity 88%specificity 87%)
Females 33.7%(sensitivity 83%specificity 79%)
Area Std Error Asymptotic
Sig
Asymptotic 95% Confidence Interval
Lower Bound Upper Bound
Male 0.047 0.017 0.000 0.914 0.980
Female 0.895 0.032 0.001 0.832 0.959
Male Female

Bioelectrical Impedance Analysis (BIA)
Total BodyPotassium (TBK)
Under Water Weighing
“BodPod” Air Displacement Plethysmography
DEXA
MRI
Assessment of Body Composition

Prediction of Body Composition

BMI as a Measure of Obesity…….
• Although FM is the diagnostic yardstick for obesity,
• BMI is used as a surrogate measure
• But validity of universal cutoff points are questionable

- International Obesity Task
Force (IOTF)
- CDC centile charts (CDC 2000)
- British growth standard
BMI-Z Scores
- WHO Growth Standards
(2007)
This is used in the local CHDR
IOTF
CDC charts
British 1990WHO 2007
Different BMI Based Assessment Tools


Identical BMI but significantly different body Fat
The image is a useful reminder of the limitation of BMI as a measure of adiposity across different populations
(The Lancet 2004;64:163)

• Asians have low BMI with high fat mass
Wang et al (1994)
• New Zealand (5-11 years)Fat content compared to European children.
Indian origin ↑4.3%Pacific Islanders ↓1.7%
Duncan et al (2005)
• European Caucasians had 3.8% more fat than AmericanCaucasians. Socio economic environments (of same ethnicorigin) influence body fat Deurenberg et al (1998)
BMI based obesity cutoff should be different for differentpopulations.
Evidence for differences in Body fat

0
10
20
30
40
50
60
70
-10 -5 0 5 10
% F
M
BMI Z
Native Sri Lankan Australian Sri Lankan
White Caucasian Native Sri Lanka
Australian Sri Lankan White Caucasian
BMI-Z Vs %FM
Body Composition, Ethnicity and Socioeconomic Environment
At any given BMI-Z score, native Sri Lankan children had the highest %FM while the Australian Caucasian children had the lowest %FM.
These differences were statistically significant.
This shows that genetics as well as living environment influences body composition.
Modified from Wickramasinghe et al
Ann Hum Biol. 2005:;32: 60-72

BMI as a Surrogate Marker of Body Composition
FM
FM
FM
FFM
FFM
FFM
Ideal Obese Athlete
Could have same BMI but different body compositions
BMI = Mass/Height2
Mass = Fat + Fat free

Anthropometric cutoffs used for
nutritional assessment in Sri Lankan
Children, are they valid?
Are we Feeding and Monitoring the growth
of our children correctly?

Materials & Methods
• Subjects: 5 – 15 year old children from 8 schools in the Education Zone of Negombo, Western Province.
• Sample size 13000 children were screen form the Negombo education zone
• Ethics Obtained from Ethical review committee of Sri Lanka College of Paediatricians

Materials & Methods (cont..)
Anthropometry• Height • Weight• Circumferences
Body composition Assessed using InBody 230 BIA machine
Calculated the;Body Mass Index (BMI) Weight/Height2
(kgm-2) Waist hip ratio (WHR) WC/HCWaist height ration (WHtR) WC/Ht

Distribution of the Study Population
Male
Female
0
1000
2000
3000
4000
5 - 10 yrs10 - 15 yrs
2578 3023
3719 3946
No
of
Ch
ildre
n
Male Female
13266 children werescreened

5 -10 years (n=6297) 11 – 16 years (n=6969)
Nutritional status* Female Male Female Male
Severe wasting<-3SD
122(3.2%)
121(4.7%)
111(2.8%)
186(6.2%)
Wasting-3SD to – 2SD
528(14.2%)
442(17.1%)
385(9.8%)
449(14.9%)
Normal-2SD to +1SD
2596(69.8%)
1694(65.7%)
2748(69.6%)
1860(61.5%)
Overweight+1SD to +2SD
337(9.1%)
172(6.7%)
512(13.0%)
358(11.8%)
Obese>+2SD
136(3.7%)
149(5.8%)
190(4.8%)
170(5.6%)
TOTAL 3719 2578 3946 3023
* Assessed by BMI for Age WHO 2007 standards
Distribution of the Nutritional Status

5 -10 years (n=6297)
11 – 16 years (n=6969)
TOTAL(13266)
Female Male Female Male
High %FM*337
(9.1%)189
(19.6%)1541
(39.1%)694
(22.9%)2761
(20.8%)
WHtR>0.5
163(4.4%)
131(5.1%)
448(11.4%)
484(16.1%)
1226(9.2%)
OverweightØ
+1SD to +2SD
337(9.1%)
172(6.7%)
512(13.0%)
358(11.8%)
1379(10.4%)
ObeseØ
>+2SD
136(3.7%)
149(5.8%)
190(4.8%)
170(5.6%)
645(4.8%)
* %FM >33.7% in females and >28.6% in malesØ Assessed by BMI for Age WHO 2007 standards
Results– Nutritional Status

Prevalence of High Percentage Fat mass according to Birth weight and BMI category in 5-15 years
0.0%
10.0%
20.0%
30.0%
40.0%
50.0%
60.0%
70.0%
80.0%
90.0%
100.0%
<-2 -2 to 0 0 to +1 +1 to +2 >+2
Pre
vale
nce
of
Hig
h %
FM
BMI Z Score
Low Birthweight Normal Birthweight
<-2 -2 to 0 0 to +1 +1 to +2 >+2
Category
High Birthweight
GirlsBoys

Validity of Existing Anthropometric Cut-offs in Diagnosing Obesity in 5-10yrs
Girls Boys
Anthro’ parameter
Cut-off Se Sp Se Sp
BMI
WHO >+2 SD 36% 99.9% 56.7% 99.7%
IOTF 28.4% 100% 31.7% 100%
Wickramas’ 2011
94.2% 95.1% 97% 95.6%
WC
British >+2 SD 42.7% 98.9% 42.1% 98.3%
Wickramas’ 2011
90.2% 89.9% 98.8% 84.1%
WC-Ht Ratio>0.5 37.8% 98.7% 58.5% 99.4%
>0.45 87.6% 83.9% 97% 85.7%

Girls Boys
Anthro’ parameter
Cut-off Se Sp Se Sp
BMI
WHO >+2SD 18% 100% 51.2% 99.9%
IOTF 13.3% 100% 19.5% 100%
Wickramas’2011
96.7% 80% 97.4% 81.2%
WC
British >+2 SD 46.8% 99.3% 62.8% 99.3%
Wickramas’ 2011
90.4% 77.9% 99.5% 62.4%
WC-Ht Ratio>0.5 30.4% 99.4% 63.5% 99.3%
>0.45 70.7% 92.8% 92.8% 91%
Validity of Existing Anthropometric Cut-offs in Diagnosing Obesity in 10 -15 yrs

Ann Hum Biol. 2005:;32: 60-72
CMJ. 2009; 54: 114-9.

What need to be done?
• Revise cutoff to suit the population
• Newer screening methods

5-10 years
10-15 years5-10 years
ROC of selected anthropometric parameters in predicting abnormal %FM (28.6) in Boys
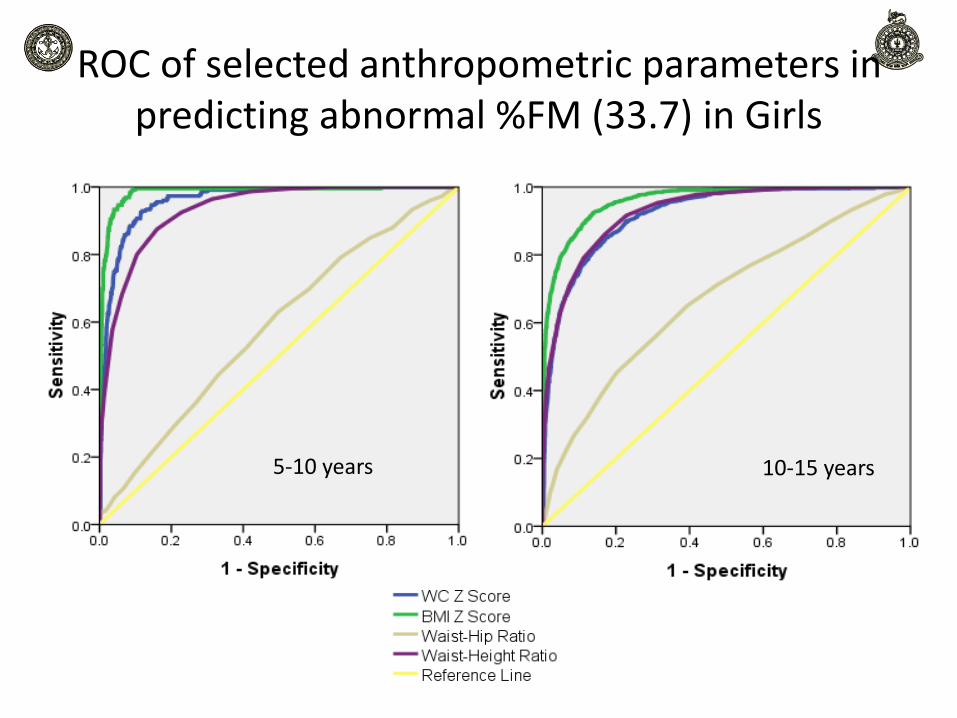
10-15 years5-10 years
ROC of selected anthropometric parameters in predicting abnormal %FM (33.7) in Girls

Established BMI cutoff Compared with the Newly Developed
5
10
15
20
25
30
35
4 6 8 10 12 14 16 18
BM
I (k
g/m
2 )Age (years)
BMI comparable to 25%/ 32% FM
BMI comparable to 28.6% 33.7%FM
5
10
15
20
25
30
35
4 6 8 10 12 14 16 18
BM
I (k
g/m
2 )
Age (years)
BMI comparable to 98th centile FM
IOTF Obesity cutoff
IOTF Over weight cutoff
Boys Girls

Comparison of Cutoff with Available Data
BMI (kgm-2) WC (cm)
Male Female Male female
Katulanda et al (Sri Lanka 2010)
20.7 22.0 76.5 76.3
Razak et al (Canada 2007)
21.0 -
Dudeja et al (India 2001)
21.5 19.0 -
Wickramasinghe et al (Sri Lanka 2011) 19.2 19.7 68.4 70.4
Current Study 24.2 21.5 87.8 70.9
Suggested by WHO(2004)
22.0 – 25.0 -
IDF (2006) - 90 80
It is important to have correct diagnostic tool to Identify Obesity

Obesity cutoffs should be…...........
• Ethnic specific BMI cutoffs ? (Misra 2003)
• Population specific cutoffs? (Stevens 2003)
• BMI cutoff values in Asians for metabolic risk varies between 22 kg/m2 to 25kg/m2
(WHO, Lancet 2004)
Anthropometric cutoff developed based on abiological end point, ie. corresponding to the FMassociated with metabolic complications would be relevantthan a population distribution (statistical) cutoff

Therefore………….
• Ethnicity as well as living environment influences the body composition
• Current BMI based cutoff values are not sensitive detect highbody fat content of Sri Lankan children
• Caution should be exerted when using non-validated growth references
• Anthropometric cutoffs should be developed to detect disease risks
• We cannot ignore the paediatric population

Under-nutrition during perinatal period leads to many adverse outcomes
later in life
(David Barker 1994)
“Fetal Origin of Adult Diseases”
1938 - 2013
“Postnatal Growth Acceleration” hypothesis
Term small for date infants that had
catch up growth showed BP and Fat
Mass at 8 years of age
Singhal & Lucas Circulation.
2007;115:213-220

Evensen E et al. 2016 BMC Pediatrics 16(64)
Overweight/Obesity at 5-7 yrs Overweight/Obesity at 15-17 yrs
Crude Adjusted Crude Adjusted
Age Weight class
% OR 95%CI OR 95%CI % OR 95%CI OR 95%CI
2-4
Thin/Normal
1.0 1.0 1.0 1.0
Owt/Obese
52.5 11.6 6.4-21.0 11.0 6.0-21.0 39.3 3.0 1.7-5.3 3.2 1.8-5.6
5-7
Thin/Normal
1.0 1.0
Owt/Obese
63.0 11.1 6.4-19.2 12.1 6.9-21.4
Effects of Childhood Obesity on Later Obesity

<10% of NORMAL weight children
Becomes OBESE Adults
>75% of OBESE children
Becomes OBESE Adults
Freedman DS et al, Relationship of Childhood Obesity to Coronary Heart Disease Risk Factors in Adulthood: The Bogalusa Heart Study.
Pediatrics 2001;108:712-8

Obesity has the potential to negate many of the health benefits that have contributed to increase of life expectancy
Consequence on Long Term Health


On the contrary…......
• Does lack of appropriate anthropometric tools affect our children?
• Would it lead to the development of Overweight/Obesity?

13.9 13.911.6 11.6
15.512.8 13.5 14.2 12.6 11.7 13.1
57.354.3
43
37.3 37.7
30.7 29
20.916.3
21.6 23.5
49.9
44.6
36.2
27.223.8 16.1 13.5 16.7
15.6 19.2 19.6
0
10
20
30
40
50
60
70
1975 1977 1980 1987 1993 1995 2000 2006 2008 2009 2012
Pre
vale
nce
%
Year
Prevalence of Underweight, Stunting and Wasting in Sri Lanka (<5 yrs)
1975 - 2012
Wasting Underweight Stunting
Source: Medical Research Institute, 2002; Demographic Health Survey 2006/07; National Food Security Assessment 2009; Sri Lanka Complementary Feeding Study; National Nutrient and Micronutrient Survey 2012

42.2
39.8
32.0 31.633.5
27.8 28.126.5
28.427.8
30.2
25.2
22.124.2
20.7 19.918.4
20.0
2.3 1.8 1.4 2.3 2.5 3.0 4.1 3.8 4.2
3.52.0 2.1 3.0 3.4 4.3 4.8 5.0 4.9
0.0
5.0
10.0
15.0
20.0
25.0
30.0
35.0
40.0
45.0
2007 2008 2009 2010 2011 2012 2013 2014 2015
Pe
rce
nta
gePrevalence of wasting and overweight in Sri
Lanka 2007-2015 (14 yrs)
Low BMI Boys Low BMI Girls Overweight Boys Overweight Girls
Source: School & Adolescent Health Unit, Family Health Bureau

Distribution of children with adverselyhigh %FM in each BMI for age SDcategory in 5 ≤ to <10 and 10≤ to <15year age groups, by gender
5 ≤ to <10 year Category 10≤ to <15 year old category
Male
(>25%FM)
Female
(>32%FM)
Male
(>25%FM)Female (>32%FM)
SD Category N % N % N % N %
1. < -3 1 11.1% 1 33.3% 0 0% 4100.0
%
2 -3--2 2 15.4% 2 50.0% 2 25.0% 2 33.3%
3. -2--1 2 8.0% 8 66.7% 4 30.8% 8 72.7%
4. -1- 0 3 23.1% 3 50.0% 7 63.6% 7 50.0%
5. 0 -+1 6 60.0% 14 87.5% 9 81.8% 14 73.7%
6. 1-+2 9 69.2% 5 62.5% 14 100.0% 9 90.0%
7. 2-+3 7 87.5% 6 100% 6 75.0% 4 80.0%
8. +3 2 66.7% 1 100% - - 1100.0
%
Total 62 34.0% 40 71.4% 42 61.8% 49 70.0%
Note: the highlighted area show the ‘suggested normal range’ of the parameter for Sri Lankan children

• Are we over diagnosing stunting/wasting and under diagnosing overweight/obesity?
• What would be the health and economicimplication of this?
• These need to be discussed and resolved at scientific, managerial and policy formulating circles.

CONCLUSION
• Sri Lankan /South Asia populations have a different body composition
• it’s important to have appropriate anthropometric cutoff values thus enabling early detection of unhealthy body composition (in children).
• Anthropometric cutoff values should suit the population / ethnic group and not be mere ‘universal’ value

We, who care for
health, have a great
responsibility in the
prevention of NCDs in
the next generation

Acknowledgements
• Warnakulasuriya LS (Post Graduate Institute of Medicine (Trainee), Universityof Colombo), Fernando MAM & Thawfeek ARM (Colombo North TeachingHospital, Ragama), Adikaram AVN (Health Unit, Bandaranayake InternationalAirport, Katunayake), Anurasiri WML (District General Hospital, Negombo), SilvaKDRR & Sirasa MSF (Wayamba University), Samaranayake D (Department ofCommunity Medicine, University of Colombo).
• Mr Sheran Weerasinghe (site Manager) and all research assistance
• All children who participated in the study
• The study was funded by an educational grant from Lions ClubNegambo Host, Negambo, Sri Lanka.