
Assessment of Natural Gas and Electric Distribution ...
28
Assessment of Natural Gas and Electric Distribution Service Reliability Report Issued: July 19, 2018 Project Team William Liss Patricia Rowley Gas Technology Institute 1700 S. Mount Prospect Rd. Des Plaines, Illinois 60018 www.gastechnology.org GTI TOPICAL REPORT
Transcript of Assessment of Natural Gas and Electric Distribution ...

Assessment of Natural Gas and Electric Distribution Service Reliability
Report Issued: July 19, 2018
Project Team William Liss Patricia Rowley
Gas Technology Institute 1700 S. Mount Prospect Rd.
Des Plaines, Illinois 60018
www.gastechnology.org
GTI TOPICAL REPORT

Assessment of Natural Gas and Electric Distribution Service Reliability Page ii
Legal Notice
This information was prepared by Gas Technology Institute (“GTI”). Neither GTI, the members of GTI,
the Sponsor(s), nor any person acting on behalf of any of them:
a. Makes any warranty or representation, express or implied with respect to the accuracy, completeness,
or usefulness of the information contained in this report, or that the use of any information, apparatus,
method, or process disclosed in this report may not infringe privately-owned rights. Inasmuch as this
project is experimental in nature, the technical information, results, or conclusions cannot be predicted.
Conclusions and analysis of results by GTI represent GTI's opinion based on inferences from
measurements and empirical relationships, which inferences and assumptions are not infallible, and with
respect to which competent specialists may differ.
b. Assumes any liability with respect to the use of, or for any and all damages resulting from the use of,
any information, apparatus, method, or process disclosed in this report; any other use of, or reliance on,
this report by any third party is at the third party's sole risk.
c. The results within this report relate only to the items tested.
Assessment of Natural Gas and Electric Distribution Service Reliability Page iii
Table of Contents
Page Legal Notice ................................................................................................................................ ii
Table of Contents ....................................................................................................................... iii
Table of Tables .......................................................................................................................... iv
Table of Figures ......................................................................................................................... iv
Executive Summary ................................................................................................................... 1
Introduction and Background ..................................................................................................... 3
Natural Gas Distribution Service Survey .................................................................................... 8
Energy Distribution Service Reliability: Results and Discussions ..............................................10
Role for Natural Gas as a Cost-Effective and Clean Reliability and Resilience Solution ............18
Conclusions ..............................................................................................................................21
References ...............................................................................................................................23
List of Acronyms .......................................................................................................................24

Assessment of Natural Gas and Electric Distribution Service Reliability Page iv
Table of Tables
Page Table 1: Summary Energy Distribution Reliability and Outage Rate Results .............................. 1
Table 2: IEEE 1366 Electric Distribution Reliability Indices ........................................................ 7
Table 3: Natural Gas Distribution System Reliability Data Summary .........................................10
Table 4: Natural Gas Distribution System Reliability Data Comparison .....................................11
Table 5: Summary of Natural Gas Distribution Reliability by Company .....................................12
Table 6: Electric Distribution System Reliability Data Summary ................................................13
Table 7: Summary of Electric Distribution Reliability by Company .............................................14
Table 8: Summary Energy Distribution Reliability and Outage Rate Results .............................21
Table of Figures
Page Figure 1: Natural Gas System Safety and Reliability .................................................................. 1
Figure 2: Energy Distribution Reliability and Outage Rate Comparison ...................................... 2
Figure 3: Natural Gas System Safety and Reliability .................................................................. 3
Figure 4: Growing Role of Natural Gas Power Generation ......................................................... 4
Figure 5: U.S. Department of Transportation Data on Serious Pipeline Incidents (2005-2016) ... 4
Figure 6: Common Ground Alliance Damage Incident Data ....................................................... 5
Figure 7: State-Level Natural Gas Incident Rate (CGA Data; 2016) ........................................... 6
Figure 8: Natural Gas Distribution Service Reliability Survey ..................................................... 8
Figure 9: Natural Gas Distribution Service Reliability ................................................................10
Figure 10: Natural Gas Distribution Service Annual Outage Rate .............................................11
Figure 11: Electric Distribution Service Reliability ......................................................................13
Figure 12: Electric Distribution Service Annual Outage Rate .....................................................14
Figure 13: Comparison of Natural Gas and Electric Service Reliability (ASAI) ..........................16
Figure 14: Comparison of Natural Gas and Electric Annual Outage Rates ................................17
Figure 15: North American Production of Natural Gas and LPG Generator Sets .......................18
Figure 16: Example Residential and Commercial/Industrial Natural Gas Generator Sets ..........19
Figure 17: Natural Gas vs Diesel Generator Set Lifecycle Cost Calculator ................................19
Figure 18: Energy Distribution Reliability and Outage Rate Comparison ...................................21
Assessment of Natural Gas and Electric Distribution Service Reliability Page 1
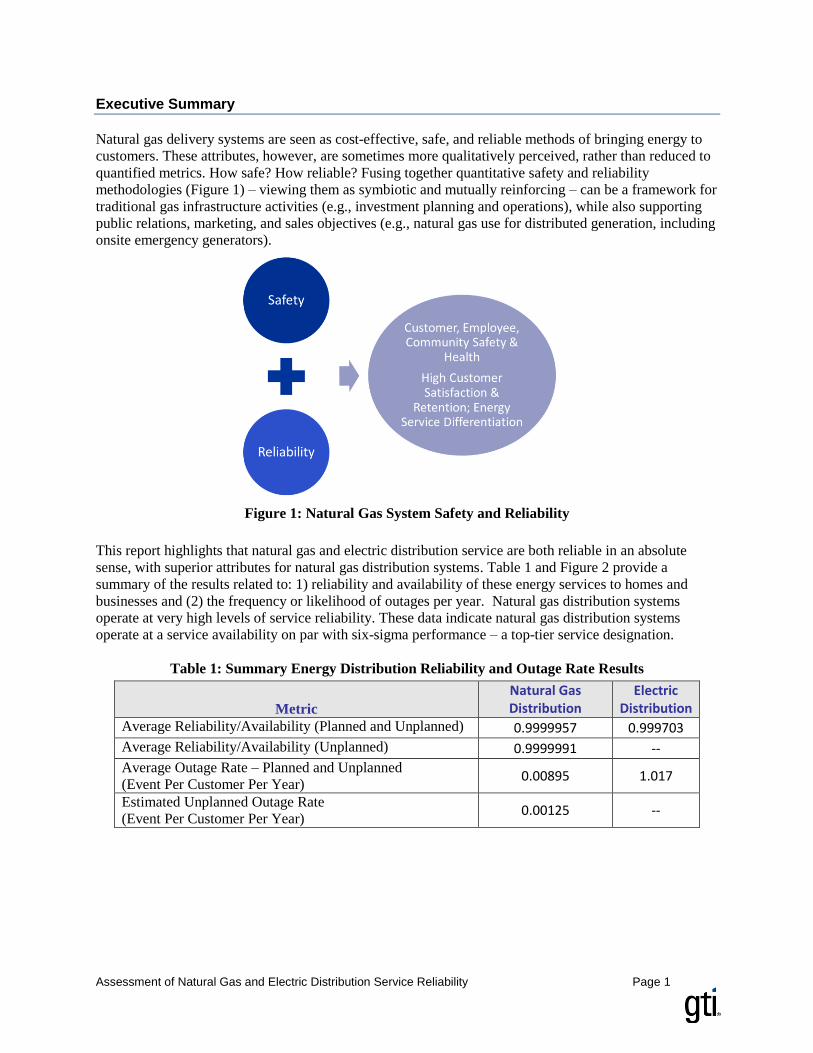
Executive Summary
Natural gas delivery systems are seen as cost-effective, safe, and reliable methods of bringing energy to
customers. These attributes, however, are sometimes more qualitatively perceived, rather than reduced to
quantified metrics. How safe? How reliable? Fusing together quantitative safety and reliability
methodologies (Figure 1) – viewing them as symbiotic and mutually reinforcing – can be a framework for
traditional gas infrastructure activities (e.g., investment planning and operations), while also supporting
public relations, marketing, and sales objectives (e.g., natural gas use for distributed generation, including
onsite emergency generators).
Figure 1: Natural Gas System Safety and Reliability
This report highlights that natural gas and electric distribution service are both reliable in an absolute
sense, with superior attributes for natural gas distribution systems. Table 1 and Figure 2 provide a
summary of the results related to: 1) reliability and availability of these energy services to homes and
businesses and (2) the frequency or likelihood of outages per year. Natural gas distribution systems
operate at very high levels of service reliability. These data indicate natural gas distribution systems
operate at a service availability on par with six-sigma performance – a top-tier service designation.
Table 1: Summary Energy Distribution Reliability and Outage Rate Results
Metric
Natural Gas Distribution
Electric Distribution
Average Reliability/Availability (Planned and Unplanned) 0.9999957 0.999703
Average Reliability/Availability (Unplanned) 0.9999991 --
Average Outage Rate – Planned and Unplanned
(Event Per Customer Per Year) 0.00895 1.017
Estimated Unplanned Outage Rate
(Event Per Customer Per Year) 0.00125 --

Assessment of Natural Gas and Electric Distribution Service Reliability Page 2
Figure 2: Energy Distribution Reliability and Outage Rate Comparison
Natural gas service disruptions are rare. On average, only 1 in 112 customers are expected to experience
an outage (planned or unplanned) in any given year. Most natural gas outages are for planned equipment
replacement. Unplanned outages affect about 1 in 800 natural gas customers per year. By comparison,
electric distribution systems have between four and five sigma reliability performance, with an average of
one outage per year per customer.
While not specifically quantified in this report, anecdotal experience indicates most electric distribution
outages occur due to unplanned impacts such as severe weather; in contrast, most natural gas outages are
due to planned maintenance and gas systems often remain operational during extreme weather events. In
most regions, North American natural gas distribution systems should have intrinsic reliability levels
equal to, or better than, onsite liquid fuel storage – a key consideration for emergency and standby
generators. In earthquake prone regions, further assessment may be needed, while noting there are
pipeline construction methods that minimize pipeline damage during earthquakes.
Natural gas industry improvement efforts should seek to fuse together safety and reliability as mutually
reinforcing concepts. While natural gas distribution service is reliable and exhibits very low outage rates,
there are pathways for continuous improvement to raise service reliability and lower outage rates.
Examples include methods and techniques to replace residential meters or underground pipeline and
assets by using onsite supplemental natural gas supply (e.g., compressed gas cylinders or trailers) to
homes or businesses. Improved methods for identification of the location of underground natural gas
systems and enhanced effectiveness of 811 one-call centers can also result in avoidance of excavation
damage – a leading contributor to unplanned natural gas outages.
Future efforts should look to revisit and update this natural gas distribution reliability assessment. Gas
distribution operators are encouraged to enhance their information systems to include tracking of planned
and unplanned outage events and, to the extent possible, customer outage time per event.

Assessment of Natural Gas and Electric Distribution Service Reliability Page 3
Introduction and Background
Natural gas delivery systems are generally viewed as cost-effective, safe, and reliable methods of bringing
energy to customers. These attributes, however, are sometimes more qualitatively perceived, rather than
reduced to quantified metrics. How safe? How reliable? Where can improvements be made? Do
customers and other stakeholders understand and place appropriate value on natural gas system
reliability?
On process improvement, W. Edwards Deming stated: if you can’t measure it, you can’t manage it. There
is a growing trend toward employing approaches such as quantitative risk analysis (QRA) for natural gas
system safety. Process reliability and quality control principles (e.g., “six sigma”) are congruent with
quantitative safety and risk management methodologies – albeit viewed from a slightly different
perspective.
The term six sigma (6, or 6 standard deviations) is used in manufacturing, process improvement, and
quality management to denote top-tier quality and reliability. Technically, Six Sigma is a Motorola
trademark that pertains to a set of tools and techniques for process improvement, but the term is widely
used in industry. Broadly, six sigma is the ability of a “process” to produce output within specifications
and with less than 3.4 defects per million units produced. Processes that operate with six sigma quality are
statistically expected to be 99.9997% reliable, free of defects, etc. For manufacturing, it is often tied to the
number of defective parts per million made. The six sigma concept can be applied to service quality as
well – for example, the annual reliability or availability of natural gas or electric energy delivery service
to customers.
Fusing together quantitative safety and reliability methodologies (Figure 3) – viewing them as symbiotic
and mutually reinforcing – can be a framework for traditional gas infrastructure activities such as
investment planning, system engineering, and operations, while also supporting public relations,
marketing, and sales objectives. For example, quantified energy delivery service metrics can inform and
improve gas operations while also enhancing customer and community-facing business outcomes such as
elevating customer satisfaction, improving brand perception, and ensuring differentiation against potential
substitute energy options (e.g., electricity).
Figure 3: Natural Gas System Safety and Reliability

Assessment of Natural Gas and Electric Distribution Service Reliability Page 4
Energy delivery system reliability and resilience is gaining attention. One reason is the growing focus on
natural gas and electricity interdependence in the United States (U.S.). Since 2000, U.S. natural gas power
generation (Figure 4) has grown from 15% to approximately 32% of the overall U.S. power generation
mix. Importantly, natural gas serves as the primary resource for meeting critical peak electric demand.
Figure 4: Growing Role of Natural Gas Power Generation
In this context, it is feasible natural gas delivery system reliability may receive greater attention and
possibly foster tracking metrics similar to those incorporated into the Institute of Electrical and Electronic
Engineers (IEEE) 1366 Guide for Electric Power Distribution Reliability Indices.
A wide range of factors – including natural phenomena (e.g., weather or earthquakes), material failure,
and human activity – can cause energy delivery system service interruptions. In the U.S., there are two
primary public sources of incidents affecting natural gas pipelines: U.S. Department of Transportation
(USDOT) and the Common Ground Alliance (CGA). Figure 5 shows USDOT data, in Pareto chart form,
on the primary factors that contributed to U.S. gas distribution and transmission serious incidents since
2005; there are specific USDOT criteria for what constitutes a serious incident.
Figure 5: U.S. Department of Transportation Data on Serious Pipeline Incidents (2005-2016)

Assessment of Natural Gas and Electric Distribution Service Reliability Page 5
The CGA maintains a database of reported incidents leading to damage across a wide range of
underground services such as natural gas, electrical, telecommunications, cable, etc. Figure 6 shows
example 2016 CGA data on causes of damage and the types of utility service impacted. In 2016, natural
gas assets experienced the second largest amount of economic damage, involving over 86,000 different
incidents. Most incidents are due to excavation activity (e.g., when equipment operators or property
owners dig into underground assets).
Figure 6: Common Ground Alliance Damage Incident Data

Assessment of Natural Gas and Electric Distribution Service Reliability Page 6
Note that the number of natural gas incidents reported by CGA in 2016 is appreciably larger (over 86,000
incidents) than the number of serious incidents in the USDOT database. For example, USDOT reports
include about 1,500 serious natural gas distribution incidents from 2005-2016, averaging about 125 per
year. This is about 0.15% of the number of CGA-reported incidents in 2016. This indicates most natural
gas incidents are relatively limited in terms of impact to people or economic damage – nominally one
serious incident per 700 overall incidents. The goal from a safety and reliability viewpoint is to drive both
of these numbers downward.
Figure 7 shows state-level CGA natural gas incident data, normalized by the number of residential natural
gas customers in the state, within a +/- 3 standard deviation range. This view of the data has limitations.
There may be commercial and industrial customers impacted by an incident within the CGA database or
there may be incidents not captured by CGA. With these caveats, the data provide a proximate incident
rate metric that should correspond with natural gas customer unplanned outage rates.
Figure 7: State-Level Natural Gas Incident Rate (CGA Data; 2016)
In statistical process control theory, 99.7% of measurements should randomly distribute within +/- three
standard deviations of the mean. One way of visually displaying this is a Process Control Chart; Figure 7
is an example of this type of chart. State-level gas incident data are consistent with this concept,
indicating no states falling outside a +/- 3-standard deviation range. There are generally less than 0.004
incidents per residential customer per year based on this CGA incident database, with an average around
0.00135 incidents per residential customer per year. The inverse of this unplanned incident rate implies:
An individual customer might experience an unplanned natural gas service disruption once every
740 years or
About 1 in 740 customers could experience an unplanned natural gas service incident in any
given year.
Reliability and associated concepts are quantitative metrics; they can be measured and monitored. The
IEEE 1366 Guide for Electric Power Distribution Reliability Indices provides a methodology for
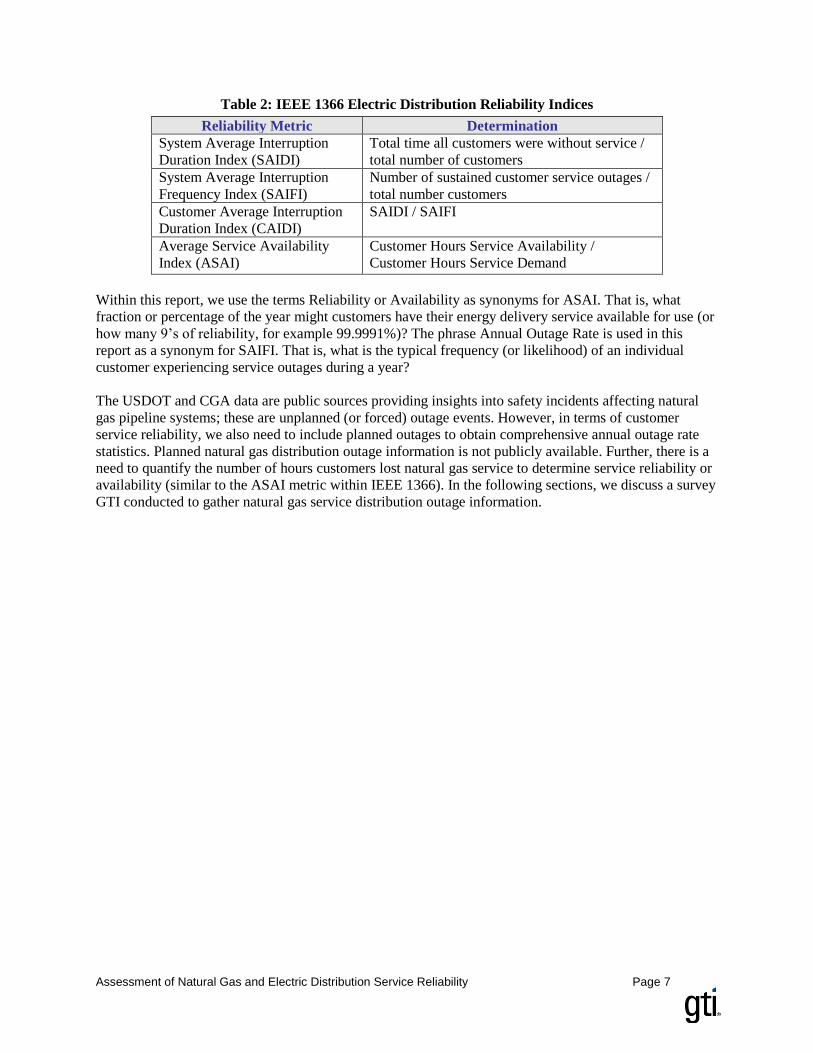
ascertaining electric distribution system reliability indices. Several IEEE 1366 metrics are illustrated in
Table 2.
Assessment of Natural Gas and Electric Distribution Service Reliability Page 7
Table 2: IEEE 1366 Electric Distribution Reliability Indices
Reliability Metric Determination
System Average Interruption
Duration Index (SAIDI)
Total time all customers were without service /
total number of customers
System Average Interruption
Frequency Index (SAIFI)
Number of sustained customer service outages /
total number customers
Customer Average Interruption
Duration Index (CAIDI)
SAIDI / SAIFI
Average Service Availability
Index (ASAI)
Customer Hours Service Availability /
Customer Hours Service Demand
Within this report, we use the terms Reliability or Availability as synonyms for ASAI. That is, what
fraction or percentage of the year might customers have their energy delivery service available for use (or
how many 9’s of reliability, for example 99.9991%)? The phrase Annual Outage Rate is used in this
report as a synonym for SAIFI. That is, what is the typical frequency (or likelihood) of an individual
customer experiencing service outages during a year?
The USDOT and CGA data are public sources providing insights into safety incidents affecting natural
gas pipeline systems; these are unplanned (or forced) outage events. However, in terms of customer
service reliability, we also need to include planned outages to obtain comprehensive annual outage rate
statistics. Planned natural gas distribution outage information is not publicly available. Further, there is a
need to quantify the number of hours customers lost natural gas service to determine service reliability or
availability (similar to the ASAI metric within IEEE 1366). In the following sections, we discuss a survey
GTI conducted to gather natural gas service distribution outage information.

Assessment of Natural Gas and Electric Distribution Service Reliability Page 8
Natural Gas Distribution Service Survey
In an effort to quantify natural gas distribution service reliability and outage rate, GTI undertook a survey
of several North American natural gas distribution operators. The intent was to gather information on:
Number of annual service outages (planned and unplanned, in separate categories if available)
Number of lost service hours due to outages (actual or best engineering estimates)
Figure 8 shows the survey questionnaire.
Figure 8: Natural Gas Distribution Service Reliability Survey
With these survey results, the goal is to:
Provide statistical data to quantify the outage rates and service availability for natural gas
distribution operations
Use these data to enable a comparison of natural gas and electric distribution service reliability
Make quantitative data available to inform codes and standards making processes, specifying
engineers, end users, and other stakeholders with respect to the reliability of using natural gas as
a fuel source for emergency generators in lieu of diesel or other onsite stored fuels
In prior discussions with natural gas distribution operators, it appeared evident that outage information
was available, but that tracking outage hours was less probable. For this reason, the survey included the
option for providing an engineering estimate of outage hours.
In advance of the survey, a gas distribution company provided GTI an example reliability tracking report.
This used an engineering estimate of 8 hours to approximate outage duration per event. From this, the
total number of outages was multiplied by 8 hours to obtain the total number of customer outage hours. In
the context of planned outages, a value of 8 hours is likely a reasonable and, perhaps, conservative
estimate. For example, during a common process of replacing a residential customer meter and regulator
set, the actual outage time may only last one or two hours (though more time may be needed in preparing
equipment for replacement). If not included in the survey response, an 8-hour outage time per event
engineering estimate was used by GTI.
Unlike planned outages, unplanned outages would undoubtedly vary in length depending on the extent
and nature of the infrastructure impacted. In rare instances, such as extreme events like an earthquake, the
extent and duration of outage time may be extensive and fall into a major event –a category defined
within IEEE 1366. Due to the fundamental differences between unplanned and planned outages, the
survey aimed to quantify these two outage categories. From a customer perspective, an unplanned outage
is likely more significant than a planned outage. For example, planned outages are scheduled in advance
and provide customers the opportunity to make contingency plans to minimize disruption to their home or
businesses. Further, planned outages would not likely take place during more cold weather periods when
natural gas service is critically important. The CGA incident data, discussed previously, provides a
secondary source for estimating unplanned outage rates.
If available If available If availableIf applicable,
place an X If available If availableIf applicable,
place an X
1. Calendar Year
for Data
Reporting
2. Total Number
of Customers
Served
3. Total Number
of Calendar
Year Outages
3a. Number of
Single Customer
Outages
3b. Number of
Multiple
Customer
Outages
4. Total Number
of Customers
Impacted
4a. Based on
Engineering
Estimate
4b. Total
Number of
Planned
Customer
Outages
5. Actual or
Estimated Total
Calendar Year
Customer
Outage Hours
5a. Based on
Engineering
Estimate
Residential
Commercial

Assessment of Natural Gas and Electric Distribution Service Reliability Page 9
Survey respondents were informed to exclude interruptible customer events. That is, during extreme
demand periods a select number of larger customers may have natural gas service interrupted. These
interruptible customers – as compared to firm-rate customers – make an economic decision to allow
natural gas service suspension during times of high demand. Interruptible service outages are
categorically different from service outages due to an unplanned or planned event. In addition, the
primary focus of this survey is on core residential and commercial customers who would not likely be on
interruptible natural gas service.
A question was raised by one company about outages related to safety concerns. For example, outages
that occur when service is shutoff due to reports of natural gas within a building. Guidance was provided
to include this type of outage if the cause was due to natural gas assets within the jurisdiction of the
natural gas pipeline operator. Safety-related outages due to downstream piping or equipment in the
building could be excluded (which would be similar to excluding an electrical breaker outage within a
building). This would be technically outside the natural gas distribution service responsibility.
Companies could also include these events regardless of the cause of the incident. In either case, this is
expected to be a small number of incidents and would not materially affect the results.

Assessment of Natural Gas and Electric Distribution Service Reliability Page 10
Energy Distribution Service Reliability: Results and Discussions
Natural Gas Distribution Service Reliability
GTI received survey responses from twelve North American natural gas distribution companies. Table 3
provides a summary of the survey input. This encompassed about 10.5 million natural gas customers –
mainly residential and commercial, with some industrial customers. Four of the companies had one
million or greater customers and six had less than one million customers. Some respondents provided data
for multiple years.
Table 3: Natural Gas Distribution System Reliability Data Summary
Number of Companies 12
Number of Companies-Years 22
Approximate Number of Customers 10,462,000
Average Reliability/Availability
(Planned and Unplanned Outages) 0.9999942
Average Reliability/Availability
(Unplanned Outages) 0.9999978
Average Outage Rate – Planned and Unplanned
(Event Per Customer Per Year) 0.0159
Estimated Unplanned Outage Rate
(Event Per Customer Per Year) 0.00234 (survey)
(0.00135, CGA data)
Figure 9 and Figure 10 summarize the natural gas service reliability and annual outage rate data,
respectively. Outage rates include planned and unplanned outage events – shown separately when both
were available. Figure 10 also includes the 2016 CGA data finding of a 0.00135 incident rate per
residential customer per year. Based on this limited sample, the unplanned outage rate information from
the survey is consistent with the 2016 CGA incident rate.
Figure 9: Natural Gas Distribution Service Reliability

Assessment of Natural Gas and Electric Distribution Service Reliability Page 11
Figure 10: Natural Gas Distribution Service Annual Outage Rate
Some companies had notably higher annual outage rates (planned and unplanned). In these instances,
their unplanned outage rate is consistent with expectations, but the planned activity outage rate is higher.
This likely indicates companies that are replacing equipment (e.g., main and services or replacing
residential meter sets) at an appreciable rate as part of system modernization and accelerated replacement
programs.
As noted previously, the reliability data includes in most cases an estimate of outage hours per event (e.g.,
8 hours). Currently, most natural gas distribution operators do not track outage event duration. In most
cases, an 8-hour outage assumption is used to estimate outage time. Table 4 shows the impact on
calculated reliability using an 8-hour and 24-hour outage assumption; the difference is small due to the
low outage rates for natural gas distribution service.
Table 4: Natural Gas Distribution System Reliability Data Comparison
Average Reliability/Availability (8 hour assumption) 0.9999942 Average Reliability/Availability (24 hour assumption) 0.9999902
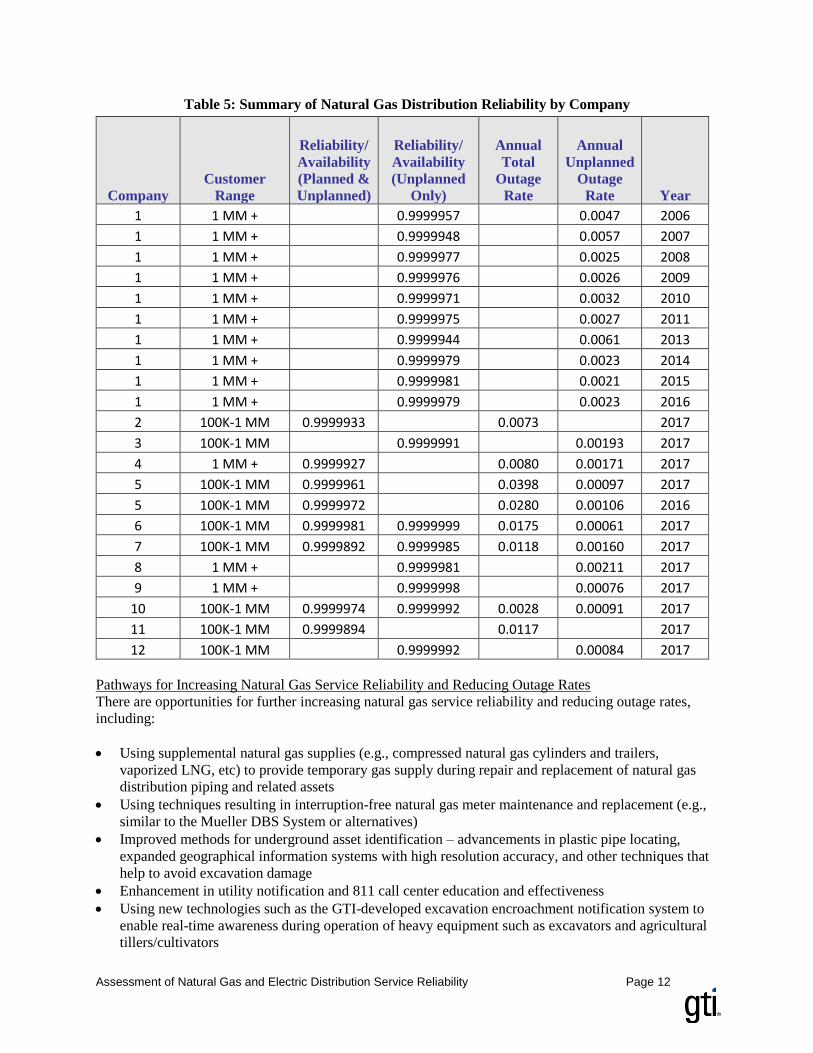
Table 5 provides a summary of the natural gas distribution company data.
Assessment of Natural Gas and Electric Distribution Service Reliability Page 12
Table 5: Summary of Natural Gas Distribution Reliability by Company
Company
Customer
Range
Reliability/
Availability
(Planned &
Unplanned)
Reliability/
Availability
(Unplanned
Only)
Annual
Total
Outage
Rate
Annual
Unplanned
Outage
Rate Year
1 1 MM + 0.9999957 0.0047 2006
1 1 MM + 0.9999948 0.0057 2007
1 1 MM + 0.9999977 0.0025 2008
1 1 MM + 0.9999976 0.0026 2009
1 1 MM + 0.9999971 0.0032 2010
1 1 MM + 0.9999975 0.0027 2011
1 1 MM + 0.9999944 0.0061 2013
1 1 MM + 0.9999979 0.0023 2014
1 1 MM + 0.9999981 0.0021 2015
1 1 MM + 0.9999979 0.0023 2016
2 100K-1 MM 0.9999933 0.0073 2017
3 100K-1 MM 0.9999991 0.00193 2017
4 1 MM + 0.9999927 0.0080 0.00171 2017
5 100K-1 MM 0.9999961 0.0398 0.00097 2017
5 100K-1 MM 0.9999972 0.0280 0.00106 2016
6 100K-1 MM 0.9999981 0.9999999 0.0175 0.00061 2017
7 100K-1 MM 0.9999892 0.9999985 0.0118 0.00160 2017
8 1 MM + 0.9999981 0.00211 2017
9 1 MM + 0.9999998 0.00076 2017
10 100K-1 MM 0.9999974 0.9999992 0.0028 0.00091 2017
11 100K-1 MM 0.9999894 0.0117 2017
12 100K-1 MM 0.9999992 0.00084 2017
Pathways for Increasing Natural Gas Service Reliability and Reducing Outage Rates
There are opportunities for further increasing natural gas service reliability and reducing outage rates,
including:
Using supplemental natural gas supplies (e.g., compressed natural gas cylinders and trailers,
vaporized LNG, etc) to provide temporary gas supply during repair and replacement of natural gas
distribution piping and related assets
Using techniques resulting in interruption-free natural gas meter maintenance and replacement (e.g.,
similar to the Mueller DBS System or alternatives)
Improved methods for underground asset identification – advancements in plastic pipe locating,
expanded geographical information systems with high resolution accuracy, and other techniques that
help to avoid excavation damage
Enhancement in utility notification and 811 call center education and effectiveness
Using new technologies such as the GTI-developed excavation encroachment notification system to
enable real-time awareness during operation of heavy equipment such as excavators and agricultural
tillers/cultivators

Assessment of Natural Gas and Electric Distribution Service Reliability Page 13
Electric Distribution Service Reliability
For comparison, GTI assembled a representative set of electric distribution service reliability statistics.
Several state public utility organizations require annual reporting of these data, typically using the IEEE
1366 methodology; these data are available online. Summary GTI-collated electric distribution statistics
are shown in Table 6. This encompasses nine electric distribution service operators and sixty company-
years (for example, includes data from 11 years from some companies). These data are from electric
distribution operators in California, New York, Massachusetts, Illinois, and Oregon.
Table 6: Electric Distribution System Reliability Data Summary
Number of Companies 9
Number of Companies-Years 60 Average Reliability/Availability 0.999703 Average Outage Rate (Event Per Customer Per Year) 1.017
Figure 11: Electric Distribution Service Reliability
Assessment of Natural Gas and Electric Distribution Service Reliability Page 14
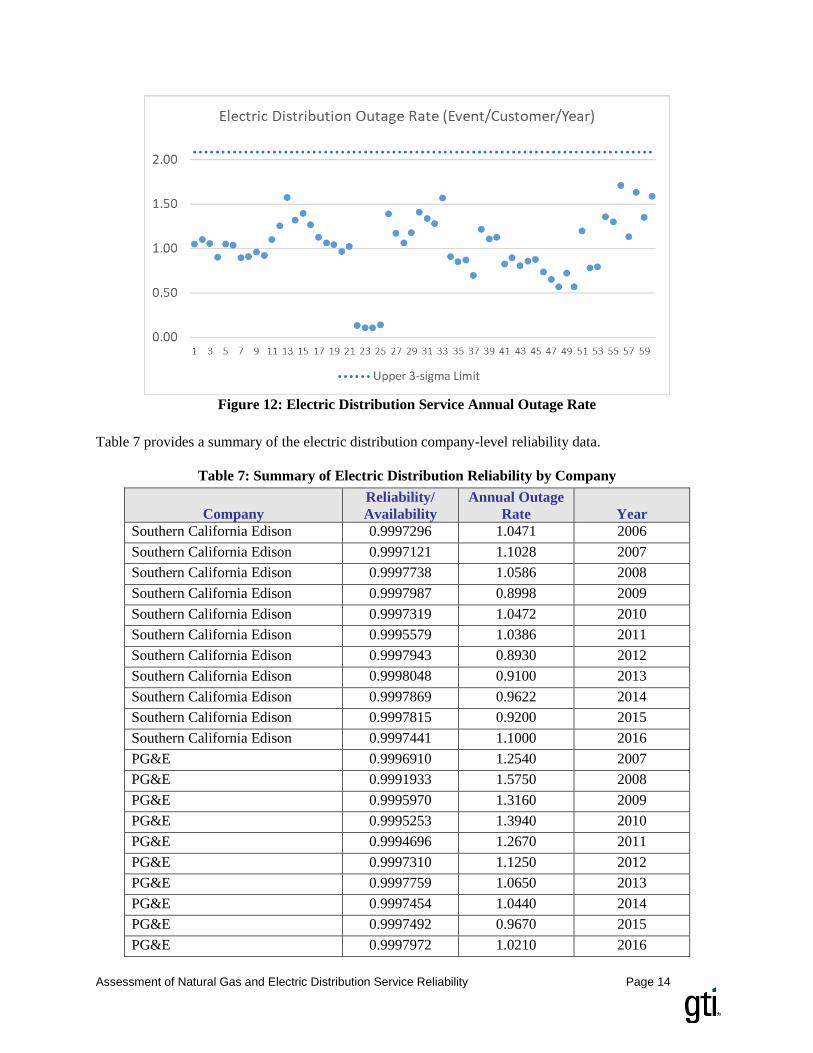
Figure 12: Electric Distribution Service Annual Outage Rate
Table 7 provides a summary of the electric distribution company-level reliability data.
Table 7: Summary of Electric Distribution Reliability by Company
Company
Reliability/
Availability
Annual Outage
Rate Year
Southern California Edison 0.9997296 1.0471 2006
Southern California Edison 0.9997121 1.1028 2007
Southern California Edison 0.9997738 1.0586 2008
Southern California Edison 0.9997987 0.8998 2009
Southern California Edison 0.9997319 1.0472 2010
Southern California Edison 0.9995579 1.0386 2011
Southern California Edison 0.9997943 0.8930 2012
Southern California Edison 0.9998048 0.9100 2013
Southern California Edison 0.9997869 0.9622 2014
Southern California Edison 0.9997815 0.9200 2015
Southern California Edison 0.9997441 1.1000 2016
PG&E 0.9996910 1.2540 2007
PG&E 0.9991933 1.5750 2008
PG&E 0.9995970 1.3160 2009
PG&E 0.9995253 1.3940 2010
PG&E 0.9994696 1.2670 2011
PG&E 0.9997310 1.1250 2012
PG&E 0.9997759 1.0650 2013
PG&E 0.9997454 1.0440 2014
PG&E 0.9997492 0.9670 2015
PG&E 0.9997972 1.0210 2016

Assessment of Natural Gas and Electric Distribution Service Reliability Page 15
Table 7: Summary of Electric Distribution Reliability by Company (cont’d)
Company
Reliability/
Availability
Annual Outage
Rate Year
Consolidated Edison 0.9996906 0.1300 2013
Consolidated Edison 0.9996473 0.1100 2014
Consolidated Edison 0.9996416 0.1100 2015
Consolidated Edison 0.9996952 0.1400 2016
National Grid 0.9995879 1.3900 2013
National Grid 0.9996724 1.1700 2014
National Grid 0.9997637 1.0600 2015
National Grid 0.9997249 1.1800 2016
NYSEG 0.9997329 1.4100 2013
NYSEG 0.9996610 1.3400 2014
NYSEG 0.9997557 1.2800 2015
NYSEG 0.9996701 1.5700 2016
RG&E 0.9996861 0.9100 2013
RG&E 0.9997352 0.8500 2014
RG&E 0.9997557 0.8700 2015
RG&E 0.9997614 0.7000 2016
NStar 0.9998086 1.213 2006
NStar 0.9998305 1.11 2007
NStar 0.9998373 1.127 2008
NStar 0.9998763 0.826 2009
NStar 0.9998468 0.893 2010
NStar 0.9999026 0.807 2011
NStar 0.9998161 0.854 2012
NStar 0.9998700 0.877 2013
NStar 0.9998611 0.734 2014
Portland General Electric 0.9998516 0.650 2010
Portland General Electric 0.9998744 0.570 2011
Portland General Electric 0.9997374 0.720 2012
Portland General Electric 0.9998174 0.570 2013
Portland General Electric 0.9995320 1.200 2014
Portland General Electric 0.9996689 0.780 2015
Portland General Electric 0.9996804 0.790 2016
PacifiCorp 0.9996895 1.360 2010
PacifiCorp 0.9994692 1.300 2011
PacifiCorp 0.9992489 1.710 2012
PacifiCorp 0.9997203 1.130 2013
PacifiCorp 0.9995243 1.630 2014
PacifiCorp 0.9994958 1.350 2015
PacifiCorp 0.9995753 1.590 2016
Assessment of Natural Gas and Electric Distribution Service Reliability Page 16
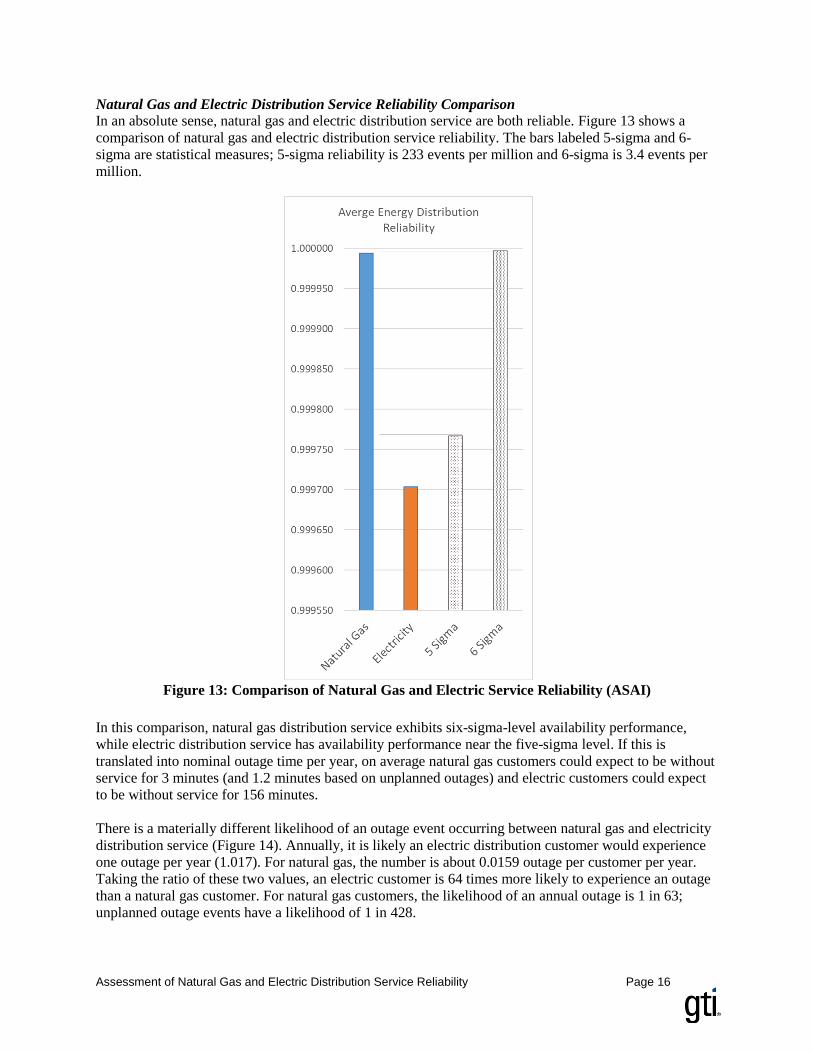
Natural Gas and Electric Distribution Service Reliability Comparison
In an absolute sense, natural gas and electric distribution service are both reliable. Figure 13 shows a
comparison of natural gas and electric distribution service reliability. The bars labeled 5-sigma and 6-
sigma are statistical measures; 5-sigma reliability is 233 events per million and 6-sigma is 3.4 events per
million.
Figure 13: Comparison of Natural Gas and Electric Service Reliability (ASAI)
In this comparison, natural gas distribution service exhibits six-sigma-level availability performance,
while electric distribution service has availability performance near the five-sigma level. If this is
translated into nominal outage time per year, on average natural gas customers could expect to be without
service for 3 minutes (and 1.2 minutes based on unplanned outages) and electric customers could expect
to be without service for 156 minutes.
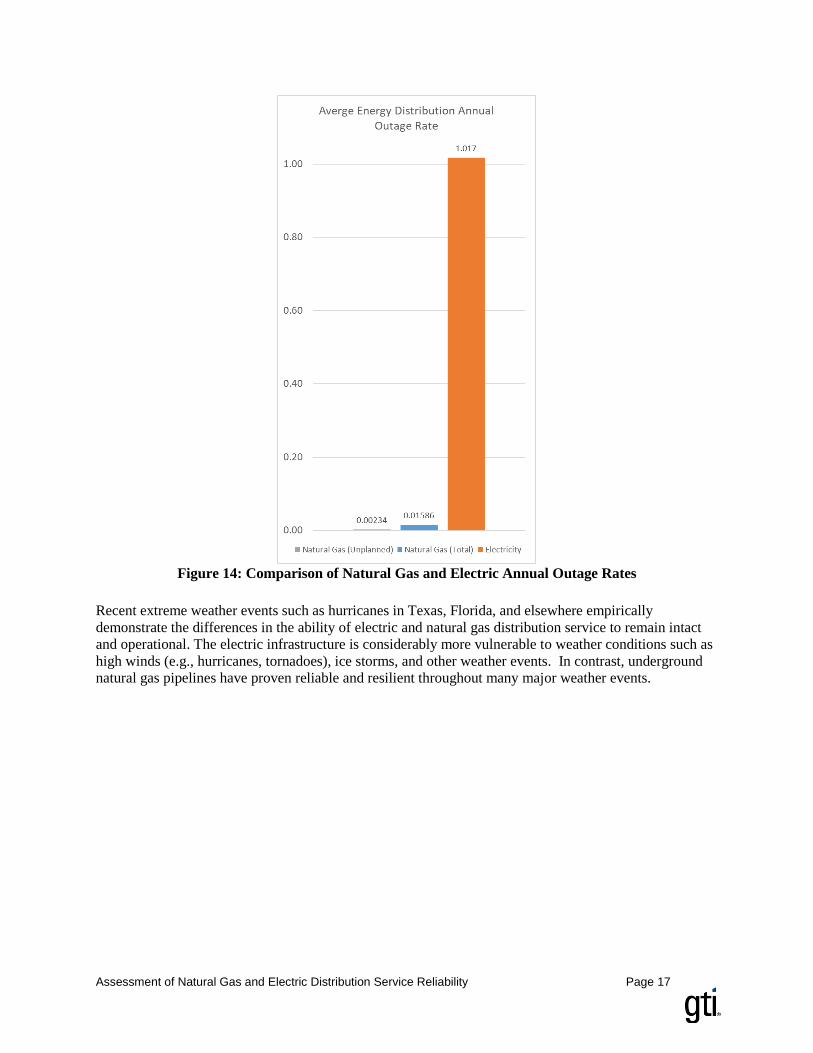
There is a materially different likelihood of an outage event occurring between natural gas and electricity
distribution service (Figure 14). Annually, it is likely an electric distribution customer would experience
one outage per year (1.017). For natural gas, the number is about 0.0159 outage per customer per year.
Taking the ratio of these two values, an electric customer is 64 times more likely to experience an outage
than a natural gas customer. For natural gas customers, the likelihood of an annual outage is 1 in 63;
unplanned outage events have a likelihood of 1 in 428.
Assessment of Natural Gas and Electric Distribution Service Reliability Page 17
Figure 14: Comparison of Natural Gas and Electric Annual Outage Rates
Recent extreme weather events such as hurricanes in Texas, Florida, and elsewhere empirically
demonstrate the differences in the ability of electric and natural gas distribution service to remain intact
and operational. The electric infrastructure is considerably more vulnerable to weather conditions such as
high winds (e.g., hurricanes, tornadoes), ice storms, and other weather events. In contrast, underground
natural gas pipelines have proven reliable and resilient throughout many major weather events.

Assessment of Natural Gas and Electric Distribution Service Reliability Page 18
Role for Natural Gas as a Cost-Effective and Clean Reliability and Resilience Solution
While electric distribution service reliability is high in an absolute sense, for some end users the impact of
electric outages at their homes or businesses can be highly disruptive and pose an economic hardship. For
these applications, end users may employ onsite generators for emergency or standby service. In some
instances, end users strive for 100% power reliability by coupling onsite generation with uninterruptible
power supply (UPS) systems. This includes critical life safety applications such as hospitals and 911 call
centers as well as instances where the costs of power outages are extremely high (e.g., financial
institutions, pharmaceutical manufacturing, and others).
Earlier estimates placed the installed capacity of standby and emergency generators near 170 GW; this
number has likely increased over the past decade. These distributed generation units serve a vital role
during electric power outages. Historically, many of these have been diesel-fueled standby or emergency
engine generators – especially for commercial and industrial facilities – while gasoline or gaseous (i.e.,
natural gas or propane) generator units may be used at homes and light-commercial businesses.
A number of factors are opening up greater market opportunity for onsite natural gas power systems to
supplement grid electricity. This is evidenced by the increasing sale of natural gas engines and generator
sets. As shown in Figure 15, according to data from Power Systems Research, the North American market
for 5-20 kW natural gas and liquefied petroleum gas (LPG, or propane) generator sets has grown by over
a factor of four since 2000 – totaling about 110,000 units in 2017. Internationally, sales of larger 1-5 MW
natural gas engines is also growing. In 2016, natural gas commanded over 15% market share in the 1-5
MW range (the balance being diesel engines); in 1990, gas engine market share was below 4%.
Figure 15: North American Production of Natural Gas and LPG Generator Sets
Figure 16 shows typical natural gas-fueled generators for standby and emergency power at residential
(left) and commercial or industrial facilities (right). These units connect to the natural gas distribution
pipeline system and can provide nearly instantaneous power (e.g., in about ten seconds) after a power
outage. End users benefit from using natural gas due to avoided need to replenish onsite liquid fuel tanks
(e.g., diesel or LPG) as well as the lower fuel costs. Onsite liquid fuels are consumed during periodic
(e.g., weekly) running of generator sets (“exercising”) or, more significantly, when called upon for
extended run times during long power outages. The continued supply of pipeline natural gas is a
substantial resilience benefit for end users compared to managing the logistics of liquid fuel resupply
during extreme disruptions in building power supply.

Assessment of Natural Gas and Electric Distribution Service Reliability Page 19
Figure 16: Example Residential and Commercial/Industrial Natural Gas Generator Sets
There is market pull for using natural gas in place of diesel engines. To help end users, GTI worked with
a major generator set manufacturer (Generac) to develop a total cost of ownership calculator to assist in
comparing the business case for natural gas and diesel for standby and emergency generator sets
(calculator available at www.generatorTCO.com). Figure 17 shows an example screenshot of a portion of
this online calculator. There is also a white paper available on this topic (see References). From an
economic perspective, an onsite natural gas generator can open the possibility for customers to participate
in an electric demand response program to capture additional savings.
Figure 17: Natural Gas vs Diesel Generator Set Lifecycle Cost Calculator
Against this backdrop of growing end user interest in using onsite natural gas power generation to
improve site electric reliability, traditional practices and historical code and standards language have
typically favored diesel-fueled engines for standby and emergency power. This stems in part from the
view that onsite fuel storage was either preferable or required (e.g., in life safety applications).
Assessment of Natural Gas and Electric Distribution Service Reliability Page 20
As noted by Generac in a whitepaper publication, reliability of fuel supply is of great concern for code
officials – that is, authorities having jurisdiction (AHJs), such as fire marshals or others, involved in
permitting emergency generators. Per National Fire Protection Association (NFPA) National Electrical
Code (NEC), onsite fuel is required for facilities with Level 1 loads “where failure of the equipment to
perform could result in loss of human life or serious injuries.” Mission-critical applications, including
hospitals and 911 call centers, often rely on diesel-fueled generators because on-site fuel storage is
viewed as more reliable.
While NEC requires on-site fuel supply for mission-critical standby systems, it grants AHJs the flexibility
to permit the use of alternative fuels in other standby power applications where there is a low probability
of a simultaneous failure of both the off-site fuel delivery system (e.g., natural gas) and the power from
the outside electrical utility company. As the natural gas distribution service data highlighted in this report
indicates, the probability of a customer losing natural gas service during an unplanned event is quite low –
particularly in the absence of major catastrophic event such as an earthquake. Even during several recent
major U.S. weather events, anecdotal information indicates natural gas service to customers remained
largely unaffected.
Traditional perception within the market is that diesel engines are the most reliable prime movers for
standby generators; however, despite their widespread use, diesel generators have demonstrated multiple
reliability issues. Outages associated with major weather events have highlighted diesel-fueled generator
vulnerability, including improper or inadequate fuel maintenance practices, and the difficulty or
impossibility of fuel replenishment in the midst of prolonged and wide-scale outage events. The
introduction of ultra-low sulfur diesel (ULSD) successfully reduced engine emissions, but ULSD has a
shorter shelf life and requires more rigorous maintenance and periodic fuel polishing. In addition, newer
diesel engines require higher quality fuel, and so are less tolerant of fuel issues. During extended power
grid outages following extreme weather events, the ability for over-the-road diesel resupply can be
disrupted for days to weeks, limiting the generator operation to the 2 to 4 days provided by on-site fuel
storage. In this context, reliable natural gas fuel supply – free from issues such as water in diesel fuel
storage tanks -- could serve as a more reliable emergency generator fuel supply option than diesel.
Regions with potential seismic activity comprise a higher risk category for natural gas pipelines.
However, earthquake-resistant design practices may help minimize theses impacts by ensuring pipelines
have flexibility to move (e.g., pipelines embedded in pea gravel or geofoam, or the use of expansion loops
that avoid long, fixed pipeline segments). For applications where traditional onsite fuel storage may be
preferred or required, onsite LPG could serve as a supplemental energy supply for natural gas generator
sets for some equipment.
The growing role of natural gas emergency and standby generator sets that use natural gas distribution
pipelines underscores the societal value of natural gas as:
A reliable energy supply option for homes and businesses
Part of an integrated solution that enhances onsite electric supply reliability and improves end
user and local community resilience during extreme events that can disable electric distribution
(as well as liquid fuel supply) service for an extended duration.

Assessment of Natural Gas and Electric Distribution Service Reliability Page 21
Conclusions
Natural gas energy delivery systems are generally viewed as cost-effective, safe, and reliable – but how
reliable? Quantified reliability metrics, like those outlined in this report, can help inform natural gas
system engineering and operations, while also enhancing customer and community-facing business goals.
This report highlights that natural gas and electric distribution service are both reliable in an absolute
sense. Table 8 and Figure 18 provide a summary of the results related to: 1) reliability and availability of
these energy services to homes and businesses and (2) the frequency or likelihood of outages per year.
Table 8: Summary Energy Distribution Reliability and Outage Rate Results
Metric
Natural Gas
Distribution
Electric
Distribution
Average Reliability/Availability (Planned and Unplanned) 0.9999942 0.999703
Average Reliability/Availability (Unplanned) 0.9999978 --
Average Outage Rate – Planned and Unplanned
(Event Per Customer Per Year) 0.0159 1.017
Estimated Unplanned Outage Rate
(Event Per Customer Per Year) 0.00234 (survey)
(0.00135, CGA data) --
Figure 18: Energy Distribution Reliability and Outage Rate Comparison

Assessment of Natural Gas and Electric Distribution Service Reliability Page 22
Natural gas distribution systems operate at very high levels of service reliability. These data indicate
natural gas distribution systems operate at a service availability on par with six-sigma performance – a
top-tier service designation. Natural gas service disruptions are rare. On average, only 1 in 63 customers
(1/0.0159) are expected to experience an outage (planned or unplanned) in any given year. Most natural
gas outages are for planned equipment replacement; data in this report indicate unplanned annual natural
gas service outages affect about 1 in 428 natural gas customers (1/0.00234) per year.
By comparison, electric distribution systems have between four and five sigma reliability performance,
with an average annual outage time of 156 minutes per year per customer and each electric distribution
customer can expect at least one outage event per year – a much higher rate than for natural gas
distribution service. While not specifically quantified in this report, anecdotal experience indicates the
vast majority of electric distribution outages occur due to unplanned impacts such as severe weather
(whereas most natural gas outages are due to planned events).
In most regions, North American natural gas distribution systems should have intrinsic reliability levels
equal to, or better than, onsite liquid fuel storage – a key consideration for emergency and standby
generators. In earthquake prone regions, further assessment may be needed to evaluate this hypothesis,
while noting there are pipeline construction methods that can minimize pipeline damage during
earthquakes and ground movement.
Natural gas industry improvement efforts should seek to fuse together safety and reliability as mutually
reinforcing concepts. While natural gas distribution service is reliable and exhibits very low outage rates,
there are pathways for continuous improvement to raise service reliability and lower outage rates.
Examples include methods and techniques to replace residential meters or underground pipeline and
assets by using onsite supplemental natural gas supply to maintain natural gas supply (e.g., compressed
gas cylinders or trailers) to homes or business. Improved methods for identification of the location of
underground natural gas systems and enhanced effectiveness of 811 one-call centers can also result in
avoidance of excavation damage – a leading contributor to unplanned natural gas outages.
Future efforts should look to revisit and update this natural gas distribution reliability assessment. Gas
distribution operators are encouraged to enhance their information systems to include tracking of planned
and unplanned outage events and, to the extent possible, customer outage time per event.

Assessment of Natural Gas and Electric Distribution Service Reliability Page 23
References
1. Burns and McDonnell, “Natural Gas is a Smart Choice for Data Center Backup Power – Even in
Earthquake-Prone Areas,” (2017),
https://www.burnsmcd.com/insightsnews/insights/tech-paper/natural-gas-smart-choice-for-data-
center-power
2. California Public Utilities Commission, Electric System Reliability Annual Reports.
http://www.cpuc.ca.gov/general.aspx?id=4529
3. Common Ground Alliance, “Best Practices 15.0: The Definitive Guide for Underground Safety and
Damage Prevention, (March 2018), http://commongroundalliance.com/best-practices-guide
4. Diesel and Gas Turbine Worldwide, 40th Annual Power Generation Order Survey.
https://dieselgasturbine.com/2016-power-generation-order-survey/
5. Gas Technology Institute, “Reliability Assessment of Diesel vs. Natural Gas for Standby Generation,”
http://www.generac.com/industrial/generacindustrialpower/media/library/Whitepapers/PDFs/Generac
-Industrial-Power_Whitepaper_GTI-Natural-Gas-Backup-Power.pdf
6. Generac Power Systems, Natural Gas and Diesel Generator Set Total Cost of Ownership Calculator,
http://www.generac.com/Industrial/all-about/natural-gas-fuel/natural-gas-performance
7. Generac Power Systems, “Understanding Natural Gas Fuel Reliability for Backup Power,”
http://www.generac.com/industrial/generacindustrialpower/media/library/Whitepapers/PDFs/Generac
-Industrial-Power_Whitepaper_Natural-Gas-Reliability.pdf
8. Hainzl, M., “Standby Power Generation Fuel Security – Diesel vs. Natural Gas”, Generac Power
Systems,
http://www.generac.com/industrial/generacindustrialpower/media/library/Whitepapers/PDFs/
9. Illinois Commerce Commission, Electric Reliability.
https://www.icc.illinois.gov/Electricity/utilityreporting/ElectricReliability.aspx
10. IEEE Standard 1316 – 2012 – IEEE Guide for Electric Power Distribution Reliability Indices,
https://standards.ieee.org/findstds/standard/1366-2012.html
11. Massachusetts Institute of Technology, Lincoln Laboratory, “Interdependence of the Electricity
Generation Systems and the Natural Gas System and Implications for Energy Security,” (May, 2013)
https://www.ll.mit.edu/mission/engineering/Publications/TR-1173.pdf
12. Massachusetts Department of Public Utilities, Service Quality.
https://www.mass.gov/service-details/service-quality
13. National Energy Technology Laboratory, “Backup Generators (BUGS): The Next Smart Grid Peak
Resource,” April, 2010.
https://www.netl.doe.gov/File%20Library/research/energy%20efficiency/smart%20grid/whitepapers/
BUGS_The-Next-Smart-Grid-Peak-Resource--April-2010-.pdf
14. Natural Gas Council, “Natural Gas Systems: Reliable and Resilient,” (July, 2017)
http://www.ngsa.org/download/analysis_studies/NGC-Reliable-Resilient-Nat-Gas-WHITE-PAPER-
Final.pdf
15. New York State Department of Public Service, “2016 Electric Reliability Performance Report,” June,
2017. http://documents.dps.ny.gov/public/Common/ViewDoc.aspx?DocRefId=%7BBBCBF3C3-
1812-4EEC-9E31-6901AED885D3%7D
16. North American Electric Reliability Corporation, “2013 Special Reliability Assessment:
Accommodating an Increased Dependence on Natural Gas for Electric Power, Phase II: A
Vulnerability and Scenario Assessment for the North American Bulk Power System (May, 2013)
http://www.nerc.com/pa/RAPA/ra/Reliability%20Assessments%20DL/NERC_PhaseII_FINAL.pdf
17. Power Systems Research, OE Link™ Database,
https://www.powersys.com/products-services/powertrain-databases/oe-link
18. Public Utility Commission of Oregon, “Seven-Year Electric Service Reliability Statistics: 2010-
2016,” June, 2017. https://www.puc.state.or.us/safety/Seven-
Year%20Elec%20Service%20Reliability%20Study%20Jun%202017.pdf

Assessment of Natural Gas and Electric Distribution Service Reliability Page 24
19. U.S. Department of Transportation – Pipeline and Hazardous Materials Safety Administration,
Annual Report Data from Gas Distribution, Gas Gathering, Gas Transmission, Hazardous Liquids,
and Liquefied Natural Gas (LNG) Operators.
https://www.phmsa.dot.gov/data-and-statistics/pipeline/source-data
List of Acronyms
Acronym Description
AHJ Authority Having Jurisdiction
ASAI Average Service Availability Index
CAIDI Customer Average Interruption Duration Index
CGA Common Ground Alliance
GTI Gas Technology Institute
IEEE Institute of Electrical and Electronic Engineers
kW Kilowatt
LPG Liquefied Petroleum Gas
MW Megawatt
NEC National Electrical Code
NFPA National Fire Protection Association
QRA Quantitative Risk Analysis
SAIDI System Average Interruption Duration Index
SAIFI System Average Interruption Frequency Index
ULSD Ultra-Low Sulfur Diesel
UPS Uninterruptible Power Supply
USDOT United States Department of Transportation
END OF REPORT


