
Assessment of Mexican Driver Understanding of Existing ...
71
I. Report No. 2. Government Accession No. FHWA/TX-97/1274-1 4. Title and Subtitle ASSESSMENT OF MEXICAN DRIVER UNDERSTANDING OF EXISTING TRAFFIC CONTROL DEVICES USED IN TEXAS 7. Author(s) H. Gene Hawkins, Jr., Dale L. Picha, Bret L. Mann, Charles R. Mcllroy, Katie N. Womack, and Conrad L. Dudek 9. Performing Organization Name and Address Texas Transportation Institute The Texas A&M University System College Station, Texas 77843-3135 12. Sponsoring Agency Name and Address Texas Department of Transportation Research and Technology Transfer Office P. 0. Box 5080 Austin, Texas 78763-5080 15. Supplementary Notes Project Director: Carlos Lopez, P.E. Traffic Operations Div. (512)416-3135 Technical Report Documentation Page 3. Recipient's Catalog No. 5. Report Date November 1996 6. Perforn1ing Organization Code 8. Performing Organization Report No. Research Report 12 74-1 10. Work Unit No. (TRAIS) 11. Contract or Grant No. Study No. 0-1274 13. Type of Report and Period Covered Interim: September 1995 - August 1996 14. Sponsoring Agency Code Research performed in cooperation with the Texas Department of Transportation and the U.S. Department of Transportation, Federal Highway Administration. Research Study Title: Traffic Control Devices for Drivers in Texas Border Areas 16. Abstract The Texas-Mexico border area possesses many unique characteristics that could potentially reduce the effectiveness of traffic control devices used in these areas. This report describes the results from the first year of a three-year research project on the use of traffic control devices in Texas border areas. The first year was devoted to information gathering and an assessment of traffic control device understanding among drivers entering Texas from Mexico. Key first-year tasks included gathering information from pertinent literature and telephone interviews and conducting surveys of driver comprehension of existing traffic control devices. The surveys used a flashcard format and were administered to drivers on international bridges going from Mexico to Texas. In general, the results indicate that Mexican drivers understand most of the traffic control devices included in the survey. Devices that were found to exhibit a potential for improvement include: the Yield sign, the use of yellow in pavement markings to distinguish two-way traffic, hazardous cargo signing, some aspects of truck weight signs, the difference between yellow and orange signs, understanding of specific signs, and the proper driving response to school buses. 17. Key Words 18. Distribution Statement Traffic Control Devices, Signing, Bilingual Signs, Comprehension of Traffic Control Devices No restrictions. This document is available to the public through NTIS: 19. Security Classif.(ofthis report) Unclassified Form DOT F 1700.7 (8-72) National Technical Information Service 5285 Port Royal Road Springfield, Virginia 22161 20. Security Classif.(of this page) Unclassified Reproduction of completed page authorized 21. No. of Pages I 22. Price 72
Transcript of Assessment of Mexican Driver Understanding of Existing ...

I. Report No. 2. Government Accession No.
FHWA/TX-97/1274-1
4. Title and Subtitle
ASSESSMENT OF MEXICAN DRIVER UNDERSTANDING OF EXISTING TRAFFIC CONTROL DEVICES USED IN TEXAS
7. Author(s)
H. Gene Hawkins, Jr., Dale L. Picha, Bret L. Mann, Charles R. Mcllroy, Katie N. Womack, and Conrad L. Dudek
9. Performing Organization Name and Address
Texas Transportation Institute The Texas A&M University System College Station, Texas 77843-3135
12. Sponsoring Agency Name and Address
Texas Department of Transportation Research and Technology Transfer Office P. 0. Box 5080 Austin, Texas 78763-5080
15. Supplementary Notes
Project Director: Carlos Lopez, P.E. Traffic Operations Div. (512)416-3135
Technical Report Documentation Page
3. Recipient's Catalog No.
5. Report Date
November 1996
6. Perforn1ing Organization Code
8. Performing Organization Report No.
Research Report 12 7 4-1
10. Work Unit No. (TRAIS)
11. Contract or Grant No.
Study No. 0-1274
13. Type of Report and Period Covered
Interim: September 1995 - August 1996
14. Sponsoring Agency Code
Research performed in cooperation with the Texas Department of Transportation and the U.S. Department of Transportation, Federal Highway Administration. Research Study Title: Traffic Control Devices for Drivers in Texas Border Areas
16. Abstract
The Texas-Mexico border area possesses many unique characteristics that could potentially reduce the effectiveness of traffic control devices used in these areas. This report describes the results from the first year of a three-year research project on the use of traffic control devices in Texas border areas. The first year was devoted to information gathering and an assessment of traffic control device understanding among drivers entering Texas from Mexico. Key first-year tasks included gathering information from pertinent literature and telephone interviews and conducting surveys of driver comprehension of existing traffic control devices. The surveys used a flashcard format and were administered to drivers on international bridges going from Mexico to Texas. In general, the results indicate that Mexican drivers understand most of the traffic control devices included in the survey. Devices that were found to exhibit a potential for improvement include: the Yield sign, the use of yellow in pavement markings to distinguish two-way traffic, hazardous cargo signing, some aspects of truck weight signs, the difference between yellow and orange signs, understanding of specific signs, and the proper driving response to school buses.
17. Key Words 18. Distribution Statement
Traffic Control Devices, Signing, Bilingual Signs, Comprehension of Traffic Control Devices
No restrictions. This document is available to the public through NTIS:
19. Security Classif.(ofthis report)
Unclassified Form DOT F 1700.7 (8-72)
National Technical Information Service 5285 Port Royal Road Springfield, Virginia 22161
20. Security Classif.(of this page)
Unclassified Reproduction of completed page authorized
21. No. of Pages I 22. Price
72

ASSESSMENT OF MEXICAN DRIVER UNDERSTANDING OF EXISTING TRAFFIC CONTROL DEVICES USED IN TEXAS
by
H. Gene Hawkins, Jr., Ph.D., P.E. Associate Research Engineer Texas Transportation Institute
Dale L. Picha Assistant Research Scientist
Texas Transportation Institute
Bret L. Mann Associate Director - Center for Entrepreneurship and Economic Development
The University of Texas - Pan American
Charles R. Mcilroy, P.E. Assistant Research Scientist
Texas Transportation Institute
Katie N. Womack Research Scientist
Texas Transportation Institute
and
Conrad L. Dudek, Ph.D., P.E. Research Engineer
Texas Transportation Institute
Research Report 1274-1 Research Study Number 0-1274
Research Study Title: Traffic Control Devices for Drivers in Texas Border Areas
Sponsored by the Texas Department of Transportation
In Cooperation with U.S. Department of Transportation Federal Highway Administration
November 1996
TEXAS TRANSPORTATION INSTITUTE The Texas A&M University System College Station, Texas 77843-3135


IMPLEMENTATION STATEMENT
The part of Texas along the Mexico border exhibits many unique characteristics, including many that are related to the manner in which drivers operate on the highway system. In particular, the ability to provide border area drivers with traffic control devices that they can understand and respond to is an essential part of providing a safe and efficient transportation system. This research project was initiated to evaluate the effectiveness of existing traffic control devices used in border areas and to develop improvements for those devices. This report describes the findings from the first year of the project. These findings can be used on an interim basis to make minor improvements in border area traffic control devices.
v


DISCLAIMER
The contents of this report reflect the views of the authors who are responsible for the opinions, findings, and conclusions presented herein. The contents do not necessarily reflect the official views or policies of the Federal Highway Administration or the Texas Department of Transportation. This report does not constitute a standard, specification, or regulation, nor is it intended for construction, bidding, or permit purposes. The engineer in charge of the project was H. Gene Hawkins, Jr., P.E. #61509.
vu

ACKNOWLEDGMENTS
At the initiation of this project, TxDOT formed a panel of Project Advisors to provide guidance in the development and conduct of the research activities and review project deliverables. The Project Advisors were able to provide the researchers with valuable insights related to the manner in which border area drivers respond to traffic control devices. They also served as a valuable resource for obtaining information related to the research activities. The research team met with the Project Advisors on several occasions, and the assistance and comments received from them were instrumental in conducting the project activities. The researchers would like to acknowledge the following Project Advisors for their time, efforts, and contributions:
Project Director • Carlos Lopez, Traffic Operations Division, Texas Department of Transportation
Project Advisors • Terry Carson, Laredo District, Texas Department of Transportation • Carlos Chavez, El Paso District, Texas Department of Transportation • Vic Garcia, International Relations Office, Texas Department of Transportation • Jesus Leal, Pharr District, Texas Department of Transportation • Ted Ozuna, San Antonio District, Texas Department of Transportation • Lewis Rhodes, Traffic Operations Division, Texas Department of Transportation • Jeanne Swanson, Traffic Operations Division, Texas Department of Transportation
Vlll

TABLE OF CONTENTS
Page
LIST OF FIGURES ............................................................ x
LIST OF TABLES ............................................................ xi
SUMMARY ................................................................ xiii
CHAPTER I - INTRODUCTION ............................................... 1-1 KEY ISSUES ........................................................... 1-1 NAFTA WORKING GROUP ON TRAFFIC CONTROL DEVICES ............... 1-2 RESEARCH APPROACH ................................................. 1-3 TARGET POPULATION ................................................. 1-4 FIRST YEAR PROJECT ACTIVITIES ....................................... 1-4
CHAPTER II -BACKGROUND INFORMATION ................................. II-1 LANGUAGE AND CULTURAL ISSUES .................................... II-1 PRINCIPLES FOR TRAFFIC CONTROL DEVICES ........................... II-3 NAFTA WORKING GROUP ON TRAFFIC CONTROL DEVICES .............. II-12 SUMMARY OF RESEARCH ON LINGUISTICS IN SIGNING .................. II-13 RELATED RESEARCH ON COMPREHENSION
OF TRAFFIC CONTROL DEVICES .................................... II-14 SUMMARY OF TELEPHONE INTERVIEWS ............................... II-16
CHAPTER III - SURVEY ACTIVITIES ........................................ III-1 CRITICAL INCIDENT SURVEY .......................................... III-1 TRAFFIC CONTROL DEVICE SURVEY ................................... III-2
CHAPTER IV - INITIAL FINDINGS ........................................... IV-1
CHAPTER V -REFERENCES ................................................ V-1
APPENDIX A - RESULTS OF PILOT COMPREHENSION SURVEY . . . . . . . . . . . . . . . . A-1
APPENDIX B - RES UL TS OF FINAL COMPREHENSION SURVEY ................. B-1
IX

LIST OF FIGURES
Page
Figure 11-1. Early Texas Stop Sign .............................................. II-1 Figure 11-2. 1971 THD Speed Limit Signs ........................................ II-4 Figure 11-3. Bilingual Guide Sign in Texas ........................................ II-4 Figure 11-4. Bilingual Regulatory Sign in Texas .................................... 11-4 Figure 11-5. Mexican-Style Sign in Texas ......................................... 11-4 Figure 11-6. Example of Similar Mexican Signs .................................... II-5 Figure 11-7. Mexican Regulatory Signs ........................................... 11-6 Figure 11-8. Mexican Warning Signs ............................................. II-7 Figure II-9. Mexican Service Signs .............................................. II-8
x

LIST OF TABLES
Page
Table 11-1. Comparison of American and European Signing Systems ................... 11-3 Table 11-2. Marking and Signal Comprehension in the 1991 TTI Survey ............... 11-15 Table 11-3. Regulatory Sign Comprehension in the 1991 TTI Survey .................. 11-15 Table 11-4. Warning and Other Sign Comprehension in the 1991 TTI Survey ........... 11-16
Table 111-1. Results of the Pilot Survey .......................................... 111-3 Table 111-2. Final Survey Results for Regulatory Signs ............................. 111-5 Table 111-3. Final Survey Results for Warning Signs ............................... 111-6 Table 111-4. Final Survey Results for Other Signs ................................. llI-6 Table 111-5. Final Survey Results for Truck Related Signs ........................... 111-7 Table 111-6. Final Survey Results for Pavement Markings ........................... 111-8 Table 111-7. Final Survey Results for Traffic Signal Indications and Signal Signing ....... llI-8
Table A-1. Demographic Characteristics for the Pilot Survey . . . . . . . . . . . . . . . . . . . . . . . . A-1 Table A-2. Pilot Survey Responses for Stop Sign . . . . . . . . . . . . . . . . . . . . . . . . . . . . . . . . . A-2 Table A-3. Pilot Survey Responses for Yield Sign . . . . . . . . . . . . . . . . . . . . . . . . . . . . . . . . . A-2 Table A-4. Pilot Survey Responses for Do Not Enter Sign . . . . . . . . . . . . . . . . . . . . . . . . . . A-2 Table A-5. Pilot Survey Responses for Day/Night Speed Limit Sign . . . . . . . . . . . . . . . . . . A-3 Table A-6. Pilot Survey Responses for Day/Night Truck Speed Limit Sign . . . . . . . . . . . . . A-3 Table A-7. Pilot Survey Responses for Mexican Speed Limit Sign . . . . . . . . . . . . . . . . . . . . A-3 Table A-8. Pilot Survey Responses for One Way Sign . . . . . . . . . . . . . . . . . . . . . . . . . . . . . A-4 Table A-9. Pilot Survey Responses for Protected Left on Green Arrow Sign ............ A-4 Table A-10. Pilot Survey Responses for Left Turn Yield on Green Ball Sign . . . . . . . . . . . . A-4 Table A-11. Pilot Survey Responses for Two Way Left Turn Sign . . . . . . . . . . . . . . . . . . . . A-5 Table A-12. Pilot Survey Responses for Crossbuck Sign (Meaning) ................... A-5 Table A-13. Pilot Survey Responses for Crossbuck Sign (Location) ................... A-5 Table A-14. Pilot Survey Responses for Stop for School Bus Loading or Unloading Sign .. A-6 Table A-15. Pilot Survey Responses for Fasten Safety Belts Sign. . . . . . . . . . . . . . . . . . . . . A-6 Table A-16. Pilot Survey Responses for Trucks Use Right Lane Sign . . . . . . . . . . . . . . . . . A-6 Table A-17. Pilot Survey Responses for Weight Limit Sign ......................... A-7 Table A-18. Pilot Survey Responses for Hazardous Cargo Route Sign . . . . . . . . . . . . . . . . . A-7 Table A-19. Pilot Survey Responses for Hazardous Cargo Prohibited Sign ............. A-7 Table A-20. Pilot Survey Responses for Hill Sign . . . . . . . . . . . . . . . . . . . . . . . . . . . . . . . . . A-8 Table A-21. Pilot Survey Responses for Clearance Sign . . . . . . . . . . . . . . . . . . . . . . . . . . . . A-8 Table A-22. Pilot Survey Responses for Right Lane Ends Sign . . . . . . . . . . . . . . . . . . . . . . . A-8 Table A-23. Pilot Survey Responses for Advisory Speed Plate Sign ................... A-9 Table A-24. Pilot Survey Responses for School Bus Stop Ahead Sign . . . . . . . . . . . . . . . . . A-9 Table A-25. Pilot Survey Responses for Advanced Lane Closed Sign ................. A-9 Table A-26. Pilot Survey Responses for Single Broken Yellow Center Line Sign . . . . . . . A-I 0 Table A-27. Pilot Survey Responses for No Passing Zone Markings Sign ............. A-IO Table A-28. Pilot Survey Responses for Double Solid White Line Sign ............... A-10
Xl

Table B-l. Demographic Characteristics for the Final Survey ......................... B-1 Table B-2. Final Survey Results for Traffic Signal Indications and Left Tum Signal Signs .. B-2 Table B-3. Final Survey Results for Pavement Markings ............................ B-3 Table B-4. Final Survey Results for Regulatory Signs ............................... B-4 Table B-5. Final Survey Results for Warning Signs ................................. B-6 Table B-6. Final Survey Results for Other Signs ................................... B-7 Table B-7. Final Survey Results for Truck Related Signs ............................ B-8
XII

SUMMARY
The areas of Texas along the Mexican border have always possessed many unique characteristics that make these areas distinct from other areas of Texas. The Hispanic influence and the predominance of Spanish as the spoken language are the most significant factors that make these areas so different from the rest of the state. Not only is there a predominant Hispanic presence among Texas border area residents, the number of tourists and truck drivers who speak only Spanish is steadily increasing due to the expected increases in international traffic from the free-trade zone and the North American Free Trade Agreement (NAFTA). As a result of these and other factors, there is concern that traffic control devices used on highways and streets in the Texas border areas may not adequately meet the information needs of border area drivers. In particular, there is a concern that signs, many of which were originally designed for English-speaking drivers, may not be well-suited to border drivers, many of whom speak only Spanish, or very limited English. Some of the major factors that might affect the effectiveness of traffic control devices in border areas are:
• The use of two languages (English and Spanish), • The presence of two systems of measurement (metric and English), • Actual differences in the traffic control devices used in Mexico and Texas, and • Cultural differences between Mexican and U.S. drivers.
Although the Texas Department of Transportation (TxDOT) has been concerned about the effectiveness of traffic control devices in the border area for many years, the issue has remained largely undocumented. Therefore, TxDOT sponsored this research to investigate the effectiveness of border area traffic control devices and to develop appropriate recommendations for improving the effectiveness of these devices. The results of this three-year research project will provide TxDOT with the guidance to improve the use and effectiveness of traffic control devices in the border areas of Texas. The guidelines will lead to more effective methods of meeting the unique information needs of border area drivers, thereby reducing driver uncertainty and improving the overall safety of the Texas highway system. Improving the ability of Spanish-speaking drivers to respond to traffic control devices will lead to a friendlier transportation system and encourage the economic development of commercial and tourist facilities in border areas. Improved traffic control devices would also improve TxDOT' s ability to restrict overweight and overheight commercial vehicles to highway facilities and service locations that can safely accommodate them.
This report documents the activities and findings of the first year of the three-year research project. The first year was devoted to problem identification and included the following activities:
• Identify target population - In order to focus the research efforts on a manageable portion of the border driver population, the researchers, in combination with the Project Advisors, determined that the research should address Mexican drivers entering Texas from Mexico, driving either automobiles or commercial trucks. Throughout this report, they are referred to as "Mexican drivers" with the intent that they are residents of Mexico driving a vehicle in a Texas border area.
Xlll

• Gather pertinent information - The first part of the project was devoted to gathering available information about the border areas and pertinent research. Activities and findings are described in Chapter II. ... Review available literature - Researchers reviewed the literature that addressed
various issues of concern to border area traffic control devices. Specific literature includes traffic control device documents and evaluations of driver comprehension in border areas.
... Contact US and Mexican transportation professionals/officials - Telephone interviews were conducted of various individuals associated with transportation issues in the border areas.
... Coordinate with NAFTA Working Group on Traffic Control Devices -Representatives from Canada, Mexico, and the United States have created a working group to address the key traffic control device issues related to implementation of NAFTA.
• Conduct critical incident survey - A critical incident survey was prepared and administered to identify locations where Mexican drivers were having navigational difficulties. Activities and findings are described in Chapter III. For various reasons described in Chapter III, the critical incident survey did not provide information that could be used in the first-year problem identification effort.
• Assess driver comprehension of existing traffic control devices - A driver comprehension survey was developed and administered to determine whether Mexican drivers were having difficulty understanding existing traffic control devices. Survey development, administration, and results are described in Chapter III. In general, the survey results indicate that the existing system of traffic control devices used in the Texas border area functions well among the target population.
• Develop initial findings - The researchers used the results of the first-year research activities to develop the initial project findings. These findings are described in Chapter IV. Potential areas for improvement actions include: ... Stopping laws for school buses, ... Handout information for Mexican truck drivers and/or Mexican tourists, ... Bilingual signing for specific applications, ... Explanatory signing for specific applications, and ... Additional evaluations of speed limit signing.
XIV

CHAPTER I
INTRODUCTION
The areas of Texas along the Mexican border have always possessed many unique characteristics that make these areas distinct from other areas of Texas. The Hispanic influence and the predominance of Spanish as the spoken language are the most significant factors that make these areas so different from the rest of the state. Not only is there a predominant Hispanic presence among Texas border area residents, the number of tourists and truck drivers who speak only Spanish is steadily increasing with the opening of the Texas/Mexico border. As a result of these and other factors, there is concern that traffic control devices used on highways and streets in the Texas border areas may not adequately meet the information needs of border area drivers.
Although the border areas have possessed a strong Hispanic influence for many years, the expected increases in international traffic due to the free-trade zone and the North American Free Trade Agreement (NAFTA) have focused additional concern on the existing system of traffic control devices. In particular, there is a concern that signs, many of which were originally designed for English-speaking drivers, may not be well-suited to border drivers. many of whom speak only Spanish, or very limited English.
KEY ISSUES
Some of the key unique issues related to border area traffic control devices include: the use of two languages in border areas, the presence of two systems of measurement (International System [SJ.] and United States [U.S.] Customary), differences in the traffic control devices used in Mexico and Texas, and cultural differences between Mexican and U.S. drivers. For several years, the Texas Department of Transportation (TxDOT) has been concerned about these issues and the ability of traffic control devices to meet the needs of border area drivers. Unfortunately, the effectiveness of traffic control devices in meeting the information needs of border area drivers is a largely undocumented and unquantified issue. Therefore, TxDOT sponsored this research project, being conducted by the Texas Transportation Institute (TTI), to investigate the effectiveness of border area traffic control devices and to develop appropriate recommendations for improving the effectiveness of these devices. The follovving paragraphs summarize some of the key points associated with these issues. They are discussed in greater detail in Chapter II (Background).
Language
One of the expressions ofthis continuity is the use of the Spanish language. The Mexican border cities (MBCs) are predominantly monolingual, and the Spanish-English bilingualism that one might expect to observe is purely specific or transitional. The use of English is generally related to the job site or other situations in which a monolingual English is present. On the U.S.-Mexico border, as in many countries in the world, there is a tendency to learn English in high school, and its use is characterized by an urban or industrial context. Its use is more frequent, although not exclusive, among middle and upper class individuals.
I-1

Units of Measurement
The researchers identified as a key issue the ability of Mexican drivers to understand the use of U.S. Customary units of measurements in traffic control devices. The most significant highwayrelated measurements in traffic control devices that are affected by the use of measurements, both in SJ. and U.S. Customary units, include:
• Speed limit signs; • Weight limit signs; • Distance signs; • Vertical clearance signs; • Mileposts; • Roadway/bridge width signs; and • Supplemental distance signs.
Compatibility of Traffic Control Devices
There are both many similarities and significant differences in the traffic control device systems used in the United States and Mexico. The basic color and shape principles are similar in the two countries, except for the use of a red circle in Mexican regulatory signs. The major differences that may cause difficulties include the units of measurement, the design of the speed limit sign, the color of pavement markings, the design of permissive signs, signs for hazardous cargo freight, and the use of word message signs.
Cultural Differences
From a sociocultural perspective, North American border cities have noticeable Mexican characteristics, while from an economic perspective, MBCs exhibit mostly North American characteristics. MBCs are distinguished by the presence of the assembly industry. In spite of the gradual transformation of the twin cities, the Mexican presence and ethnolinguistic continuity with Mexico are still obvious.
NAFTA WORKING GROUP ON TRAFFIC CONTROL DEVICES
The Working Group on Traffic Control Devices is one of five working groups of the Land Transportation Standards Subcommittee associated with NAFTA. The group has met three times, with additional meetings scheduled for the near future. The group has compared the use of traffic control devices in Canada, U.S., and Mexico and determined that "commercial and private drivers will experience only minimal inconvenience, due to the differences in traffic control devices, when driving on one of the other two countries' highways" (unpublished correspondence). The group identified eight areas where differences in traffic control devices may be significant:
• Metric units; • Speed limit signs; • Permissive signs; • Word message signs;
I-2

• Color of pavement markings; • Hazardous cargo signs; • Symbol signs; and • Traffic control devices for construction areas.
The activities of the working group are described in more detail in Chapter II (Background Information).
RESEARCH APPROACH
At present, there are no formal guidelines to help TxDOT personnel determine how best to use signs and other traffic control devices to meet the information needs of border area drivers. The results of this research \\ill provide TxDOT with the guidance to improve the use and effectiveness of traffic control devices in the border areas of Texas. The guidelines will lead to more effective methods of meeting the unique information needs of border area drivers, thereby reducing driver uncertainty and improving the overall safety of the Texas highway system. Improving the ability of Spanish speaking drivers to respond to traffic control devices will lead to a friendlier transportation system and encourage the economic development of commercial and tourist facilities in border areas. Improved traffic control devices would also improve TxDOT's ability to restrict overweight and overheight commercial vehicles to highway facilities and service locations that can safely accommodate them. In general, the research results will provide TxDOT with the tools to meet the unique information needs of border area drivers and provide a safer and more efficient transportation system.
The researchers will address the goal and objectives of this three-year research project through a three-phase work plan. The goal, objectives, and phases are listed below. These three phases correspond to the primary areas of emphasis for the project.
• Research Goal: .. Identify the information needs of drivers in Texas border areas, determine how traffic
control devices can be improved to better convey the needed information to border area drivers, and develop recommendations for the use of the improved devices.
• Research Objectives: .. Identify existing concerns and difficulties in meeting the information needs of border
area drivers. .. Identify available information on the use of traffic control devices in areas
throughout the United States with special information needs. .. Contact organizations and individuals who may have knowledge or concerns
associated with the focus of the research project. .. Identify the pertinent characteristics of drivers, vehicles, and roadways that may
affect the use of traffic control devices in Texas border areas. .. Identify and assess any special issues that may impact the manner that traffic control
devices are used in border areas. Assess the effectiveness of existing traffic control devices in meeting the information needs of border area drivers. Develop strategies for improving traffic control devices in border areas.
I-3

.,. Evaluate the potential effectiveness of improvement strategies .
.,. Develop recommendations for improving and using traffic control devices in Texas border areas .
.,. Assess impacts of recommendations and solicit input from affected organizations .
.,. Develop a document intended specifically for implementing the research project recommendations within TxDOT .
.,. Document the research project activities in interim and final reports. • Research Phases:
.,. Phase I - identification of information needs and deficiencies,
.,. Phase II - evaluation of existing and proposed traffic control devices, and
.,. Phase III - development and implementation of recommendations.
TAR GET POPULATION
The drivers in the Texas border areas present a wide range of driver characteristics that can impact the effectiveness of traffic control devices in the border areas. Examples of these characteristics include: place ofresidence (Texas border, Texas non-border, Mexico), type of vehicle (private automobile, commercial truck), and language capabilities (English, Spanish, bilingual). Addressing all of these driver characteristics would have diluted the research resources. Therefore, the researchers, in combination with the Project Advisors, determined that the research should focus on Mexican drivers corning into Texas driving either automobiles or commercial trucks.
FIRST YEAR PROJECT ACTIVITIES
Because the effectiveness of traffic control devices in border areas has not been sufficiently evaluated in the past, the first year of the project was devoted to problem identification. The firstyear activities included review of related information, interviews of transportation professionals, driver surveys, and identification of major issues of concern. The key first-year activities are briefly described below. Where appropriate, these descriptions identify the portion of this report that provides the results of the activity.
• Gather pertinent information - Specific efforts are listed below. Activities and findings are described in Chapter IL .,. Review available literature - Researchers reviewed the literature that addressed
various issues of concern to border area traffic control devices. Specific literature includes traffic control device documents and evaluations of driver comprehension in border areas. Contact US. and Mexican transportation professionals/officials - Telephone interviews were conducted of various individuals associated with transportation issues in the border areas .
.,. Coordinate with NAFTA Working Group on Traffic Control Devices -Representatives from Canada, Mexico, and the United States have created a working group to address the key traffic control device issues related to implementation of NAFTA.
1-4

• Conduct critical incident survey - A critical incident survey was prepared and administered to identify locations where Mexican drivers were having navigational difficulties. Activities and findings are described in Chapter III.
• Assess driver comprehension of existing traffic control devices - A driver comprehension survey was developed and administered to determine whether Mexican drivers were having difficulty understanding existing traffic control devices. Activities and findings are also described in Chapter III.
• Develop initial findings - The researchers used the results of the first-year research activities to develop the initial project findings. These findings are described in Chapter IV.
I-5

CHAPTER II
BACKGROUND INFORMATION
The initial effort of the first-year of the research project was to gather information from a variety of resources in order to identify difficulties that Mexican drivers might have with the traffic control devices used in Texas border areas. The researchers undertook several different information gathering activities, including:
• identifying pertinent language and cultural characteristics of Mexican drivers; • comparing pertinent principles for traffic control devices in the U.S. and Mexico; • coordinating activities with the NAFT A Working Group on Traffic Control Devices; • identifying the findings of previous research; and • conducting telephone interviews of transportation professionals.
LANGUAGE AND CULTURAL ISSUES
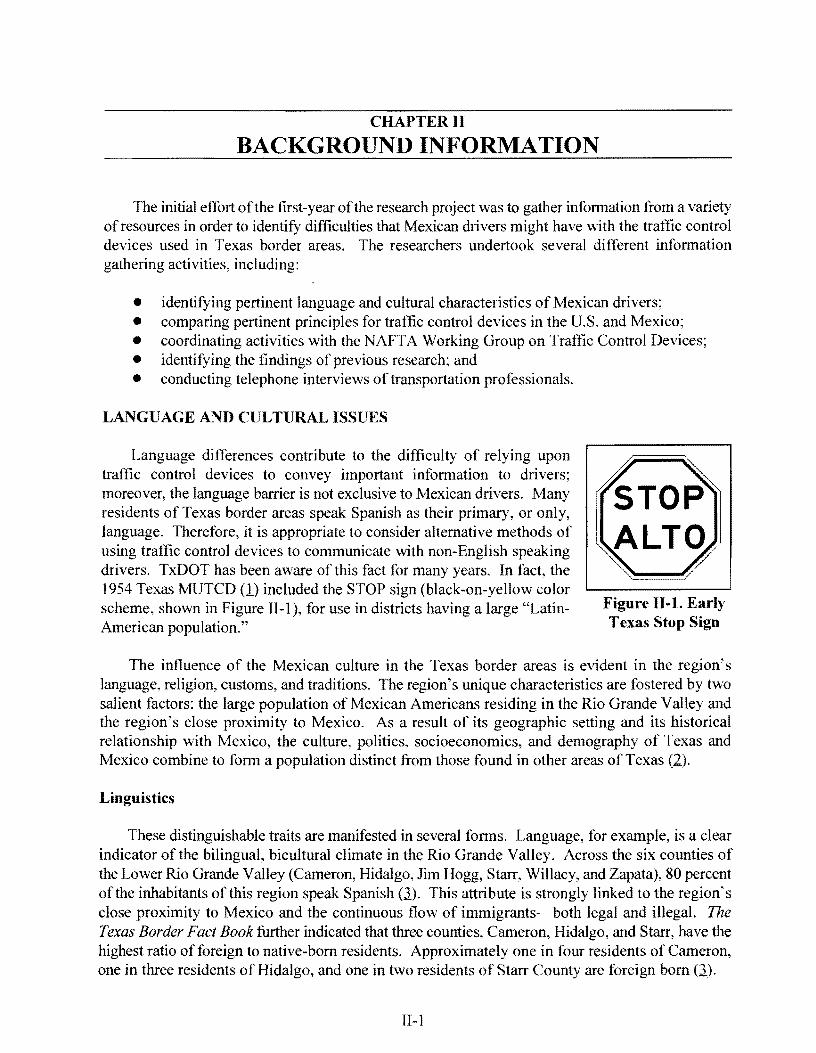
Language differences contribute to the difficulty of relying upon traffic control devices to convey important information to drivers; moreover, the language barrier is not exclusive to Mexican drivers. Many residents of Texas border areas speak Spanish as their primary, or only, language. Therefore, it is appropriate to consider alternative methods of using traffic control devices to communicate with non-English speaking drivers. TxDOT has been aware of this fact for many years. In fact, the 1954 Texas MUTCD (1) included the STOP sign (black-on-yellow color scheme, shown in Figure II-1 ), for use in districts having a large "LatinAmerican population."
Figure 11-l. Early Texas Stop Sign
The influence of the Mexican culture in the Texas border areas is evident in the region's language, religion, customs, and traditions. The region's unique characteristics are fostered by two salient factors: the large population of Mexican Americans residing in the Rio Grande Valley and the region's close proximity to Mexico. As a result of its geographic setting and its historical relationship with Mexico, the culture, politics, socioeconomics, and demography of Texas and Mexico combine to form a population distinct from those found in other areas of Texas (2).
Linguistics
These distinguishable traits are manifested in several forms. Language, for example, is a clear indicator of the bilingual, bicultural climate in the Rio Grande Valley. Across the six counties of the Lower Rio Grande Valley (Cameron, Hidalgo, Jim Hogg, Starr, Willacy, and Zapata), 80 percent of the inhabitants of this region speak Spanish (.3.). This attribute is strongly linked to the region's close proximity to Mexico and the continuous flow of immigrants-both legal and illegal. The Texas Border Fact Book further indicated that three counties, Cameron, Hidalgo, and Starr, have the highest ratio of foreign to native-born residents. Approximately one in four residents of Cameron, one in three residents of Hidalgo, and one in two residents of Starr County are foreign born Cl).
II-1

The ethnic composition of the Rio Grande Valley has led to the adaptation of a regional dialect commonly referred to as "Tex-Mex," Spanglish, or cal6. This dialect resulted from the need to conduct business and daily activities in a bilingual environment. It incorporates both English and Spanish words and produces a variation of two tongues. These words are hybrids which can usually be deciphered by English and Spanish monolinguals who live in the border area. Furthermore, this South Texas vocabulary is integrated into daily speech patterns through code-switching (the rapid shifts between two languages during a conversation). Common "Tex-Mex" phrases include words such as carpeta for carpet, cookiar for cook, wachar for watch, and parkear for park.
A recently published book describes the linguistic aspects of the United States/Mexico border area. Open Signs: Language and Society on the United States-Mexico Border (:1) provides important insights into the cultural and linguistic sensitivities on both sides of the border. According to the authors, people of Hispanic ancestry typically are bilingual upon the second generation after immigrating to the United States side of the border, and speak only English by the fourth generation. This is true only for those immigrants and their descendants who move beyond the American border communities (ABCs) into areas further interior, such as San Antonio. People of Hispanic heritage who reside in ABCs usually remain bilingual. Furthermore, residents on the opposite side of the border in Mexican border communities (MBCs) are bilingual only to the extent that they speak limited English to American tourists who do not speak Spanish. When they are in any other situations, they always speak Spanish. This is referred to as transitional bilingualism. There would be a loss of the transitional bilingualism if North American tourists no longer visited the borders and certain industries ceased to exist. In other words, the Mexicans would not use English at all and would transition back to only the Spanish language.
North American Free Trade Agreement
With the passage of the North American Free Trade Agreement (NAFTA), traffic flow along the U.S.-Mexico border has increased steadily. Commercial crossings along U.S.-Mexico points of entry account for an estimated 1.8 million of the annual border crossings in 1995; this number is expected to increase to 12 million by the year 2000 (.5.).
Although frequent crossings are made by Mexican trucking companies, many of those companies traveling in the U.S. remain within a close distance to the U.S.-Mexico border. An estimated 90 percent of the Mexican trucking companies operating in Hidalgo County (a Texas border county) only travel to the boundaries of the Foreign Trade Zone before returning to Mexico (Q).
Some U.S. consumer groups and trucking officials argue that U.S. trucking companies are required to meet higher operating standards than their Mexican counterparts. They stress that safety for Valley residents is compromised when unregulated Mexican companies are allowed to operate along the border.
In the Rio Grande Valley, several arrangements between U.S. and Mexican cities have facilitated the movement of commercial traffic. The Paired Cities Agreement and the 1993 Tamaulipas Understanding have exempted truckers driving in certain sections of the Rio Grande Valley from adhering to state licensing rules.
11-2

General Findings from Literature
The following findings were identified to be of importance to Mexican trucking companies who operate in the United States.
• Familiarity of Traffic Signs: Due to limited fluency in the English language, many Mexican truck drivers have limited familiarity with traffic signs. They can recognize and interpret commonly seen traffic symbols; however, they still encounter some difficulty in interpreting certain types of traffic signs with words or phrases.
• System of Measurement: Of the truck drivers polled, many agreed that the S.I. system is very important to their on-the-job performance. Unlike the language barrier, the U.S. Customary System poses a greater degree of difficulty. This is encountered in instances where the height of an overpass is expressed in yards and feet. For many drivers, the conversion from the U.S. Customary System to the International System is difficult in these situations.
• Trucking Rules and Regulations: Mexican truck drivers continue to remain uninformed on rules and regulations that affect their profession. Their knowledge in the areas of personal safety, commercial vehicle safety, and weight restrictions is limited.
PRINCIPLES FOR TRAFFIC CONTROL DEVICES
There are two basic systems of traffic control devices used in the world today: the American system and the European system. The American system is the older of the two and is primarily used in North America, South America, and Australia. The European system is used in most other countries. Some countries, such as Mexico, utilize a combination of both methods. Table II-1 describes some of the key differences between the two signing systems.
T bl II 1 C f A dE s· s a e - . ompanson o mencan an uropean 1gnmg 1ystems
System Communication
Regulatory Signs Warning Signs Freeway Pavement
Methods Guide Signs Markings
American Words and Black on white Black on yellow White on green Yellow Symbols Vertical rectangle Diamond Horizontal rectangle and white
Black on white Black on white Various colors Primarily
European Symbols Red border Red border Circle Triangle
Horizontal rectangle all white
Traffic Control Devices in Texas
The Texas Manual on Uniform Traffic Control Devices (TxMUTCD) (1) establishes the basic principles for traffic control devices used in Texas. It is based on the national MUTCD (~). The national MUTCD was first published in 1935 and has undergone numerous revisions during the ensuing 60 years. The first Texas MUTCD was published in 1954, although there were earlier documents that provided some limited guidance for the use of traffic control devices.
II-3

In the United States, the early signs were primarily word oriented, with English being the language of choice. However, in the 1970s, the MUTCD began a shift toward internationality with the introduction of many symbol signs. The wider use of symbols, while potentially increasing the ability of international drivers to understand the signs, has created a concern of reduced understanding among native drivers.
Texas has had a large Hispanic presence in the border areas for many years. One of the earliest instances of this recognition, as it relates to traffic control devices, is a special STOP sign that was described in the 1954 Texas MUTCD (1). This STOP sign, illustrated in Figure 11-1 (see page I), contained both English and Spanish words. It was also a black-on-yellow sign. The MUTCD indicated that it was for use in districts having a large "Latin-American population."
In 1971, the Texas Highway Department (THD, a predecessor of TxDOT), issued a letter to districts that described a day/night Mexican metric speed limit sign assembly for use on highways leading north from the Texas-Mexico border. This sign assembly is presented in Figure II-2. The circles in the signs were red. The metric sign assembly was placed next to the typical day/night speed limit sign assembly.
Currently, there is limited use of bilingual and Mexican-style traffic signs in the Texas border areas. Figures II-3, II-4, and II-5 illustrate examples of these types of signs that were recently observed in the Rio Grande Valley.
® MAXIMA
NOC HE
Figure 11-2. 1971 THD Speed Limit
Signs
TEXAS TRAVEL INFORMATION CENTER US 83 EXPRESSWAY
42 MILES
OFICINA OE TURISMO US 83 EXPRESSWAY
67 KM
Figure 11-3. Bilingual Guide Sign in Texas
II-4
RAflCO SLOWER LENTO TRAFFIC CARRIL KEEP
DERECHO RIGHT
Figure U-4. Bilingual Regulatory Sign in
Texas
Figure 11-5. Mexican-Style Sign in Texas

Traffic Control Devices in Mexico
The Mexican system of traffic control devices shares many attributes with the U.S. (and Texas) system. For example, warning signs in both countries use a black-on-yellow, diamond-shaped format. Figure 11-6 provides another comparison of key Mexican signs that are similar to their Texas counterparts. Even though the Mexican system of traffic control devices shares several attributes with the U.S. system, there are enough differences to potentially confuse a driver from Mexico coming into Texas. For example, Mexico does not use the circle, pentagon, pennant, or rectangular shapes for warning signs. Additionally, the Mexican driver is not accustomed to a large number of signs that use word message legends. Of course, the Mexican signs that do use word legends are in Spanish.
Many of the symbols used in Mexican signs are different from
Figure 11-6. Example of Similar Mexican Signs
those used in Texas. Furthermore, although the AL TO (STOP) and CEDA EL PASO (YIELD) signs use similar shapes, almost all of the other regulatory signs are completely symbol-based. In addition, most of Mexico uses an all-white system of pavement markings.
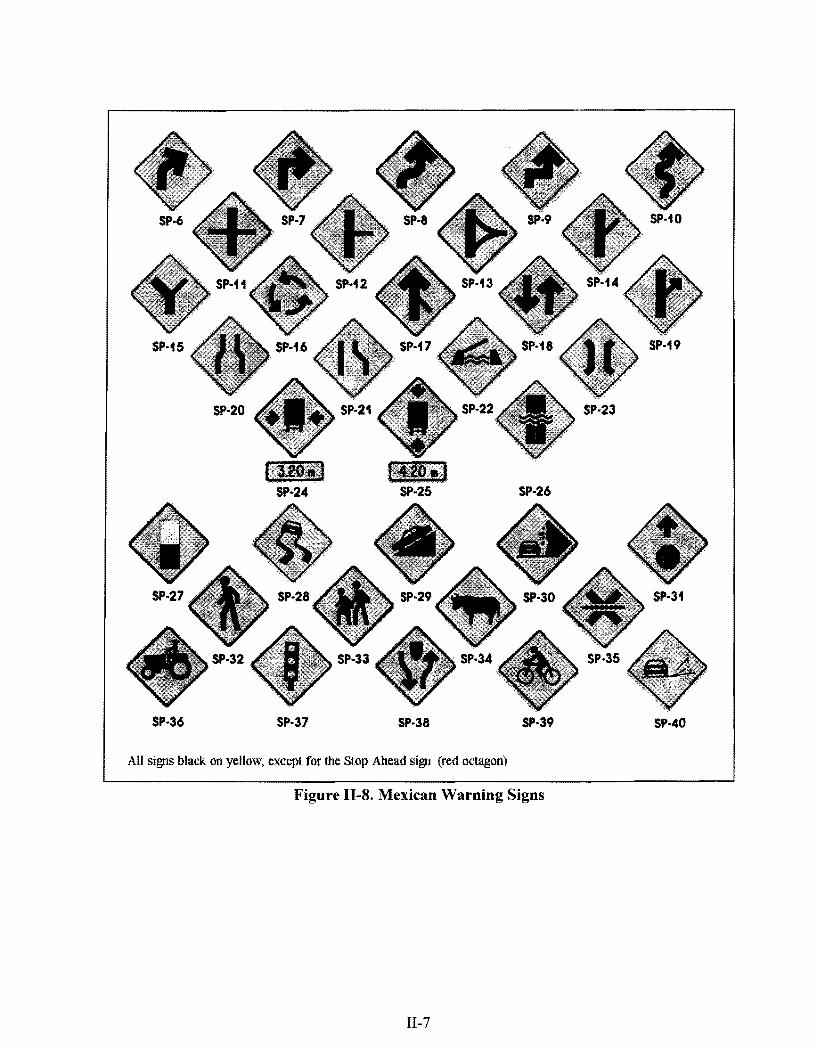
All units of measure in Mexico's signs are metric. A Mexican driver entering the Texas border area may have some difficulties understanding some of the Texas signs and pavement markings due to the differences between the systems. Figures II-7, 11-8, and II-9 illustrate a few of the signs from the Mexican equivalent of the Texas MUTCD (2.).
To a limited extent, TxDOT-sponsored research (l.Q) conducted in 1993 addressed some of the concerns associated with signing and other traffic control devices on both sides of the Texas-Mexico border. This research found some limited bilingual signing on both sides of the border but indicated the need for more emphasis on this practice. Mexico was found to utilize the practice more than Texas. The research also indicated that fewer signs were used in work/construction areas in Mexico than in Texas. Surveys found that drivers on both sides of the border are concerned about foreign drivers ' knowledge of local signing and traffic laws.
Traffic Control Devices in Other U.S. Border States
No prior research into meeting the needs of Spanish-speaking drivers' comprehension of U.S. traffic control devices has been located or obtained from the border states of California, Arizona, or New Mexico.
Florida, although not technically a border state with Mexico, shares many of the characteristics that make the border states unique. Florida has a large non-English speaking population, of which most are Spanish-speaking. Additionally, it has many foreign tourists who do not speak English. For these reasons, Florida was also considered for investigation into how to address these concerns.
II-5

• v B ~ ~ ',
'~-, ,/, so
SR-6 SR·7 SR-8 SR-9 SR·10
~ ~ ~ ~ ~ SR-11 SR·11A SR·12 SR·13 SR·14
m ~ m e ~ SR·15 SR-16 SR-17 SR·18 SR-19
[®] ~ ~ ~ ~ SR·20 SR-21 SR-22 SR·23 SR-24
~ ~ • ~ ~ SR·25 SR-26 SR-27 SR-28 SR-29
~ m B e ( .f.ZO rn J
SR-30 SR-31 SR-32 SR-33
All signs black on white with red circle, except for the Alto sign (white on red)
Figure 11-7. Mexican Regulatory Signs
II-6
SP·24 SP-25 SP-26
SP-36 SP·37 SP-38 SP·39 SP-40
All signs black on yellow, except for the Stop Ahead sign (red octagon)
Figure 11-8. Mexican Warning Signs
II-7

•• Sls-1 SfS.2 Sls-3 SIS-7
• 51$-11 SIS-12 SIS-13 SIS-14
SfS.15 SIS-16 SIS-17 SIS-19 SIS-20 SfS.21
•• SIS-25 51$-26 SIS-27 ii
SIT-i II
SIS-22 SIS-23
• SIT-9 SIT-10
All signs are white on blue, except for the First Aid (red cross on white)
Figure 11-9. Mexican Service Signs
New Mexico
Telephone interviews were conducted with personnel of the New Mexico State Highway and Transportation Department (NMSHTD). The results indicated that New Mexico uses the symbol versions of warning signs, when possible, to minimize the potential of non-English speaking drivers of misinterpreting or not understanding word-message signs. Also, within approximately 80
II-8
kilometers of the Mexico border, NMSHTD utilizes "dual" guide signing. A conventional destination sign (with U.S. customary units) is proceeded 150 meters by a similar destination sign with S.I. units. Personnel from New Mexico, however, emphasized that English and Spanish legends are not "mixed" on the same sign. Lastly, in an effort to improve communications between corresponding traffic agencies in Mexico, the NMSHTD has developed a reference guide that provides for better understanding and translation of technical transportation terms from Spanish to English and from English to Spanish (ll).
California
Telephone interviews with the California Transportation Department (Cal Trans) revealed that bilingual word-message signs are used (although sparingly) in the southern part of the state. One example of a word-message sign with a bilingual legend is the FAS TEN SAFETY BEL TS sign (R 19-8). Other examples, used by the City of Los Angeles at grade crossings on the city's light rail system, contain dual language messages as well. One particular sign reads PHOTO CITATIONS ISSUED I INFRACCIONES REGISTRADAS FOTOGRAFICAMENTE; another reads RAILROAD CROSSING MONITORED BY CAMERA, PHOTO CITATIONS ISSUED I CRUCE OBSERV ADO POR CAMAR!\S FOTO-CIT A CI ONES EMITIDAS (l.2, U). Although not discussed previously in this report, a difficulty associated with using dual language signing is evident in these two sign legends. A translation from English to Spanish typically results in a longer text legend, which may prove to be impractical to implement because of legibility concerns.
CalTrans also uses a limited number of symbol signs intended for bilingual drivers. Alternative sign symbols not necessarily used in the national MUTCD attempt to convey clearer meaning for both U.S. and Mexican drivers.
Arizona
Telephone interviews revealed that the Arizona Department of Transportation (ADOT) is increasing their use of bilingual signs near the Arizona-Mexico border (within 50 kilometers) and along major highway within the state. No specific directives or memorandums have been issued to the ADOT districts mandating the use and placement of the bilingual signs; districts, however, must receive administrative approval for each bilingual sign that is to be installed. The sign contains both English and Spanish text legends, with the English text typically above the Spanish text.
Florida
Although not located along an international border, the Florida Department of Transportation (FDOT) has many concerns over the ability of international tourists to understand their traffic signs. International tourism has played an increasingly important role in the health of Florida's economy. The incidences of international visitors being victims of random violence was believed to have a significant negative impact upon the number of tourists from foreign countries. FDOT determined that one challenge facing the international visitor is the interpretation of highway signing which can cause the visitor to become disoriented or lost while driving in Florida (.14). Therefore, in 1994, FDOT contracted with Wilbur Smith Associates (WSA) and TTI to conduct a study entitled "Evaluation oflnternational Signing Practices" (14, U). In conducting this project, the WSAJTTI
11-9
team looked at international signing practices and methods of making Florida guide signing more understandable to international tourists. In the TTI effort of the project, TTI conducted surveys of over 500 international travelers to identify the driving problems of international visitors. Human factors/traffic engineering critical incident analyses were then performed of these driving problems. Positive guidance principles were then applied to develop practical recommendations to make Florida's roads safer and more "user friendly." The primary recommendations were tested by follow-up studies with other international drivers.
Traffic Control Devices in Other Countries
There are several countries that struggle with the issue of providing signing for a driving population that represents more than one language. Examples include Canada (English and French), India (Hindu and English), and Switzerland (German and French). The following paragraphs describe how traffic control devices are used in some of these countries and their efforts to promote international uniformity.
Canada
The Canadian MUTCD (16.) contains examples of bilingual signs which are "intended to provide all jurisdictions with guidelines to assist in obtaining uniformity in bilingual signing, appropriate for use throughout Canada." Specific examples of each sign type are illustrated. The signs adhere to the following policies described in the Canadian MUTCD (Part E):
• The majority or dominant language of the province will be on top or on the left of the sign; • Both languages should be on one sign, and areas for each language should be equal; • Accents should be provided with the French legends; • Names of municipalities, rivers, falls, bridges, streets, etc., should not be translated on
highway signs; and • Where bilingual signs are used, a policy of a strictly bilingual legend is recommended on
regulatory, guide, and warning signs even though some words are easily identifiable in both languages.
Despite the guidelines listed above, Section A I. I 7 of the manual does seem to allow for messages in French and English being on separate signs. It reads, "Jn the case of a French-language sign accompanying an English-language sign. bothfor the same purpose, the signs should be placed not more than 30m apart" (16.).
Europe
A document dealing with the topic of international drivers' comprehension of traffic control devices in Europe is "Trends in Road Signing in Europe" by M. Bernhard and published by the Transportation Research Board in I 985 (11). The abstract states, in part, that "Europe is a mixture of cultures and political systems with many linguistic barriers," and "it forms a strong economic body which depends on its road infrastructure;' and "therefore, the road network of Europe must have the equipment in road signing and markings allowing drivers.from any country to feel safe and comfortable in any other country."
11-10

Bernhard states in the paper that the sign symbols are now similar in all countries of Europe, and that most sign legends have been abolished to deal with the language barriers. According to Bernhard, the only symbols still in text are the words STOP and BUS.
International
Attempts have been made, with some success, toward achieving more uniformity worldwide in traffic control devices. In 1909 the convention on the International Circulation of Motor Vehicles was held in Paris, France. This convention recommended four road signs depicting certain road hazards: humps, curves, road crossings, and railroad crossings. Many European countries ratified this convention recommendation. In 1926 the Convention Relative to Motor Traffic prescribed a modest system of six uniform signs, including the triangular-shaped "danger" sign in use today in Europe. In 1931 the Convention for the Unification of Road Signs was adopted at Geneva. The number of road signs specified increased to 26, and they were divided into three categories: danger signs, signs giving definite instructions, and information signs. In 1939 a committee of the League of Nations recommended further standardization of the international road sign system, but the Second World War postponed any implementation of the recommendations. The United Nations (U.N.) adopted a new protocol on road signs in 1949. It recommended more than 50 traffic signs and was agreed to by 30 nations. The U. N. recommended a world system of signing in 1953. This U.N. Draft Convention was not well-received, and ten years later, only two European countries had subscribed to it. The 1949 U.N. protocol is, therefore, the primary foundation of the current standardization (to the extent that standardization exists) (18.).
Zuniga describes and evaluates sign recommendations made by the United Nations Conference on Road Traffic during the period 1967-68 (12). Devices used for equivalent situations were compared, and one, or in some cases, two style(s) were chosen as the preferred sign. It is apparent, by examining the many differences in sign types still in use in various countries, that the recommendations resulting from this conference have, in large part, not been implemented. The conference's recommendations as to the preferred sign types were expected to be used by countries that were just developing road networks and traffic signing. It was not expected that the highly developed countries on the various continents would completely change their signing procedures. However, the differences between signing in Mexico and the United States, even at that time, were not as great (as far as color and shape) as were the differences between the Americas and other continents. Most of the differences in Mexican and American signing is in the legends (Spanish vs. English) and in the picture symbol used on the sign.
The United Nations Economic Commission for Europe (UNECE) Conference on Road Traffic's 1968 Vienna Convention included recommendations for legends, or supplemental plates with legends, to go along with symbols when this might make the meaning more clear (2.Q.). These suggestions are taken from the Convention's recommendations:
• Nothing in this Convention shall prohibit the addition, in order to facilitate the interpretation of signs, of an inscription in a rectangular panel below the sign or in a rectangular panel containing the sign itself, if this does not make the sign more difficult to understand for drivers who cannot understand the inscription.
11-11

• Where the competent authorities consider it advisable to make the meaning of a sign or symbol more explicit or, in the case of regulatory signs, to limit their application to certain categories of road-user or certain periods, and where it would not be possible to convey the necessary information by an additional symbol or by numerals as provided in the annexes to this Convention, an inscription shall be placed below the sign in a rectangular panel.
• The inscriptions referred to in paragraphs 3 and 4 of this Article shall be in the national language, or in one or more of the national languages, and also, if the Contracting Party concerned considers it advisable, in other languages, in particular official languages of the United Nations.
The Geneva European Agreement of May 1, 1971 further refined sign standardization (11).
NAFTA WORKING GROUP ON TRAFFIC CONTROL DEVICES
As previously mentioned, NAFT A is expected to have a significant impact on the transportation system in all three partner countries (Canada, United States, and Mexico). These countries have created several committees in an effort to address some of the most significant of the issues created by NAFT A. One of these is the Land Transportation Standards Subcommittee, which has five working groups. Working Group 3-Traffic Control Devices for Highways, is responsible for seeking compatibility of practices related to traffic control devices. To date, the group has compared the three national manuals for traffic control devices, identified ditforences, and developed initial recommendations. The working group found that the majority of signs used in the three countries are similar in shape, color, and design and that commercial and private drivers will experience only minimal inconvenience due to the differences. The group did identify several traffic control device issues where differences occur among the countries. These differences are described below.
• Metric Units - Both Mexico and Canada use the SJ. system, while the United States uses the U.S. Customary system of measurements. For speed and distance measurements, the differences are primarily an inconvenience to drivers. However, for height, width, and weight restrictions, the differences are critical for truck traffic.
• Speed Limit Sign - Each country uses a different design for its speed limit signs. Mexico's is similar to the European system (number in a red circle) while the other countries use a black on white number with words ("Speed Limit" in the U.S. and "Maximum" in Canada). In both the U.S. and Canada, a red circle is used only on prohibition signs.
• Permissive Signs - Each country uses a different method of indicating permissive and mandatory movements at an intersection. These could cause difficulties for those drivers who are not familiar with each country's methods.
• Word Message Signs - The U.S. has a higher proportion of word message signs, although all three countries use some word message signs. These signs could pose difficulties for those drivers who do not speak the language used in the sign.
• Color of Pavement Markings - The U.S. and Canada use a yellow/white pavement marking system while Mexico uses an all-white system (although some Mexican states that border the U.S. use a yellow/white system).
• Dangerous Goods/Cargo Signs - Each country has a different method of signing for hazardous cargo. Canada uses a symbol, the U.S. uses the letters "HC," and Mexico uses
11-12

a word message sign. This issue was forwarded to Working Group 5-Handling Hazardous Cargo.
• Symbol Signs - Although there are some differences in symbols among the countries, most symbols should be understandable. The weight limit symbol ("t" for metric ton versus "T" for English ton) could cause some confusion.
• Construction Traffic Control Devices - The specific signs used in work zones in the three countries are different.
The working group has developed a three-part action plan to address differences between traffic control devices. The action plan includes the following elements:
• Brochur~ The working group is in the process of developing a pamphlet for distribution at border crossings. This brochure will describe the differences in rules of the road and traffic control devices among the three countries. Initial drafts of the brochure have been targeted to commercial drivers, and the brochure appears as if it will be several pages in length.
• Dual message signing - The working group recommends that limited dual message signs be placed near the borders and crossings on selected heavily traveled NAFTA corridors. These signs are expected to focus primarily on speed limit and word-message signs directed mainly toward commercial vehicle drivers.
• Information Exchange - The working group recommends that a method of exchanging future information on changes to traffic control devices be established between the three countries.
SUMMARY OF RESEARCH ON LINGUISTICS IN SIGNING
There has been limited research in other countries related to linguistic aspects of traffic signs, particularly with respect to bilingual signs. A few of the key findings from these studies are described in the following paragraphs.
Canada
"Design and Comprehension of Bilingual Traffic Signs," by P .B. Lessage for the benefit of Transport Canada published in 1981, is a research report dealing with Canadian practices (21). The report contains the following findings:
• Bilingual signs require more reading time than monolingual signs; • The dominant language should be located either at the "top" of a "top-bottom" sign legend
configuration, or at the "left" of a "left-right" configuration; • Neither the "top-bottom" nor the "left-right" sign legend configuration was found to be
significantly better than the other; • Clear demarcation of the two languages (for example, by a line) significantly improved sign
performance, particularly for monolingual driving subjects; and • Use of "pivot" words (a word common to both languages) resulted in poorer sign
performance than corresponding fully-translated signs.
II-13

England (Wales)
Probably the most in-depth study of bilingual signs is a 1972 research study conducted in England (22). This project researched the use of bilingual signs (Welsh and English) in Wales. Many types of signs, including directional, warning, and regulatory signs, were investigated using various bilingual legend configurations on each. The findings and recommendations resulting from their research include:
• Adding Welsh to direction signs increases the reading times of most signs; • There is a greater increase in reading times on directional signs if a Welsh legend is
positioned above an English legend; • When destination names (in two languages) were paired by brackets, the reading time for
a bilingual three-destination sign was shorter than the reading time for a monolingual sixdestination sign;
• The results for the warning and regulatory signs which had supplementary plates bearing word messages were similar to those for the direction signs, namely that adding a plate bearing the message in Welsh increased the reading time, and the increase was greatest if the Welsh plate was positioned above the English one; and
• If further signs in Wales are to be made bilingual, the Welsh should be added below the English.
It should be noted that most of subject pool participating in the England study were English drivers. Furthermore, the few Welsh-speaking subjects that participated in the study all stated that they were accustomed to reading English legends on road signs. No monolingual Welsh drivers were a part of these tests.
Further research was conducted by this same laboratory in 1974 (.2.3.). This time, Welsh drivers who only speak Welsh were included. Not surprisingly, these drivers had quicker comprehension of the signs when the Welsh version of the legend was placed above the English version. However, as the author noted in the conclusion, there are many more English-speaking drivers than Welshspeaking drivers, and the safer legend combination would still be English on the '"top" and Welsh on the "bottom."
RELATED RESEARCH ON COMPREHENSION OF TRAFFIC CONTROL DEVICES
As recently as 1990, TxDOT sponsored an evaluation of motorist understanding of traffic control devices (24). During the first three years of that project, the Texas Transportation Institute conducted five different evaluations in order to assess driver comprehension of traffic control devices. The first and most comprehensive of these evaluations was a statewide survey which addressed 46 devices and was given to 1,745 Texas drivers. The survey was conducted in 12 driver licensing stations located in six geographic regions of Texas in 1991. Two of the locations were along the Texas-Mexico border. The survey sample was selected such that it was representative of the driving population of Texas with respect to gender, age, and ethnicity.
As part of the current research project, the researchers reanalyzed the earlier comprehension data to evaluate comprehension differences in the border areas. Tables II-2, 11-3, and 11-4 compare the
II-14

correct response rates for the survey results for three sample categories: overall sample of 1, 745 Texas drivers, border city sample of 156 drivers in El Paso and Eagle Pass, and non-border city sample of 1,589 drivers in 10 cities not located on the Texas-Mexico border. The border and nonborder data was not presented in this format in the original research report.
T bl II 2 M ki d s· IC h h 1991 TTI S a e . . ar ngan 1gna ompre ens10n m t e urvev Percent Correct Statistically Border>
Device Overall Border Non-Border Different 10% lower
. Single Broken Yellow Centerline marking 76.8% 66.0% 77.9% Yes Yes
No-Passing Zone markings 88.0% 87.2% 88.0% No No
Solid White Edge Line marking 74.7% 63.5% 75.8% Yes Yes
Single Broken White Lane Line marking 50.3% 38.5% 51.5% Yes Yes
Double Solid White Lane Line marking 61.0% 60.9% 61.0% No No
Two-Way Left Turn markings 58.6% 48.1% 59.6% Yes Yes
Preferential Lane (diamond) marking 65.3% 54.5% 66.3% Yes Yes
Yellow Arrow signal 80.4% 78.8% 80.6% No No
Flashing Yellow Ball signal 80.7% 71.2% 81.7% Yes Yes
Flashing Red Beacon signal 41.l% 33.3% 41.9% Yes No
Flashing Yellow Beacon signal 54.0% 44.9% 54.9% Yes Yes
Steady Red X Lane-Use Control signal 74.9% 58.3% 76.5% Yes Yes
a e - . . egu a ory l!ll om pre ens10n m e urvey Tblll3R I t s· c h . th 1991 TTI S Percent Correct
Device Sign Word or Statistically Border> Code Symbol Overall Border
Non- Different 10% lower Border
Yield Rl-2 Word 79.4% 73.7% 80.0% Yes No
• Reduced Speed Ahead R2-5a Word 93.2% 85.3% 94.0% Yes No
Speed Zone Ahead R2-5c Word 55.0% 51.9% 55.3% No No
Mandatory Tum R3-7 Word 79.5% 70.5% 80.4% Yes No
Double Turn R3-8L Symbol 65.0% 50.0% 66.5% Yes Yes
Two-Way Left Turn Lane R3-9b Symbol 44.6% 35.9% 45.4% Yes No
HOV Restriction R3-14 Word 45.7% 32.1% 47.0% Yes Yes
Slower Traffic Keep Right R4-3 Word 70.8% 57.1% 72.1% Yes Yes
Do Not Cross Double White Line R4-3B Word 72.6% 71.2% 72.8% No No
Keep Right R4-7 Symbol 69.9% 59.0% 71.0% Yes Yes
Protected Left on Green Arrow RI0-9 Word 53.0% 44.9% 53.8% Yes No
Protected Left on Green R10-9a Word 15.5% 9.0% 16.1% Yes No
Left Turn Yield on Green Ball RI0-12 Word 74.5% 65.4% 75.4% Yes Yes
II-15

T bl II 4 W doh s· c h h 1991 TTI S a e - . armn2an t er I rn ompre ens1on m t e urvey
Sign Word or Percent Correct Statistically Border> Device
Code Symbol Overall Border Non-Border Different 10°/o lower
Tum WI-I Symbol 31.9% 28.2% 32.2% No No
Curve WI-2 Symbol 32.4% 26.3% 33.0% Yes No
Reverse Tum WI-3 Symbol 66.5% 50.6% 68.0% Yes Yes
Stop Ahead W3-la Symbol 87.4% 85.3% 87.6% No No I
Lane Reduction Transition W4-2 Symbol 61.2% 53.8% 61.9% Yes No
Narrow Bridge W5-2a Symbol 81.7% 78.8% 82.0% No No
Divided Highway Ends W6-2 Symbol 50.7% 47.4% 51.0% No No
Slow Down on Wet Road W8-5 Symbol 62.3% 55.1% 63.1% Yes No
Rough Road W8-8 Word 88.7% 83.3% 89.2% Yes No
Grooved Pavement Ahead W8-12 Word 29.2% 30.1% 29.1% No No
Lane Ends Merge Left W9-2 Word 64.0% 48.7% 65.5% Yes Yes
RR Advance Warning WI0-1 Symbol 77.8% 71.8% 78.4% Yes No
Parallel RR Advance Warning WI0-3 Symbol 69.3% 58.3% 70.4% Yes Yes
Truck Crossing Wl 1-10 Symbol 66.1% 52.6% 67.5% Yes Yes
Limited Sight Distance Wl4-4 Word 44.9% 34.6% 45.9% Yes Yes
Watch for Ice on Bridge WI9-2 Word 84.0% 76.9% 84.7% Yes No
Ramp Metered When Flashing W19-3 Word 45.7% 43.6% 45.9% No No
Warning Sign Shape & Color --- --- 58.1% 50.6% 58.8% Yes No
School Speed Limit S5-I Word 79.0% 67.9% 80.1% Yes Yes
Type 3 Object Marker OM-3 Word 61.9% 59.0% 62.2% No No
Guide Sign Color -- --- 75.1% 66.7% 76.0% Yes No
The analysis of this data indicates that there are numerous traffic control devices in which the comprehension in the border areas is less than that in the rest of the state. For several of the devices, the comprehension levels in the border areas are more than 10 percentage points less than levels in the rest of the state. There are several factors, however, that were considered in interpreting this data. The survey was administered only to Texas residents and only an English-language survey was administered. Lastly, many of the questions addressed some subtle aspects of the meaning of a particular traffic control device. For instance, the question for the "flashing red beacon signal" did not ask for an interpretation of a red beacon; rather, it asked the driver to identify the color of the beacon that drivers on the intersecting roadway would see. As a result of these factors and others, the data was interpreted within the context of the questions and the possible response choices.
SUMMARY OF TELEPHONE INTERVIEWS
In order to identify opinions and perceptions at the local levels, the researchers conducted telephone interviews of personnel from transportation agencies, tourist organizations, and
II-16
commercial transportation businesses on both sides of the border. Interviews of U.S. officials were conducted in English and those of Mexican officials were generally conducted in Spanish.
Interviews of U.S. Officials
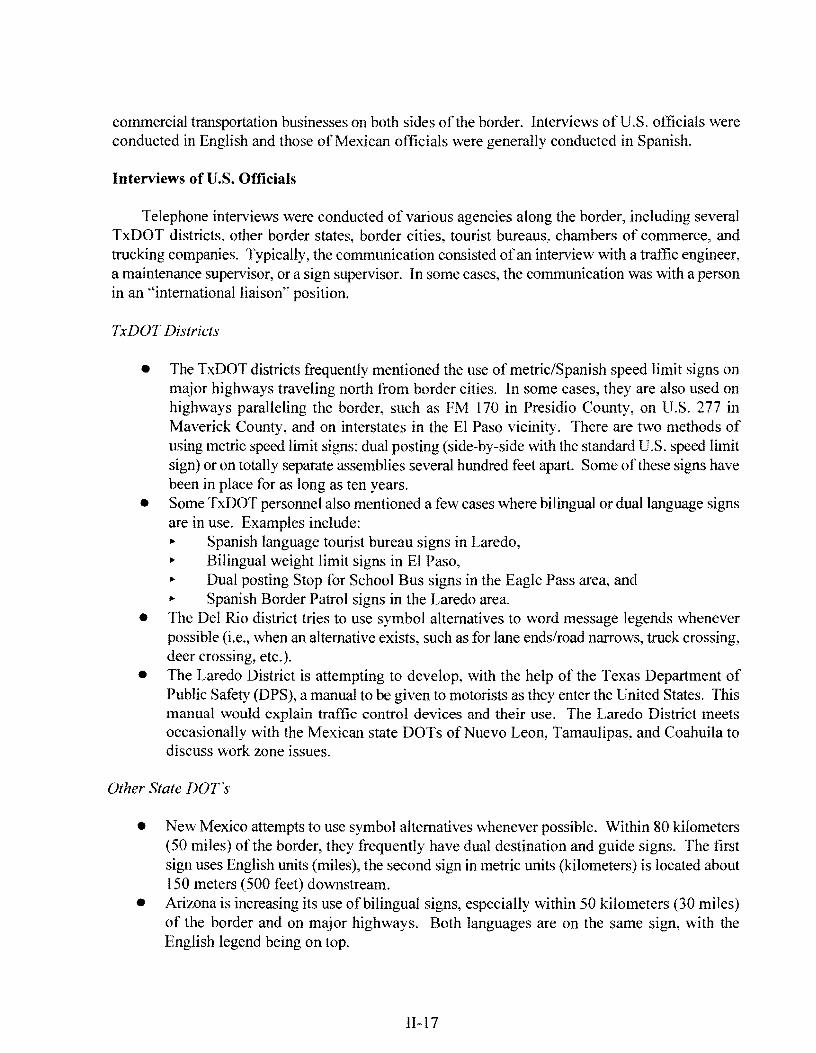
Telephone interviews were conducted of various agencies along the border, including several TxDOT districts, other border states, border cities, tourist bureaus, chambers of commerce, and trucking companies. Typically, the communication consisted of an interview with a traffic engineer, a maintenance supervisor, or a sign supervisor. In some cases, the communication was with a person in an "international liaison'' position.
TxDOT Districts
• The TxDOT districts frequently mentioned the use of metric/Spanish speed limit signs on major highways traveling north from border cities. In some cases, they are also used on highways paralleling the border, such as FM 170 in Presidio County, on U.S. 277 in Maverick County, and on interstates in the El Paso vicinity. There are two methods of using metric speed limit signs: dual posting (side-by-side with the standard U.S. speed limit sign) or on totally separate assemblies several hundred feet apart. Some of these signs have been in place for as long as ten years.
• Some TxDOT personnel also mentioned a few cases where bilingual or dual language signs are in use. Examples include: "' Spanish language tourist bureau signs in Laredo, "' Bilingual weight limit signs in El Paso, "' Dual posting Stop for School Bus signs in the Eagle Pass area, and "' Spanish Border Patrol signs in the Laredo area.
• The Del Rio district tries to use symbol alternatives to word message legends whenever possible (i.e., when an alternative exists, such as for lane ends/road narrows, truck crossing, deer crossing, etc.).
• The Laredo District is attempting to develop, with the help of the Texas Department of Public Safety (DPS), a manual to be given to motorists as they enter the United States. This manual would explain traffic control devices and their use. The Laredo District meets occasionally with the Mexican state DOTs ofNuevo Leon, Tamaulipas, and Coahuila to discuss work zone issues.
Other State DOT's
• New Mexico attempts to use symbol alternatives whenever possible. Within 80 kilometers (50 miles) of the border, they frequently have dual destination and guide signs. The first sign uses English units (miles), the second sign in metric units (kilometers) is located about 150 meters (500 feet) downstream.
• Arizona is increasing its use of bilingual signs, especially within 50 kilometers (30 miles) of the border and on major highways. Both languages are on the same sign, with the English legend being on top.
II-17

• California does not have any signs with metric units yet However, they have a few bilingual signs for such information as "Fasten Seat Belts," "Pedestrian Crossing," and "Last Exit."
• None of the agencies contacted thus far knew of any special initiatives or any research being conducted with regards to traffic control devices and driver information needs in the border area.
Interviews of Mexican Officials
Interviews were also conducted, in Spanish, of various Mexican officials and representatives of trucking companies. The results of these surveys are described below.
• Mexican transportation officials stated that the major problem in interpreting U.S. traffic signs, in general, is the implementation of English units in sign legends. An example of this is on the Speed Limit sign, which uses miles per hour as the unit of measurement. The use of English units makes it confusing since most speedometers on Mexican vehicles are in kilometers per hour.
• Some officials indicated a belief that U.S. traffic regulations are not fully understood by Mexican drivers. Those drivers who may have a basic understanding of the regulations experience frustrations when the regulations are not practiced uniformly from state to state.
• Several individuals noted that Mexican tourists had difficulty locating car repair shops when on the freeway system.
• Tourist bureau officials indicated that the use of route numbers to identify highways made navigation more difficult. They indicated that drivers preferred the use of destination signing. The same officials also mentioned the difficulties created by the use of the English system of measurement, as opposed to the metric system.
• In Mexico, a program called PAI SANO provides information regarding Mexican traffic regulations, immigration requirements, the Federal Highway Police, and other information to Mexican-American tourists coming into Mexico. This information is available from a portable stand located in the Mexican customs inspection facility. The same officials indicated an interest in participating if a similar program could be developed for Mexican tourists entering the United States.
• The Mexican trucking companies surveyed indicated that drivers are not required to speak English in order to drive across the border into the U.S. An exception to this rule is drivers transporting hazardous materials.
• Some companies indicated that communication by CB radio is very helpful for drivers that get lost while driving in the United States.
II-18

CHAPTER III
SURVEY ACTIVITIES
The first year of this research project was devoted to information gathering and problem identification. The previous chapter described the information acquired from the literature and various organizations or individuals. However. the most intensive first-year efforts were devoted to developing and administering two different surveys: a critical incident survey and a survey of driver comprehension of existing traffic control devices. Both of these surveys focused on drivers coming into Texas from Mexico.
As originally proposed, the critical incident survey was scheduled for the first year of the project and the driver comprehension survey was scheduled for the second year of the project. However, the first phase of the critical incident survey, which addressed short-haul truck drivers, did not produce sufficient information for indicating navigational difficulties. Therefore, the researchers accelerated the project schedule so that the driver comprehension survey (originally a second-year activity) could be developed and administered during the first year.
CRITICAL INCIDENT SURVEY
At the beginning of the research project, the researchers were concerned that navigation was a significant difficulty of Mexican drivers entering Texas. Therefore, a critical incident survey was developed to assess the effectiveness of guidance information.
The critical incident survey is a human factors technique used by TTI in previous studies of guide signs (Ll., 22) to identify highway locations where drivers become lost or confused. The survey is conducted by interviewing drivers to identify locations where they were lost or confused. The interviewers ask specific questions about these locations and attempt to confirm the exact location of the difficulty, attempting to discern the reasons the driver may have been lost or confused. These locations are described as the "critical incident sites." Information is then gathered about these sites. The information may include photos, videotapes, or design plans. A human factors/traffic engineering analysis is then conducted using this information to identify common characteristics and specific signing deficiencies that might cause navigational difficulties. The survey is not intended to identify all locations where drivers are experiencing navigational difficulties. Rather, it is intended as a screening tool that can be used to identify and classify typical navigational difficulties of the target population.
The critical incident survey developed for this project was based on the critical incident survey developed by TTI for evaluating international drivers in Florida (.Ll.). Researchers from the University of Texas - Pan American (UTPA) attempted to administer the survey to short-haul truck drivers at several border locations. Unfortunately, the UTPA researchers were not able to identify any drivers who were able to describe specific sites where they had navigational difficulties. As a result, the critical incident survey did not provide any information that could be used in the first-year problem identification effort. There may be several reasons why the desired information was not obtained. Some of the more likely reasons are listed below.
III-1

• Respondents could not remember sufficient details associated with an incident of being lost or confused;
• Respondents could not identify the specific location where they were lost or confused; • Respondents traveled only in familiar areas; and • Respondents would not admit to having been lost or confused.
TRAFFIC CONTROL DEVICE SURVEY
Once it appeared that the results of the critical incident survey would provide limited information, the researchers began development of a survey to evaluate driver comprehension of traffic control devices. The comprehension survey was developed in three phases. The first phase was a pretest administered in College Station, the second phase was the pilot survey administered in McAllen, and the third phase was the final survey administered in El Paso and McAllen.
Pretest Survey
The initial development of the comprehension survey began with a pretest instrument. In developing the pretest instrument, the researchers developed a format and procedure for the survey, selected the devices to include in the survey, and identified the responses that were most likely to be given for each device. Once prepared, the survey was administered to the Texas A&M University chapter of the Committee for the Awareness of Mexican American Culture and to an "English as a Second Language" class at Texas A&M. The information gained from the pretest survey was used to develop the pilot survey. The actual comprehension results of pretest survey were not analyzed for several reasons. First, the survey was not administered at a border location. This meant that the survey sample was not necessarily representative of the border area. Furthermore, the survey questions were in the early developmental phase and did not always provide the information needed to assess driver understanding of traffic control devices.
Pilot Survey
The pilot survey was conducted, as is appropriate, to test the survey instrument, the survey technique, and the method of analysis. The pilot survey was a crucial element of the research process, as the researchers had little experience with administering this type of survey under the particular circumstances of this project. The intent of the survey was to identify aspects of the survey content and administration procedure needing improvement.
The pilot survey addressed 26 devices and was administered to approximately 300 drivers at the international port crossing between Reynosa, Tamaulipas and McAllen, Texas in May 1996 .. The survey was given to drivers while waiting in the queue to cross the bridge from Mexico to Texas. The survey utilized a flashcard format where the surveyor presented a flashcard with an image of a traffic control device, then asked a question about the sign. The driver's response was recorded on a data form by the surveyor. To expedite the data recording process, typical answers were provided on the data form. If the response was different from one of the expected responses, the surveyor wrote that response on the form. The surveyor showed the driver as many flashcards as possible while the vehicle was in the bridge queue. Therefore, the number of questions per driver varied from just a few to many. The survey was administered over a two-day period (Friday and Saturday) and included both commercial/business and tourists drivers coming into Texas from Mexico.
111-2

For the analysis, the survey responses which were not one of the expected answers on the data f 01m were first translated from Spanish to English. Each response was then categorized into one of four results: correct, partially correct, incorrect, or not sure. The definitions of these categories for each device are given in Appendix A. Percentages were calculated for each response to every device. Table III-I summarizes comprehension results for the devices in the pilot survey. Appendix A provides a more detailed analysis of the results and a table summarizing the demographic characteristics of the pilot survey sample.
T bl III 1 R f h p·1 s a e - . esu ts o t e I Of urvev
Device No. of Response Rates (percent)
Drivers Correct Partially Correct Incorrect Not Sure
Stop sign 69 99 NIA I 0
Yield sign 81 40 NIA 41 20
Do Not Enter sign 82 72 NIA 23 5
DayiNight Speed Limit signs 69 39 41 16 4
Day/Night Truck Speed Limit signs 79 11 38 51 0
Mexican Speed Limit sign 86 26 42 33 0
One Way sign 82 2 44 48 6
Protected Left on Green Arrow sign 79 5 15 77 3
Left Tum Yield on Green Ball sign 65 2 14 82 3
Two Way Left Tum sign 67 5 10 84 2
Crossbuck sign (meaning) 69 0 68 26 6
Crossbuck sign (location) 60 50 NIA 48 2
Stop for School Bus Loading or Unloading sign 60 0 26 74 0
Fasten Safety Belts - State Law sign 85 11 22 14 53
Trucks Use Right Lane sign 74 50 16 18 16
Weight Limit IO Tons sign 77 21 34 31 14
Hazardous Cargo Route sign 80 I NIA 15 84
•Hazardous Cargo Prohibited sign 68 0 3 22 75 1
Single Broken Yellow Center Line marking 84 0 33 57 IO
No Passing Zone marking 72 0 32 61 7
Double Solid White Line marking 78 19 NIA 73 8
Hill sign 72 0 36 46 18
Clearance sign 86 24 27 27 22
Right Lane Ends sign 80 IO NIA 71 19
Advisory Speed Plate 67 27 22 49 2
School Bus Stop Ahead sign 79 I 6 87 4
Rh!.ht Lane Closed 500 Ft 78 0 32 54 14
Note: NI A - there Is no acceptable partially correct response to the question for this device.
III-3

It should be noted that to be classified as correct, many responses required mention of some subtle aspects of the sign definition. For example, to be classified as correct, responses to the Crossbuck sign (Rl 5-1) required the driver to state that the device indicated a railroad crossing and that the sign is located at the crossing location (as opposed to an advance sign placement).
Final Survey
Once the pilot survey was administered and the results had been analyzed, the researchers identified several areas where the survey could be improved. Therefore, changes were made to the devices addressed in the survey, the format of the questions, and the procedure for administering the survey. This final survey addressed 33 devices and was administered to over 750 drivers at international port crossings in El Paso, McAllen, and Pharr, Texas.
A significant change in the final survey was the inclusion of formal follow-up questions to the primary survey questions. These follow-up question(s) were necessary to ascertain whether a driver understood some of the subtle meanings of devices and to allow comparisons between driver responses. In the pilot survey, the form and content of follow-up questions was at the discretion of the person administering the survey. However, this made it difficult to compare the responses of different survey participants.
The results of the pilot survey also indicated the need to make other changes in the final survey instrument. These changes included the addition of some devices, deletion of other devices, and improved graphics, as well as changes in survey administration. The method of recording responses on the data form did not provide the necessary level of detail needed for a thorough analysis. In the final survey, drivers' responses were recorded on a tape recorder. The tape-recorded responses were then categorized as correct, partially correct, incorrect, and not sure. A fifth category, indeterminate, was added to account for responses that were either inaudible on the tape during playback or where a mechanical failure occurred during the survey administration.
The final survey was administered at the same international port crossings in McAllen and Pharr, Texas, as well as in El Paso, Texas, in August 1996. As with the pilot survey, this survey was given to drivers while waiting in the queue to cross the bridge from Mexico to Texas. The survey utilized a similar flashcard format, where the surveyor would present to a driver a flashcard with an image of a traffic control device, and ask a question about the device. The driver's response was recorded on audio tape for later analysis. The surveyor showed the driver as many flashcards as possible while the vehicle was in the bridge queue. Therefore, the number of questions per driver varied from just a few to many. The survey was administered over a three-day period in each city. The days were Thursday, Friday, and Saturday and included both commercial/business and tourist drivers coming into Texas from Mexico.
The devices presented were divided into four sets. Set 1 contained basic traffic control devices that address right-of-way and speeds, Sets 2 and 3 contained a variety of devices, and Set 4 contained the devices related to trucks. Each set contained approximately 8 devices. The survey sets, or portions thereof, were administered to a total of 759 drivers. Each driver answered an average of about 23 questions. For Sets 1 through 3, there were at least 500 responses to the primary question for each device, with many devices having over 600 responses.
III-4

For each device, a researcher listened to the recorded response to the primary question, interpreted the response according to the criteria, and recorded the answer category (correct, partially correct, incorrect, not sure, or indeterminate.) on a data form. Appendix B contains the criteria used to classify the responses to each question. Responses to follow-up questions, if any, were interpreted in the same manner. Typically, if a response did not meet the criteria for a correct or partially correct answer, the response was categorized as incorrect.
The analysis of the survey responses was a time-intensive effort, as a total of some 17 ,500 responses were interpreted. Tables 111-2, 111-3, 111-4, III-5, 111-6, and 111-7 summarize the comprehension results for the different types of devices addressed in the final survey. Appendix B provides a more detailed analysis of the results and a summary of the demographic characteristics of the final survey sample.
a e - . ma T bl III 2 F' I S urvey esu s or R It fi R I t e2u a ory s· 12ns
Response Rates (percent)
Device Question Sample
Size Partially Not Correct
Correct Incorrect
Sure Unknown
Stop sign Primary 601 98.7 0.0 0.5 0.2 0.7
Yield sign Primary 603 63.9 0.0 21.5 13.6 l.O
Primary 601 82.3 15.2 1.3 0.5 0.7 Day/Night Speed Limit signs
Follow-up 462 82.5 0.0 9.7 6.l 1.7
Do Not Enter sign Primary 582 90.7 0.0 4.6 3.4 l.2
One Way sign Primary 560 83.3 0.0 13.8 1.6 l.3
Stop for School Bus Loading or Primary 557 57.9 24.2 14.6 3.3 0.0
Unloading sign Follow-up 274 64.6 0.0 27.4 5.4 2.5
Primary 587 33.2 23.2 5.5 36.6 l.5 Fasten Safety Belts - State Law
Follow-up 156 89.2 0.0 7.0 l.3 2.6
111-5

T bl III 3 F. I S R It fi W s· a e - . ma urvev esu s or arnmg 1gns
Response Rates (percent)
Device Question Sample
Size Correct Partially
Incorrect Not
Unknown Correct Sure
I Primary 528 65.4 30.8 2.5 LO 0.4
Curve sign with Advisory Speed Follow-up 62 76.9 0.0 20.0 1.6 1.6
Plate Follow-up 114 44.l 48.7 4.5 1.8 0.9
Follow-up 42 86.4 2.3 9.1 0.0 2.3
Two-Way Traffic sign Primary 538 93.3 0.6 4.1 1.9 0.2
Advance Railroad Warning sign Primary 602 39. I 40.5 6.5 12.8 1.2
Primary 545 52.3 34.3 11.6 1.5 0.4
School Crossing sign Follow-up 125 68.5 0.0 29.I 1.6 0.8
Follow-up 63 63.9 0.0 32.8 3.3 0.0
T bl III 4 F" l S R It fi 0th s· a e - . ma urvev esu s or er 1gns
Response Rates (percent)
Device Question Sample
Size Partially Not Correct
Correct Incorrect
Sure Unknown
Primary 579 80.3 1.0 2.9 14.9 0.9
Road Work Ahead sign Follow-up 380 64.5 28.7 5.8 0.0 1.1
Follow-up 4 88.9 0.0 0.0 0.0 I I.I
Two Right Lane Ends signs - One Primary 502 8.4 11.2 16.9 62.3 1.2
Orange and One Yellow Follow-up 328 46.5 6.0 19.3 32.6 1.5
III-6

T bl III 5 F' I S R i T k R I d s· a e - . ma urvey esu ts or rue e ate U!DS
Response Rates (percent)
Device Question Sample
Size Partially Not Correct
Correct Incorrect
Sure Unknown
Primary 144 63.9 29.9 4.2 l.4 0.7
Day/Night Truck Speed Limit signs Follow-up 111 92.0 0.0 7.2 0.9 0.0
Follow-up 116 65.5 0.0 31.0 2.6 0.9
Low Clearance sign Primary 134 67.7 11.3 9.0 9.8 2.3
Weight Limit IO Tons sign Primary 132 68.8 17.2 8.6 5.5 0.0
Primary 126 1.6 5.7 40.3 50.8 1.6 Load Zoned Bridge sign
Follow-up 12 16.7 0.0 58.3 16.7 8.3
Primary 124 29.8 3.2 25.8 39.5 l.6
Weigh Station Next Right sign Follow-up 28 79.3 0.0 10.3 6.9 3.5
Follow-up 29 83.3 3.3 3.3 6.7 3.3
Primary 121 64.2 22.5 10.8 2.5 0.0 Hill sign
Follow-up 74 67.7 0.0 30.7 1.3 1.3
Primary 118 31.4 0.9 14.4 53.4 0.0 Hazardous Cargo Route sign
Follow-up 20 65.0 0.0 5.0 20.0 10.0
Hazardous Cargo Prohibited sign Primary 116 28.1 11.4 21.l 39.5 0.0
III-7

T bl Ill 6 F. I S R It f, P tM k' a e - . ma urvey esu s or avemen ar m2s
Response Rates (percent)
Device Question Sample
Size Partially Not Correct
Correct Incorrect
Sure Unknown
Broken Yell ow Centerline Pavement Marking - I-way or 2- Primary 593 72.2 0.0 25.3 1.5 1.0 way
Broken Yellow Centerline Pavement Marking - passing Primary 589 36.8 38.0 22.8 0.5 1.9 restrictions
No Passing Zone Pavement Primary 573 84.J 0.0 12.2 1.9 1.8
Markings
Broken White Lane Line Pavement Primary 503 51.5 0.0 45.2 2.6 0.8
Marking - I-way or 2-way
Broken White Lane Line Pavement Primary 494 81.8 0.0 14.3 1.4 2.4
Marking - passing restrictions
T I II 7 F. ab e I- . mal s urvey Results orTra m s· IC uma II d. n 1cations an d s· 12na Is· 12mn2
Response Rates (percent)
Device Question Sample
Size Partially Not Correct
Correct Incorrect
Sure Unknown
Red Ball signal indication Primary 600 97.7 0.0 2.0 0.0 1.0
Yellow Ball signal indication Primary 600 97.7 0.5 2.0 0.2 0.2
Green Ball signal indication Primary 596 97.6 0.3 0.7 0.2 1.2
Green Left Arrow signal indication Primary 586 80.8 0.0 17.6 0.5 1.2
Green Left Arrow signal indication with Protected Left on Green Primary 564 72.1 0.0 24.9 0.9 2.1 Arrow sign
Green Ball signal indication for left Primary 538 79.0 0.0 17.6 1.5 1.9
tum - no sign
Green Ball signal indication for left tum -Left Tum Yield on Green Primary 500 78.2 0.0 17.2 2.6 2.0 Ball sign
In general, the results of both comprehension surveys indicate that most of the Mexican drivers participating in the surveys understood the traffic control devices that were evaluated. About half of the devices had correct response percentages of over 80 percent. Messages that appear to be especially well understood include:
III-8
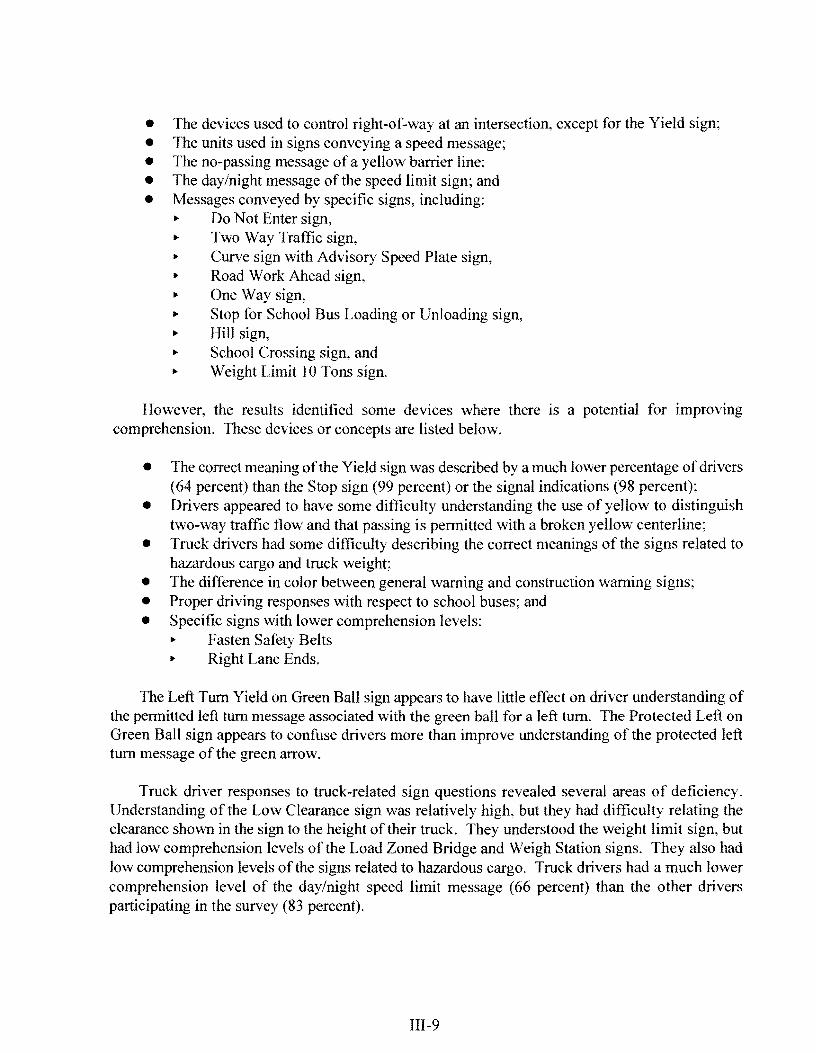
• The devices used to control right-of-way at an intersection, except for the Yield sign; • The units used in signs conveying a speed message; • The no-passing message of a yellow barrier line; • The day/night message of the speed limit sign; and • Messages conveyed by specific signs, including:
• Do Not Enter sign, • Two Way Traffic sign, • Curve sign with Advisory Speed Plate sign, • Road Work Ahead sign, • One Way sign, • Stop for School Bus Loading or Unloading sign, • Hill sign, • School Crossing sign, and • Weight Limit 10 Tons sign.
However, the results identified some devices where there 1s a potential for improving comprehension. These devices or concepts are listed below.
• The correct meaning of the Yield sign was described by a much lower percentage of drivers (64 percent) than the Stop sign (99 percent) or the signal indications (98 percent);
• Drivers appeared to have some difficulty understanding the use of yellow to distinguish two-way traffic flow and that passing is permitted with a broken yellow centerline;
• Truck drivers had some difficulty describing the correct meanings of the signs related to hazardous cargo and truck weight;
• The difference in color between general warning and construction warning signs; • Proper driving responses with respect to school buses; and • Specific signs with lower comprehension levels:
• Fasten Safety Belts • Right Lane Ends.
The Left Turn Yield on Green Ball sign appears to have little effect on driver understanding of the permitted left tum message associated with the green ball for a left tum. The Protected Left on Green Ball sign appears to confuse drivers more than improve understanding of the protected left turn message of the green arrow.
Truck driver responses to truck-related sign questions revealed several areas of deficiency. Understanding of the Low Clearance sign was relatively high, but they had difficulty relating the clearance shown in the sign to the height of their truck. They understood the weight limit sign, but had low comprehension levels of the Load Zoned Bridge and Weigh Station signs. They also had low comprehension levels of the signs related to hazardous cargo. Truck drivers had a much lower comprehension level of the day/night speed limit message (66 percent) than the other drivers participating in the survey (83 percent).
III-9


CHAPTER IV
INITIAL FINDINGS
The purpose of the first year of this research project was to evaluate the use of traffic control devices in border areas and to identify areas where improvements might be developed. The first-year activities were concentrated in three areas: information gathering, a critical incident survey, and driver comprehension surveys. Information about border area characteristics a<> they relate to traffic control devices was collected from the literature and telephone interviews of various individuals. Originally, the critical incident survey was intended to be the major effort of the first year. However, it was difficult to identify drivers who could provide the necessary type of information about critical incidents, and the information obtained from this effort was limited. As a result, the researchers accelerated the project schedule and conducted the comprehension surveys of traffic control devices during the first year.
In general, the information obtained during the first year of the project indicate that the existing system of traffic control devices used in the Texas border area functions well. There are some specific items where improvements should be considered. These improvements are described below.
• When to stop for a school bus appeared to confuse drivers. Potential treatments should concentrate on the bus and not signing;
• Handout information should be developed for Mexican truck drivers, with careful consideration to account for drivers that may be illiterate;
• Bilingual signing should be developed for the following applications: ,. Hazardous cargo signs, ,. Weight limits and weigh station signs, ,. Vertical clearances, including metric plaques for clearance dimensions, and ,. the Fasten Safety Belt sign;
• Explanatory signing should be developed for use on heavily traveled highways headed north from the border. These signs should explain the meaning of key traffic control device concepts. Specific concepts that should be addressed in these signs are: ,. Driver response to yellow pavement markings, and ,. Meaning of yellow barrier lines.
• The Mexican drivers participating in the survey appeared to have adequate understanding of the U.S. speed limit sign. Therefore, no changes are recommended for this sign at this time. However, additional evaluations should be conducted of the existing sign and the effectiveness of using signs (dual posting or bilingual) targeted to Mexican drivers.
For many of the comprehension limitations identified in the first year, there are limited engineering actions that could improve comprehension. In many cases, some form of driver education presents the most effective improvement strategy. Therefore, during the second year of this project, the researchers will develop a brochure that can be distributed at border crossings. This brochure will provide traffic control device information to address the weaknesses identified by the research.
IV-1

Driver understanding of the Yield sign was significantly different than that of the other traffic control devices related to intersection right-of-way. The differences between the U.S. and Mexican Yield signs are minor, so the difference in comprehension levels may be attributable to some other factor, such as the difficulty in verbalizing the "yield" concept, the interpretation of the Spanishlanguage response by researchers, or a possible lack of understanding of the question.
IV-2

CHAPTERV
REFERENCES
1. Texas Manual on Uniform Traffic Control Devices. Texas Highway Department, Austin, Texas, 1954.
2. Saenz, R., and M. Ballejos. "Industrial Development and Persistent Poverty in the Lower Rio Grande Valley," in Forgotten Places: Uneven Development in Rural America, University Press of Kansas, 1992. pp. 102-124.
3. The Texas Border Fact Book. Texas Centers for Border Economic Development, 1990. 4. Polkinhorn, H., R, Reyes, and G. Munoz. Open Signs: Language and Society on the United
States-Mexico Border. Binational Press, Calexico, California/Mexicali, Baja California, 1993. 5. Dailey, R. "Activists Call Mexican Trucks Hazardous," in The Valley Morning Star, December
13, 1995, pp. A2. 6. Grant, M.L. "Morales, Valley Square Off on Mexican Trucking Regulations," in The Valley
Morning Star, October 30, 1995, pp. IA & 12A. 7. Texas Manual on Uniform Trqffic Control Devices. Texas Department of Transportation,
Austin, Texas, 1980, revised to March 1994. 8. Manual on Uniform Traffic Control Devices for Streets and Highways, U.S. Department of
Transportation, Federal Highway Administration, Washington, D.C., 1988. 9. Manual De Dispositivos Para El Control Del Transilo En Calles Y Carreteras. Secretaria de
Comunicaciones y Transportes, April I 986. I 0. Pezo, R., and Gordon Cook. Impacts of Increased Trade on Highway Safety Along the
Texas/Mexico Border. Research Report 1984-1 F, University of Texas at El Paso, El Paso, Texas, December 1993.
11. English/Spanish Highway Technical Reference Terms and Definitions, Final Report. Research Report 91-09, New Mexico State Highway and Transportation Department, Santa Fe, New Mexico, 1991.
12. Hubaud, L., and Linda Meadow. Los Angeles Metro Blue Line Enforcement Program. Metropolitan Transit Authority, Los Angeles, California, 1995.
13. Automated Rail Crossing Enforcement. (A marketing brochure). Traffic Services Group, U.S. Public Technologies, Inc., San Diego, California, 1994.
14. Evaluation of International Signing Practices, Final Report. Wilbur Smith and Associates in association with Texas Transportation Institute and Elizabeth Kurz and Company, Orlando, Florida, November 1994.
15. Dudek, C.L., R.D. Huchingson, H.G. Hawkins, and N. Trout. Evaluation of International Signing Practices, Volume 2-Appendix A. Texas Transportation Institute, College Station, Texas, November 1994.
16. Uniform Traffic Control Devices for Canada. Metric Edition. Roads and Transportation Association of Canada, Ontario, Canada, January 1976.
17. Bernhard, M. Trends in Road Signing in Europe. In Transportation Research Circular 297, TRB, National Research Council, Washington, D.C., 1985, pp. 18-21.
18. Session Ill - Standards Development. Proceedings of International Conference on Highway Sign Symbology. International Road Federation and U.S. Department of Transportation, Federal Highway Administration, Washington, D.C., June 1972.
V-1
19. Zuniga, J.M. International Effort Toward Uniformity on Road Signs, Signals and Markings. In Highway Research Record No. 299, HRB, National Research Council, Washington, D.C., 1969, pp.1-17.
20. Draft Convention on Road Signs and Signals of the U.N. Conference on Road Traffic. Vienna, Austria, Oct-Nov. 1968. U.N. Economic and Social Council, New York, Document E/Conf. 56/17, Nov. 1968.
21. Lesage, P.B., Design and Comprehension of Bilingual Traffic Signs. Road and Motor Vehicle Traffic Safety Branch, Transport Canada, Ottawa, Ontario, March 1981.
22. Rutley, K.S. An Investigation into Bilingual (Welsh/English) Traffic Signs. Research Report LR 475, Transportation and Road Research Laboratory, Department of the Environment, Crowthorne, Berkshire, 1972.
23. Rutley, K.S. A Second Investigation into Bilingual (Welsh/English) Traffic Signs. Supplementary Report 34 UC, Transportation and Road Research Laboratory, Department of the Environment, Crowthorne, Berkshire, 1974.
24. Hawkins, H.G. Jr., K.N. Womack, and J.M. Mounce. Motorist Understanding o/Trciffic Control Devices: Study Results and Recommendations. Research Report 1261-4, Texas Transportation Institute, College Station, Texas, March 1994.
25. Brackett, Quinn, R.D. Huchingson, N.D. Trout, and K.N. Womack. Highway User Operational Information. Research Report 957-1, Texas Transportation Institute, College Station, Texas, February 1991.
V-2

APPENDIX A
RESULTS OF PILOT COMPREHENSION SURVEY
This appendix presents the detailed results of the driver comprehension pilot survey administered on the international bridge between Reynosa, Tamaulipas (Mexico) and McAllen, Texas (U.S.) on May 10-11, 1996. The survey used a flashcard format, where a driver was shown an image of a traffic control device and asked to answer a question about the devices. The responses were recorded on a data form for later analysis. In analyzing the responses, the researchers classified each response as correct, partially correct, incorrect, or not sure according to the definitions given for each device on the following pages.
Table A-1 presents the demographic information for the pilot survey. Tables A-2 through A-28 present the results of the pilot survey.
T bl A 1 D h. Ch t . f f. th P'l t S y a e - . emo2rap ic arac eris ics or e 10 urve
Characteristic Frequency Percent
Male 273 82.0%
Gender Female 51 15.3%
N/R 9 2. 7rl/o i
< 25 ,.,,.,
9.9% ·'-'
25-55 247 74.2% Age
>55 44 13.2%
N/R 9 2.7%
Passenger Car 189 56.8%
Single Unit 14 4.2%
Type of Vehicle Tractor/Trailer 109 32.7%
Bus 7 2.1%
N/R 14 4.2%
Note: N/R =not recorded
A-1

a e - . 10 urvey espouses or op lf!D T bl A 2 p·1 t S R fi St s· Stop What is this sign telling you?
Category Response
torrect must come to a complete halt/stop/alto
Partially Correct no acceptable response
Incorrect all other responses
Not Sure
Total number of responses
Yield
ategory
Partially Correct
Incorrect
ot Sure
Table A-3. Pilot Surve
hat does this sign tell you?
Response
must give/cede/yield right-of-way to traffic on the other roadway
no acceptable response
all other responses
Total number ofres onses
No.
68
0
I
0
69
No.
32
0
.,,.,
.:u
16
81
Percent
98.6%
0.0%
1.4%
0.0%
100%
Percent
39.5%
0.0%
40.7%
19.8%
100%
a e - . I Ot urvev esponses or 0 ot n er 1gn T bl A 4 p·1 S R fi D N E t s· Do Not Enter What does this sign indicate?
[Category Response No. Percent
Correct you may not enter the roadway from this direction or
59 72.0% wrong way
Partially Correct no acceptable responses 0 0.0%
Incorrect all other responses 19 23.2%
Not Sure 4 4.9%
Total number of responses 82 100%
A-2
Rl-1
• Rl-2
R5-1
=

T ab e A-5. p·1 s I Ot urvev R esponses for Dav/Nig:ht Soeed Limit it?D
Speed Limit What does 70 mean on this sign? R2-I & R2-3
K::ategory Response No. Percent
1Correct maximum speed/maximum velocity/speed limit (JJJJ/_
27 39.1% SPEEDi
units (70 miles per hour) LIMIT I
Partially Correct maximum speed/maximum velocity/speed limit or
28 40.6% 701 units (70 miles per hour)
Incorrect all other responses 11 15.9%
m !Not Sure 3 4.3%
Total number of responses 69 100%
T bl A 6 p·1 S R fl D IN" h T k S d L" "ts· a e - . I Ot urvev esvonses or av, U!i t rue ioee 1m1 1gn
Truck Speed Limit What does the 60 in this sign mean? R2-2a& R2-3
!Category Response No. Percent
Correct maximum speed/velocity for trucks and units ( 60
9 11.4% TRUCK miles per hour) SPEED
Partially Correct maximum speed/velocity for trucks QI.. units (60 miles LIMIT per hour)
30 38.0%
60 Incorrect all other responses 40 50.6%
II !Not Sure 0 0.0%
Total number of responses 79 100%
a e - . 1 ot, urvev T bl A 7 P'l S R esponses f M or exican Sneed Limit Sit?:n
Mexican Speed Limit What does the JOO mean in this sign? ----K::ategory Response No. Percent
!Correct maximum speed/velocity (JJJJ/_ units (I 00 kilometers
22 25.6% per hour)
Partially Correct maximum speed/velocity QI.. units (I 00 kilometers per
36 41.9% ~ hour)
Incorrect all other responses 28 32.6%
!Not Sure 0 0.0%
Total number of responses 86 100%
A-3

T bl A 8 P"l t S a e - I 0 urvey R espouses fi o w s· or ne ay 1gn
One Way What is this sign telling you? R6-l
~ategory Response No. Percent
Correct all traffic moves in direction of arrow 2 2.4%
Partially Correct one-way 36 43.9% loNE WAY)
1lncorrect all other responses 39 47.6%
Not Sure 5 6.1%
Total number of responses 82 100%
T bl a e A-9 p·1 s . I Ot urvey R espouses fi p or rotecte dLf . et on G re en A rrow s· 1gn
Protected Left on If you want to turn left at an intersection, what is this sign telling you? RI0-9 K;reen Arrow
Category Response No. Percent
Correct you have the right-of-way when the green arrow is on
4 5.1 % and you must yield right-of-way with the green ball
Partially Correct you have the right-of-way when the green arrow is on
12 15.2% or you must yield right-of-way with the green ball ~-10
Incorrect all other responses 61 77.2% s ' • Not Sure 2 2.5%
Total number of responses 79 100%
T bl A 10 p·1 S a e - . I Ot urvey R esponses fi L ft T or e urn y· Id 1e on G reen B II s· a 1gn
Left Turn Yield on If you have a green signal, what is this sign telling y ou? Rl0-12 K;reen Ball
(:ategory Response No. Percent
Correct left tum okay on green ball fll1JI. must after yielding
I 1.5% right-of-way - [Q LUI TURN
wait for green arrow or left tum okay on green ball YIELD Partially Correct 9 13.8% ON CRCU ·o
after yielding right-of-way • 0 Incorrect all other responses 53 81.5%
!Not Sure 2 3.1%
rrotal number of responses 65 100%
A-4

T bl A 11 p·1 S R fi T W L ftT s· a e - . I ot unrey esponses or WO av e urn um
lfwo Way Left Turn What is this sign telling you? R3-9b
!Category Response fil Percent
Correct center lane is used only for making left turns 3 4.5% CENTER LANE
Partially Correct left turn or center lane used for turning 7 10.4%
~~ Incorrect all other responses 56 83.6% ONLY
!Not Sure l 1.5%
lfotal number ofresoonses 67 100%
Table A-12. Pilot Sun.rev Resoonses for Crossbuck Si!!n (MeaninP)
(:rossbuck What does this sign indicate? Rl5-l
category Response No. Percent
Correct railroad crossing and sign located at the tracks 0 0.0%
Partially Correct railroad crossing 47 68.1% 1)( Incorrect all other responses 18 26.1%
!Not Sure 4 5.8%
rrotal number of responses 69 100%
Table A-13. Pilot Sun.rev Responses for Crossbuck Si!!n (Location)
Crossbuck Where is this sign located? R15-l
Category Response No. Percent
Sorrect at/on the tracks 30 50.0%
Partially Correct no acceptable response 0 0.0% ~ (:) :'1~ .... ~
Incorrect all other responses 29 48.3% "'"' ~r:::, l:)
!Not Sure I 1.7% ~ ~
rrotal number of responses 60 100%
A-5

T bl A 14 p·1 S R fi s fi S h I B L d. U I d. s· a e - . I ot urvey esponses or top or c 00 us oa mg or n oa lllf! lf!D
Stop for School Bus What should you do when you see this sign? Rl9-I Loading or Unloading
(:ategory Response No. Percent
Correct stop for school bus loading, unloading, or if the
0 0.0% bus lights are flashing
STOP Partially Correct school bus 16 26.2% FOR
SCHOOL BUS
Incorrect all other responses 45 73.8% LOADING OR UNLOADING
Not Sure 0 0.0%
Total number of responses 61 100%
Table A-15. Pilot Survey Responses for Fasten Safety Belts Sh?:n
Fasten Safety Belts What is this sign telling you? Rl9-8
egory Response No. Percent
Correct must wear safety/seat belt l111!l. state law 9 10.6%
Partially Correct wear safety/seat belt 19 22.4% FASTEN
Incorrect all other responses 12 14.1% SAFETY BELTS
Not Sure 45 52.9% STATE LAW
rrotal number of responses 85 100%
T bl A 16 P'l S a e - . I ot urvey R esponses fi T or rue ksU RihL se If.? t ane 1gn
Trucks Use Right What is this sign telling you? R4-5 Lane e•ry Response No. Percent
applies to trucks f1!JJ/. must be in right lane 37 50.0% ct TRUCKS
!Partially Correct applies to trucks QI. must be in right lane 12 16.2% USE RIGHT
Incorrect all other responses 13 17.6% LANE
!Not Sure 12 16.2%
Total number ofresponses 74 100%
A-6

T bl A 17 p·1 S a e - . I Ot urvev R fi W . h L. . s· esoouses or ei!! t 1m1t um
Weight Limit What does this sign indicate? Rl2-l
!Category Response No. Percent
!Correct maximum weight and units (U.S. tons) 16 20.8%
Partially Correct maximum weight !!I. units (U.S. tons) 26 33.8% WEIGHT LIMIT
Incorrect all other responses 24 31.2% 10 !Not Sure 11 14.3% TONS
Total number of responses 77 100%
a e - . I ot urvev espouses or azar ous anw oute U!U T bl A 18 p·1 S R fi H d c R
Hazardous Cargo What is this sign telling you? Rl4-2 !Route
K::ategory Response No. Percent
K:orrect vehicles with hazardous cargo must follow sign .- 1.3%
Partially Correct no acceptable response 0 0.0%
~ Incorrect all other responses 12 15.0%
Not Sure 67 83.8%
rr otal number of responses 8 100%
T bl A 19 P"l t S a e - . IO urvev R fi H espouses or d azar ous c ar20 P h·b·t ds· ro 1 1 e ·~u
Hazardous Cargo Prohibited What is this sign telling you? Rl4-3
Category Response No. Pere
!Correct vehicles with hazardous cargo are not allowed
0 0.0% on this road
® Partially Correct either hazardous cargo !!I. prohibited 2 2.9%
Incorrect all other responses 15 22.1%
!Not Sure 51 75.0%
rrotal number ofresponses 68 100%
A-7

T bl A 20 p ·1 t S a e - . I 0 urvey R espouses or I 120
Hill What does the 8% mean on this sign? W7-l & W7-3
!Category Response No. Percent I
K:orrect trucks OJ1Jl. steep grade/downgrade 0 0.0%
Partially Correct trucks QI. steep grade/downgrade 26 36.1% I~ Incorrect all other responses 33 45.8% I
Not Sure 13 'I 18.1% ~ E I
Total number of responses 72 100% I
T bl A 21 p·1 S a e - . I ot urvey R ~ Cl esponses or ea ranee 12n
Clearance I What does the 14 and 4 mean? Wl2-IT
Category /Response No. Percent I
Correct vertical clearance/clear height lll1.d. units ( 14 feet 4
21 24.4% inches)
$ Partially Correct vertical clearance/clear height fl! units ( 14 feet 4
23 26.7% inches)
Incorrect I
all other responses 23 26.7%
!Not Sure 19 22.1%
Total number ofresponses 86 100%
Table A-22. Pilot Survey Responses for Ri2ht Lane Ends Si2n
!Right Lane Ends What lane should you be in? W9-l
Category Response No. Percent - I
' Correct should be in, or move to, left lane 8 10.0%
f artially Correct no acceptable response 0 0.0%
:~ Incorrect all other responses 57 71.3%
!Not Sure 15 18.8%
rrotal number of responses 80 100%
A-8

I
I
T bl A 23 P"l S a e - . I ot urvey R esponses i Ad. s or v1sory •Pee d Pl t s· a e 1gn
J\dvisory Speed What does the 35 mean in this sign? Plate
Category Response No. Percent
Correct recommended speed/maximum speed/speed limit qnd
18 26.9% units (35 mph)
rartially Correct recommended speed/maximum speed/speed limit QI.
15 22.4% units (35 mph)
Incorrect all other responses 33 49.3%
Not Sure I 1.5%
Total number of responses 67 100%
T bl A 24 P"I t S a e - . I 0 urvey R esponses i S h I B St Ah d s· or c 00 us op ea 1gn
School Bus Stop IA head
I What should you do when you see this sign?
K::ategory 1Response No. Percent
Correct watch for school bus QI. can't see school bus I 1.3%
Partially Correct school bus 5 6.3%
Incorrect all other responses 70 88.6%
Not Sure 3 3.8% -
ITotal number ofresponses 79 100%
onses for Advanced Lane Closed Si n
Advanced Lane losed
ategory
orrect
Partially Correct
Incorrect
ot Sure
What does this sign mean?
Response
right lane closed/ends ahead and move to left Jane (lJ1Jf. construction zone
right lane closed/ends ahead QL move to left lane QL
construction zone
all other responses
otal number of res onses
A-9
No. Percent
0 0.0%
25 32.1%
42 53.8%
11 14.1%
78 100%
Wl-2& Wl3-l
0 ~I
S3-I
SCHOO[ BUS STOP
AHEAD
CW20-5CR
I

T ab e A-26 p·1 s . I ot ti s· I B k Y II urvey Responses or ID!! e ro en e ow c enter L. s· me um Single Broken Yell ow What does the yellow stripe mean? Pavement Center Line Markings
Category Response No. Percent
Correct two-way traffic f1!1Jl. you are allowed to cross the
0 0.0% line to pass
A Partially Correct two-way traffic flL you are allowed to cross the line
28 33.3% to pass
Incorrect all other responses 48 57.1%
Not Sure 8 9.5%
Total number ofresponses 84 100%
a e - . I 0 urvey espouses or 0 assm2 one ar n2s I n T bl A 27 P'I t S R ti NP z M ki s· No Passing Zone if you are traveling on the right lane, what do these yellow stripes mean? Pavement Markings Markings
Category Response No. Percent
Correct road is two-way traffic and you are not allowed to cross
0 0.0% the solid yellow line to pass
A Partially Correct road is two-way traffic flL you are not allowed to cross ?" 31.9% the solid yellow line to pass
_j
Incorrect all other responses 44 61.1%
Not Sure 5 6.9%
Total number ofresponses 72 100%
T bl A 28 p·1 t S a e - . 10 urvev R f D bl s rd Wh•t L. s· esponses or OU e 0 I I e me 12n
Double Solid White When can you cross these two white lines? Pavement
~ne Marking
Category Response No. Percent
Correct never (except in case of emergency) 15 19.2%
Partially Correct no acceptable response 0 0.0%
~ ~ Incorrect all other responses 57 73.1%
!Not Sure 6 7.7%
Total number of responses 78 100%
A-10

APPENDIXB
RESULTS OF FINAL COMPREHENSION SURVEY
This appendix presents the detailed results of the driver comprehension survey administered at international port crossings in El Paso and McAllen, Texas in August 1996. The survey used a flashcard format, where a driver was shown an image of a traffic control device and asked to answer a question about the devices. The responses were recorded on audio tape for later analysis. In analyzing the responses, the researchers classified each response as correct, partially correct, incorrect, not sure, or indeterminate according to the definitions given for each device on the following pages.
Table B-1 presents the demographic information for the final survey. Tables B-2 through B-5 present the results of the final survey.
T bl B 1 D h' Ch t . f ti th F' I S y a e - . emo2rap IC arac ens 1cs or e ma urve
I Characteristic I Frequency I Percent I Male 606 80.7%
Gender Female 145 19.3%
N/R 8 l.1%
<25 48 9.4%
25-55 452 88.3% Age
>55 12 2.3%
N/R 247 32.5%
Passenger Car 576 78.7%
Single Unit 37 5.1%
Type of Vehicle Tractor/Trailer 103 14.1%
Bus 14 l.9%
Other/N/R 29 3.8%
Note: N/R not recorded
B-1

a e - . ma urvey esu s or ra IC 1gna n 1catrons an e t urn 1gna igns T bl B 2 F' IS R It t T ffi s· II d' d L f T s· IS
Device Question Correct Response Partially Correct Correct
Partially Incorrect Not
Unknown Sample Concept Response Concept Correct Sure Size
What does the red in this traffic signal mean? Stop at intersection No acceptable
lltl- For all responses, if not or do not cross response 97.7 0.0 2.0 0.0 1.0 601 answered already: intersection a. What would you do if you saw this?
1What does the yellow in this traffic
Be prepared to stop, I • I ? ... ~-)Jiil s1gna mean. slow down, use No acceptable • Q. For all responses, if not 97 .7 0.5 2.0 0.2 0.2 599 - · · - answered already: I caution, or red light response
a. What would you do if you saw this? coming up
o:l I
N
What does the green in this traffic Allowed to enter or 1signal mean? I
9 1• 1Q1 For all responses, if not cross the No acceptable 97.6 0.3 0.7 0.2 1.2 596 intersection, have I
answered already: response
a. What would you do if you saw this? the right of way
•••• If you want to make a left tum, do you 'No, the arrow tells
have to yield to traffic in the opposite me to go
I don't think so 80.8 0.0 17.6 0.5 1.2 587 direction?*
I
••1•.i If you want to make a left tum, do you No, the arrow/sign ·- - · have to yield to traffic in the opposite I don ' t think so 72.l 0.0 24.9 0.9 2.1 563 Pt1C1nma tells me to go I Lal 01
direction?* HlllUlln -.. 191Ql
If you want to make a left tum, do you Yes, the green tells
have to yield to traffic in the opposite me I have to yield
Maybe/ I think so 79.0 0.0 17.6 1.5 1.9 534 direction?*
·-- o:-r:;a:1...._ =-i • "II -··· · ,...__ ···- ' If you want to make a left tum, do you Yes, the green/sign
LUTIUll have to yield to traffic in the opposite tells me I have to Maybe/I think so 78.2 0.0 17.2 2.6 2.0 499 YIELD
OlllllUll direction?* yield •
Note: *Two different versions of this question were asked. "What color is the signal for the traffic in the opposite direction?" was asked approx. I 0% of the time.

Table B-3. Final Surve Results for Pavement Markin s
Correct Response Partially Correct Partially Not Sample Device Question
Concept Response Correct Correct
Incorrect Sure
Unknown Size Concept
ls this a one-way road Two-way road or cars No acceptable going in both/opposing/ 72.2 0.0 25.3 1.5 1.0 593 or a two-way road?
different directions response Broken Yellow Centerline
Pavement Marking
Is the blue car Yes, if there is enough
Yes without allowed to pass the
room to pass safely. identifying the 36.8 38.0 22.8 0.5 1.9 589
Broken Yellow Centerline red car? safety element.
Pavement Marking
o:; ls the blue car No acceptable
I allowed to pass the No 84.l 0.0 12.2 1.9 1.8 573 t...J red car? response
No Passing Zone Pavement Markings
Is this a one-way road One-way or cars going No acceptable 51.5 0.0 45.2 2.6 0.8 505 or a two-way road? in same direction response
Broken White Lane Line Pavement Marking
ls the blue car No acceptable
allowed to pass the Yes 81.8 0.0 14.3 1.4 2.4 490 red car?
response Broken White Lane Line
Pavement Markin
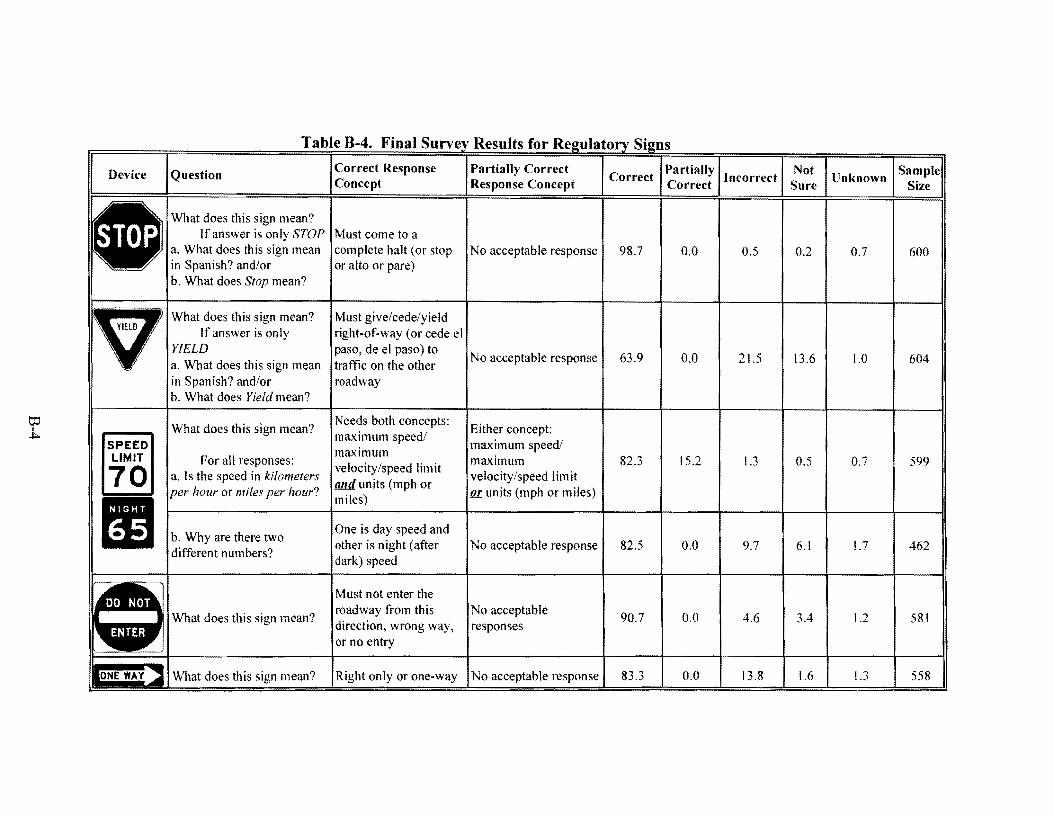
a e - . ma T bl B 4 F. IS urve'J R esu s or It fi R I egu atory s· 1gns
Device Question Correct Response Partially Correct Correct
Partially Incorrect
Not Unknown Sample
Concept Response Concept Correct Sure Size
• What does this sign mean?
If answer is only STOP Must come to a a. What does this sign mean complete halt (or stop No acceptable response 98.7 0.0 0.5 0.2 0.7 600 in Spanish? and/or or alto or pare} b. What does Stop mean?
v What does this sign mean? Must give/cede/yield If answer is only right-of-way (or cede el
YIELD paso, de el paso) to No acceptable response 63.9 0.0 2 l.5 13.6 1.0 604 a. What does this sign mean traffic on the other
in Spanish? and/or roadway b. What does Yield mean?
What does this sign mean? Needs both concepts:
Either concept: SPEED
maximum speed/ maximum speed/
LIMIT For all responses: maximum maximum 82.3 15.2 1.3 0.5 0.7 599
70 a. ls the speed in kilometers velocity/speed limit
velocity/speed limit per hour or miles per hour?
111111. units (mph or QI. units (mph or miles)
rl miles)
b. Why are there two One is day speed and other is night (after No acceptable response 82.5 0.0 9.7 6.1 1.7 462 different numbers? dark) speed
~ Must not enter the
Ir. What does this sign mean? roadway from this No acceptable 90.7 0.0 4.6 3.4 1.2 581 direction, wrong way, responses or no entry
•ONE WAY~ What does this sign mean? Right only or one-way No acceptable response 83.3 0.0 13.8 1.6 1.3 558

Table B-4. Final Survey Results for Regulatory Signs (continued)
1 Device Question Correct Response Partially Correct
Correct Partially
Incorrect Not
Unknown Sample
Concept Response Concept Correct Sure Size
Stop for school bus loading. unloading or if
STOP What does this sign mean? the bus lights are
School bus 57.9 24.2 14.6 3.3 0.0 553
FOR flashing SCHOOL BUS LOADING OR For all responses:
When the red lights are UNLOADING flashing or whenever
a. When do you have to stop the bus is loading or
No acceptable response 64.6 0.0 27.4 5.4 2.5 277 for a school bus?
unloading
What does this sign mean? Must wear safety/seat Wear safety/seat belt or
33.2 23.2 5.5 36.6 1.5 587 FASTEN belt fll1JJ. it is state law just seat belt SAFETY BELTS For truck drivers only:
STATE LAW a. Does this sign apply to Yes No acceptable response 89.2 0.0 7.0 1.3 2.6 157 you?

a e - . ma urvey esu s or arnm2 12ns T bl B 5 F' IS R It fi w Device Question Correct Response Concept Partially Correct
Correct Partially Incorrect Not
Unknown Sa::lell Response Concept Correct Sure Si
Road curves/turns/bends Either road !l!1J1 recommended speed is curves/turns/bends QI.
What does this sign mean? 35 mph (must give units). recommended/ maximum 65.4 30.8 2.5 1.0 0.4 526 Not speed limit or speed (or speed limit) is 35 maximum speed mph
<() If "CURl'EITURN'" is not part Shows the change in road of the response: direction. direction you No acceptable response 76.9 0.0 20.0 1.6 1.6 65 a. What does the arrow mean? should drive
lf"'SPEED" is not part of the
~ Recommended speed in Speed limit or maximum response: mph (miles) speed
44.1 48.7 4.5 1.8 0.9 111 b. What does the "35" mean?
Following any response that mentions "SPEED'':
mph (miles) No acceptable response 86.4 0.0 11.4 0.0 2.3 44 c. ls this speed in kilometers per hour or miles per hour?
4P Two-way traffic or traffic What does this sign mean? going in both/opposing No median between traffic 93.3 0.6 4.1 1.9 0.2 534
directions
--~) What does this sign mean?
Railroad crossing ahead Just railroad crossing or
39.1 40.5 6.5 12.8 1.2 603 train
What does this sign mean? School crosswalk Crosswalk or pedestrian
52.3 34.3 11.6 l.5 0.4 545 crosswalk
~ If the response does not include "SCHOOL:" Students or children or
No acceptable response 68.5 0.0 29.1 1.6 0.8 127 a . .w.h.Q. would you expect to see school age pedestrians
" 'I when you see this sign?
If the response does not include At or near the crosswalk No acceptable response 63.9 0.0 32.8 3.3 0.0 61 "CROSSING:"

Table B-6. Final Surve Results for Other Si ns
Device Question Correct Response Partially Correct
Correct Partially
Incorrect Not
Unknown Sample
Concept Response Concept Correct Sure Size
Any response that What does this sign identifies construction, Slow down without
80.3 1.0 2.9 14.9 0.9 579 mean? I road work, or workers in mention of road work
or near the highway.
For all responses: 'Watch for road or a. What should you do construction work and be Slow down 64.5 28.7 5.8 0.0 I. I 380 when you see this sign? prepared to slow down.
t:O For simple answers: Record verbatim NIA 88 .9 0.0 0.0 0.0 11. I 9 I
-....) b. Anything else?
The orange sign indicates Either the orange sign
Why are these two signs construction, fl!lf!. the
indicates construction, QI. 8.4 11.2 16.9 62.3 1.2 498
different? yellow sign is a warning
the yellow sign is a warning
For all responses: Move to the left lane
a. What do these signs QI. right lane ends
No acceptable response 46.5 0 .0 19.3 32.6 1.5 331 mean?
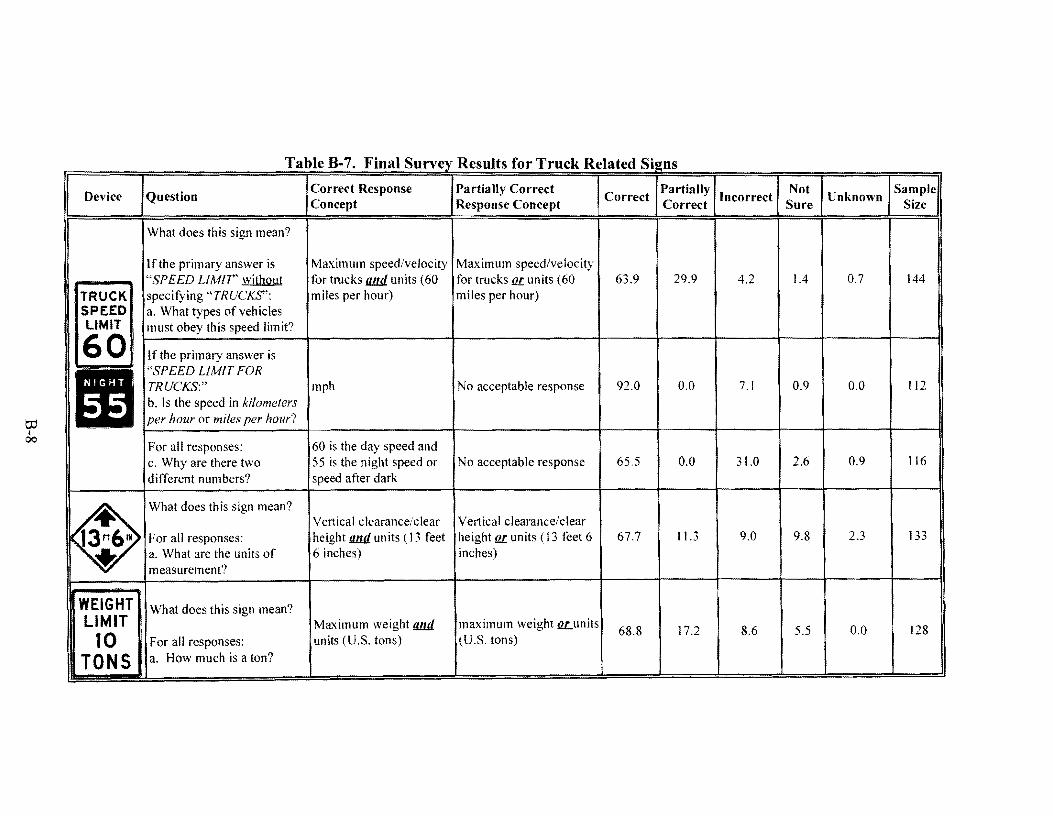
tti I
00
Device
TRUCK SPEED LIMIT I
60
m 1~~ WEIGHT LIMIT
10 TONS
a e - . ma T bl B 7 F" IS urvey
Question Correct Response Concept
What does this sign mean?
If the primary answer is Maximum speed/velocity "SPEED LIMIT"~ for trucks UJ11I. units ( 60 specifying "TRUCKS'': miles per hour) a. What types of vehicles must obey this speed limit?
lfthe primary answer is "SPEED LIMIT FOR TRUCKS:" mph b. Is the speed in kilometers per hour or miles per hour?
For all responses: 60 is the day speed and c. Why are there two 55 is the night speed or different numbers? speed after dark
What does this sign mean? Vertical clearance/clear
For all responses: height fll1JJ. units ( 13 feet a. What are the units of 6 inches) measurement?
What does this sign mean? Maximum weight fll1JJ.
For all responses: units (U.S. tons) a. How much is a ton?
R I i esu ts or True k Related Si JDS
Partially Correct Correct
Partially Incorrect
Not Unknown
Sample Response Concept Correct Sure Size
Maximum speed/velocity for trucks QI. units (60 63.9 29.9 4.2 1.4 0.7 144 miles per hour)
No acceptable response 92.0 0.0 7.1 0.9 0.0 112
No acceptable response 65.5 0.0 31.0 2.6 0.9 116
Vertical clearance/clear height QI. units ( 13 feet 6 67.7 11.3 9.0 9.8 2.3 133 inches)
maximum weight QLunits 17.2 68.8 (U.S. tons)
8.6 5.5 0.0 128

Table B-7. Final Surve Results for Truck Related Si ns continued
Device Question Correct Response Partially Correct
Correct Partially
Incorrect Not
Unknown Sample
Concept Response Concept Correct Sure Size
What does this sign There is a weight limit There is a weak bridge 1.6 5.7 40.3 50.8 1.6 124
mean? on a bridge ahead. ahead
!fthe answer indicates a "BRIDGE AHEAD
Stop, tum around, or find WITH A WEICHT LIMIT':
another road if your No acceptable response 16.7 0.0 58.3 16.7 8.3 12
truck weighs more than a. What would you do if
the limit. you saw this sign on the road?
What does this sign Weigh station open mu/. Weigh station open QI.
trucks must stop to be trucks must stop to be 29.8 3.2 25.8 39.5 1.6 124 o:; mean? weighed. weighed. I I l.O
lf"BASCULA" is not used as a response: Place where trucks are
No acceptable response 79.3 0.0 10.3 6.9 3.5 29 , a. What is a weigh weighed
station?
For all responses: b. Does this sign require
Yes No acceptable response 83 .3 0.0 6.7 6.7 3.3 30 you to go through the wei h station?

Table B-7. Final Survev Results for Truck Related Si!?.ns (continued
Device Question Correct Response Partially Correct
Correct Partially
Incorrect Not
Unknown Sample
Concept Response Concept Correct Sure Size
What does this sign mean?
~ If response includes
Trucks am/. steep Trucks Q.t:. steep 64.2 22.5 10.8 2.5 0.0 120 "GRADE" or "SLOPE':
grade/downgrade grade/downgrade
a. Does it go lJ.J2 or .dm¥.n?
For all responses: Brake carefully, use
b. What should you do brakes sparingly
No acceptable response 67.7 0.0 30.7 1.3 1.3 75 when you see this sign?
t:O I
Vehicles with hazardous 0
What does this sign cargo must follow sign or
~ mean? identifies a hazardous
No acceptable response 31.4 0.0 I 5.3 53.4 0.0 118
cargo route
For all correct responses: a. Give an example of a Record verbatim NIA 65.0 0.0 5.0 20.0 10.0 20
hazardous cargo?
Vehicles with hazardous
~ cargo are not allowed on
What does this sign this road or hazardous Some type of prohibition 28. 1 11 .4 21.1 39.5 0.0 114
mean? cargo prohibited or no hazardous cargo