Assessment of Lifting Criteria for Crane on a Heavy Lift ... Udid... · Assessment of Lifting...
103
Assessment of Lifting Criteria for Crane on a Heavy Lift Ship ‘load check and fatigue life calculation’ Udit Sood Master Thesis presented in partial fulfillment of the requirements for the double degree: “Advanced Master in Naval Architecture” conferred by University of Liege "Master of Sciences in Applied Mechanics, specialization in Hydrodynamics, Energetics and Propulsion” conferred by Ecole Centrale de Nantes developed at University of Rostock in the framework of the “EMSHIP” Erasmus Mundus Master Course in “Integrated Advanced Ship Design” Ref. 159652-1-2009-1-BE-ERA MUNDUS-EMMC Supervisors: Prof. Dr.Eng./Hiroshima Univ. Patrick Kaeding, University of Rostock Dr.-Ing. Thomas Lindemann, University of Rostock Internship Supervisor: Mr. Helge Rathje, SAL Heavy Lift GmbH, Hamburg, Germany Reviewer: Prof. Maciej Taczala, University of Szczecin Rostock, February 2017
Transcript of Assessment of Lifting Criteria for Crane on a Heavy Lift ... Udid... · Assessment of Lifting...

Assessment of Lifting Criteria for Crane on a Heavy Lift Ship
‘load check and fatigue life calculation’
Udit Sood
Master Thesis
presented in partial fulfillment
of the requirements for the double degree:
“Advanced Master in Naval Architecture” conferred by University of Liege
"Master of Sciences in Applied Mechanics, specialization in Hydrodynamics, Energetics and Propulsion”
conferred by Ecole Centrale de Nantes
developed at University of Rostock
in the framework of the
“EMSHIP”
Erasmus Mundus Master Course
in “Integrated Advanced Ship Design”
Ref. 159652-1-2009-1-BE-ERA MUNDUS-EMMC
Supervisors: Prof. Dr.Eng./Hiroshima Univ. Patrick Kaeding, University of Rostock
Dr.-Ing. Thomas Lindemann, University of Rostock
Internship Supervisor: Mr. Helge Rathje, SAL Heavy Lift GmbH, Hamburg, Germany
Reviewer: Prof. Maciej Taczala, University of Szczecin
Rostock, February 2017


2 Udit Sood
Master Thesis developed at University of Rostock, Germany
ABSTRACT
‘Assessment of lifting criteria for cranes on a heavy lift ship'
By Udit Sood
A Greater demand of energy on land has led to an increase in the offshore drilling and energy
harvesting activities. The shipping industry has shown a rise in demand for the specialised vessels
called the heavy lift ships. These ships are designed to transport goods to the offshore sites for
construction and maintenance and also heavy cargo from one place to another by sea. The heavy
cargo loading and offloading operations are carried out using powerful cranes present on such
vessels. The crane capacities determine the cargo consignments which need to be handled. They
form a vital machinery on such type of vessels. When we compare cargo operations with the
onshore operation, these are much more complicated both in terms of the cargo handling and
transportation.
The work scope of this thesis comprises of review of standard lifting criteria for shipboard cranes
provided by DNV-GL classification society. The load on the crane is assessed during the cargo
operations. The stresses experienced at different locations are found out using finite element
modelling. This data is then processed for fatigue analysis.
The comparative study of crane structure and operation rules created by Lloyds Register and
DNV-GL classification society is also carried out. The best-suited rules for the company business
are analysed.
Finally, a report summing up all the results, findings is prepared. Some valuable optimisation
procedures are suggested which would serve for a better structural and fatigue life for the new
coming model for such type of crane.
Keywords: DNV-GL, Lloyds Register, offloading, offshore, cargo operations, finite element
modelling, optimisation, fatigue life.

ACKNOWDEDGEMENTS
I would like to express my sincere regards for my company supervisor Mr Helge Rathje, Senior
Project Engineer at SAL Heavy Lift GmbH. For giving me the opportunity to work on a company
project. And providing me with all possible assistance in terms of knowledge and resources during
the internship.
I am grateful to my University of Rostock Professor Dr.-Ing Patrick Keeding and Dr.-Ing
Thomas Lindemann ,for giving me a valuable chance to work on an industrial internship and
providing me timely assistance in terms of knowledge for the sound understanding of my thesis.
Without their essential guidance I would not have succeeded in my endeavour.
Besides my mentor I had been assisted by some of the professional and highly qualified engineers
from SAL Heavy Lift GmbH. I would express my deep gratitude to Mr. Arthur Stuckert, Project
Engineer, Mr Jonathan Schmidt, Senior Project Engineer, Mr Ralf Tschritter, Senior Project
Engineer, Mr Ben Konrad, Project Engineer, Mr. Bin Wang, Project Engineer and Mr Tilo
Klappenbach, Project Engineer who had guided me during my internship.
It was a great experience working with the highly qualified and professional staff of the SAL
Heavy Lift GmbH .I would also like to thank Chief design engineer Mr. Marco Doelling from TTS
crane for giving me the opportunity to work on the design of their crane model.
I would like to express my regards towards DNV-GL and Lloyds Register personals who had
guided me with the rule and guidelines.
In the end, I would like to thank my family members my parents and my brother who had
supported me in terms of moral support throughout my thesis work.
This thesis is developed in the frame of the European Masters Course in Integrated Advance Ship
Design named EMSHIP for the European Education in Advance Ship Design.
Ref.:159652-1-2009-1-BE-ERA MUNDUS-EMMC.

4 Udit Sood
Master Thesis developed at University of Rostock, Germany
TABLE OF CONTENTS
TABLE OF FIGURES ................................................................................................................................................ 6
TABLE OF EQUATIONS ......................................................................................................................................... 7
LIST OF SYMBOLS ................................................................................................................................................... 9
DECLARATION OF AUTHORSHIP ..................................................................................................................... 10
1. INTRODUCTION ............................................................................................................................................. 12
1.1 PREFACE ...................................................................................................................................................... 12 1.2 SCOPE OF STUDY .......................................................................................................................................... 13
2. CRANE STRUCTURAL COMPONENTS ..................................................................................................... 14
2.1 CRANE PEDESTAL AND HOUSING ................................................................................................................. 14 2.2 CRANE JIB .................................................................................................................................................... 14 2.3 CRANE SLEW BEARING AND THE SYSTEM .................................................................................................... 14 2.4 CRANE CAB .................................................................................................................................................. 15 2.5 STRUCTURAL FAILURE ................................................................................................................................. 15
3. THE COMBINATION OF STRUCTURAL PARTS TO FORM COMPLETE CRANE. .......................... 16
4. STUDY OF THE CLASSIFICATION RULES FOR LIFTING APPLIANCES ........................................ 18
5. LLOYDS REGISTER RULES AND GUIDELINES FOR LIFTING APPLIANCES ................................ 20
5.1 CASE 1. ........................................................................................................................................................ 21 5.2 CASE 2 ......................................................................................................................................................... 21 5.3 CASE 3 ......................................................................................................................................................... 21 5.4 CASE 4 ......................................................................................................................................................... 22
6. DNV-GL GUIDELINES FOR THE CRANES ............................................................................................... 26
7. DESIGN STRUCTURAL LOADS .................................................................................................................. 27
7.1 REGULAR LOADS ......................................................................................................................................... 27 7.2 IRREGULAR LOADS. ..................................................................................................................................... 31
7.2.1 Wind load ............................................................................................................................................ 31 7.2.2 Snow and ice load ................................................................................................................................ 32 7.2.3 Temperature load ................................................................................................................................. 32
7.3 SPECIAL LOADS. ........................................................................................................................................... 32
8. FINITE ELEMENT MODELLING ................................................................................................................ 34
8.1 ELEMENT DESCRIPTION ............................................................................................................................... 34 8.2 MATERIAL PROPERTIES ................................................................................................................................ 34 8.3 MODELLING OF THE CRANE ......................................................................................................................... 34
9. BOUNDARY CONDITION AND MESH ELEMENT SELECTION CRITERIA .................................... 40
9.1 MESH GEOMETRY ........................................................................................................................................ 42 9.2 DEFINING THE BOUNDARY CONDITIONS ...................................................................................................... 45
10. STUDY OF THE CRANE LOADS ................................................................................................................ 46
11. SIMULATION OF LOAD CASES ................................................................................................................ 51
11.1 LOAD CASE 1 ............................................................................................................................................... 52 11.2 LOAD CASE 2 ............................................................................................................................................... 57 11.3 LOAD CASE 3 ............................................................................................................................................... 59 11.4 LOAD CASES 4 TO 8 ...................................................................................................................................... 62
12. HOT SPOT ANALYSIS. ................................................................................................................................ 66
12. 1 BOOM HOT SPOTS ........................................................................................................................................ 66
12.2 CRANE HOUSING HOT SPOTS ....................................................................................................................... 67
13. RAIN FLOW COUNTING METHOD FOR THE FATIGUE ANALYSIS. .............................................. 69
14. MEAN STRESS CORRECTION ON THE FATIGUE LIFE ..................................................................... 72
14.1 GERBER MEAN STRESS CORRECTION METHOD ............................................................................................ 74
Design Requirement and Load Assessment of Crane on Heavy Lift Ship 5
““EMSHIP” Erasmus Mundus Master Course, period of study September 2015 – February 2017”
14.2 GOODMAN’S MODEL .................................................................................................................................... 74 14.3 SMITH, WATSON AND THE TOPPER METHOD ............................................................................................... 75 14.4 COMPARISON OF THE MEAN STRESS CORRECTION ....................................................................................... 76
15. FATIGUE ANALYSIS OF THE CRANE STRUCTURE ........................................................................... 79
15.1 DAMAGE CRITERIA APPROACH. ................................................................................................................... 80 15.2 SAFE LIFE APPROACH .................................................................................................................................. 81
16. USING THE PALMGREN MINER RULE ................................................................................................. 81
16.1 PLATE ANALYSIS ......................................................................................................................................... 81 16.2 WELD ANALYSIS .......................................................................................................................................... 84 16.3 CONCEPT COVERED IN THE CALCULATION .................................................................................................. 90 16.4 DESIGN EQUATIONS AND THE CALCULATION OF THE PARAMETERS ............................................................ 90 16.5 THE DESIGN EQUATION FOR THE FATIGUE ................................................................................................... 90
17. CONCLUSION ................................................................................................................................................ 90
18. REFERENCES ................................................................................................................................................ 91
APPENDICES ........................................................................................................................................................... 92
A .................................................................................................................................................................................. 92
B .................................................................................................................................................................................. 92
C .................................................................................................................................................................................. 92
D .................................................................................................................................................................................. 92
..................................................................................................................................................................................... 96

6 Udit Sood
Master Thesis developed at University of Rostock, Germany
TABLE OF FIGURES
Figure 1: This is the 2-Dimension view of the shipboard crane .................................................. 14 Figure 2: This is the top view of the boom structural member of the crane ................................ 14 Figure 3: The structural components contributing crane structure .............................................. 14 Figure 4: A gernalized dimensioning of the crane and its essential components ........................ 18 Figure 5: Ship 183 Type [REF:www. http://sal-heavylift.com/] ................................................. 24 Figure 6: Basic dimentions of the crane and its angle of refrence .......................................... 25 Figure 7: Determing the dropping factor fa .................................................................................. 31 Figure 8: Crane structure as per the manufacturer drawings ....................................................... 35 Figure 9: Front view of the crane consisting of the essential dimensions ................................... 35 Figure 10: Plate and stiffening arrangement of crane structure .................................................... 37 Figure 11: Plate sections of the crane ........................................................................................... 38 Figure 12: 3-D model of the crane ................................................................................................ 38 Figure 13: Position of the cranes on actual ship structure ............................................................ 38 Figure 14: Various plate thicknesses for diffrent structural components ..................................... 39 Figure 15: The boundary conditions for the housing support condition ....................................... 40 Figure 16: Boundary conditions for the boom supports ............................................................... 41 Figure 17: The shear lag effects on the elements .......................................................................... 42 Figure 18: Defining the element size in finite element model ...................................................... 43 Figure 19: The shape function considered in RFEM .................................................................... 43 Figure 20: The mesh geometry and the size of mesh chosen for housing. ................................... 44 Figure 21: The mesh geometry and the size of mesh chosen for housing and boom ................... 45 Figure 22: Detecting the flaws in the mesh of the model ............................................................. 45 Figure 23: The load case description of the crane ........................................................................ 47 Figure 24: Comparision between the manufacturer and design FEM .......................................... 53 Figure 25: Linear Vs Nonlinear analysis ...................................................................................... 54 Figure 26: Non linear deflections of the boom with inclination of ship. ...................................... 54 Figure 27: Deformation in the crane housing due to boom loads. ................................................ 55 Figure 28: Stress in the crane housing and hot spots. ................................................................... 56 Figure 29: Hot spot location of the crane structure ....................................................................... 57 Figure 30: Linear Vs Nonlinear analysis for Boom ...................................................................... 58 Figure 31: Analyses with inclination ............................................................................................ 58 Figure 32: Linear vs Nonlinear analysis for loadcase 2 ................................................................ 60 Figure 33: Analysis with inclination ............................................................................................. 60 Figure 34: Comparision of housing deflection between manufacturer FEM and design FEM .... 61 Figure 35: Deflections and stress analysis .................................................................................... 62 Figure 36: The concerned plates for the hot spots ........................................................................ 66 Figure 37: Plate thicknesses and hotspot shown by missing plates .............................................. 67 Figure 38: The hot spot analysis on the whole crane structure plating ......................................... 68 Figure 39: Stress curve for crane loading on crane structure ........................................................ 69 Figure 40: Example of cyclic stress curve to be analysed using Rainflow counting mechanism 70 Figure 41: Reference from experimental paper’ .......................................................................... 77 Figure 42: Cycles as experienced during crane loadings .............................................................. 79 Figure 43: Weld stress .................................................................................................................. 84 Figure 44: Stress Strain curve .[REF:Eurocode EC 3-1-9] ........................................................... 87

Design Requirement and Load Assessment of Crane on Heavy Lift Ship 7
““EMSHIP” Erasmus Mundus Master Course, period of study September 2015 – February 2017”
TABLE OF EQUATIONS
(1)
(2)
(3)
= = [°] (4)
(m/ ) (5)
Fsa = ( ) (6)
(7)
LW =q.cf.Aw [N] (8)
(9)
(10)
(11)
(12)
(13)
(14)
(15)
(16)
(17)
(18)
(19)
(20)
(21)
+ =1 (22)

8 Udit Sood
Master Thesis developed at University of Rostock, Germany
1-( (23)
(24)
+( =1 (25)
(26)
(27)
(28)
(29)
(30)
(31)
(32)
(33)
(34)
(35)
(36)
(37)
(38)
Log N=log A –mlog S (39)

Design Requirement and Load Assessment of Crane on Heavy Lift Ship 9
““EMSHIP” Erasmus Mundus Master Course, period of study September 2015 – February 2017”
LIST OF SYMBOLS
RFEM RFEM Finite Element Software Package
DNV-GL Det Nortskey Veritas
MATLAB MATLAB Software Package
Lloyd’s register Lloyds Register
AutoCAD AutoCAD Design Software
CLAME Code For Lifting Appliances in Marine Environment, Jan 2016
LR Lloyd’s Register
FEA Finite Element Analysis
DIN Deutsche Industry-Norm
(t by t) Tip stress and strain based method for stress calculation
SWL Safe Working Loads
IACS International Association of classification Society
Orca Flex Orca Flex Hydrodynamic calculation Software
Octopus Octopus Hydrodynamics Load Calculation Software
CAD Computer-Aided Design
SAL Heavy Lift Schifffahrtskontor Altes Land GmbH & Co. KG
RStab Stability calculation finite element software
SN curves Stress Number of Cycle curve
SWT Smith, Watson and the Topper method
M.V Lona Motor Vessel Lona
Miller Rule Damage calculation method
RFAT Add on module for Fatigue calculation
EN European Norms
S-355 Steel class S-355
2-D 2-Dimessional
3-D 3-Dimessional

10 Udit Sood
Master Thesis developed at University of Rostock, Germany
LIST OF TABLES
Table 1: Ship crane specifications on ship 183 type[REF: http://sal-heavylift.com/] .................. 25 Table 2: Load limits for inspection ............................................................................................... 28 Table 3: Wind speed for various operations ................................................................................. 31 Table 4: Load limits for various loads .......................................................................................... 32 Table 5: The Youngs modulus for crane wire at various outreach ............................................... 41 Table 6: Loadings in different load cases ..................................................................................... 47 Table 7: Some important crane specifacions and abbreviations ................................................... 48 Table 8: Loadcase combination 1 ................................................................................................. 48 Table 9: Loadcase combination 2 ................................................................................................. 49 Table 10: Loadcase combination 3 ............................................................................................... 50 Table 11: Reaction forces from loadcase 1 ................................................................................... 55 Table 12: Reaction forces from loadcase 2 ................................................................................... 59 Table 13: Reaction forces from boom loadcase 3 ........................................................................ 61 Table 14: Counting cycle and stress range ................................................................................... 70 Table 15: Number of of cycles with same mean stress ................................................................. 71 Table 16: Safety factors used for different approaches for fatigue calculation ............................ 86

Design Requirement and Load Assessment of Crane on Heavy Lift Ship 11
““EMSHIP” Erasmus Mundus Master Course, period of study September 2015 – February 2017”
DECLARATION OF AUTHORSHIP
I declare that this thesis and the work presented in it are my own and have been
generated by me as the result of my own original research.
Where I have consulted the published work of others, this is always clearly
attributed.
Where I have quoted from the work of others, the source is always given. With the
exception of such quotations, this thesis is entirely my own work.
I have acknowledged all main sources of help.
Where the thesis is based on work done by myself jointly with others, I have made
clear exactly what was done by others and what I have contributed myself.
This thesis contains no material that has been submitted previously, in whole or in
part, for the award of any other academic degree or diploma.
I cede copyright of the thesis in favour of the University of Rostock..
Date:13.01.2017 Signature:

12 Udit Sood
Master Thesis developed at University of Rostock, Germany
INTRODUCTION
1.1 Preface
A greater demand of energy on land has led to an increase in the offshore drilling and energy
harvesting activities. The shipping industry has shown a rise in demand for the specialised
vessels called the heavy lift ships. These ships are designed to transport goods to the offshore
sites for construction and maintenance and also heavy cargo from one place to another by sea.
The heavy cargo loading and offloading operations are carried out using powerful cranes present
on such vessels. The crane capacities determine the cargo consignments which need to be
handled. They form a vital machinery on such type of vessels. When we compare cargo
operations with the onshore operation, these are much more complicated both in terms of the
cargo handling and transportation. The heavy cargo loading and offloading operations are carried
out using powerful cranes present on such vessels. The crane capacities determine the cargo
consignments which need to be handled and form vital machinery on heavy lift vessels. When
we compare cargo operations with the offshore operation, these are much more complicated both
in terms of the internal load handling within the installation and the sea-lift operations of a
supply vessel. The reason is that during high sea operations experiences wave induced motions.
The boom tip of the crane will have wave induced motion components in both the horizontal and
vertical directions. The magnitude of these motions may vary with the sea state and wave
heading angle.
Lifting operations on a heavy lift ship are much more demanding for the crane components than
similar operations being carried out on a fixed offshore platform.
The topic -‘Assessment of lifting criteria for cranes on a heavy lift ship’ relates to the crane on
the heavy lift ship which is one of the most essential machinery, for the vessel trade and
business. Special care needs to be taken in its design, maintenance and operation. Shipping
companies owning heavy lift ships have special designers, operators and the handler for the
equipment. In order to ease the structural design and inspection during long operation of the
crane on such vessel this thesis topic has been chosen.
The study starts with accessing the structural strength. This is achieved by modelling using an
Auto Cad and Inventor software.
The second task comprised of the determination of the loads acting on the structural members
and determines the load cases. It is seen from the rules that the loads acting on the structure are a
summation of all the live loads, wind loads, ship accelerations, cargo loads and dead loads and
other physical parameters such as the heel and the trim effects.
1.

Design Requirement and Load Assessment of Crane on Heavy Lift Ship 13
““EMSHIP” Erasmus Mundus Master Course, period of study September 2015 – February 2017”
After completion of the calculations the loading conditions are imposed on the finite element
model and it is simulated. The calculations are done based on the analytical formulation given by
DNV-GL Rules for the lifting appliances [REF 09].
The summation of these load cases is carried out by the MATLAB code which compares the
stresses at an individual nodal point and calculates the damage using the Miner’s Rule.
The final part of the thesis comprises of the comparison of the rule requirements for the
structural components of the crane. In my thesis, I have made comparisons between the
classification society DNV-GL and Lloyd’s register [Appendix B]. Different amplification
factors used during the design calculations are compared.
Together all these calculations, results and observations are summed up to form a compiled
master thesis to be submitted for university evaluation.
1.2 Scope of study
The title of the thesis is “Assessment of lifting criteria for cranes on a heavy lift ship”. The
work scope is divided into sections and has been explained in the following sequential order:
1) Study of the crane structure and review of standard lifting criteria for shipboard cranes
provided by DNV-GL and Lloyds register classification society:
This part of the project comprises of defining the crane structural components and then
compiling major rules designed by the classification society for the lifting of heavy. The safety
requirements and the limits for heavy lift ship will be assessed. The criteria followed during and
before lifting in order to calculate the load on the deck as well as on crane boom and the crane
housing will be summed up to find the safest means to carry out the cargo operation.
2) Classification of measured crane load of different operating condition and modelling in
AutoCAD and Inventor in order to obtain actual dimensions of the crane.
The crane is subjected to different load cases and crane positions this will be assessed in terms of
the crane boom angles. These parameters are determined to find out the appropriate boom angle
with the reverent load case.
The target is to calculate stress at different loading conditions on the crane structure using finite
element software. The crane boom and the housing are subjected to different stresses at different
loading conditions. These stresses for eight loading conditions will be found out. Calculation of
the fatigue on the structure of the crane using the damage criteria.
3) MATLAB software is used for reading all the stress tensor values obtained from the
finite element software to find the fatigue on the nodal points of the crane structure. A report is
prepared summing up all the results, findings and the suggestions. The thesis work is prepared
with the approval of the operator, manufacturer and the classification society.
In the end the optimization procedures are suggested for operation and manufacturing of cranes.

14 Udit Sood
Master Thesis developed at University of Rostock, Germany
2. CRANE STRUCTURAL COMPONENTS
The crane is divided into many structural components and special safety considerations need to
be taken for each of them prior to estimate the lifting loads:
Figure 1: This is the 2-Dimension view of the shipboard crane ref:[01]
Figure 2: This is the top view of the boom structural member of the crane ref: [01]
The crane as a complete machinery can be divided into different parts, which makes it easy for
the analysis and study of its gigantic structure.
Figure 3: The structural components contributing crane structure
2.1 Crane Jib:
The jib is constructed in the shape of a twin box girder which is connected by three cross braces
and a boom tip has a sheave block.
Design Requirement and Load Assessment of Crane on Heavy Lift Ship 15
““EMSHIP” Erasmus Mundus Master Course, period of study September 2015 – February 2017”
The jib is attached to the crane housing by two foot bearing. The connection is made by a pin
which rests on spherical bushing. The crane jib is one of the heaviest structural components of
the crane (152 tons) refer: [01]. It bears the compressive loads of the cargo and is supported by
the wires on the other end. The jib being long (37 meters) and suspended shows the maximum
deflection at its tip. It is the structural member transferring the major load of the cargo to the
crane housing. The safety and the fatigue requirements for the crane boom are important as it
possesses a major risk for the failure due to its large outreach and cantilever type behaviour as
seen from the finite element results.
2.2 Crane slew bearing and the system:
The rotation of the housing about its axis is carried out using a slew bearing which allows the
crane to rotate 360 degrees about its axis. The sealing is done using lip seals which prevent entry
of unwanted material into the oil lubricated chamber. refer :[01]
Slew bearing is grease lubricated and need to be lubricated periodically using a grease gun. The
slew ring bolts clamp the crane housing stationary part of the bearing to the deck housing.
The crane jib is kept in a locked position using two lock pin when the ship is moving and the
crane operation is not required.
The slewing operation is carried out using fifteen slew drive assembly having an axial variable
displacement pump and a planetary gearbox. [01]
2.3 Crane Cab:
This is a steel chamber with windows for the operator to sit. The crane cab is an extension of the
crane housing and is connected to the structure by a cut out window in the crane structure. It
forms the place of the clear view of the operator of the crane.
2.4 Structural Failure:
Types of the failure the crane can experience during its lifetime:
1. Structural failure.
2. Loss of sealing and weather protection.
3. Bearing damage.
4. Damage by contact.
In this assignment, we concentrate on the failure of the structural components of the crane.
Causes which may lead to structural failure of the crane and its components:
a. The operating condition which may cause the greatest impact to the structural integrity of
the crane is the load operations being carried out when the vessel is excessively heeled or
trimmed due to improper ballasting.

16 Udit Sood
Master Thesis developed at University of Rostock, Germany
b. Inadvertent contact of the crane jib with another structure.
Criticality of damage to various parts of the crane: refer: [01]
a. Crane structural pedestal:
Failure effects
Failure
mode
Equipment On
System
Operation Early
detection
Probability
of
occurrence
Severity Criticality
Structural
failure
Damage Loss of
integrity
Stopped Inspection Low Major Low
b. Crane Housing:
Failure effects
Failure
mode
Equipment On
System
Operation Early
detection
Probability
of
occurrence
Severity Criticality
Structural
failure
Damage Loss of
integrity
Stopped Inspection
and strain
gauge
readings.
Low Major Low
c. Slewing System:
Failure effects
Failure
mode
Equipment On
System
Operation Early
detection
Probability
of
occurrence
Severity Criticality
Structural
failure
Damage Loss of
integrity
Stopped Inspection
and strain
gauge
readings.
Low Major Low
Bearing
Failure
Damage Loss of
integrity
Stopped Inspection Mild Major Medium
Bolt
failure
Damage Loss of
securing
Potentially
damaging
Inspection Mild Critical Low
Slew gear
failure
Damage Rotation
compro
mised
Stopped Inspection Mild Major Medium
d. Crane jib:
Failure
effects
Failure
mode
Equipment On
System
Operati
on
Early
detection
Probability
of
occurrence
Severity Criticality
Structural
failure
Damage Loss of
integrity
Stopped Inspection. Low Major Low
Bearing
Failure
Damage Luffing
compro
mised
Stopped Inspection Mild Major Medium

Design Requirement and Load Assessment of Crane on Heavy Lift Ship 17
““EMSHIP” Erasmus Mundus Master Course, period of study September 2015 – February 2017”
3. COMBINATION OF STRUCTURAL PARTS TO FORM
COMPLETE CRANE.
In order to reduce the production cost dynamic design calculation need to be carefully carried
out. In order to do so computer based software such as CAD and finite element methods is
usually used. In my case we I have made use of company license finite element software of
RFEM to determine the loads at the various components and then use these calculations for the
structural design.
This part of the design is the most critical and stressful. As the weakest link determines the
overall performance of the machinery. Over or under calculations can prove harmful for the
design of the component. And as it is very difficult to consider the crane as a whole and the
dynamic performance is difficult to calculate. The residual and design imperfections are always a
mystery in the design phase. As the dimensions of the crane structure are large, so the buckling
and elastic deformations also need to be considered. The impact loads and the inertial loads also
complicate the problem. All these factors create a big difference in the static design model and
the actual working conditions. Other loads which may create nonlinear response are wind loads,
Heat, cold and the wave induced effects on the crane. It is quite difficult to describe the force on
the crane accurately as the loads change with respect to time. The traditional design methods
cannot meet up with design requirements of modern offshore crane and high end motion
analysing software’s such as an RFEM nonlinear calculation need to be employed which are
expensive and require skilled operators to work on the software.
Many researches are being carried out in this field to meet up with the problems faced with the
earlier designs. In order to ensure that the crane bears with the harsh working experience due to
the alternating loading, wind force and the wave affects the classification society has set up
certain design requirements and proposed a factor of safety for the design of the crane parts.
This rule states that the structural components of the crane the dynamic amplification factor Ψ
(factor of safety) shall not be taken less than: [REF: DNVGL 0378, Section 10, Page 100,
Edition May 2016]. [02]
Ψ =1.3 for lifting loads for W up to 2500KN
Ψ =1.5 –W/12500 for 2500Kn<W<5000KN
Ψ =1.1 for W>5000KN

18 Udit Sood
Master Thesis developed at University of Rostock, Germany
Where W is the maximum working load and Ψ is termed as the dynamic amplification factor.
Figure 4: A gernalized dimensioning of the crane and its essential components
refer: [01]

Design Requirement and Load Assessment of Crane on Heavy Lift Ship 19
““EMSHIP” Erasmus Mundus Master Course, period of study September 2015 – February 2017”
4. STUDY OF THE CLASSIFICATION RULES FOR LIFTING
APPLIANCES
To carry out cargo operations the vessels need to comply with the rules specified by
classification society or the European Union rule requirements. The classification society chosen
for the assignment is DNV-GL. And the certificate provided after inspection is in compliance
with DNV GL guidelines which is valid for the shipboard crane operations carried by on-board
ship operating under safe working conditions.
In this thesis the following rules will be used in order to carry out the required calculations.
DNV-2.22 lifting appliances
DNVGL-RU-0050 cranes on crane vessels.
DNVGL CG 0378,Offshore & Platform Lifting.
Code For Lifting Appliances in Marine Environment (Lloyd’s Register)
The guidelines are given by the two major classification societies that are DNV-GL and the
Lloyds Register regarding the construction, maintenance and the operations of the inland and the
offshore cranes. They mainly concern the study of the static loads, allowable stresses and fatigue
loading on the crane during its sea and offshore cargo handling operations.
The study is created after discussions with the classification representative’s senior specialist
marine team leader “Dr. In Enno Alberts” and joint meeting held with “Mr Marco Hartmann” a
lead specialist for lifting appliances Lloyd office in Hamburg.
The main areas covered in this part of the topic are the rules followed in the heavy lift cargo
operation during the harbour lift. As the vessel is in sheltered water, there is little effect of the
wave on the lifting operation. While on the other hand the cargo loads on the boom tip create
significant deflection and create cyclic loading on the crane structure, which can pose a threat of
fatigue due to continuous cargo handling. In the sailing conditions the boom is in the rested
position or is in supported condition. It is usually locked with the boom tip facing upwards and
lock pin inserted for additional support and restricting motion of the boom due to sea conditions.
This load case is not much of a fatigue problem for the crane. The European rule specifies that
the stresses which are below 50% of the yield stress of the material do not contribute for the
fatigue loading on the crane structure. Hence the sea going condition with boom locked is not
much of fatigue problem.
In order to analyse the loads on the crane we consider the static and the dynamic loading factors
which are considered crucial during the design of the crane structure. These conditions are given
below: refer: [02]
On board and off board lifts.

20 Udit Sood
Master Thesis developed at University of Rostock, Germany
Side loads, and the wind effects.
Vertical dynamic loads
Heal or trim of the ship during the cargo operations
Allowable stress of the structural components
Special consideration for the crane foundations, slewing bearing and the pedestal
Storing position of the crane boom during non-crane operation condition subjected to
wave conditions at the sea
These conditions are monitored by keeping a close check on the given parameters.
Vertical velocity of the vessel during operation
Hoist velocity
Loading conditions for the crane structure

Design Requirement and Load Assessment of Crane on Heavy Lift Ship 21
““EMSHIP” Erasmus Mundus Master Course, period of study September 2015 – February 2017”
5. LLOYDS REGISTER RULES AND GUIDELINES FOR LIFTING
APPLIANCES
The factors which have a drastic influence on the life of the crane and its structure have been
specially controlled in terms of the force limitation. The rules and guidelines are founded under
the heading of “Code For Lifting Appliances in Marine Environment, Jan 2016” under Lloyds
Register guidelines. The detailed specific rules can be found in under the heading of “Cranes
and submersible Lifting Appliances” gives us a brief algorithm formula of the major loads which
are kept in considerations during the design phase of the crane. These loads are characterized
into four different cases: refer: [04]
5.1 Case 1
For the crane operating without wind, the design is to be considered with respect to the
combination of the dead load, live load horizontal forces and the dynamic forces due to the crane
movements. Given by:
(1)
Where:
Fd=Duty factor
Lg=dead load
Fh=Live load
Ll=Hoisting factor
Lh1=Horizontal component of the live load due to the heel and trim.
Lh2=The next most unfavourable horizontal load.
Lh3= The horizontal component of the dead load due to the heel and trim.
5.2 Case 2
In this case the wind loads are also considered in the calculations.
(2)
Where:
Lw=The most unfavourable wind load. Refer: [04]
Rest all the parameters are same.
5.3 Case 3
In this case “the crane is considered in the stowed position when subjected to the forces
subjected from the accelerations due to the ship's motion and the static inclination, together with

22 Udit Sood
Master Thesis developed at University of Rostock, Germany
the wind force. The effects of the anchor locks and lashings are to be taken into consideration.
Refer: [04]
5.4 Case 4
In this case the “canes are to be considered into the exceptional load conditions” which are:
Refer: [04]
a) Coming into contact with buffers.
b) Failure of the hoist wire or sudden release of the load for the cranes with the
counterweight.
c) Test loading.
The Lloyds guidelines are the ones which have recently been updated and the Jan 2016 issue.
The guidelines given under “Fatigue design assessment application and notification “given by
the LR represent the application, responsibilities and the Fatigue design assessment procedures
for the ship structure. The crane foundation is analysed for the fatigue, and it is at the discretion
of the manufacturer to go for fatigue analysis for cranes structure operating on the heavy lift
ship. It is mostly seen that as the cranes on such ships have very few loading and the discharge
operations during their lifetime the load cycles experienced during its life are quite low (below
20,000) hence the fatigue does not really pose a topic of much of a concern for crane structure of
heavy lift ships. Reference is again made to Chapter 4, Section 2.3.4 of the CLAME. Ref: [05]
Makes the decision how much of a concern fatigue shall be for the design and operation of a
crane depends on the intended use of the crane and the way it is stowed on board.
For cranes which are rarely used, such as some shipboard cranes which are turned away from the
quayside while in harbour and where the mobile harbour cranes are utilized to unload the vessel,
fatigue might be less of a concern as for jib cranes in a trans-shipper compared to the container
or the feeder ship crane which are heavily utilized. The classification society is really concerned
about the storage position of the boom when the ship is in its sea voyage or at anchor with no
cargo operations taking place. The storage of the boom resting freely or with the two booms tied
up to each other in a freely hanging position have proved to be with future studies a case of
major fatigue crack initialization case. It is also found that the boom locked on the housing with
its boom tip upwards poses a concern for fatigue crack on the structure of the housing. Hence,
even though the class does not give direct rules for the calculation of fatigue for the structure at
lower stress range (below the endurance limits and stresses below 10% of the maximum stress),
but still they ensure that these practices which have proved to be a major concern for the fatigue
crack initialization are discouraged on board.
The FEA that is “Federation European De La Manutention” ref: [06] which is an organization
operating in the European Union have specified rules for building crane and other lifting beam.

Design Requirement and Load Assessment of Crane on Heavy Lift Ship 23
““EMSHIP” Erasmus Mundus Master Course, period of study September 2015 – February 2017”
In their rules under the heading of “Rules for the design of hoisting Appliances” in the chapter
“DIN 15018-1” ref: [08] specifies the structural requirements for the building of the crane based
on fatigue calculations. These design criteria are followed by the manufacturer during its design
phase. It also specifies the load cases, calculation, verification and analysis of the structure and
the ropes used in the cranes for the hoisting and the lowering of the crane boom. Ref: [08]. The
regulation brings out the significance of the duty factor which has been incorporated for the
structural design criteria given in the Lloyds rules. These rules are kept as the benchmark for the
design rules for fatigue by LR. These rules are specified under the heading of “Lifting appliances
in a marine environment”. The definition of the “duty factor” can be found under the heading of
the design standards such as F.E.M. 1.001. ref: [06] the guidelines given by LR “duty factor” is
defined as the “amplifying coefficient”. It states that for pure fatigue calculations the duty factor
may be set to 1,0. This also that the low cycle fatigue may need to be taken into consideration for
the determination of the fatigue failure of the structural components of the crane having low duty
cycles. Ref: [05]
While the guidelines provided under “EN-3.1.9 under DIN 4132” EN rules provides the
guidelines for the fatigue assessment of the crane structure. These rules are not directly
incorporated in the classification society, but they are used as the benchmark for all the
calculations considered essential. The EN 3-1-9 states that in case the wind load increase the
mean stress by creating a constant load on the structural components and hence increasing the
chances of the fatigue failure of the component.Ref: [10] On the other hand the rule also points
out that the effect of the wind is usually negligible and can be neglected for the calculations. It
depends on the case whether the wind load has an influence in our case or not. But in order to be
on the safer side, I have incorporated wind effect on the longer cross section of the boom
structure which will give a bigger margin for the safety and the operational convenience of
operator.
From the above we can conclude that F.E.M. 1.001 Ref: [06] rules state that it requires the
operational load case without wind can be considered while EN-3.1.9 ref: [10] series of
standards appears to be more widely accepted and followed.
The Lloyds register has three levels of fatigue design assessments:
Level 1: considers the welding details in comparison with a detail design guide;
Level 2: considers ship specific voyages (sea areas) and calculates stress concentration in way of
bottom and side longitudinal intersections with transverse structures using a special software.
Level 3: makes use of the full ship motion analysis in connection with a fine mesh finite
element investigation which results in a fatigue live prediction.

24 Udit Sood
Master Thesis developed at University of Rostock, Germany
From this it is seen that the lifting analysis can be done by taking the wave height and the period
or on the other hand by considering the ship specific motion analysis. The limitation is that the
rule needs to be implemented fully, by either method and there should be no mixing of the
criteria.
The allowable stresses calculated using these load factors and the rule requirement formulae
given above are then tested for the yielding and fatigue of the component.
In this rule it is found that no mention of the swell is incorporated. It is usually assumed that in
order to keep the structure safe maximum swell condition are given by the manufacturer.
This calculation for the fatigue is done in the design phase and need to be followed by the
operators using the class rules and guidelines
Snatch loads are a major concern during the operation of the cranes. The snatch load is the
situation when the hoisting speed of the crane is low and the wave created on at sea results the
vessel to rise and, during this scenario ship hull can accidentally touch the suspended cargo and
give it a reaction upward force. This reaction force will create fluctuating loads on the boom tip
and may cause severe damage to the structure. This effect does not directly incorporate in the
classification rules for the heavy lift ships. Snatch loads are, in general, to be avoided and safety
checks are incorporated during the cargo handling conditions in order to prevent such situations.
The dynamic factor for general purpose offshore cranes is (using the simplified method) is
derived by taking into account the various velocities which are present during a lift, e.g.
minimum and the actual hoisting speed, boom tip velocity and load supporting deck velocity.
The prescribed minimum hoisting speed is kept as a reference, the risk of snatch loads occurring
during the operations are kept under check. But in the heavy lift vessels due to the large weights
of the cargo the hoist and the lowering speeds are really low. In order to prevent the lifted cargo
touching the deck or transferring the loads to some structure, it is ensured that the sea conditions
are fairly calm. The restricting conditions of the sea during the cargo operations are given by the
manufacturer.
Figure 5: Ship 183 Type [Ref: www. http://sal-heavylift.com/]

Design Requirement and Load Assessment of Crane on Heavy Lift Ship 25
““EMSHIP” Erasmus Mundus Master Course, period of study September 2015 – February 2017”
Table 1: Ship crane specifications on ship 183 type [Ref: http://sal-heavylift.com/]
Cranes 2 x 1,000 tons SWL,
Combinable up to 2,000 tons
Capacity
1,000 MT @ 16m outreach
800 MT @ 25m outreach
500MT @ 38m outreach
Slewing 360 degree with hydraulic
motor drive
Luffing 18.17 degree to 84.35 degree
Hoisting Maximum boom tip height of
37.3 meters
Operating 5.4 degree inclination(max)
(5 degree Heel and 2 degree trim.)
Wind Speed 20m/sec (Fatigue calculation)
The engineered lift calculations eliminate the risk of snatch loads to occur during open sea
condition lifts of shipboard cranes the clearance distance between the cargo lift and the structure
is defined. Special formula and the rule requirements are incorporated in order to ensure these
parameters.
Figure 6: Basic dimentions of the crane and its angle of refrence
26 Udit Sood
Master Thesis developed at University of Rostock, Germany
It was searched in the rules that whether it was possible to lift loads by crane beyond the SWL. It
was found out that it is not allowed. Only under special conditions on the joint approval of the
flag state, port authority, classification and the manufacturer a load lift of 110% of SWL is
allowed. But as we can see these are for special cases and the operation are deemed to be
accepted for the situations which are specified. But in the normal operations the lift loads in no
case should exceed the SWL capacity of the crane.
One of the major concerns of the crane manufacturers is to rate their crane with Safe Working
Loads after the class inspections. It was searched in the rules, whether it was possible to get the
class approval for the cranes for higher safe working loads for the crane for a similar model
which had been allotted a lower lifting capacity by a different classification society. And as my
comparison was mainly concerned with the classification society DNVGL and LR and both are
members of IACS (International Association of Classification Society) I received an answer that
was a “No”. As both of these classification societies are under IACS (International Association
of classification society) the design factors set by them have an almost equal value. It is seen that
the crane classed by one classification society when having a given SWL will have mostly the
same SWL, when its similar model is tested by another class. But this value would never exceed
the one which was given before. And if the manufacturer plans to change the class, first of all it
requires a special reason which should be acceptable by IACS for the change of class. And still
other classification society cannot rate SWL higher than the previous defined. This system gives
uniformity in the inspection criteria and ensures that the safety is always ensured between all
class inspections to a similar level. This similarity in the design requirements also extends to the
design rules and the factors which will be discussed in the later sections.
Design Requirement and Load Assessment of Crane on Heavy Lift Ship 27
““EMSHIP” Erasmus Mundus Master Course, period of study September 2015 – February 2017”
6. DNVGL GUIDELINES FOR CRANE STRUCTURE
Classification society DNVGL provides special rule requirements for the classification of the
heavy lift crane operating on the ships. It is seen that comparing the rules small differences are
found among them. The major field of our concern will be design factors calculated with the
different structural strength calculation procedures.
The structural analysis of the crane is important during the design stage as well as during its
operating life. In order to obtain the stresses at various components of the crane the DNVGL
rules and guidelines for the design and calculation of the loads are followed. Ref: [17]. This
gives us the basic overview of the loads which we will experience and need to employ in order to
get the actual load calculations and deflections on my finite element model.
The main field of the concern is the structural components of the crane. These structural
components are constructed keeping in mind certain failure criteria and the loadings which may
be harmful for its long working. These criteria need to be looked upon during the design phase of
the crane structure:
Design Structural Loads.
Fatigue analysis.
The loads carrying capacity of the crane are defined as design load of the cranes. These loads
determine the static and the dynamic loads the crane is designed to handle in the normal running
conditions in its day to day business. The subcategories of the loads are described as.
1. Regular loads.
2. Irregular loads
3. Special loads.
6.1 Regular loads:
These regular loads are further subdivided into subcategories.
Dead loads.
Hoist loads.
Dynamic forces due to the drive system.
o Vertical dynamic force due to the lifting of loads.
o Vertical dynamic force due to the suspended loads.
o Horizontal driving force due to the lifting of loads.
o Horizontal driving force due to suspending of the loads.
Dynamic forces generated by the ship motion.
o Vertical dynamic force.

28 Udit Sood
Master Thesis developed at University of Rostock, Germany
o Horizontal dynamic force due to inclination of the crane base.
o Horizontal dynamic force due to acceleration of the crane basis.
Diagonal pull loads due to the cargo runner deflection angles. Ref: [17]
o Harbour operation.
o Sea operations.
Partial dropping off the useful loads during normal operations.
Tie down forces on the cargo hooks.
The regular loads are the operating loads which the crane experiences during the majority of its
life span. These loads are the usual loads which the crane manufacturer tests for 25 years of the
crane operating life. It is further categorized into:
Dead loads (LE): Dead loads are the weights of all the fixed and mobile components of
loading gear and loose gear permanently present during the operation. Dead loads are calculated
by multiplying the mass by the acceleration of gravity g = 9.81 m/s². This is accounted as the
structural self-weight in the finite element modal analysis.
Test load (LP): The test load (LPdyn) of loading gear is the test load which is to be raised,
lowered and braked by motor during the test using the drives (dynamic test).This load is 110% of
the safe loads. This will be explained more clearly in the test certificate given below. This test is
carried on the periodical basis and need to be logged in for the class surveys. Ref: [17]
Nominal loads (LNe) Test loads (LPdyn)
1. Up to 20 tons SWL +25%
2. 20 t to 50 tons SWL +5t
3. Over 50 tons SWL +10%
Hoist load (LH): Regarding the crane dimensioning, the nominal load which the crane
handles are termed as the hoist loads. Sea operation: LH = (LE + LN)
Where LN which is a nominal load at sea can be calculated by the formulae of hoist load
coefficient Ψ.
(3)
Where:
The relative speed between load and hook in the course of lifting the load [m/s]
Table 2: Load limits for inspection

Design Requirement and Load Assessment of Crane on Heavy Lift Ship 29
““EMSHIP” Erasmus Mundus Master Course, period of study September 2015 – February 2017”
Nominal load at sea [t]
Ψ is also called as the dynamic amplification factor. This factor need to be multiplied with the
lifted loads and it gives the real SWL of the crane. The loads combined with the self-weight of
the crane gives the total loaded condition of the crane. This dynamic amplification factor is
induced in the crane operation period due to the sudden breaking of the cargos and the sudden
stopping effects of the crane operations which result in loads much greater than the actual weight
of the cargoes to be applied on the boom head. So the lifting load calculations are carried out
after multiplying the actual load weight with this coefficient. Now the question will arise that
how do we calculate the nominal sea load which is one of the unknowns in the formulae.
This is presently not required because we consider the ship to be operating in sheltered waters.
But during the sea voyage this is an important criterion, but as the crane is without loads in that
situation the stresses are below 50% of yield strength and hence does not contribute to fatigue
failure of the component.
Dynamic forces due to drive systems:
The dynamic forces of the system consist of the horizontal and the vertical forces which can be
calculated from the formulae given in the equation 1. These calculations require stiffness which
can be calculated by the instructions given. It is found out by multiplying the self-weight with
the dynamic amplification factor that is 5% of the self-weight for the boom to find out the actual
loading due to the dynamic conditions (As provided in the section above under Dynamic
amplification factor)
The horizontal dynamic force angle can be calculated by the equation given below. Ref: [15]
= = [°] (4)
Where:
: Deflection angle in longitudinal direction of the crane boom
: Deflection angle in transverse direction of the crane boom
: Significant wave height [m]
This factor and the weights are combined with the physical parameters such as the list and the
trim factors to find the loads. Ref: [15]
For such operations the maximum trim angle (β) allowed is +/-2o and the heel angle (α) allowed
is +/-5o. Horizontal forces due to the suspended loads are equal to:
(m/ ) (5)

30 Udit Sood
Master Thesis developed at University of Rostock, Germany
Where:
/ 30 = Angular speed [1/s]=(0.0314s-1)
r : Rotating/slewing radius [m]=38mts
v : · r = Circumferential speed [m/s]=1.1938m/sec
n : r.p.m. [1/min]
Dynamic forces due to the ship motion:
The calculation is to include the following influences: Ref: [15]
Vertical and horizontal motions of the cargo deck
Motion behaviour, on which the crane is mounted
Structure weight of the crane
Hydrodynamic properties of a floating or submerged load (neglected as in sheltered
waters)
Influence of anchoring systems
Environmental conditions (Wind conditions considered)
Diagonal pull loads due to cargo runner:
The pull forces created by the crane should not exceed the requirements which states that:
For such operations the maximum trim angle (β) allowed is +/-2o and the heel angle (α) allowed
is +/-5o.
Partial drop off of the load:
When a part of the useful load LN is dropped during normal operation, in such cases a dropping
factor is considered.
Fsa = ( ) (6)
(7)
𝛥LN:Change in load.
LN: Useful load (max 1000tons)
σ: 0.5 for slow load dropping
: 1.0 for fast load dropping
These are usually the instantaneous conditions occurring very few times in the crane structure.
They are considered for the structural design phase and usually neglected in the fatigue
calculations as they do not occur significant number of times during the crane life.

Design Requirement and Load Assessment of Crane on Heavy Lift Ship 31
““EMSHIP” Erasmus Mundus Master Course, period of study September 2015 – February 2017”
6.2 Irregular loads.
These loads are further subdivided into subcategories: Ref: [17]
1. Wind load.
2. Snow and ice load.
3. Temperature load
6.2.1 WIND LOAD:
The total wind load acting on a crane structure is the sum of the wind loads acting on its various
structural components. Ref: [15]
LW =q.cf.Aw [N] (8)
(Dynamic pressure) (9)
Where:
v : Wind speed [m/s]
cf : Form coefficient [-]
Aw: wind area [m2]
The maximum wind speed calculation for the loading and port operations are as provided
below:
Operating Mode Wind speed at operation Wind speed out of operation
1. Ship loading using its
gear in harbour condition. 20m/s 50m/s
2. Ship loading using its
gear in sea condition. 25m/s 50m.s
3. Offshore loading gear 25m/s 63m/s
Figure 7: Determing the dropping factor fa .Ref: [19]
Table 3: Wind speed for various operations

32 Udit Sood
Master Thesis developed at University of Rostock, Germany
But for the fatigue calculation the wind speeds are taken to be 20m/sec for the port operating
conditions. So I have considered this wind as additional load on the structure.
The formula for the calculation of the wind velocity is: Ref: [84]
(10)
6.2.2 SNOW AND ICE LOAD:
A general ice accretion of 3cm thickness may be assumed for all parts of the construction which
are exposed to the weather conditions. The specific weight of the ice is assumed to be 700
kg/m3. Ref: [18]
The specific weight of snow is assumed to be 200 kg/m3. In our case we do not consider the
snow and the ice loads as the structure is designed in a form which cannot hold ice on it.
6.2.3 TEMPERATURE LOAD:
The temperature loads are to be considered in the calculated strength analyses. The European
Rules state that in no case the temperature of the components to exceed above 150 degree
Celsius as it has detrimental effect on the life of the structure. I have made a study of the
reduction of the number of cycles due to the increase of the temperature of the structure. This
will be discussed in the mean stress calculation section. Ref: [18]
6.3 Special loads.
The special loads are loads which are experienced during certain conditions and operations. Such
loads may be of small interval, but involves larger forces so they form a critical part of the load
determination and need to be observed during the crane design phase.
Dynamic load testing.
Buffering forces.
Loads due to the safety system.
Tear off the hoist loads.
Dynamic load testing are calculated using the given load
Nominal loads (LNe) Test loads (LPdyn)
Up to 20 tons SWL +25%
20 t to 50 tons SWL +5t
Over 50 tons SWL +10%
Table 4: Load limits for various loads

Design Requirement and Load Assessment of Crane on Heavy Lift Ship 33
““EMSHIP” Erasmus Mundus Master Course, period of study September 2015 – February 2017”
Buffering forces: The impact force on the buffer is to be determined from the buffer
characteristic and - in order to take into consideration the dynamic effect of the buffering force it
need to be multiplied with the following factors fp:
fp: 1.25 for buffer with linear characteristic.
Loads due to the safety system: The loads LS due to safety systems, such as e.g.
o AOPS (Automatic Overload Protection System)
o MOPS (Manual Overload Protection System)
o ELRS (Emergency Load Release System)
Tear off the hoist loads: These loads are for when in the catastrophic case of the hoist load is
torn off, this result in fa = - 1, this can be seen from the fig 7.
The problems experienced by the crane structural parts in the earlier working models are usually
analysed. This also forms only intermittent loads and not seen to occur significant times during
the life of the crane operation.
From the above study we see that the maximum loads the crane can bear is defined by the
maximum safe working loads (Other cases which exceed the safe working load do not have
significant occurrence and hence are neglected). And this SWL loads are added with the
structure weight, with the dynamic amplification amplitude for simulating motions and the
physical and environmental conditions (Wind, list and trim).
These all finally contribute to the maximum loading a crane will withstand during its operating
cycles.

34 Udit Sood
Master Thesis developed at University of Rostock, Germany
7. FINITE ELEMENT MODELLING
The finite element analysis is a powerful tool for the structural analysis and analysis of 2-D or
3D models using the building elements such as members, plates, shell, solid or contact element.
The structure can be tested for the applied loads and also for the calculation of the linear and
nonlinear load effects. This greatly reduces the long iterative calculations earlier required in such
cases. The finite element provides a means of calculations for the deformations, internal forces,
support forces, reaction forces and solid contact stresses. Further analysis for the stability and
fatigue calculations are also carried out. These features of the software enable us to get quicker
results for the effects on the members when they are subjected to the loading conditions.
The situation and the load conditions to be analysed are to be determined by the user and need to
be accurately set in order to get the real state results for our calculations.
7.1 Element Description
The software provides feature to incorporate many types of the elements in its design in order to
calculate the stresses. The building blocks can consist of the beam for the supports, shell element
for major structural plating’s and rib elements for the smaller supporting framework. These
combine to form the finite element model. In my case I have used the shell elements for the
analysis of the stresses representing the plate. It enables me to see the local buckling and other
local phenomenon occurring at the sites of the connections and the welds and give us a detailed
overview of the stresses. While the beams are used for the supporting members for the internal
framework mostly comprising of the flat bar elements.
7.2 Material Properties
The material used for the structure is steel S-355 (E=210000N/mm^2). The material is chosen
because the actual crane is made of this material type. And for the analysis point of view we use
linear elastic and isotropic material. As the structure is made of the steel it follows the elastic
nature and hence it falls into this category.
7.3 Modelling of the crane
In order to model the crane the following steps need to be followed to carry out the analysis.
Prior to the modelling the crane dimensions and the certain parameters such as the height, width,
dimensions of plates and the plate thicknesses are required. Then the view of the crane in the top
and front side views is modelled in AutoCAD. The dimensions which are missing are located in
the manufacturer structural drawing or in the design manual. Some of the parameters are missing
the company is contacted for the specific requirement and the data. The AutoCAD model needs
Design Requirement and Load Assessment of Crane on Heavy Lift Ship 35
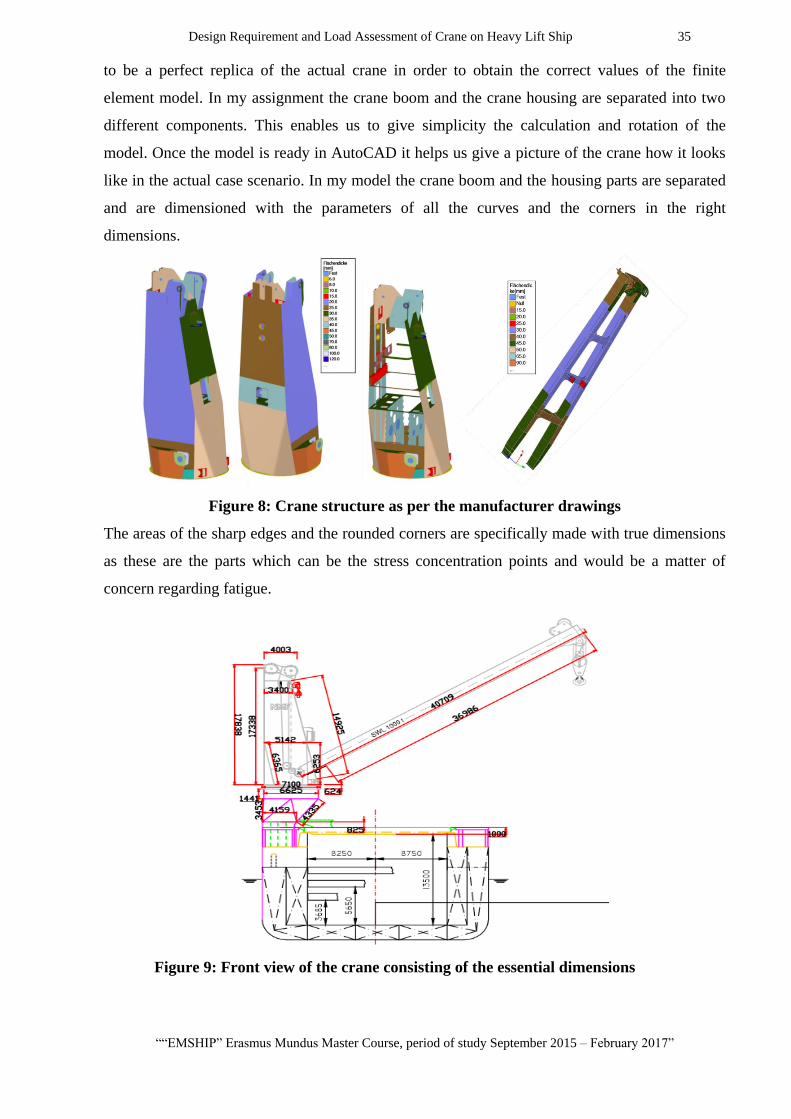
““EMSHIP” Erasmus Mundus Master Course, period of study September 2015 – February 2017”
to be a perfect replica of the actual crane in order to obtain the correct values of the finite
element model. In my assignment the crane boom and the crane housing are separated into two
different components. This enables us to give simplicity the calculation and rotation of the
model. Once the model is ready in AutoCAD it helps us give a picture of the crane how it looks
like in the actual case scenario. In my model the crane boom and the housing parts are separated
and are dimensioned with the parameters of all the curves and the corners in the right
dimensions.
Figure 8: Crane structure as per the manufacturer drawings
The areas of the sharp edges and the rounded corners are specifically made with true dimensions
as these are the parts which can be the stress concentration points and would be a matter of
concern regarding fatigue.
Figure 9: Front view of the crane consisting of the essential dimensions

36 Udit Sood
Master Thesis developed at University of Rostock, Germany
This model would be beneficial for the company to present to the client who wishes to analyse
the crane present on the ship. And also useful for me to further design the finite element model.
The windows and the cut-outs are made in the model as they were of main concern in terms or
stress points. The modelling of the back wall and the front operator chamber cut out is especially
important for calculating the structural strength of the housing. Similarly the crane boom is quite
a large member and is supposed to be elastic due to the material properties of the steel used for
its construction. This boom member needs to be specifically analysed as it is supporting the
loads on one side and is hinged using the bearing pin on the other. Similarly the boom tip is also
being supported by the wires. The wires prevent too much of flexing of the boom and depending
on the stiffness of the wires the boom tip will show deformations on application of the loads.
This nature of the boom has to be checked for the deflections in the finite element model needs
to be compared with the manufacturer given deflections (this is done by comparing model with
the deflections of the boom finite element model of the manufacturer). As the crane is a
copyright of most of the data about the structure was kept confidential. But SAL Heavy Lift
being its business client had the opportunity to get the structural details lacking by the word of
mouth from the chief design engineer of the crane manufacturing company.
The essential structural drawings were obtained and the position of the brackets and the
stiffeners were placed on the crane after determining the stress concentration points at the
structure and were later approved by the manufacturer by presenting my finite element model to
their chief engineer. I had the opportunity to visit the manufacturer in order to get stiffening and
other information which was not mentioned in the company drawings. These stiffeners and the
brackets in the crane housing and the boom element were essential to calculate the structural
strength of the component and needed to be modelled in the exact and accurate way. If any of
these structural members were missing it would lead to calculation of different stresses in the
finite element model from the real case scenario, so in order to get the real results of the structure
the crane housing and the boom are accurately modelled and all the small and tiny steel parts are
tried to be modelled.

Design Requirement and Load Assessment of Crane on Heavy Lift Ship 37
““EMSHIP” Erasmus Mundus Master Course, period of study September 2015 – February 2017”
The edges of the boom are specially kept into consideration as they can be areas of the stress
concentration points so they need to be rounded off. The curvature used on the actual boom was
analysed and the same dimensions are given to the model. This enables us to locate the actual
areas which would act as the points of the stress concentration. This part forms our first stage of
the project. The pictures and the dimensions obtained from collecting all the structural drawings
and filling the vacant spaces with the information given by the manufacturer helped me model
the crane in drawing software. Once the first step of modelling in the AutoCAD and the inventor
software is done, then we get a clear picture of the machinery how it actually looks. Now using
the reference of the AutoCAD model the crane and the crane housing needs to be modelled. In
order to do so it is not very simple. This model is now sent to the second stage, which is
modelling of the crane and the boom in the RFEM software. This is finite element software and
requires a plate and the shell elements to model the machinery.
The central portion of the boom consists of the connecting surface between the two boom arms.
This is modelled and the two boom arms are then connected, it is ensured that the nodes match
arms and members are well connected to share the loads which are suspended on the boom tip.
Figure 10: Plate and stiffening arrangement of crane structure

38 Udit Sood
Master Thesis developed at University of Rostock, Germany
Figure 12: 3-D model of the crane
These two references and as well as the manufacturer’s drawings are consulted to finally prepare
a finite element model of the crane boom. The final model of the boom is presented in the
drawing given below for further reference.
Figure 13: Position of the cranes on actual ship structure
[Ref: www.http://sal-heavylift.com/]
It is seen that for the reduction of the weight the plate thicknesses vary according to the areas
which bear more stresses compared to the areas of less stress. It is seen that the surfaces are
curved at most of the parts so in such places the quad angles are used while the areas of nodes
lying in the same plane the flat surfaces are used. The crane housing has various cut outs for the
back window and the operator’s cabin. These are also modelled as they can contribute to stress
concentration parts in the housing as it is seen from the model that there are very few stiffeners
and most of the load of the crane boom and the crane wires are borne by the walls of the
structure. These walls are made of steel of the grade S-355. So keeping all these factors into
consideration the crane house is modelled. The areas of the maximum concern are seen to be the
place where the boom attaches to the housing and the crane wires which are placed on the top
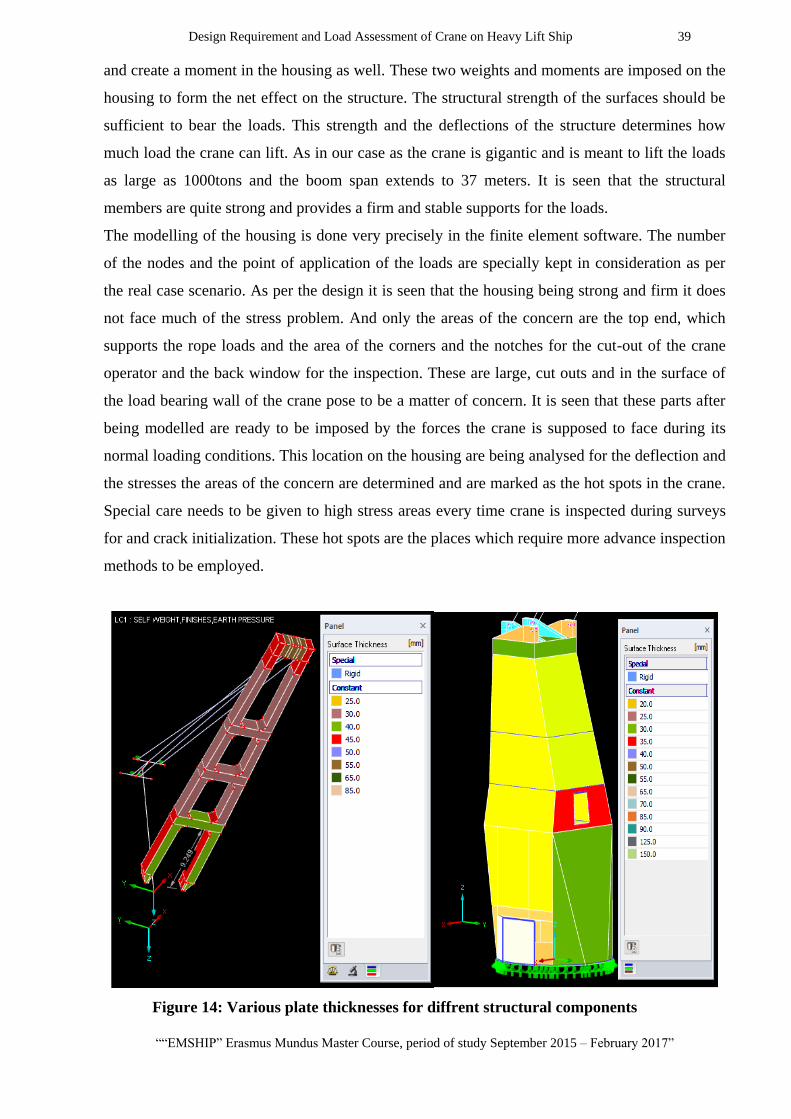
Design Requirement and Load Assessment of Crane on Heavy Lift Ship 39
““EMSHIP” Erasmus Mundus Master Course, period of study September 2015 – February 2017”
and create a moment in the housing as well. These two weights and moments are imposed on the
housing to form the net effect on the structure. The structural strength of the surfaces should be
sufficient to bear the loads. This strength and the deflections of the structure determines how
much load the crane can lift. As in our case as the crane is gigantic and is meant to lift the loads
as large as 1000tons and the boom span extends to 37 meters. It is seen that the structural
members are quite strong and provides a firm and stable supports for the loads.
The modelling of the housing is done very precisely in the finite element software. The number
of the nodes and the point of application of the loads are specially kept in consideration as per
the real case scenario. As per the design it is seen that the housing being strong and firm it does
not face much of the stress problem. And only the areas of the concern are the top end, which
supports the rope loads and the area of the corners and the notches for the cut-out of the crane
operator and the back window for the inspection. These are large, cut outs and in the surface of
the load bearing wall of the crane pose to be a matter of concern. It is seen that these parts after
being modelled are ready to be imposed by the forces the crane is supposed to face during its
normal loading conditions. This location on the housing are being analysed for the deflection and
the stresses the areas of the concern are determined and are marked as the hot spots in the crane.
Special care needs to be given to high stress areas every time crane is inspected during surveys
for and crack initialization. These hot spots are the places which require more advance inspection
methods to be employed.
Figure 14: Various plate thicknesses for diffrent structural components

40 Udit Sood
Master Thesis developed at University of Rostock, Germany
8. BOUNDARY CONDITION:
Now dealing with all the parameters it is seen that the boundary conditions for the problem set
are fixed. These boundary conditions are:
1. Boundary conditions for the fixation of the housing: The housing of the crane is fixed
in x, y and z coordinates but as the housing is sitting on a bearing which makes it freely movable
in x, y and z rotational coordinates. Hence it is seen that the moments are kept free. The housing
is free to rotate and change its support conditions in all the coordinate system. These changed
geometrical conditions can be viewed by the figure given below.
2. Fixation of the boom: The boom is considered to be a large beam which is free to show
deflections. The boom is the actual load transferring member of the crane and it needs to be
analysed in detail. Hence the supporting conditions for the boom member are crucial for the
analysis results. The boom tip is supported by the support wires which take a part of the boom
structural load and the other part of the load is taken by the boom base. The boom tip wires are
of specific stiffness and the young’s modulus which is present on the actual crane. While the
base of the crane is hinged with freedom to move as a hinged joint in y axis. The support
conditions can be viewed in the figure given below. The support wires as it is supported on the
sheaves they have freedom of rotation motion in the X and Y direction, hence it is kept free in
these axes. While the other motions are restricted. Same is the condition with the boom support
as it is resting on the pin bearing it has freedom of rotation in the X and Y direction while the Z
direction is held up because of the wire supports restricting its motion.
Figure 15: The boundary conditions for the housing support condition

Design Requirement and Load Assessment of Crane on Heavy Lift Ship 41
““EMSHIP” Erasmus Mundus Master Course, period of study September 2015 – February 2017”
3. Stiffness of the wires: The wires of the crane are designed with the young’s modulus as
provided with the manufacturer. The wire thickness is kept as 80 percent of the nominal diameter
and the length of the crane wires are also kept same as the actual crane at that boom angle and
the outreach. For the finite element model the wires are used as the tension members as they are
only capable to take the tension loads .The list of the crane wire diameters and the lengths are
provided in the table given below.
Boom Angle Outreach
Wire diameter Luff (m)
Young’s mod Luff Length of the Luff rope(m)
Wire diameter Hoist (m)
Young’s Modulus Hoist
Length of the hoist rope(m)
69.74 16m
115mm 102 000N/mm²
25.065
115mm 94000N/mm²
21.065
54.04 25m
115mm 102 000N/mm²
28.613
115mm 94000N/mm²
25.5
18.17 38m
115mm 102 000N/mm²
38.5594
115mm 94000N/mm² 35.91
Figure 16: Boundary conditions for the boom supports
Table 5: The Youngs modulus for crane wire at various outreach

42 Udit Sood
Master Thesis developed at University of Rostock, Germany
9. MESH GEOMETRY:
The finite element method is considered to be of the best analysis for the calculation of the
stresses present on the complex geometry models and the case where the calculations are
nonlinear and require complex analytical formulae for the calculation. In such situations the
finite element modelling becomes really useful and need to be used for accurate and realistic
results for the assignment. But the software has certain limitations and it is dependent on the user
how efficiently he has handled the problem to calculate the results. The basic parameters on
which the results of the analysis depend are basically based on the following parameters:
1. The boundary conditions chosen.
2. The mesh geometry chosen for the analysis.
3. Mesh size chosen for the analysis.
4. Type of the equation used for the analysis.
5. The software accuracy and stability.
6. Correctness of the model design.
7. Fineness of the meshing and the expertise of the designer.
The analysis of the appropriate mesh required convergence study. This study will be basically
concentrated on the selection of the element type. A comparative study will be made and the
mesh stress results obtained from the analysis will be compared to the actual results to give us
the actual scenario to which mesh shape and the type need to be chosen for the further analysis.
Also the size of the mesh depends on the plate thickness, which need to be meshed and the
processing capability of the computer processor used.
The mesh type used forms a major concern for the analysis. Hence a study was done on the
different types of the meshes available and the best suited for the given problem set.
It is to be noted that also the error in the displacements cannot be eliminated just by increasing
the number of elements in depth. This phenomena is called the shear locking.
Figure 17: The shear lag effects on the elements

Design Requirement and Load Assessment of Crane on Heavy Lift Ship 43
““EMSHIP” Erasmus Mundus Master Course, period of study September 2015 – February 2017”
As in the modelling I have used shell type elements, it is necessary to define the shape function
for the analysis and to prevent the shear locking as was shown in the previous text. So in order to
obtain the correct stress results the shape function chosen is shown below.
Figure 19: The shape function considered in RFEM
Figure 18: Defining the element size in finite element model

44 Udit Sood
Master Thesis developed at University of Rostock, Germany
Figure 20: The mesh geometry and the size of mesh chosen for housing.

Design Requirement and Load Assessment of Crane on Heavy Lift Ship 45
““EMSHIP” Erasmus Mundus Master Course, period of study September 2015 – February 2017”
Figure 21: The mesh geometry and the size of mesh for boom
Figure 22: Detecting the flaws in the mesh of the model
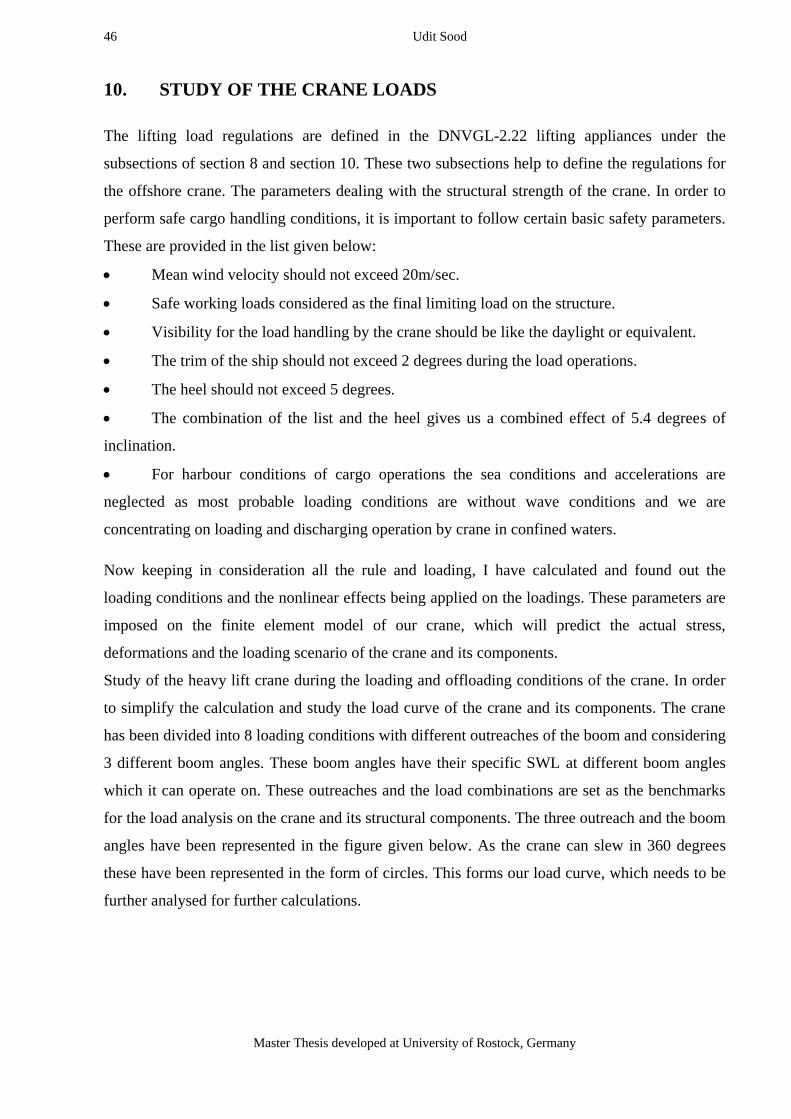
46 Udit Sood
Master Thesis developed at University of Rostock, Germany
10. STUDY OF THE CRANE LOADS
The lifting load regulations are defined in the DNVGL-2.22 lifting appliances under the
subsections of section 8 and section 10. These two subsections help to define the regulations for
the offshore crane. The parameters dealing with the structural strength of the crane. In order to
perform safe cargo handling conditions, it is important to follow certain basic safety parameters.
These are provided in the list given below:
Mean wind velocity should not exceed 20m/sec.
Safe working loads considered as the final limiting load on the structure.
Visibility for the load handling by the crane should be like the daylight or equivalent.
The trim of the ship should not exceed 2 degrees during the load operations.
The heel should not exceed 5 degrees.
The combination of the list and the heel gives us a combined effect of 5.4 degrees of
inclination.
For harbour conditions of cargo operations the sea conditions and accelerations are
neglected as most probable loading conditions are without wave conditions and we are
concentrating on loading and discharging operation by crane in confined waters.
Now keeping in consideration all the rule and loading, I have calculated and found out the
loading conditions and the nonlinear effects being applied on the loadings. These parameters are
imposed on the finite element model of our crane, which will predict the actual stress,
deformations and the loading scenario of the crane and its components.
Study of the heavy lift crane during the loading and offloading conditions of the crane. In order
to simplify the calculation and study the load curve of the crane and its components. The crane
has been divided into 8 loading conditions with different outreaches of the boom and considering
3 different boom angles. These boom angles have their specific SWL at different boom angles
which it can operate on. These outreaches and the load combinations are set as the benchmarks
for the load analysis on the crane and its structural components. The three outreach and the boom
angles have been represented in the figure given below. As the crane can slew in 360 degrees
these have been represented in the form of circles. This forms our load curve, which needs to be
further analysed for further calculations.

Design Requirement and Load Assessment of Crane on Heavy Lift Ship 47
““EMSHIP” Erasmus Mundus Master Course, period of study September 2015 – February 2017”
Figure 23: The load case description of the crane
Loads +Wind
Load Case S.No.
Boom angle. (degrees)
load SWL
(tons) Outreach
Weight of Boom(t)
Total Weight
Force P(KN)
Force by Finite element(KN)
1 69.74 1000 16 152 1152 11301.12 11369.8
2 54.04 800 25 152 952 9339.12 9418.21
3 18.17 500 38 152 652 6396.12 6507
4 54.04 500 25 152 652 6396.12 6475.04
5 69.74 500 16 152 652 6396.12 6464.58
6 18.17 350 38 152 502 4924.62 5035.99
7 54.04 350 25 152 502 4924.62 5003.96
8 18.17 250 38 152 402 3943.62 4054.97
Now keeping these load cases as constant we distribute all the loadings on the crane within these
load cases and count the number of load operation the crane has conducted for each of the load
cases as per the data obtained from the load cell which gives us the loading cycles for 1.8 years
of the operating period of the crane. This 1.8 years will be extrapolated for the life of the crane
that is 20 years.
It is to be noted the acceleration and the dynamic factor will be added in code.
Table 6: Loadings in different load cases

48 Udit Sood
Master Thesis developed at University of Rostock, Germany
Now if we combine the boom and the housing together and calculate the actual moment at the
crane pedestal centre, then we will get following forces and the moments due to various loads
being applied due to cargo and the structural weights. This final calculation of the moments is
handled by the finite element software. But in order to show the extent of the forces and the
influence of the different hoist velocities the analytical calculations have been performed.
Considering the actual weights of the wires, structure, dynamic effects and the cargo loads on the
crane are considered. It is to be noted that the centre of gravity of the different loads lies at
different points and hence have different levers at different boom angles.
SWL 800 T outstretch 25m
Hoisting Speed 1.5 m/min
Dead Hoist and wind load.
(F /KN) Factor Lever Moment (KNm)
WLL 8093.25 1.05 27.722 235579.1303
Wta 1540.17 1.05 16.029 25921.75418
WTk 1491.12 1.05 -0.018 -28.182168
WTs 287.433 1.05 12.578 3796.098888
Wth60 16.677 1.05 27.769 486.2587937
Total WT 12000.0825
Pswl 80.6 30.025 2420.015
Pwta 42.9 19.201 823.7229
Pwtk 35.1 6.677 234.3627
total P 158.6
Axial force 11841.4825
Radial force 1555.866
Resultant moment 269233.1606
Table 7: Some important crane specifacions and abbreviations
Component Weight WLL Weight of load
Crane Jib 157 t Wta Weight of Boom
Crane House 152 t WTk Weight of Housing
Hook SWL 1000t 25 t WTs Weight of Wire
Hook SWL 60t 1.7 t Wth60 Cargo Acceleration force
Ropes 29.3 t Pswl Forward acc of Boom
Equipment 1.7 t Pwta Forward acceleration of wire
Pwtk Forward acceleration of housing
total 366.7 tons
Table 8: Loadcase combination 1

Design Requirement and Load Assessment of Crane on Heavy Lift Ship 49
““EMSHIP” Erasmus Mundus Master Course, period of study September 2015 – February 2017”
SWL 500 T Outstretch 38m
Hoisting Speed 2.2 m/min
Dead Hoist and wind load.
(F /KN) Factor lever Moment (KNm)
WLL 5150.25 1.05 38.952 210643.165
Wta 1540.17 1.05 23.134 37411.8074
WTk 1491.12 1.05 -0.018 -28.182168
WTs 287.433 1.05 18.5 5583.38603
Wth60 16.677 1.05 39.273 687.703612
Total WT 8909.9325
Pswl 57 9.266 528.162
Pwta 42.9 7.305 313.3845
Pwtk 35.1 6.677 234.3627
total P 135
Axial force 8774.9325
Radial force 1324.35
Resultant moment 255373.789
Table 9: Loadcase combination 2

50 Udit Sood
Master Thesis developed at University of Rostock, Germany
SWl 1000 t outstretch 16m
Hoisting Speed 1.3 m/min
Dead Hoist and wind load.
(F /KN) factor lever Moment (KNm)
WLL 10055.25 1.05 19.225 202977.7903
Wta 1540.17 1.05 10.896 17620.77694
WTk 1507.797 1.05 -0.018 -28.4973633
WTs 287.433 1.05 8.402 2535.762669
Wth60 16.677 1.05 19.184 335.9281464
Total WT 14077.69335
Pswl 80.6 36.166 2914.9796
Pwta 42.9 22.581 968.7249
Pwtk 35.1 6.677 234.3627
total P 158.6
Axial force 13919.09335
Radial force 1555.866
Resultant moment 227559.8279
Table 10: Loadcase combination 3

Design Requirement and Load Assessment of Crane on Heavy Lift Ship 51
““EMSHIP” Erasmus Mundus Master Course, period of study September 2015 – February 2017”
11. SIMULATION OF LOAD CASES
In order to analyse the stress data set of the crane a special approach is followed. In this approach
the crane is modelled in the finite element software. This modelling is done in two parts. 1st is
the boom section which is a long supported structural component of the crane which has one end
loaded with the cargo loads and the other end which is resting on the bearing pin and the other
end, which is being supported by the crane wires. While the other part is the housing. Housing is
the vertical steel structure which gives support to the boom and as well as encloses the
machinery components of the crane which consist of the winches, the wire reel and the six
hydraulic winch driving mechanism. It consists of the hollow steel structure about 20 meters
high from the ship deck and has the wire connections for the boom at its top end and the bottom
end has a special connection of the boom using the bearing pin. The driving winches consist of
the hydraulic mechanism which provides the luffing, slewing and the hoisting and lowering
motions to the crane boom and the cargo resting on the boom tip. These two components
combine to form our crane and will be discussed in the coming sections. The crane together is a
complex part with different motions of the boom and the housing combined, hence in order to
simplify the problem the crane has been divided into two components. The wires supporting the
boom consist of one is luffing wire 2 in number and the other is the hoisting wire 2 in number.
These two pairs of the wires support the top part of the boom. The correctness of the finite
element results to the real case scenario is ensured by keeping in mind the following parameters
which are matched with the real crane in order to give us the same behavior features as that
present on the live crane. The features which are kept constant are:
o The material properties of the crane structure.
o The weld locations between the connecting plating.
o The dimensions of the crane to the real crane.
o The plating thicknesses at various locations of the crane.
o The length of the wire ropes at various loading conditions.
o The material properties of the wire.
o Dimeter and the young’s modulus of the wire materials.
o The boundary conditions and the type of the fixtures used for the connection of the crane
housing and the boom.
o The position of the connection of the wire on the housing and the boom.
o The number of the nodal connections on the real crane and the model.
o The structural members supporting the structure,its locations and the material properties.
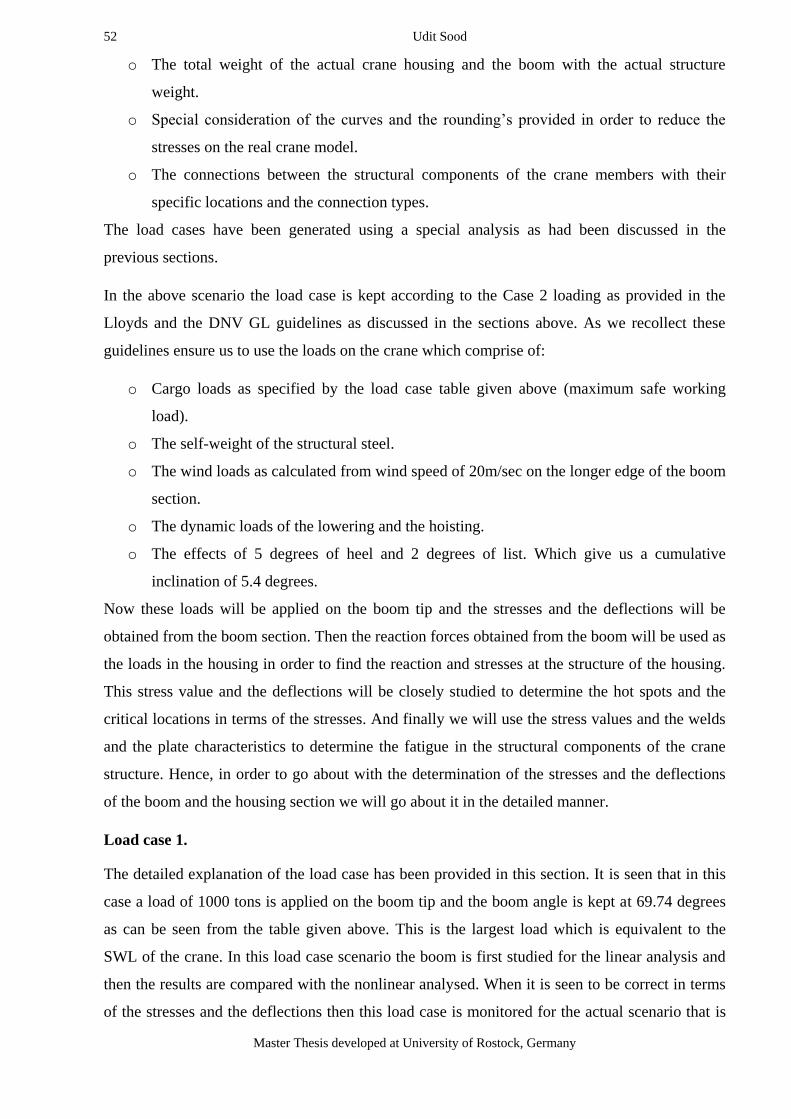
52 Udit Sood
Master Thesis developed at University of Rostock, Germany
o The total weight of the actual crane housing and the boom with the actual structure
weight.
o Special consideration of the curves and the rounding’s provided in order to reduce the
stresses on the real crane model.
o The connections between the structural components of the crane members with their
specific locations and the connection types.
The load cases have been generated using a special analysis as had been discussed in the
previous sections.
In the above scenario the load case is kept according to the Case 2 loading as provided in the
Lloyds and the DNV GL guidelines as discussed in the sections above. As we recollect these
guidelines ensure us to use the loads on the crane which comprise of:
o Cargo loads as specified by the load case table given above (maximum safe working
load).
o The self-weight of the structural steel.
o The wind loads as calculated from wind speed of 20m/sec on the longer edge of the boom
section.
o The dynamic loads of the lowering and the hoisting.
o The effects of 5 degrees of heel and 2 degrees of list. Which give us a cumulative
inclination of 5.4 degrees.
Now these loads will be applied on the boom tip and the stresses and the deflections will be
obtained from the boom section. Then the reaction forces obtained from the boom will be used as
the loads in the housing in order to find the reaction and stresses at the structure of the housing.
This stress value and the deflections will be closely studied to determine the hot spots and the
critical locations in terms of the stresses. And finally we will use the stress values and the welds
and the plate characteristics to determine the fatigue in the structural components of the crane
structure. Hence, in order to go about with the determination of the stresses and the deflections
of the boom and the housing section we will go about it in the detailed manner.
Load case 1.
The detailed explanation of the load case has been provided in this section. It is seen that in this
case a load of 1000 tons is applied on the boom tip and the boom angle is kept at 69.74 degrees
as can be seen from the table given above. This is the largest load which is equivalent to the
SWL of the crane. In this load case scenario the boom is first studied for the linear analysis and
then the results are compared with the nonlinear analysed. When it is seen to be correct in terms
of the stresses and the deflections then this load case is monitored for the actual scenario that is

Design Requirement and Load Assessment of Crane on Heavy Lift Ship 53
““EMSHIP” Erasmus Mundus Master Course, period of study September 2015 – February 2017”
analytic with the inclination of 5.4 degrees and the wind forces and self-loads and other dynamic
loads on the crane structural components.
An application of the loads at the boom it is seen that the boom shows a deflection of 350.4 mm.
This deflection value was then checked with the results of the finite element model of the boom
provided by the manufacturer which showed a value of 350.3 mm. The results are very close
with the variation of just 0.1% from this we can conclude that the model is seen to show the real
case deflections and the results as has been shown by the actual crane. The picture depicting my
results and the manufacturer finite element results have been provided below for viewing:
Figure 24: Comparision between the manufacturer and design FEM
Now moving forward with the analysis the load case is further analysed for the linear and the
nonlinear analysis. Now using the linear and the nonlinear analysis the boom deflections and the
stresses are seen to vary a little bit. The linear analysis shows a deflection of 360.6 while the
nonlinear analysis shows of 364.1. There has been slight variation of about 0.0935%. And this
variation is obvious as nonlinear analysis needs to account for the effects of the deflection on the
member due to bending moment. And the shear deformations causing moments and more
deflections. But the values are found under the limit and hence our results show fairly good
resemblance to the real case scenario.

54 Udit Sood
Master Thesis developed at University of Rostock, Germany
Similarly the boom section is then analysed for the actual scenario which is required for the
extraction of the stress history at the nodal coordinates. This analysis considers all the parameters
mentioned in the previous section of inclination and other effects. The results obtained from
these analyses showed a deflection of 390.3 mm. This data and the stress tensor history is
extracted for the further analysis. And needs to be tested for fatigue .
Figure 26: Non linear deflections of the
boom with inclination of ship.
The reaction forces obtained at the connection points for the wire ropes and the bottom of the
boom are imposed as the load cases for the housing section at the boom connection points there.
The reaction force obtained from the boom analysis at the connection nodes of the wires at the
Figure 25: Linear Vs Nonlinear analysis

Design Requirement and Load Assessment of Crane on Heavy Lift Ship 55
““EMSHIP” Erasmus Mundus Master Course, period of study September 2015 – February 2017”
housing (nodes 256 to 259) and the connection point of the boom at the housing bearing (Node 2
and 3) is as given below:
Node Support Forces [kN] Support Moments [kNm]
No. PX' PY' PZ' MX' MY' MZ'
2 -1549.93 447.83 4357.22 0.00 0.00 -171.31
3 -6276.65 -1552.00 17700.00 0.00 0.00 -66.31
256 2396.36 322.55 -3135.48 0.00 0.00 0.00
257 2360.40 268.48 -3092.94 0.00 0.00 0.00
258 1440.18 106.41 -2100.54 0.00 0.00 0.00
259 1629.64 329.17 -2358.42 0.00 0.00 0.00
Forces 0.00 -77.56 11369.80
Loads 0.00 -77.56 11369.80
Now we move on to the housing part. The following forces on being applied to the top wire
connection points and the bottom bearing pin connection the housing is seen to show certain
deflection. In this case it is also analysed using the linear, nonlinear and then the load case with
the inclination and all of the cases have shown different results as expected. The results of the
final analysis with inclination are as shown in the figure given below:
Figure 27: Deformation in the crane housing due to boom loads.
From the above load case figure it is seen that the housing reaction forces are not symmetrical
(represented by the green lines on the base). This is basically because the inclination and the
moment created due to the wind force. This results in different loads on the two legs of the boom
resting on the housing pin. It is seen that there is also a tendency for the housing to move
Table 11: Reaction forces from loadcase 1

56 Udit Sood
Master Thesis developed at University of Rostock, Germany
forward due to the horizontal force component acting due to the pull of the wires on the top of
the housing of the structure. These forces result in a resultant deflection at the top with a value of
24.2mm. The deflection is seen to be maximum at the top and it gradually reduces to zero at the
base. The housing is fixed on a freely rotating bearing at the base and the bearing is free to allow
the rotations about x, y and the z coordinates. These rotations are handled by the special swirl
bearing which supports the loads of the housing.
Now we need to observe the hot spots created in the structure due to these loads. These hot spots
are again seen in the stress history results in the finite element model. The stability of the model
is also seen using the RStab feature of the software which shows us the critical locations in terms
of the stress. The results are as given below:
Figure 28: Stress in the crane housing and hot spots.
The structure shows fairly good acceptance to the loads of the cargo and is seen to sustain the
adverse of the loading scenario. This is the maximum load case is seen to pass the test and the
stress results will be analysed in the coming sections of the fatigue test for the structure. It is seen
that this load case is seen to occur only a limited time in the life of the crane. And has a very
little contribution to the fatigue life.
The hot spots observed in this load case almost resemble the loaded sections in all the
subsequent load cases. The plating of concern having high stresses is seen at the locations of:
Boom section hot spots:
o The top plate section supporting the wire sheaves.

Design Requirement and Load Assessment of Crane on Heavy Lift Ship 57
““EMSHIP” Erasmus Mundus Master Course, period of study September 2015 – February 2017”
o The curved sections of the boom inner plating. Having connections of the boom arms.
o The lowermost plate having the connection of the boom to the bottom bearing
connection.
Housing hot spots:
o The top plate section supporting the wire loads.
o The forward most face plate.
o The forward plating having the operator window cut out.
o The back plate having window cut out is shown to have stress points along its top and
side edges.
o The bottom most plate supporting the housing loads.
o The plating supporting the bearing boom pin load.
The areas shown in green colour represent plate sections with hot spots:
Figure 29: Hot spot location of the crane structure
Load case 2:
Now we move on to the next load case which comprises of the cargo loads of 800 tons and the
boom angle of 54.04 degrees. This boom angle forces is observed and it is seen that the lateral
deflection of the boom is seen to be 286.8mm for the linear analysis, and 288.4 for the non-linear
results. These analyses are compared simultaneously in the figures given below. Similarly as in
the case one, the reaction forces at the connections are analyzed and are imposed as the loading
conditions on the housing to obtain the results. The final load case with the inclinations and the
required static and the dynamic loads have been provided below. This analysis shows slight
variation to the results without inclination due to the uneven distribution of the loads at the two
legs of the crane boom.

58 Udit Sood
Master Thesis developed at University of Rostock, Germany
The reaction forces obtained at the connection points are as shown in the table:
Figure 30: Linear Vs Nonlinear analysis for Boom
Figure 31: Analyses with inclination

Design Requirement and Load Assessment of Crane on Heavy Lift Ship 59
““EMSHIP” Erasmus Mundus Master Course, period of study September 2015 – February 2017”
Node Support Forces [kN] Support Moments [kNm]
No. PX' PY' PZ' MX' MY' MZ'
2 -2490.72 386.25 3541.57 0.00 0.00 -38.61
3 -9114.88 -1145.29 12980.60 0.00 0.00 -5.12
256 3130.82 200.46 -1893.75 0.00 0.00 0.00
257 3113.91 159.22 -1887.25 0.00 0.00 0.00
258 2607.12 54.98 -1625.32 0.00 0.00 0.00
259 2753.76 266.81 -1697.62 0.00 0.00 0.00
Forces 0.00 -77.56 9418.21
Loads 0.00 -77.56 9418.21
As in the previous case these forces are applied to the nodes connecting the boom to the housing
to obtain the deflection and the stressed, hot spots on the housing as shown in the figure given
below:
The hot spots and the stress history were further analysed and the data set obtained has been used
for the study of the fatigue on the members. The stress data set for the nodal history is attached
in the appendix for reference.
Load case 3:
Similarly as the above load case for the linear, nonlinear and the load case with the ship
inclination of 5.4 degrees the boom is analysed for this set of the load case. It is seen that the
lateral deflection for the boom linear case is: 305.6mm in the nonlinear load case is: 307mm and
for the boom with the inclination is found to be: 318.2mm. The three load cases are given below
for further review. It is seen after observing the reaction force that as the boom angle is inclined
so the forces acting in the x direction are greater than the resultant force in the z direction. This
load case is special in terms of the maximum outreach of the boom. From the above case it is
seen that this load case will create maximum deflection of the housing in the x direction.
Although the boom is loaded with just 500 tons of the load still this creates the limiting case for
the housing structure. The housing structure is seen to lift loads no more than 500 tons when the
boom is at 18.17 degrees. Considering this condition the capacity of the crane is restricted but it
is seen at this angle the boom arm outreach is 38 meters which gives us a radius span of the
boom of 38 meters in 360 degree. This span and the lifting capacity makes this crane special in
its type and among the cranes which have the combination of outreach and span to this extent.
Table 12: Reaction forces from loadcase 2

60 Udit Sood
Master Thesis developed at University of Rostock, Germany
The reaction force data set is given below for the further analysis. In this data set, it can be easily
seen that the x direction forces in this load case in enormous and due to the outreach of the boom
a great difference in the force distribution. This forms the basis of the load on the housing where
it will try to pull the housing in the X direction, creating maximum deflection of 34.6 mm in the
forward direction.
Figure 32: Linear vs Nonlinear analysis for loadcase 2
Figure 33: Analysis with inclination

Design Requirement and Load Assessment of Crane on Heavy Lift Ship 61
““EMSHIP” Erasmus Mundus Master Course, period of study September 2015 – February 2017”
Node Support Forces [kN] Support Moments [kNm]
No. PX' PY' PZ' MX' MY' MZ'
2 -2994.24 386.05 1122.08 0.00 0.00 445.33
3 -9810.32 -297.90 3565.48 0.00 0.00 313.15
256 3225.10 -20.81 376.55 0.00 0.00 0.00
257 3229.40 -47.28 374.54 0.00 0.00 0.00
258 3162.77 -124.15 525.29 0.00 0.00 0.00
259 3187.29 26.54 543.58 0.00 0.00 0.00
Forces 0.00 -77.56 6507.52
Loads 0.00 -77.56 6507.52
Since this load case forms a critical loading for the housing hence the results are compared with
the finite element data set provided by the manufacturer. It is seen that the linear case when
compared shows a deflection of 46.9 while the manufacturer finite element shows deflection of
61.3. This shows a variation of 19%. Although our deflection is found to be lower than the
manufacturer model it is seen that the behavior of the stress distribution and the nature of the
deflections are similar for both cases.
Table 13: Reaction forces from boom loadcase 3
Figure 34: Comparision of housing deflection between manufacturer FEM and
design FEM

62 Udit Sood
Master Thesis developed at University of Rostock, Germany
The above load cases were judged for the loads applied on the housing and the housing
deflection and the stress data set are as given in the figure below:
Figure 35: Deflections and stress analysis
From these results it is seen that the deflection for the housing is seen to be 34.6mm. The stress
in the housing is determined. It is seen that this results comply with the structural requirements.
This load case experiences a large number of operating cycles during its life and hence
contribute significant amount to the fatigue life of the component. The stress data sets are loaded
in the appendix and used in the MATLAB code for the analysis of the fatigue.
Load cases 4 to 8:
It is seen that the load cases from 4 to 8 are the repetition of the boom angles and the outreaches
from the first three load cases only the boom loading is varied in order to obtain intermediate
values of the loads. These load cases are not that severe as the first three load cases it is usually
lower loading of the crane boom. In order to explain all of those I have created a cumulative

Design Requirement and Load Assessment of Crane on Heavy Lift Ship 63
““EMSHIP” Erasmus Mundus Master Course, period of study September 2015 – February 2017”
study of all the load cases. It represents the linear and the nonlinear boom and the housing
deflections at all the load cases and then gives us the load case comparisons when the boom is at
an inclination of 5.4 degrees. The stress history of all these load cases is retrieved and are tested
for the fatigue analysis in the later sections. The cycles of the operations for the crane are
counted in the earlier sections are utilized for the fatigue calculations.
Load Case 4 Node Support Forces [kN] Support Moments [kNm]
No. PX' PY' PZ' MX' MY' MZ'
2 -
4052.42 177.40 5826.44 0.00 0.00 -26.74
3 -
3709.22 -252.94 5340.76 0.00 0.00 -1.76
256 2072.78 12.92 -1240.08 0.00 0.00 0.00
257 2075.02 -13.78 -1241.44 0.00 0.00 0.00
258 1812.01 -68.94 -1108.47 0.00 0.00 0.00
259 1801.84 67.78 -1102.17 0.00 0.00 0.00
Forces 0.00 -77.56 6475.04
Loads 0.00 -77.56 6475.04
Load case 5 Node Support Forces [kN] Support Moments [kNm]
No. PX' PY' PZ' MX' MY' MZ'
2 -886.98 215.25 2655.35 0.00 0.00 -87.97
3 -
3340.62 -847.32 9565.95 0.00 0.00 -35.67
256 1287.70 173.32 -1680.26 0.00 0.00 0.00
257 1268.61 144.30 -1657.71 0.00 0.00 0.00
258 786.05 58.08 -1142.06 0.00 0.00 0.00
259 885.25 178.81 -1276.69 0.00 0.00 0.00
Forces 0.00 -77.56 6464.58
Loads 0.00 -77.56 6464.58
Load Case 6 Node Support Forces [kN] Support Moments [kNm]
No. PX' PY' PZ' MX' MY' MZ'
2 -
2290.16 275.63 952.32 0.00 0.00 303.62
3 -
7223.96 -229.95 2714.30 0.00 0.00 212.83
256 2382.30 -15.37 282.18 0.00 0.00 0.00
257 2384.83 -34.92 280.62 0.00 0.00 0.00
258 2363.88 -92.79 396.37 0.00 0.00 0.00
259 2383.11 19.84 410.20 0.00 0.00 0.00
Forces 0.00 -77.56 5035.99
Loads 0.00 -77.56 5035.99

64 Udit Sood
Master Thesis developed at University of Rostock, Germany
Load Case 7 Node Support Forces [kN] Support Moments [kNm]
No. PX' PY' PZ' MX' MY' MZ'
2 -
1315.58 162.78 2052.99 0.00 0.00 -18.82
3 -
4388.62 -575.26 6420.24 0.00 0.00 -6.24
256 1520.52 97.36 -913.85 0.00 0.00 0.00
257 1511.88 77.31 -910.44 0.00 0.00 0.00
258 1300.94 27.43 -805.56 0.00 0.00 0.00
259 1370.86 132.82 -839.62 0.00 0.00 0.00
Forces 0.00 -77.56 5003.76
Loads 0.00 -77.56 5003.76
Load Case 8 Node Support Forces [kN] Support Moments [kNm]
No. PX' PY' PZ' MX' MY' MZ'
2 -
1820.78 202.01 839.15 0.00 0.00 209.15
3 -
5499.73 -184.65 2146.85 0.00 0.00 145.95
256 1820.43 -11.75 219.26 0.00 0.00 0.00
257 1821.79 -26.67 218.01 0.00 0.00 0.00
258 1831.29 -71.89 310.43 0.00 0.00 0.00
259 1847.00 15.38 321.27 0.00 0.00 0.00
Forces 0.00 -77.56 4054.97
Loads 0.00 -77.56 4054.97

““EMSHIP” Erasmus Mundus Master Course, period of study September 2015 – February 2017”
Study Load Case 5 Load Case 6 Load Case 7 Load Case 8
Max Stress 15.10KN/cm2 15KN/cm2 11KN/cm2 10KN/cm2
Load 500 tons 350 tons 350 tons 250 tons
Boom Angle 69.74 degree 18.17 degree 54.04 degree 18.17 degree
Stress history of Housing with inclination 5.4 degree

66 Udit Sood
Master Thesis developed at University of Rostock, Germany
12. HOT SPOT ANALYSIS:
The detection of the hot spots in the structure forms quite an important part in the structure
analysis. It is important to locate the areas of high stress concentration points so that it becomes
easier to locate the crack initialization in the structure. The plating’s with more stress are the
ones we will be more concerned with during the survey. So using the stress data set we had
obtained using our finite element model we go about locating the areas of high stress points in
the structure. As the structure is divided into the boom part and the housing part so we go about
the analysis in two steps.
Boom hot spots
The boom tip area as we know is supporting the cargo loads and as well as the pulling force of
the rope sheaves. It causes areas of stress concentration in the wire connection areas on the boom
tip. In order to deal with high stresses at boom tip a thicker plate is provides the loads from the
cargo are then spread on this plate which are then transmitted to rest of the boom structure
through the boom arms and the wire ropes.
Figure 36: The concerned plates for the hot spots

Design Requirement and Load Assessment of Crane on Heavy Lift Ship 67
““EMSHIP” Erasmus Mundus Master Course, period of study September 2015 – February 2017”
The force transmits from the boom arm to the boom pin bearing. The deflection caused on the
boom tip reduces the final forces as it is transmitted to the rest of the boom areas. The
characteristics of the model are seen to be the same.
The loads obtained at the boom pin and the wires, then apply to the housing section of the model.
It is seen that few places represent areas of hot spots in our finite element model. These places of
concern are.
The forward section of the boom tip plate.
The inside curved edges of the boom section.
The front plate of the boom which reaches up to the boom pin.
The side plates connecting the boom to the boom pin.
The detailed hot spots of the structure are represented in the figure 38 of this section.
Crane housing hot spots
The housing of the crane section is also seen to possess areas of large stresses on the plate
sections. These plates showing the maximum stresses are highlighted below in the figure for easy
location. This includes the forward plate. The areas around the window cut outs and the back
wall of the crane housing, which carries the wire loads and transfers it to the housing foundation
structure. The following areas which were discussed above can be seen in the figures given
below as missing sections of the plating’s.
Figure 37: Plate thicknesses and hotspot shown by missing plates

68 Udit Sood
Master Thesis developed at University of Rostock, Germany
Figure 38: The hot spot analysis on the whole crane structure plating
The stress data set obtained after the analysis of the structural parts of the crane are provided in
the appendix. It is seen that the stress values of the structural components need to be analysed
and certain corrections need to be made on its parameters in order to enable us to do the
calculations for the fatigue on these parts. The corrections and the modifications on the values of
the stress which need to be made on the values are explained in the sections given below.
The static analysis of the stresses needs to be converted to the cyclic stress history in order to
calculate for the fatigue. It is seen that the crane loading cycle consists of lifting of the cargo,
swinging the cargo on board and then releasing it. In such a scenario, it is seen that the stress
cycle experienced by the crane has one time when the crane is loaded with the cargo load and
then it needs to be released of the load. Hence it is seen that the stress curve is a half cycle,
which only consist of the downward loads and no force acts against the gravitational force. It is
also seen that the boom element has its self-weight and it needs to be always acting downwards.
This self-weight and the wind force acting on the crane results in the increase of the mean stress
on the structural components of the crane. This increase in the mean stress further reduces the
fatigue life of the structural components. In order to calculate the mean stress acting on the
structural components we need to use special rules and the formulae which are given in the
coming section.

Design Requirement and Load Assessment of Crane on Heavy Lift Ship 69
““EMSHIP” Erasmus Mundus Master Course, period of study September 2015 – February 2017”
13. RAINFLOW COUNTING METHOD FOR THE FATIGUE
The rain flow counting method earlier called Pagoda roof method. It was introduced by
Mitsubishi and Endo (1968). This forms the method for cycle counting for the fatigue analysis.
But in my case as the stress cycle history for the crane is obtained from the load cell so I had not
used the method. But this method will prove useful for further analysis for the next researcher for
the sea going condition fatigue analysis of the structure hence I will explain it in brief. Ref: [29]
This gives the time series analysis of the peak and the valleys as shown in the figure below. This
is a recognized method for counting the half cycles for the fatigue calculation for the member
subjected to cyclic loading. The method is explained in brief as to how to go about the approach:
The stress curve is assumed to be a combination of hills and valleys as peaks and troughs.
We start from the valleys and allow the raindrop to fall from the roof. And the pattern of the
calculation represents the flow of the falling water.
There are certain rules we need to follow in order to get the correct results:
1. The lines connecting the peaks and the valleys form a series of pagodas rules.
2. Each rain flow begins at the start of the time series and end at the end of every peak or
valley.
3. Rainflow initiated at the peak drops down until it reaches a peak more positive value (or
a valley more negative value) compared to the peak where it started.
4. Rainflow stops when it reaches the rain flow from above.
5. Rainflow terminates at the end of the time series.
6. Horizontal length of the each rain flow is counted as a half cycle of that stress range.
7. Where half cycle represents one valley and one peak. An example of the above case is
shown using a simplified figure which will very well explain the method.
Figure 39: Stress curve for crane loading on crane structure

70 Udit Sood
Master Thesis developed at University of Rostock, Germany
Figure 40: Example of cyclic stress curve to be analysed using Rainflow
counting mechanism
This figure represents the time vs shear stress (sigma). The shear stress is in the form of peaks
and the valleys. The main motive of the rainflow counting mechanism is to collect all the stress
cycles having the same values. This is done using the rules discussed before and the method is so
special it has been accepted by the ASTM society. And it forms an acceptable method to count
the number of cycles of the stress for the fatigue calculations.
In order to explain the method more precisely I would go into is details. The stress vs time cycle
seen above is inverted by 90 degrees so that the curve looks as shown in the figure given above.
Then it is assumed that the rainflows from the starting edge of the stress curve and it drops down
when it reaches the sharp edge. This one length of the stress represents a half cycle. These half
cycles are then collected and summed in a tabular format which contains three variables. 1st
column forms the path which the rain has followed. 2nd column is the cycle count which shows
how much distance has been covered and the third column is the stress value.
Path Cycles σ
A-B B-C C-D D-E E-F F-G G-H H-I
Now moving further, we see that the stress has to be converted to stress range, which is the
required parameter in the y axis of the S-N curve. The stresses which we had obtained in the
Table 14: Counting cycle and stress range

Design Requirement and Load Assessment of Crane on Heavy Lift Ship 71
““EMSHIP” Erasmus Mundus Master Course, period of study September 2015 – February 2017”
previous case has to be summed together to see how many cycles of the particular stress value do
we have for a given time history. This is done as shown in the figure below. It is seen that all half
cycles combine to form complete cycles. This is done using the special Matlab code which sums
up the cycles and tells us the number of cycles. This is one of the critical steps of the fatigue
counting method and is very important to count the cycles correctly. In our case the stress history
is limited to the loading and offloading conditions of the crane and hence the number is finite
and can be easily dealt with. But when we are considering the wave loads over 1 or 1.8 years,
then in such cases the stress history contains many stress cycles and it is really complex to count
the cycles manually. In this case we need a MATLAB program which filters the signal and
converts them into the number of cycles and the stress range which will be then processed for the
fatigue calculations.
Σ RANGE CYCLES PATH
8 7 6 5 4 3 2 1
Based fatigue damage estimates, we have made a comparison of the different methods of the
counting methods and the damage calculated by them.
(11)
Where:
=Range Counting.
=Rainflow Counting (Proposed by ASTM)
=Level Crossing Counting
=Peak counting
=Narrow band approximation.
As the Rainflow counting method is more reliable and is accepted by most of the society as the
method for the cycle counting for the stress cycles so we go with this method leaving the others.
But in my case as the cycle of the crane are less and can be counted by the simple excel sheets
for each load case so although the code was formed has not been put to use for the cycle
counting of the crane load cases. But for the calculation of the cycles of the stresses created due
to the wave effects on the crane when it is stored in the rested position this cycle counting
method can be used and forms a vital tool in the analysis for next stage of the thesis.
Table 15: Number of of cycles with same mean stress

72 Udit Sood
Master Thesis developed at University of Rostock, Germany
14. EFFECT OF MEAN STRESS CORRECTION ON THE
FATIGUE LIFE
The fatigue life of a component is influenced by two parameters that are the mean stress and the
number of the cycle the member is subjected to (alternating stress). The SN curves mainly deal
with the alternating stress (Stress Range) while it neglects the effect of the mean stress effect on
the structure. So it is seen that the alternating stresses are seen to have these effects. The tensile
loading of the structure tends to widen the crack and the compressive stresses tend to close it.
Hence among the two cases, alternating stress value needs to be determined as it forms a vital
part, in order to calculate the correct fatigue life of the component the mean stress also plays a
vital role and need to be incorporated in the calculations. The two types of the stresses can be
explained by the diagram given below: Ref: [08]
(N/
(N/
(12)
Table 16: Number of cycle counted using load cell
Design Requirement and Load Assessment of Crane on Heavy Lift Ship 73
““EMSHIP” Erasmus Mundus Master Course, period of study September 2015 – February 2017”
It is seen that the factors such as the rise in temperature, wind loads, self-weight and the loads
such as the hook load always creates a rise in the mean stress on the crane structure. This rise in
mean stress results in lowering of the fatigue life of the components.
The mean stress corrections are not easy to find and hence were not considered for the SN curve
method for the fatigue analysis. Hence, I have used some of the approaches proposed by the
researchers and made a comparative study regarding it in order to select the best method suitable
for the crane loaded structure.
In cycles which are completely non-reversing (as in my case) then the mean stress calculated
value is not zero. In such a case we need a correction mechanism to calculate these mean stresses
as they are having a significant effect on the characteristics of the fatigue life of the component.
The machine components which usually experience cyclic loading due to high revolutions of the
fluctuating loads usually experience a fatigue is meant the stress ratio characterised by R=0 to
R=-0.5, while in the components experiencing the complete reversal of the stresses experience
the mean stress ratio of R=1 to R=-1.Where R defined as the stress ratio between maximum and
minimum stress occurring during the cycle. In these calculations, the yield strength of the
material at room temperature is normally used, as the temperature has effects on the mean stress
value .
Now we will look into the various stress correction methods which are selected and can be useful
for calculation of the accurate mean stress for the crane model. The selection of these models are
widely on the type of the loading and the boom angle condition of the crane and also partly on
the cycle of the loading chosen for the analysis. This comparative study is performed in order to
calculate the best-suited method which does not overestimate our results and nether
underestimates the number of cycles for the lifetime of the member. The rise in mean stress
results in lowering of the fatigue life of the components.[Ref: Metal Fatigue In Engineering,
John Wiley, 2001 and Goodman J (1930) Mechanics applied to Engineering, Volume 1 ]. Ref:
[30]
The description of the various methods for the mean stress correction are presented below:
1. Gerber mean stress correction method.
2. Goodman mean stress correction method.
3. Soderberg mean stress correction method.
4. Marrow mean stress correction method.
5. Walker mean stress correction method.
6. SWT mean stress correction method.

74 Udit Sood
Master Thesis developed at University of Rostock, Germany
a. Gerber mean stress correction method:
This is the most widely used stress correction methods. This method is represented by the
formulae given below.[Ref: Fatigue and Fracture of Engineering Structures, A.Ince and
G.Glinka, Backwell Publishing Ltd] [31]
+ =1 (13)
Where:
=Stress amplitude.
=Value of stress equivalent to fully reversed stress.
=Mean stress.
=Material ultimate strength.
Gerber formula represents an equation of a parabola with respect to the model boundary line. In
order to calibrate the model a factor called as is used. Where is the regression
coefficient found by experiment and is explained in the lower tables below it transforms the
formulae to the given equation:
1-( (14)
Using this number of cycle of fatigue can be calculated this can be done by the given formulae:
(15)
Where:
=Number of cycles to failure as calculated after correction.
=Number of cycles to failure.
=Stress amplitude.
=Value of stress equivalent to fully reversed stress.
k=Slope of the fatigue curve
But following this formula has certain drawbacks:
The Gerber formula does not distinguish between the compression and the tension stresses.
It is usually seen that the compression stresses increase the fatigue life while the tensile forces
reduces it, but in this formula this characteristic is not accounted.
In order to solve this problem a new model was designed which is called the
b. Goodman’s model
The Goodman model has rectified the flaws that were found in the Gerber model and is more
advanced and shows better results than the Gerber model. [Ref:15]

Design Requirement and Load Assessment of Crane on Heavy Lift Ship 75
““EMSHIP” Erasmus Mundus Master Course, period of study September 2015 – February 2017”
+( =1 (16)
Where the parameters used are the same as the Gerber model except the correction of the square.
The parameters given in the above formulae are:
=Stress amplitude.
=Value of stress equivalent to fully reversed stress.
=Mean stress.
=Material ultimate strength.
The advantages of this model are that model makes use of the material constants determined on
the basis of the monotonic tensile test. So this model is easy to transform into the different
material model as the constant value is easy to determine.
The model bears some of the drawbacks too, which makes the model to go for certain corrections
to rectify the results. The few drawbacks of the model are:
1. As the model uses the tensile test results for the determination of the high cycle fatigue so
it determines the static properties of the material. Hence, using this model is not able to
determine the fatigue behaviour of the material in the right way as it is more accurately
determined by the dynamic characteristics of the material properties rather than the static ones.
2. The factors such as the cycle hardening or softening of the material are not considered in
the calculations.
3. This signifies that the material means stress is calculated without incorporating any of the
factors which determine the mean stress sensitivity of the material.
In order to meet with the given drawbacks of the two models we move on to more refined and
precise methods. This is
c. Smith, Watson and the Topper method
This is a very popular method which was designed in USA in 1970.[REF:14]This method is
basically used in the strain based fatigue analysis by combining the strain equation proposed by
Manson multiplied by Basque equation. The equation is defined by the following formulae:
(17)
(18)
Where:
=Maximum stress of the cycle ( )
R =Stress Ratio
Stress amplitude

76 Udit Sood
Master Thesis developed at University of Rostock, Germany
(19)
This method proves to be conservative in the low cycle fatigue region. It is seen that the SWT
mean stress correction gives a good result for both steel and the aluminium materials. It is seen
that Marrow and SWT methods are most popular but the SWT is more accurate when compared
to Marrow.
The SWT even after providing many positive results possesses some of the drawbacks which I
would like to point upon.
1. In the SWT method parameter provides a rather non conservative result when it is used
for the calculation of the compressive mean stresses. Therefore for the boom section the major
stresses being compressive due to the suspended loads this method for stress correction is not
used.
2. The SWT method does not fall good when dealing with the von misses stress data.[REF:
International Journal of Engineering and Tech IJENS Vol 14] Therefore as I have used the
results for the stresses using the Von Misses stresses from the finite element software hence I
cannot use SWT method in order to avoid uncertainty of the results.
d. Comparison of the mean stress correction
In this part of the study a comparative study of the mean stress is made using the different
models discussed and the S-N curve data.[REF:13]. The problem is much more clearly explained
in the coming section which shows a clear distinction of the fatigue cycles calculated:
1. Gerber stress correction.
2. Goodman mean stress correction.
3. Smith, Watson and Tupper stress correction.
4. S-N curve data provided using the experimentation of the material.
It is seen that the different models following different approaches differ in the calculated fatigue
life. But it is seen that the different models are suitable for different loading conditions and the
different class of the material. In order to find the best suitable for our application we need to
carry out a MATLAB experimental analysis. For the steel material used by us in the crane boom
and the housing it is seen that the Marrow model is too conservative while the SWT method
cannot be used because we need a summary of the Von Misses stress for the final analysis.
Therefore considering these situation we select the Gerber rule.
From the literature it can be seen that the certain methods are suitable for certain analysis an
example of the few of the examples are:
SWT method of mean stress correction: Basically used for the aluminium and steel and
seen to give a fairly good results. Drawback of this method is that it fails to work with the von
misses stress data. But is fairly good with the other type of stress analysis.

Design Requirement and Load Assessment of Crane on Heavy Lift Ship 77
““EMSHIP” Erasmus Mundus Master Course, period of study September 2015 – February 2017”
Millers rule for the mean stress correction: This gives a coarse result of the stress life. It
is an old method and certain methods to correct the drawback have been found out regarding this
method.
Walker method of mean stress correction: This method simplifies the proposed method of
SWT. It has introduced a coefficient (ϒ) which changes according to the material properties of
the material and hence makes the formulae more material specific.
The significance of the rise in temperature on the mean stress effect. It is seen that few of the
components such as the sheaves and the wire ropes on the crane will experience a rise of
temperature during operation and the hoisting and lowering operations. This rise in temperature
results in the reduction of the fatigue life of the component. Such a phenomena can be calculated
using the research of the regression coefficients which has been provided by the researchers
[REF: 9] ‘J. Warren and D. Y. Wei, “A microscopic stored energy approach to generalize fatigue
life stress ratios,” International Journal of Fatigue, vol. 32, no. 11’. The result of the analysis for
the temperature rise of 260 degrees has been calculated for the stress ratio of 0.05 at 260 degree
for the various mean stress correction methods specified above:
The Regression coefficient values for various stress ratios have been obtained from the research
paper as per [REF: 9]. These values are for the material type S-355 steel with properties as of the
crane.
Figure 41: Reference from experimental paper Ref: [33]
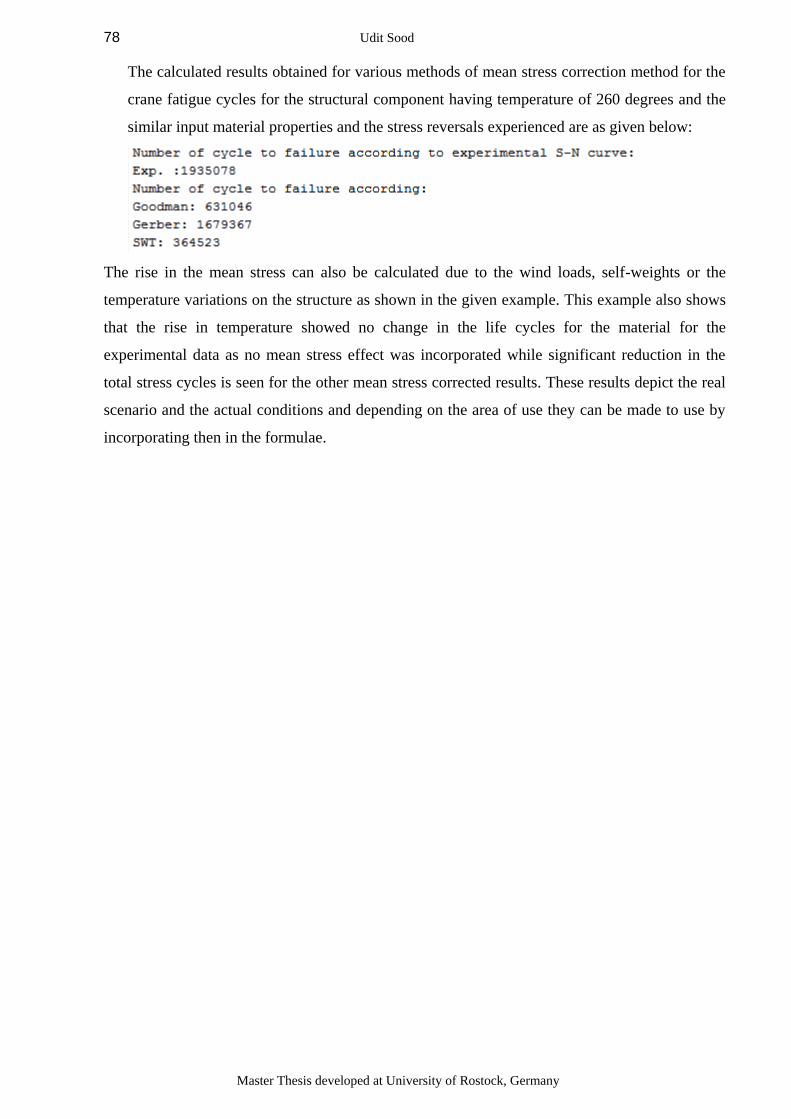
78 Udit Sood
Master Thesis developed at University of Rostock, Germany
The calculated results obtained for various methods of mean stress correction method for the
crane fatigue cycles for the structural component having temperature of 260 degrees and the
similar input material properties and the stress reversals experienced are as given below:
The rise in the mean stress can also be calculated due to the wind loads, self-weights or the
temperature variations on the structure as shown in the given example. This example also shows
that the rise in temperature showed no change in the life cycles for the material for the
experimental data as no mean stress effect was incorporated while significant reduction in the
total stress cycles is seen for the other mean stress corrected results. These results depict the real
scenario and the actual conditions and depending on the area of use they can be made to use by
incorporating then in the formulae.

Design Requirement and Load Assessment of Crane on Heavy Lift Ship 79
““EMSHIP” Erasmus Mundus Master Course, period of study September 2015 – February 2017”
15. FATIGUE ANALYSIS OF THE CRANE STRUCTURE
The fatigue strength of the structural components of the crane is basically determined by
[REF: 13]:
The material of the structural components of the crane.
The shape, surface conditions, state of corrosion, size (scale factor) and other factors
constituting stress concentration.
The ratio R between the minimum and the maximum stress which occur between the
various cyclic loads add is used in order to determine the mean stress.
The stress spectrum considered.
The number of the stress cycles the component is subjected to.
In order to begin with the fatigue calculation, the static stresses obtained from the finite element
model need to be converted into cyclic stresses. In such a case the R factor comes into
consideration. For the alternating stresses, R is considered to be {-1} for a fully reversing cycle.
The stress obtained from the finite element model analysis of the structure. The curve
representing the stress range for the crane loading discharging condition is shown in figure 42
given below. It is seen that the stress is maximum when the crane load is on the boom tip then as
the crane starts to discharge the loads the curve comes towards the maximum stress value and
finally ends at 0 value. The X axis shows the time and boom span taken for one loading
discharging condition on the crane. And the count of such stress time curve forms the number of
stress cycles the crane is subjected for 1 or 1.8 years of the time span. This cycle data is obtained
from the load cell values which has recorded data for 1.8 years and is then extrapolated to 20
years of the life of the crane.
In the rule requirements provided by’ DNVGL 2015 page 4-19 Ref: [17] ‘it has been stated if the
number of the stress cycles experienced by the crane structural components are below 20000 the
fatigue calculations may be omitted. (DN 015 EN Ref: [08] rule state if loading is below 8000
fatigue checking is not required.)
It is seen that the approach followed for the calculation of the fatigue depends on the method of
obtaining the stress of the component and the data which needs to be processed. Depending on
Figure 42: Cycles as experienced during crane loadings

80 Udit Sood
Master Thesis developed at University of Rostock, Germany
the stress tensors or the hot spot stress or the notch stress values taken for the calculation
determines the method chosen. Now I will be discussing the two most popular and commonly
used approaches for the calculation and would find out the best suited among them for our
analysis and the calculations.
a. Damage criteria approach.
The nominal stress approach is the simplest approach which is followed. It is a far-field approach
in which the stress acting due to the force, moments or a combination of the load is analysed to
find out the possible site for the crack initialization. As these approaches require all the structural
areas of the crane to be analysed so it is desirable to create a finite element of the structure. The
locations of the hot spots are found and the curve to represent the similar details for the fatigue is
plotted.
The hot spot stress is the stress acting at the toe of the weld. It is a point where the stress
concentration is the highest. These possess the points of the hot spots where the crack
initialization may take place. It basically comprises the membrane and the bending stress
component. Such an analysis predicts the strength of all the welds of that type, but it requires a
more detailed finite element stress approach to deal with it.
Although this method has a drawback that it requires a lot of data and the calculations to plot an
accurate viable distribution. The possibility of the shortage of the data which is a common
feature and the drawback. In my case, I have chosen this method to predict the life of the
specimen and the crane components because the operating life of the crane which I am analysing
on the ship has only undergone 1.8 years of its lifetime with the crane operation. And for the
operator, it is essential to keep a track with the crane that it will survive the lifetime of the ship.
And also to predict the lifting capacity after years of operation the operator needs to know which
is the areas of concern which need to be stiffened or additional metal work needs to be carried
out on it.
Few of the data points followed for this type of approach is:
• Calculation of fatigue damage is made till initialization of crack
• This method is valid for machinery having fewer operations during its lifetime.
• The rules state that in order to implement this approach there needs to be a continuous
stress monitoring device placed on the crane and in our case we have load cell on boom
tip for counting stress cycles and stress loadings on the structure.
• This approach is used where the consequences of the accident may be quite severe if it
takes place.
So seeing all these points we judge out that this approach is best suited for our case.

Design Requirement and Load Assessment of Crane on Heavy Lift Ship 81
““EMSHIP” Erasmus Mundus Master Course, period of study September 2015 – February 2017”
b. Safe life Approach
The second method of the fatigue analysis is by to determine constant stress level and different
constant stress range for the model. It rather calculates the remaining life of the component
rather than the damage during the life approach and is not suitable for our analysis.
16. DAMAGE CRITERIA APPROACH
The Miner’s Rule cumulative damage it states that the failure of a component occurs when the
number of the operation cycles approaches the total fatigue cycles of the component. It can be
represented in a simple equation stating: Ref: [10]
(20)
Where:
D=Damage of the concerned node.
nb=Total number of load cases.
ni=Counted cycle using the rain flow analysis.
Ni=Total cycles for failure after the correction factors.
This method is found to be useful under the following conditions:
Calculation of fatigue till initialization of crack
Valid for machines having fewer operations during its lifetime
Need to have continuous stress monitoring device.(Load cell on boom tip)
For machines whose, consequences during failure may be catastrophic.
This approach can be further subdivided to find out the damage:
1. Plate sections.
2. Weld sections
a. Plate analysis:
In order to determine the fatigue failure on the plate sections the following conditions need to be
kept in mind:
Carried out to check failure of plate sections of the structure
Notch case of 120 to 160 used for the analysis.
I would like to explain the detailed approach used for the plate analysis for fatigue:

82 Udit Sood
Master Thesis developed at University of Rostock, Germany
In order to calculate the fatigue for the plate of the structure. The structural component
comprising of the boom and the housing are divided into different plate sections depending on
the thicknesses of the plates used for its constructions. Each of these plates is further divided into
coarse grids in the finite element software. These grids are 0.5 meters to 1 meter square in size.
Then using the finite element software the stresses are found for each of these grids. Now we
have generated a database for the stresses at various grids and the coordinate in x,y and z
defining the location of the grid centres in the finite element model. This is basically done so that
the grid points having maximum stress can be located in the real model.
Now we move on to the next stage of the analysis. Here we are basically concerned with the
calculation of the fatigue. In order to calculate the fatigue we need three parameters:
The stress at the point of calculation.
The notch case of that section.
The number of cycles the element section has already gone through during its present
life.
The first two cases are basically required to calculate the maximum number of the cycle the
material can withstand before facing fatigue crack. While the third case has been already
calculated by us using the stress counting method.
The stress at the grid point was obtained from the finite element software as discussed in the first
paragraph.
Regarding the notch case, a special approach has been followed. In this approach, I have located
the junctions where the plate sections change and it is obvious that these changed plate sections
will be having weld connections between them. So all these changing plate sections are located
and a notch case lower than the plate section that is 80 to 112 (compared to 120 for the plate) is
used. Now in the first step, a notch case of 80 is used. This notch case is then checked for the
accordance with three basic equations which need to be fulfilled for the calculation. These
equations are:
(21)
(22)
(23)
Where:
x =λxΔσ
λ=damage ratio
=Endurance stress range
=Stress Range

Design Requirement and Load Assessment of Crane on Heavy Lift Ship 83
““EMSHIP” Erasmus Mundus Master Course, period of study September 2015 – February 2017”
Consequences of failure
=Torque range
ΔσC =The fatigue strength for 2x10^6 cycles are represented on the curve given below
ΔτR=The fatigue strength of the shear stress is given by the curve below.
If the validity of any of this equation is not fulfilled then a notch case of 112 instead of 90 is
tried. And even if then the equation is not meeting the requirements of the right side coefficients
to be less than one then the final and the best weld case of 120 is used. This is done using the
condition statements of the MATLAB code.
Once the notch case has been decided then using the equation given below a maximum number
of cycles that particular section can withstand is calculated. The formulae used for the above
calculation is as given below:
(24)
Example: (25)
Where:
=Maximum cycle for damage of component (Using SN curve for S355 material)
=Endurance stress range from finite element grid stress for that location.
=Stress Range using the specific notch case selected for that location.
Consequences of failure (1.15 in our case)
Now using these calculated values I can calculate the damage at that particular location of the
section. The formulae used for the calculation will be the Millers rule:
(26)
Where:
D=Damage of the concerned node.
nb=Total number of load cases.
ni=Counted cycles.
Ni=Total cycles for failure after the correction factors.
This calculation is done for all the load cases and the cumulative damage is calculated which will
give the final damage at that particular location of the structure.
Using this approach an output file containing the history of all plate grid point locations with
their index and the coordinates are created and the respective cumulative damage which they will

84 Udit Sood
Master Thesis developed at University of Rostock, Germany
experience in 25 years of the lifetime of the component. This data is seen and we now know the
notch case at all these grid points, their stress history and the cumulative damage. This forms the
final result and can be used for the prediction of the fatigue life of the various plate sections
forming the crane housing and the boom structure.
The output file for the nodal damage results looks like this:
Grid No. X Coordinate Y Coordinate Z Coordinate Damage
19 14.8547 -2.3735 -37.1244 0.1061
20 15.3547 -2.3735 -37.1244 0.0837
23 14.3547 -2.3735 -37.6244 0.2021
24 14.8547 -2.3735 -37.6244 0.1995
9 7.7474 1.8561 -19.5786 0.1069
10 8.2474 1.8523 -19.5786 0.0612
11 8.7474 1.8485 -19.5786 0.1909
16 7.7473 1.8458 -20.0785 0.1214
17 8.2473 1.842 -20.0785 0.0472
18 8.7473 1.8382 -20.0785 0.1859
23 7.7473 1.8356 -20.5784 0.1297
24 8.2472 1.8318 -20.5784 0.0467
25 8.7472 1.828 -20.5784 0.0351
26 9.2472 1.8242 -20.5784 0.1017
31 8.2472 1.8215 -21.0783 0.0505
32 8.7472 1.8177 -21.0783 0.0644
33 9.2471 1.8139 -21.0783 0.0373
b. Weld analysis:
This approach is used for the analysis of the weld for the failure by fatigue. In this case the
following steps are to be followed.
Carried out to check failure of welds.
SN curve type of 80 to 120 used for the analysis of the fatigue in this case.
Figure 43: Weld stress

Design Requirement and Load Assessment of Crane on Heavy Lift Ship 85
““EMSHIP” Erasmus Mundus Master Course, period of study September 2015 – February 2017”
Analysed by special RFAT module defining the boom section as a linear isotropic
element for the analysis.
This is a more elaborate approach where the boom section is assumed to be composed of
a combination of 40 member elements of different cross sections. These cross sections are then
defined for the notch cases at 16 locations. The areas of the welds are given the notch case lower
than that of the normal plating. Using this approach the entire section of the boom is analysed
and finally, a graphical and history of the damage at each defined section is obtained. This is
then plotted in form of a graphical solution which can be read easily.
Using the damage characteristic as given in the European EN 1993-1-9 rules calculate the fatigue
damage of the structure of crane.
The fatigue damage is basically based on the structural characteristics such as the cross section,
weld properties, material properties, and the structure supporting and the weight. While the
second parameter governing the fatigue behaviour is the stress applied to the structure.
The internal forces are analysed by the structural analyses of the member and its cross sections.
The welds are to be considered as the points which are most susceptible to the fatigue failure.
These points may be welds, corners, sharp edges and positions where there is already a crack.
The fatigue design basically compares the nominal stress range Δσ and Δτ with the design values
of ΔσR and ΔτR stress ranges. The method for the calculation is explained in more details in the
coming section.
c. Design equations and the calculation of the parameters:
The damage equivalent stress ranges ΔσR and ΔτR relates to 2x10^6 stress cycles and these are to
be checked with the applied stress and the torque ranges According to the stress ranges for the
nominal and the shear stresses have limitations which are given by the given equations:
(27)
(28)
Where:
Δσ=Stress range (As was shown to calculate using rain flow method)
=Yield stress of the material (355 N/mm^2).
Δτ=Torque range.
These values are checked and analysed for each node.

86 Udit Sood
Master Thesis developed at University of Rostock, Germany
d. The design equation for the fatigue:
The stresses on the action side are determined by the serviceability level. For the partial safety
factor ϒMf =1. 0 applies. These assessment methods were analysed in the previous sections to
account for the various parts of the crane and its influence on the damage to that part on the
working of the crane and its components.
Assessment method Consequence of failure
Low High
Damage tolerant 1.00 1.15
Safe life 1.15 1.35
The design for the fatigue follows the following equations. This covers the basic equation which
is again tested for the validity of the stress range calculated for each nodal point.
(29)
(30)
Where:
x =λxΔσ
λ=damage ratio
=Endurance stress range
=Stress Range
Consequences of failure
=Torque range
Simultaneous effect of the normal and the shear force effects are to be compared
(31)
ΔσC =The fatigue strength for 2x10^6 cycles are represented on the curve given below
ΔτR=The fatigue strength of the shear stress is given by the curve below.
Table 17: Safety factors used for different approaches for fatigue calculation

Design Requirement and Load Assessment of Crane on Heavy Lift Ship 87
““EMSHIP” Erasmus Mundus Master Course, period of study September 2015 – February 2017”
(32)
This is carried out for each nodal stress obtained from the finite element analysis. It gives us the
number of cycles the component can sustain before failure. Ref: [10]
1. Then we obtain the damage equivalent factor λ from the general formulae:
(33)
Figure 44: Stress Strain curve .[REF:Eurocode EC 3-1-9]

88 Udit Sood
Master Thesis developed at University of Rostock, Germany
• Boom divided into 40
member elements.
• Each member notches
defined at 16 locations.
• Mean stress calculated by
finite element method.
• All 8 load cases combined
to calculate damage
Weld Fatigue determination approach
33

Design Requirement and Load Assessment of Crane on Heavy Lift Ship 89
““EMSHIP” Erasmus Mundus Master Course, period of study September 2015 – February 2017”
Maximum damage given by manufacturer
Damage difference=0.71-0.663=0.047
Maximum damage calculated on welds :
=~ 0.71Out of 1.00
Locating Maximum Fatigue Damage
35

90 Udit Sood
Master Thesis developed at University of Rostock, Germany
17. CONCLUSION
From the above thesis, we can derive important findings . Among them some of the major
findings are:
It is seen from the experimental calculations that the load case with maximum boom outreach
(38mts) is the limiting load case for crane operation. This is said because it is seen from the
experimental data that even though the boom is loaded with 500 tonnes of load even then:
Housing deflections are maximum (46.9mm)
Horizontal forces on bearing are maximum (as observed from the finite element resultant
force)
The maximum fatigue damage is found to occur on the boom tip after 25 years of lifetime. This
can be observed by viewing the weld history results of the boom section generated by the RFAT
finite element software.
Structure welds are more prone to fatigue failure compared to the plating
The housing bottom plating and the foundation shape is critical for analysis and hot spot point of
view. This can be seen that in all the load cases the bottom plating of the crane housing has stress
concentration points. This can be reduced by changing the form of the housing bottom section.
By creating a rounded section instead of the sharp edges as is seen in the crane housing.
The window areas on housing need to be minimised to give more structural strength. It is seen
that the front and the back housing walls are the major load bearing parts and the cut outs in it
for the windows tend to create hot spots at the corners and the edges of the structure.
The last and the final observation is that when we compare the classification rules for the lifting
appliances among the Lloyd’s Register and the DNVGL it is seen that even though they have
different design factor values. But in the end, it sums out to be almost the same for both the
rules.
Some of the places marked as the hot spots and the platings more prone to the fatigue failure are
the ones which need to be checked thoroughly for the crack initialization and the weaknesses.
These places need to be marked and more frequent inspection and intense surveys to be carried
out. It is seen that the cranes present on the heavy lift vessels are very less prone to the fatigue
failure at the plate sections while the fatigue life at the welds are more. This is basically as the
welds have a lower notch case. So the welds are supposed to fail before then the plate section.
Design Requirement and Load Assessment of Crane on Heavy Lift Ship 91
““EMSHIP” Erasmus Mundus Master Course, period of study September 2015 – February 2017”
18. REFERENCES
/1/ NMF Crane Manuel, Operations and Maintainance
/2/ Standards For Offshore and Platform Lifting Appliances DNVGL 0378, Section 10, Page
100, Edition May 2016
/3/ DNV-GL RU 0050 Cranes on Crane Vessels
/4/ Code for Lifting Appliances in a Marine Environment, Lloyds Register (Jan 2016),
Chapter 4 page 80, “Cranes and submersible Lifting Appliances”.
/5/ Code for Lifting Appliances in a Marine Environment, Lloyds Register (Jan 2016),
Chapter 4, Section 2.3.4
/6/ “Federation European De La Manutention”, Booklet 4, ‘Checking For Fatigue and Choice
of Mechanism Components’.
/7/ Rules for the Classification of Inland Navigation Vessels PART B – Hull Design and
Construction
/8/ Eurocode 3.DIN 15 018-1 Krane, “Rules for the design of hoisting Appliances”.
/9/ Eurocode 3 DIN 15 001-1 Krane
/10/ Eurocode 3.1.9 DIN 4132, Fatigue Assessment.
/11/ Technical Standards Committee Guidelines for Maritime Lifting and Lowering 0027/ND
/12/ Journal of Construction Steel Research
/13/ Reliability Based Design Guidelines of Fatigue Of Ship Structure
/14/ A microscopic stored energy approach to generalize fatigue life stress
ratios,” International Journal of Fatigue, vol. 32, no. 11.
/15/ Standards For Shipboard Lifting Appliances DNVGL ST 0377
/16/ Guidelines for Marine Lifting & Lowering Operations DNVGL ST-N001
/17/ Guidelines for Fatigue Design of Offshore Steel Structures 2010 DNV-RP 203
/18/ Standards For Offshore and Platform Lifting Appliances DNVGL-ST- 0378, Section 10,
Page 84, Edition May 2016
/19/ Germanischer Lloyd, Loading Gear on Seagoing Ships and Offshore Installations, Edition
July 2015]
/20/ Journal of Construction Steel Research, ESEVIER ‘A comparison of fatigue between S-
355 and S-690 grade steels
/21/ Fatigue and Fracture of Engineering Materials and Structure ‘Modification of Marrow
and Smith Watson Topper Mean Stress Correction Models’
/22/ Mean Stress Correction Effects On Fatigue Life Behaviour of Steel Alloys, By Quasim
Bader, Emad Kadum.International Journal of Engineering and Technology Vol-14,No 04.
/23/ Kranbahanen Besmessung und konstruktive Gestaltung, Seesselberg
/24/ International Journal of Fatigue, vol. 32, no. 11
/25/ Manual RFEM Finite element Manual on RFAT
/26/ Standard for Certification of Lifting Appliances, Oct 2011. Ch-2, Sec.6
/27/ Guidelines for the Design of Crane Supporting Steel Structure

92 Udit Sood
Master Thesis developed at University of Rostock, Germany
/28/ Manual RFEM Software.
/29/ Website: http://nptel.ac.in
/30/ Metal Fatigue In Engineering, John Wiley, 2001 and Goodman J (1930) Mechanics
applied to Engineering, Volume 1
/31/ Fatigue and Fracture of Engineering Structures, A.Ince and G.Glinka, Backwell
Publishing Ltd
/32/ International Journal of Engineering and Tech IJENS Vol 14
/33/ International Journal of Fatigue, vol. 32, no. 11

Design Requirement and Load Assessment of Crane on Heavy Lift Ship 93
““EMSHIP” Erasmus Mundus Master Course, period of study September 2015 – February 2017”
APPENDIX A
Boom Hot Spot Locations
Input Data:
Material Properties: S-355
Material Model: Linear Elastic
S.No Load Case No Loading Repeats Stress Type Hot spot Location Maximum Stress [MPa] Fatigue Failure(Y/N)
1 Loadcase 1 20800 Von Mises 2099/725/2099/1142 -186 N
2 Loadcase 2 20800 Von Mises 2141/735/2108/1154 -145 N
3 Loadcase 3 20800 Von Mises 2180/1348/721/1180 -143 N
4 Loadcase 4 31200 Von Mises 2141/699/2108 -114.9 N
5 Loadcase 5 10400 Von Mises 2099/725/659 108.2 N
6 Loadcase 6 31200 Von Mises 2180/721/254/1180 -113 N
7 Loadcase 7 31200 Von Mises 2141/699/2108 -86 N
8 Loadcase 8 31200 Von Mises 2180/721/254/1180 -92.5 N Housing Hot Spot Locations
S.No Load Case No Loading Repeats Stress Type Hot spot Location Maximum Stress [MPa] Fatigue Failure(Y/N)
1 Loadcase 1 20800 Von Mises 10656 /12438 /18473 -210 N
2 Loadcase 2 20800 Von Mises 10658 /158 / 16760 -190 N
3 Loadcase 3 20800 Von Mises 190 / 10658 /12438 -163 N
4 Loadcase 4 31200 Von Mises 190 /222/ 10656 -155 N
5 Loadcase 5 10400 Von Mises 190 / 21543 /10657 108.2 N
6 Loadcase 6 31200 Von Mises 158 / 16760 / 222 -113 N
7 Loadcase 7 31200 Von Mises 10657 / 222 -86 N
8 Loadcase 8 31200 Von Mises 12438/ 190 -92.5 N
It can be seen that the hot spot location depends on the boom angle and the magnitude depends on the loading weight.

94 Udit Sood
Master Thesis developed at University of Rostock, Germany
APPENDIX B
Summary Of the Design Coefficients used for the Crane Structure
S.No Lloyd's values DNV-GL Values
Regulation Followed Code for lifting appliances in Standard for shipboard
marine environment (edition Jan 2016) lifting appliances DNVGL-ST-0377
(I) Shipboard Cranes
1 Vertical dynamic factor (Minimum)
Ref: Code for Lifting Appliances (Ref DNVGL-ST-0377 Sec 5.4.4)
Fh.min = 1,1 (for jib crane) Hoist load=1.15
Fh.min = 1,15 (for jib type grab cranes)
Basic Allowable stress/yield stress
2 Without wind force Load case 1=0.67 (Ref Ch 4, Sec 2.17) 0.67
3 With wind force Load case 2=0.75 (Ref Ch 4, Sec 2.17) 0.75
4 Duty Factor Deck jib crane=1.05 (Ref Ch 4, Sec 2.3) None
5 Heel/Trim in degree. 5 degree heel 2 degree trim (Ref Ch 1, Sec 2.3) 5 degree heel 2 degree trim (Ref Table 4-1)
Overall Design Factor
6 Without wind force 0.86 (Ref Summation of all factors) 0.86
7 With Wind force 0.77 (Ref Summation of all factors) 0.77
8 Shock load To consider To consider
9 Fatigue analysis Operating life 6x10^5 cycles Load cycles 6x10^5
(Ref Ch 4, Sec 2.3.2 & 2.3.4 ) (Ref Table 5-7 cranetype C1)
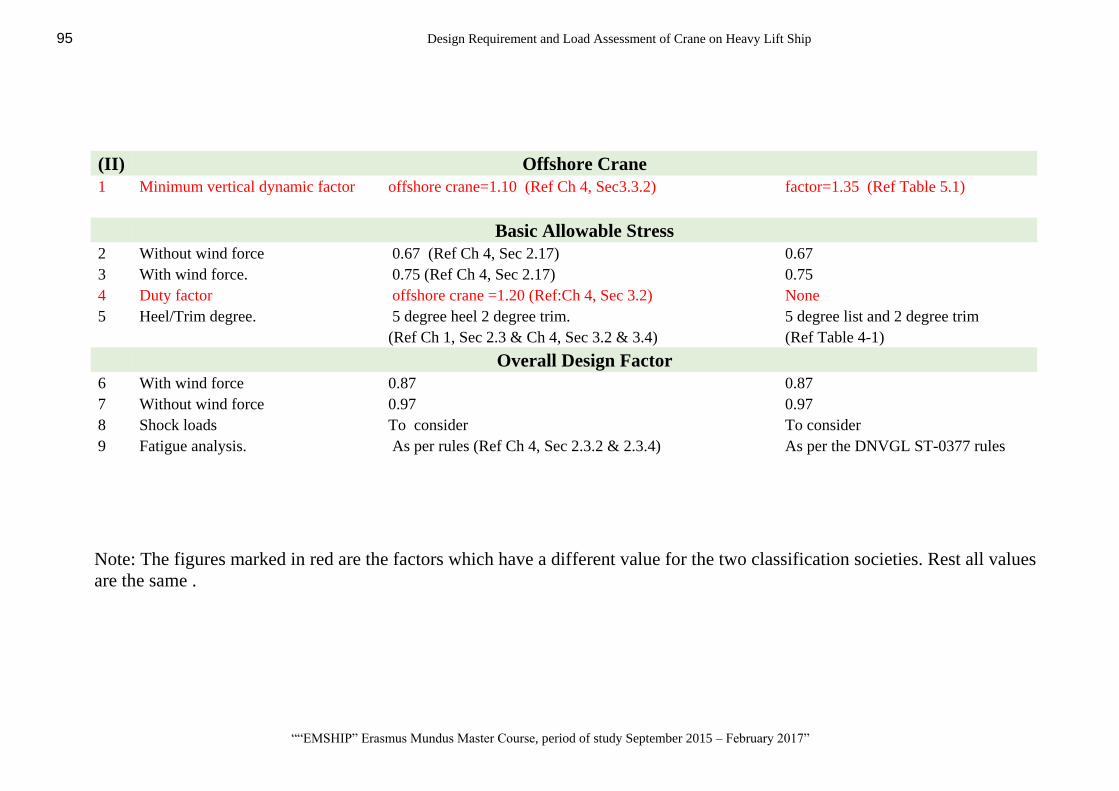
95 Design Requirement and Load Assessment of Crane on Heavy Lift Ship
““EMSHIP” Erasmus Mundus Master Course, period of study September 2015 – February 2017”
(II) Offshore Crane
1 Minimum vertical dynamic factor offshore crane=1.10 (Ref Ch 4, Sec3.3.2) factor=1.35 (Ref Table 5.1)
Basic Allowable Stress
2 Without wind force 0.67 (Ref Ch 4, Sec 2.17) 0.67
3 With wind force. 0.75 (Ref Ch 4, Sec 2.17) 0.75
4 Duty factor offshore crane =1.20 (Ref:Ch 4, Sec 3.2) None
5 Heel/Trim degree. 5 degree heel 2 degree trim. 5 degree list and 2 degree trim
(Ref Ch 1, Sec 2.3 & Ch 4, Sec 3.2 & 3.4) (Ref Table 4-1)
Overall Design Factor
6 With wind force 0.87 0.87
7 Without wind force 0.97 0.97
8 Shock loads To consider To consider
9 Fatigue analysis. As per rules (Ref Ch 4, Sec 2.3.2 & 2.3.4) As per the DNVGL ST-0377 rules
Note: The figures marked in red are the factors which have a different value for the two classification societies. Rest all values
are the same .

96 Udit Sood
Master Thesis developed at University of Rostock, Germany
APPENDIX C
Boom output forces and Reaction forces imposed on housing
Load case1 Load Case 2 Load Case 3 Load Case 4 Load Case 5 Load Case 6 Load Case 7 Load Case 8
Sum of loads in X 0.00 kN 0.00 kN 0.00 kN 0.00 kN 0.00 kN 0.00 kN 0.00 kN 0.00 kN
Sum of support forces in X 0.00 kN 0.00 kN 0.00 kN 0.00 kN 0.00 kN 0.00 kN 0.00 kN 0.00 kN
Sum of loads in Y -77.56 kN -77.56 kN -77.56 kN -77.56 kN -77.56 kN -77.56 kN -77.56 kN -77.56 kN
Sum of support forces in Y -77.56 kN -77.56 kN -77.56 kN -77.56 kN -77.56 kN -77.56 kN -77.56 kN -77.56 kN
Sum of loads in Z 11369.80 kN 9418.21 kN 6507.52 kN 6475.04 kN 6464.58 kN 5035.99 kN 5003.76 kN 4054.97 kN
Sum of support forces in Z 11369.80 kN 9418.21 kN 6507.52 kN 6475.04 kN 6464.58 kN 5035.99 kN 5003.76 kN 4054.97 kN
Resultant of reactions about X 16194.100 kNm 11289.600 kNm 2836.090 kNm -10.229 kNm 8109.210 kNm 2003.160 kNm 4957.320 kNm 1447.880 kNm
Resultant of reactions about Y -5.66E+04 kNm -8.18E+04 kNm -8.68E+04 kNm -5.19E+04 kNm -2.83E+04 kNm -6.07E+04 kNm -3.58E+04 kNm -4.34E+04 kNm
Resultant of reactions about Z -11.258 kNm -19.413 kNm -33.998 kNm -25.948 kNm -11.365 kNm -34.059 kNm -19.531 kNm -34.087 kNm
Maximum displacement in X-direction 344.5 mm 234.7 mm 95.0 mm 150.3 mm 185.0 mm 69.5 mm 113.4 mm 52.5 mm
Maximum displacement in Y-direction 106.9 mm 81.4 mm 33.0 mm -5.2 mm 55.2 mm 23.6 mm 37.4 mm 17.3 mm
Maximum displacement in Z-direction 159.9 mm 198.2 mm 306.1 mm 119.9 mm 85.5 mm 225.6 mm 95.5 mm 172.0 mm
Maximum vectorial displacement 390.3 mm 312.0 mm 318.2 mm 189.3 mm 209.0 mm 234.6 mm 150.7 mm 178.9 mm
Maximum rotation about X-axis 8.5 mrad 9.0 mrad 7.9 mrad -2.8 mrad 4.5 mrad 6.0 mrad 4.4 mrad 4.9 mrad
Maximum rotation about Y-axis -13.9 mrad -10.7 mrad -10.1 mrad -6.8 mrad -7.8 mrad -8.1 mrad -5.8 mrad -6.8 mrad
Maximum rotation about Z-axis -13.9 mrad -9.2 mrad -3.3 mrad -3.7 mrad -7.4 mrad -2.5 mrad -4.6 mrad -2.1 mrad
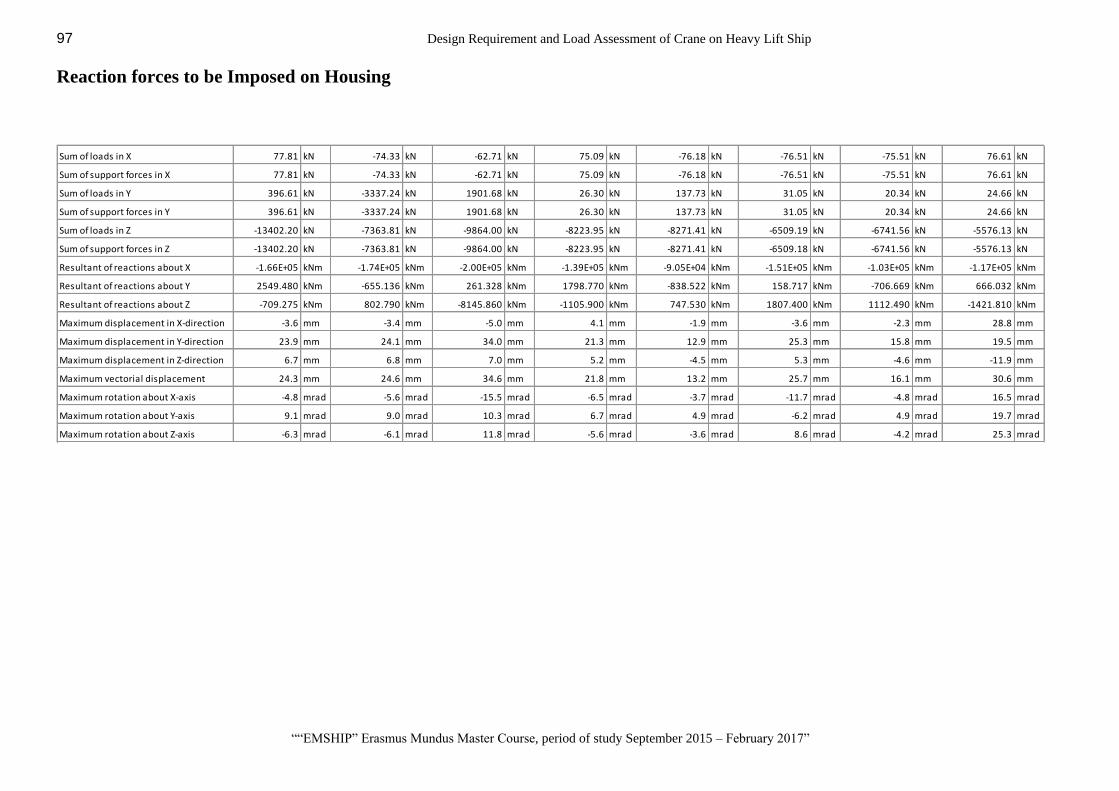
97 Design Requirement and Load Assessment of Crane on Heavy Lift Ship
““EMSHIP” Erasmus Mundus Master Course, period of study September 2015 – February 2017”
Reaction forces to be Imposed on Housing
Sum of loads in X 77.81 kN -74.33 kN -62.71 kN 75.09 kN -76.18 kN -76.51 kN -75.51 kN 76.61 kN
Sum of support forces in X 77.81 kN -74.33 kN -62.71 kN 75.09 kN -76.18 kN -76.51 kN -75.51 kN 76.61 kN
Sum of loads in Y 396.61 kN -3337.24 kN 1901.68 kN 26.30 kN 137.73 kN 31.05 kN 20.34 kN 24.66 kN
Sum of support forces in Y 396.61 kN -3337.24 kN 1901.68 kN 26.30 kN 137.73 kN 31.05 kN 20.34 kN 24.66 kN
Sum of loads in Z -13402.20 kN -7363.81 kN -9864.00 kN -8223.95 kN -8271.41 kN -6509.19 kN -6741.56 kN -5576.13 kN
Sum of support forces in Z -13402.20 kN -7363.81 kN -9864.00 kN -8223.95 kN -8271.41 kN -6509.18 kN -6741.56 kN -5576.13 kN
Resultant of reactions about X -1.66E+05 kNm -1.74E+05 kNm -2.00E+05 kNm -1.39E+05 kNm -9.05E+04 kNm -1.51E+05 kNm -1.03E+05 kNm -1.17E+05 kNm
Resultant of reactions about Y 2549.480 kNm -655.136 kNm 261.328 kNm 1798.770 kNm -838.522 kNm 158.717 kNm -706.669 kNm 666.032 kNm
Resultant of reactions about Z -709.275 kNm 802.790 kNm -8145.860 kNm -1105.900 kNm 747.530 kNm 1807.400 kNm 1112.490 kNm -1421.810 kNm
Maximum displacement in X-direction -3.6 mm -3.4 mm -5.0 mm 4.1 mm -1.9 mm -3.6 mm -2.3 mm 28.8 mm
Maximum displacement in Y-direction 23.9 mm 24.1 mm 34.0 mm 21.3 mm 12.9 mm 25.3 mm 15.8 mm 19.5 mm
Maximum displacement in Z-direction 6.7 mm 6.8 mm 7.0 mm 5.2 mm -4.5 mm 5.3 mm -4.6 mm -11.9 mm
Maximum vectorial displacement 24.3 mm 24.6 mm 34.6 mm 21.8 mm 13.2 mm 25.7 mm 16.1 mm 30.6 mm
Maximum rotation about X-axis -4.8 mrad -5.6 mrad -15.5 mrad -6.5 mrad -3.7 mrad -11.7 mrad -4.8 mrad 16.5 mrad
Maximum rotation about Y-axis 9.1 mrad 9.0 mrad 10.3 mrad 6.7 mrad 4.9 mrad -6.2 mrad 4.9 mrad 19.7 mrad
Maximum rotation about Z-axis -6.3 mrad -6.1 mrad 11.8 mrad -5.6 mrad -3.6 mrad 8.6 mrad -4.2 mrad 25.3 mrad

98 Udit Sood
Master Thesis developed at University of Rostock, Germany
APPENDIX D (FATIGUE CALCULATION)
Block 1. (Similar calculation done for 8 load cases to find cumulative
S.No Cordinates (mm) Thickness(mm) Optimized f (m) f® f(w) f (i) f (t) Δσ R Δσ© f (s) Δσ© n
y z t(mm) No(+)/Yes(-)Material Mean stress Weld Shape Structure failureThickness (N/mm^2) (N/mm^2) Misalignmentfatigue calulation
1 516.2 -802.7 30 + 1 1 1 0.9 0.96948075 100 87.2532671 1.0003126 87.2805423 1040
2 516.2 -827.7 27.5 + 1 1 1 0.9 0.98392783 100 88.5535045 1.0003126 88.5811861 1040
3 486.2 -827.7 25 + 1 1 1 0.9 1 100 90 1.0003126 90.0281338 1040
4 0 -827.7 25 + 1 1 1 0.9 1 100 90 1.0003126 90.0281338 1040
5 -486.2 -827.7 25 + 1 1 1 0.9 1 100 90 1.0003126 90.0281338 1040
6 -516.2 -827.7 27.5 + 1 1 1 0.9 0.98392783 100 88.5535045 1.0003126 88.5811861 1040
7 -516.2 -802.7 30 + 1 1 1 0.9 0.96948075 100 87.2532671 1.0003126 87.2805423 1040
8 -516.2 0 30 + 1 1 1 0.9 0.96948075 100 87.2532671 1.0003126 87.2805423 1040
9 -516.2 747.4 30 + 1 1 1 0.9 0.96948075 100 87.2532671 1.0003126 87.2805423 1040
10 -516.2 777.4 30 + 1 1 1 0.9 0.96948075 100 87.2532671 1.0003126 87.2805423 1040
11 -486.2 777.4 30 + 1 1 1 0.9 0.96948075 100 87.2532671 1.0003126 87.2805423 1040
12 0 777.4 30 + 1 1 1 0.9 0.96948075 100 87.2532671 1.0003126 87.2805423 1040
13 486.2 777.4 30 + 1 1 1 0.9 0.96948075 100 87.2532671 1.0003126 87.2805423 1040
14 516.2 777.4 30 + 1 1 1 0.9 0.96948075 100 87.2532671 1.0003126 87.2805423 1040
15 516.2 747.4 30 + 1 1 1 0.9 0.96948075 100 87.2532671 1.0003126 87.2805423 1040
16 516.2 0 30 + 1 1 1 0.9 0.96948075 100 87.2532671 1.0003126 87.2805423 1040
Calculating the factors for the plate correction factors.
c= 0.15 Compressive stress Δσ s,max 160 applied peak stress
f (w) 1 Non grinded Δσ s 159 bending portion
1.15 Disc grinded K' 0.95
1.4 Rounded Best K (m) 1 Stress increase factor due to misalignment.
f (i) 0.9 Without notches
0.95 With notches and rounded
r= 100 mm With notch (f i<1)
n 0.17 welded t>25mm
0.1 toe ground
Δσ R 100 Butt weld A1 to A6

99 Design Requirement and Load Assessment of Crane on Heavy Lift Ship
““EMSHIP” Erasmus Mundus Master Course, period of study September 2015 – February 2017”
S.No Cordinates (mm) Thickness(mm) Optimized Max Cycles Δσ ch max Δσ m n € ϒ (mf)
y z t(mm) No(+)/Yes(-)
1 547.6 -803.7 30 + 2000000 87.2805423 181.677455 3 437178.491 1.15
2 547.6 -828.7 27.5 + 2000000 88.5811861 184.384789 3 457015.524 1.15
3 517.6 -828.7 25 + 2000000 90.0281338 187.396661 3 479778.986 1.15
4 0 -828.7 25 + 2000000 90.0281338 187.396661 3 479778.986 1.15
5 -517.6 -828.7 25 + 2000000 90.0281338 187.396661 3 479778.986 1.15
6 -547.6 -828.7 27.5 + 2000000 88.5811861 184.384789 3 457015.524 1.15
7 -547.6 -803.7 30 + 2000000 87.2805423 181.677455 3 437178.491 1.15
8 -547.6 0 30 + 2000000 87.2805423 181.677455 3 437178.491 1.15
9 -547.6 746.4 30 + 2000000 87.2805423 181.677455 3 437178.491 1.15
10 -547.6 776.4 30 + 2000000 87.2805423 181.677455 3 437178.491 1.15
11 -517.6 776.4 30 + 2000000 87.2805423 181.677455 3 437178.491 1.15
12 0 776.4 30 + 2000000 87.2805423 181.677455 3 437178.491 1.15
13 517.6 776.4 30 + 2000000 87.2805423 181.677455 3 437178.491 1.15
14 547.6 776.4 30 + 2000000 87.2805423 181.677455 3 437178.491 1.15
15 547.6 746.4 30 + 2000000 87.2805423 181.677455 3 437178.491 1.15
16 547.6 0 30 + 2000000 87.2805423 181.677455 3 437178.491 1.15
Symbols Meaning
Δσ ch Corrected Mean Stress
max Δσ Maximum Mean Stress
ϒ (mf) Partial Safety Factor (Eurocode 3)
f® Mean stress correction factor
f(w) Weld Shape correction factor
f (i) Structure failure correction
f (t) Thickness correction factor
Δσ R Stress range Weld property from SN curve
Δσ© Corrected stress range
f (s) Misalignment correction factor


D-D ( 1 : 100 )
B-B ( 1 : 100 )
BB
DD
EE
7600R355
0R3211
55526649
1986 2186 1985 1183
1920
1227
1991
138
20621991
1227
2151
1124
2192
491610431603
822
1131
1765
4621
5058
5154
4381
670
1446
1446
4696
1646 1665
3399
2620
700
660
4197
1677
901
6115009
721
14541533
1351
744
1044520
50531028
1534
1832
5265
1472
3446
7953
8400
5811
386
4
4931
6385
5880
4809
4697
7100
620
2356
660 737
1728
749
1800
4520
1080
8936
4377
4819
4673
1410 1410
984 1139
820
1740
1584
267
34245229
7720
7721
5740
6155
6274
2289
2260
6232
2200
5938
815
4096
4575
59587100
5428
6434
21151371
4564
4538
4894
604
8
5296
3554
6763
3345
4852
1590
1913
1577
1901
5669
4983
4096
12184
1876
2989
593
632
2576
1477165
9
929
50
32
291418
18091684
3787
252119512
34
3399
618
49305666
4332
4945
712
190311
77
1439
3835
3876
6079
4223
1948
5540
5217
1686
3333
64410
07
745
897
1054
1109
13821902
3770
2111
3720
3802
4654
1957
5395
7448
4233
8602
3072
1189
1001
2530
31713391
6377
1705
7946
6331
4633
6222
5896
74537098
6240
5118
5532
4645
A-A ( 1 : 100 ) 1069
1248
3839
3439
3133
74537098
23092
309
15108
28
4645 6216
6235
6269
6353
8171
2675
1495
1380
1690
11361
G
GF
F
7176
4554
5003
5989
5437
1880
1201
2979
1338
5695
5184
2514
6343
6111
4664
7098
2315
680
3875
6656
3895954814
550
730
1899
5754
2622
2242
2289
905
842
730718
372
3173
1675
1541
1085 730
622
730
732
1751
18492
G-G ( 1 : 100 )F-F ( 1 : 100 )
A
A
APPENDIX D