ASSESSMENT OF INTRINSIC BIOREMEDIATION OF … · ASSESSMENT OF INTRINSIC BIOREMEDIATION OF JET FUEL...
36
ASSESSMENT OF INTRINSIC BIOREMEDIATION OF JET FUEL CONTAMINATION IN A SHALLOW AQUIFER, BEAUFORT, SOUTH CAROLINA By Francis H. Chapelle, James E. Landmeyer, and Paul M. Bradley U.S. GEOLOGICAL SURVEY Water-Resources Investigations Report 95-4262 Prepared in cooperation with the SOUTHERN DIVISION, NAVAL FACILITIES ENGINEERING COMMAND Columbia, South Carolina 1996
Transcript of ASSESSMENT OF INTRINSIC BIOREMEDIATION OF … · ASSESSMENT OF INTRINSIC BIOREMEDIATION OF JET FUEL...

ASSESSMENT OF INTRINSIC BIOREMEDIATION OF JET FUEL CONTAMINATION IN A SHALLOW AQUIFER, BEAUFORT, SOUTH CAROLINA
By Francis H. Chapelle, James E. Landmeyer, and Paul M. Bradley
U.S. GEOLOGICAL SURVEY Water-Resources Investigations Report 95-4262
Prepared in cooperation with the
SOUTHERN DIVISION, NAVAL FACILITIES ENGINEERING COMMAND
Columbia, South Carolina 1996

U.S. DEPARTMENT OF THE INTERIOR
BRUCE BABBITT, Secretary
U.S. GEOLOGICAL SURVEY
Gordon P. Eaton, Director
For additional information write to:
District Chief U.S. Geological Survey Stephenson Center- Suite 129 720 Gracern Road Columbia, SC 29210-7651
Copies of this report can be purchased from:
U.S. Geological Survey Earth Science Information Center Open-File Reports Section Box 25286, Mail Stop 517 Denver Federal Center Denver, CO 80225

CONTENTS
Page
Abstract..................................................................... 1
Introduction.................................................................. 1
Purpose and scope....................................................... 2
Description of study area ................................................. 2
Framework for assessing intrinsic bioremediation.............................. 2
Field and laboratory data-collection methods........................................ 5
Quantification of hydrologic, geochemical, and microbial parameters .................... 7
Hydrologic and hydrogeologic framework.................................... 8
Ground-water chemistry.................................................. 8
Microbial degradation................................................... 13
Adsorption coefficient................................................... 13
Assessment of intrinsic bioremediation ........................................... 13
Approach to solute-transport simulation..................................... 18
Solute-transport simulations of hydrocarbon migration......................... 19
Conclusions................................................................. 29
References.................................................................. 30

ILLUSTRATIONS
Page
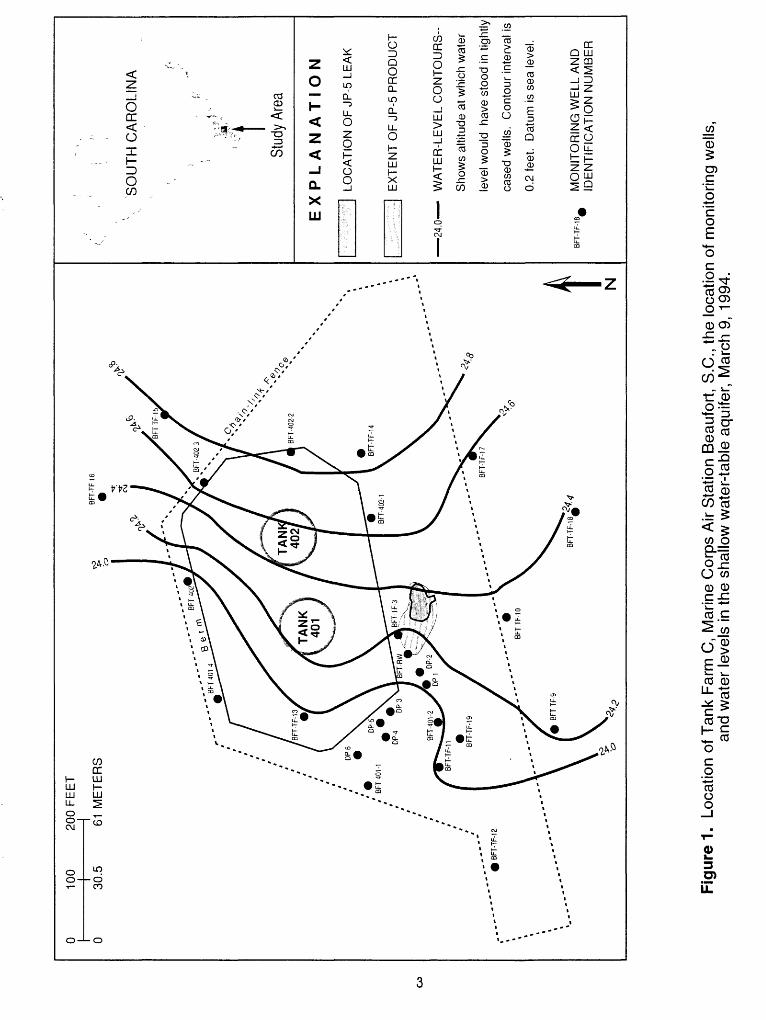
Figure 1. Map showing the location of Tank Farm C, Marine Corps Air Station Beaufort, S.C., the location of monitoring wells, and water levels in the shallow water-table aquifer, March 9, 1994..............3
2. Schematic showing lithologic description of sediments corednear wells BFT-401-4 andBFT-TF-12. ................................4
3. Schematic showing a framework for assessing the efficiency ofintrinsic bioremediation ............................................6
4-6. Graphs showing:4. The mineralization of 14C-toluene to 14CO2 under aerobic and
anaerobic conditions in sediments from Tank Farm C .................14
5. The mineralization of 14C-naphthalene to 14CO2 under aerobic andanaerobic conditions in sediments from Tank Farm C ................. 15
6. Adsorption isotherms for benzene and toluene on Tank Farm C sediments .. .16
7. Map showing the location and orientation of the modeled area ............20
8-13. Graphs showing:8. Simulated solute transport of toluene at Tank Farm C for conservative
solute transport and reactive solute transport, given the parameters of the Standard Model..........................................21
9. Simulated 1994 distribution of toluene at Tank Farm C for minimumand maximum values of hydraulic conductivity ......................23
10. Simulated 1994 distribution of toluene at Tank Farm C for minimumand maximum values of the microbial degradation rate constant.........24
11. Simulated concentration changes of toluene over a 30-year period forminimum and maximum values of the adsorption coefficient............25
12. Simulated 1994 distribution of toluene at Tank Farm C formaximum and minimum solute-transport parameters ..................26
13. Simulated changes in toluene concentrations at Tank Farm C followingremoval of the free-product source in 1995..........................28
iv

TABLES
Page
Table 1. Concentrations of benzene, toluene, ethylbenzene, total xylenes, and naphthalene in ground water from monitoring wells at Tank Farm C, Marine Corps Air Station Beaufort, South Carolina, March 9, 1994.....................................................9
2. Field-measured water-chemistry parameters of ground waterfrom monitoring wells at Tank Farm C, Marine Corps Air StationBeaufort, South Carolina, March 9, 1994. ............................. .10
3. Concentrations of anions and gases in ground water frommonitoring wells at Tank Farm C, Marine Corps Air StationBeaufort, South Carolina, March 9, 1994.............................. .11
4. Concentrations of cations in ground water from monitoring wells at Tank Farm C, Marine Corps Air Station Beaufort, South Carolina, March 9, 1994...................................... .12

CONVERSION FACTORS, VERTICAL DATUM, AND ABBREVIATIONS
Multiply By To obtain
Length
foot (ft) 0.3048 meterfoot per foot (ft/ft) 0.3048 meter per metersquare foot (ft2) 6.09294 square meter
Flow
foot per day (ft/d) 0.3048 meter per dayfoot per year (ft/yr) 0.3048 meter per yearsquare foot per day (f^/d) 0.09290 square meter per day
Volume
gallon (gal) 3.785 liter ounce 28.35 gram
Temperature: In this report, temperature is given in degrees Celsius (°C), which can be converted to degrees Fahrenheit (°F) by the following equation:
°F = (1.8x°C) + 32
Sea Level. In this report, "sea level" refers to the National Geodetic Vertical Datum of 1929 a geodetic datum derived from a general adjustment of the first-order level nets of the United States and Canada, formerly called Sea Level Datum of 1929.
Chemical concentration: In this report, chemical concentration in water is expressed in metric units as milligrams per liter (mg/L) or micrograms per liter (i^ig/L).
Radiochemical activity: In this report, radioactivity units are given in rnicrocuries (|nCi)
Biodegradation rate constant: In this report, first-order kinetics are used to model biodegradation rates of petroleum hydrocarbons. First-order rate constants (K^) are expressed in units of percent of compound degraded per day (%/d). Because percent is dimensionless, this reduces to units of inverse days (d~^.
Adsorption coefficient: In this report, the adsorption coefficient (K^) is expressed as centimeters cubed per gram (crrrVg), which are equivalent to units of liters per kilogram (L/kg).
VI

ASSESSMENT OF INTRINSIC BIOREMEDIATION OF JET FUELCONTAMINATION IN A SHALLOW AQUIFER,
BEAUFORT, SOUTH CAROLINA
By Francis H. Chapelle, James E. Landmeyer, and Paul M. Bradley
ABSTRACT
Field and laboratory studies show that microorganisms indigenous to the ground-water system underlying Tank Farm C, Marine Corps Air Station Beaufort, S.C., degrade petroleum hydrocarbons under aerobic and anaerobic conditions. Under aerobic conditions, sediments from the shallow aquifer underlying the site mineralized radiolabeled ( 14C) toluene to 14CO2 with first-order rate constants of about -0.29 per day. Sediments incubated under anaerobic conditions mineralized radiolabeled toluene more slowly, with first-order rate constants of-0.001 per day. Although anaerobic rates of biodegradation are low, they are significant in the hydrologic and geochemical context of the site. Because of low hydraulic conductivities (1.9-9.1 feet per day) and low hydraulic gradients (about 0.004 feet per feet), ground water flows slowly (approximately 20 feet per year) at this site. Furthermore, aquifer sediments contain organic-rich peat that has a high sorptive capacity. Under these conditions, hydrocarbon contaminants have moved no further than 10 feet downgradient of the jet fuel free product. Digital solute- transport simulations, using the range of model parameters measured at the site, show that dissolved contaminants will be completely degraded before they are discharged from the aquifer into adjacent surface-water bodies. These results show that natural attenuation processes are containing the migration of soluble hydrocarbons, and that intrinsic bioremediation is a potentially effective remedial strategy at this site.
INTRODUCTION
In June 1990, a leak occurred from a corroded section of pipe during a jet fuel (JP-5) transfer operation at Tank Farm C, Marine Corps Air Station (MCAS) Beaufort, South Carolina. The leaking pipe was about 3 ft below land surface, and the loss of fuel totaled approximately 10,600 gal. The leak was reported to the South Carolina Department of Health and Environmental Control (SCDHEC), and a site assessment was completed (U.S. Navy Department, 1993). This assessment showed the presence of JP-5 as free product at the point of the original spill, the presence of dissolved hydrocarbons in ground water, and that site remediation would be needed to remove the contaminants.

The U.S. Geological Survey, in cooperation with the Southern Division Naval Facilities Engineering Command, U.S. Navy, and MCAS Beaufort quantified hydrologic, geochemical, and microbial parameters in sediments from the Tank Farm C site to facilitate simulation of intrinsic bioremediation. The objective of the study was to establish a framework for assessing the efficiency of intrinsic bioremediation at the site.
Purpose and Scope
The purpose of this report is to present an evaluation of the feasibility of intrinsic bioremediation to remove soluble hydrocarbons from contaminated ground water, and to assess the degree that contaminants are isolated from points of contact with human or wildlife populations at Tank Farm C. This evaluation included field studies documenting the present location and distribution of soluble benzene, toluene, ethylbenzene, and xylene (BTEX) and the polynuclear aromatic hydrocarbon (PAH) compound naphthalene. Also, hydrologic conditions in the shallow water-table aquifer underlying the site were assessed and discharge areas where contaminants could come into contact with human or wildlife populations were identified. Experimental studies designed to assess biodegradation rates and the adsorption characteristics of hydrocarbons in sediments cored from the site were conducted in the laboratory. Finally, a solute- transport analysis designed to estimate rates of contaminant transport, determine the likely maximum extent of the plume, and quantitatively assess the possibility of contaminant transport to potential points of contact with humans was conducted.
Description of Study Area
Tank Farm C is located at the MCAS Beaufort (fig. 1) and covers an area of about 500,000 ft2 . The site is underlain by alluvial sediments of Pleistocene age. The lithology of these sediments (fig. 2) consists predominantly of woody organic debris (BFT-401-4) in a matrix of fine sand that was deposited in a swampy environment of deposition. Overlying the organic-rich sediments is a layer of medium-grained sand (BFT-TF-12) that was spread over the site as fill material during construction of the tank farm.
Framework for Assessing Intrinsic Bioremediation
The efficiency of intrinsic bioremediation (naturally occurring attenuation processes) to contain contaminant migration in ground-water systems can be assessed by quantitatively comparing rates of contaminant transport to rates of biodegradation. If transport rates are fast relative to rates of biodegradation, contaminants can migrate freely with ground-water flow and possibly reach points of contact with human or wildlife populations. Conversely, if transport rates are slow relative to biodegradation rates, contaminant migration is more confined and less likely to reach points of contact. In either case, the efficiency of intrinsic bioremediation can be assessed by evaluating the presence/absence of contaminant transport to predetermined points of contact. Thus, this assessment includes hydrologic (rates of ground-water flow), microbiologic (rates of biodegradation), geochemical (adsorption properties), and demographic (points of contact) considerations.
100
30.5
200
FE
ET
H 61 M
ET
ER
S
o
<4.
2
t N
SO
UT
H C
AR
OLIN
A
Stud
y Ar
ea
EX
PL
AN
AT
ION
"""H
LO
CA
TIO
N O
F J
P-5
LE
AK
24.
0-
EX
TE
NT
OF
JP
-5 P
RO
DU
CT
WA
TE
R-L
EV
EL
CO
NT
OU
RS
-
Sho
ws
altit
ude
at w
hich
wat
er
leve
l wou
ld
have
sto
od in
tig
htly
case
d w
ells
. C
onto
ur in
terv
al is
0.2
feet
. D
atum
is s
ea le
vel.
MO
NIT
OR
ING
WE
LL A
ND
ID
EN
TIF
ICA
TIO
N N
UM
BE
R
Fig
ure
1.
Loca
tion
of T
ank
Farm
C,
Mar
ine
Cor
ps A
ir S
tatio
n B
eauf
ort,
S.C
., th
e lo
catio
n of
mon
itorin
g w
ells
,an
d w
ater
leve
ls in
the
sha
llow
wat
er-t
able
aqu
ifer,
Mar
ch 9
, 19
94.

BFT-401-4
DEPTH, IN FEET
1
2
3
4
5
6
7
8
9
LITHOLOGY
...... ................................. .....
^^Jr-JrvIr-S-jiF
^^"^"^^
<7^^/^y//y/^z^/.
/y////////s/L//y//
DESCRIPTION
Sandy soil
Organic-rich sandy sediment.Chips of woody material abundant.
Clayey silt, organic rich, stained red with ferric iron.
Peat. Organic matter comprises90% of sediment and consists
of decomposed pine-bark material.
END HOLE
BFT-TF-12
DEPTH, IN FEET
1
2
3
4
5
6
7
LITHOLOGY
/^S2.//'fy^~/jL//^
DESCRIPTION
Light-brown sandy fill material.-_
Gray to white sandy fill material,Ot7 ~ Q 1^0/,WIZ. ~ 573 /O
Organic-rich peat. Poorly decomposed pine bark material comprises 60-80%
of sediment.
END HOLE
Figure 2. Lithologic description of sediments cored near wells BFT-401-4 and BFT-TF-12.

The U.S. Geological Survey, in cooperation with the Southern Division Naval Facilities Engineering Command, U.S. Navy, and MCAS Beaufort has developed a framework for assessing the efficiency of intrinsic bioremediation. In this framework (fig. 3), hydrologic, geochemical, and microbiologic information are integrated using digital solute-transport techniques in order to assess contaminant transport to pre-defined points of contact (adjacent water-supply wells or surface-water bodies). Because determining model parameters is subject to many uncertainties, it is not usually feasible to define a unique set of parameters that will accurately simulate contaminant transport for a particular site. Because of this, parameter uncertainty is explicitly treated as part of the modeling process, and a range of solutions is used to encompass minimum and maximum rates of solute transport. If, within this range, there is no combination of model parameters that results in contaminant transport to a point of contact, then intrinsic bioremediation may be considered a viable remedial option. Conversely, if certain combinations of model parameters indicate that contaminant transport to points of contact is possible, then intrinsic bioremediation can be ruled out as a remedial option. This framework is consistent with recent regulatory guidance documents (South Carolina Department of Health and Environmental Control, 1994) and are followed in this report.
FIELD AND LABORATORY DATA-COLLECTION METHODS
A site visit was made March 9-11, 1994, for the purpose of collecting water-chemistry data, water samples for BTEX analysis, and sediment samples for laboratory studies on hydrocarbon biodegradation and adsorption. Prior to ground-water sampling, water levels were recorded, and the wells purged (3 well-casing volumes). Measurements of water temperature, pH, and concentrations of dissolved oxygen, dissolved ferrous iron, and dissolved sulfide were made in the field using techniques described by Wood (1976) and Skougstad and others (1978). Samples were collected for BTEX and naphthalene and transported to the laboratory for analysis. Because the existing well network was inadequate for delineating the distribution of contaminants on a fine scale, five temporary well points were installed (wells with the prefix DP, standing for drive point) (fig. 1), and analyzed for contaminants and water-chemistry parameters as described above. Sediment samples were recovered from hydrocarbon-contaminated and uncontaminated sites using a hand auger. Sediments were placed in presterilized wide-mouth glass mason jars, chilled to 4 °C, and transported to the laboratory for analysis.
Laboratory studies were used to evaluate rates of hydrocarbon biodegradation and to evaluate the adsorption characteristics of hydrocarbons on the aquifer material present at the site. In both cases, toluene was used as a model BTEX compound and naphthalene was used as a model PAH compound.

I Hydrologic Assessment!Measure hydrologic parameters needed to determine the rates of ground-water flow including:
(1) Aquifer hydraulic conductivity (Kaq )(2) Aquifer porosity (0)(3) Hydrologic gradients (Ah)
IMicrobiologic Assessment!Measure rates of biodegradation (Kj,j0) for specific contaminant of concern.
Geochemical AssessmentMeasure distribution of soluble contaminants at site and determine sorption parameters for contaminant of concern.
[Construct Solute-Transport iModel|Build analytical or numerical solute- transport model that quantitatively integrates hydrologic, microbiologic, and 2eochemical data.
| Evaluate Model Uncertainty]Determine minimum and maximum distances of solute transport based on uncertainty of measured hydrologic, microbiologic. and geochemical parameters.
YES
Intrinsic bioremediationruled out
as remedial option
Doesmodelingindicate
contaminant transport to sensitive
NO
Intrinsic bioremediationis possible
remedial option
Figure 3. Framework for assessing the efficiency of intrinsic bioremediation.
6

The biodegradation-rate experiments tracked production of 14CO2 end products from radiolabeled toluene or naphthalene as an indicator of microbial degradation. Because production of 14CO2 from hydrocarbons is unequivocal evidence of microbial transformation, and because this is extremely sensitive, this method is preferable to simply tracking the disappearance of unlabeled hydrocarbons with time. Approximately 0.5 |nCi of radiolabeled compound was added to 1.0 gm of sediment in each vial. Heat and mercuric chloride-killed controls were prepared in the same way. At specified times, triplicate vials were acidified with phosphoric acid (H3PO4 , 2M), the evolved 14CO2 collected in potassium hydroxide (KOH, 3 M) base traps, and 14Cmeasured with scintillation counting. Reported 14C values were corrected for activity in traps at time zero, and for activity in killed controls. The results are given as the mean of triplicate measurements plus or minus one standard deviation.
Adsorption experiments were performed with heat-sterilized sediments, to avoid possible microbial degradation effects, using methods described by Schwarzenbach and Westall (1981). Five grams of sediment were placed in septated serum vials and amended with either 0, 5, 10, or 50 |iig of toluene or benzene. The vials were allowed to equilibrate for 1 hour, and the liquid fraction then analyzed for concentrations of toluene or benzene. For each treatment, the amount of adsorbed hydrocarbon was taken as the difference between the amount added and the amount present in solution at the end of the equilibration time.
QUANTIFICATION OF HYDROLOGIC, GEOCHEMICAL, AND MICROBIAL PARAMETERS
The results of hydrologic, geochemical, and microbial investigations are presented in this section. This includes description of site hydrology, ground-water chemistry, aquifer material adsorption characteristics, and microbial degradation rates determined in both field and laboratory studies.
The measured hydraulic conductivities and the water-level data allow rates of ground-water flow to be estimated based on Darcy's equation:
v=(KAh)/9 (1)
where
v is the average velocity of ground water in feet per day; K is the average hydraulic conductivity in feet per day; Ah is the hydraulic gradient (dimensionless); and 9 is the effective porosity (dimensionless).

The hydraulic gradient is fairly uniform over the site with an maximum head drop of about 0.8 ft per 200 ft, indicating values on the order of 0.004 ft/ft. This very shallow gradient combined with the low- to medium-hydraulic conductivities (1.9 - 9.1 ft/d) indicates that ground-water flow is slow at this site. Assuming a porosity of 0.4 (reasonable for the poorly compacted organic-rich sediments), rates of ground-water flow are on the order of 0.06 ft/d, or about 20 ft/yr. Thus, in the 4 years between the JP-5 spill and sampling ground-water chemistry for this project, the maximum distance that soluble contaminants would be expected to migrate is about 80 ft.
Hydrologic and Hydrogeoloqic Framework
The organic-rich aquifer sediments at Tank Farm C are characterized by low- to medium- hydraulic conductivities. The results of slug tests (U.S. Navy Department, 1993) showed hydraulic conductivities ranging from 1.9 to 9.1 ft/d with a mean value of 4.5 ft/d. The water- table surface at the site (measured on March 9, 1994) indicates that ground water flows from east to west toward low-lying areas east of the site (fig. 1). A small drainage ditch located near well BFT-401-1 appears to be a discharge area for the water-table aquifer and is the nearest potential point of contact for contaminants moving from the site of the JP-5 leak.
Hydrologic conditions at this site change rapidly with climatic changes. This is because the water-table aquifer is closely connected with the surface. For example, the measured water level in well BFT-401-3 on April 4, 1993, was 27.11 ft above sea level during a wet spring (U.S. Navy Department., 1993). The water level measured about one year later on March 9, 1994, was 24.17 (fig. 1), after a fairly dry spring. These data indicate that water levels at the Tank Farm C site rise and fall several feet depending on recent precipitation events. Significantly, however, the hydrologic gradients were similar for the 1993 and 1994 water-level measurements, both of which indicate values of about 0.004 ft/ft. This suggests that even though water levels rise and fall, the hydrologic gradient stays fairly constant. This, in turn, suggests that rates of ground-water flow are less variable than water levels in the aquifer.
Ground-Water Chemistry
Concentrations of BTEX and naphthalene ranged from less than 5 to 572 mg/L in ground water from the Tank Farm C site (table 1). Two distinct plumes of contaminated ground water were observed. The first and largest (fig. 1) was associated with the original spill site and was characterized by the highest concentrations of contaminants. A smaller zone of contamination, located in the drainage ditch west of the original spill, was delineated by the drive-point wells DP- 4 and DP-5 (table 1). Significantly, even wells associated with measurable JP-5 free-product contamination (well BFT-401-3) showed only modest concentrations (< 1,000 ug/L) of petroleum hydrocarbons.

Table 1 .--Concentrations of benzene, toluene, ethylbenzene, total xylenes, and naphthalene in ground water from monitoring wells at Tank Farm C, Marine Corps Air Station Beaufort, South Carolina, March 9, 1994
[Units in micrograms per liter (ng/L); NA, not analyzed; <, less than]
Monitoring well number (fig-1)
BFT-TF-9
BFT-TF-11
BFT-TF-12
BFT-TF-13
BFT-TF-15
BFT-TF-16
BFT-TF-19
BFT-401-1
BFT-401-2
BFT-401-3
BFT-401-3 (replicate)
BFT-402-1
BFT-402-3
BFT-RW
BFT-RW (replicate)
DP-1
DP-2
DP-3
DP-4
DP-5
DP-6
Benzene
<5.0
<5.0
<5.0
<5.0
<5.0
<5.0
<5.0
<5.0
19.4
107
141
<5.0
<5.0
37.6
41
<5.0
<5.0
<5.0
<5.0
<5.0
<5.0
Toluene
<5.0
<5.0
<5.0
<5.0
<5.0
<5.0
<5.0
<5.0
<5.0
31
35
<5.0
<5.0
29.7
28
<5.0
<5.0
<5.0
<5.0
<5.0
<5.0
Ethylbenzene
<5.0
<5.0
<5.0
<5.0
<5.0
<5.0
<5.0
<5.0
13.4
141
184
<5.0
<5.0
108
105
<5.0
<5.0
<5.0
19.2
16.2
<5.0
Xylene (total)
<10.0
<10.0
<10.0
19
<10.0
<10.0
<10.0
<10.0
51.4
372
572
<10.0
<16.0
340
328
<10.0
<10.0
<10.0
30.8
31.3
<10.0
Naphthalene
<5.0
<10.0
<10.0
NA
<10.0
<10.0
<10.0
<10.0
34
212
NA
<10.0
<10.0
161
159
<10.0
<10.0
<10.0
<10.0
46
<10.0

Concentrations of dissolved oxygen, ferrous iron, hydrogen, and sulfide in ground water from the site are given in table 2. Ground water at this site not associated with petroleum hydrocarbon contamination is aerobic, despite the organic-rich nature of the aquifer sediments. In contrast, water from contaminated zones was generally anaerobic and contained relatively high concentrations of dissolved iron. Hydrogen concentrations in anaerobic ground water were in the 0.1 to 1.5 nM range, which is characteristic of Fe(III) reduction and sulfate reduction as the predominant terminal electron-accepting processes.
Table 2.--Field-measured water-chemistry parameters of ground water from monitoring wells at Tank Farm C, Marine Corps Air Station Beaufort, South Carolina, March 9, 1994
[mg/L, milligrams per liter; nM, nanomoles per liter; °C, degrees Celsius; NA, not analyzed; <, less than]
Monitoring well number
(fig-DBFT-TF-9
BFT-TF-11
BFT-TF-12
BFT-TF-13
BFT-TF-15
BFT-TF-16
BFT-TF-19
BFT-401-1
BFT-401-2
BFT-401-3
BFT-402-1
BFT-402-3
BFT-RW
Dissolved oxygen (mg/L)
4.1
4.1
3.85
<.1
NA
1.26
<.1
.18
<.1
<.1
.18
<.1
<.1
Ferrous iron [Fe(ll)J (mg/L)
0.6
1
<.1
.8
NA
3.8
2
1.1
.8
1.8
1.4
6.5
4.0
Sulfide [S-]
(mg/L)
<0.01
.05
<.01
.35
NA
<.01
.45
.01
.75
.01
<.01
.95
.15
PH[units]
4.03
6.83
5.35
4.93
4.65
3.86
5.6
4.91
5.31
5.46
3.58
4.01
4.21
Dissolved hydrogen
(nM)
NA
NA
NA
.6
NA
NA
.5
.04
1.5
NA
NA
NA
.38
Temperature (°C)
16.9
17.3
17.9
18.3
NA
NA
21.8
17.4
21.1
17.1
17.7
17.7
18.8
10

Concentrations of nitrate (table 3) were generally low, except for high values in water from wells BFT-TF-11, BFT-TF -15, and BFT-402-1. These high values of nitrate may be related to the use of nitrogen fertilizers on the grass, and subsequent nitrate transport to the saturated zone. Sulfate concentrations ranged from 0.8 to 150 mg/L. The highest values (150 mg/L) were associated with the recovery well (BFT-RW) and suggest an anthropogenic source of sulfate. Sulfate concentrations of 1 to 30 mg/L can be attributed to sulfate delivered to the system from atmospheric recharge. The lowest concentrations of sulfate were in water from the most contaminated well (BFT-401-3) and may indicate the removal of sulfate due to microbial sulfate reduction. Phosphate concentrations were below 0.01 mg/L in all samples.
Table ^.--Concentrations ofanions and gases in ground water from monitoring wells at Tank Farm C, Marine Corps Air Station Beaufort, South Carolina, March 9, 1994
[Units in milligrams per liter; <, less than]
Monitoring well number
(fig. 1)BFT-TF-9
BFT-TF-1 1
BFT-TF-1 2
BFT-TF-1 3
BFT-TF-1 5
BFT-TF-1 9
BFT-401-1
BFT-401-2
BFT-401-3
BFT-401-3(replicate)
BFT-402-1
BFT-402-3
BFT-RW
BFT-RWR(replicate)
Chloride
9.8
2.1
1.7
2.6
5.1
4.4
2.5
3.7
2.8
2.8
2.3
10.3
2.7
2.7
Bromide
<0.05
<.05
<.05
.03
<.05
<.05
<.05
.06
.07
.08
<.05
.12
.09
.09
"» - S
<0.05 <0.01
2.8 <.01
.35 <.01
.12 <.01
3.3 <.01
<.05 <.01
.72 <.01
<.05 <.01
.05 <.01
.05 <.01
5.3 <.01
<.05 <.01
<.05 <.01
<.05 <.01
Sulfate
19.3
9.9
9.1
3.2
55.1
36.7
9.4
12.2
.82
.83
36.6
18.7
142
150
Dissolved inorganic carbon
20.1
13.4
18.6
123.6
66.8
95.5
54.2
132.4
212.4
213.5
48.1
197.6
214
213.9
Dissolved methane
0.1
<-1
<-1
<.1
<-1
<.1
<-1
3.9
2.1
2.1
<.1
<-1
1.0
2.0
11

Concentrations of cations such as sodium, potassium, magnesium, and calcium (table 4) were in the range typical of shallow aquifers in the Coastal Plain of South Carolina. There were measurable concentrations of ammonium present (table 4), and comparison with nitrate concentrations (table 3) indicates that most of the dissolved organic nitrogen in this system is present as reduced ammonium. These data indicate the presence of reducing conditions in the aquifer even though the ground water generally contains measurable concentrations of dissolved oxygen.
Table 4. -Concentrations of cations in ground water from monitoring wells at Tank Farm C, Marine Corps Air Station Beaufort, South Carolina, March 9, 1994
[Units in milligrams per liter; <, less than]
Monitoring well number(fig.D
BFT-TF-9
BFT-TF-11
BFT-TF-12
BFT-TF-13
BFT-TF-15
BFT-TF-19
BFT-401-1
BFT-401-2
BFT-401-3
BFT-401-3 (replicate)
BFT-402-1
BFT-402-3
BFT-RW
BFT-TF-RW (replicate)
Sodium
8.1
5.3
1.7
3.1
34.3
14.2
3.1
4.2
2.1
2.1
2.4
6.1
6.2
6.2
Ammonium
<0.05
<.05
<.05
1.1
<.05
.31
.29
.67
3.32
3.26
.06
1.34
1.50
1.84
Potassium
0.41
.94
.53
1.24
1.33
41.37
2.89
1.89
1.83
1.85
2.98
.80
1.16
1.14
Magnesium
0.83
.32
.71
.82
2.17
1.10
.51
.83
.51
.49
1.02
1.82
.29
.27
Calcium
4.0
4.0
4.8
4.2
6.1
10.8
2.57
9.66
8.99
8.96
6.19
2.86
3.23
3.19
12

Microbial Degradation
Biodegradation of toluene and naphthalene was rapid under aerobic conditions, with about 10 percent of the total radiolabel mineralized in 10 hours (figs. 4 and 5). Biodegradation was much slower under anaerobic conditions with about 3 percent of the radiolabeled compounds mineralized in about 30 days. Oxygen carried into the aquifer by vertically percolating recharge would be available to support aerobic metabolism, but once the oxygen is consumed, anaerobic metabolism would prevail. Given the mosaic of aerobic and anaerobic conditions at this site, overall rates of hydrocarbon biodegradation are probably intermediate between the aerobic and anaerobic extremes shown on figures 4 and 5.
Adsorption Coefficient
Laboratory studies were conducted to determine adsorption coefficients for benzene and toluene in sediments from Tank Farm C. Toluene is more strongly adsorbed (K^ ~ 31.6 cmVmg) than benzene (K^ ~ 3.08 cm3/mg) by the organic-rich sediments at the site (fig. 6). The adsorption isotherms were linear over the wide concentration range evaluated experimentally. Similar experiments conducted with organic-poor sediments characteristic of the Laurel Bay site, MCAS Beaufort (James E. Landmeyer, U.S. Geological Survey, written commun., 1994), showed substantially lower K^ values that ranged from 0.08 to 0.15 cnrVmg. The high K^ values characteristic of the Tank Farm C site can be attributed to the organic-rich nature of the aquifer materials. Furthermore, these relatively high K,^ values indicate that the movement of dissolved petroleum hydrocarbons will be significantly retarded relative to ground-water flow at this site.
ASSESSMENT OF INTRINSIC BIOREMEDIATION
The distribution of contaminated ground water at the site, as well as records of the contamination event, indicates two plumes of contaminated ground water. The larger plume is associated with the spill site, and reflects hydrocarbons leaching into the ground water from free product floating on the water table. A smaller plume is delineated by drive-point wells (DP-4 and DPS). This smaller plume is not connected to the larger free-product plume as demonstrated by uncontaminated ground water encountered at DP-3, DP-2, and DP-1 (fig. 1). Eyewitness accounts of the spill event indicate that some free product reached land surface and flowed overland to the drainage ditch where it formed a pool. The smaller plume probably represents fuel transported to the drainage ditch that subsequently percolated into the ground and reached the water table.
13

4 6 HOURS
AREA OF ORIGIN ENLARGED
Figure 4. Mineralization of 14C-toluene to 14CO2 under (A) aerobic and (B) anaerobic conditions in sediments from Tank Farm C.
14

246
HOURS
AREA OF ORIGIN ENLARGED
0 20
DAYS
Figure 5. Mineralization of 14C-naphthalene to 14CO2 under (A) aerobic and (B) anaerobic conditions in sediments from Tank Farm C.
15

AD
SO
RB
ED
C
ON
CE
NT
RA
TIO
N
PA
RT
S
IN
PE
R
MIL
LIO
N
oo
-*
ro
ooo
o
o
o
o
T|
(5'
C fl>
O)
Q.
to
O -8 r-l-
i§ to -X
" IT
T
l$
^ 3
3 w
G
Oto ^
-s
0 >
O to
0
D)
Q.
C
0 13 0
O o

The data indicate that the larger plume has not migrated extensively away from the site of the original spill, and that the plume is characterized by very sharp concentration gradients between contaminated and uncontaminated ground water. For example, concentrations of toluene at BFT-RW and BFT-401-3, which are in the large plume of contaminated ground water, are 28 and 31 mg/L, respectively (fig. 1). Water from well DP-2, which is about 20 ft from TFC-RW, and water from well BFT-401-2, which is about 50 ft from BFT-RW, is uncontaminated. To some extent, the lack of plume migration can be attributed to slow rates of ground-water flow. However, given a ground-water-flow rate of 20 ft/yr, it would be expected that contaminants would have migrated as much as 80 ft from the spill source. Because this is not observed, it is evident that other processes are serving to retard the migration of contaminated ground water.
The migration of soluble contaminants in ground-water systems is affected by hydrologic, geochemical, and microbiologic processes. The principal hydrologic factors are the dispersion of contaminants and advective mixing of contaminated with uncontaminated water. There are a wide variety of geochemical processes that can affect the transport of contaminants including mineral precipitation-dissolution reactions and adsorption-desorption reactions. Petroleum hydrocarbons in ground water are not, in general, subject to significant mineral precipitation reactions so that the most important geochemical process affecting transport are sorption reactions. Finally, the microbial degradation of hydrocarbons is an important factor affecting contaminant transport.
The effects of these different hydrologic, geochemical, and microbiologic processes on contaminant transport can be quantified by writing a mass balance equation that includes terms for each individual process. Where dispersion, advection, sorption, and microbial degradation are the principal processes affecting transport in one dimension, this equation may be written
vac nat ax2 ax
where
C is concentration of solute in micrograms per liter;t is time in days;D is the coefficient of hydrodynamic dispersion in square feet per day;x is distance in feet;v is the velocity of ground-water flow in feet per day;S and n are adsorption isotherm parameters; andk is a first-order microbial degradation rate constant in day" 1 .
Equation 2 is most readily solved by numerical methods. In this study, the solute-transport code SUTRA (Saturated-Unsaturated TRAnsport) as described by Voss (1984) was used to obtain solutions in two dimensions subject to hydrologic, geochemical, and microbial conditions at Tank Farm C.
17

The hydrologic conditions at Tank Farm C were simulated by assigning hydraulic conductivities at the site (U.S. Navy Department, 1993) and by reconstructing the observed potentiometric surface of the aquifer. Hydrologic data show that water levels at the site are highly dynamic, rising or falling as much as 3 ft depending on the amount of precipitation. However, the data also show that hydrologic gradients remain fairly constant with time. Thus, rather than attempting to simulate the complex rise and fall of water levels, the observed gradients were imposed on the model area by holding water levels on the boundary constant. This is a significant simplification of the actual hydrologic system. The geochemical and microbiologic conditions at the site were estimated experimentally as has been previously discussed.
Approach to Solute-Transport Simulation
There are two distinct approaches to modeling complex hydrologic systems. The first, often called consolidative modeling, seeks to simulate every possible feature of a hydrologic system in order to arrive at a unique solution to the solute-transport problem at hand. While conceptually appealing, consolidative modeling assumes that ail relevant parameters can be measured, and that the spatial and temporal variability of these parameters can be defined. This approach inevitably comes into conflict with the uncertainties inherent in all hydrologic systems. It is not possible, for example, to precisely measure the distribution of hydraulic conductivity at a site, so that uncertainty in model results is inevitable. When the uncertainties inherent in measuring all of the relevant hydrologic, geochemical, and microbiologic parameters are taken into account, it is clear that to arrive at the single unique solution envisioned by consolidative modeling is generally not technically feasible.
A second approach to modeling hydrologic systems, often called exploratory modeling, explicitly recognizes these inherent uncertainties. Rather than attempting to arrive at a single unique solution, exploratory modeling shows the range of possible solutions given the uncertainty of the measured parameters. For example, if the hydraulic conductivity of a system is uncertain, with measurements ranging from a minimum of 1.9 ft/d to a maximum of 9.1 ft/d, an exploratory model can evaluate solute transport for both of these possible extremes. Then, even though the exact solute-transport behavior of the system is not precisely known, there is a high likelihood that this behavior falls between the two extremes.
For purposes of assessing the efficiency of intrinsic bioremediation to contain contaminant migration, the exploratory modeling approach is most appropriate. In such an assessment, the most relevant question is the likelihood that contaminants will reach a point of contact under any possible conditions. If it can be shown that for the possible range of parameters there is no combination that results in solute transport to a point of contact, then it can be concluded with reasonable confidence that intrinsic bioremediation is a feasible remedial alternative. On the other hand, if the given range of parameters suggests that solute transport to a point of contact is possible, then it can be concluded with similar confidence that intrinsic bioremediation is not a feasible alternative to contain contaminants.
18

Solute-Transport Simulations of Hydrocarbon Migration
Data gathered at the Tank Farm C site define the range of hydraulic gradients (fig. 1), hydraulic conductivities (U.S. Navy Department, 1993; tables 3-4), adsorption isotherm parameters (fig. 6), and rnicrobial degradation rates (figs. 4 and 5) determined at the site. Of these parameters, the most uncertainty resides in the hydraulic conductivity data and microbial degradation rates. The mean value of four hydraulic conductivity measurements (U.S. Navy Department, 1993) was 4.5 ft/d, but the observed range from 1.9 to 9.1 ft/d indicates significant variability. Similarly, measured microbial degradation rates varied between 0.2 d" 1 for aerobic conditions to 0.001 d' 1 for anaerobic conditions. Given this variability, the modeling approach was to calculate the distribution of hydrocarbons for the possible extremes in order to evaluate the possibility of solute transport to the nearest point of contact at the site. To do this, a set of most probable values was selected, based on measurements made at the site, and used to construct a Standard Model. This model assumes that the water-table gradients remain constant over time (that is, the water-level distribution is the same as of March 9, 1994), that microbial degradation proceeds under aerobic and anaerobic conditions (Kbio ~ 0.01 d" 1 ), that the solute being transported is toluene (in other words, toluene is representative of the behavior of other BTEX compounds), and that the aquifer exhibits strong adsorption properties (K^ = 31.6 cm3/mg) for toluene. The Standard Model is not intended to represent "best" estimates of parameters, but rather to have a point of comparison for different model runs in which parameters were varied within measured ranges.
The area modeled is 120 by 150 ft and is oriented so that the free product is located on the upgradient side (fig. 7), and the nearest point of contact (the drainage ditch) is located on the downgradient edge. Thus, solute transport to the downgradient edge of the model would indicate contaminants reaching a point of contact. In addition, the modeled area is oriented so that water- chemistry data are available at the free-product zone where the plume begins (BFT- RW, BFT-401-3), immediately downgradient (30 ft) of the free-product zone (DP-2), and at the downgradient edge of the model (DP-3).
The development of the contamination plume from a constant source (JP-5 derived from the 1990 spill) through 1994 was simulated assuming conservative solute transport (no biodegradation and no adsorption), and reactive solute transport assuming the parameters of the Standard Model (fig. 8). As expected, the simulated plume of a conservative solute gradually expands at a rate of about 20 ft/yr, finally extending 80 ft downgradient, but not reaching the downgradient edge of the model (fig. 8 A). However, this simulation indicates that a conservative solute would reach well DP-2. In contrast, the plume simulated by the Standard Model (fig. 8B) is much more confined, with contaminants extending less than 20 ft downgradient and not reaching well DP-2. In the case of conservative transport, the plume enlarges continuously with time. The results of the Standard Model, however, indicate that the plume will grow much more slowly.
19

100
30.5
to
o
200
FE
ET
H
61 M
ET
ER
SBF
T-TF
-16
BFT-
TF-1
2
BFT-
TF-1
5
BFT-
401
4
BFT-
TF-1
7
BFT
-TF-
18.
t N
/SO
UT
H C
AR
OL
INA
\
v '
>
Stud
y Ar
ea
EX
PL
AN
AT
ION
LOC
AT
ION
OF
JP
-5 L
EA
K
EX
TE
NT
OF
JP
-5 P
RO
DU
CT
BFT-T
F-180
M
ON
ITO
RIN
G W
ELL
AN
D
IDE
NT
IFIC
AT
ION
NU
MB
ER
Figu
re 7
. Lo
catio
n an
d or
ient
atio
n of
the
mod
eled
are
a.

140 I-
120 h
* r n^ I 1* 4_J*
*
20 40 60 80 100 120
20 40 60 80 100 120
40 60 80 100 120
Model ParametersKaq = 4.5 ft/d Kbio = 0.00 d' 1 K ad = 0.00 cm 3/gm
i yyu
1992
1994
40 I-
EXPLANATION
V, MONITORING WELL AND IDENTIFICATION NUMBER
*
DP-3
20 40 60 80 100 120
20 40 60 80 100 120
60
FEET
80 100 120
Model ParametersKaq = 4.5 ft/d Kblo = 0.01 d' 1 Kad = 10 cm 3/gm
Figure 8. Simulated solute transport of toluene at Tank Farm Cfor (A) conservative solute transport and, (B) reactive solute transport,
given the parameters of the Standard Model.21

The first question to be addressed by exploratory modeling is the effects that uncertainty in hydraulic conductivity at the site can have on contaminant transport. The simulated 1994 distribution of toluene, assuming the aquifer system has a uniformly low (1.9 ft/d) hydraulic conductivity, is shown in figure 9 A. The simulated 1994 distribution of toluene, assuming the aquifer has a uniformly high (9.1 ft/d) hydraulic conductivity, is shown in figure 9B. As can be seen, the higher hydraulic conductivity results in a larger plume. This is due to the higher rates of ground-water flow that develop, and consequently higher rates of contaminant transport.
The laboratory studies indicated that rates of biodegradation (Kbio) could possibly be as lowas 0.001 d" 1 (uniformly anaerobic conditions), or as high as 0.2 d' 1 (uniformly aerobic conditions). The results of a simulation designed to explore how such a range in Kbio can affect solute transport are shown in figure 10. The effect of assuming the lower Kbio value is shown in figure 10 A, and the effect of assuming the higher Kbio value is shown in figure 10B. The maximum extent of the plume is less given the higher rate of degradation, and contaminants are contained within 2 ft of the free-product source.
Degradation of petroleum hydrocarbons at this site occurs under anaerobic and aerobic conditions. Thus, the effective value of Kbio is probably intermediate between the values used in the simulations shown in figure 10. The intermediate Kbio value used in the Standard Model (fig. 8) is probably more representative of in situ conditions given the better match to the measured distribution of toluene (table 1.)
The results of the laboratory experiments to determine adsorption coefficient (K^ valuesindicated significant variability ranging from 4.1 to 31.6 cm3/g. The effects of this variability on model results are shown in figure 11 for a 30-year simulation of solute transport. When the adsorption coefficient is low (fig. 11 A), the plume reaches steady-state conditions (that is, the plume is no longer expanding with time) within the first 10 years of the simulation. However, when the adsorption coefficient is high (fig. 11B), the plume does not reach steady-state conditions even after 30 years. The net effect of the adsorption coefficient, therefore, is to affect the rate at which the plume reaches steady-state conditions. When there is a high adsorption coefficient, such as is the case at Tank Farm C, the plume will take much longer to achieve steady- state conditions. Based on this analysis, it seems likely that the plume at Tank Farm C has not yet reached steady-state conditions and may continue to migrate in the future. This, in turn, indicates that removal of the free product source of dissolved contaminants may be a desirable remedial option at this site.
The model analysis indicates that the extent of contamination at Tank Farm C is sensitive to aquifer hydraulic conductivity (K^) and biodegradation rates (Kbi0), and relatively insensitive to adsorption (K^. Because high values of K^ and low values of Kbio lead to more extensive contaminant migration, a simulation was performed that used the highest K^ reported at the site and the lowest Kbio . The results of this simulation (fig. 12 A) show an extensive plume developing that is similar to that of the conservative transport simulation (fig. 8A). The results of this simulation represent the worst-case scenario of solute transport at the site. Furthermore, measured water-chemistry data from DP- land DP-2 (table 1) show that this scenario
22

(A)
120100
80 -
60
.<rDP-2
DP-1
Model ParametersK aq =1.9ft/dK = 0.01 d -1
= 10cm3/gm
0 20 40 60 80 100 120
120
100
80
60 'r-
(B)
20
20 40
^/DP-2
DP-1
60
FEET
Model ParametersK aq = 1 ft/d Kbio = 0.01 d- 1 K ad = 10 cm 3/gm
80 100 120
Figure 9. Simulated 1994 distribution of toluene at Tank Farm C for (A) minimum and, (B) maximum values of hydraulic conductivity (Kaq).
23

140
120
100
80
60
(A) ^^N-
D/'
*/'
// /
^DP-2/
//
//
//
/ DP-1///
!40
20
0
//
- //
/ /
//
/ /
/ /
//
1 /^LJP'J I i i
Model ParametersK aq = 4.5 ft/dKbio = 0.001 d' 1K ad = 10 cm 3/gm
0 20 40 60 80 100 120
140
120
100
80
60
40
20
0 C
_(B) ^-^
^i ir""""""i
\s
/
/ DP-1
/
APP-3
Model ParametersK aq = 4.5 ft/d Kbio = O.IOd' 1K ad = 10 cm 3/gm
20 40 60 80 100 120
FEET
Figure 10. Simulated 1994 distribution of toluene at Tank Farm C for (A) minimum and (B) maximum values of microbial degradation rate constant (K bio ).
24

tft tft
YEAR 1
20 40 60 0 20 40 60 30 100 120
YEAR 10
* Q-*
YEAR 20
YEAR 30
(A)Model Parameters
Kaq = 4.5 ft/d Kbio = 0.01 d- 1 Kad = 1 cm 3/gm
(B)
, *OP 3 ,
0 20 40
Model
80 80 100
FEET
ParametersKaq = 4.5 ft/d Kbio = 0.01 d' 1 Kad = 30 cm 3/gm
Figure 11. Simulated concentration changes of toluene over a 30-year period for (A) minimum and (B) maximum values of the adsorption coefficient (K ad).
25

140
120
100
80
60
40
20
0 0
140
120
100
80
60
40
20
0 (
<A> ^-N
V
- *+
\^)*L_
/
/ DP-1
Model ParametersKaq = 9.1 ft/d Kbio = 0.001 d- 1 Kad = 1 .0 cm 3/gm
20 40 60 80 100 120
(B) ^^N
^tv t "1
£ /^-
/ DP-2
/'
/ DP-1~~ i
-
/
i «iDP-3 i i i
Model ParametersKaq = 1.9 ft/d K b j 0 = 0.1 d" 1 Kad = 30 cm 3/gm
3 20 40 60 80 100 120
FEET
Figure 12. Simulated 1994 distribution of toluene at Tank Farm C for (A) maximum and (B) minimum solute-transport parameters.
26

overestimates contaminant transport. The important feature of this simulation, however, is that even given the overestimate of solute transport, contamination is not predicted to reach the nearest point of contact (the discharge point in the drainage ditch), which is located at the downgradient edge of the model grid. Thus, it can be concluded with reasonable confidence that no combination of transport parameters at this site will lead to contaminants reaching the nearest point of contact in this hydrologic system.
The converse of this simulation, where the lowest possible K^ value and highest Kbio value is shown in figure 12B. In this best-case scenario, contaminants are totally immobilized and do not migrate at all from the free-product source
As a practical matter, parameter values intermediate between those used in figures 12 A and 12B are probably better estimates of in situ conditions, and these are incorporated into the Standard Model simulations shown in figure 8B. Due to the inherent uncertainties of measuring the hydrologic, geochemical, and microbiologic parameters, the lack of contaminant transport given the maximum transport parameters (fig. 12A) is strong evidence that contaminants are effectively contained by natural attenuation processes at this site.
The simulated remedial effects of removing the free-product source of contaminants is shown in figure 13. The parameters used in this simulation are those of the Standard Model. As can be seen, contaminants are not predicted to degrade quickly with time, with concentrations of toluene of 100 mg/L remaining after 20 years. This behavior is a direct result of the high sorptive capacity of the organic-rich sediments present at this site. Because of this sorptive capacity, a large pool of sorbed BTEX compounds will remain trapped in the sediments even after free- product removal. Furthermore, continual desorption will result in relatively high BTEX concentrations in ground water. However, the combination of sorption and biodegradation still serve to contain soluble contaminants.
These simulations illustrate the dual role of sorption in affecting contaminant transport at this site. On one hand, the high sorption capacity serves to greatly restrict contaminant migration from the free-product source area. On the other hand, this high sorption capacity provides a large pool of sorbed contaminants that will continue to contaminate ground water for a long time into the future.
These simulations also suggest a remedial strategy to deal with this feature of the hydrologic system. It is possible to excavate JP-5-contaminated sediments to remove the main source of soluble contaminants. It is also possible, however, to excavate the sorption-contaminated sediments as well. Because the simulations indicate that sorption-contaminated sediments will be restricted to within a few feet of the free product, those sediments can be excavated along with the JP-5 contaminated sediments as part of the remedial strategy.
27

>N Source Removal. / 1995
,«PP-3
0 20 40 60 80 100 "20
^"N Contaminants Remaining ^ /" in Ground Water, 2005
! > _________________________________________
0 20 JO 60
100 h
^^N i Contaminants Remaining ^ /" in Ground Water, 2015
,<»DP-3
0 20 40 60 80 100 120 FEET
Model ParametersKaq = 4.5 ft/d Kbio = 0.01 d' 1 Kad = 4.0 cm 3/gm
Figure 13. Simulated changes in toluene concentrations at Tank Farm C followingremoval of the free-product source in 1995.
28

CONCLUSIONS
The results of this evaluation indicate that no combination of reasonable hydrologic, microbiologic, and geochemical conditions are present that could result in contaminant transport to a point of contact with humans or wildlife at Tank Farm C. This indicates that contaminants are effectively isolated under current site conditions, that they are not affecting adjacent surface- water bodies, nor are they likely to in the future. This, in turn, indicates that intrinsic bioremediation is a possible remedial option for containing contaminated ground water at Tank Farm C. Available evidence indicates that removal of free product- and sorption-contaminated sediments can accelerate the intrinsic bioremediation of contaminated ground water at this site.
29

REFERENCES
Schwarzenbach, R.P., and Westall, J., 1981, Transport of nonpolar organic compounds from surface water to ground water: Laboratory sorption studies. Environmental Science and Technology, v. 15, no. 11, p. 11-18.
South Carolina Department of Health and Environmental Control, 1994, Draft risk-based corrective action guidance document for soil and ground water, Ground-Water Protection Division, Columbia, South Carolina, 40 p.
Skougstad, M.W., Fishman, M.J., Friedman, L.C., Erdman, D.E., and Duncan, S.S., 1978, Methods for analysis of inorganic substances: U.S. Geological Survey Open-File Report 78-679, 626 p.
U.S. Navy Department, Southern Division Naval Facilities Engineering Command, 1993, Contamination Assessment Report, Tank Farm C, MCAS Beaufort, S.C., Ground-Water Protection Division, no. A-07-AA-155513, 53 p.
Voss, C.I., 1984, A finite-element simulation model for saturated-unsaturated, fluid density- dependent ground-water flow with energy transport or chemically-reactive species transport: U.S. Geological Survey Water-Resources Investigations Report 84-4369, 409 p.
Wood, W.W., 1976, Guidelines for collection and field analysis of ground-water samples for selected unstable constituents: U.S. Geological Survey Techniques of Water-Resources Investigations, book 1, chap. D2, 24 p.
3Q *U.S GOVERNMENT PRINTING OFFICE 1996-542-0