Assessment of impact on biogas producers of proposed ... · Project Number: 16-015.6 ... Lucy...
24
Assessment of impact on biogas producers of proposed changes to sustainability criteria Project Number: 16-015.6 February 2016 A report for DECC
Transcript of Assessment of impact on biogas producers of proposed ... · Project Number: 16-015.6 ... Lucy...
Assessment of impact on biogas producers of proposed
changes to sustainability criteria
Project Number: 16-015.6
February 2016
A report for DECC
Impact on biogas producers of proposed changes to sustainability criteria (16-015.6), Page 2 of 24
Author(s)
Michael Goldsworthy
Reviewer(s)
Lucy Hopwood
Disclaimer
While NNFCC considers that the information and opinions given in this work are sound, all
parties must rely on their own skill and judgement when making use of it. NNFCC does not
make any representation or warranty, expressed or implied, as to the accuracy or
completeness of the information contained in this report and assumes no responsibility for
the accuracy or completeness of such information. NNFCC will not assume any liability to
anyone for any loss or damage arising out of the provision of this report.
NNFCC
NNFCC is a leading international consultancy with expertise on the conversion of biomass to
bioenergy, biofuels and bio-based products.
NNFCC, Biocentre, Phone: +44 (0)1904 435182
York Science Park, Fax: +44 (0)1904 435345
Innovation Way, E: [email protected]
Heslington, York, Web: www.nnfcc.co.uk
YO10 5DG.
Impact on biogas producers of proposed changes to sustainability criteria (16-015.6), Page 3 of 24
Contents
1 Introduction ...................................................................................................................................................... 4
1.1 Objectives ...................................................................................................................................................... 4
1.2 Methodology ............................................................................................................................................... 4
1.2.1 GHG thresholds ...................................................................................................................................... 4
1.2.2 Default supply chains ........................................................................................................................... 5
1.2.3 Sensitivities ............................................................................................................................................... 6
2 Outputs ............................................................................................................................................................... 9
2.1 Biomethane................................................................................................................................................... 9
2.2 CHP; electricity only ................................................................................................................................ 13
2.3 CHP; electricity and heat ....................................................................................................................... 16
2.4 Boiler; heat only ....................................................................................................................................... 19
3 Summary and discussion .......................................................................................................................... 21
3.1 Summary ..................................................................................................................................................... 21
3.2 Discussion................................................................................................................................................... 21
Impact on biogas producers of proposed changes to sustainability criteria (16-015.6), Page 4 of 24
1 Introduction
1.1 Objectives
Sustainability criteria were introduced in the RHI in October 2015 and are now being
considered for the FIT Scheme. DECC wishes to align the criteria across schemes and is trying
to understand, in the interests of achieving maximum value for money and decarbonisation
at least cost, what the impact on biogas and biomethane producers would be if the GHG
limit were tightened or the underlying assumptions changed. DECC wish to understand:
What the impacts are of applying alternative fossil-fuel comparators for biomethane
and biogas combustion
What the impacts are of applying alternative end-use efficiency assumptions for
biomethane and biogas combustion
The costs/benefits of harmonising the lifecycle GHG emissions limit between schemes
The extent to which farm AD plants are resilient to fluctuations in crop yield
The key factors which could drive industry behaviour towards lowest carbon
abatement costs
1.2 Methodology
1.2.1 GHG thresholds
NNFCC first established a range of potential GHG thresholds for the modelling. These
thresholds were based on the existing criteria under the RHI (60% GHG saving on an EU
fossil heat comparator of 87gCO2eq/MJ) and RO (60% GHG saving on an EU electricity
comparator of 198gCO2eq/MJ) and a recent communication from the Commission on the
“State of play on the sustainability of solid and gaseous biomass used for electricity, heating
and cooling in the EU”1, which suggested new, marginal fossil fuel comparators for electricity
(186gCO2eq/MJ), heat (80gCO2eq/MJ ) and biomethane (72gCO2eq/MJ ) and indicated that at
least a 70% GHG saving should be targeted by biomass energy facilities, with further
improvement made post-2020.
Thresholds are outlined in Table 1.
1 http://ec.europa.eu/energy/sites/ener/files/2014_biomass_state_of_play_.pdf
Impact on biogas producers of proposed changes to sustainability criteria (16-015.6), Page 5 of 24
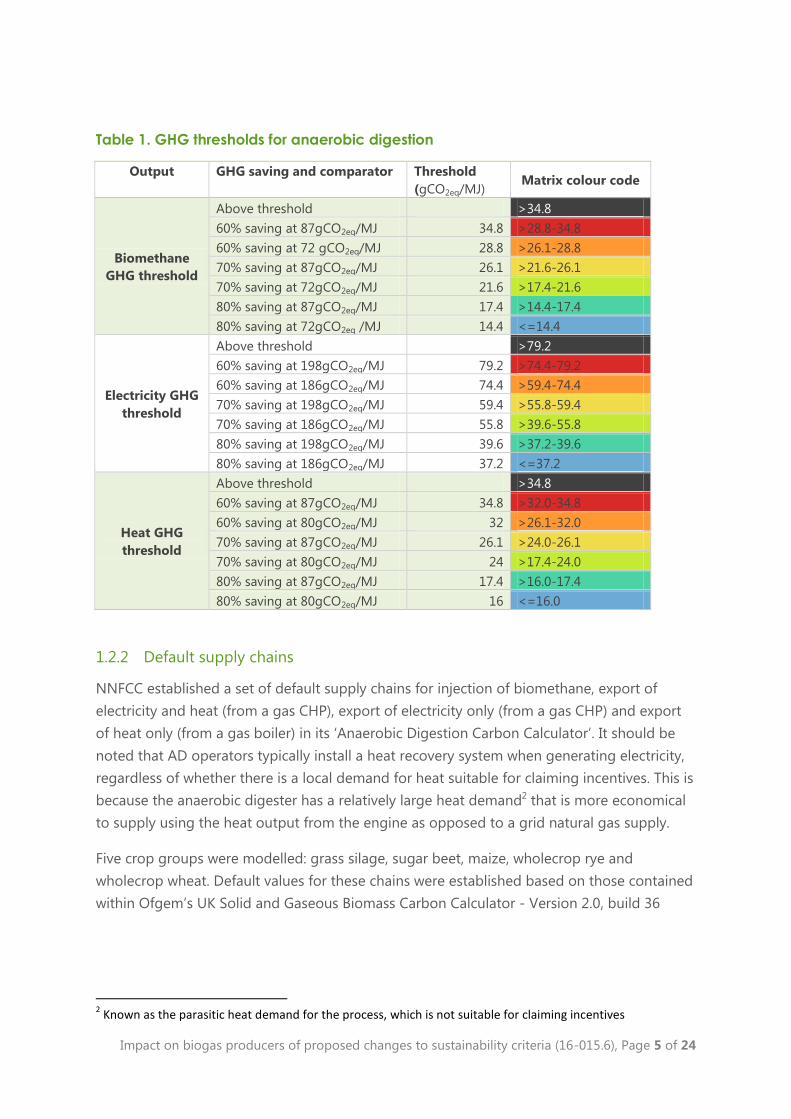
Table 1. GHG thresholds for anaerobic digestion
Output GHG saving and comparator Threshold
(gCO2eq/MJ) Matrix colour code
Biomethane
GHG threshold
Above threshold >34.8
60% saving at 87gCO2eq/MJ 34.8 >28.8-34.8
60% saving at 72 gCO2eq/MJ 28.8 >26.1-28.8
70% saving at 87gCO2eq/MJ 26.1 >21.6-26.1
70% saving at 72gCO2eq/MJ 21.6 >17.4-21.6
80% saving at 87gCO2eq/MJ 17.4 >14.4-17.4
80% saving at 72gCO2eq /MJ 14.4 <=14.4
Electricity GHG
threshold
Above threshold >79.2
60% saving at 198gCO2eq/MJ 79.2 >74.4-79.2
60% saving at 186gCO2eq/MJ 74.4 >59.4-74.4
70% saving at 198gCO2eq/MJ 59.4 >55.8-59.4
70% saving at 186gCO2eq/MJ 55.8 >39.6-55.8
80% saving at 198gCO2eq/MJ 39.6 >37.2-39.6
80% saving at 186gCO2eq/MJ 37.2 <=37.2
Heat GHG
threshold
Above threshold >34.8
60% saving at 87gCO2eq/MJ 34.8 >32.0-34.8
60% saving at 80gCO2eq/MJ 32 >26.1-32.0
70% saving at 87gCO2eq/MJ 26.1 >24.0-26.1
70% saving at 80gCO2eq/MJ 24 >17.4-24.0
80% saving at 87gCO2eq/MJ 17.4 >16.0-17.4
80% saving at 80gCO2eq/MJ 16 <=16.0
1.2.2 Default supply chains
NNFCC established a set of default supply chains for injection of biomethane, export of
electricity and heat (from a gas CHP), export of electricity only (from a gas CHP) and export
of heat only (from a gas boiler) in its ‘Anaerobic Digestion Carbon Calculator’. It should be
noted that AD operators typically install a heat recovery system when generating electricity,
regardless of whether there is a local demand for heat suitable for claiming incentives. This is
because the anaerobic digester has a relatively large heat demand2 that is more economical
to supply using the heat output from the engine as opposed to a grid natural gas supply.
Five crop groups were modelled: grass silage, sugar beet, maize, wholecrop rye and
wholecrop wheat. Default values for these chains were established based on those contained
within Ofgem’s UK Solid and Gaseous Biomass Carbon Calculator - Version 2.0, build 36
2 Known as the parasitic heat demand for the process, which is not suitable for claiming incentives
Impact on biogas producers of proposed changes to sustainability criteria (16-015.6), Page 6 of 24
(B2C2)3. Conservative factors used in processing modules to encourage operator use of
actual values were removed to ensure that supply chain emissions were not overestimated.
Notable attention was given to biogas output values from digestion to ensure correlation.
This was important because the B2C2 is structured such that the biogas yield from digestion
represents net yield (i.e. all output is used downstream for biomethane/combustion) rather
than gross yield (i.e. output is split between downstream use and internal energy
requirements). Once default supply chains were established in the ‘Anaerobic Digestion
Carbon Calculator’ they were compared against those within B2C2 to ensure consistency.
For biogas combustion supply chains where default values for end use efficiency and final
product use were unavailable, typical industry values were used. These values included:
Electrical CHP efficiency of 35%
Thermal CHP efficiency of 40%
Thermal boiler efficiency of 85%
Temperature of delivered heat of 150°C4
All potential exportable heat from CHP (for “CHP; electricity and heat” scenarios) is
used in valid process
1.2.3 Sensitivities
Once default supply chains were established in the calculator a range of variables were
modelled in an independent manner to analyse their impact on overall supply chain
emissions when compared to the relevant default chain.
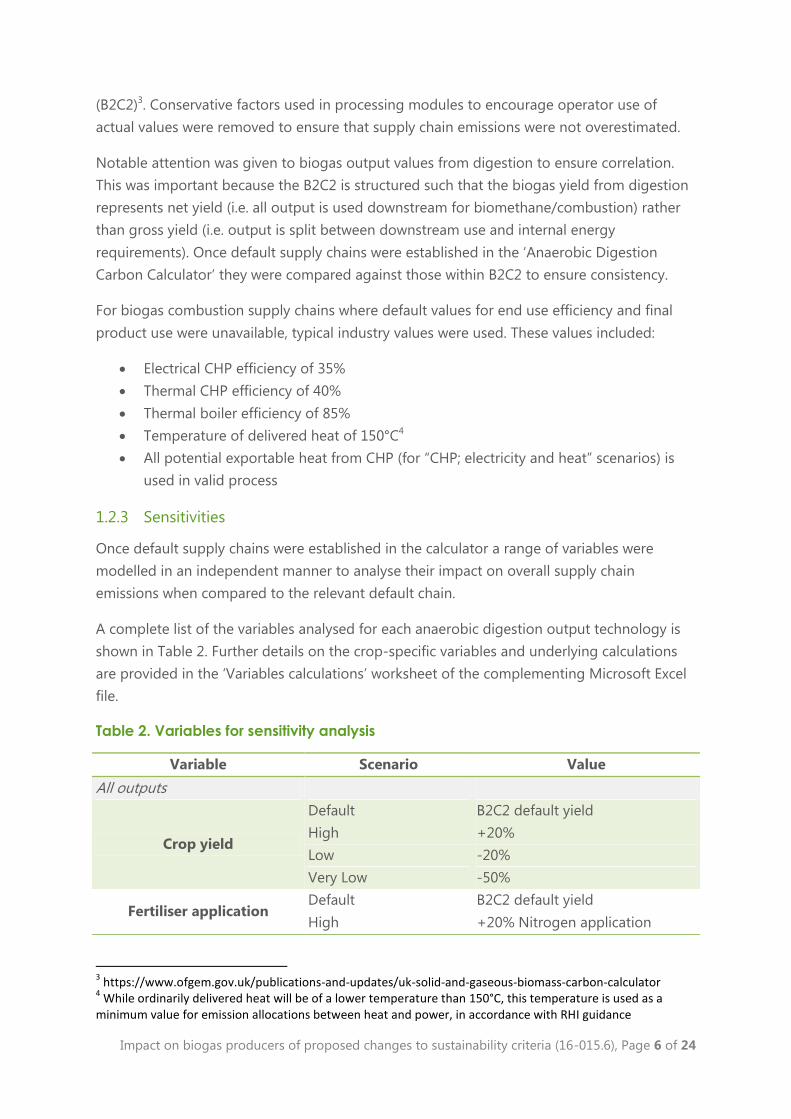
A complete list of the variables analysed for each anaerobic digestion output technology is
shown in Table 2. Further details on the crop-specific variables and underlying calculations
are provided in the ‘Variables calculations’ worksheet of the complementing Microsoft Excel
file.
Table 2. Variables for sensitivity analysis
Variable Scenario Value
All outputs
Crop yield
Default B2C2 default yield
High +20%
Low -20%
Very Low -50%
Fertiliser application Default B2C2 default yield
High +20% Nitrogen application
3 https://www.ofgem.gov.uk/publications-and-updates/uk-solid-and-gaseous-biomass-carbon-calculator
4 While ordinarily delivered heat will be of a lower temperature than 150°C, this temperature is used as a
minimum value for emission allocations between heat and power, in accordance with RHI guidance
Impact on biogas producers of proposed changes to sustainability criteria (16-015.6), Page 7 of 24
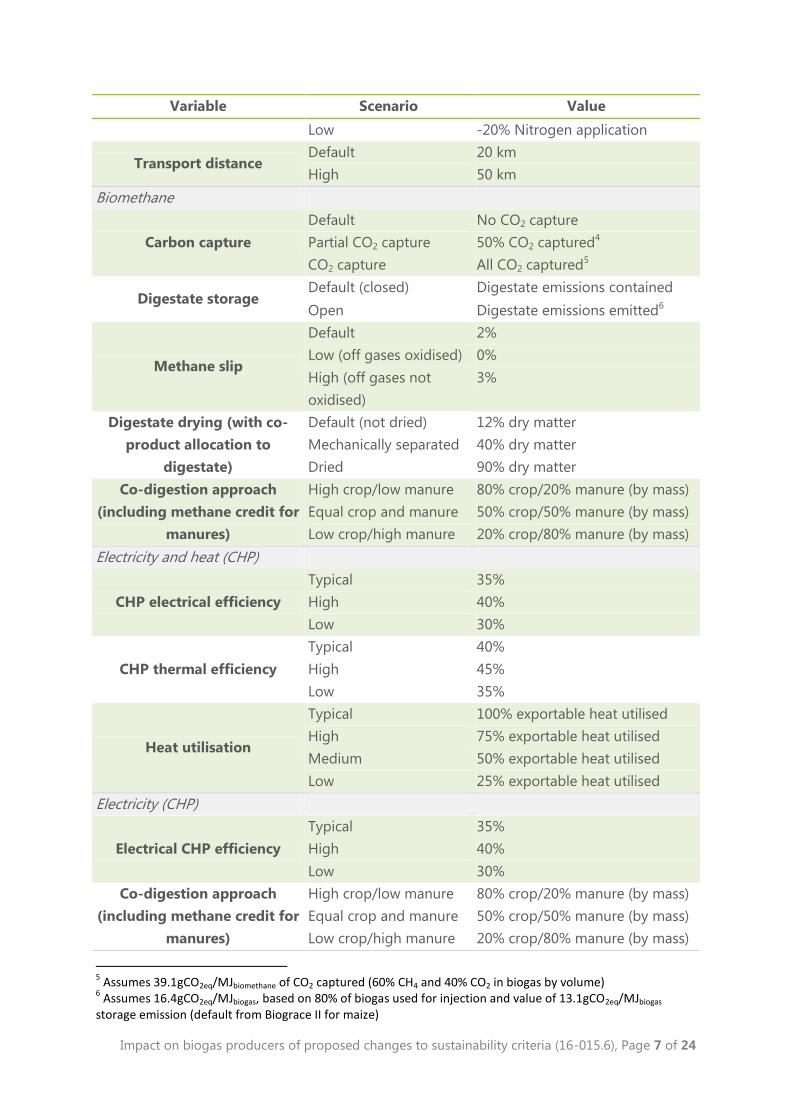
Variable Scenario Value
Low -20% Nitrogen application
Transport distance Default 20 km
High 50 km
Biomethane
Carbon capture
Default No CO2 capture
Partial CO2 capture 50% CO2 captured4
CO2 capture All CO2 captured5
Digestate storage Default (closed) Digestate emissions contained
Open Digestate emissions emitted6
Methane slip
Default 2%
Low (off gases oxidised) 0%
High (off gases not
oxidised)
3%
Digestate drying (with co-
product allocation to
digestate)
Default (not dried) 12% dry matter
Mechanically separated 40% dry matter
Dried 90% dry matter
Co-digestion approach
(including methane credit for
manures)
High crop/low manure 80% crop/20% manure (by mass)
Equal crop and manure 50% crop/50% manure (by mass)
Low crop/high manure 20% crop/80% manure (by mass)
Electricity and heat (CHP)
CHP electrical efficiency
Typical 35%
High 40%
Low 30%
CHP thermal efficiency
Typical 40%
High 45%
Low 35%
Heat utilisation
Typical 100% exportable heat utilised
High 75% exportable heat utilised
Medium 50% exportable heat utilised
Low 25% exportable heat utilised
Electricity (CHP)
Electrical CHP efficiency
Typical 35%
High 40%
Low 30%
Co-digestion approach
(including methane credit for
manures)
High crop/low manure 80% crop/20% manure (by mass)
Equal crop and manure 50% crop/50% manure (by mass)
Low crop/high manure 20% crop/80% manure (by mass)
5 Assumes 39.1gCO2eq/MJbiomethane of CO2 captured (60% CH4 and 40% CO2 in biogas by volume)
6 Assumes 16.4gCO2eq/MJbiogas, based on 80% of biogas used for injection and value of 13.1gCO2eq/MJbiogas
storage emission (default from Biograce II for maize)
Impact on biogas producers of proposed changes to sustainability criteria (16-015.6), Page 8 of 24
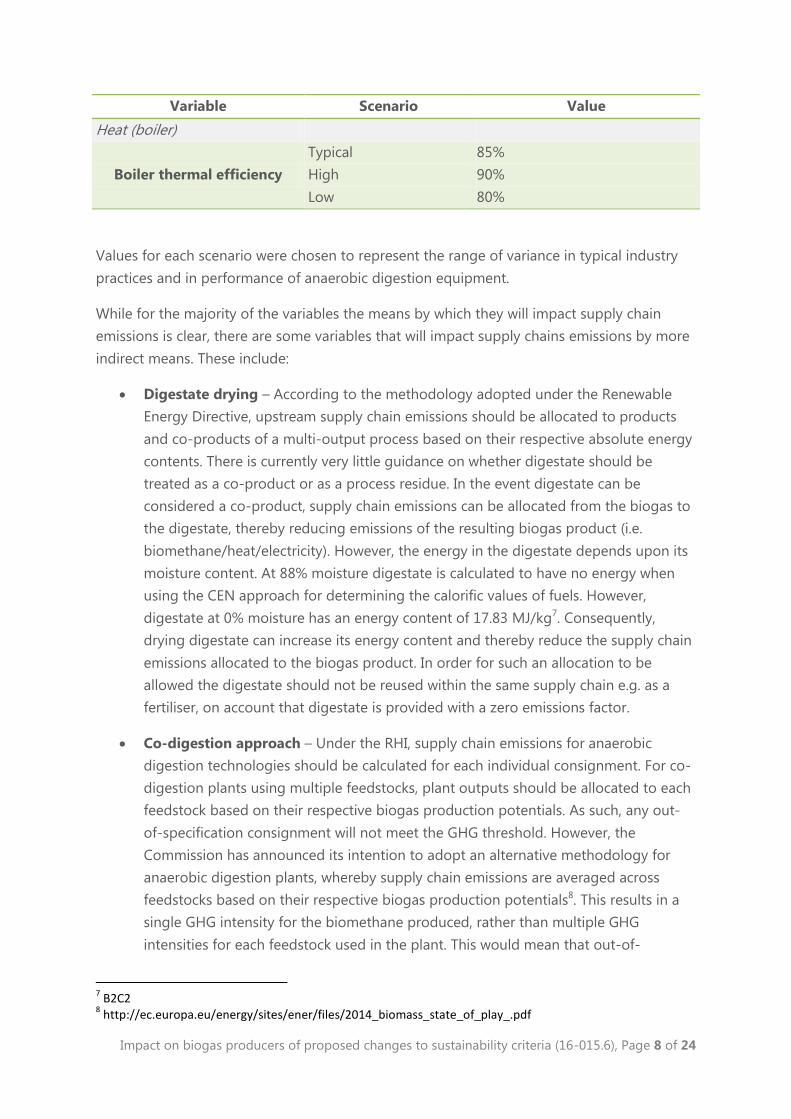
Variable Scenario Value
Heat (boiler)
Boiler thermal efficiency
Typical 85%
High 90%
Low 80%
Values for each scenario were chosen to represent the range of variance in typical industry
practices and in performance of anaerobic digestion equipment.
While for the majority of the variables the means by which they will impact supply chain
emissions is clear, there are some variables that will impact supply chains emissions by more
indirect means. These include:
Digestate drying – According to the methodology adopted under the Renewable
Energy Directive, upstream supply chain emissions should be allocated to products
and co-products of a multi-output process based on their respective absolute energy
contents. There is currently very little guidance on whether digestate should be
treated as a co-product or as a process residue. In the event digestate can be
considered a co-product, supply chain emissions can be allocated from the biogas to
the digestate, thereby reducing emissions of the resulting biogas product (i.e.
biomethane/heat/electricity). However, the energy in the digestate depends upon its
moisture content. At 88% moisture digestate is calculated to have no energy when
using the CEN approach for determining the calorific values of fuels. However,
digestate at 0% moisture has an energy content of 17.83 MJ/kg7. Consequently,
drying digestate can increase its energy content and thereby reduce the supply chain
emissions allocated to the biogas product. In order for such an allocation to be
allowed the digestate should not be reused within the same supply chain e.g. as a
fertiliser, on account that digestate is provided with a zero emissions factor.
Co-digestion approach – Under the RHI, supply chain emissions for anaerobic
digestion technologies should be calculated for each individual consignment. For co-
digestion plants using multiple feedstocks, plant outputs should be allocated to each
feedstock based on their respective biogas production potentials. As such, any out-
of-specification consignment will not meet the GHG threshold. However, the
Commission has announced its intention to adopt an alternative methodology for
anaerobic digestion plants, whereby supply chain emissions are averaged across
feedstocks based on their respective biogas production potentials8. This results in a
single GHG intensity for the biomethane produced, rather than multiple GHG
intensities for each feedstock used in the plant. This would mean that out-of-
7 B2C2
8 http://ec.europa.eu/energy/sites/ener/files/2014_biomass_state_of_play_.pdf
Impact on biogas producers of proposed changes to sustainability criteria (16-015.6), Page 9 of 24
specification consignments could be balanced against consignments that perform
well below the threshold to enable all output to comply with the sustainability
criteria. This is notably important when considering the potential savings that can be
achieved through utilisation of manures/slurries, with the Commission proposing a
GHG credit of 45.05gCO2eq/MJ manure.
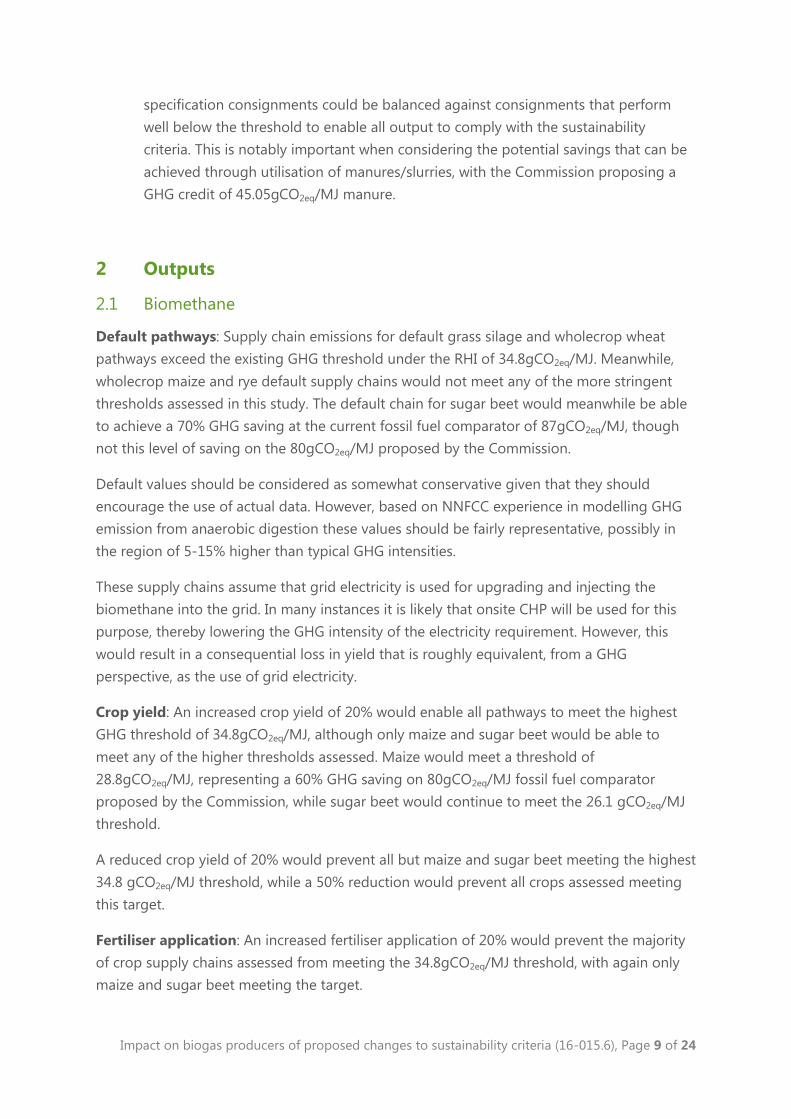
2 Outputs
2.1 Biomethane
Default pathways: Supply chain emissions for default grass silage and wholecrop wheat
pathways exceed the existing GHG threshold under the RHI of 34.8gCO2eq/MJ. Meanwhile,
wholecrop maize and rye default supply chains would not meet any of the more stringent
thresholds assessed in this study. The default chain for sugar beet would meanwhile be able
to achieve a 70% GHG saving at the current fossil fuel comparator of 87gCO2eq/MJ, though
not this level of saving on the 80gCO2eq/MJ proposed by the Commission.
Default values should be considered as somewhat conservative given that they should
encourage the use of actual data. However, based on NNFCC experience in modelling GHG
emission from anaerobic digestion these values should be fairly representative, possibly in
the region of 5-15% higher than typical GHG intensities.
These supply chains assume that grid electricity is used for upgrading and injecting the
biomethane into the grid. In many instances it is likely that onsite CHP will be used for this
purpose, thereby lowering the GHG intensity of the electricity requirement. However, this
would result in a consequential loss in yield that is roughly equivalent, from a GHG
perspective, as the use of grid electricity.
Crop yield: An increased crop yield of 20% would enable all pathways to meet the highest
GHG threshold of 34.8gCO2eq/MJ, although only maize and sugar beet would be able to
meet any of the higher thresholds assessed. Maize would meet a threshold of
28.8gCO2eq/MJ, representing a 60% GHG saving on 80gCO2eq/MJ fossil fuel comparator
proposed by the Commission, while sugar beet would continue to meet the 26.1 gCO2eq/MJ
threshold.
A reduced crop yield of 20% would prevent all but maize and sugar beet meeting the highest
34.8 gCO2eq/MJ threshold, while a 50% reduction would prevent all crops assessed meeting
this target.
Fertiliser application: An increased fertiliser application of 20% would prevent the majority
of crop supply chains assessed from meeting the 34.8gCO2eq/MJ threshold, with again only
maize and sugar beet meeting the target.
Impact on biogas producers of proposed changes to sustainability criteria (16-015.6), Page 10 of 24
Meanwhile, a reduced fertiliser application of 20% would have much the same impact on
supply chain emissions as a 20% increase in crop yield, with all pathways meeting the 34.8
gCO2eq/MJ threshold but only maize and sugar beet able to perform below any of the lower
targets.
Assuming a high fertiliser application rate has a very similar impact on pathway GHG
emissions as a low crop yield, as does assuming a low fertiliser application rate compared to
a high crop yield. This is because the relative use of nitrogen per tonne of feedstock is the
most important factor in determining cultivation emissions.
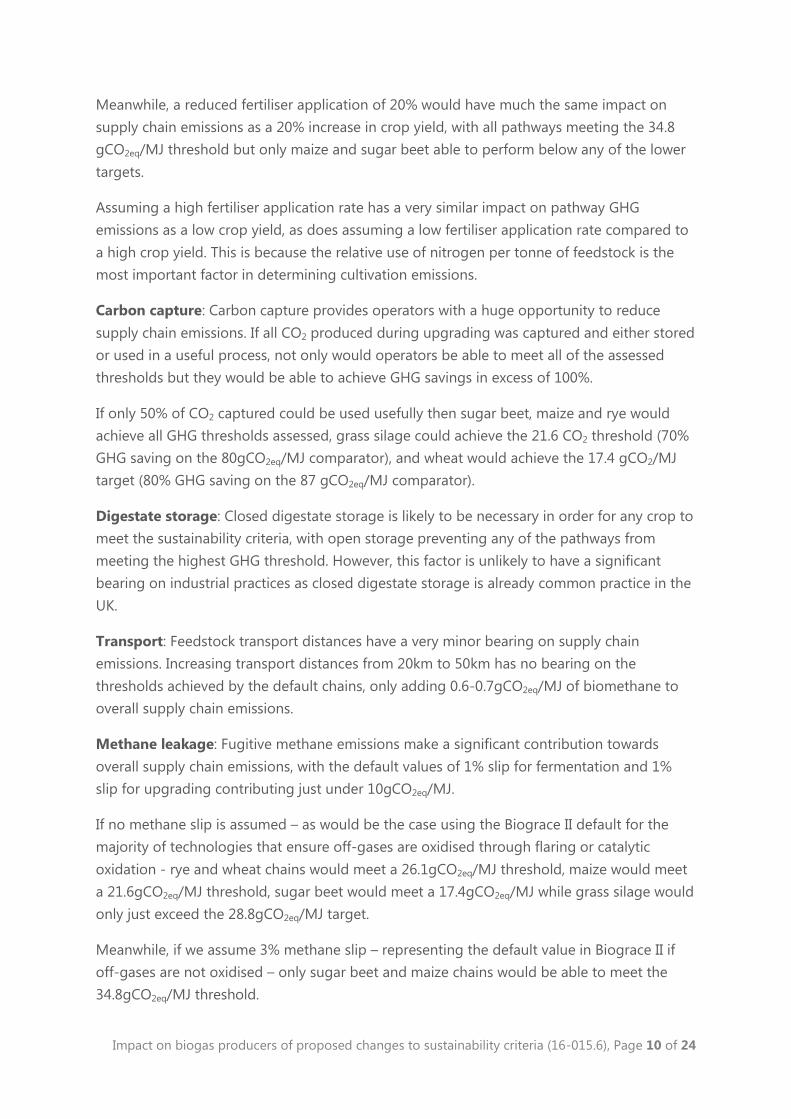
Carbon capture: Carbon capture provides operators with a huge opportunity to reduce
supply chain emissions. If all CO2 produced during upgrading was captured and either stored
or used in a useful process, not only would operators be able to meet all of the assessed
thresholds but they would be able to achieve GHG savings in excess of 100%.
If only 50% of CO2 captured could be used usefully then sugar beet, maize and rye would
achieve all GHG thresholds assessed, grass silage could achieve the 21.6 CO2 threshold (70%
GHG saving on the 80gCO2eq/MJ comparator), and wheat would achieve the 17.4 gCO2/MJ
target (80% GHG saving on the 87 gCO2eq/MJ comparator).
Digestate storage: Closed digestate storage is likely to be necessary in order for any crop to
meet the sustainability criteria, with open storage preventing any of the pathways from
meeting the highest GHG threshold. However, this factor is unlikely to have a significant
bearing on industrial practices as closed digestate storage is already common practice in the
UK.
Transport: Feedstock transport distances have a very minor bearing on supply chain
emissions. Increasing transport distances from 20km to 50km has no bearing on the
thresholds achieved by the default chains, only adding 0.6-0.7gCO2eq/MJ of biomethane to
overall supply chain emissions.
Methane leakage: Fugitive methane emissions make a significant contribution towards
overall supply chain emissions, with the default values of 1% slip for fermentation and 1%
slip for upgrading contributing just under 10gCO2eq/MJ.
If no methane slip is assumed – as would be the case using the Biograce II default for the
majority of technologies that ensure off-gases are oxidised through flaring or catalytic
oxidation - rye and wheat chains would meet a 26.1gCO2eq/MJ threshold, maize would meet
a 21.6gCO2eq/MJ threshold, sugar beet would meet a 17.4gCO2eq/MJ while grass silage would
only just exceed the 28.8gCO2eq/MJ target.
Meanwhile, if we assume 3% methane slip – representing the default value in Biograce II if
off-gases are not oxidised – only sugar beet and maize chains would be able to meet the
34.8gCO2eq/MJ threshold.
Impact on biogas producers of proposed changes to sustainability criteria (16-015.6), Page 11 of 24
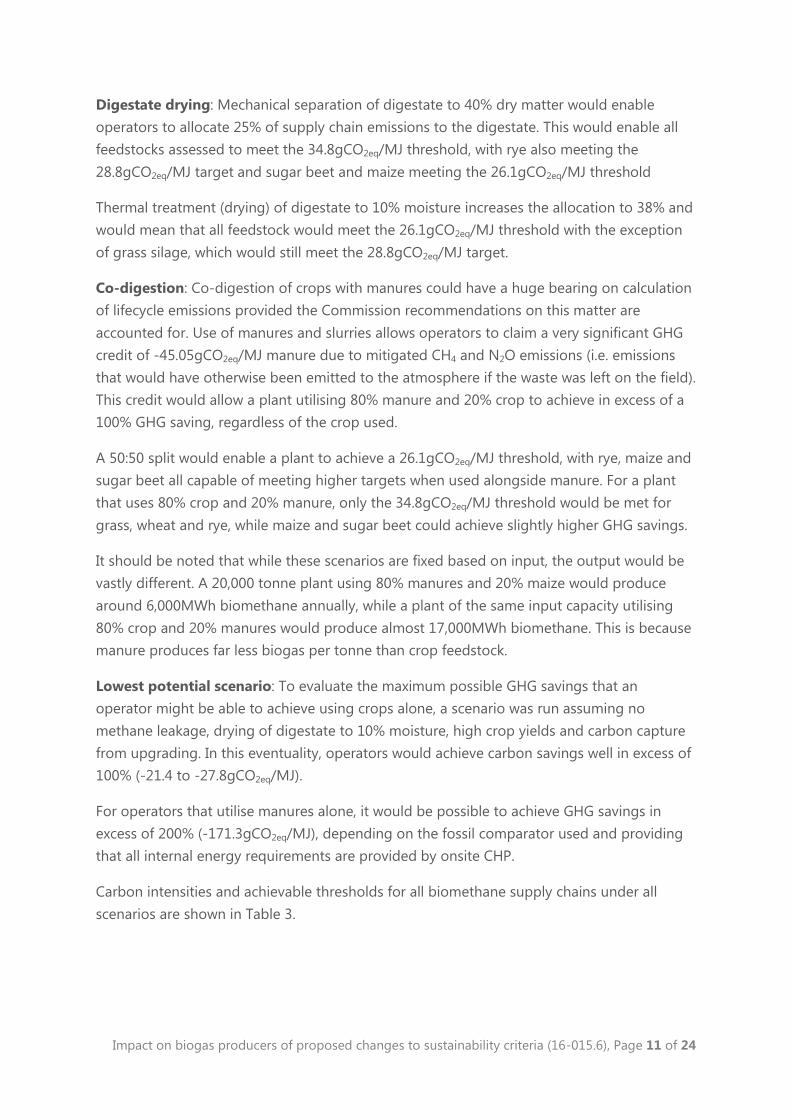
Digestate drying: Mechanical separation of digestate to 40% dry matter would enable
operators to allocate 25% of supply chain emissions to the digestate. This would enable all
feedstocks assessed to meet the 34.8gCO2eq/MJ threshold, with rye also meeting the
28.8gCO2eq/MJ target and sugar beet and maize meeting the 26.1gCO2eq/MJ threshold
Thermal treatment (drying) of digestate to 10% moisture increases the allocation to 38% and
would mean that all feedstock would meet the 26.1gCO2eq/MJ threshold with the exception
of grass silage, which would still meet the 28.8gCO2eq/MJ target.
Co-digestion: Co-digestion of crops with manures could have a huge bearing on calculation
of lifecycle emissions provided the Commission recommendations on this matter are
accounted for. Use of manures and slurries allows operators to claim a very significant GHG
credit of -45.05gCO2eq/MJ manure due to mitigated CH4 and N2O emissions (i.e. emissions
that would have otherwise been emitted to the atmosphere if the waste was left on the field).
This credit would allow a plant utilising 80% manure and 20% crop to achieve in excess of a
100% GHG saving, regardless of the crop used.
A 50:50 split would enable a plant to achieve a 26.1gCO2eq/MJ threshold, with rye, maize and
sugar beet all capable of meeting higher targets when used alongside manure. For a plant
that uses 80% crop and 20% manure, only the 34.8gCO2eq/MJ threshold would be met for
grass, wheat and rye, while maize and sugar beet could achieve slightly higher GHG savings.
It should be noted that while these scenarios are fixed based on input, the output would be
vastly different. A 20,000 tonne plant using 80% manures and 20% maize would produce
around 6,000MWh biomethane annually, while a plant of the same input capacity utilising
80% crop and 20% manures would produce almost 17,000MWh biomethane. This is because
manure produces far less biogas per tonne than crop feedstock.
Lowest potential scenario: To evaluate the maximum possible GHG savings that an
operator might be able to achieve using crops alone, a scenario was run assuming no
methane leakage, drying of digestate to 10% moisture, high crop yields and carbon capture
from upgrading. In this eventuality, operators would achieve carbon savings well in excess of
100% (-21.4 to -27.8gCO2eq/MJ).
For operators that utilise manures alone, it would be possible to achieve GHG savings in
excess of 200% (-171.3gCO2eq/MJ), depending on the fossil comparator used and providing
that all internal energy requirements are provided by onsite CHP.
Carbon intensities and achievable thresholds for all biomethane supply chains under all
scenarios are shown in Table 3.
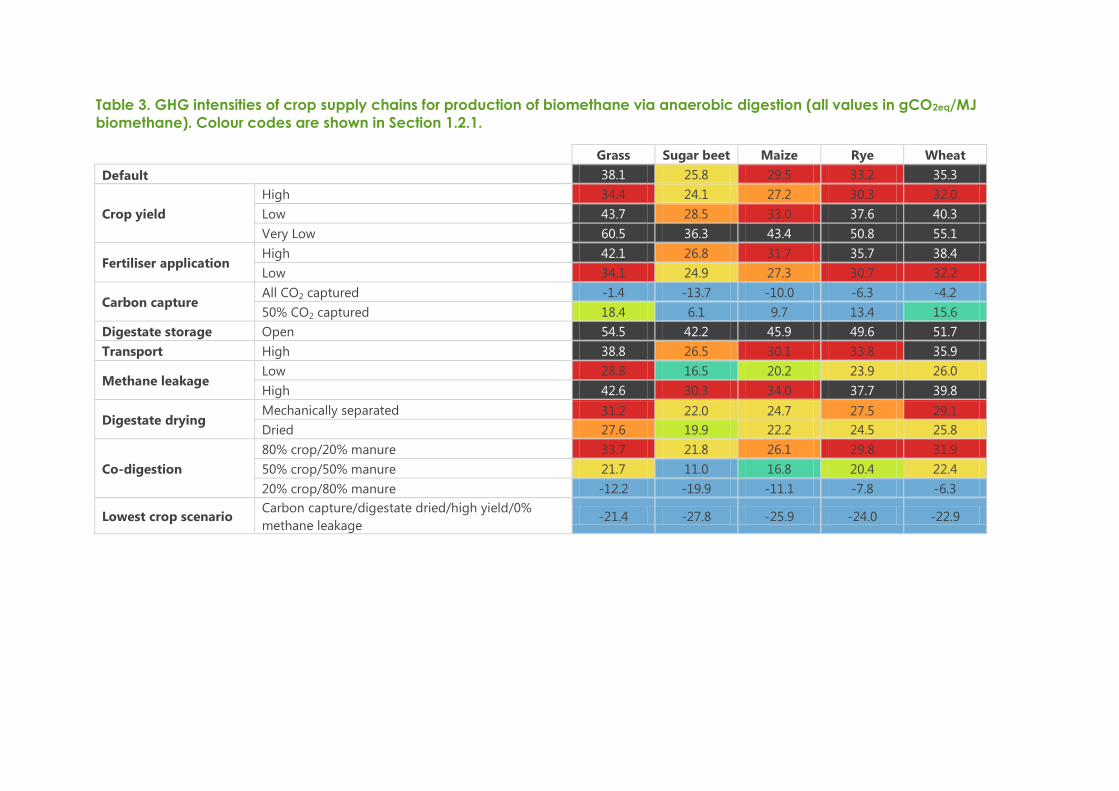
Table 3. GHG intensities of crop supply chains for production of biomethane via anaerobic digestion (all values in gCO2eq/MJ
biomethane). Colour codes are shown in Section 1.2.1.
Grass Sugar beet Maize Rye Wheat
Default 38.1 25.8 29.5 33.2 35.3
Crop yield
High 34.4 24.1 27.2 30.3 32.0
Low 43.7 28.5 33.0 37.6 40.3
Very Low 60.5 36.3 43.4 50.8 55.1
Fertiliser application High 42.1 26.8 31.7 35.7 38.4
Low 34.1 24.9 27.3 30.7 32.2
Carbon capture All CO2 captured -1.4 -13.7 -10.0 -6.3 -4.2
50% CO2 captured 18.4 6.1 9.7 13.4 15.6
Digestate storage Open 54.5 42.2 45.9 49.6 51.7
Transport High 38.8 26.5 30.1 33.8 35.9
Methane leakage Low 28.8 16.5 20.2 23.9 26.0
High 42.6 30.3 34.0 37.7 39.8
Digestate drying Mechanically separated 31.2 22.0 24.7 27.5 29.1
Dried 27.6 19.9 22.2 24.5 25.8
Co-digestion
80% crop/20% manure 33.7 21.8 26.1 29.8 31.9
50% crop/50% manure 21.7 11.0 16.8 20.4 22.4
20% crop/80% manure -12.2 -19.9 -11.1 -7.8 -6.3
Lowest crop scenario Carbon capture/digestate dried/high yield/0%
methane leakage -21.4 -27.8 -25.9 -24.0 -22.9
2.2 CHP; electricity only
Default pathways: All default pathways for production of electricity from anaerobic
digestion (35% electrical efficiency; no exported heat) would meet the current GHG threshold
under the RO for plants operating prior to April 2013 of 79.2gCO2eq/MJ. Wholecrop rye and
wheat would be able to meet a 60% GHG saving on the proposed EU fossil comparator for
electricity (74.4gCO2eq/MJ). However, wheat – along with grass silage -would not meet the
current threshold under the RO for ‘post-2013 dedicated biomass stations’ of 66.7gCO2eq/MJ.
Maize and sugar beet would offer further improvements, able to meet a 70% GHG saving on
the proposed EU fossil comparator (55.8gCO2eq/MJ threshold).
Crop yield: High crop yields (+20%) would enable all crops to meet a 74.4gCO2eq/MJ
threshold, with grass silage, wholecrop wheat, rye and sugar beet all able to meet a higher
GHG threshold than their respective default chains.
In the event of a low crop yield (-20%), neither grass nor wheat would meet the RO GHG
threshold. Wholecrop rye would only just achieve this target, while maize and sugar beet
would continue to meet lower thresholds. A very low yield (-50%) would prevent all but
sugar beet from meeting the highest GHG threshold assessed.
Fertiliser application: A high nitrogen fertiliser application rate (+20%) would prevent
wholecrop rye and grass from meeting the RO GHG threshold, while sugar beet, maize and
rye would continue to meet a 74.4gCO2eq/MJ target. Meanwhile, a low fertiliser application
rate would enable all pathways to achieve the 74.4gCO2eq/MJ threshold, with sugar beet,
maize and rye all capable of meeting lower thresholds. In similarity to the impact on
biomethane supply chains, a high fertiliser impact has a very similar impact on GHG
emissions as assuming a low crop yield (and vice versa).
Transport: Increasing feedstock transport distances to 50km has a small impact on overall
supply chain emissions. However, the default chain for grass silage is close enough to the
current RO GHG threshold that a high transport distance would push supply chain emissions
above the 79.2gCO2eq/MJ target.
Co-digestion: Co-digestion would have a significant impact on the GHG performance of
anaerobic digestion plants producing electricity, provided that the Commission approach is
adopted. Any plant using 50% manures (by mass) and above would meet the lowest
threshold of 37.2gCO2eq/MJ regardless of crop used; use of 80% manures would achieve
carbon savings well in excess of 100%. At 20% manure and 80% crop grass and wheat would
only meet the 74.4gCO2eq/MJ threshold, maize and rye the 55.8gCO2eq/MJ threshold and
sugar beet the lowest 37.2gCO2eq/MJ target.
End use efficiency: A high end use electrical efficiency (40%) typically reduces supply chain
GHG intensities by around 10-20gCO2eq/MJ. The vast majority of scenarios would then meet
Impact on biogas producers of proposed changes to sustainability criteria (16-015.6), Page 14 of 24
a GHG threshold of 74.4gCO2eq/MJ with the exception of those assuming very low crop
yields.
Conversely, poor end use efficiency (30%) will typically add 10-20gCO2eq/MJ to overall
emissions, preventing the majority of grass silage and wheat supply chains meeting the
highest threshold of 79.2gCO2eq/MJ under the scenarios analysed.
Carbon intensities and achievable thresholds for all supply chains under all electricity from
CHP scenarios are shown in Table 4.
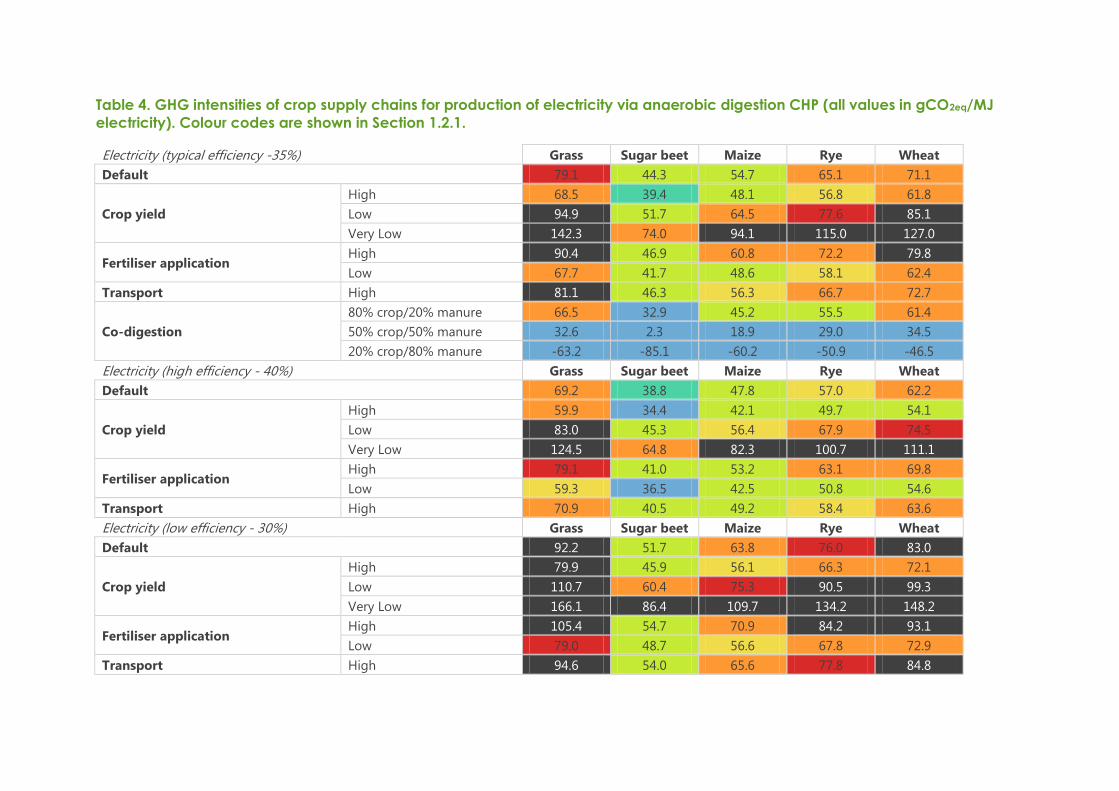
Table 4. GHG intensities of crop supply chains for production of electricity via anaerobic digestion CHP (all values in gCO2eq/MJ
electricity). Colour codes are shown in Section 1.2.1.
Electricity (typical efficiency -35%) Grass Sugar beet Maize Rye Wheat
Default 79.1 44.3 54.7 65.1 71.1
Crop yield
High 68.5 39.4 48.1 56.8 61.8
Low 94.9 51.7 64.5 77.6 85.1
Very Low 142.3 74.0 94.1 115.0 127.0
Fertiliser application High 90.4 46.9 60.8 72.2 79.8
Low 67.7 41.7 48.6 58.1 62.4
Transport High 81.1 46.3 56.3 66.7 72.7
Co-digestion
80% crop/20% manure 66.5 32.9 45.2 55.5 61.4
50% crop/50% manure 32.6 2.3 18.9 29.0 34.5
20% crop/80% manure -63.2 -85.1 -60.2 -50.9 -46.5
Electricity (high efficiency - 40%) Grass Sugar beet Maize Rye Wheat
Default 69.2 38.8 47.8 57.0 62.2
Crop yield
High 59.9 34.4 42.1 49.7 54.1
Low 83.0 45.3 56.4 67.9 74.5
Very Low 124.5 64.8 82.3 100.7 111.1
Fertiliser application High 79.1 41.0 53.2 63.1 69.8
Low 59.3 36.5 42.5 50.8 54.6
Transport High 70.9 40.5 49.2 58.4 63.6
Electricity (low efficiency - 30%) Grass Sugar beet Maize Rye Wheat
Default 92.2 51.7 63.8 76.0 83.0
Crop yield
High 79.9 45.9 56.1 66.3 72.1
Low 110.7 60.4 75.3 90.5 99.3
Very Low 166.1 86.4 109.7 134.2 148.2
Fertiliser application High 105.4 54.7 70.9 84.2 93.1
Low 79.0 48.7 56.6 67.8 72.9
Transport High 94.6 54.0 65.6 77.8 84.8
2.3 CHP; electricity and heat
Default pathways: Anaerobic digestion supply chains using CHP will typically find it easier
to meet the GHG thresholds than any other technology, despite the total energy in the
products (electricity and heat) being less (75% of energy in biogas) than if upgrading the
biomethane (99% of energy in biogas) or producing heat alone (85% of energy in biogas).
This can be explained by the following:
While upgrading to biomethane harnesses more energy from the biogas than CHP, it
also produces more emissions due to energy required for compression and
additional methane slip during the process.
While the production of heat also harnesses more energy from the biogas, allocation
of emissions for CHP depends upon the useful amount of work that can be
performed by the heat which is less than the thermal output - 35% when heat is
delivered at 150°C. This means that for a plant exporting equal power output and
thermal output, 74% of supply chain emissions are allocated to electricity and 26%
allocated to heat. Therefore, even though the end use thermal efficiency for CHP
(40%) is far lower than for heat only (85%), the low heat emission allocation factor
typically results in lower supply chain emissions for producing heat from CHP than
from a boiler.
While electricity is burdened by a greater share of the supply chain emissions for
CHP, the end use efficiency is the same as if the plant produced only electricity. Using
the above allocation, a CHP plant exporting equal power output and thermal output
would allocate 65% of supply chain emissions to the electricity, while for electricity
only it would allocate 100% of supply chain emissions to the electricity.
Default supply chains for CHP where all exportable heat is utilised would meet thresholds
below those currently adopted in the RO and RHI. For heat, all default pathways would meet
a threshold of 24.0gCO2eq/MJ with both sugar beet and maize achieving the lowest threshold
assessed of 16gCO2eq/MJ. For electricity, all default pathways would meet a threshold of
59.4gCO2eq/MJ with rye and wheat achieving a lower threshold of 59.4gCO2eq/MJ and maize
and sugar beet capable of meeting even lower targets.
Crop yield: An increased crop yield of 20% would enable all pathways to meet the lowest
threshold of 16gCO2eq/MJ for heat with the exception of grass silage which would meet the
higher 24.0gCO2eq/MJ target. Meanwhile, all pathways for electricity would meet the
55.8gCO2eq/MJ threshold, with maize and sugar beet achieving the lowest threshold for
electricity of 37.2gCO2eq/MJ.
Impact on biogas producers of proposed changes to sustainability criteria (16-015.6), Page 17 of 24
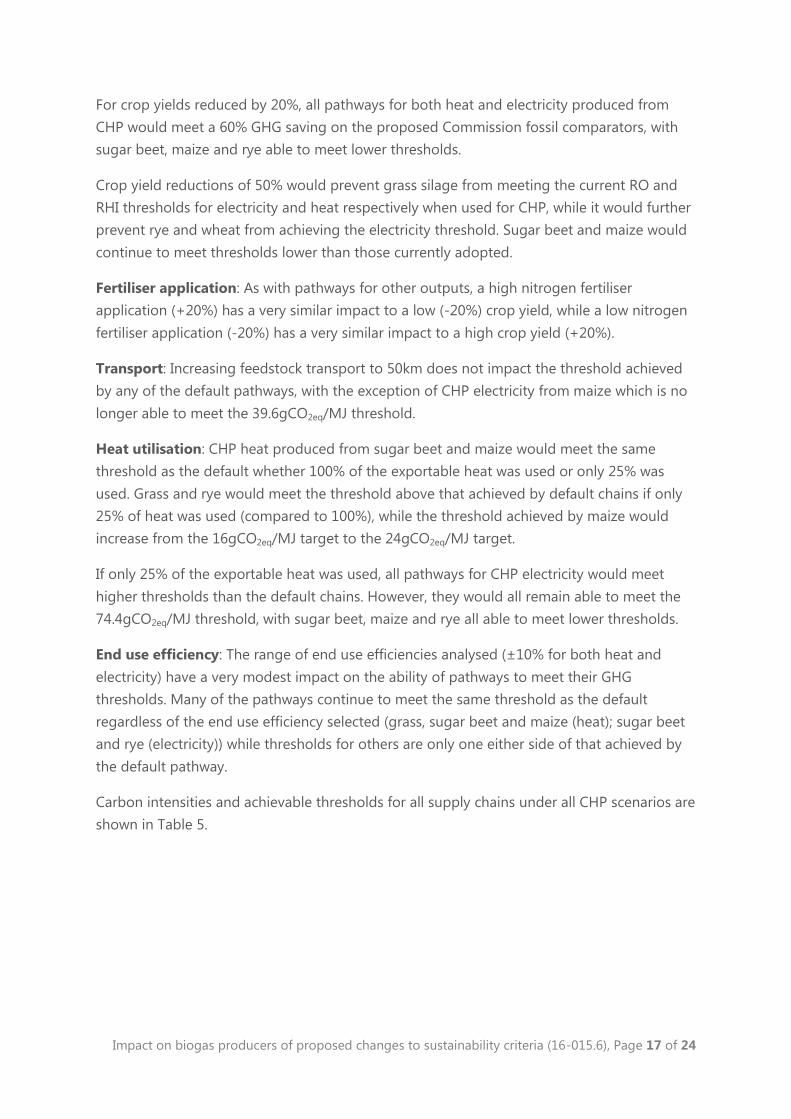
For crop yields reduced by 20%, all pathways for both heat and electricity produced from
CHP would meet a 60% GHG saving on the proposed Commission fossil comparators, with
sugar beet, maize and rye able to meet lower thresholds.
Crop yield reductions of 50% would prevent grass silage from meeting the current RO and
RHI thresholds for electricity and heat respectively when used for CHP, while it would further
prevent rye and wheat from achieving the electricity threshold. Sugar beet and maize would
continue to meet thresholds lower than those currently adopted.
Fertiliser application: As with pathways for other outputs, a high nitrogen fertiliser
application (+20%) has a very similar impact to a low (-20%) crop yield, while a low nitrogen
fertiliser application (-20%) has a very similar impact to a high crop yield (+20%).
Transport: Increasing feedstock transport to 50km does not impact the threshold achieved
by any of the default pathways, with the exception of CHP electricity from maize which is no
longer able to meet the 39.6gCO2eq/MJ threshold.
Heat utilisation: CHP heat produced from sugar beet and maize would meet the same
threshold as the default whether 100% of the exportable heat was used or only 25% was
used. Grass and rye would meet the threshold above that achieved by default chains if only
25% of heat was used (compared to 100%), while the threshold achieved by maize would
increase from the 16gCO2eq/MJ target to the 24gCO2eq/MJ target.
If only 25% of the exportable heat was used, all pathways for CHP electricity would meet
higher thresholds than the default chains. However, they would all remain able to meet the
74.4gCO2eq/MJ threshold, with sugar beet, maize and rye all able to meet lower thresholds.
End use efficiency: The range of end use efficiencies analysed (±10% for both heat and
electricity) have a very modest impact on the ability of pathways to meet their GHG
thresholds. Many of the pathways continue to meet the same threshold as the default
regardless of the end use efficiency selected (grass, sugar beet and maize (heat); sugar beet
and rye (electricity)) while thresholds for others are only one either side of that achieved by
the default pathway.
Carbon intensities and achievable thresholds for all supply chains under all CHP scenarios are
shown in Table 5.
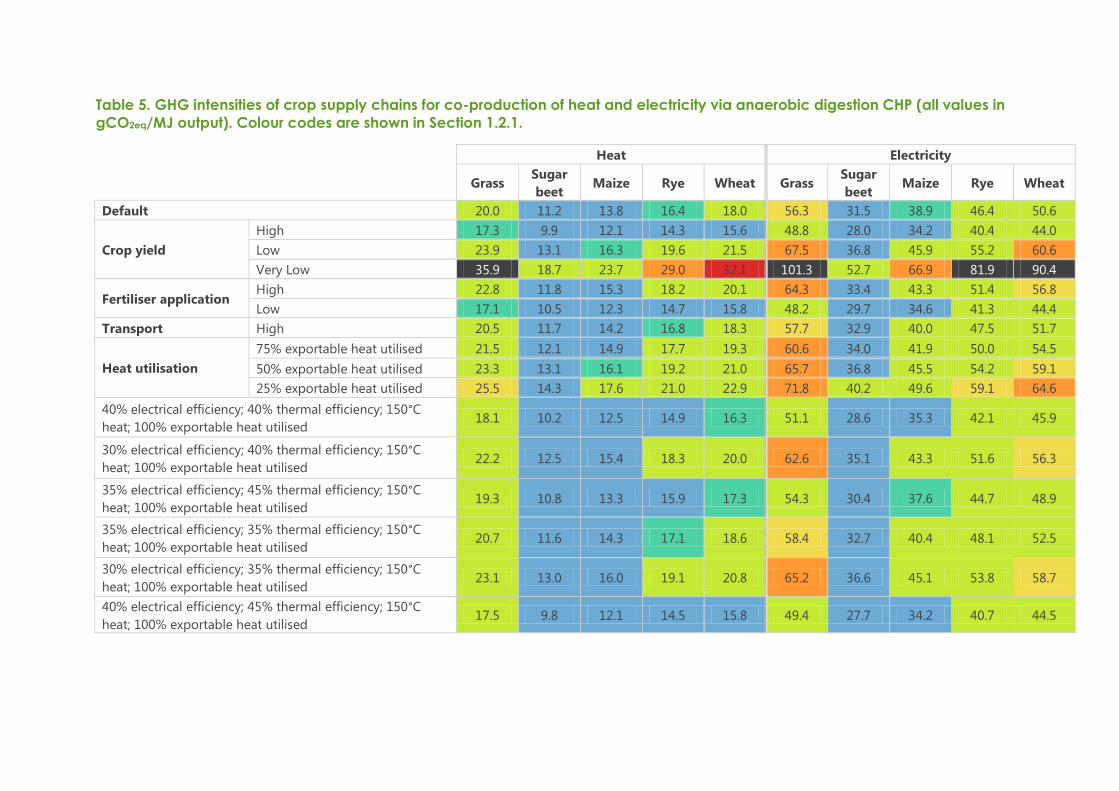
Table 5. GHG intensities of crop supply chains for co-production of heat and electricity via anaerobic digestion CHP (all values in
gCO2eq/MJ output). Colour codes are shown in Section 1.2.1.
Heat Electricity
Grass Sugar
beet Maize Rye Wheat Grass
Sugar
beet Maize Rye Wheat
Default 20.0 11.2 13.8 16.4 18.0 56.3 31.5 38.9 46.4 50.6
Crop yield
High 17.3 9.9 12.1 14.3 15.6 48.8 28.0 34.2 40.4 44.0
Low 23.9 13.1 16.3 19.6 21.5 67.5 36.8 45.9 55.2 60.6
Very Low 35.9 18.7 23.7 29.0 32.1 101.3 52.7 66.9 81.9 90.4
Fertiliser application High 22.8 11.8 15.3 18.2 20.1 64.3 33.4 43.3 51.4 56.8
Low 17.1 10.5 12.3 14.7 15.8 48.2 29.7 34.6 41.3 44.4
Transport High 20.5 11.7 14.2 16.8 18.3 57.7 32.9 40.0 47.5 51.7
Heat utilisation
75% exportable heat utilised 21.5 12.1 14.9 17.7 19.3 60.6 34.0 41.9 50.0 54.5
50% exportable heat utilised 23.3 13.1 16.1 19.2 21.0 65.7 36.8 45.5 54.2 59.1
25% exportable heat utilised 25.5 14.3 17.6 21.0 22.9 71.8 40.2 49.6 59.1 64.6
40% electrical efficiency; 40% thermal efficiency; 150°C
heat; 100% exportable heat utilised 18.1 10.2 12.5 14.9 16.3 51.1 28.6 35.3 42.1 45.9
30% electrical efficiency; 40% thermal efficiency; 150°C
heat; 100% exportable heat utilised 22.2 12.5 15.4 18.3 20.0 62.6 35.1 43.3 51.6 56.3
35% electrical efficiency; 45% thermal efficiency; 150°C
heat; 100% exportable heat utilised 19.3 10.8 13.3 15.9 17.3 54.3 30.4 37.6 44.7 48.9
35% electrical efficiency; 35% thermal efficiency; 150°C
heat; 100% exportable heat utilised 20.7 11.6 14.3 17.1 18.6 58.4 32.7 40.4 48.1 52.5
30% electrical efficiency; 35% thermal efficiency; 150°C
heat; 100% exportable heat utilised 23.1 13.0 16.0 19.1 20.8 65.2 36.6 45.1 53.8 58.7
40% electrical efficiency; 45% thermal efficiency; 150°C
heat; 100% exportable heat utilised 17.5 9.8 12.1 14.5 15.8 49.4 27.7 34.2 40.7 44.5
2.4 Boiler; heat only
Default pathways: All default pathways for heat from anaerobic digestion (85% thermal
efficiency) are able to meet the 34.8gCO2eq/MJ threshold under the RHI, with rye and wheat
able to meet a 60% GHG saving on the proposed EU fossil comparator for heat
(32.0gCO2eq/MJ) and maize and sugar beet able to meet a 70% GHG saving on the proposed
EU fossil comparator (24.0gCO2eq/MJ).
Crop yield: A high crop yield (+20%) would enable grass silage pathways to meet the
32.0gCO2eq/MJ threshold, while pathways for wheat, rye and sugar beet would all be able
meet higher thresholds than their respective default chains.
A low crop yield (-20%) would prevent both grass silage and wheat pathways from meeting
the 34.8gCO2eq/MJ threshold under the RHI. Maize and rye would still be able to meet a
32.0gCO2eq/MJ threshold while sugar beet would meet a 24.0gCO2eq/MJ target. When
assuming very low yields (-50%) only sugar beet could meet the RHI threshold, with all other
crops failing to meet this target.
Fertiliser application: As is the case for all other technologies, high nitrogen fertiliser
application scenarios provide similar supply chain emissions to low crop yield scenario and
vice versa. The only significantly different outcome would be for wheat with a high nitrogen
application rate where the 34.4gCO2eq/MJ threshold would be achieved (which it would not
be for the low yield scenario).
Transport: Increasing feedstock transport to 50km does not impact the threshold achieved
by any of the default chains.
End use efficiency: Adjusting the end use efficiency by 5% away from the typical value has a
far lesser impact on overall GHG emissions than it does for electricity on account that,
relatively, it represents a smaller increase/decrease in efficiency. As such, the thresholds
achieved under the high efficiency or low efficiency scenarios are not largely different to
those when assuming a typical efficiency.
Carbon intensities and achievable thresholds for all supply chains under all heat-only
scenarios are shown in Table 6.
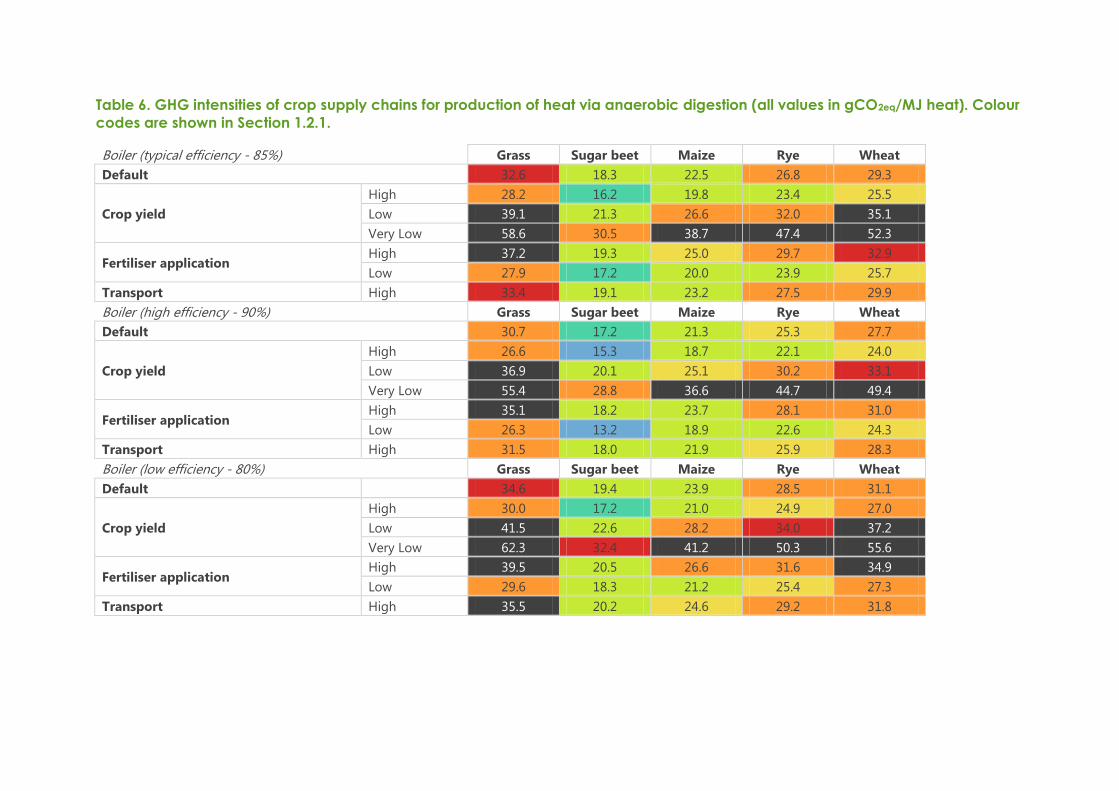
Table 6. GHG intensities of crop supply chains for production of heat via anaerobic digestion (all values in gCO2eq/MJ heat). Colour
codes are shown in Section 1.2.1.
Boiler (typical efficiency - 85%) Grass Sugar beet Maize Rye Wheat
Default 32.6 18.3 22.5 26.8 29.3
Crop yield
High 28.2 16.2 19.8 23.4 25.5
Low 39.1 21.3 26.6 32.0 35.1
Very Low 58.6 30.5 38.7 47.4 52.3
Fertiliser application High 37.2 19.3 25.0 29.7 32.9
Low 27.9 17.2 20.0 23.9 25.7
Transport High 33.4 19.1 23.2 27.5 29.9
Boiler (high efficiency - 90%) Grass Sugar beet Maize Rye Wheat
Default 30.7 17.2 21.3 25.3 27.7
Crop yield
High 26.6 15.3 18.7 22.1 24.0
Low 36.9 20.1 25.1 30.2 33.1
Very Low 55.4 28.8 36.6 44.7 49.4
Fertiliser application High 35.1 18.2 23.7 28.1 31.0
Low 26.3 13.2 18.9 22.6 24.3
Transport High 31.5 18.0 21.9 25.9 28.3
Boiler (low efficiency - 80%) Grass Sugar beet Maize Rye Wheat
Default 34.6 19.4 23.9 28.5 31.1
Crop yield
High 30.0 17.2 21.0 24.9 27.0
Low 41.5 22.6 28.2 34.0 37.2
Very Low 62.3 32.4 41.2 50.3 55.6
Fertiliser application High 39.5 20.5 26.6 31.6 34.9
Low 29.6 18.3 21.2 25.4 27.3
Transport High 35.5 20.2 24.6 29.2 31.8
3 Summary and discussion
3.1 Summary
When using default or proportionally adjusted cultivation values, sugar beet and maize
supply chains are typically able to achieve higher carbon savings than the other crops
assessed in this study, and in many circumstances will be able to meet a 70% GHG saving on
the EU fossil comparator for heat or electricity. Supply chains for grass silage are typically the
poorest performing due to an assumed high nitrogen demand relative to yield and fails to
meet even the highest thresholds under a substantial number of the scenarios assessed
outside of CHP.
Nitrogen fertiliser application and crop yields have a similarly important impact on supply
chain emissions. Assuming a low crop yield (-20%) or high fertilizer application rate (+20%)
typically increases overall supply chain emissions by 10-20%, while assuming a high crop
yield or low fertilizer application rate has the opposite effect. A very low crop yield (-50%)
would prevent many pathways from meeting even the highest GHG thresholds assessed,
although this is likely to be a very rare occurrence.
In the majority of instances, transport of feedstock has a negligible impact on overall supply
chain emissions when considering realistic journey distances.
Carbon capture and storage/utilisation largely negates any other supply chain variables as it
would allow almost any pathway to meet the lowest GHG thresholds assessed in this study,
provided that a significant amount of the CO2 produced was captured and either stored or
used in a suitable application.
Co-digestion provides a valuable means to reduce GHG emissions of plants although this
approach is only likely to have meaningful impact when used in significant volumes e.g.
above 20% total plant tonnage. While some smaller plants (<250kWe output or equivalent)
might use such a feedstock profile, this is unlikely to be the case for the vast majority of
larger plants (>500kWe output or equivalent). This is because the provision of such an
output would require the digestion of very large volume of manures that would typically not
be available onsite or nearby.
3.2 Discussion
This analysis demonstrates that use of CHP provides the easiest means for AD operators to
meet the existing GHG thresholds under the RHI and RO, provided that at least some of the
exportable heat can be utilised. The vast majority of CHP pathways analysed in this study
would be able to meet a 70% GHG saving on the fossil comparators for heat and electricity
proposed by the Commission, both of which are lower than the comparators currently used
in the RHI and RO respectively.
Impact on biogas producers of proposed changes to sustainability criteria (16-015.6), Page 22 of 24
Meanwhile, achieving the RHI threshold for biomethane provides greatest difficulties, largely
on account of the significant energy requirements for upgrading and injection. In the event
that the fossil comparator changes from EU heat average to the marginal gas supply, as
proposed by the Commission, biomethane pathways would become even more difficult to
meet relative to the heat or electricity thresholds. However, if operators can demonstrate
that all off-gases are oxidised and the upgrading equipment does not result in fugitive
methane emissions (as is becoming more frequent with modern technologies) it is likely that
the criteria would not be significantly more difficult to meet than for heat and power.
The existing GHG thresholds for heat (34.8gCO2eq/MJ) and electricity (79.2gCO2eq/MJ) under
the RHI and RO largely correspond. It is not possible to provide a completely accurate
comparison on account that assumptions need to be made about end use efficiency to
compare the criteria. However, if a plant that exactly met the 34.8gCO2eq/MJ threshold under
the RHI when using an 85% efficient boiler was to instead install a CHP to export electricity
(with no heat export), it would require a 37.3% efficient engine to meet the 79.2gCO2eq/MJ
threshold under the RO. These efficiencies are both fairly typical of industry values,
suggesting that the targets are complementary. However, as thresholds under the RO
tighten over time it will become progressively more difficult to meet the electricity target
relative to the heat target.
The above calculations provide a basic means to ensure that GHG thresholds remain
complementary. However, this relies on making assumptions about end use efficiencies for
heat and power. For biomethane, further assumptions would need to be made regarding
downstream processing of the biogas.
Unless life cycle analysis (LCA) is adopted in policy using a strictly attributional approach -
whereby a uniform GHG threshold is placed on the fuel (e.g. biogas) used to produce the
final product (e.g. heat/electricity) rather than determining a GHG saving for each application
based on the assumed fossil product(s) displaced - it will not be possible to perfectly
harmonise sustainability criteria across the power sectors. This is because each sector (heat,
power or gas) needs to account for differing end use efficiencies and each uses a different
fossil fuel comparator. Additionally, comparators are liable to change over time as markets
evolve which could therefore disrupt any attempt to improve consistency of carbon
accounting across sectors.
A fully attributional approach to LCA in policy could improve cross-sector harmonisation,
enabling a threshold to be placed on the fuel used to produce the energy rather than the
energy itself9. As such, the biogas would have a consistent GHG threshold regardless of how
it is finally used. However, an important aspect of renewable energy policy is to understand
the impact of market interventions resulting from legislation. Because of this fact,
consequential approaches to LCA – whereby GHG savings are predicted based upon
9 Though such an approach would likely require further restrictions on minimum end use efficiency
Impact on biogas producers of proposed changes to sustainability criteria (16-015.6), Page 23 of 24
comparison to counterfactual scenarios (i.e. what would otherwise happen) - are becoming
more prevalent in Commission methodologies for carbon accounting. This is evidenced by
the recent attempts to model indirect land use change in the biofuel sector as well as many
of the approaches discussed in this study, such as developing emission factors for the
marginal energy supply and allowing carbon credits for manures and slurries used in
anaerobic digestion. While this progress will inevitably prove valuable in informing policy of
the potential real world carbon savings that could be achieved by bioenergy, it risks creating
greater uncertainty in the market and will likely disrupt attempts to harmonise sustainability
across sectors.

NNFCC
NNFCC is a leading international consultancy with expertise on the conversion of biomass to
bioenergy, biofuels and bio-based products.
NNFCC, Biocentre, Phone: +44 (0)1904 435182
York Science Park, Fax: +44 (0)1904 435345
Innovation Way, E: [email protected]
Heslington, York, Web: www.nnfcc.co.uk
YO10 5DG.