ASSESSMENT OF HABITAT USAGE BY WHITE- BELLIED HERON …
53
ASSESSMENT OF HABITAT USAGE BY WHITE- BELLIED HERON (ARDEA INSIGNIS) AT BURICHHU NESTING SITE (Vegetation Structure and Floristic Composition) A dissertation submitted in partial fulfilment of the requirements for the Bachelor of Science in Forestry Damber Kumar Ghemiray June 2016 Royal University of Bhutan College of Natural Resources LOBESA
Transcript of ASSESSMENT OF HABITAT USAGE BY WHITE- BELLIED HERON …

ASSESSMENT OF HABITAT USAGE BY WHITE-
BELLIED HERON (ARDEA INSIGNIS) AT
BURICHHU NESTING SITE
(Vegetation Structure and Floristic Composition)
A dissertation submitted in partial fulfilment of the requirements
for the Bachelor of Science in Forestry
Damber Kumar Ghemiray
June 2016
Royal University of Bhutan
College of Natural Resources
LOBESA

i
ACKNOWLEDGEMENTS
I am very grateful to the Royal Government of Bhutan and The Ministry of Agriculture and
forests in particular for allowing me to pursue my undergraduate studies. I am indeed indebted to
the following groups and individuals who contributed significantly to the success of my studies
without which this paper would not be made possible.
At the college, I would like to thank my Supervisor; Mr. Ugyen Dorji who has supported my
research works, continuously guided me during the entire study period and reviewed my paper. I
would also like to thank the CNR management for giving me an approval to take up this
research.
I am also thankful to Dr. Pema Wangda, Chief Forestry Officer, WMD, DoFPS for his
continuous support in conducting filed work, data analysis, encouragement, and for attending to
all my needs concerning this paper. I would also like to thank Mr. Dorji Gyaltshen, Research
Officer, WMD for his great support right from conducting field work to data analysis and for
helping me in identifying plant specimens.
At the RNR-RDC, Yusipang, I am indebted to Dr. Purana Bdr Chhetri, Program Officer, Mr.
Tshewang Dorji, Sr. Research Officer for their encouragement, guidance and support during
entire period of my study as well as in conducting this research. I am grateful to Mr. Cheten
Thinley, Research officer, RNR-RDC Yusipang and Mr. Phuntsho, Sr. Ranger, BWS for their
enthusiastic involvement and assistance during data collection. I am also grateful to managemet,
RNR-RDC, Yusipang for their full support during my study period.
I am deeply indebted to the Royal Society for Protection of Nature (RSPN), for the financial
assistance for my research work. My sincere thanks goes to Madam Rebecca Pradhan, RSPN for
her diligent support and making special time in identifying plant specimens beside her busy
schedule. Thanks to Indra Prashad Acharya and Sonam Tshering, RSPN,for their continuous
support and encouragement.
I would also like to express my gratitude to Soils and Plant Analytical Laboratory (SPAL),
Semtokha especially Mr. Jamyang, Chief Chemist and his team for the soil sample analysis
Lastly, I would like to thank my family, relatives and to many others whose names were not
reflected here due to limited space for their continuous support, encouragement.

ii
DECLARATION FORM
I declare that this is an original work and I have not committed, to my knowledge, any
academic dishonesty or resort to plagiarism in writing the dissertation. All the sources of
information and assistance received during the course of the study are duly acknowledged.
Student’s Signature:……………………… ………………………….

iii
ACRONYMS
CNR: College of Natural Resources
DoFPS: Department of Forests & Park Services
GPS: Global Positioning System
H’: Shannon’s Diversity Index
MoAF: Ministry of Agriculture & Forest
N: Species Richness
NE: North East
P: Plot
RBA: Relative Basl Area
RNR-RDC: Renewable Natural Resources Research & Development Centre
RSPN: Royal Society for Protection of Nature
SW: South West
TBA: Total Basal Area
WMD: Watershed Management Division
WBH: White Bellied-Heron

iv
ABSTRACT
The understanding of vegetation at Burichu, a nesting site of White-bellied Heron is
important for conservation and sustainable use of these forests. As a first step towards this goal
vegetation study was conducted to understand the floristic composition and structure along
slopes of Burichu, Punatsangchu basin. The survey covered North East and South East aspects
with 17 plots measuring 20 m by 20 m at an interval of 50 m along the gradient starting from 370
m a.s.l. to 770m m a.s.l. A total of 56 woody species belonging to 30 families and 59 herbaceous
species belonging to 24 families were recorded. The site was mainly dominated by deciduous
trees (65%) in lower to mid region of the study area while upper and ridge top was dominated by
Pinus roxburghii. The ground layers were mainly dominated by shrub (77%). The south west
facing slope had lower diversity of woody species with eleven (11) species from 8 families
compared to 15 species from14 families of north east aspect. Stem density, seedling density and
ground biomass were found significantly higher in NE aspect mainly due to higher humidity.
Based on dominants and floristic composition of the study site, the forest can be classified into
four types (i) Riverine type (ii) Deciduous broadleaved type (iii) Broadleaved-Pine transitional
type and (iv) the Chirpine type at the higher altitude respectively. The Nest of the White-bellied
Heron were found in three (3) locations on few remnant Chirpine trees found at steep slopes near
river banks. A detailed vegetation, climate and soil study is suggested to better understand
nesting habitat requirement and preferences by White-bellied Heron in other areas.
Keywords: Aspect, deciduous, floristic composition, nesting habitat, structure, vegetation.

v
TABLE OF CONTENTS
ACKNOWLEDGEMENTS ............................................................................................................. i
DECLARATION FORM ................................................................................................................ ii
ACRONYMS ................................................................................................................................. iii
ABSTRACT ................................................................................................................................... iv
CHAPTER ONE ............................................................................................................................. 1
Introduction ..................................................................................................................................... 1
1.1 Background ........................................................................................................................... 1
1.2 Rationale ............................................................................................................................... 2
1.3 Objectives: ............................................................................................................................ 3
1.4 Research Questions ............................................................................................................... 3
CHAPTER TWO ............................................................................................................................ 4
Literature Review............................................................................................................................ 4
2.1 Forest classification .............................................................................................................. 4
2.2 Structure and Composition of Forest .................................................................................... 5
2.3 Factors affecting Diversity and Structure ............................................................................. 6
2.4 White bellied Heron and its Nesting Habitat in Bhutan ....................................................... 6
2.5 Methods to study diversity and distribution of Plant communities ...................................... 7
CHAPTER THREE ........................................................................................................................ 8
Materials and Methods .................................................................................................................... 8
3.1 Study Area ............................................................................................................................ 8
3.2 Survey Method & Sampling design ...................................................................................... 8
3.3 Environmental survey (Soil) ............................................................................................... 10
3.4 Data Analysis ...................................................................................................................... 10
CHAPTER FOUR ......................................................................................................................... 12
Results & Discussion .................................................................................................................... 12

vi
4.1 Environmental Condition (Soil) .......................................................................................... 12
4.2 Floristic composition and the life-form distribution in two aspects ................................... 14
4.3. Forest classification along the altitudinal gradients ........................................................... 20
4.3.1 Type-I: Riverine Forests (<370 m a.s.l) ...................................................................... 21
4.3.3 Type- III: Broad leaved- Pine transitional (670-720 m a.s.l) ...................................... 22
4.3.4 Type- IV: Pine forest (>720 m a.s.l) ............................................................................ 22
4.4. Comparison of forest Structural features in two aspects ................................................... 23
4.5. Natural Regeneration status in two Aspects ...................................................................... 26
4.6. Ground layer Vegetation in SW and NE Aspects .............................................................. 31
4.7. Comparison of Ground vegetation between NE and SW aspect ....................................... 34
CONCLUSION ............................................................................................................................. 35
REFERENCES ............................................................................................................................. 36
APPENDICES .............................................................................................................................. 42
Form 1: Tree vegetation data collection form ........................................................................... 42
Form 2: Sapling and Seedling data collection sheet ................................................................. 43
Form 3: Ground vegetation data collection sheet ..................................................................... 44
vii
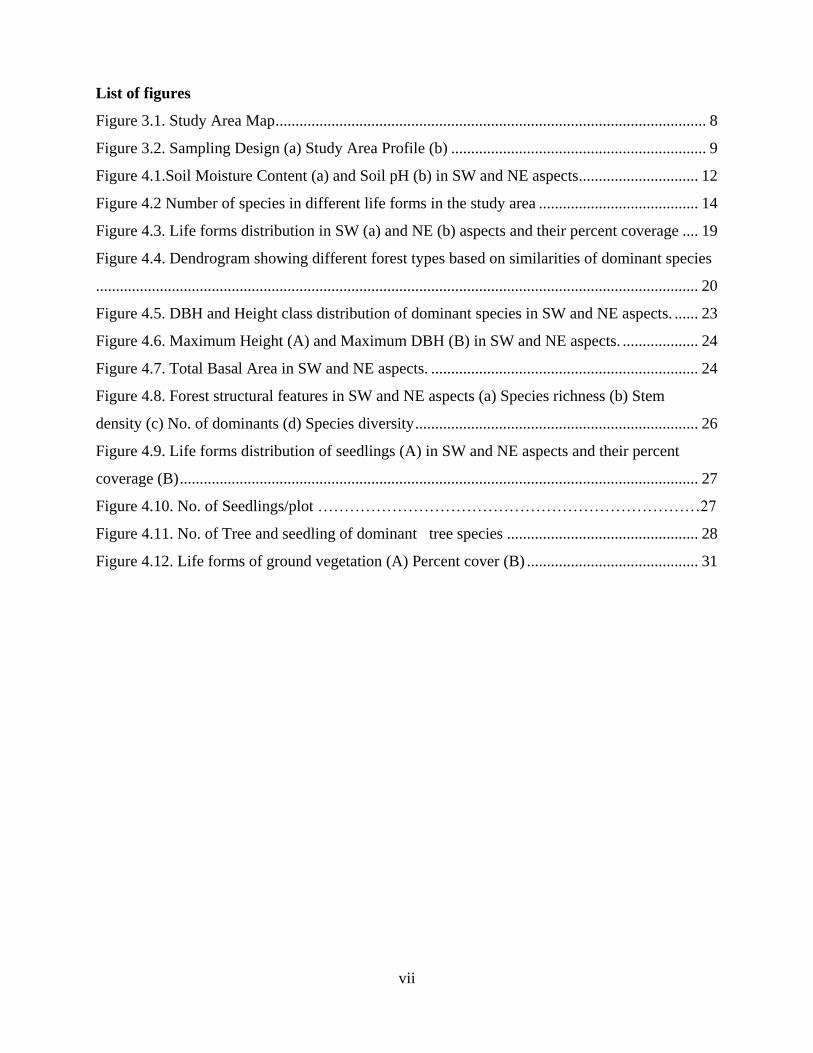
List of figures
Figure 3.1. Study Area Map ............................................................................................................ 8
Figure 3.2. Sampling Design (a) Study Area Profile (b) ................................................................ 9
Figure 4.1.Soil Moisture Content (a) and Soil pH (b) in SW and NE aspects .............................. 12
Figure 4.2 Number of species in different life forms in the study area ........................................ 14
Figure 4.3. Life forms distribution in SW (a) and NE (b) aspects and their percent coverage .... 19
Figure 4.4. Dendrogram showing different forest types based on similarities of dominant species
....................................................................................................................................................... 20
Figure 4.5. DBH and Height class distribution of dominant species in SW and NE aspects. ...... 23
Figure 4.6. Maximum Height (A) and Maximum DBH (B) in SW and NE aspects. ................... 24
Figure 4.7. Total Basal Area in SW and NE aspects. ................................................................... 24
Figure 4.8. Forest structural features in SW and NE aspects (a) Species richness (b) Stem
density (c) No. of dominants (d) Species diversity ....................................................................... 26
Figure 4.9. Life forms distribution of seedlings (A) in SW and NE aspects and their percent
coverage (B) .................................................................................................................................. 27
Figure 4.10. No. of Seedlings/plot ………………………………………………………………27
Figure 4.11. No. of Tree and seedling of dominant tree species ................................................ 28
Figure 4.12. Life forms of ground vegetation (A) Percent cover (B) ........................................... 31

viii
List of tables
Table 4.1.Plot summary ................................................................................................................ 13
Table 4.2.An overview of forest structural and soil variables measured in (n=17) plots of SW and
NE aspects in the dry valley at Burichu. ....................................................................................... 13
Table 4.3. Tree species composition ............................................................................................. 15
Table 4.4. Species comparison in SW and NE aspects ................................................................ 18
Table 4.5. Composition of seedlings in SW and NE aspects ........................................................ 29
Table 4.6. Ground vegetation composition in SW and NE aspects .............................................. 32

1
CHAPTER ONE
Introduction
1.1 Background
Bhutan Himalaya has been classified into six zones based on the elevation and humidity
matrix as tropical, sub-tropical, warm-temperate, cool-temperate, sub-arctic (cold temperate)
and Arctic (Oshawa, 1987). The mountain forests are subjected to factors such as climatic
conditions, topographic situations, and human activities; thus, forests are structurally and
floristically heterogeneous (Tang and Ohsawa, 1997). The altitudinal series of the inner Bhutan
Himalaya forms the major chunk of biodiversity hotspots in the Himalayan ecosystem which
requires immediate conservation strategies for sustainable use of these resources.
The Eastern Himalayan broadleaf forests is a temperate broadleaf forest eco-region found in
the middle elevations of the eastern Himalayas, including parts of Nepal, India, and Bhutan
(WWF, 2012). On the wet sites these broadleaved forests are mostly evergreen comprising of
oaks (Quercus sp.) chiefly Quercus lamellosa, together with Lithocarpus pachyphylla,
Rhododendron sp., Michelia sp., Bucklandia populnea, Symplocos cochinchinensis, Magnolia
sp., Cinnamomum sp. and Machilus sp. (WWF, 2012). On the drier and barren slopes
particularly along the river valleys these forests has deciduous tree species that suit to adapt well
on dry sites. One of the characteristic features of Bhutan's physiogeography is the occurrence of
dry valley in the middle ridges of big rivers (Ohsawa, 1987). The present study site Burichu falls
in a similar inner dry valley along Punatshangchu.
Apart from harboring rich deciduous forest, Burichhu is also one of the important nesting
habitats of White-bellied Heron (WBH) and is very important for conservation. Survey
conducted by Royal Society for Protection of Nature (RSPN) found three WBBH nest in the area
since 2013. The electricity transmission lines from mega hydro project plants such as
Punatshangchu I and II are being constructed, traversing through this forest. Increased
disturbances were observed in upper region of WBH habitat with introduction of stone quarry,
road construction, human settlement, to fulfill the demands for those products and land for those
hydro power plants. With increasing developmental activities and timber demand in the area, the
bigger trees which are important for WBH nesting are being felled and removed from the its
roosting sites.

2
Despite its conservation value of these forests, they are the least studied forest types in
Bhutan. Realizing the importance of broadleaved forests a few studies were conducted by the
researchers in the last few years in the evergreen broadleaved forests (Wangda et al., 2009;
Dorji, 2013; Gyaltshen, 2013 and Karma, 2013). However, the deciduous broadleaved forests
that constitute an important broadleaved forest ecosystem on the dry slopes have been least
studied in the country.
1.2 Rationale
The importance of forest at Burichu has been felt as a nesting site for WBH. These forest
resources are valuable not simply as timber but also their conservation values and vital functions
of maintaining natural environment for long term human welfare. Increasingly these forests are
facing the threats of anthropogenic pressures from developmental activities such as construction
of hydropower plants, farm roads, transmission lines and timber extractions. Due to its dry
nature, these forests are disturbed by forest fire during dry period (December to April) of almost
every year. Thus, sustainable management of these forests calls for the scientific understanding
of its dynamics and better information.
The detail study of such forest is felt necessary to clarify the factors enabling the
establishment of forest through natural regeneration. Based on understanding of their natural
dynamics, silviculture techniques could be developed mimicking the natural regeneration pattern
of such forests. Ohsawa (1987) stressed the need to study the vegetation of dry valleys in Bhutan
which may give some insights into gradational changes of zeric type vegetation from west to east
in south Asia. Same study also mentioned that forest zonation and species distribution along such
mountains are basis for understanding the mountain ecosystem of the inner dry valley.
Furthermore (Pradhan, 2015, personal communication) has also identified the study site as
WBH captive breeding niche to increase the population of this critically endangered bird
species.
The quantitative information on the distribution and abundance of tree species is of key
significance to understand the structure of a community required for planning and
implementation of conservation strategy. The structure, types and zonation pattern of most of the
Bhutan forest however is not explicitly been validated scientifically. Moreover, no study in
relation to overall structure, diversity, and regeneration status of Deciduous Broadleaved forest

3
of Bhutan has been conducted so far. As a first step towards this goal, in-depth study of such
forests with respect to species diversity, structure and regeneration became paramount
1.3 Objectives:
To assess the species composition, structure and diversity of forests in Burichu,
Punatshangchu basin.
To compare vegetation in South West and North East facing slope at Burichu
To assess the nesting Habitat of WBH.
1.4 Research Questions
In order to address the above objectives, the following are some of the questions that need to
be answered.
1. What are the plant species growing in and around the forest of Burichu?
2. What is structure of the forest at Burichu?
3. What is the status of natural regeneration of the forest in the study area?
4. Is there differences in vegetation structure and floristic composition in two aspects?

4
CHAPTER TWO
Literature Review
2.1 Forest classification
Robert et al.(1991) stated the importance of forest classification as a tool to identify key
elements and sites for potential long term preservation of the resources. It can also provide a tool
for baseline monitoring and predicting long-term vegetation responses to management activities.
Valerie et al. (2001) had shown that plants are key regulators of ecosystem functions such as soil
fertility and stability, water availability and pest control which is crucial for the decision makers
for vegetation management. Lowman and Rinker (2004) mentioned that assessment of forest
structure can be used to determine biological diversity, microclimate, ecological processes,
succession and even the evolutionary history.
The population structure data are used in interpreting vegetation succession patterns and
developing succession models (Saxena & Singh, 1984). The population structure of the forest
can also be used to study the regeneration pattern of the community.
Forests can be classified under different ways and to different degrees of specificity.
Ecologists classify forest differently using the various parameters like geography, climate,
dominant vegetation, and physiognomy and species composition.
Different ecologists have defined Bhutan forest based on different environmental
parameters. For example Wangda and Ohsawa (2006) classified forest zones by species
similarity index using cluster dendogram. Griffith was the first ecologists to explore Bhutan
forest and made interesting observations on vegetation but did not give formal classification
(Grierson & Long, 1983). Later in 1980s Grierson and Long classified Bhutan forests dividing
the main altitudinal vegetation zones. The forests were classified broadly into twelve different
forests.
Again in the late 1980s Ohsawa redefined forest classification of Bhutan based on the
habitat characteristics and altitudinal distribution of dominant species. According to Ohsawa
(1987), the forest has been classified into six climatic zones: Tropical, Subtropical, Warm
temperate, Cool temperate, Sub arctic and Arctic zone. In the recent classification of land cover
atlas of Bhutan, forest has been broadly classified into five different types, Alpine tundra, Cold
temperate forest, Warm temperate forest, Semi humid subtropical forest and Humid subtropical
forest (PPD & NSSC, 2011).
5
2.2 Structure and Composition of Forest
Understanding the forest structure is very essential in order to manage the forest resources in
a sustainable basis (Chhetri, 2004). These includes essential features such as structural type, size,
shape and both vertical and horizontal spatial distribution (Spies, 1998). Knowledge of patterns
of variation in forest structure over time and space can serve as the basis of forest management
strategies that seek to sustain a broad array of forest goods and services (Spies et al., 1999;
McComb et al., 1993).
The knowledge of forest structure, its dynamics, and its significance in ecosystems has
advanced considerably since some of the first efforts to understand the ecological importance of
forest structure (Franklin and Spies, 1991; Harmon et al., 1983; and Spies, 1998). However,
knowledge gaps remain (Chhetri, 2004), leaving considerable uncertainties about the ecological
role of forest structure e.g. in mountainous forest vegetation often changes with the slope
morphology of the forest.
Vegetation characteristics are either derived from plant morphological characters, usually
called structure, or from the plant species the floristic composition. The stand structure is defined
in terms of structural attributes and stand structural complexity (McElhinnya et al., 2005). Some
of the key structural attributes identified in the literature are stand elements such as foliage
arrangement, canopy cover, tree diameter, tree height, tree spacing, tree species, stand biomass,
understory vegetation and deadwoods.
The species composition of the forest is often unique to the area with some forests consisting
of hundreds of species of trees while others consist of few species. Forests keeps on changing
and progressing through a series of successional stages during which species composition
changes within the forest. Diversity is a combination of two factors, the number of species
present as species richness and the distribution of individuals among the species as evenness or
equitability (Semwal et al., 1999). The Species diversity is the number of different species in a
particular area (species richness) weighted by some measure of abundance such as number of
individuals or biomass. According to Hayat and Kudus (2010), the relative abundance functions
as an estimate of diversity of species at one point in time and location. This is common method
of measuring diversity in an ecosystem (the number and relative abundance of species in an
ecosystem) Gaines et al., (1999). Species richness is one of the most important elements in

6
biodiversity, because number of species existing at a site is a quantitative measure of biodiversity
and allows comparison with different communities.
2.3 Factors affecting Diversity and Structure
Forest structure is both a product of forest dynamics and a template for biodiversity and
ecosystem function (Chhetri, 2004). Consequently, understanding forest structure can help
unlock an understanding of the history, function, and future of a forest ecosystem. The natural
forces such as wind, fire, and human induced factors such as logging shape forest structure.
Furthermore, the structure of forests at stand and landscape scales is controlled by forest
management (Spies, 1993; and McComb et al., 1993), disturbances (White & Jentsch, 2001). In
mountainous forest, vegetation often changes with the slope morphology of the forest. This
relationship between vegetation and slope position has been attributed to soil moisture and soil
fertility gradients along a slope (e.g. Whittaker & Niering, 1965; Chen et al., 1997). Ohsawa,
(1987) reported that basic pattern of vegetation distribution along altitudinal gradient is
controlled by the temperature climate, through humidity which also controls the vegetation
distribution in dry valleys.
A study of tropical dry forest by Coelho et al., (2012) have shown that the floristic
composition and structure of a differed in species richness, density and basal area attributed to
topography, soil conditions and canopy opening. Structure and species composition are also
influenced by the environmental gradients, changes to variation in rainfall, fog, wind, humidity
and light (Shreve, 1914; Beard, 1949) cited in Wangda et al., (2006).
In Bhutan the phenomena of wind flow along the dry valley basins influences the floristic
composition along the typical dry valley slopes, which starts from a warm, dry pine forest at the
valley bottom to moist mixed broad-leaved forests (Wangda & Ohsawa, 2006). The distribution
of the understory species can be affected by the species composition of the forest canopy (Oijen
et al., 2009). The other biotic factors such as anthropogenic activities, cattle grazing, forest fire
etc. can also significantly alter the vegetation composition and structure of the forest.
2.4 White bellied Heron and its Nesting Habitat in Bhutan
WBH (Ardea insignis) is the second largest heron in the world belonging to the family
ardeidae. It is found in foothills of India, Nepal, Tibet, Bhutan and Burma (Ali & Ripley, 1978,
Grimmett et al., 1999, Smithies, 1953, Birdlife international, 2001 as cited in RSPN, 2011). It is
7
classified as a Critically Endangered (CE) owing to extremely small and declining population
(IUCN, 2008). Its global population stands at about 200 known individuals (RSPN, 2011). The
white-bellied heron is found in the wetlands of tropical and subtropical forests in the foothills of
the eastern Himalayas of India and Myanmar. It is also spotted in Bhutan's sub-tropical areas and
was once found in Nepal.
Bhutan is known for potential breeding of White-bellied Heron and was found along the
Punatsang Chu river especially in Pho-chhu river banks in Toewang Gewog, along Kami Chhu ,
Burichu and in Lower Kheng (Berti). It is also spotted in Madgechhu (Trongsa). Currently 28
individuals are known to exist in Bhutan (RSPN, 2015) and Punatshangchhu and its tributaries
have been identified as a permanent habitat of WBH among the river systems of Bhutan. Three
nests had been spotted in Burichu forest since 2013 (Pradhan, 2015).
Nests were always found on tall Chirpine trees (Pinus roxburghii) particularly on steep parts
of hillsides. This bird appear to prefer areas with sparsely dispersed large trees with no or very
low understory (RSPN, 2011). Also it is said that the locations of nests are usually found near
confluences of streams joining the main river. Most of the habitat in Burma, Assam and
Arunachal Pradesh is broadleaved forests but it is quite different in Bhutan where they prefer
Chirpine for nesting (RSPN, 2011).
2.5 Methods to study diversity and distribution of Plant communities
Several techniques were developed to study the structure of the forest ecosystems. Some of
the methods used are random sampling (Devlal & Sharma, 2008b), stratified random sampling,
complete enumeration, line transect etc., while commonly used method for large forest area
along mountain slope is predetermined transect line with quadrat sample plots at certain
elevation interval. Tang and Ohsawa, (1999); Wangda et al., (2010); Gyaltshen,(2013) and many
others used this quadrat sample plots of varying sizes along the transects to study the diversity
and distribution patterns of plant communities along the altitudinal gradients in the mountain
regions. The mountain ecosystem of the Himalaya can be best understood through forest
zonation and species distribution along the mountains (Wangda & Ohsawa, 2002).

8
CHAPTER THREE
Materials and Methods
3.1 Study Area
The study was conducted in two Aspects (South West and North East) at Burichu area along
Punatshangchu. It is located at 63 km from Wandi Bridge along Wangdi-Tsirang Highway at an
average altitude of 520 masl. The area has steep slopes on either side of Punatshangchu with an
extensive tract of deciduous broadleaved forest at the lower elevation and chirpine forest on the
upper elevation. The average annual temperature ranges from 12.8 °Ϲ - 21.3 °Ϲ with annual
precipitation of 783.5mm (Source: RNR-RDC, Yusipang). The soil type is loam and dry. The
study site is one of the important habitats of WBH especially for its nesting.
Figure 3.1. Study Area Map

9
3.2 Survey Method & Sampling design
The field works was conducted during November and December 2015. During the field
works, the forest communities of Burichu along the altitudinal gradients from river bed at 370 m
to hill top at 770 m a.s.l. on two aspects NE and SW respectively . The study area includes
seventeen (17) sampling plots with an interval of about 50 meters between plots and the plot size
of 400 m2. Difficult sites such as steep cliff, bamboo thickets, rock outcrop and open areas are
purposely eliminated to maintain the uniformity throughout the series. In each of these plots e
vegetation survey was conducted by vegetation strata; trees, shrubs and herbs were analyzed for
species richness and diversity. For tree strata quadrat sampling of 20 x 20m was adopted while
for seedling and ground layer, 3 sub-plots of 2 x 2 m were established diagonally within the tree
layer so as to keep consistency throughout the plots to avoid biases. In the tree category, species
were classified into two major categories based on tree height consisting of, tree (> 1.3 m) and
sapling or Seedlings (< 1.3 m) respectively and their diameters at breast height (DBH) at 1.3 m
above the ground and . Total height (H) were measured and recorded. For seedlings, all tree
individuals occurring within the sub-quadrat (2 x 2 m) having height <1.3 m were measured and
their heights were recorded in centimeters and also approximate age of seedlings was measured
by counting the annual internodes. For ground vegetation cover, herbs were identified and height
of the tallest of each species and their corresponding coverage were recorded by a visual
estimate.
Figure 3.2. Sampling Design (a) Study Area Profile (b)
Flora of Bhutan by Grierson and Long (1983) were used for to identify the plant species
Specimens and photographs of unidentified plants were collected and herbarium was maintained
botanists were consulted for to authentic their identity.
20m
20m
2m
2m
Tree layer
Seedling and
Ground layer
SW NE
(a) (b)
10
3.3 Environmental survey (Soil)
One soil sample per plot was collected from center of seedling and ground strata plot. The soil
thus collected were processed and analyzed at Soil and Plant Analytical Laboratory (SPAL),
Semtokha for soil moisture content, soil PH, N,P, K and soil carbon determination.
3.4 Data Analysis
The diameter at breast height(DBH) data of individual tree were used to calculate species
basal area (BA, cm2) and then the relative proportion of each species relative basal area in
percent (RBA %) was calculated. The RBA of each species was used as abundance measure of
species in a community.
Species richness was determined as the number of species per unit area (Whittaker, 1975),
Species diversity was calculated by using Shannon-Wiener information index (Shannon and
Weaver 1963) as:
H = -Σ{Pi * Ln (Pi)} …………………………………………………………Equation 1
Where: H = the Shannon diversity index, Pi= fraction of the entire population area of the
species), ∑ = sum of species and Ln = natural log.
Species evenness (J’) was calculated by using Pielou‟s evenness index.
Evenness (J) =H
LnS…………………………………………………………………….Equation 2
Where H is the amount of Shannon_Wiener Index, S: the number of taxon in samples and Ln =
natural log. The dominant species of the altitudinal plots were determined based on the
dominance analysis (Ohsawa, 1984) which states that in a community dominated by single
species, its relative dominance is accounted at 100%. If two species share dominance, the
relative dominance of each species is accounted at 50%. Likewise, if there are three co-
dominants, 33.3%, and so on. The number of dominant species is that which shows the least
deviation between the actual relative dominance values and the expected percent share of the
corresponding co-dominant-number model. The following equation was used:
d = 1/N {Σ (χi-χ’) 2 + Σ χj2}……………………………………….Equation 3
iЄT jЄU
Where, i is the actual percent share (relative basal area is adopted here) of the top species
(T), i.e., in the top dominant in the one-dominant model, or the two top dominants in the two-

11
dominant model and so on; is the ideal percent share based on the model as mentioned above and
χ is the percent share of the remaining species (U). N is total number of species.
The preliminary data were processed using pivot-table of the Microsoft Excel 2010. Once
the data were processed, analysis was carried out by using PC-ORD version 5.1 for cluster
analysis to determine the forest type using distance measure of Relative Sorensen and Group
Average as linkage method and SPSS version 16 was used for correlation analysis.

12
5.6
5.8
6
6.2
6.4
6.6
6.8
7
7.2
7.4
7.6
370 420 470 520 570 620 670 720 770
So
il P
H
Altitude
SW
NE
0
0.5
1
1.5
2
2.5
3
3.5
4
370 420 470 520 570 620 670 720 770
SM
C(%
)
Altitude
SW
NE
(a) (b)
CHAPTER FOUR
Results & Discussion
4.1 Environmental Condition (Soil)
The soil moisture content and soil pH were investigated along the altitudinal gradient in two
aspects, (SW &NE). The highest moisture content in NE aspect 3.6%, where as it was 2.3% in
SW aspect at 370 m a.s.l. A Mann-Whitney test indicated that the soil moisture content was
significantly higher in NE aspect (M = 2.83%, SD = ± 0.38) than SW aspect (M = 2.15%, SD = ±
0.22), U(16) = 1, p < .05. Ghobadi et al, (2012) also surmised of South facing slope showing
low moisture content as the slope receives more sunlight. It was further supported by the findings
of Wangda & Ohsawa (2006) that South facing slopes are directly exposed to the southerly wind
during the afternoon causing drier conditions. Spearman’s rho correlation test revealed a
significant association between aspects and soil moisture content, r = 0.85, p < .01. Gyeltshen
(2013) reported a strong relationship between north facing aspects to soil moisture contents. Soil
pH of SW aspect was slightly higher (M = 6.97, SD = ± 0.23) as compared to NE aspect (M=
6.59, SD = ± 0.23).
Figure 4.1. Soil Moisture Content (a) and Soil pH (b) in SW and NE aspects

13
Variable SW(n=9) NE(n=8) U z p
mean±SD mean±SD
H' 1.78±0.497 1.74±0.529 28.5 -0.723 0.47
TBA(cm^2) 11902.4±4934.9 12590.4±6869.9 35 -0.096 0.923
Max. DBH(cm) 47.17±13.472 57±34.55 33 -0.289 0.773
Max. Ht. (m) 25.62±10.232 26.40±12.422 35 0.096 0.923
Stem Density 50.89±13.439 60.12±10.120 14 -2.123 0.034
N 13.56±3.005 16.67±4.979 22 -1.361 0.174
No. of Dominants 4.56±2.455 3.38±2.504 26 -0.978 0.328
No. of Seedling 5.56±3.609 18.12±9.156 2 -3.284 0.001
pH 6.97±0.226 6.59±0.229 9 -2.598 0.009
SMC 3.44±1.27 2.35±1.327 11.5 -2.36 0.016
Significant p<o.o5
Table 4.1.Plot summary
Table 4.2.An overview of forest structural and soil variables measured in (n=17) plots of SW and NE aspects in the dry valley at
Burichu.
Plot Number P9 P8 P7 P6 P5 P4 P3 P2 P1 P10 P11 P12 P13 P14 P15 P16 P17
Location E 2705018.3 270527.5 270526.6 270526.1 270525.4 270525.2 270522.7 270521.7 270517.4 2701049 2704.053.0 274053.4 270453 270455.1 270454.1 270454 270451.7
N 9004044.6 900439.2 900437.2 900434.6 900430.1 900425.8 900422.5 900121.3 900423.2 9004028.2 9004024.4 900424.1 900418.5 900415.8 900413.6 900411.3 900405.7
Aspect
Altitude (m) 770 720 670 620 570 520 470 420 370 370 420 470 520 570 620 670 720
Inclination(Degree) 80 75 75 70 45 40 80 40 20 35 47 70 55 55 51 75 10
Plot Size (m2) 400 400 400 400 400 400 400 400 400 400 400 400 400 400 400 400 400
Total Basal Area/plot 20923.9 11948.7 7250.4 7605.9 6611.0 14627.3 13191.2 8261.8 16698.5 27888.3 8459.8 9418.3 6559.1 9723.5 10772.8 10981.8 16919.1
Max.Ht. (m) 39.6 29.5 16.1 13 17.8 17.7 36.2 37.3 23.4 50 23.5 13.8 13 21.2 22.6 29.5 37.6
Max. DBH (cm) 69.9 53 40.2 38.4 31.2 44.3 59.9 31 56.6 130 48 43.2 25.2 31.6 34.3 64.4 80
Species Richness (N)/Plot 12 12 10 10 17 12 15 18 16 27 17 13 15 14 21 15 12
Diversity (H') 0.91 1.94 0.97 1.74 2.26 2.14 2.09 2.03 1.9 1.9 1.88 1.88 1.99 1.82 2.43 1.43 0.62
Eveness (J') 0.37 0.78 0.42 0.76 0.80 0.86 0.77 0.70 0.69 0.58 0.66 0.73 0.73 0.69 0.80 0.53 0.25
No.ofDominant 1 4 1 4 7 8 6 6 4 2 3 6 4 2 8 1 1
Stem Density/Plot 78 30 39 57 46 55 48 57 48 56 75 50 55 47 59 69 70
SW NE
14
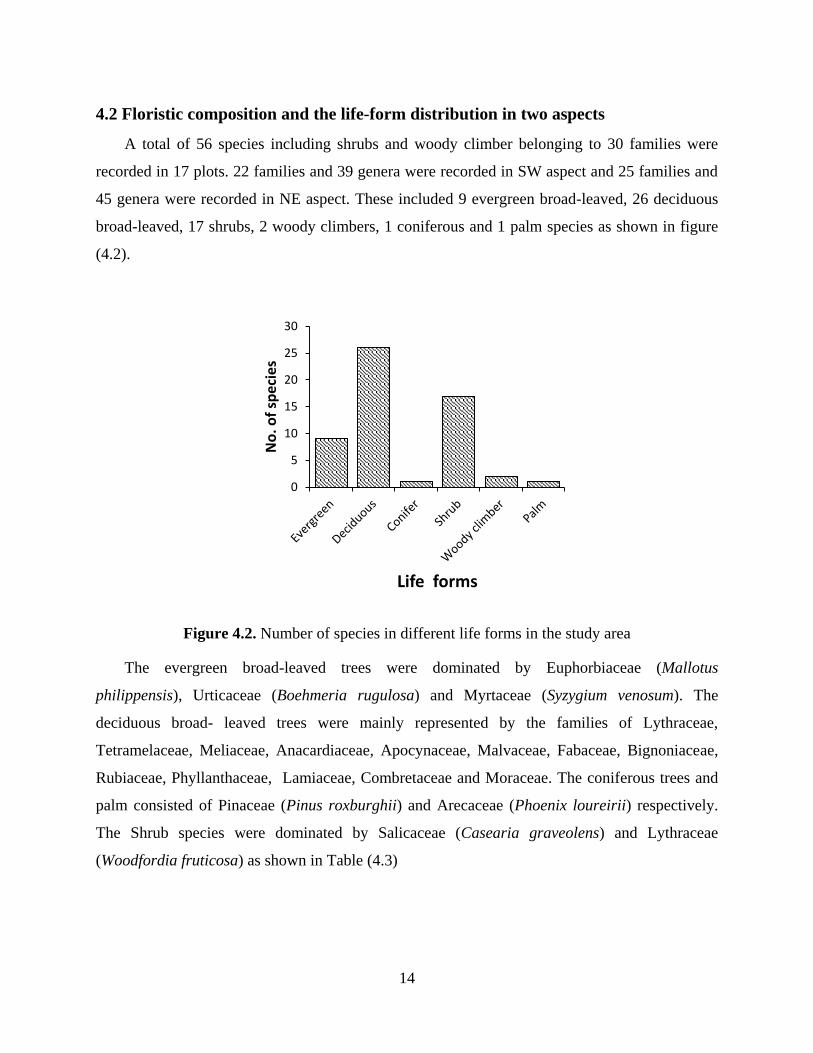
4.2 Floristic composition and the life-form distribution in two aspects
A total of 56 species including shrubs and woody climber belonging to 30 families were
recorded in 17 plots. 22 families and 39 genera were recorded in SW aspect and 25 families and
45 genera were recorded in NE aspect. These included 9 evergreen broad-leaved, 26 deciduous
broad-leaved, 17 shrubs, 2 woody climbers, 1 coniferous and 1 palm species as shown in figure
(4.2).
Figure 4.2. Number of species in different life forms in the study area
The evergreen broad-leaved trees were dominated by Euphorbiaceae (Mallotus
philippensis), Urticaceae (Boehmeria rugulosa) and Myrtaceae (Syzygium venosum). The
deciduous broad- leaved trees were mainly represented by the families of Lythraceae,
Tetramelaceae, Meliaceae, Anacardiaceae, Apocynaceae, Malvaceae, Fabaceae, Bignoniaceae,
Rubiaceae, Phyllanthaceae, Lamiaceae, Combretaceae and Moraceae. The coniferous trees and
palm consisted of Pinaceae (Pinus roxburghii) and Arecaceae (Phoenix loureirii) respectively.
The Shrub species were dominated by Salicaceae (Casearia graveolens) and Lythraceae
(Woodfordia fruticosa) as shown in Table (4.3)
0
5
10
15
20
25
30
No
. of
spe
cie
s
Life forms

15
Table 4. 3. Tree species composition
Plot no. P9 P8 P7 P6 P5 P4 P3 P2 P1 P10 P11 P12 P13 P14 P15 P16 P17
Altitude 770 720 670 620 570 520 470 420 370 370 420 470 520 570 620 670 720
Aspect SW SW SW SW SW SW SW SW SW NE NE NE NE NE NE NE NE
Inclination(Degree) 80 75 75 70 45 40 80 40 20 35 47 70 55 55 51 75 10
Plot Size (m2) 400 400 400 400 400 400 400 400 400 400 400 400 400 400 400 400 400
Total Basal Area/plot 20924 11949 7250 7606 6611 14627 13191 8262 16699 27888 8460 9418 6559 9724 10773 10982 16919
Max.Ht. (m) 40 30 16 13 18 18 36 37 23 50 24 14 13 21 23 30 38
Max. DBH (cm) 70 53 40 38 31 44 60 31 57 130 48 43 25 32 34 64 80
Species Richness (N)/Plot 12 12 10 10 17 12 15 18 16 27 17 13 15 14 21 15 12
Diversity (H') 1 2 1 2 2 2 2 2 2 2 2 2 2 2 2 1 1
Eveness (J') 0 1 0 1 1 1 1 1 1 1 1 1 1 1 1 1 0
No.ofDominant 1 4 1 4 7 8 6 6 4 2 3 6 4 2 8 1 1
Stem Density/Plot 78 30 39 57 46 55 48 57 48 56 75 50 55 47 59 69 70
Species Family RBA RBA RBA RBA RBA RBA RBA RBA RBA RBA RBA RBA RBA RBA RBA RBA RBA
Evergreen Trees
Boehmeria rugulosa Urticaceae 0 9
Mallotus philippensis Euphorbiaceae 5 4 7 1 7 14 6 22 2 5 8 8 8 8 2
Heteropanax fragrans Araliaceae 1
Celtis timorensis Cannabaceae 0 0 0
Persea sp. (Bhaisi Kawla) Lauraceae 2
Pterospermum acerifolium Malvaceae 0
Syzygium venosum Myrtaceae 16
Duabanga grandiflora Lythraceae 4
Alstonia scholaris Apocynaceae 4
SubTotal 0 6 4 7 1 16 14 6 23 26 5 8 8 8 8 2 0

16
Deciduous Tree
Lagerstroemia parviflora Lythraceae 4 14 11 22 24 32 28 0 40 22 14 37 3 5 0
Grewia eriocarpa Malvaceae 1 20 76 18 4 9 8 22 6 3 35 29 10 6 1
Eriolaena spectabilis Malvaceae 1 7 40 2 9 7 9 25 28 6 7 0
Terminalia chebula Combretaceae 1 1 1 22 1 5 7 5 1 2 0
Sterculia villosa Malvaceae 0 18 0 0 0 2 0 4 1
Dalbergia sericea Fabaceae 0 0 0 0 0
Stereospermum colais Bignoniaceae 23 15 4 0
Lannea coromandelica Anacardiaceae 6 3 8 22 11 18 9 7 4 4 4 4
Bauhinia purpurea Fabaceae 3 0
Gmelina arborea Lamiaceae 1 3 6 6
Bridelia retusa Phyllanthaceae 0 5 20 1 0 0 3 3 6 1
Holarrhena pubescens Apocynaceae 1 0 0 0 2 5 0 18 2 2 1 0 0
Ficus semicordata Moraceae 8 0
Hymenodictyon flaccidum Rubiaceae 1 0 0 0 1 5 5 8 0
Melia azedarach Meliaceae 0 2
Chukrasia tabularis Meliaceae 2 1 11 2 0 0
Wrightia tomentosa Apocynaceae 6 5 1
Albizia lebbeck Fabaceae 1 1 15 1 0 1
Erithrena arborea Fabaceae 10
Tetrameles nudiflora Tetramelaceae 18 50
Sapium insigne Euphorbiaceae 0 0
Spondias pinnata Anacardiaceae 2
Bombax ceiba Malvaceae 1 1
Premna sp Verbenaceae 0 0
Oroxylum indicum Bignoniaceae 2
Engelhardia spicata Juglandaceae 1
Sub Total 4 70 93 86 76 71 83 87 75 70 82 78 83 87 48 22 3
Conifer
Pinus roxburghii Pinaceae 73 19 25 64 86
Sub Total 73 19 0 0 0 0 0 0 0 0 0 0 0 0 25 64 86

17
Palm
Phoenix loureirii Arecaceae 19 10 10 3 4 5 5 15 6 7
Sub Total 19 0 0 0 10 10 3 4 0 0 0 5 0 5 15 6 7
Shrubs
Woodfordia fruticosa Lythraceae 4 3 0 4 9 1 1 1 5 3
Phyllanthus emblica Phyllanthaceae 0 6 1 1 0
Rhus paniculata Anacardiaceae 0 4 3 1 2 5 2 0 1
Casearia graveolens Salicaceae 0 5 7 5 1 2 1 0 2 0 1 1
Desmodium oojinense Fabaceae 0 3 1
Ficus ischnopoda Moraceae 0
Glochidion velutinum Phyllanthaceae 0 1
Cipadessa baccifera Meliaceae 0 0 0 1 0 0
Murraya koenigii Rutaceae 0 0 0 0
Brucea mollis Simaroubaceae 0
Ficus hirta Moraceae 1
Flueggea virosa Phyllanthaceae 0
Opuntia vulgaris Cactaceae 1
Aspidopterys glabriuscula Malpighiaceae 0
Capparis olacifolia Capparaceae 0
Caryopteris paniculata Lamiaceae 0 1
Antidesma acidum Phyllanthaceae 0
Sub Total 4 5 3 7 13 3 1 3 2 3 13 10 9 1 3 7 4
Woody Climbers
Microcos paniculata Malvaceae 0
Acasia sp Fabaceae 1
Sub Total 0 0 0 0 0 0 0 0 0 0 0 0 0 0 1 0 0

18
Eleven species in 8 families were limited to SW aspect, 15 species in 14 families were limited to
North East aspects, and 30 species belonging to 19 families were common to both the sites.
Floristically, tree species composition pattern was quite similar between the two aspects.
Jaccard’s similarity index (1948), for the NE and SW aspect calculated for species is 0.54 and for
the family 0.63 respectively which shows strong similarity between the vegetation compositions
of the two aspects. The list of species common to both the aspects and unique to each aspect is
provided in Table (4.4).
Table 4.4. Species comparison in SW and NE aspects
Species Family Species Family
Mallotus philippensis Euphorbiaceae Persea Sp. (Bhaisi Kawla) Lauraceae
Celtis timorensis Cannabaceae Pterospermum acerifolium Malvaceae
Deciduous Trees Boehmeria rugulosa Urticaceae
Lagerstroemia parviflora Lythraceae Heteropanax fragrans Araliaceae
Tetrameles nudiflora Tetramelaceae Deciduous Trees
Chukrasia tabularis Meliaceae Bauhinia purpurea Fabaceae
Lannea coromandelica Anacardiaceae Erithrena arborea Fabaceae
Holarrhena pubescens Apocynaceae Ficus hirta Moraceae
Wrightia tomentosa Apocynaceae Flueggea virosa Phyllanthaceae
Sapium insigne Euphorbiaceae Brucea mollis Simaroubaceae
Grewia eriocarpa Malvaceae Glochidion velutinum Phyllanthaceae
Eriolaena spectabilis Malvaceae Ficus ischnopoda Moraceae
Stereospermum colais Bignoniaceae
Albizia lebbeck Fabaceae Evergreen Trees
Hymenodictyon flaccidum Rubiaceae Syzygium venosum Myrtaceae
Bridelia retusa Phyllanthaceae Duabanga grandiflora Lythraceae
Sterculia villosa Malvaceae Alstonia scholaris Apocynaceae
Gmelina arborea Lamiaceae Deciduous
Terminalia chebula Combretaceae Spondias pinnata Anacardiaceae
Ficus semicordata Moraceae Bombax ceiba Malvaceae
Dalbergia sericea Fabaceae Premna sp Verbenaceae
Melia azedarach Meliaceae Oroxylum indicum Bignoniaceae
Conifer Engelhardia spicata Juglandaceae
Pinus roxburghii Pinaceae Shrubs
Palm Opuntia vulgaris Cactaceae
Phoenix loureirii Arecaceae Aspidopterys glabriuscula Malpighiaceae
Shrubs Capparis olacifolia Capparaceae
Casearia graveolens Salicaceae Caryopteris paniculata Lamiaceae
Cipadessa baccifera Meliaceae Antidesma acidum Phyllanthaceae
Murraya koenigii Rutaceae Woody Climbers
Rhus paniculata Anacardiaceae Microcos paniculata Malvaceae
Woodfordia fruticosa Lythraceae Acasia sp Fabaceae
Desmodium oojinense Fabaceae
Phyllanthus emblica Phyllanthaceae
Common to Both Aspects Specific to SW
Specific to Site NE
Evergreen Trees Evergreen Trees

19
8%
66%
16%5% 5%
Evergreen
Deciduous
Conifer
Palm
Shrub
0
10
20
30
40
50
60
70
80
90
100
P9 P8 P7 P6 P5 P4 P3 P2 P1 P10 P11 P12 P13 P14 P15 P16 P17
RB
A(%
)
Evergreen Trees Deciduous Tree Conifer Palm Shrubs Woody Climbers
Low High High Low Altitude
SW NE
For the both aspects, deciduous broad-leaved (65.62%) dominated the areas followed by
coniferous species (15.65%) and evergreen broad-leaved (8.33%) and the least was for Woody
climber (0.07%) as shown in figure (4.3 (a) and (b). The deciduous trees were found to be
slightly more on the SW aspects (7) as compared to NE aspect (5) whereas conifer trees were
more in NE aspect occupying the upper ends (above 620 m a.s.l) of the series towards the ridge
top. The evergreen broad leaved tree species mostly occupied the lower part, while the deciduous
trees were found mostly in the mid elevations of the study area. Occurrence of similar pattern
was also reported by Tang and Ohsawa, (1997).
Figure 4.3. Life forms distribution in SW (a) and NE (b) aspects and their percent coverage
(a)
(b)
(b)

20
Type IV
Cluster Analysis
Information Remaining (%)100 75 50 25 0
P1
P11
P2
P12
P3
P6
P13
P14
P4
P5
P7
P8
P9
P17
P16
P15
P10
370m
420m
420m
470m
470m
620m
520m
570m
520m
570m
670m
720m
770m
720m
670m
620m
370m
Lagerstroemia parviflora
Grewia eriocarpa
Eriolaena spectabilis
Terminalia chebula
Grewia eriocarpa Stereospermum colais
& Pinus roxburghii
Pinus roxburghii
Tetrameles nudiflora &
Syzygium sp Type I
Type II
Type III
Dendrogram
Deciduous Forest
Broadleaved- Pine Transitional Forest
Pine Forest
Riverine Forest
4.3. Forest classification along the altitudinal gradients
The dominance (relative basal areas) of all the tree species in each plot was subjected to
cluster analysis for classifying forest zones by the species similarity index using dendrogram.
Four forest types (Type -I: Riverine, Type-II: Deciduous broad-leaved, Type- III: Broad leaved-
Pine transitional and Type- IV: Pine) were classified with arbitrarily at 37.5 % similarity
threshold, figure (4.4).
Figure 4.4. Dendrogram showing different forest types based on similarities of dominant species
These four forest zones were named based on life-forms of dominants. Floristic
compositions and plot descriptions of each plot were discussed briefly following the zonation of
the entire altitudinal gradients. Forest zones, similar to the present study area were also reported
(Tang & Ohsawa,, 1997) in Mt. Emei, Sichuan, China where evergreen broad-leaved trees were
distributed in low and middle altitudes, then deciduous broad-leaved trees and finally
21
dominated exclusively by coniferous trees above 2500 m a.s.l. However, the vegetation type is
contrasting with the forests types in wider and concave dry areas like Lobesa, Punakha where
forest transition from chirpine type in the dry valley bottom to broadleaved forests and to conifer
forest mostly dominated by Abies and Tsuga on the ridge top (Wangda, 2003).
The causes for the existence of such forest is however not clear. It could be due to the
disturbances such as Tseri cultivation in the past from the fact that some of the big remnant
chirpine trees were observed at lower part of the study area. It could also be natural as the study
area falls below the lower limit of Chirpine which is 900m (Grierson & Long, 1983) and hence
other drought tolerant species thrived. Wangda, (2003) also mentioned that in the lower convex
slope valley bottom, the climatic condition is dry, warm and sunny with frequent local valley
wind that causes higher evaporation and transpiration and thus only drought tolerant species can
survive.
4.3.1 Type-I: Riverine Forests (<370 m a.s.l)
Based on the location being closer to the Punatshangchu river bed and the presence of some
of the riverine plant communities the forest below 370 m a.s.l. of the study area (P10) is
classified as riverine forest. It was observed that this forest type consisted of multi-dominant
stand with heterogeneous composition supporting the finding made by Wangda and Ohsawa,
(2006). The forest was composed of Tetrameles nudiflora, Syzygium venosum, Duabanga
grandiflora, Bombax ceiba and Sapium insigni in tree layer, while the middle layer story
composed Casearea graveolens Antidesma acuminatum, Woodfordia fruticosa, Microscos
panniculata and Opentia vulgaris . The ground vegetation was mainly composed of Oplismenus
sp. Carex sp., Asplenium sp. and crptolepis buchanani.
4.3.2 Type II: Deciduous broadleaved Forests (370-620 m.a.s.l)
This forest type is named based on the presence of more deciduous trees as the dominant
species. It covers mid altitudes of the study area (370-620 m a.s.l.) and includes maximum (59%)
of the total plots (P1, P2, P3, P4, P5, P6, P11, P12, P13 and P14). This forest type is dominaed
mainly by deciduous tree species such as Lagerstroemia parviflora, Grewia eriocarpa,
Eriolaena spectabilis, Terminalia chebula and Stereospermum colais. Other associated
deciduous broadleaved tree species includes Lannea coromandelica, Holarrhena pubescens,

22
Bauhinia purpurea, Hymenodictyon flaccidum, Stereospermum colais and Sterculia villosa.
There were also found some of the evergreen species like Mallotus philippensis, Pterospermum
acerifolium and Heteropanax fragrans but are not the dominating species.
The shrub layer species are mostly Cipadessa baccifera, Murraya koenigii, Rhus paniculata,
Brucea mollis, Woodfordia fruticosa, Glochidion velutinum and Desmodium oojinense. The
ground layer is dominated mainly by Chromolaena odoratum with some ferns Lygodium
japonicum, Asplenium sp. Lepisorus sp. Adiantum sp. and Thelylpteris sp. and grasses
(Arundinella sp. and Oplismenus burmannii).
Similar plant communities were also found in lowland deciduous forest in Chang Kian
Valley, Chiang Mai, northern Thailand (Vaidhayakarn and Maxwell, 2010) and in moist
deciduous forest in the Central Indian Highlands (Newton, 1988). Some of the common species
includes Lagerstroemia parviflora, Grewia eriocarpa, Eriolaena spectabilis, Terminalia
chebula, Stereospermum colais, Lannea coromandelica, Bauhinia sp. Stereospermum colais,
Sterculia villosa, Mallotus philippensis, Pterospermum acerifolium, Rhus paniculata, Brucea
mollis, Woodfordia fruticosa and Glochidion velutinum
4.3.3 Type- III: Broad leaved- Pine transitional (670-720 m a.s.l)
This forest type has both the broadleaved and conifer species. Broadleaved species is
dominated by Grewia eriocarpa and Stereospermum colais while Pinus roxburghii was the only
conifer species present. The area has Phoenix sp., Woodfordia fruticosa and Casearia graveolens
as the dominating shrub species while ground layer is dominated by Chromolaena odoratum and
Phragmites karka. Some of the associated tree species includes Eriolaena spectabilis,
Lagerstroemia parviflora, Mallotus philippensis and Lannea coromandelica.
4.3.4 Type- IV: Pine forest (>720m a.s.l)
The upper plots (P9, P15 and P17) from 720 m a.s.l. and above in the study area were
named as Pine forest on the basis of prevailing dry condition and dominated by Pinus roxburghii.
P. roxburghii is endemic to Himalayan region and the type constitutes a light and open forest.
This species prefers dry, well-drained sites, ridges and cliffs. Similarly, as per Gearson & Long (
2006) P. roxburghii is found between the altitudinal ranges of 1000 - 2000 m a.s.l. and
distributed from west to east along the mid-altitudes of Bhutan Himalaya (Punatsangchu,

23
Kurichu and Dangmechu). In the present study site P. roxburghii was found to be distributed
from as low as 720 m a.s.l. altitude and appeared as dominant species. The lower limit is in
contrast with the findings of Wangda (2006) who also recorded the lower limit of chirpine at
1300 m a.s.l. He also mentioned that though the upper limit of P. roxburghii is limited by the
natural factors including biological interactions, the lower limit of 1520 m a.s.l. is not the natural
one and is limited by soil moisture content and also by the anthropogenic activities. In the study
area, P. roxburghii appeared as pure stands with a few undergrowth shrubs, such as Zizyphus sp.,
Phylanthus emblica, Phoenix loureirii, Woodfordia fruticosa and Rhus paniculata. The ground
layer includes Barleria cristata, Carex sp., Chromolaena odoratum, Desmodium renefolium,
Duhaldea cappa and Flemingia macrophylla.
4.4. Comparison of forest Structural features in two aspects
Structural traits of the forest at Burichu along the altitudinal gradients were described and
compared between two aspects based on Maximum Height, Maximum DBH, Total Basal Area,
Species Richness, Stem Density and Number of Dominant species. The forest of Burichu was
found to be secondary with 62% of dominant trees falling in height class between 0-10 m and 76
% was constituted by DBH class between 0-25 cm, figure (4.5). Vegetation structure, as
measured by the mean number of dominant trees in different height and age classes, showed no
significant differences between SW and NE aspects (U(16) = 33, p >.05). While trees with a
height class 11-20 m were similar for the two aspects, lower height class trees (0-10 m) were
more abundant in SW aspect however statistical test did not reveal any significant difference.
Figure 4. 5. DBH and Height class distribution of dominant species in SW and NE aspects.
0
5
10
15
20
0-10 11-20 21-30 31-40 >40
Me
an S
tem
s o
f d
om
inan
t Sp
./P
lot
Height Class (m)
SW
NE
0
2
4
6
8
10
12
0-10 11-25 26-50 51-75 >75
Me
an S
tem
s o
f d
om
inan
t Sp
./P
lot
DBH Class (cm)
SW
NE
24
0
5000
10000
15000
20000
25000
30000
P9
P8
P7
P6
P5
P4
P3
P2
P1
P1
0P
11
P1
2P
13
P1
4P
15
P1
6P
17
TBA
(cm
^2) SW NE
AltitudeHigh Low Low High
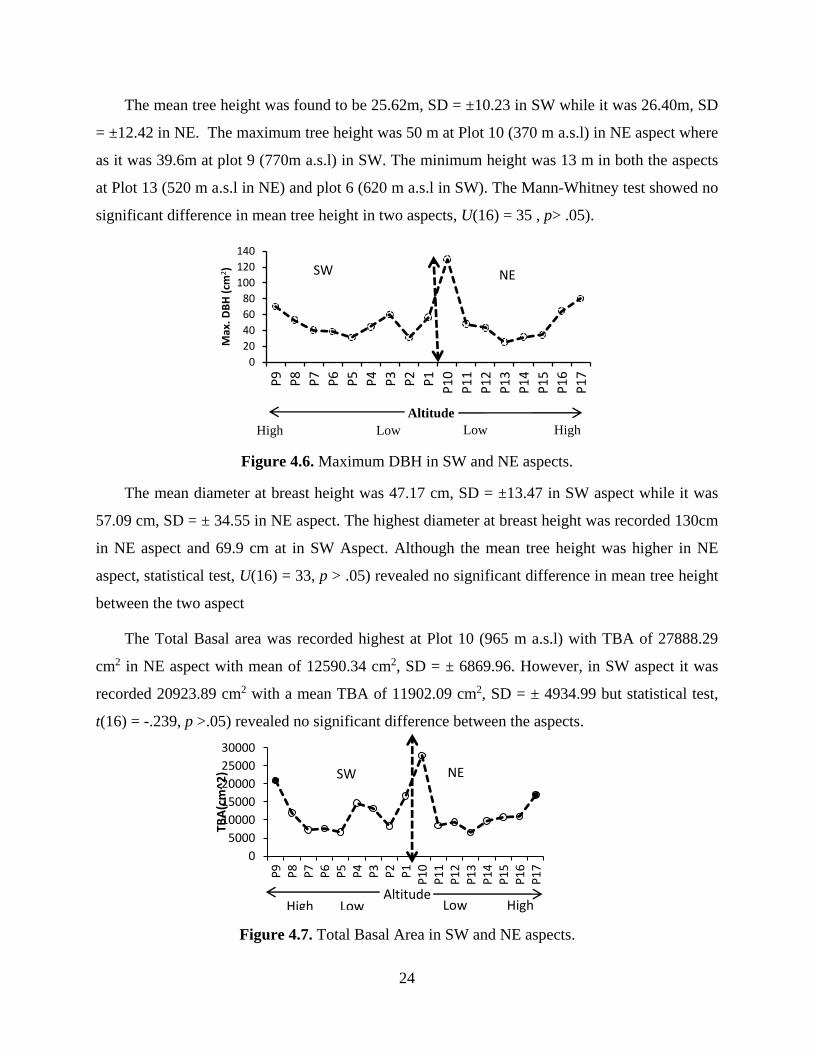
The mean tree height was found to be 25.62m, SD = ±10.23 in SW while it was 26.40m, SD
= ±12.42 in NE. The maximum tree height was 50 m at Plot 10 (370 m a.s.l) in NE aspect where
as it was 39.6m at plot 9 (770m a.s.l) in SW. The minimum height was 13 m in both the aspects
at Plot 13 (520 m a.s.l in NE) and plot 6 (620 m a.s.l in SW). The Mann-Whitney test showed no
significant difference in mean tree height in two aspects, U(16) = 35 , p> .05).
Figure 4.6. Maximum DBH in SW and NE aspects.
The mean diameter at breast height was 47.17 cm, SD = ±13.47 in SW aspect while it was
57.09 cm, SD = ± 34.55 in NE aspect. The highest diameter at breast height was recorded 130cm
in NE aspect and 69.9 cm at in SW Aspect. Although the mean tree height was higher in NE
aspect, statistical test, U(16) = 33, p > .05) revealed no significant difference in mean tree height
between the two aspect
The Total Basal area was recorded highest at Plot 10 (965 m a.s.l) with TBA of 27888.29
cm2 in NE aspect with mean of 12590.34 cm2, SD = ± 6869.96. However, in SW aspect it was
recorded 20923.89 cm2 with a mean TBA of 11902.09 cm2, SD = ± 4934.99 but statistical test,
t(16) = -.239, p >.05) revealed no significant difference between the aspects.
Figure 4.7. Total Basal Area in SW and NE aspects.
0
20
40
60
80
100
120
140
P9
P8
P7
P6
P5
P4
P3
P2
P1
P1
0
P1
1
P1
2
P1
3
P1
4
P1
5
P1
6
P1
7
Max
. DB
H (
cm2) SW NE
Altitude
High Low Low High
25
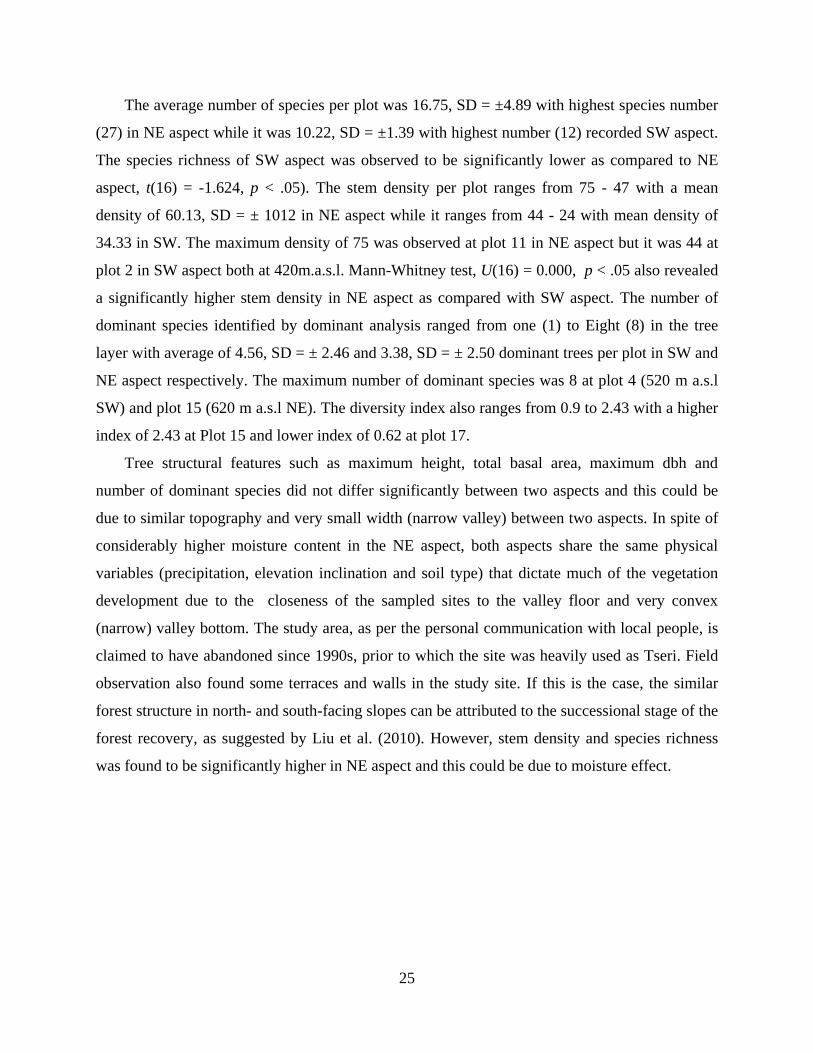
The average number of species per plot was 16.75, SD = ±4.89 with highest species number
(27) in NE aspect while it was 10.22, SD = ±1.39 with highest number (12) recorded SW aspect.
The species richness of SW aspect was observed to be significantly lower as compared to NE
aspect, t(16) = -1.624, p < .05). The stem density per plot ranges from 75 - 47 with a mean
density of 60.13, SD = ± 1012 in NE aspect while it ranges from 44 - 24 with mean density of
34.33 in SW. The maximum density of 75 was observed at plot 11 in NE aspect but it was 44 at
plot 2 in SW aspect both at 420m.a.s.l. Mann-Whitney test, U(16) = 0.000, p < .05 also revealed
a significantly higher stem density in NE aspect as compared with SW aspect. The number of
dominant species identified by dominant analysis ranged from one (1) to Eight (8) in the tree
layer with average of 4.56, SD = ± 2.46 and 3.38, SD = ± 2.50 dominant trees per plot in SW and
NE aspect respectively. The maximum number of dominant species was 8 at plot 4 (520 m a.s.l
SW) and plot 15 (620 m a.s.l NE). The diversity index also ranges from 0.9 to 2.43 with a higher
index of 2.43 at Plot 15 and lower index of 0.62 at plot 17.
Tree structural features such as maximum height, total basal area, maximum dbh and
number of dominant species did not differ significantly between two aspects and this could be
due to similar topography and very small width (narrow valley) between two aspects. In spite of
considerably higher moisture content in the NE aspect, both aspects share the same physical
variables (precipitation, elevation inclination and soil type) that dictate much of the vegetation
development due to the closeness of the sampled sites to the valley floor and very convex
(narrow) valley bottom. The study area, as per the personal communication with local people, is
claimed to have abandoned since 1990s, prior to which the site was heavily used as Tseri. Field
observation also found some terraces and walls in the study site. If this is the case, the similar
forest structure in north- and south-facing slopes can be attributed to the successional stage of the
forest recovery, as suggested by Liu et al. (2010). However, stem density and species richness
was found to be significantly higher in NE aspect and this could be due to moisture effect.

26
Figure 4.8. Forest structural features in SW and NE aspects (a) Species richness (b) Stem
density (c) No. of dominants (d) Species diversity
4.5. Natural Regeneration status in two Aspects
Young woody plants below the canopy are very important for forest stability and represent
the new generation of forest species. It also depicts the future forest type and structure. The
presence of natural regeneration was observed in all the plots except in plot 8 at 720 m a.s.l. The
Table (4.5) illustrates the composition and distribution of the natural regenerations by three
different life forms of evergreen broadleaved, deciduous and Shrubs including two unknown
species. The natural regeneration composition was based on the relative density in percent shared
by individual species in each plot. The regeneration composition also revealed the similar
patterns like trees resembling the maximum coverage by deciduous broadleaved species (47%)
followed by shrub with 35% and evergreen broadleaved with 14% as illustrated in figure (4.9).
0
10
20
30
40
50
60
70
80
90
P1 P2 P3 P4 P5 P6 P7 P8 P9
Ste
m D
ensi
ty/p
lot
Plot No.
SW
NE
(b)
0
1
2
3
4
5
6
7
8
9
P1 P2 P3 P4 P5 P6 P7 P8 P9
No.
of
Dom
inan
ts
Plot No.
SW
NE
(c) 0
0.5
1
1.5
2
2.5
3
P9
P8
P7
P6
P5
P4
P3
P2
P1
P10
P11
P12
P13
P14
P15
P16
P17
Div
ersi
ty (
H')
Plot No
SW NE
(d
0
5
10
15
20
25
30
P1 P2 P3 P4 P5 P6 P7 P8 P9
No
of
Spe
cie
s (N
)
Plot no.
NE
SW
(a)

27
0
10
20
30
40
50
60
70
80
90
100
P9
P7
P6
P5
P4
P3
P2
P1
P1
0
P1
1
P1
2
P1
3
P1
4
P1
5
P1
6
P1
7
Re
lati
ve D
en
sity
(%
)
Plot no. (A)
47%
14%
35%
1%3% Deciduous
Evergreen
Shrub
Palm
Unknown
(B
.
Figure 4.9. Life forms distribution of seedlings (A) in SW and NE aspects and their percent
coverage (B)
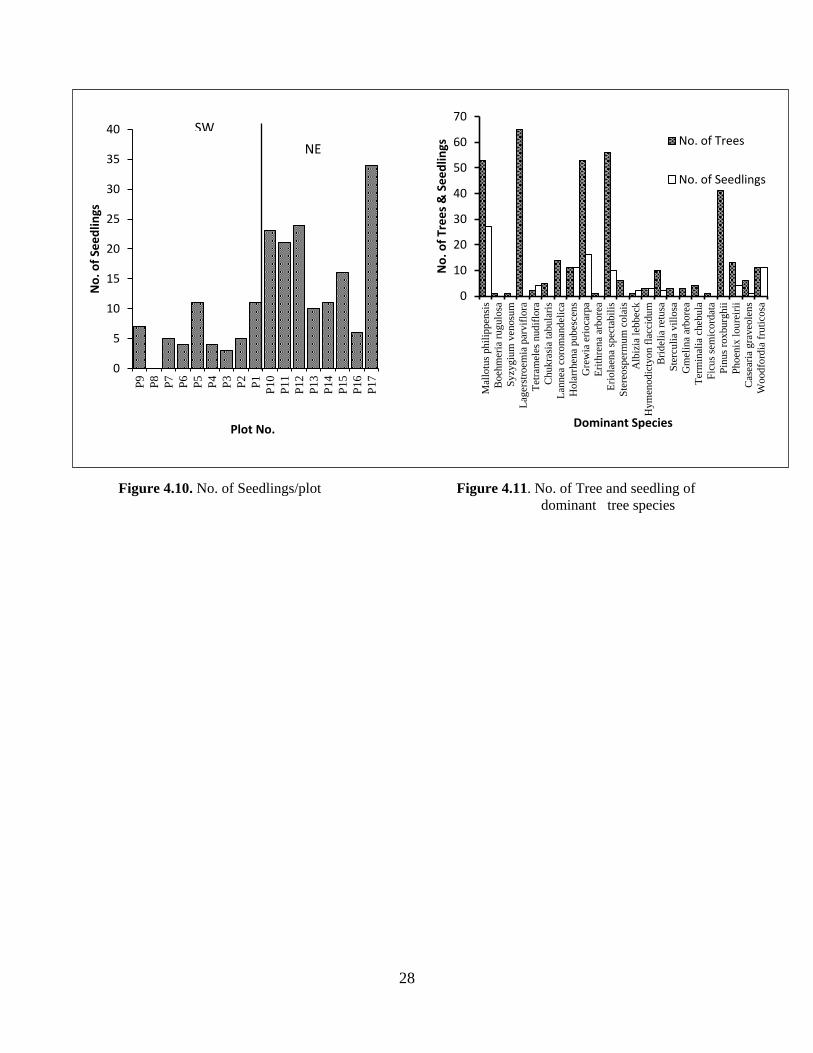
The average seedling count was found to be 11 seedlings per plot with maximum seedling
count recorded at plot 17 at 720 m a.s.l. with 34 numbers mainly dominated by deciduous
broadleaved species such as Grewia eriocarpa, Dalbergia sericea, Hymenodictyon flaccidum
and Eriolaena spectabilis. Comparatively higher numbers of seedling density was observed in
NE aspect with seedling count ranging 6-34 while it was 3 – 11 in SW aspect t(16) = -3.811, p >
.05).
The higher recruitment in NE aspect could also be attributed to higher moisture content and
the disturbance. The regeneration status and distribution of some of the dominant species was
observed along the series, figure (4.10) and (4.11). The regeneration of Grewia eriocarpa,
Dalbergia sericea , was observed from in almost all the plots however seedling of Pinus
roxburghii was not found in any of the studied plots.
NE SW
28
Figure 4.10. No. of Seedlings/plot Figure 4.11. No. of Tree and seedling of
dominant tree species
0
5
10
15
20
25
30
35
40P
9
P8
P7
P6
P5
P4
P3
P2
P1
P10
P11
P1
2
P13
P14
P15
P16
P17
No
. of
See
dlin
gs
Plot No.
NE
0
10
20
30
40
50
60
70
Mal
lotu
s ph
ilip
pen
sis
Bo
ehm
eria
rug
ulo
sa
Sy
zygiu
m v
enosu
m
Lag
erst
roem
ia p
arvif
lora
Tet
ram
eles
nu
dif
lora
Ch
uk
rasi
a ta
bu
lari
s
Lan
nea
coro
man
del
ica
Ho
larr
hen
a pubes
cens
Gre
wia
eri
oca
rpa
Eri
thre
na
arbore
a
Eri
ola
ena
spec
tabil
is
Ste
reo
sper
mum
cola
is
Alb
izia
leb
bec
k
Hy
men
od
icty
on f
lacc
idu
m
Bri
del
ia r
etusa
Ste
rcu
lia
vil
losa
Gm
elin
a ar
bore
a
Ter
min
alia
cheb
ula
Fic
us
sem
ico
rdat
a
Pin
us
rox
bu
rgh
ii
Ph
oen
ix l
ou
reir
ii
Cas
eari
a gra
veo
len
s
Wo
od
ford
ia f
ruti
cosa
No
. of
Tre
es
& S
ee
dlin
gs
Dominant Species
No. of Trees
No. of Seedlings
SW

29
Table 4. 5. Composition of seedlings in SW and NE aspects
Species Family P9 P8 P7 P6 P5 P4 P3 P2 P1 P10 P11 P12 P13 P14 P15 P16 P17
Altitude (m) 770 720 670 620 570 520 470 420 370 370 420 470 520 570 620 670 720
Deciduous
Grewia eriocarpa Malvaceae 42.9 25.0 4.3 4.8 20.8 20.0 9.1 12.5 8.8
Dalbergia sericea Fabaceae 42.9 40.0 8.7 4.2 10.0 18.2 31.3 16.7 8.8
Hymenodictyon flaccidum Rubiaceae 14.3
Albizia lebbeck Fabaceae 20.0 9.1 9.1 4.8 6.3
Eriolaena spectabilis Malvaceae 75.0 20.0 9.1 11.8
Dalbergia racemosa Fabaceae 25.0 45.5
Holarrhena pubescens Apocynaceae 80.0 9.1 8.7 20.0 6.3 2.9
Dalbergia stipulensis Fabaceae 9.1
Tetrameles nudiflora Tetramelaceae 17.4
Bridelia retusa Phyllanthaceae 8.7
Bauhinia purpurea Fabaceae 4.3 4.8
Premna sp Verbenaceae 4.2
Subtotal 100 0 60 100 55 25 0 80 27 52 14 29 70 36 56 17 32
Evergreen
Mallotus philippensis Euphorbiaceae 25.0 18.2 19.0 41.7 18.2 12.5 66.7 5.9
Celtis timorensis Cannabaceae 18.2
Pterospermum acerifolium Malvaceae 4.2
Subtotal 0 0 0 0 0 25 0 0 36 0 19 46 0 18 13 67 6
SW NE

30
Shrub
Desmodium oojinense Fabaceae 40.0 14.3 10.0
Rhus paniculata Anacardiaceae 27.3 4.8 8.3 18.8 14.7
Cipadessa baccifera Meliaceae 18.2 50.0 66.7 20.0 17.4 19.0 8.3 9.1
Fluggia Virosa Phyllanthaceae 9.1
Murraya koenigii Rutaceae 9.1 19.0 9.1
Tabernaemontana divaricataApocynaceae 21.7
Phyllanthus emblica Phyllanthaceae 8.7 10.0 18.2 16.7 8.8
Hyptianthera stricta Rubiaceae 9.5 4.2 9.1
Casearia graveolens Salicaceae 10.0
Woodfordia fruticosa Lythraceae 12.5 26.5
Zizyphus sp. Rhamnaceae 2.9
Subtotal 0 0 40 0 45 50 67 20 18 48 67 21 30 45 31 17 53
Palm
Phoenix loureirii Arecaceae 4.2 8.8
Subtotal 0 0 0 0 0 0 0 0 0 0 0 4 0 0 0 0 9
Unknown
Lea indica??? 33.3
Rubeaceae (Canthium) 18.2
Subtotal 0 0 0 0 0 0 33 0 18 0 0 0 0 0 0 0 0

31
11%
77%
2%3%
1% 0% 6% Grass
Shrub
Fern
Climber
Perennial
HerbAnnual Herb
Unknown
(B)
4.6. Ground layer Vegetation in SW and NE Aspects
Based on the quantitative ground vegetation data from two study sites, a total of fifty nine
(59) species belonging to 24 families including 14 unknown species were recorded. A total of 27
genera belonging to 18 families were recorded in South West aspect and 27 families with 32
genera were recorded in North East aspect. There were nine (9) annual herbs, eight (8) perennial
herbs, twelve 12 climbers, Five (5) ferns, seven (7) grass and four (4) shrub species. A total of 13
species belonging to 10 families were found to be common to both the sites. The most common
species which were widely distributed to both sites of the study area were Chromolaena
odoratum, Oplismenus burmannii, Lygodium japonicum, and Arundinella sp., Table (4.6).
Floristically, shrub had maximum coverage with 77% followed dominated mainly by
Chromolaena odoratum and 11% is covered by grass, Figure (4.12 (A) and (b)) which include
Arundinella sp and Oplismenus burmannii as dominating grass species. The lowest percentage
was of annual and perennial herbs with 1% and 0.4% which may be correlated with the season of
the study which was conducted during winter. The Highest diversity was 1.43 at 370 m.asl (P 10)
with highest species richness (17) and 0.22 was the lowest at 720 m.asl (P 8) with lowest species
richness (6).
Figure 4.12. Life forms of ground vegetation (A) Percent cover (B)
0
10
20
30
40
50
60
70
80
90
100
P9
P8
P7
P6
P5
P4
P3
P2
P1
P1
0
P1
1
P1
2
P1
3
P1
4
P1
5
P1
6
P1
7
RV
(%)
SW
Low High High Low Altitude
(A)
NE

32
Table 4.6. Ground vegetation composition in SW and NE aspects
Species Family Lifeform P9 P8 P7 P6 P5 P4 P3 P2 P1 P10 P11 P12 P13 P14 P15 P16 P17
Altitude (m) 770 720 670 620 570 520 470 420 370 370 420 470 520 570 620 670 720
Aspect
Cymbopogon sp. Poaceae Grass 13.1
Phragmites karka Poaceae Grass 7.4 1.8 10.3
Arundinella sp. Poaceae Grass 1.4 0.7 11.7 0.8 0.7 2.4 5.5 0.4 0.3
Oplismenus burmannii Poaceae Grass 0.5 0.6 1.0 1.9 21.9 26.7 61.3 2.1 1.3 1.5 0.1 0.7 1.2 1.6
Carex sp. Cyperaceae Grass 0.2 0.0 0.0 0.4
Apluda mutica Poaceae Grass 0.5
Imperata cylindrica Poaceae Grass 1.3 5.2
Sub Total 21.9 0.0 1.1 14.1 11.3 1.9 22.7 27.4 61.3 2.1 3.7 7.2 0.5 0.7 2.0 3.0 5.5
Chromolaena odoratum Asteraceae Shrub 73.8 95.9 67.2 64.4 83.3 72.3 57.3 56.7 19.9 62.9 91.1 84.1 95.5 96.8 93.8 94.1 91.2
Flemingia sp. Fabaceae Shrub 0.4 0.1 0.0 0.1 0.6
Desmodium sp. Fabaceae Shrub 0.2 0.1 0.0
Solanum viarum Solanaceae Shrub 0.2
Sub Total 74.2 95.9 67.2 64.4 83.5 72.4 57.3 56.7 19.9 62.9 91.3 84.1 95.5 96.8 93.8 94.1 91.7
Lygodium japonicum Lygodiaceae Fern 0.5 0.1 0.2 0.1 0.1 2.7 0.0 0.5 1.1 0.3 0.7 0.0
Asplenium sp. Aspleniaceae Fern 1.6 0.8 0.2 2.4 3.6 1.0 0.6 0.8 1.8
Lepisorus sp. Polypodiaceae Fern 0.0
Adiantum sp. Pteridaceae Fern 2.8 1.8 1.3 1.2 2.2 10.7
Thelylpteris sp. Thelypteridaceae Fern 0.1
Sub Total 0.5 1.6 0.8 2.8 1.9 1.5 1.2 2.2 10.8 0.2 5.0 3.6 1.5 1.6 1.1 2.5 0.0
Butea buteiformis Fabaceae Climber 0.6
Solena amplexicaulis Cucurbitaceae Climber 0.1
Stephania glabra Menispermaceae Climber 0.3 0.0 0.1 0.1 2.0 0.0 0.0
Mikania micrantha Asteraceae Climber 24.1 13.2
Cryptolepis buchanani Apocynaceae Climber 0.6 0.3 1.8
Perthenosisus sp. Vitaceae Climber 0.1
Thunbergia grandiflora Acanthaceae Climber 1.5
Tetrastigma sp. Vitaceae Climber 1.2
Dioscorea pentaphylla Dioscoreaceae Climber 1.5 1.3
Melodinus khasianus Apocynaceae Climber 0.0
Dioscorea hamiltonii Dioscoreaceae Climber 0.0
Ampelocissus sikkimensis Vitaceae Climber 1.2
Sub Total 0.6 0.1 0.3 0.0 0.0 24.1 0.0 0.7 0.3 17.8 0.0 3.6 0.0 0.0 2.6 0.0 0.0
SW NE

33
Staychys sp. Lamiaceae Perennial Herb 0.0
Asparagus racemosus Asparagaceae Perennial Herb 0.1 0.8 18.5 0.1
Peristrophe fera Acanthaceae Perennial Herb 0.1
Kyllinga sp. Cyperaceae Perennial Herb 0.2
Oxalis corniculata Oxalidaceae Perennial Herb 0.1
Hedychium sp. Zingiberaceae Perennial Herb 1.1
Vigna sp. Fabaceae Perennial Herb 1.0
Desmodium renefolium Fabaceae Perennial Herb 0.5
Sub Total 0.0 0.1 0.0 0.8 0.0 0.1 18.7 0.0 0.0 0.1 0.0 1.1 0.0 0.0 0.1 0.0 1.5
Duhaldea cappa Asteraceae Annual Herb 0.1 0.0 0.1 0.4
Barleria cristata Acanthaceae Annual Herb 0.0 0.0 0.2
Crassocephalum crepidioides Asteraceae Annual Herb 0.1
Peliosanthes griffithii Convallariaceae Annual Herb 0.1 0.1 0.1
Urena lobata Malvaceae Annual Herb 0.1 0.1 0.0
Croton sp. Euphorbiaceae Annual Herb 4.6
Hyptis suaveolens Lamiaceae Annual Herb 0.4
Ageratum conyzoides Asteraceae Annual Herb 0.0
Spermacoce sp. Rubiaceae Annual Herb 0.0
Sub Total 0.0 0.0 0.0 0.0 0.0 0.1 0.0 0.0 0.0 5.1 0.0 0.0 0.0 0.0 0.1 0.0 0.0
Carex like Unknown 2.2
Grass 2 Unknown 0.7 0.4 30.5 17.7 1.2 0.3
Grass 3 Unknown 1.8
Paedera like Unknown 0.1
Crawfurdia like Unknown 2.8 3.6
Ficus sp (Like) Unknown 0.4 0.1 2.5
Compositae Unknown 0.0 0.0
Grass 1 Unknown 13.0 3.9 0.4 2.3
Antada like Unknown 4.4
Cordate leaf (Climber) Unknown 3.6
Unknown climber Unknown 0.0
Grass 5 Unknown 0.8 0.3 0.3
Lonecera like Unknown 0.0
Grass 4 Unknown 0.3
Sub Total 0.0 1.8 0.1 0.0 3.2 0.0 0.0 13.0 7.6 10.5 0.0 0.4 2.4 0.8 0.3 0.3 0.3
34
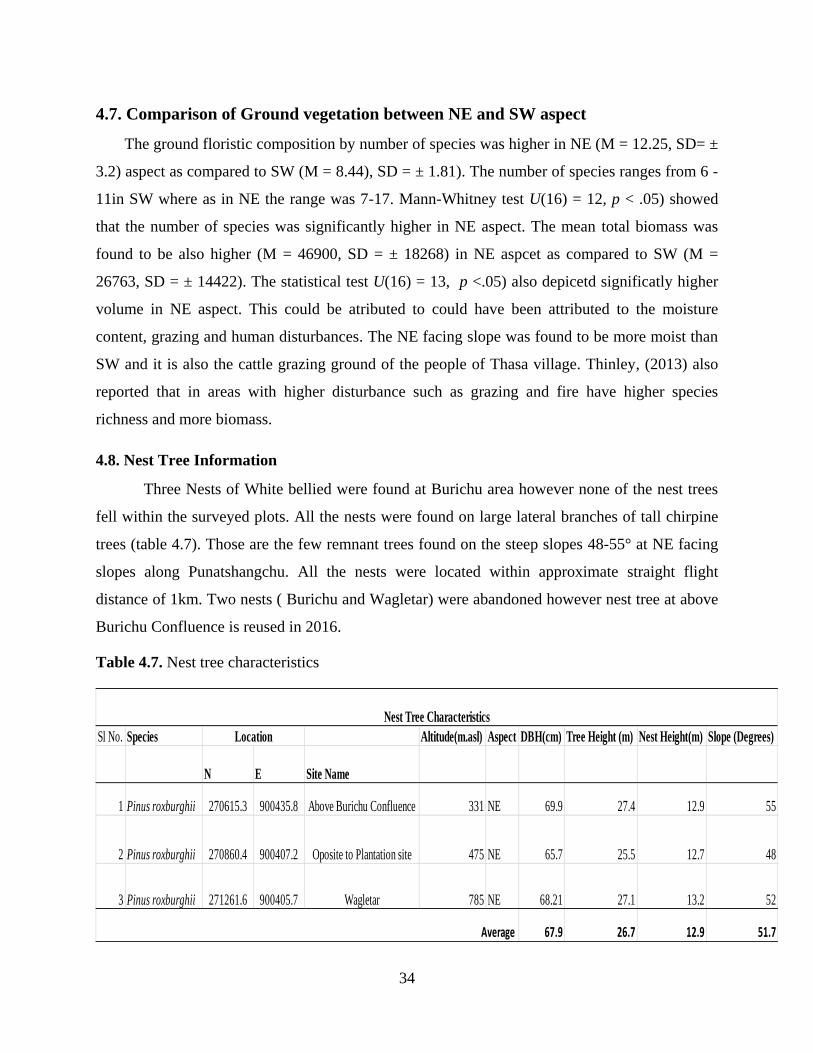
4.7. Comparison of Ground vegetation between NE and SW aspect
The ground floristic composition by number of species was higher in NE (M = 12.25, SD= ±
3.2) aspect as compared to SW (M = 8.44), SD = ± 1.81). The number of species ranges from 6 -
11in SW where as in NE the range was 7-17. Mann-Whitney test U(16) = 12, p < .05) showed
that the number of species was significantly higher in NE aspect. The mean total biomass was
found to be also higher (M = 46900, SD = ± 18268) in NE aspcet as compared to SW (M =
26763, SD = ± 14422). The statistical test U(16) = 13, p <.05) also depicetd significatly higher
volume in NE aspect. This could be atributed to could have been attributed to the moisture
content, grazing and human disturbances. The NE facing slope was found to be more moist than
SW and it is also the cattle grazing ground of the people of Thasa village. Thinley, (2013) also
reported that in areas with higher disturbance such as grazing and fire have higher species
richness and more biomass.
4.8. Nest Tree Information
Three Nests of White bellied were found at Burichu area however none of the nest trees
fell within the surveyed plots. All the nests were found on large lateral branches of tall chirpine
trees (table 4.7). Those are the few remnant trees found on the steep slopes 48-55° at NE facing
slopes along Punatshangchu. All the nests were located within approximate straight flight
distance of 1km. Two nests ( Burichu and Wagletar) were abandoned however nest tree at above
Burichu Confluence is reused in 2016.
Table 4.7. Nest tree characteristics
Sl No. Species Altitude(m.asl) Aspect DBH(cm) Tree Height (m) Nest Height(m) Slope (Degrees)
N E Site Name
1 Pinus roxburghii 270615.3 900435.8 Above Burichu Confluence 331 NE 69.9 27.4 12.9 55
2 Pinus roxburghii 270860.4 900407.2 Oposite to Plantation site 475 NE 65.7 25.5 12.7 48
3 Pinus roxburghii 271261.6 900405.7 Wagletar 785 NE 68.21 27.1 13.2 52
67.9 26.7 12.9 51.7
Location
Nest Tree Characteristics
Average
35
CONCLUSION
The dry slopes of Burichu harbored 56 species belonging to 30 families in tree and shrubs
layer while there were 59 species belonging to 24 families in ground layer. The forest is mainly
dominated by deciduous trees (65%) in lower and mid region of the study area while upper and
ridge top is dominated by Pinus roxburghii. Although there was difference in floristic
composition with respect to altitude, there were no or little differences in structural attributes.
No difference was observed between slope aspects with regards to species composition and
forest structural features since both aspects share the same physical variables (precipitation,
elevation and parent material) that dictate much of the vegetation development due to convex
nature of the study area. Nonetheless, stem density, seedling density and ground biomass were
found to be significantly higher in NE aspect. Forest at the study site could be broadly named as
deciduous forest however the forest was classified in to four types based on the similarity of
dominant species (Riverine, Deciduous broad-leaved, Broad leaved- Pine transitional and Pine
forest). These forests have conservation values as it provides nesting habitat for the critically
endangered WBH.
The north-facing forest is found to be more preferred nesting site by WBH. It is concluded
that the combined effects of topographical variability, slope aspect and human disturbance
regime determine the preference of nesting site by WBH.
A detailed vegetation, climate and soil study is suggested to better understand nesting
habitat requirement and preferences by White-bellied Heron in other areas of Butan. As there are
fewer regenerating species on the SW aspect, this study recommends toinclude the less
regenerating species in the plantation and reforestation programs. Further, Chirpine was found to
be poorly regenerating on both the aspects. As chir pine is important for white bellied heron
habitat, reforestation using Chir pine seedlings is suggested.
36
REFERENCES
Beard J.S. (1949). Natural vegetation of the Windward and Leeward Islands. Oxford Forestry
Memoirs 21: 1-192
Birdlife International,(2001). Threatened birds of Asia: the Birdlife International Red Data
Book. Cambridge, UK: Birdlife International
Chen, Z.S., Hsieh, C.F., Jiang, F.Y., Hsieh T.H. and Sun, I.H. (1997). Relations of soil properties
to topography and vegetation in a subtropical rain Forest in southern Taiwan. Journal of
Plant Ecology. 13 (2): 229-241.
Chhetri, P.B. (2004). Structure and Composition of Mixed Conifer Forests in Western Bhutan.
Thesis, MSc. in Mountain Forestry; University of Natural Resources and Applied Life
Sciences, Vienna
Coelho M.S, Almada E.D, Fernandes G.W, Santos R.M, Quintino A.V, Sánchez-Azofeifa A,
(2012). Floristic composition and structure of a tropical dry forest at different
successional stages in the Espinhaço Mountains, southeastern Brazil. Entomol. 53: 404-
414.
Deparment of Forests and Park Services. (2015). An overview of the Department of Forest and
Park Services. Retrieved from <http://www.dofps.gov.bt>Assessed on 9 November 2015.
Devlal, R., & Sharma, N. (2008a). Altitudinal changes in dominance-diversity and species
richness of tree species in a temperate forest of Garhwal Himalaya. Life Science Journal.
5 (2).
Franklin, J.F., and Spies, T.A. 1991. Composition, function, and structure of oldgrowth Douglas-
fir forests. General Technical Report PNW-GTR-285, USDA, Forest Services, Portland,
Oregon.pp 71-82.
Grierson, A. J. C., & Long, D. G. (1983). Flora of Bhutan, (Vol. 1 ). Royal Botanic Garden,
Edinburgh.
Gyaltshen, D. (2013). Structure and Floristic Composition of the Natural Sal (shorea robusta)
Forest along the hills of Gomtu, Southern Bhutan. Dissertation, BSc. Forestry, College
of Natural Resources, Punakha
Harmon, M.E., Bratton, S.P., White, S.P., (1983). Disturbance and vegetation response in
relation to environmental gradients in the Great Smoky Mountains. Vegetatio. 55:129-
139.

37
Hayat, M. S. A., & Kudus, K. A. (2010). Assessment of Plant Species Diversity at Pasir
Tengkorak Forest Reserve, Langkawi Island, Malaysia. Journal of Agricultural Science,
2(1).
IUCN, (2008). White-bellied Heron, IUCN 2008 Redlist retrieved from http://www.birdlife.org
Kawakita, J. (1956). Land and crops of Nepal Himalaya. Vegetatio
Liu, X., Zhang, W., Liu, Z., Qu, F., Song, W.,(2010). Impacts of land cover changes on Soil
chemical properties in Taihang Mountain, China. J. Food, Agric. Environ.
McComb, W.C., Spies, T.A. and Emminggham, W. H. 1993. Douglas-fir forests: Management
for timber and matured-forest habitat. Journal of Forests. 91:31-42
McElhinnya, C., Gibbonsb, P., Bracka, C., & Bauhusc, J. (2005). Forest and woodland stand
structural complexity: Its definition and measurement. Forest Ecology and Management,
218 (1-3), 1-24. Retrieved from http://www.sciencedirect.com/science
Nakao, S. (1995). Ecological notes. Kihara, H. ed. Fauna and Flora of Nepal Himalaya
Newton, P.N. (1988). Structure and phenology of a moist deciduous forest in the Central Indian
Highland. Vegetatio, 75:3-16.
Ohsawa, M. (1984a). Differentiation of Vegetation Zones and Species Strategies in the
Subalpine Rejoin of Mt. Fuji. Vegetatio. 57: 15-52
Ohsawa, M. (ed.) 1987. Life Zone Ecology of the Bhutan Himalaya. Laboratory of Laboratory of
Ecology, Chiba University, Japan.
Ohsawa, M.(1987). Vegetation Zones in the Bhutan Himalaya. Life Zone Ecology of the Bhutan
Himalaya: Chiba University, Japan
Oijen, D. V., Feijen, M., Hommel, P., Ouden, J. D., & Waal, R. D. (2009). Effects of tree species
composition on within-forest distribution of understory species.
Pielou, E.C. (1969). An Introduction to Mathematical Ecology. Wiley, New York, U.S.A.
PPD, & NSSC. (2011). Land cover Atlas of Bhutan; Land cover and area statistics of 20
Dzongkhags
Rinker HB, Lowman MD (2004) Insect herbivory in tropical forest. In: Lowman MD, Rinker HB
(eds) Forest canopies. Elsevier/Academic Press, San Diego, CA., pp 359-386
Robert, L. D., Patrick, J. L., & Bourgeron, S. (1991). A Preliminary Classification of the Plant
Communities of Northeastern Montana. Montana Natural Heritage Program.

38
RSPN, (2011). The Critically Endangered White-bellied Heron. Royal Soceity for protection of
Nature. Thimphu, Bhutan
Saxena, A. K., & Singh, J. S. (1984). Tree population structure of certain Himalayan forest
associations and implications concerning their future composition. Vegetatio. 58, 61-69.
Semwal, Nautiyal , S., Rao, K. S., Maikhuri, R. K., & Bhandari, B. S. (1999). Structure of
Forests Under Community Conservation: A Preliminary Study of Jardhar Village
Initiative in Garhwal Himalaya. Himalayan Ecology and Development, 7(2). Retrieved
from http://gbpihedenvis.nic.in/HTML/vol72/vol72-Semwal.htm
Shreve F. (1914). A Montane Rain Forest: A Contribution to the Physiological Plant Geography
of Jamaica. Publication Nº 199. Carnegie Institute. Washington, DC, USA. 110 pp
Shugart, H., Sedjo, R., & Sohngen, B. (2003). Potential Impacts on U.S. Forest Resources,
Prepared for the Pew Center on Global Climate Change. Forests & Global climate
change.
Snyder, M. (2010 ). What Is Forest Stand Structure and How Is It Measured? Retrieved from
http://northernwoodlands.org/articles/article
Spies, T. and Turner, M. (1999). Dynamics forest mosaics. In: M.L. (1999). Managing
Biodiversity in Forest Ecosystems. Cambridge University Press. pp 95-160.
Spies, T.A., (1998). Forest Structure: A key to the ecosystem. Northwest science.72. Special
Issue No.2, USA.
Tang, C. Q. & Ohsawa, M. (1999). Altitudinal distribution of evergreen broad-leaved trees and
their leaf-size pattern on a humid subtropical mountain, Mt. Emei, Sichuan, China.
Journal of Plant Ecology, 145, 221-223.
Tang, C. Q. and Ohsawa, M.(1997). Zonal Transition of Evergreen, Deciduous, and Coniferous
Forests along the Altitudinal Gradient on a Humid Subtropical Mountain, Mt. Emei,
Sichuan, China. Laboratory of Ecology, Chiba University, Japan.
Tenzin, P. (2013). Forest Structure and Composition along the Altitudinal Gradients of Sub-
Tropical Forest, Utarey - Ashinikhola, Gomtu. Dissertation, BSc. Forestry, College of
Natural Resources, Punakha
Vaidhayakarn, C. and Maxwel, J. F.(2010). Ecological status of the lowland deciduous forest in
Chang Kian Valley, Chiang Mai, northern Thailand. Maejo International Journal of
Science and Technology ISSN 1905-7873 Retrieved from www.mijst.mju.ac.th

39
Valerie, T., Eviner, F., & Stuart, C. I. (2001). Plant species provide vital ecosystem functions for
sustainable agriculture, rangeland management and restoration. California Agriculture,
55(6), 54-59.
Valerie, T., Eviner, F., & Stuart, C. I. (2001). Plant species provide vital ecosystem functions for
sustainable agriculture, rangeland management and restoration. California Agriculture,
55(6), 54-59.
Wangda, P. (2003).Forest zonation along the complex altitudinal gradients in a dry valley
Punatsang chu, Bhutan, Master’s thesis, The University of Tokyo, Japan.
Wangda, P., Pradhan, R., Choden, K. & Gyaltshen, D. (2009). Biodiversity Conservation and
Evaluation of Human Disturbances on the Cool Montane Evergreen Broad-leaved Forest
in the Mid Hills of the Bhutan Himalaya. Ministry of Agriculture and Forests, Thimphu,
Bhutan
Weaver P.L (2010). Forest structure and composition in the lower montane rain forest 0f the
luquillo mountains, puerto rico Interciencia 35: 640-646.
White, P.S. and Jentsch, A.,(2001). The search for generality in studies of disturbance and
ecosystem dynamics. Progress in Botany. 62: 400-450.
Whittaker, R.H. (1975). Communities and ecosystem. The Macmillan company, New York,
U.S.A.
Whittker, R.H. and Niering, W.A.,(1965). Vegetation of the Santa Catalina mountains, Arizona:
a gradient analysis of the south slope. Journal of plant Ecology. 46: 429-452.
World Wildlife Fund (2012). Eco-regions of Bhutan. Retrieved from
http://www.eoearth.org/view/article/177484

40
Some Photos from the field
Celtis timorensis, Cannabaceae, ET at P2(Alt: 420m) SW and at P10, P11(Alt: 370,420)m.asl NE
Desmodium oojinense, Fabaceae,
Shrub at P7, P8 (Alt: 670,720m.asl)
SW and at P11(Alt: 420masl)NE
Cipadessa baccifera , Meliaceae,Shrub at P2& P7 (Alt:420 and 670m.asl) SW & at P10, P11, P12,P14 (Alt: 370,420,470,570)m.asl
NE
Hymenodictyon flaccidum, Rubiaceae, Deciduous Tree at P2, P3 & P4 (420,470 & 520) m.asl SW and at P10,
P11,P13,P14,P15(370,470,520,570,620) m.asl NE

41
Pic 1. New distribution records of plants for Bhutan
a b
c d
Pic 1. Study Area (a)-Chirpine on ridge (b)-deciduous forest, (c) -Riverine and (d)-
Chromolaena odorata as dominating under shrub

42
APPENDICES
Form 1: Tree vegetation data collection form
Data Sheet ( Tree Vegetation ≥1.3)
Location: Plot No.:
Date: Aspect:
Altitude: Plot Size:
Inclination: Recorder
Northing: Easting:
Sp.No. Species Name DBH Ht. Status Stem Type

43
Form 2: Sapling and Seedling data collection sheet
Data Sheet for Seedling < 0.5m
Location: Plot No.:
Date: Aspect:
Altitude: Plot Size:
Inclination: Recorder:
Northing: Easting:
Sp. No. Species name (Seedling) Ht. Age

44
Form 3: Ground vegetation data collection sheet
Data Sheet (Ground Vegetation)
Location: Plot No.:
Date: Aspect:
Altitude: Plot Size:
Inclination: Recorder
Northing: Easting:
Sl/No Species Ht. (cm) C (%) Remarks