Assessment of Groundwater Vulnerability to Pollution Using ... · Assessment of Groundwater...
8
The Asian Review of Civil Engineering ISSN: 2249 - 6203 Vol. 4 No. 1, 2015, pp.20-27 © The Research Publication, www.trp.org.in Assessment of Groundwater Vulnerability to Pollution Using Modflow O. Ganesh Babu, R. Saravanan, M.C.Sashikkumar and S. Pitchaikani Anna University, Chennai, Tamil Nadu, India Abstract - Groundwater is one of the valuable resources in this world. Once the groundwater gets contaminated, remediation is very difficult. So the protection of groundwater against contamination is very important. The quality of groundwater in Noyyal River basin which passes through Tirupur block have been affected very much due to industrial effluents released by the dyeing and bleaching industries in Tirupur. In this context, the present study is an attempt to assess the aquifer vulnerability of Noyyal River basin using Visual Modflow. Groundwater flow for noyyal river basin has been simulated using Visual Modflow- MT3D a versatile groundwater software package. The aquifer characteristics, water level data, pumping wells, observation wells, concentration observation wells, ground surface and bottom elevation, Hydraulic conductivity, porosity, TDS concentration and boundary conditions have been used as model input. The model has been urn through MT3D engine, which is one of the sections in Visual Modflow model. The TDS pollution contamination zones have been find out and classified according to their ranges using Visual Modflow model. I. INTRODUCTION Groundwater is one of the important sources of water for the people of this world. The withdrawal of groundwater has been increased to a greater extent due to increase of population, industrialization and agriculture practices. However, disposal of various industrial effluents in water bodies, solid wastes which percolate and reaches the groundwater table and gets transported along with the direction of groundwater flow. As a result different pollutants reach the groundwater system and pose a threat to groundwater quality. Tirupur is a dry, water- scarce region which is facing the problem of environment pollution more because of the industries. One of the most significant challenges for the Tirupur textile industry today is water. Textile production, particularly dyeing and bleaching, can be water intensive and can generate large quantities of effluent. The qualities of groundwater are very affected by surrounding dyeing and bleaching industries. The disposal of industrial effluent into the Noyyal River leads to mass storage of waste water in the orathupalayam reservoir. The continuous storage of salt laden effluents in the reservoir, have resulted in the deterioration of groundwater quality in the areas surrounding the reservoir. From the reference of Ministry of Urban Development, the TDS value is less than 1000mg/l, which is denoted as Class-A, it has no detrimental effect on agriculture and acceptable as drinking water source, and also the TDS value in between above 1000mg/l to 7500mg/l which is denoted as Class-B, it is unfit for drinking and adverse effect on many crops. Hence, the study has been taken up to address the vulnerable area of different potential and also the identification of concentration areas due to TDS pollutant. The objective of the study to simulate the aerial extent of contaminant concentration using Visual Modflow – MT3D. II. STUDY AREA The area selected for this study is the Tirupur Block which is situated between 11 °N to 11°20' N Latitude and 77°10’E to 77°30’ Longitude. The area selected for this study is bounded by Palladam taluk and Pongalur block in south, Avinashi taluk in west and Erode district in north and east. Terrain Slope varies from 0 to 3% where most of the area has slope less than 1% which is almost flat. The block is drained by Noyyal River and Nallar River. The map of the study area as shown in Figure 1. Noyyal is a seasonal river, fed by the monsoons. The water flow is moderate for a short period during the monsoon season. Occasionally flash floods occur after heavy rain events. There are seven major tributaries, all originating from first or second order streams in the foothills of the Western Ghats. Floods are common during the rainy season due to the steep slopes in the upper part of the catchments. Rainfall in the basin is highly variable due to the orographic effects of the Western Ghats. The mountains form a “rain shadow area” over the plain which consequently has a dry climate. The average rainfall in the basin is about 700 mm. Geologically, the Tirupur Block fall under hard rocks such as granite and gneiss with weathering depth varying from 1-19 m underlie the area. 20 TARCE Vol.4 No.1 Jan - June 2015 TARCE Vol.4 No.1 Jan - June 2015
Transcript of Assessment of Groundwater Vulnerability to Pollution Using ... · Assessment of Groundwater...
The Asian Review of Civil Engineering ISSN: 2249 - 6203 Vol. 4 No. 1, 2015, pp.20-27
© The Research Publication, www.trp.org.in
Assessment of Groundwater Vulnerability to Pollution Using Modflow
O. Ganesh Babu, R. Saravanan, M.C.Sashikkumar and S. PitchaikaniAnna University, Chennai, Tamil Nadu, India
Abstract - Groundwater is one of the valuable resources in this world. Once the groundwater gets contaminated, remediation is very difficult. So the protection of groundwater against contamination is very important. The quality of groundwater in Noyyal River basin which passes through Tirupur block have been affected very much due to industrial effluents released by the dyeing and bleaching industries in Tirupur. In this context, the present study is an attempt to assess the aquifer vulnerability of Noyyal River basin using Visual Modflow. Groundwater flow for noyyal river basin has been simulated using Visual Modflow- MT3D a versatile groundwater software package. The aquifer characteristics, water level data, pumping wells, observation wells, concentration observation wells, ground surface and bottom elevation, Hydraulic conductivity, porosity, TDS concentration and boundary conditions have been used as model input. The model has been urn through MT3D engine, which is one of the sections in Visual Modflow model. The TDS pollution contamination zones have been find out and classified according to their ranges using Visual Modflow model.
I. INTRODUCTION
Groundwater is one of the important sources of water for the people of this world. The withdrawal of groundwater has been increased to a greater extent due to increase of population, industrialization and agriculture practices. However, disposal of various industrial effluents in water bodies, solid wastes which percolate and reaches the groundwater table and gets transported along with the direction of groundwater flow. As a result different pollutants reach the groundwater system and pose a threat to groundwater quality. Tirupur is a dry, water-scarce region which is facing the problem of environment pollution more because of the industries. One of the most significant challenges for the Tirupur textile industry today is water. Textile production, particularly dyeing and bleaching, can be water intensive and can generate large quantities of effluent. The qualities of groundwater are very affected by surrounding dyeing and bleaching industries. The disposal of industrial effluent into the Noyyal River leads to mass storage of waste water in the orathupalayam reservoir. The continuous storage of salt laden effluents in the reservoir, have resulted in the deterioration of groundwater quality in
the areas surrounding the reservoir.
From the reference of Ministry of Urban Development, the TDS value is less than 1000mg/l, which is denoted as Class-A, it has no detrimental effect on agriculture and acceptable as drinking water source, and also the TDS value in between above 1000mg/l to 7500mg/l which is denoted as Class-B, it is unfit for drinking and adverse effect on many crops. Hence, the study has been taken up to address the vulnerable area of different potential and also the identification of concentration areas due to TDS pollutant. The objective of the study to simulate the aerial extent of contaminant concentration using Visual Modflow – MT3D.
II. STUDY AREA
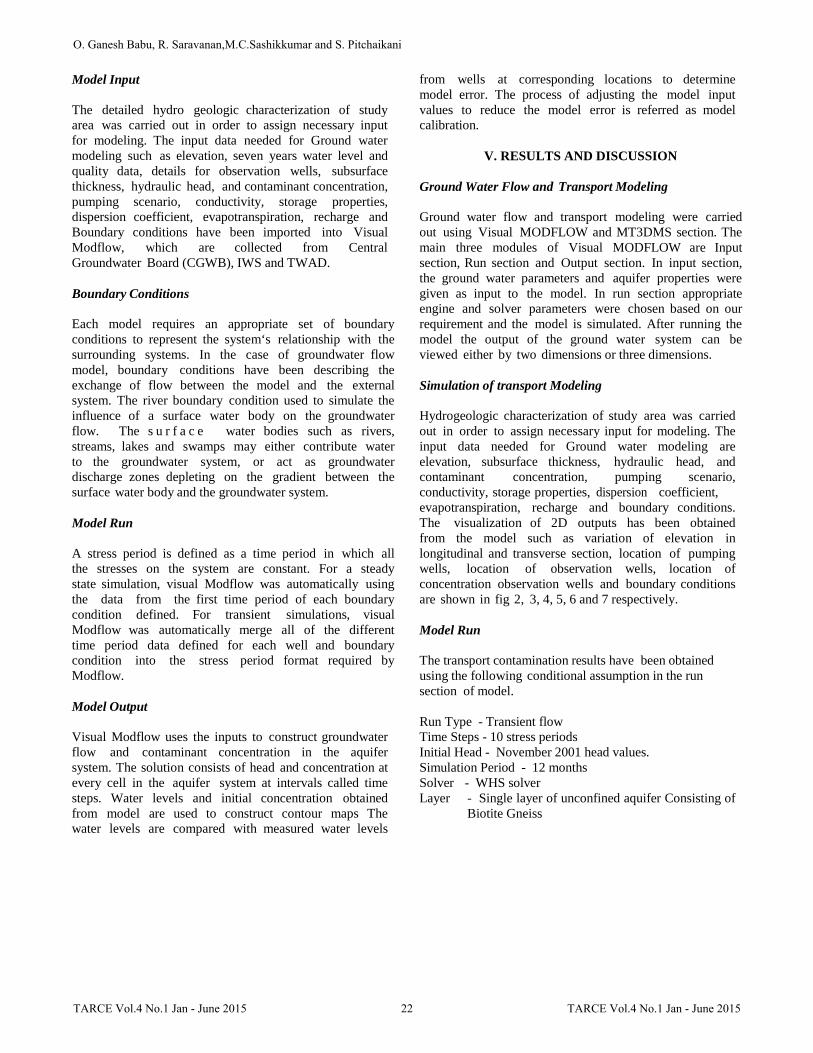
The area selected for this study is the Tirupur Block which is situated between 11 °N to 11°20' N Latitude and 77°10’E to 77°30’ Longitude. The area selected for this study is bounded by Palladam taluk and Pongalur block in south, Avinashi taluk in west and Erode district in north and east. Terrain Slope varies from 0 to 3% where most of the area has slope less than 1% which is almost flat. The block is drained by Noyyal River and Nallar River. The map of the study area as shown in Figure 1.
Noyyal is a seasonal river, fed by the monsoons. The water flow is moderate for a short period during the monsoon season. Occasionally flash floods occur after heavy rain events. There are seven major tributaries, all originating from first or second order streams in the foothills of the Western Ghats. Floods are common during the rainy season due to the steep slopes in the upper part of the catchments. Rainfall in the basin is highly variable due to the orographic effects of the Western Ghats. The mountains form a “rain shadow area” over the plain which consequently has a dry climate. The average rainfall in the basin is about 700 mm. Geologically, the Tirupur Block fall under hard rocks such as granite and gneiss with weathering depth varying from 1-19 m underlie the area.
20TARCE Vol.4 No.1 Jan - June 2015 TARCE Vol.4 No.1 Jan - June 2015
Fig.1 Tirupur Block
This formation was deeply weathered in the tertiary period. The study area consists of deep pediment along Noyyal river course from Sulur to Tirupur shallow pediment along the stream courses joining Noyyil River. The study area has hydrological soil group ‘B’ with moderate infiltration and moderate run off potential is comparatively found in larger areas of the block. The hydrological soil group ‘C’ with slow rate of infiltration and moderate runoff potential is also found in the block. The soil texture ranges from loamy sand to gravelly sandy clay loam. The common colour of soil found in the study area is reddish brown. The various land use categories observed in the study area are 65% of agricultural lands, forest lands, salt affected lands, waste lands,water bodies and settlements etc. There is a constant decrease in the percentage of agricultural lands from 72% (1971-72) to 65% (1997) of the total area of the block. Waste lands comprising of barren lands and rocky outcrops are present along with reserve forests. Total landuse are is 286.39 km2. Maximum and minimum deviations in landuse area are observed as 185.92 km2 and 8.71 km2 for agriculture and water bodies respectively.
III. METHODOLOGY
Groundwater flow is simulated using Visual Modflow which has the most complete and user-friendly modeling environment for practical applications in three-dimensional groundwater flow. And MT3DMS is one of the problems solving method in Visual Modflow which is used to determine the contaminant transport simulation. This is a fully-integrated package which combines powerful analytical tools with a logical menu structure. The model input parameters and results can be visualized in 2D (cross-section and plan view) and 3D at any time during the development of the model or the displaying of the results.
IV.GROUNDWATER FLOW AND CONTAMINANTTRANSPORT MODELING
Visual MODFLOW simulates ground water flow in
aquifer systems using block centered finite difference method. In this method, an aquifer system is divided into rectangle blocks by a grid. The grid of blocks is organized by rows, columns and layers and each block is commonly called a cell. For each cell within the volume of the aquifer system, aquifer properties and information related to wells, rivers and other inflow and outflow features are specified. The steady state and transient flow can be simulated for unconfined aquifers and confining units. The following equations 1 and 2 are used to find out the groundwater flow and transport concentration.
The governing equation for groundwater flow is ∂/∂x {Kx ∂h/∂x} +∂/∂y {Ky ∂h/∂y}+∂/∂z {Kz ∂h/∂z} =Ss ∂h/∂t (1) Where, Kx, Ky - Hydraulic conductivity along the horizontal Directions (x, y axes) Kz - Hydraulic conductivity along the vertical Directions (z axis) x ,y, z - Carte Sian coordinates directions H - Hydraulic head Ss - Specific storage of the porous material T - Time The governing equation for solute transport without chemical reactions The advection-dispersion equation which is embedded in MT3D was used for modeling
Where,
Dij = is the dispersion coefficient [L2/T]
C = is concentration [M/L3]Vi = is the groundwater velocity [L/T ], ( vi = qi /n) qi = is the specific volume flux and [L/T ] n = is the porosity
∂x i
∂ D
∂c −
∂ (v c) = ∂c
ij i j
∂xi
∂t ∂x
21
Assessment of Groundwater Vulnerability to Pollution Using Modflow
TARCE Vol.4 No.1 Jan - June 2015
Model Input
The detailed hydro geologic characterization of study area was carried out in order to assign necessary input for modeling. The input data needed for Ground water modeling such as elevation, seven years water level and quality data, details for observation wells, subsurface thickness, hydraulic head, and contaminant concentration, pumping scenario, conductivity, storage properties, dispersion coefficient, evapotranspiration, recharge and Boundary conditions have been imported into Visual Modflow, which are collected from Central Groundwater Board (CGWB), IWS and TWAD.
Boundary Conditions
Each model requires an appropriate set of boundary conditions to represent the system‘s relationship with the surrounding systems. In the case of groundwater flow model, boundary conditions have been describing the exchange of flow between the model and the external system. The river boundary condition used to simulate the influence of a surface water body on the groundwater flow. The s u r f a c e water bodies such as rivers, streams, lakes and swamps may either contribute water to the groundwater system, or act as groundwater discharge zones depleting on the gradient between the surface water body and the groundwater system.
Model Run
A stress period is defined as a time period in which all the stresses on the system are constant. For a steady state simulation, visual Modflow was automatically using the data from the first time period of each boundary condition defined. For transient simulations, visual Modflow was automatically merge all of the different time period data defined for each well and boundary condition into the stress period format required by Modflow.
Model Output
Visual Modflow uses the inputs to construct groundwater flow and contaminant concentration in the aquifer system. The solution consists of head and concentration at every cell in the aquifer system at intervals called time steps. Water levels and initial concentration obtained from model are used to construct contour maps The water levels are compared with measured water levels
from wells at corresponding locations to determine model error. The process of adjusting the model input values to reduce the model error is referred as model calibration.
V. RESULTS AND DISCUSSION
Ground Water Flow and Transport Modeling
Ground water flow and transport modeling were carried out using Visual MODFLOW and MT3DMS section. The main three modules of Visual MODFLOW are Input section, Run section and Output section. In input section, the ground water parameters and aquifer properties were given as input to the model. In run section appropriate engine and solver parameters were chosen based on our requirement and the model is simulated. After running the model the output of the ground water system can be viewed either by two dimensions or three dimensions.
Simulation of transport Modeling
Hydrogeologic characterization of study area was carried out in order to assign necessary input for modeling. The input data needed for Ground water modeling are elevation, subsurface thickness, hydraulic head, and contaminant concentration, pumping scenario, conductivity, storage properties, dispersion coefficient, evapotranspiration, recharge and boundary conditions. The visualization of 2D outputs has been obtained from the model such as variation of elevation in longitudinal and transverse section, location of pumping wells, location of observation wells, location of concentration observation wells and boundary conditions are shown in fig 2, 3, 4, 5, 6 and 7 respectively.
Model Run
The transport contamination results have been obtained using the following conditional assumption in the run section of model.
Run Type - Transient flow Time Steps - 10 stress periods Initial Head - November 2001 head values. Simulation Period - 12 months Solver - WHS solver Layer - Single layer of unconfined aquifer Consisting of
Biotite Gneiss
22
O. Ganesh Babu, R. Saravanan,M.C.Sashikkumar and S. Pitchaikani
TARCE Vol.4 No.1 Jan - June 2015 TARCE Vol.4 No.1 Jan - June 2015
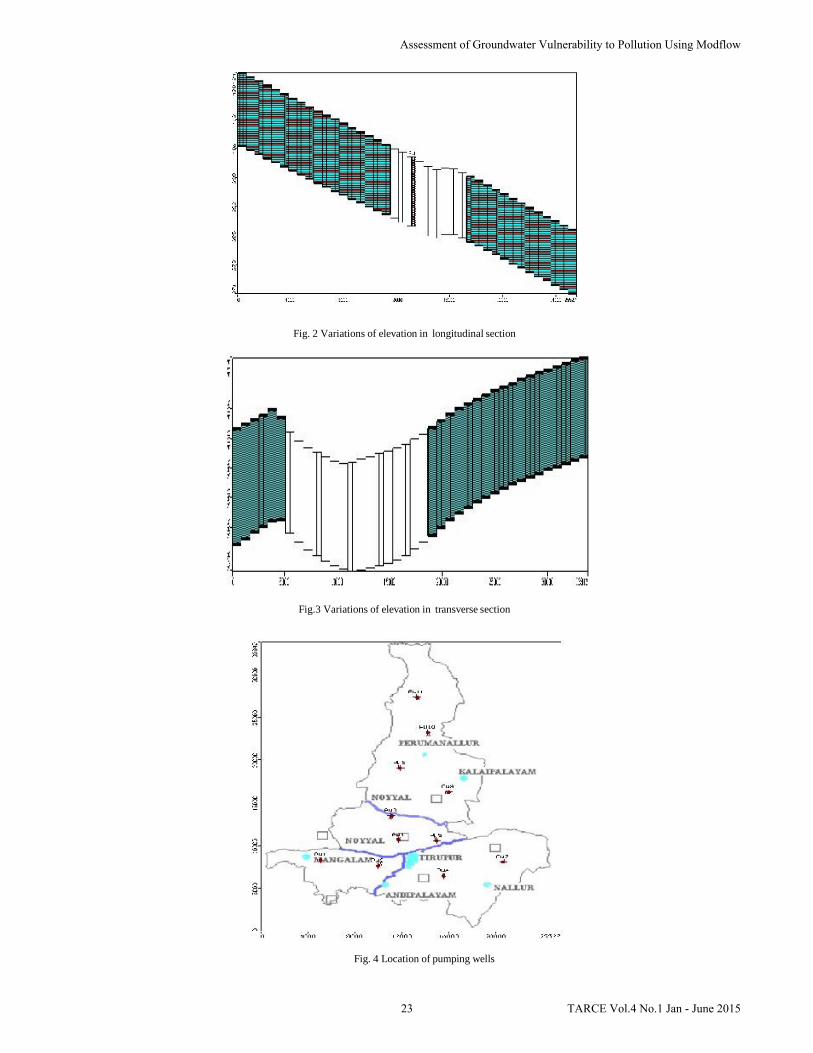
Fig. 2 Variations of elevation in longitudinal section
Fig.3 Variations of elevation in transverse section
Fig. 4 Location of pumping wells
23
Assessment of Groundwater Vulnerability to Pollution Using Modflow
TARCE Vol.4 No.1 Jan - June 2015
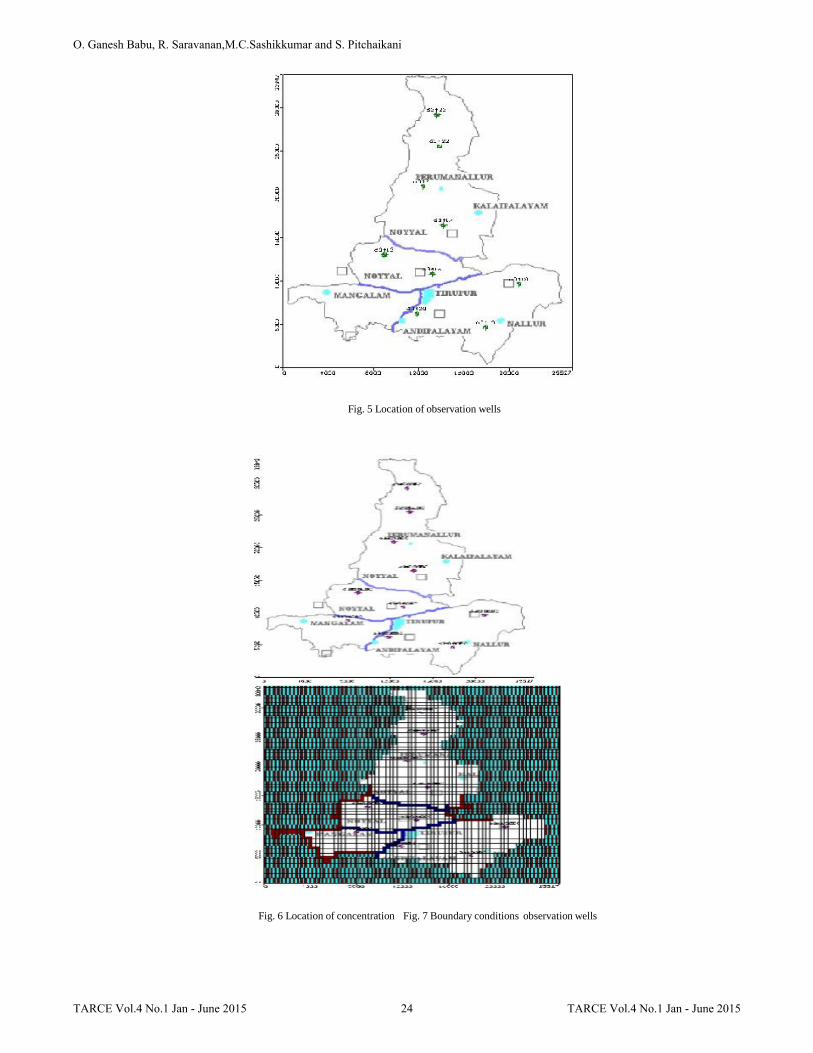
Fig. 5 Location of observation wells
Fig. 6 Location of concentration Fig. 7 Boundary conditions observation wells
24
O. Ganesh Babu, R. Saravanan,M.C.Sashikkumar and S. Pitchaikani
TARCE Vol.4 No.1 Jan - June 2015 TARCE Vol.4 No.1 Jan - June 2015
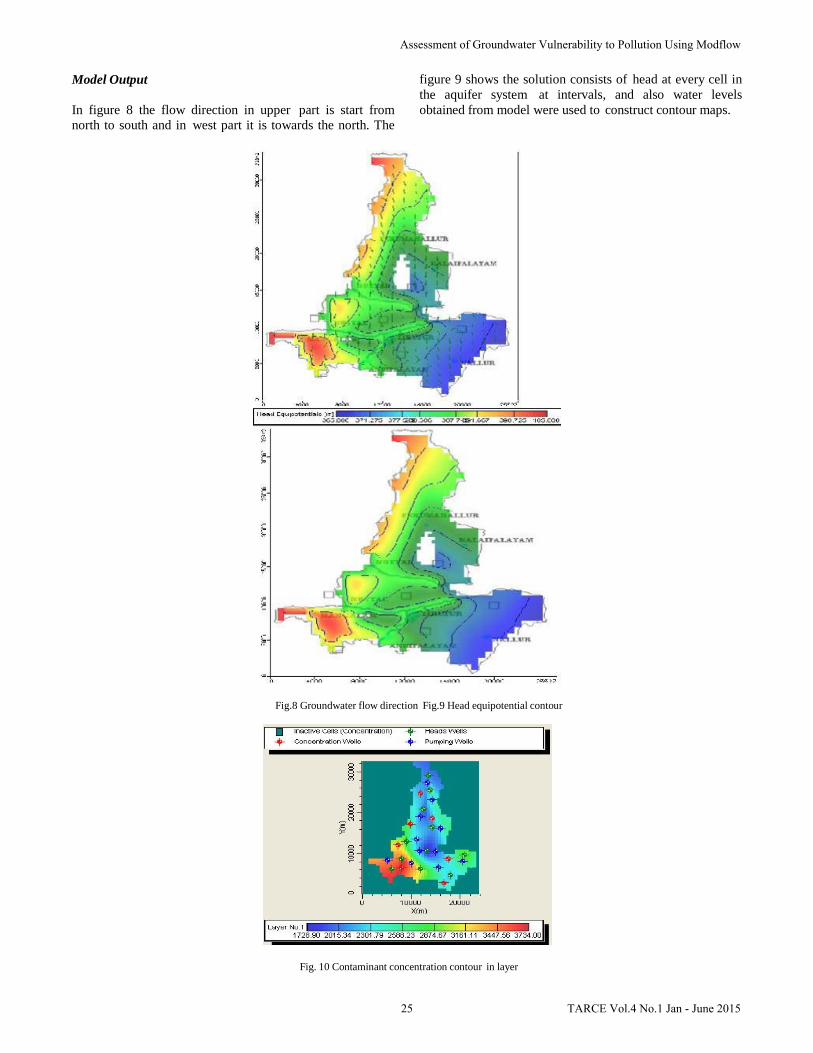
Model Output
In figure 8 the flow direction in upper part is start from north to south and in west part it is towards the north. The
figure 9 shows the solution consists of head at every cell in the aquifer system at intervals, and also water levels obtained from model were used to construct contour maps.
Fig.8 Groundwater flow direction Fig.9 Head equipotential contour
Fig. 10 Contaminant concentration contour in layer
25
Assessment of Groundwater Vulnerability to Pollution Using Modflow
TARCE Vol.4 No.1 Jan - June 2015
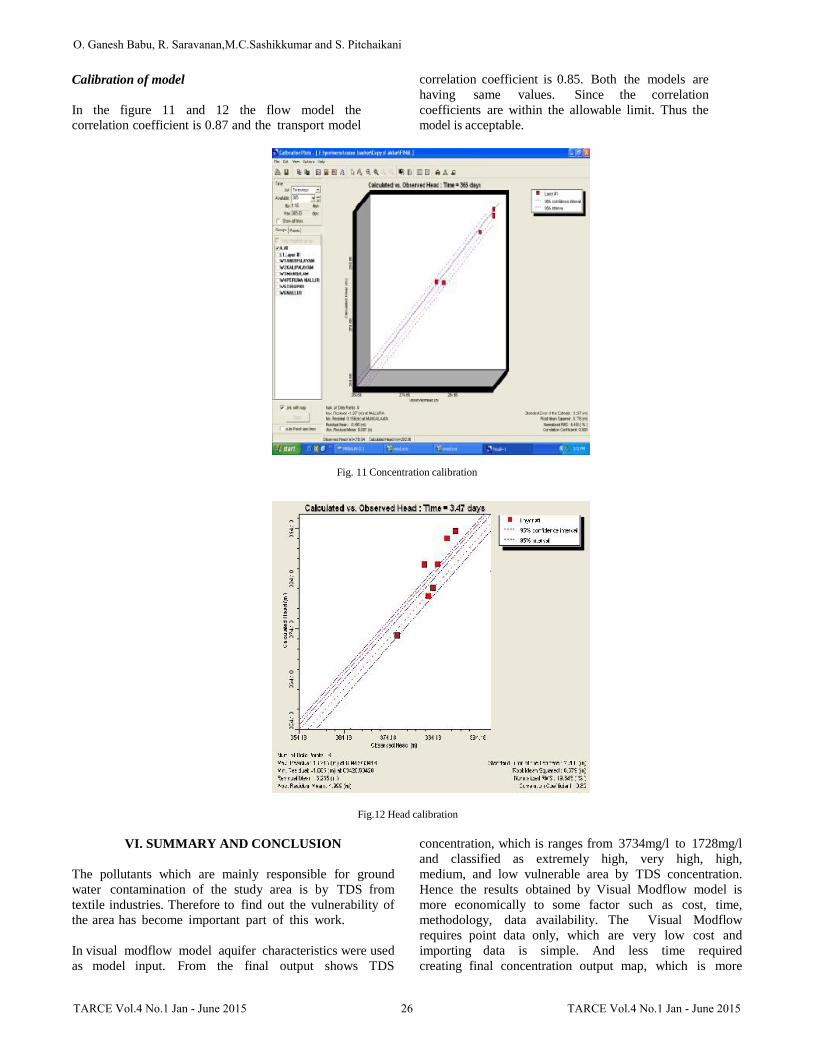
Calibration of model
In the figure 11 and 12 the flow model the correlation coefficient is 0.87 and the transport model
correlation coefficient is 0.85. Both the models are having same values. Since the correlation coefficients are within the allowable limit. Thus the model is acceptable.
Fig. 11 Concentration calibration
Fig.12 Head calibration
VI. SUMMARY AND CONCLUSION
The pollutants which are mainly responsible for ground water contamination of the study area is by TDS from textile industries. Therefore to find out the vulnerability of the area has become important part of this work.
In visual modflow model aquifer characteristics were used as model input. From the final output shows TDS
concentration, which is ranges from 3734mg/l to 1728mg/l and classified as extremely high, very high, high, medium, and low vulnerable area by TDS concentration. Hence the results obtained by Visual Modflow model is more economically to some factor such as cost, time, methodology, data availability. The Visual Modflow requires point data only, which are very low cost and importing data is simple. And less time required creating final concentration output map, which is more
26
O. Ganesh Babu, R. Saravanan,M.C.Sashikkumar and S. Pitchaikani
TARCE Vol.4 No.1 Jan - June 2015 TARCE Vol.4 No.1 Jan - June 2015
useful for macro/ Regional level preparation of vulnerable map. The final outputs shows Visual Modflow Model is the economically good model based on the above said factors.
REFERENCES
[1] Ali El-Naqa et al., (2006) “Gis –based evaluation of groundwater vulnerability in Russeifa area, Jordan”, revista mexicana de ciencias geological, vol.23, pp.277-287.
[2] Belmonte-Jinenez .S.I. et al., (2005) “Vulnerability to contamination of the Zaachila aquifer, Oaxaca, Mexico”, Geofisica International journal,Vol 44, Num 3, pp 283-300.
[3] Dixon .B (2004) “Prediction of Ground Water Vulnerability Using an Integrated GIS Based Neuro Fuzzy Techniques”, Environmental Science, Journal of Spatial Hydrology, Vol.2.
[4] Gurunadha Rao et al., (1999) “Mass transport modeling for assessement of groundwater contamination around Mathura oil refinery, Mathura, Uttar Pradesh, India”, Environmental Geology,Vol. 39, No. 10, pp. 1138-1146.
[5] Joao Paulo lobo-ferreira (2000) “GIS and mathematical modeling for
the assessment of groundwater vulnerability to pollution”, Application to two Chinese case study areas”, Ground Water Research Group,
[6] Laboratouio Nacional De Engenharia Civil., lisboa, Portugal, Aug 23-25.
[7] Jose Alfredo Ramos Leal et al., (2003) “Aquifer Vulnerability Mapping in the Turbio River Valley, Mexico: Validation Study”, Geofisical International, Vol.42, Num.1, pp.141-156.
[8] Kumar .C.S et al., (2004) “Predicting spatial distributions of vulnerability of Indiana state aquifer systems to nitrate leaching using a GIS”, I:/Journal/222.htm.
[9] Levent Tezcan et al., (2004) “surface cover infiltration index: asuggested method to assess infiltration capacity for intrinsic vulnerability in karstic areas in absence of quantitative data”, Int .J.Speleol.Vol.33, pp.35-48.
[10] Lobo-Ferreira .J.P et al., (2003) “Groundwater Vulnerability assessment of the Goa case study area”,Laboratorio Nacional de Engenharia Civil, Lisbon, Portugal, Goa University, Panaji, India.
[11] Mirela Pancescu (2004) “Phreatic aquifers vulnerability for Mostistea Plain using GIS technology”, National Inatitute of Hydrology and Water Management, Bucharest, Romania.
27
Assessment of Groundwater Vulnerability to Pollution Using Modflow
TARCE Vol.4 No.1 Jan - June 2015