Intrasplenic Behavior of Healthy and Diseased Red Blood Cells

Unit 2 • Chapter 5. Assessment of genetic damage in healthy and diseased tissue 63
Un
it 2
Ch
ap
ter
5
unit 2.biomarkers: practical aspects
chapter 5.
Assessment of genetic damagein healthy and diseased tissue
Joe Shuga, Pierre Hainaut, and Martyn T. Smith
Summary
DNA, along with other cellular components, is under constant attack by chemical, physical, and infectious agents present in the human environment, as well as by reactive metabolites generated by physiological processes. Mutations occur as the consequence of this damage, but may also be caused by improper DNA repair of alterations occurring during normal DNA replication and transcription. Genetic damage can occur at the level of the gene (e.g. point mutations, insertions, and deletions) or at the level of the chromosome (e.g. aneuploidy, translocations). Further, mutations can also take place in mitochondrial DNA. Another form of DNA modification is epigenetic methylation of CpG islands, which affects the dynamics of chromatin
as well as the expression of a large panel of genes.
Recent technical advances have improved the capacity to detect and quantify genetic and epigenetic changes. This chapter summarizes current knowledge on mechanisms of DNA damage and mutagenesis, laying out the concepts for interpreting mutations as biomarkers in investigating the causes and consequences of cancer. It also outlines both established and novel methods for detecting genetic and epigenetic changes in normal and diseased tissues, and then discusses their application in the realm of molecular epidemiology.
Introduction
The sequencing of the human genome has established the existence of about 22 000 protein-coding genes (1,2). Together these protein-coding genes only comprise 2–3% of the total genome, which amounts to approximately 3.25x10⁹ nucleotide base pairs. The great majority of DNA is actually not protein-coding and instead consists of regulatory sequences, sequences encoding regulatory and metabolic RNAs, and repetitive sequences. All sequences are assembled and replicated according to specific base pairing to form the double helix, which is packed with proteins into a structure called chromatin that forms chromosomes. Cells also contain non-genomic DNA: the mitochondrial genome, which is circular and composed of

64
16.6x10³ base pairs, is present in the cytoplasm at a copy number of ~102-104 per cell. Both genomic and mitochondrial DNA undergo structural alterations associated with disease (3–9).
Structural alterations in DNA occur through changes in DNA base pairing, as well as in its supra-molecular chromatin and chromosome organization (Figure 5.1). Base pairing changes are known as ‘mutations,’ while changes that do not modify the base pairing content of DNA but affect its expression, processing, metabolism, and stability are known as ‘epigenetic changes.’ The nature and type of mutations can vary by several orders of magnitude, from single base pair mutations to deletions or duplications encompassing whole chromosomes. Such changes are the causal defects of many diseases. Cancers, in particular, develop as the consequence of accumulated genetic and epigenetic
changes that affect the expression and activity of selected sets of genes, providing cells with selective growth advantages on the path to malignancy (10–12).
In recent years, technical advances have improved the capacity to detect and quantify genetic changes, paving the way for novel methods for early detection of mutations and for better understanding the mechanisms that have caused their formation. This chapter outlines several of these methods and examines their application in the area of molecular epidemiology and early detection of disease (Figure 5.2). It also provides a brief presentation of the more established methods available for detecting and measuring mutations in normal and diseased tissues. This information is presented in the context of current knowledge on mechanisms of mutagenesis, laying out the key concepts for interpreting the significance of mutations as
biomarkers in investigating the causes and consequences of cancer.
Mechanisms of mutagenesis
Mutations as biomarkers of early effects of carcinogens
In their seminal 1953 paper, Watson and Crick made one of the most famous understatements in biology: “It has not escaped our notice that the specific pairing we have postulated immediately suggests a possible copying mechanism for the genetic material.” Since then, DNA replication mechanisms and their associated repair systems have developed into a prolific field of research. Many human diseases, such as cancer, neurodegenerative, inflammatory, or autoimmune diseases, can be described as a disruption in the balance between correct and incorrect DNA synthesis (13).
Figure 5.1. DNA, chromatin structures, and chromosomes. The architecture of the genetic material, from DNA double-helix to packed chromosomes, is represented in relation with the level at which different forms of genetic modifications may occur (mutations, epigenetic changes, chromosomal aberrations)

Unit 2 • Chapter 5. Assessment of genetic damage in healthy and diseased tissue 65
Un
it 2
Ch
ap
ter
5
DNA, along with other cellular components, is under constant attack by reactive metabolites generated by physiological processes, as well as by chemical, physical, or infectious agents present in the human environment. It is estimated that each individual human cell can undergo damage to its DNA at a rate of up to 106 molecular lesions per day (14). This extensive DNA damage is compensated for and corrected by DNA repair systems. Thus, contrary to common perception, DNA is far from being carved in stone for eternity: its structure is highly variable, ever changing, and stabilized only by active biological processes that maintain the fidelity of DNA replication. Failure to detect, process, or repair DNA damage in an appropriate way leads to mutations.
Mutations occurring in the germline may be passed from one generation to the other and may form the underlying cause of inherited diseases. These germline mutations
are present in the genome of every cell of the resulting offspring, even those cells and tissues that do not express a phenotypic defect caused by mutation. Genetic changes can also be acquired by a somatic cell after conception; such mutations are not transmitted from one generation to the other. However, these acquired mutations are transmitted to all cells descended from the original cell that underwent the mutation, giving rise to a clone (colony) of cells carrying the mutation as a marker and possibly as a phenotypic trait. This is particularly spectacular in the case of cancer, which results from the proliferation of a single or a small number of clone(s) having acquired a selective growth advantage as the result of mutation. Cancer involves deep modifications of the cell genome through multiple steps of somatic mutations (15,16).
Genetic damage can occur at the level of the gene (e.g. point mutations, insertions, and deletions)
or at the level of the chromosome (e.g. aneuploidy, translocations). Historically, studies on genetic and genomic damage have tended to measure mutations in surrogate genes, such as hypoxanthine phosphoribosyltransferase (HPRT) and glycophorin A (GPA) (17), or to use cytogenetics to assess changes in chromosome structure and number, such as classical and banded chromosomal aberrations, sister chromatid exchanges, and micronucleus formation (18–21). These biomarkers have been shown to be associated with a wide range of carcinogenic exposures (22–26). However, mutations in surrogate genes are of limited value as biomarkers of early effect, since they are not on the causal pathway of disease.
During the past three decades, several hundred genes have been identified as recurrent sites for genetic or genomic damage in cancer cells. These genes provide
Figure 5.2. Scope of the chapter: biomarkers of early effects. This scheme shows sequential steps in the processes by which environmental exposures may deregulate genetic programmes, thus leading to cancer. This chapter focuses on the detection of genetic changes that are biomarkers of early effects of DNA damaging processes, and, in particular, on those biomarkers that are parts of the molecular pathways of disease causation. These biomarkers include DNA damage, mutations in genomic and mitochondrial DNA, chromosomal aberrations, epigenetic changes, and formation of micronuclei

66
a wide spectrum of biomarkers to detect early mutational and chromosomal effects of carcinogenic exposure in humans (27). These novel biomarkers measure changes frequently observed among cancer patients, including point mutations in genes such as TP53, ras, BRCA1/2, HER1/2, altered gene methylation, aneuploidy (chromosome loss or gain – including monosomy 7 and trisomy 8), and specific chromosome rearrangements such as translocations. Such changes are readily detectable in cancer cells. However, to exploit their value as biomarkers of early effect, they must be applicable to study individuals who may be at risk, but who do not yet have cancer. Such studies require detecting genetic changes that occur in single cells or a small number of cells that are morphologically undistinguishable from ‘normal’ cells. This is now feasible using cutting edge technologies such as real-time quantitative polymerase chain reaction (PCR), fluorescence in situ hybridization (FISH) analysis, and genotypic selection methods which introduce new levels of sensitivity and specificity. Such biomarkers are useful in epidemiological studies of environmentally induced cancers which have long latency periods, as well as providing early detection for those individuals at risk.
Sources of DNA damage
The elucidation of the human genome sequence has made it possible to identify genetic alterations in cancers on an unprecedented scale. Comprehensive analysis of the coding sequence of 13 023 genes in breast and colorectal cancers revealed that individual tumours accumulate, on average, approximately 90 mutant genes.
However, only a subset (about 11 per tumour on average) appears to be mutated at a significant frequency and may be considered as potential ‘drivers’ of the neoplastic process. Most other mutations appear to be ‘passengers,’ occurring as a consequence of the genetic instability of cancer cells (28,29). Currently, the list of genes affected by potential driver mutations includes about 300 candidates. An exhaustive discussion of each mutation known to be associated with cancer is beyond the scope of this chapter. The Human Gene Mutation Database (HGMD) compiles a list of mutations in the coding regions
of genes that are known to cause genetic defects (30–35) (http://www.hgmd.cf.ac.uk/ac/index.php). Single base pair substitutions account for about 50% of all mutations in the HGMD and include different subtypes (e.g. transitions or transversions) depending upon the nature of the base change. Other common changes include deletions, insertions, duplications, inversions, and alterations of unstable repeated sequences (Figure 5.3).
Epidemiological studies have demonstrated the links between carcinogen exposure and cancer in human populations. The type, route, and amount of exposure can
Figure 5.3. Distribution of mutation types in the HGMD database. The proportion of different types of mutations in the HGMD database is shown. A: Types of mutations. Indels: combined insertions and deletions. B: Types of base changes among missense mutations. Note that the two types of transitions are more common than the four types of transversions. Mutations at CpG sites represent about 65% of all G:C to A:T transitions. Source: http://lisntweb.swan.ac.uk/cmgt/index.htm

Unit 2 • Chapter 5. Assessment of genetic damage in healthy and diseased tissue 67
Un
it 2
Ch
ap
ter
5
determine the type of cancer. It also influences the type of genetic, genomic, and epigenetic alterations, leading in some instances to genetic changes that are ‘signature’ of specific environmental carcinogens. A typical example of such a ‘carcinogen fingerprint’ is C to T transition mutations at hotspot dipyrimidines sites in TP53 caused by ultraviolet radiation (36). However, such an unequivocal mutation pattern is the exception. In most instances, mutation patterns are complex, reflecting the diversity of exposures and mechanisms involved in carcinogenesis (37).
Many factors and agents can produce DNA damage leading to mutations. Highly reactive molecules, such as oxygen and nitrogen radicals, are produced
as by-products of physiological and pathological processes. DNA binding compounds can also form as the result of the enzymatic transformation of exogenous compounds, a process called carcinogen activation. These reactive products can induce covalent or non-covalent anomalies in DNA, resulting in various forms of base damage, single- or double-strand cuts, nicks, and gaps, and crosslinks (both intrastrand and interstrand) (38). Different forms of damage elicit distinct DNA repair reactions. The main forms of base damage are oxidized, reduced, and fragmented bases, as well as covalent adducts of small chemical groups (e.g. alkyl adducts) or large compounds (the so-called ‘bulky adducts’ induced by metabolites of
polycyclic aromatic hydrocarbons, arylamines, or mycotoxins). Imperfect repair of these lesions induces irreversible changes in the DNA base pairing. Carcinogen DNA fingerprints arise when a particular type of base pair change is frequently observed following exposure to a specific type of carcinogen. Table 5.1 shows a list of some chemicals that induce defined types of DNA lesions and describes the major types of mutations that result from these lesions in experimental systems.
Mutagenesis induced by exposure to carcinogens
Many carcinogens are lipophilic compounds that cross plasma membranes to accumulate in the
Table 5.1. DNA fingerprints of some exogenous and endogenous DNA-damaging agents
Site of pre-mutagenic lesion Mutagen Main mutations Possible TP53 fingerprint in:
N7-G AFB1 GC > TA Hepatocellular carcinoma
N2-G B[a]P-7,8-diol-9,10-epoxide (BPDE) GC > TA Lung cancer, smokers
O6-G N-Methyl-N-nitrosourea GC > AT Oral, esophageal cancer?
O6-G NNK GC > AT Lung cancer?
C8-G 1-Nitrosopyrene GC > AT, GC > TA ?
C8-G 4-Aminobiphenyl GC > TA Bladder cancer
C8-G 2-AAF GC > TA Bladder cancer?
C8-G PhIP GC > TA ?
8-oxo-G Oxidative agents GC > TA Many cancers, including lung
1,N2-G Malondialdehyde GC > TA, GC > AT ?
N6-A Stryene oxide AT > CG ?
N6-A Benzo[c]phenanthrene diol epoxides AT > TA, AT > GC Lung, esophageal cancer?
N6-A BPDE AT > GC Lung cancer
3,N4-C Vinyl chloride GC > AT Angiosarcoma of the liver
5-OH-C, 5-OH-U, uridine glycol Oxidative agents GC > AT ?
N3-U Propylene oxide GC > AT ?
Pyrimidine dimers UV CC > TT tandem,
GC > AT Non-melanoma skin cancer
Apurinic Depurinating agents GC > TA, AT > TA ?
? – No clear mutation fingerprint identified so farTable compiled from (235) and (236)

68
cytoplasm and the nucleus. To neutralize their immediate, toxic effects, cells mobilize complex enzymatic machineries acting as a first line of defence against DNA damage. Cytochrome P (CYP) 450 enzymes initiate a cascade of metabolic detoxification reactions by catalysing the addition of an oxygen atom to the carcinogen, increasing its solubility in water (Figure 5.4) (39,40). This process is amplified by conjugation enzymes, such as glutathione S-transferase, converting the oxygenated carcinogen to a soluble compound which is eliminated from the cell. These efficient detoxification reactions provide a first line of protection against the toxicity of chemicals (41). However, the reactive, water-soluble compounds
formed during this process often contain an electrophilic (electron-deficient) centre that can react with DNA bases at specific N and O positions resulting in the formation of covalent DNA adducts (Figure 5.4) (42–45).
The second line of defence is to remove damage through DNA repair proteins and pathways (46–48). The nucleotide excision repair pathway eliminates intra- and interstrand DNA crosslinks as well as bulky DNA adducts. Base excision repair (BER) eliminates and corrects bases damaged by small chemical groups (oxidized or methylated bases) or those fragmented by ionizing radiation or chemical oxidation. The frequent, miscoding, methylated base O6-methylguanine is repaired through a specialized mechanism
using the enzyme O6-methylguanine DNA methyltransferase (49–51). Repair mechanisms involve steps of damage removal (e.g. by DNA glycosylases in BER) followed by base incorporation reactions mediated by polymerases. Furthermore, some DNA lesions are not repaired at the same rate on both strands of the double helix. The transcribed strand is preferentially repaired during transcription-coupled repair, generating strand asymmetry in the distribution of some mutations induced by exogenous carcinogens, such as in cigarette smoke (Figure 5.5). In addition, repair is dependent upon sequence context. For example, in TP53, there is evidence that repair is slower at some of the major mutation hotspots than at other positions (52,53).
Figure 5.4. Carcinogen metabolism, DNA damage, and mutations: the example of aflatoxins. Aflatoxin is a widespread contaminant of the staple diet in tropical areas. This mycotoxin is metabolized in the liver to form epoxides that bind covalently to guanine at codon 249 in TP53. There is a synergistic effect between aflatoxin and chronic HBV infection in inducing a specific mutation which is found in about 50% of hepatocellular carcinomas in large regions of Africa and South-East Asia

Unit 2 • Chapter 5. Assessment of genetic damage in healthy and diseased tissue 69
Un
it 2
Ch
ap
ter
5
A third line of defence against DNA damage is provided by the cellular response to incomplete or imperfect DNA repair, which triggers suppressive mechanisms that prevent DNA replication. A key response in this process is stabilization and activation of the p53 protein, which induces either apoptosis or cell-cycle arrest, terminal differentiation, and senescence (54), thereby
permanently deleting damaged cells from the pool of cells capable of replicating their DNA. Cells that escape these mechanisms and proceed through replication undergo a replicative block due to the stalling of DNA polymerases at the site of a persistent lesion. To bypass this block, cells have evolved low-fidelity polymerases which resolve the lesion but are also error prone, often incorporating the
wrong base at the site of damage (13,55). Mutations arise when DNA adducts are bypassed incorrectly by these low-fidelity DNA polymerases. The variable fidelity of DNA copying mechanisms is one of the main molecular mechanisms of evolution: high-fidelity DNA synthesis prevents mutations and maintains stable genetic information over many generations, while low-fidelity DNA synthesis serves to generate diversity, leading to advantages for some individuals in a population subjected to selection pressures.
Spontaneous mutations
Many mutations occur without the involvement of exogenous DNA damaging agents. There are four main types of damage to DNA due to endogenous cellular processes: (1) base oxidation (e.g. 8-oxo-7,8-dihydroguanine (8-oxoG) and generation of single or double DNA strand breaks by reactive oxygen species); (2) base alkylation (e.g. methylation, such as formation of methylguanine); (3) hydrolysis (e.g. deamination, depurination, and depyrimidination); and (4) mismatch (due to DNA replication in which the wrong DNA base is incorporated into a newly synthesized DNA strand). It is estimated that spontaneous mutations occur in the coding regions of mammalian genomes at a rate of about 2.2x10⁻⁹ per base pair per year (56). This rate is similar among different genes, but is extremely variable at different base pairs. In particular, the CpG dinucleotides can mutate at a rate 10 times higher than other nucleotides, generating transitions (57,58). About 3–5% of cytosines at CpG dinucleotides in the human genome are methylated at position 5ʹ by a post-replicative mechanism catalysed by DNA methyltransferase. The 5-methylcytosine (5mC) is less
Figure 5.5. Distribution and strand bias of TP53 mutations in lung cancers in relation with tobacco smoke. The proportion of each base change in lung cancers is shown for smokers and non-smokers. Differences between two symmetric base changes demonstrate a strand bias (e.g. G:T versus C:A). Note the strand bias for transversions (G:C to T:A and A:T to C:G) in smokers. In non-smokers, these mutations are less frequent and do not show a strand bias. Strand bias is indicative of DNA damage by bulky adducts that stall polymerase and trigger transcription-coupled repair on the transcribed strand. Source: (54) with permission of Oxford University Press.

70
stable than cytosine and undergoes spontaneous deamination into thymine at a rate five times higher than the unmethylated base. The instability of CpG dinucleotides has led to their negative selection and subsequent loss during evolution. CpG dinucleotides represent less than 1% of the genome, one-seventh of their expected frequency assuming an equal proportion of all dinucleotide motifs, yet they are the site of roughly 25% of all known mutations in human disease that are listed in the HGMD database. In TP53’s DNA binding domain, which is a major site for mutations linked to cancer, there are 22 CpG dinucleotides located within 600 bp of coding sequence. Transitions at these CpG dinucleotides represent about 25% of all reported mutations, with a range from about 15% in lung cancers of smokers (in which many mutations are caused by tobacco carcinogens rather than by spontaneous mechanisms) to close to 50% in adenocarcinomas of the gastro-digestive tract (Figure 5.6) (59). Deamination of 5mC is enhanced by oxygen and nitrogen radicals, leading to a higher load of these mutations in cancers occurring
within the context of inflammatory precursor lesions, such as Barrett’s mucosa or ulcerative colitis (60,61).
Small insertions and deletions arise during replication through a mechanism known as the slipped-mispairing model (32). In this model, nucleotide skipping and/or misincorporation results from transient misalignment of the primer to the template due to the looping out of a base (or a short stretch of bases) from the template. This phenomenon preferentially occurs within runs of identical bases or in regions containing repetitive DNA sequences. Increased length of monotonic runs correlates with increased frequency of insertion/deletion events (62).
Mutation patterns in relation to cancer risk factors
The ‘mutation pattern’ concept is of central importance in assessing the value of mutations as biomarkers of early effects of carcinogens. Assessing a mutation pattern relies on six critical points: (1) type of mutation; (2) nucleotide change(s); (3) sequence context; (4) strand distribution; (5) occurrence of the
mutation at a position of known structure or function (e.g. mutations in exons, introns, at mRNA splice junctions, or other structures involved in mRNA processing, within promoter regions, etc.); and (6) consequence of the mutation on the gene structure and its coding potential (e.g. silent, missense, nonsense, mutations affecting exon processing, or expression levels) (63). A mutation pattern occurs when there is a significant difference in any of these elements, or combination thereof, between a set of ‘test’ mutations (e.g. mutations identified in a particular type of disease and exposure, such as lung cancers of smokers) and a set of ‘reference’ mutations (e.g. lung cancers of never-smokers).
The formation of a mutation pattern can be seen as the result of a complex process of mutation selection through a succession of filters (Table 5.2). The first filter consists of the chemical properties of the carcinogen and of its cellular activation process. Carcinogens can damage DNA in specific ways, generating lesions that reflect the chemistry of DNA damage (64). Base position, accessibility, and
Figure 5.6. Patterns of TP53 mutations in lung cancers of smokers, colorectal cancer, and adenocarcinoma of the oesophagus. The proportion of different mutation types is shown in lung cancers of smokers and in two cancers which commonly develop in an inflammatory context (e.g. colitis in colon cancer, Barrett’s mucosa in oesophagus). CpG transitions are more frequent in colon and esophageal ADC as compared to lung/smokers. In contrast, transversions are more common in lung/smokers than in colon and esophageal ADC. Data from IARC TP53 database, release R12 (http://www-p53.iarc.fr)

Unit 2 • Chapter 5. Assessment of genetic damage in healthy and diseased tissue 71
Un
it 2
Ch
ap
ter
5
sequence context are important factors that determine the type of DNA damage, forming a second filter (63). The third filter consists of DNA repair, which removes the majority of lesions, but does so in a selective manner such that all types of lesions are not eliminated with the same efficiency (46). A strand bias towards preferential repair of the transcribed strand is suggestive of selective removal of bulky, polymerase-blocking lesions during transcription (65). DNA replication and polymerase fidelity constitute the fourth filter (13). The final filter is the biological selection process that chooses cells with mutations that confer a selective advantage on the path to neoplastic transformation (66,67).
Until recently, most of our knowledge on mutation patterns in cancer was based on studies of a handful of genes frequently mutated in human cancers, including members of the ras family and TP53. Mutations in K-ras occur in up to 20–40% of common cancers, such as breast, colon, and pancreas and adenocarcinoma of the lung. The most common mutation is at codon 12, effectively limiting the spectrum of the mutation pattern to three different bases. TP53 in contrast, offers a wider target for assessing mutation patterns since most mutations fall within a domain that spans about 600 nucleotides. Moreover, over 75% of all mutations are point mutations, providing a good representation of many different types of base changes. Figure
5.7 summarizes some of the most characteristic mutation patterns identified by sequencing TP53. Current efforts aimed at large-scale, high-throughput sequencing of tumour DNA are producing a wealth of mutation data that essentially recapitulate the mutation patterns observed in TP53. An interesting difference is the higher prevalence of the rare G to C transversions in breast cancer, identified by large-scale sequencing, as compared to TP53 sequencing. This observation suggests that some unidentified carcinogen causing such mutations may be involved in mutagenesis leading to breast cancer (68).
Mutation databases provide a repository and quick access for published mutation data, with annotations that allow users to select
Table 5.2. Formation of a mutation pattern through a succession of ‘filters:’*The example of benzo(a)pyrene from tobacco smoke
Exposure Tobacco smoke contains over 60 substances classified as carcinogenic to humans by IARC, including 1 to 40 ng Benzo[a]Pyrene (B[a]P)/cigarette
Filter Example Type of Lesion
Filter 1 Chemistry of DNA damage B[a]P is metabolized by CYP450 to generate BPDE that binds on the N2 position of guanine
BPDE-N2-dG adduct
Filter 2 Base position and sequence context
Adducts preferentially form at G adjacent to methylated cytosines at mCpG sites
Major adducts at codons 156, 157, 245, 248, 273
Filter 3 DNA repair Transcription-coupled repair preferentially removes lesions on the TS
Strand bias with persistence of adducts on G on the NTS
Filter 4 DNA replication Lesion bypass of an adducted template by Pol η mis-incorporates A instead of C; replication results in substitution of G to T opposite to misincorporated A
Formation of G to T transversions
Filter 5 Protein filter Only mutations that inactivate p53 protein contribute to the clonal expansion of cancer cells and are detectable in cancer lesions
Selection of mutations at codons 157, 245, 248, 273; counter-selection of mutation at codon 156, which is silent.
Mutation pattern in cancer Excess of G to T transversions on the NTS at specific codons in lung cancers of smokers
*Refers to specific criteria that can influence mutation pattern formation.BPDE, B[a]P-7,8-diol-9,10-epoxide; TS, transcribed DNA strand; NTS, non-transcribed strandTable compiled from (235)

72
reference data sets and compare mutation patterns. Examples of such databases are given in Table 5.3. However, these databases are subject to many biases since they compile data from studies that differ in size, methods, design, case selection criteria, and annotations, and are prone to publication bias (reviewed in (69)).
Multistep carcinogenesis
Neoplasia is a multistep process. Experimental studies have demonstrated that the tumorigenic conversion of normal human fibroblasts requires the concerted disruption of several signalling pathways. The number and sequence of genetic changes required for neoplastic transformations varies according to species and according to cell type within species (70). Moreover, particular genes, chromosomal
regions, and entire chromosomes are vulnerable to mutation at variable points in carcinogenesis (16). This suggests that certain mutations play a role in the ability of a cell to survive and continue to the next step of this multistep process and determine what the next mutation will be. These mutations, particularly early events, may provide markers indicative of genetic damage and potential cancer risk.
Since much of cancer research depends on backtracking from tumour tissue, it is difficult to assess the time point at which one mutation arose relative to another. Comparison between ‘early stage’ versus ‘late stage’ lesions does not entirely eliminate this difficulty, because lesions deemed ‘early stage’ are not necessarily the temporal predecessors of those deemed ‘late stage.’ However, models of temporal sequence of genetic events have been
developed and have provided valuable information on the clonal and genetic progression of cancer. The archetype of these models was developed for colon cancer (16) (Figure 5.8). This model takes advantage of the fact that colon cancer has distinct morphological stages that define a pathological progression sequence, from polyp to adenoma and then carcinoma. By assessing the predominant mutations in each morphological stage, it has been possible to identify sequential genetic changes that underpin the morphological changes. From normal tissue, the model proposes that cells acquire one mutation after another, beginning with the loss of a key gene involved in cell proliferation (activated protein C (APC), detectable in benign polyps), aberrant methylation, further mutation of oncogenes (K-ras, detectable in many adenomas), and
Figure 5.7. Examples of mutation patterns and carcinogen fingerprints in TP53. Three well described ‘carcinogen fingerprints’ are represented. Solar UV induces a characteristic DNA lesion, dipyrimidine dimer, leading to CC to TT transitions at adjacent cytosines in non-melanoma skin cancer. Aflatoxin metabolites form adducts on the N7 position of guanine at the third base of codon 249 in TP53, leading to AGG to AGT transversion mutations at that codon in hepatocellular carcinoma. Polycyclic aromatic hydrocarbons from tobacco smoke induce adduct formation on N2 position of several guanines, leading to frequent transversions at several codons in lung cancers of smokers. Source: (70) with kind permission from Springer.

Unit 2 • Chapter 5. Assessment of genetic damage in healthy and diseased tissue 73
Un
it 2
Ch
ap
ter
5
finally loss of DCC and TP53, which are frequent events in carcinomas and may push the cell over the malignant cancer threshold. This concept has been expanded to other cancer types (Figure 5.8). It is important to note the differences in occurrence of mutations in each cancer type. For example, TP53 mutations are believed to be early or predisposing events in astrocytoma and breast cancers, but are proposed to be later events in colon carcinogenesis. However, this order is not invariant and accumulation of mutations is the key factor in progression towards malignancy.
Mutations in mitochondrial DNA
The mitochondrial genome is ~16.6x10³ base pairs in length, exists at a copy number of ~102-104 per cell, and is densely packed in protein coding sequence (~93%
is used to encode 37 genes). Functional changes in mitochondria were associated with cancer as early as 1956, when Warburg proposed that irreversible damage to the respiration was a necessary first step in carcinogenesis (71–73). Changes in mitochondrial DNA (mtDNA), specifically, were associated with cancer as early as 1967, when a series of reports showed that the frequency of aberrations (in this case, multiple copy-length circular molecules) in mtDNA was increased in the leukocytes of granulocytic leukaemia patients (9,74–76). The presence of mtDNA mutations was reported in seven out of 10 colorectal cancer cell lines examined, with a predominance of mitochondria containing multiple copies of the mtDNA (7). It was then demonstrated that the mtDNA mutations were somatic, since they were found in the primary tumours from which the cell lines were derived, but not
in normal tissues from the donors. In many cases, the mutations were homoplasmic, meaning that a single mutated mitochondrion had selectively proliferated over all others in a single cell (7).
Recent reports have documented somatic mtDNA mutations in tumours of the bladder, breast, prostate, head and neck, lung, liver, kidney, brain, stomach, pancreas and in the haematologic malignancies leukaemia and lymphoma. These findings support the notion that mtDNA mutations contribute to tumour growth (4,5,77–88). Furthermore, the copy number for mtDNA was recently found to be significantly increased in workers exposed to high levels (> 10ppm) of benzene, a carcinogen that causes leukaemia (89,90). It is not yet understood how mutations in mtDNA accumulate within tumours, but both theoretical and empirical approaches have suggested that
Table 5.3. List and web links of selected mutation databases
Database Name Content and Scope Web Link
Catalogue of Somatic Mutations in Cancer (COSMIC)
Global catalogue of somatic mutations in 4773 cancer related genes; contains over 70 000 mutations
http://www.sanger.ac.uk/genetics/CGP/cosmic/
IARC TP53 mutation database Comprehensive database of TP53 mutations in human tissues; contains over 25 000 entries
http://www-p53.iarc.fr/
The Human Genome Variation Society (HGVS) The most comprehensive list of single-locus mutation databases and a portal to access them
http://www.hgvs.org/dblist/dblist.html
Mitochondrial Mutations (MITOMAP) Compendium of polymorphisms and mutations of the human mitochondrial DNA
http://www.mitomap.org/
Mitelman Database of Chromosome Aberrations in Cancer
Chromosomal aberrations in relation to tumor characteristics, based either on individual cases or associations
http://cgap.nci.nih.gov/Chromosomes/Mitelman
The Mammalian Gene Mutation database (MGMD)
Searchable database of published mutagen-induced gene mutations in mammalian tissues
http://lisntweb.swan.ac.uk/cmgt/index.htm
Genetic Alterations in Cancer (GAC) Comprehensive collection of data compiled from studies reported in the published literature on genetic alterations in tumors associated with exposure to specific chemical, physical, or biological agents that can be linked to genes implicated in the development of cancers
http://www.niehs.nih.gov/research/resources/databases/gac/index.cfm

74
they accumulate without selection (91,92).
A recent study used cytoplasmic hybrid technology to demonstrate that the metastatic potential of tumour cells was enhanced by mtDNA mutations associated with the overproduction of reactive oxygen species (3). However, many of the mutations reported so far are not associated with a detectable mitochondrial defect (7). Although it is still unclear how mutations in mtDNA contribute to
carcinogenesis, these mutations are significant biomarkers in detecting tumour recurrence and in assessing genotoxic damage (5,93).
Detection of mutations
Many standard methods are available for detecting mutations in normal or diseased tissue samples; reviewing them is beyond the scope of this chapter. They differ by their sensitivity, scope (one or multiple genes), and by whether
the detection aims to identify mutations at specific base positions or to screen large DNA fragments to detect mutations at any possible position within that fragment (Table 5.4). Independent of the technique used, the modern methodological cornerstones of mutation detection are PCR and DNA sequencing. This section briefly discusses the basic requirements for detecting somatic mutations, focusing on detecting low levels of mutant DNA in non-diseased or surrogate samples.
Figure 5.8. Four multistep models of carcinogenesis. A: Vogelstein and Kinzler model of mutation accumulation pattern in colon cancer (16). B: Cavanee and White model of astrocytoma progressing to secondary glioblastoma (73). C: Theoretical model of therapy-induced leukaemia. D: A simplified version of the Beckmann and Niederacher model of multistep carcinogenesis in breast cancer (74). These models are only intended to provide a rough overview of how these cancers may progress during typical carcinogenesis, and it should be kept in mind that these cancers may arise via different paths in individuals

Unit 2 • Chapter 5. Assessment of genetic damage in healthy and diseased tissue 75
Un
it 2
Ch
ap
ter
5
Obtaining high-quality DNA
DNA is a robust molecule retrievable from biological materials stored in a wide range of conditions. However, DNA is sensitive to modifications by oxidation from prolonged contact with air, exposure to light (UV, in particular), enzymes, and by reaction with fixatives used in pathology. RNA may also be used as starting material for mutation detection. It is the recommended source for screening based on functional assays in which RNA is used to generate cDNA and express the protein in vitro, or when mutation detection is specifically aimed at identifying mutants with splicing defects. However, RNA is much more labile and unstable than DNA and is extremely sensitive to RNase present in biological materials.
The first challenge is to process and preserve specimens in a way that is compatible with obtaining good quality nucleic acids. Fresh frozen material is the best source and is mandatory for RNA. However, in many studies, the most routinely available material is tissue fixed in buffered formalin or alcohol and embedded in paraffin. Alcohol is
preferable to formalin, as the latter induces the formation of covalent protein and DNA adducts. Other fixatives, such as alcoholic Bouin’s, should be avoided since they contain chemicals that inhibit PCR. Fixed and embedded material yields DNA that is generally degraded by fragmentation and chemical modification. Though damage increases with overfixation, underfixation is also a problem as DNA may become degraded by chemical or enzymatic reactions. DNA fragmentation effectively limits the length of PCR-amplifiable fragments to 300–500 bp and DNA base modifications increase the risk of mutation artefacts during PCR. Despite these limitations, formalin-fixed tissue has been routinely used to detect mutations by PCR-based assays (94). The risk of artefactual mutation detection may be kept low by using strict laboratory protocols and mutation confirmation strategies (see below).
The second problem is to extract DNA from cells relevant for mutation detection analysis. Many tissue specimens obtained by resection or biopsy contain cells other than those suspected to contain mutations
(e.g. stromal cells, blood vessels, infiltrated inflammatory cells, etc.) that are present in solid tumours. Tumors are heterogeneous in their cellular composition and contain areas of different stage, grade, or morphological differentiation. Surrogate specimens used as a source of cancer cells, such as sputum or exfoliated cells, may contain significant amounts of DNA of bacterial origin. The use of methods to enrich the specimen for DNA extraction in DNA from the appropriate source is recommended. With tissue sections, this may be achieved by prior assessment by a pathologist and delineation of areas of material to extract, either by marking segments of tissues on companion histological slides, or by using laser-guided microdissection to retrieve specific groups of cells from a histological section. In the case of haematologic malignancies, knowledge of cell surface protein characteristics can often be used along with antibodies and selection techniques (e.g. immunomagnetic or flow cytometric) to separate cancerous cells from normal blood cells.
PCR sensitivity and specificity
DNA extraction is easy to perform using standard protocols and commercially available kits. Controlling DNA quality by physical methods (spectrometry, fluorimetry, or gel analysis) is not mandatory since the ‘gold standard’ is suitability for PCR. The quality, amount, and specificity of PCR products should be systematically checked before analysis by sequencing or other mutation detection method.
It should be kept in mind that PCR generates miscoding artefacts. First, commercial polymerases used in PCR generate random incorporation errors at rates between less than
Table 5.4. Comparison of sensitivity of selected mutation detection methods
RFLP, restriction fragment length polymorphism; mEPCR, membrane expression of endothelial protein C receptor; SOMA, short oligonucleotide mass analysis; APEX, arrayed primer extension; DHPLC, denaturing high performance liquid chromatography; TTGE, temporal temperature gradient gel electrophoresisTable compiled from (111) and (104)
Technology Detection limit (% mutant DNA)
RFLP 3-6
mEPCR 0.1
SOMA <1
APEX* 3-6
DHPLC* 3-12
TTGE 10
Direct Sequencing 25

76
2x10⁻⁶ and 8.4x10⁻⁵ (95). Second, PCR is prone to contamination by adventitious material. In laboratories where the same gene(s) are routinely analysed, contamination by aerosols of PCR products is a serious problem which can be overcome with rigorous laboratory procedures (96), as well as the use of dUTP and uracil glycosylase in PCR reactions to prevent carryover contamination. The best practice is to compartmentalize the various steps of the protocol in different laboratory locations (DNA extraction, assembly of PCR reactions, and performance of PCR itself) with one-way circulation patterns to make sure those final PCR products never come into contact with biological materials for extraction.
The sensitivity of mutation detection depends on the PCR strategy (see below), the sequence context, and the methodology for mutation detection. In principle, the sensitivity of mutation detection is expressed as the minimal percentage of mutant material detectable in a background of wild-type material (Table 5.4). It is mandatory to confirm detected mutations in a second analysis performed using a batch of DNA independently extracted from the same specimen (not a second aliquot from the same extraction). It should be noted that up to 10% of mutations included in mutation databases may be false mutations resulting from fixation and/or PCR artefacts. The need for replication has a bearing on the cost of mutation detection studies.
Detection of point mutations in non-diseased tissues
Mutations occur in non-cancer cells at rates that are increased by exposure to carcinogens. They can
also be detected in bodily fluids or exfoliated cells that contain only a small fraction of tumour-derived material, thus providing a means for detection of subclinical disease. The proportion of mutant DNA in such samples is too low for detection using conventional methods. However, mutations may be detectable using methods that are several orders of magnitude more sensitive than conventional ones.
The most remarkable studies on mutation detection in non-diseased tissues have been conducted on TP53 mutations in skin (97,98) and on TP53 mutations in non-cancerous liver, colon, and lung (99–101). In normal skin, detection is facilitated by the fact that the epithelium is made of juxtaposed patches of cells originating from single progenitors. Since many missense TP53 mutations induce protein stabilization, immunohistochemistry can be used to detect patches of cells with p53 accumulation, which are then microdissected and analysed by PCR/sequencing (97,98). Mutational signatures of solar UV have been detected in the DNA of normal skin of sun-exposed subjects (102). Studies in the liver, colon, and lung have used a sensitive genotypic assay (103). This method is based on the cloning of PCR products of the mutant allele into phage lambda followed by plaque assay and oligonucleotide hybridization to quantitate mutant PCR products. Its sensitivity is of one mutant DNA copy cell in about 10 million cells. Results have demonstrated increased mutation loads in the liver of patients with Wilson disease, in the colon of patients with ulcerative colitis (two oxyradical overload cancer precursor diseases) (99,101), and in the normal lung of heavy smokers without clinical evidence of cancer
(100). However, these methods are labour-intensive and expensive, limiting their application in molecular epidemiology.
Detection of mutations in surrogate samples
Identifying cancer-related mutations in tissues other than cancer is a major goal for studies aimed at assessing the impact of environmental exposures, as well as developing molecular-based methods for early detection of cancer. This has led to the development of methods to detect mutations in exfoliated cells or DNA retrieved from bodily fluids or secretions (Table 5.5). Recent developments on the use of circulating free DNA (CFDNA) isolated from plasma or serum, provide a good example of the problems and challenges posed by mutation assessment in surrogate samples (104). The plasma of all subjects contains minute amounts of free DNA that occurs as a by-product of normal cell turnover in solid tissues. This DNA is unstable and does not accumulate at levels above one to 10 ng per ml. In patients with various cancers, inflammatory or autoimmune diseases, however, increased tissue destruction and cell turnover in the lesion results in abnormally high levels of CFDNA in the plasma/serum. It was estimated that for a patient with a tumour load of 100 g in size (~3x10¹⁰ cancer cells), up to 3.3% of the tumour DNA entered the circulation every day (105). Various types of DNA alterations have been reported in CFDNA, including point mutations, DNA hypermethylation, microsatellite instability, and losses of heterozygosity (LOH) in patients with many different types of cancer. In most cases, these alterations were identical to the ones detected in the patient’s tumour tissue,

Unit 2 • Chapter 5. Assessment of genetic damage in healthy and diseased tissue 77
Un
it 2
Ch
ap
ter
5
supporting the tumoural origin of altered CFDNA. Thus, CFDNA may provide a very valuable source of genetic material as a surrogate for molecular analysis of cancer and pre-cancer patients, for detecting somatic alterations when biopsies are not available, and for accessing small amounts of tumour DNA when the exact position of a suspected primary lesion is not clearly defined. The fact that CFDNA can be obtained without invasive or painful procedures makes it particularly suitable for studies in a population-based context.
High-sensitivity detection of point mutations
The main problem for detecting mutation in non-diseased tissues or in surrogate samples is that the mutation is present in only a small fraction of the total DNA, a level too low for detection by conventional sequencing.
This section briefly describes recent high-throughput assays suitable for detection of low levels of mutant DNA in a background
of wild-type DNA. The first four of these methods all have the same limitation: they require the prior knowledge of the exact position and type of the mutation, and are therefore limited to the detection of mutation hotspots. For detection of mutations at unselected sites, most studies have used pre-screening methods, such as single strand conformation polymorphism (SSCP), denaturing high performance liquid chromatography (DHPLC), denaturing gradient gel electrophoresis (DGGE), or related techniques (106–108). Several protocols are available to retrieve and re-amplify mutant DNA after pre-screening (either by excision of shifted bands detected by temporal temperature gradient gel electrophoresis (TTGE) or SSCP, or by collection of shifted peaks in DHPLC). This re-amplified, mutant-enriched material can then be analysed by direct sequencing. This approach has been successfully used to detect mutant TP53 DNA in the plasma of healthy subjects recruited in a prospective study (Figure 5.9) (109). A new method,
arrayed primer extension (APEX), allows the detection of ‘unknown’ mutations within a given sequence (110–112). However, this assay is still in development and its suitability for large-scale studies remains to be demonstrated. Finally, this section concludes with a brief description of current high-throughput sequencing efforts and their perspectives for application in molecular epidemiology.
Mutation-enriched PCR
Mutation-enriched PCR (ME-PCR) is the most widely used procedure for genotypic selection of mutant DNA. It is based on restriction digestion using enzymes that cleave DNA at sites that are modified by mutations. This method selectively cleaves wild-type sequences, thus providing enrichment in mutant sequences. Two versions of this type of assay have been commonly used: restriction site mutation (RSM) is based on digestion before PCR amplification (113), and restriction fragment length polymorphism (RFLP) is based on restriction
Table 5.5. Genetic and epigenetic changes both in tumors and matched CFDNA detected with different methods
Type of alteration Cancer site Method Tumor CFDNA Reference
Point Mutation
TP53 HNSCC AS-PCR 11 (18%) 2/11 (18%) (237)
K-ras2 Colorectal PCR 35/135 29/35 (83%) (238)
Hypermethylation
CDKN2a Esophagus MSP 31/38 (82%) 7/31 (23%) (239)
APC Lung RT-MSP 95/99 (96%) 42/89 (47%) (240)
Genomic Instability
LOH Melanoma Fluorescent PCR 34/40 (85%) 21/34 (62%) (241)
CFDNA, circulating free DNA; CDKN2a, cyclin-dependent kinase inhibitor 2A;APC, adenomatous polyposis coli; RT-MSP, real-time methylated-specific PCR

78
digestion after PCR (114). In both instances, mutations are identified by sequencing of digestion-resistant PCR products. A modified assay has been developed to detect mutations at DNA positions that do not fall within restriction sites. This assay uses two consecutive rounds of PCR to introduce a synthetic restriction site in the wild-type allele, thus generating a PCR product amenable to restriction. This method has been successfully
applied to detect K-ras mutations in CFDNA present in the plasma of healthy subjects before diagnosis of cancer (Figure 5.9) (109).
Allele-specific PCR
Allele-specific PCR (AS-PCR) is based on the use of PCR primers that preferentially anneal with mutant DNA. The PCR products are then analysed using conventional methods (e.g. SSCP plus
sequencing). The use of AS-PCR results in considerable improvement in sensitivity over conventional methods. AS-PCR analysis of TP53 mutations resulted in the detection of mutated cells accounting for 0.01–1% of cells, sensitive enough to detect rare TP53 mutations as early biomarkers of relapse in acute myelogenous leukaemia (AML) and acute lymphocytic leukaemia (ALL) (115,116). AS-PCR may be combined with PCR methods using fluorescent probes (the so-called ‘Taqman’ method) to detect rare mutations in a semiquantitative manner. A variant of AS-PCR that targets mutational hotspots in the TP53 gene has been developed (117). This method combines PCR-SSCP with sequence-specific clamping by peptide nucleic acids (PNAs). PNAs are designed to preferentially bind to wild-type DNA, and not extend, thereby blocking amplification of wild-type DNA to yield a mutant enriched sample.
Combined Mut-Ex and allele-specific competitive blocker PCR
By combining two previously published methods (118,119), the Mut-Ex + allele-specific competitive blocker PCR (ACB-PCR technique provides one of the most sensitive genotypic selection methods (120). This assay begins with the denaturation of a heterogeneous sample of mutant and wild-type double stranded DNA. When reannealing, four types of DNA duplexes may be formed: the two homoduplexes of either wild-type or mutant DNA, and two types of heteroduplexes containing a mutant strand annealed to a wild-type strand. The proportion of each duplex depends upon the ratio of mutant to wild-type DNA in the sample. MutS, a thermostable mismatch repair
Figure 5.9. Detection of low levels of KRAS (codon 12) mutation or of TP53 mutation in circulating free plasma DNA (CFDNA) of healthy subjects. KRAS2 (A) and TP53 (B) mutation detection in CFDNA. A: Detection of mutations in codon 12 of KRAS2 by ME-PCR (involving two consecutive RFLP analyses for enrichment of the mutant DNA). After MvaI digestion, the mutant PCR product (MT; white arrow) is excised, amplified, and sequenced. Black arrow – wild-type PCR product (WT). B: Detection of TP53 mutation at codon 282. Mutations in exons 5 to 9 are analysed by DHPLC. Samples with abnormal DHPLC chromatograms are sequenced from an independent PCR product. If the mutation is not detected by sequencing, a new PCR product is analysed by TTGE. Homoduplex products are excised from the TTGE gel, reamplified, and sequenced. Gray arrow – mutant-wild-type heteroduplexes; white arrow – mutant homoduplexes; black arrow – wild-type homoduplexes; white star – mutant control heteroduplexes (top two bands) and homoduplexes. Source: (113).
Figure not available

Unit 2 • Chapter 5. Assessment of genetic damage in healthy and diseased tissue 79
Un
it 2
Ch
ap
ter
5
protein, binds to the mispaired sequence of the heteroduplex and protects a short sequence of mutant DNA from digestion by the 3ʹ-5ʹ exonuclease activity of T7 DNA polymerase, whereas the wild-type DNA is digested. This Mut-Ex step results in a 103-fold enrichment of mutant alleles. The next step utilizes an additional selection technique, allele specific competitive blocking. This genotypic selection uses allele-specific primers to amplify
mutant DNA, combined with blocker primer which preferentially anneals to the wild-type sequence. The blocker primer is modified with a 3ʹ-dideoxyguanosine residue preventing extension. The combination of Mut-Ex and ACB-PCR results in the preferential amplification of the mutant allele, with a sensitivity of as few as one mutant allele per 107 copies of the wild-type allele.
Short-oligonucleotide mass analysis
Short oligonucleotide mass analysis (SOMA) is a technique by which small sequences of mutated and wild-type DNA, produced by PCR amplification and restriction digestion, are characterized by high performance liquid chromatography (HPLC)-electrospray ionization tandem mass spectrometry (ESI-MS/MS) (121–123). DNA is amplified using primers that introduce restriction sites for enzymes that cleave DNA at positions away from their binding sites, such as BpmI. Short DNA fragments spanning the mutation site (seven to 15 base pair oligomers) are then produced by restriction digestion and separated by HPLC before ESI-MS/MS. The first MS analysis distinguishes the four single-stranded oligonucleotides corresponding to sense and antisense, wild-type, and mutant DNA. The second MS analyses oligonucleotide fragmentation products and detects mass fragments characterizing the mutated base (Figure 5.10). The use of an internal standard plasmid alongside test DNA allows the precise quantitation of mutant and wild-type sequences, which can be expressed in absolute copy numbers. This method has been applied to detection of K-ras and TP53 mutations in the plasma DNA and tissues of healthy subjects and cancer patients (124,125). Quantitation of mutant CFDNA by SOMA in a case-control study of liver cancer in The Gambia (West Africa), has shown that TP53 gene serine 249 mutation median levels were higher in hepatocellular carcinoma cases (2.8x10³ copies/mL, range: 5x10²-1.1x10⁴) compared with median levels in cirrhotic patients and healthy controls (5x10²
copies/mL, range: 5x10²-2.6x10³
Figure 5.10. Short oligonucleotide mass analysis (SOMA) of TP53 R249S mutations. A: Principle of SOMA. DNA is amplified by PCR using primers that introduce a site for BpmI, a restriction enzyme that cleaves DNA away from its recognition site. Short oligonucleotides (8-mers) are generated by digestion, purified by HPLC, and analysed by electrospray mass spectrometry. B: Mass spectrum of the sense strand of the wild-type 8-mer (top spectrum) and of its breakdown products (bottom spectrum). Inset: expected mass of breakdown products. Presence of a specific species (framed) identifies the wild-type sequence (with G at third position of codon 249)

80
and 5x10² copies/mL, range: 5x10²-2x10³ respectively) (124). This highly powerful method is rapid and amenable to scaling-up, making it one of the most powerful approaches for mutation detection in a large series of specimens.
BEAMing
BEAMing is an original method aimed at one-to-one conversion of a population of DNA fragments into a population of beads that can be counted. It derives its name from its principal components: beads, emulsion, amplification, and magnetics (Figure 5.11). First, PCR is used to amplify target DNA using primers that contain a sequence tag. Second, PCR products are mixed with beads coupled to an oligonucleotide that anneals with the tag. This mixture is emulsified to facilitate the reaction of individual PCR products with individual beads. Third, the DNA immobilized on the beads is denatured, hybridized with primers that anneal just upstream of the mutation site, and then a single nucleotide primer extension reaction is carried out using four fluorescently labelled nucleotide terminators. Flow cytometry is next used to rapidly measure the fluorescence of individual beads. The nature of
the base changes is given by the fluorescence of the incorporated nucleotide. Counting fluorescent beads provides a precise estimate of the number of wild-type or mutant DNA copies, and allows quantitation of mutant and wild-type frequencies even when they are present at ratios less than 1:10 000. This method has been used to quantify mutant APC in the circulating plasma DNA of patients with colorectal cancer (105,126,127). Quantitation of mutant APC in the plasma of patients with advanced colorectal cancer detected on average 5.3x10³ (11.1%) copies/mL of mutant APC (range: 9.08x10² (1.9%)-1.2x10⁴
(27%)) (105).
Arrayed primer extension
Arrayed primer extension (APEX) is a genotyping and resequencing technology that allows the scanning of mutations over large regions of DNA. It combines the advantages of Sanger dideoxy sequencing with the high-throughput potential of the microarray format (Figure 5.12). A DNA sample is amplified, fragmented enzymatically, and annealed to arrayed 25-mer oligonucleotides that cover the sequence of interest. Each oligonucleotide hybridizes one base
downstream of the preceding one, with their 3ʹ ends one base upstream of the base to be identified. Once hybridized, they serve as primers for template-dependent DNA polymerase extension reactions by using four fluorescently labelled dideoxynucleotides. Each base is probed with two primers: one for the sense and another for the antisense strand. Image analysis and interpretation of fluorescence signals at each position provides a read-out of the sequence. This method has been adapted for the detection of TP53 mutations in DNA isolated from plasma or from solid tumours, with a sensitivity of 0.1–5%, depending upon the sequence context and the nature of the mutation (which is higher than sequencing or conventional oligonucleotide hybridization arrays). Whether this method will prove robust enough for large-scale studies using non-diseased tissues or surrogate samples remains to be assessed.
High-throughput sequencing
The rapid development of long-range sequencing technologies makes it possible to comprehensively sequence the coding regions of the human genome. The cost and time
Figure 5.11. High-sensitivity, single DNA template mutation detection using BEAMing: APC mutations in circulating free plasma DNA. A: Extended beads were prepared attaching single PCR products to single beads in an emulsion mixture. B: Single base extensions were performed on the extended beads using four different fluorescent nucleotides. Normal DNA sequences contained a G at the queried position; mutant sequences contained an A. Source: (109). Copyright 2005 National Academy of Sciences, U.S.A.

Unit 2 • Chapter 5. Assessment of genetic damage in healthy and diseased tissue 81
Un
it 2
Ch
ap
ter
5
required to conduct high-throughput sequencing is decreasing at an extremely rapid pace, one that is reminiscent of the dramatic reduction in costs and increase in performance of microprocessors in the eighties and nineties. Within a few years, it is possible that high-throughput sequencing will largely replace current approaches for genome-wide analysis of multiple polymorphisms. The International Cancer Genome Consortium (http://www.icgc.org) has been organized to launch and coordinate several large-scale sequencing research projects with the primary goal of generating comprehensive catalogues of genomic abnormalities (somatic mutations, abnormal expression of genes, epigenetic modifications) in tumours. Collectively, high-throughput sequencing studies will generate a wealth of novel information on patterns of mutations in cancer. However, current technologies lack the sensitivity needed to detect somatic mutations in non-cancer tissues. Moreover, many of the mutations detected in such large-scale sequencing efforts appear to have no direct role in the development of cancer and simply happened to mutate as passengers in the tumour. Distinguishing ‘drivers’ from ‘passengers,’ and interpreting the significance of the latter as biomarkers of processes involved in mutagenesis, will require intensive research efforts.
Detection of genetic damage at the chromosome level
Chromosome aberrations encompass all types of changes in chromosome structure and number and have been shown to be involved in the development of cancer (e.g. leukemias and lymphomas (128,129). The most common numerical changes
Figure 5.12. Detection of missense mutations in TP53 using arrayed primer extension (APEX). DNA is amplified by PCR and fragmented before hybridization to arrayed oligonucleotide that anneal with a sequence just 1 base upstream of the position of interest. Single base extension is then performed on the arrays using four different fluorescent nucleotides. The incorporated base is detected by acquisition and analysis of fluorescence data at each position of the array. Source: AsperBio (http://www.asperbio.com/)

82
(resulting in aneuploid cells) are the loss (monosomy) or gain (trisomy) of one chromosome; less frequent types include the loss of both copies or the gain of more than one copy of a chromosome. Structural changes include translocations, inversions, breaks, and deletions. Chromosome loss can lead to the loss of tumour suppressor genes, while chromosome gain can lead to increased oncogene expression. Further, chromosome translocations, or other types of chromosome rearrangements, may lead to the formation of fusion genes with oncogenic properties.
Conventional cytogenetics
Chromosome aberrations are the only cytogenetic endpoint that has been shown to predict cancer risk (19,130), particularly in haematologic malignancies (Figure 5.13) (131). They may thus represent a promising early effect biomarker of carcinogen exposure. However, classical aberrations measure overall chromosome damage rather than specific events on the causal pathways of particular diseases. This decreases their specificity as biomarkers of exposure-related diseases, making it necessary to screen large populations or examine many cells from each subject to attain sufficient statistical power.
Many specific chromosome aberrations have been identified using classic karyotyping among patients with clinical syndromes. For example, an extra copy of chromosome 21 is routinely detected among children born with Down syndrome. As a result, classic karyotyping has become a widely used clinical diagnostic tool for many diseases, including leukaemia. However, classic cytogenetic techniques have several drawbacks for the detection of chromosome-specific
aneusomy and rearrangements: the cells must be cultured to generate metaphase spreads, only a limited number (25–100) of scoreable cells can be examined, and recognition of specific chromosomes is problematic. The use of fluorescence in situ hybridization overcomes these problems.
Molecular cytogenetics
Fluorescence in situ hybridization
Fluorescence in situ hybridization (FISH) has several advantages over conventional cytogenetics, including selectivity of specific DNA probes, multiple colour labelling, sensitivity of detection, and speed of microscopic analysis (132,133). Interphase FISH, in particular, offers several advantages over classical cytogenetics (134). First, it allows
analysis of non-dividing cells. Second, a much larger number of cells, at least 103 or more, may be analysed. Third, the detection of aneuploidy is facilitated by simply counting the number of labelled regions corresponding to a particular chromosome within the nucleus. In contrast, metaphase FISH can readily detect structural rearrangements in addition to aneuploidy. The use of metaphase FISH makes it possible to directly compare and reconcile interphase FISH and conventional cytogenetics. Several studies have determined that FISH is more sensitive and convenient than classical cytogenetics, thus appearing to be the more suitable method for large-scale population biomonitoring (135–137). FISH is now widely used in the analysis of chromosomal changes in human cancers (e.g. leukemias) and in prenatal diagnostics (133,138).
Figure 5.13. Chromosome aberrations in haematological malignancies. In acute myeloid leukaemia (AML), loss of part or all of chromosomes 5 and 7 is a common event, along with trisomy of chromosome 8 and various specific translocations and inversions including inv(16), t(8;21), t(9;22), t(15;17), and t(11q23) (107). In acute lymphocytic leukaemia (ALL), particularly in childhood ALL, the translocation t(12;21) is common (~25%). In non-Hodgkin’s lymphomas the translocation t(14;18) is frequently found (> 70%) in follicular lymphoma (98,132). Therefore, the detection of these changes at the chromosomal level could be very important in predicting risk of these diseases

Unit 2 • Chapter 5. Assessment of genetic damage in healthy and diseased tissue 83
Un
it 2
Ch
ap
ter
5
FISH has been extensively used to analyse chromosomal damage induced by exposure to ionizing radiation (139,140), and has also been gradually applied in evaluating genetic damage in cancer cases and in exposed populations (141–143). For example, a specialized FISH assay used for radiation research in humans and experimental animals has been developed (144–146). This assay uses single-colour FISH for painting the chromosome pairs 1, 2, and 4 (or 3, 5 and 6) the same colour, which allows for the detection of both the numerical and structural chromosome aberrations among these painted chromosomes, and the structural rearrangements between these and other untargeted chromosomes. Since radiation is thought to cause equal levels of damage across all chromosomes (147), and chromosomes 1 through 6 (the largest chromosomes) make up 40% of the genome (148), measurement of damage in these large chromosomes may be extrapolated to the whole genome (144). This may not be true for chemical exposures, as certain chemicals may have selective or preferential effects on certain chromosomes (149), as observed for epoxide metabolites of 1,3-butadiene (150). Indeed, the hypothesis of equal levels of damage across the genome may not hold true for low doses of radiation, as inversion of chromosome 10 has been shown to be highly sensitive to low intensity radiation exposure (151). Interestingly inv(10) rearranges the RET gene and is associated with thyroid cancer, potentially caused by linear energy transfer radiation.
Current studies employ FISH to examine the cytogenetic changes in human blood cells caused by exposure to the established leukemogen, benzene. Pilot studies in highly exposed workers from
China and controls have analysed five chromosomes by metaphase FISH, demonstrating striking, dose-dependent increases in monosomy and trisomy in some chromosomes, as well as several common structural changes (149,152). In particular, loss and long arm deletion of chromosomes 5 and 7, two of the most common cytogenetic changes in therapy- and chemical-related leukaemia, were significantly increased in benzene-exposed workers over controls (149).
While FISH can be used to measure both structural and numerical chromosome aberrations and is a powerful tool in molecular epidemiology, its sensitivity is limited to 1 in 103-104 cells and it is relatively expensive because of the high cost of probes. This makes it difficult to use FISH to detect rare translocations between multiple chromosomes, such as t(21q22) and t(11q23). The PCR technique allows much more sensitive detection of these types of changes and is also less expensive in comparison with FISH.
Other molecular cytogenetic methods
Novel cytogenetic methods have been recently developed, such as comparative genome hybridization (CGH), spectral karyotyping (SKY), and colour banding. CGH involves the comparison of total DNA extracted from normal and cancerous cells to detect specific gains or losses in genetic material associated with cancer (139). Initially developed using metaphase spreads as a template for hybridization, CGH is now commonly performed on cDNA or oligonucleotide microarrays representative of the whole genome. This method is now widely used to identify variations in copy numbers in tumour DNA, but has not been applied to the
analysis of damage induced by environmental exposures in non-diseased human tissues (although some experimental studies in animals and cell lines have shown changes induced by carcinogens).
The SKY method involves painting each of the 24 different chromosomes a different colour using four or five fluorophores with combined binary ratio labelling, which allows the entire karyotype to be screened for chromosome aberrations (153). Since the human eye cannot effectively distinguish the 24 colors, this method requires the use of an automated imaging system. In colour banding, which is based on traditional banding techniques, each chromosome is labelled by subregional DNA probes in different colors, resulting in an unique ‘chromosome bar code’ (154). This method allows the rapid identification of chromosomes and chromosome rearrangements. These techniques, however, are relatively new and have not been employed as widely or extensively as FISH.
Measurement of chromosome rearrangements by PCR
Chromosome translocations produce novel fusion genes or products that can be detected at the DNA or RNA level by PCR or reverse-transcriptase PCR (RT–PCR), as well as by FISH. PCR holds several advantages over FISH, including the ability to detect very rare events (1 copy/106–7 cells versus 1/103–4 cells by FISH), and the ability to study large numbers of people easily and at low cost. However, the high sensitivity of PCR makes it prone to false-positive results caused by sample contamination (see above). The use of exonuclease-dependent real-time PCR (‘TaqMan’ technology,
84
now generally called real-time PCR) allows for the absolute number of novel sequences to be quantified in a cell population without the need for gel electrophoresis. While no methods yet exist which employ PCR to measure rare aneuploidies or genome-wide structural damage, real-time and conventional PCR techniques, which measure specific chromosome rearrangements, have become available. RT–PCR has previously been used to detect translocations including t(14;18), t(8;21), t(9;22), and t(4;11). Using these techniques, t(9;22) and t(14;18) have been detected in unexposed individuals of different ages and in smokers (155–157). Both translocations were found to increase with age and the t(14;18) translocation was increased in cigarette smokers (158). Studies showing detectable t(8;21) by RT–PCR in an otherwise healthy benzene-exposed worker (152), demonstrate the potential of RT–PCR for monitoring specific aberrations in populations exposed to suspected or established leukemogens. Because many of these translocations have multiple breakpoints or translocation partners, multiplex assays have been developed to detect multiple or unknown rearrangements.
Principle of real-time PCR
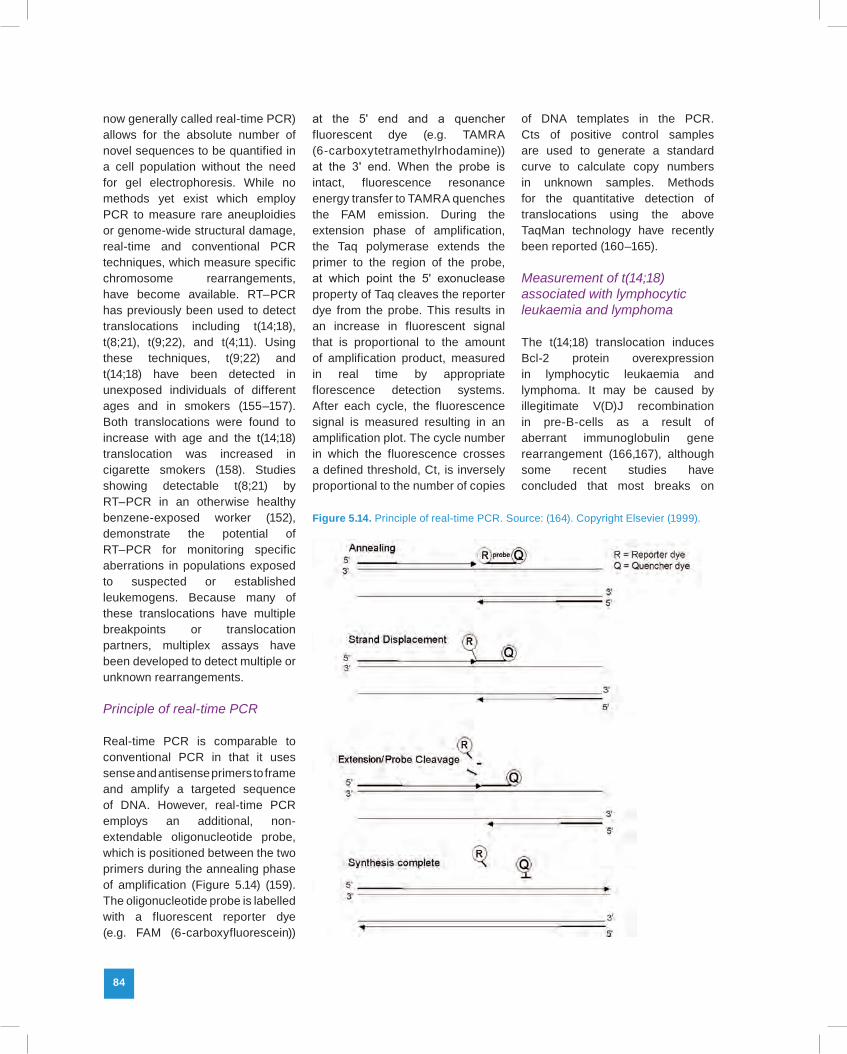
Real-time PCR is comparable to conventional PCR in that it uses sense and antisense primers to frame and amplify a targeted sequence of DNA. However, real-time PCR employs an additional, non-extendable oligonucleotide probe, which is positioned between the two primers during the annealing phase of amplification (Figure 5.14) (159). The oligonucleotide probe is labelled with a fluorescent reporter dye (e.g. FAM (6-carboxyfluorescein))
at the 5ʹ end and a quencher fluorescent dye (e.g. TAMRA (6-carboxytetramethylrhodamine)) at the 3ʹ end. When the probe is intact, fluorescence resonance energy transfer to TAMRA quenches the FAM emission. During the extension phase of amplification, the Taq polymerase extends the primer to the region of the probe, at which point the 5ʹ exonuclease property of Taq cleaves the reporter dye from the probe. This results in an increase in fluorescent signal that is proportional to the amount of amplification product, measured in real time by appropriate florescence detection systems. After each cycle, the fluorescence signal is measured resulting in an amplification plot. The cycle number in which the fluorescence crosses a defined threshold, Ct, is inversely proportional to the number of copies
of DNA templates in the PCR. Cts of positive control samples are used to generate a standard curve to calculate copy numbers in unknown samples. Methods for the quantitative detection of translocations using the above TaqMan technology have recently been reported (160–165).
Measurement of t(14;18) associated with lymphocytic leukaemia and lymphoma
The t(14;18) translocation induces Bcl-2 protein overexpression in lymphocytic leukaemia and lymphoma. It may be caused by illegitimate V(D)J recombination in pre-B-cells as a result of aberrant immunoglobulin gene rearrangement (166,167), although some recent studies have concluded that most breaks on
Figure 5.14. Principle of real-time PCR. Source: (164). Copyright Elsevier (1999).

Unit 2 • Chapter 5. Assessment of genetic damage in healthy and diseased tissue 85
Un
it 2
Ch
ap
ter
5
chromosome 18 are independent of V(D)J recombinase activity (94,168). This translocation was first identified at low levels in normal, healthy individuals (157). They subsequently showed that the incidence of t(14;18) increased with age and was higher in the blood of smokers (158). Recently, novel quantitative PCR procedures that measure very low levels of t(14;18) have been described (163,169). Rearrangements were detected at the Bcl-2 major breakpoint region in 36% of lymphoma cases, and a 98% concordance between real-time PCR and conventional PCR was found (163). In addition, using serial dilution it was demonstrated that real-time PCR was 100-fold more sensitive than conventional PCR. Bcl-2/JH fusion sequences were consistently detected when diluted 105-fold with normal genomic DNA. Others confirmed the sensitivity of this assay and concluded that the detection of single genome copies is possible if a stochastic multiple tube approach is taken (169).
Measurement of t(8;21) associated with acute myeloid leukaemia and myelodysplasia
The t(8;21) translocation results in the fusion of the ETO gene (8q22) with the AML1 gene (21q22) and is one of the most frequent abnormalities observed in AML. The presence of t(8;21) is associated with high complete remission and survival rates (170), suggesting that the levels of the translocation may be predictive of relapse. A real-time RT-PCR method to detect AML1/ETO fusion transcript in patients with AML was developed (171). Each patient showed 103 copies of AML1/ETO transcript at diagnosis and a 2–4-log decrease in copy numbers following successful induction chemotherapy. In one patient,
relapse was predicted by high copy number immediately after induction chemotherapy, which continued to increase during initial remission. These results suggest the t(8;21) translocation is detectable at low levels and may be a valuable biomarker of early effect or potential relapse.
Measurement of t(9;22) associated with leukaemia
A real-time RT–PCR method has been developed for the detection of the t(9;22) translocation (172), which is common in chronic myelogenous leukaemia (CML). This translocation results in the fusion of the ABL gene, an oncogene, with the BCR gene (173). The fusion gene product is expressed in malignant cells. By performing serial dilutions of a positive control diluted in wild-type RNA, a sensitivity of 10−5 was achieved, which is comparable to conventional PCR methods.
Micronuclei as indicators of chromosome damage in humans
Micronuclei are small cytoplasmic fragments of nuclear membrane-encapsulated DNA that are excluded from daughter nuclei during telophase after a clastogenic or aneugenic event. An increased frequency of micronuclei in reticulocytes (nascent red blood cells) has long been used as an index of acute mutagenic exposure in animals (174–178). Micronucleated (MN) reticulocytes are easily detected using DNA stains in both the peripheral blood and bone marrow of rodents following recent mutagenic exposure. Close to 70% of known human carcinogens are detected using this in vivo MN assay. Accordingly, this animal test is widely used as a pre-clinical
cytogenetic assay for genotoxicity (21,179-181).
Reticulocytes are produced from rapidly dividing progenitors in the bone marrow and are well suited for rapid assessment of MN frequency because they, like mature red blood cells, have extruded their nucleus. However, the spleen filters micronucleated red cells out of circulation, so that erythroid micronuclei (known to haematologists as Howell-Jolly bodies) are found less frequently in the peripheral blood than in the marrow, and disappear from both of these compartments 2–3 days after aberrations occur. Furthermore, once an MN is formed, the genomic lesion can contribute to cell death, and, even if the cell is still able to proliferate, the MN is not replicated and will therefore be diluted in the progeny that are formed. Thus, the presence of micronuclei is mostly used as a biomarker of either recently occurring chromosome aberrations or of an increased tendency for these events to occur (indicated by relatively high baseline levels of MN formation or by an increased response upon exposure).
Since human marrow samples are not routinely collected when monitoring for exposure effects or cancer risk in healthy populations, reticulocytes are not used to evaluate MN formation in human tissues. Efforts to use micronuclei as mutation biomarkers in human tissues have instead mainly focused on cultured human lymphocytes or exfoliated cells (182). The MN assay in cultured human lymphocytes (the cytokinesis-block micronucleus (CBMN) assay) employs cytochalasin-B in vitro to interrupt cell division after the first telophase, allowing the visualization of daughter nuclei and excluded micronuclei (182–184). Cells that have undergone mitosis (a necessary

86
step in MN formation) are identified by their binucleate appearance in the CBMN assay; cytochalasin-B prevents the dilution of micronuclei in the culture population by prohibiting proliferation. Although the CBMN assay is conducted on lymphocytes in vitro, it has been shown to be an accurate indicator of both carcinogenic exposure in the lymphocyte donor and increased cancer risk. For example, the CBMN assay has been used to establish that spontaneous MN generation increases with age of the lymphocyte donor (185,186), and that MN frequency is increased in the lymphocytes of nurses handling cytotoxic drugs (187), workers exposed to chlorinated solvents (188), and mortician students exposed to formaldehyde (189). Furthermore, a case-control study using the CBMN assay demonstrated that micronucleus frequency is increased in the lymphocytes of smokers with lung cancer (190). A nested case-control study recently showed that micronucleus frequency assessed in peripheral blood lymphocytes of disease-free subjects is a good predictor of cancer death risk (191).
The measurement of micronuclei in epithelial cells has also been used as a biomarker for monitoring DNA damage and is perhaps the least invasive method available for measuring DNA damage in humans (192). The MN assay in buccal cells was first proposed in 1983 (193), and has since been used to demonstrate that increased MN frequencies correlate with occupational exposures, lifestyle factors, dietary deficiencies, and various disease states. In early studies, exfoliated buccal mucosa cells were used to test for the genotoxic effects of betel nuts and quids of chewing tobacco (194,195). These studies often showed that higher MN frequencies
were observed at the site where the quid or tobacco mixture was kept, compared to the opposite side. Other studies have demonstrated that increased MN frequency in buccal cells is significantly increased in people exposed to arsenic (196,197), formaldehyde (189), and smokeless tobacco (198). Furthermore, arsenic exposure has been shown to modulate the MN frequency in exfoliated bladder cells (199,200). As with the CBMN assay in lymphocytes, an increased MN frequency in epithelial cells has also been linked to cancers such as oral submucous fibrosis, oral carcinoma, and breast cancer (201–203). Therefore, although micronuclei are formed from a variety of chromosomal aberrations, only some of which are on the causal pathway to disease, MN frequency in cultured lymphocytes, red cells, and epithelial tissue remains a useful biomarker for evaluating exposure and cancer risk.
Detection of epigenetic changes
In addition to the wide range of genetic damage involved in carcinogenesis, epigenetic mechanisms (e.g. methylation of CpG islands in DNA) have gained attention as key players in certain cancer types. Although tumorigenesis is accompanied by global hypomethylation of the genome, some particular regions may become hypermethylated. Approximately 70% of known human promoter regions are found within CpG islands (204), and methylation of the cytosine within these CpG regions modulates expression by silencing genes. DNA methylation is normally controlled by the activity of the DNA methyltransferase family of enzymes, but it is also known that changes in local
DNA structure, environmental exposure (e.g. nickel, plutonium, polycyclic aromatic hydrocarbons), and microsatellite instability can contribute to aberrant promoter methylation. Methylation patterns are reset during embryogenesis, although specific methylation patterns may be heritable through imprinting. Changes in the promoter methylation of a large series have been linked to aging and cancer; methods for measuring these epigenetic changes are critical to understanding the genetic basis of disease. Information on the diversity of methylated genes in cancer is available at the Methylation Cancer Database (MethCancerDB), which collects data on aberrant CpG methylation in human tumours and currently contains information on over 2000 genes (http://www.methcancerdb.net/methcancerdb/home.seam).
Aberrant methylation may result in changes in the dysregulation of every type of cell processes involved in carcinogenesis. Furthermore, changes in methylation patterns may occur synergistically with mutations or chromosomal aberrations. For example, in leukaemia and lymphoma, translocations cause the formation of novel fusion genes that produce excessive growth (128,129). Other genes undergo transcriptional silencing by methylation, which causes aberrant cell cycle control (205). Aberrant methylation and transcriptional silencing appears to be an early event in both solid tumours, including lung (206), colon (207), hepatocellular (208), and bladder (209), as well as haematologic malignancies (205).
Because of their widespread presence in the genome, their diversity, relevance to disease, and potential responsiveness to environmental changes, changes in methylation patterns are ideal

Unit 2 • Chapter 5. Assessment of genetic damage in healthy and diseased tissue 87
Un
it 2
Ch
ap
ter
5
candidate early effect biomarkers. Several different methods have been developed to detect aberrant methylation of genes, but either methylation-sensitive restriction enzyme digests of DNA or bisulfite conversion of DNA is at the core of most. So far, however, the application of these methods to non-diseased human tissues is still in its infancy.
Methylation-sensitive digestion
Restriction enzymes that have CpG sites in their recognition sequence and are sensitive to methylation status can be used to differentially digest DNA before using other techniques, such as PCR or Southern blotting, to analyse the resulting digest. It is preferable to use enzymes that have at least two CpG sites in their recognition sequence (e.g. NotI, SacII, EagI, and BsHII) to increase the specificity of the method. Southern blotting after digest is the gold standard for measuring aberrant methylation. There are very few examples of a Southern blot analysis that has not been confirmed by other techniques. However, the downside of Southern blot analysis is that it is time consuming and requires a large amount of high-quality DNA, which precludes the use of paraffin-embedded tissue. Methylation-specific restriction followed by PCR using primers that frame the digestion site can give false-positives due to incomplete digestion. Restriction landmark genome scanning is a whole-genome approach that relies on methylation-sensitive restriction digest, followed by radiolabelling the resulting fragments and 2D electrophoresis to resolve differences in the digest (210). Methylated CpG island amplification followed by microarray analysis is another modern technique, built
on methylation-sensitive restriction enzymes, that facilitates high-throughput detection of aberrant methylation (211,212).
Bisulfite conversion assays
The basis for another class of methylation assays is bisulfite conversion of DNA. While normal cytosine is converted to uracil upon treatment with bisulfite, methylated cytosine is unaffected. Since uracil is read by polymerases as thymine, bisulfite conversion can be used to introduce polymorphisms into a sequence based on methylation status (Figure 5.15). After bisulfite conversion, methylation-specific PCR, which targets the created polymorphisms with primer(s) that overlap with the modified site at their 3ʹ ends, can be used to distinguish between the two variants. Alternatively, standard PCR framing the modified site can be used to provide amplicon for SNP analysis using a variety of techniques including direct sequencing, pyrosequencing, methylation-sensitive single-strand conformational analysis,
high-resolution melting analysis, methylation-sensitive single nucleotide primer extension, hybridization to arrayed oligonucleotides, or base-specific cleavage/MALDI-TOF. In a recent study, bisulfite conversion and pyrosequencing have been used to analyse the methylation patterns of several genes in lung cancer tissues from smokers, ex-smokers, and life-time never smokers, demonstrating substantial differences according to histology and to smoking history (213). A limitation of bisulfite conversion techniques is that only single-stranded DNA is susceptible to bisulfite, which requires that the DNA is denatured during analysis. Thus these techniques require optimization of temperature and salt concentrations during conversion to achieve a high degree of sensitivity and specificity. In addition, conditions of bisulfite conversion can lead to degradation of DNA, specifically depurination and random strand breaks.
Among aberrantly methylated genes in cancer, the tumour suppressor gene p16INK4a has been
Figure 5.15. Detection and quantification of cytosine methylation using bisulfite conversion assay. Bisulfite conversion of a DNA sequence. Nucleotides in red are unmethylated cytosines that will be converted to uracils by bisulfite, while blue nucleotides are 5-methylcytosines resistant to conversion

88
one of the most extensively studied. This gene is a key component in the G1/S cell cycle checkpoint and has been shown to be involved in almost every type of solid cancer and in leukaemia. The INK4a locus is of special interest in cancer as it contains an alternative reading frame (ARF), encoding a different protein which also exerts tumour suppressive activities. Each ARF has its own promoters, which may be simultaneously or differentially methylated (214). A real-time methylation-specific PCR protocol has been developed for p16INK4a and applied to bone marrow samples of patients with multiple myeloma (215). This method showed high concordance with conventional methods, plus the added sensitivity and specificity of the real-time technology. In addition, researchers correlated methylation status with p16 mRNA expression and observed that transcription was inversely correlated with methylation status. Other recent publications have found that promoter hypermethylation of p16 is associated with poor prognosis in recurrent early-stage hepatocellular carcinoma, and that aberrant p16 methylation is associated with nasopharyngeal carcinoma (216,217). As with other real-time methods, this application shows great potential for future studies involving methylation of key genes in carcinogenesis, as well as other biological processes.
Emerging technologies for measuring mutations in single cells
The ultimate goal of studies on genetic damage is to detect alterations at the level of a single cell, making it possible to capture modifications that precede and initiate pathological processes. Recently, several research groups
have developed microfabricated genetic analysis systems based on performing PCR reactions in nanolitre volumes, either on a wafer or in emulsion, to separate individual templates for analysis and sequencing. These developments promise to vastly increase the throughput and sensitivity of long established methods for mutation detection (218–228). One such development is the BEAMing technique described earlier (126).
Microfabricated capillary array electrophoresis
Recently, a 96-channel microfabricated capillary array electrophoresis device was developed and applied (229) for high-throughput genotyping of the methylenetetrahydrofolate reductase gene (MTHFR), which has been shown to be predictive of increased risk of leukaemia (230). The microfabricated 96-channel capillary electrophoresis system used a radial channel format coupled with a four colour radial confocal fluorescence scanner. The chip was formed by microfabricating the capillary electrophoresis channels on one wafer and then bonding it to a drilled blank wafer. Samples were then introduced into reservoirs on the perimeter, electrophoresed into the channel intersection, and separated on a gel in under two minutes. This device was capable of rapid (< two minutes) two colour genotyping of 96 MTHFR allelic variants (229).
Single cell analysis using laboratory-on-a-chip technologies
Microfluidic and laboratory-on-a-chip technologies have advanced to the point that single cell genetic analysis is feasible on a high-throughput scale. The key to the
concept of single cell genetic analysis is the idea of a PCR colony or ‘polony’ (231). The basic idea is the dilution of a PCR template into the single molecule limit followed by PCR amplification of this template in a format that limits product diffusion, either by placing the amplification in a gel or by defining a picolitre volumetric element (232,233). The amplification in a restricted volume proceeds to produce a colony of up to ~108 amplicons that can be sequenced by sequential extension and fluorescence or by pyrosequencing. In the case of the method used by the commercial company 454 Life Sciences, one of the primers is covalently linked to a bead that is statistically distributed and trapped in the picolitre volume reactor. This ensures that each bead will yield progeny from only one template. The bead further facilitates the retention of the PCR product as one goes through the steps of pyrosequencing. This concept has been extended to single cell genomics (231), which demonstrates the isolation of DNA from a single bacterial cell followed by multiple displacement amplification of the cellular DNA, producing enough product for cloning and sequencing from a single cell. Other work has demonstrated ‘digital PCR,’ where PCR template targets are diluted at the statistical limit into picolitre volume reactors in a microfabricated poly (dimethylsiloxane) (PDMS) structure (234). The observation of distinct stochastic product production allows the genetic characterization at the single molecule level. Thus, it is evident that there has been much success in the performance of single genomic copy amplification and PCR in picolitre-sized volumes followed by genetic analysis.

Unit 2 • Chapter 5. Assessment of genetic damage in healthy and diseased tissue 89
Un
it 2
Ch
ap
ter
5
Microdroplet generation and single template PCR
Sample preparation and analysis is typically performed at the microlitre or millilitre scale, because of the limitations of manual and robotic sample transport and measuring technologies, as well as detection technologies. However, new technologies exploit microfabricated microfluidics for sample transport and manipulation and operate in tandem with miniaturized and
sensitive detectors. The marriage of these two technological advances will dramatically impact the performance of clinical and point-of-care devices and is a critical part of single cell genetic analysis. Devices and methods, including the use of specific DNA probe-based affinity gels or beads for target capture and purification in DNA sequencing and DNA computing applications, have also advanced for performing sample preparation (218,219,221). A current version of
one of these devices is shown in Figure 5.16 (228). This microdroplet generating nozzle forms uniform microdroplets containing PCR reagents, microbeads, and single cell templates. These methods have been used to sequence plasmid control templates and to detect amplicons of the gyrB and GAPDH control genes in single E. coli and lymphocyte cells, respectively (218,228).
Figure 5.16. Microfluidic device for single copy DNA template amplification. Single copy genetic amplification. A: target DNA or cells and beads are mixed with the PCR reagent (blue) at very dilute concentrations and pumped through a microfabricated droplet generator. Monodisperse nanolitre volume droplets of the PCR reagent are formed in a carrier oil (yellow) at the cross-injector and routed into a tube for temperature cycling. The number of droplets containing a single bead and a single target DNA/cell is controlled by varying their concentrations in the PCR solution and controlling the droplet volume. B: Each functional PCR mix droplet contains a bead covalently labelled with the reverse primer, dye labelled forward primer, and a single target copy. Subsequent steps of PCR generate dye labelled double stranded product on the bead surface. Following emulsion PCR, the droplets are broken and the beads are analysed by flow cytometry to quantify the bound clonal amplified product. C: Microdroplet generation for controlled formation of nanolitre PCR droplets: layout of device, showing the PCR solution inlet, the two oil inlets, and the droplet outlet ports (red). A three layer (glass-PDMS-glass) pneumatically controlled micropump is integrated on-chip to deliver PCR reagent containing dilute 34μm beads and template. The manifold layer (blue) controls valve actuation, and the via hole connects the glass-PDMS hybrid channel (green) to the thermally bonded all-glass channel and cross-injector (black). Etch depth, 100μm. D: Optical micrograph of droplet generation at the cross-injector. Droplets are generated at a frequency of 5.7Hz with a combined oil flow rate of 2.2μL/min and a PCR solution flow rate of 0.8μL/min. For this experiment, average bead concentration was 130 beads/μL (0.33 bead/droplet). E: Optical micrograph of droplets with a predictable stochastic distribution of beads. Adapted from (233), Figures 1 and 2. Copyright (2008) American Chemical Society.

90
Conclusions
A new generation of candidate biomarkers of early effect in carcinogenesis is now available. Their validation in translation studies is currently a major focus in molecular epidemiology. Several of these makers are now available for application in large-scale studies on human populations. These methods utilize the latest advances in molecular cytogenetics and PCR allowing for genetic or epigenetic changes to be detected and measured in cancer-related genes and in specific regions of chromosomes that are rearranged, lost, or amplified in carcinogenesis. The combination of these methods with microfluidics and advanced fluorescence detection systems opens a wide horizon for innovative technologies and the development of novel laboratory instruments.
These new early effect biomarkers are on the causal pathway to disease and, as such, should have important application in predictive clinical tests of cancer
risk. In addition, the high sensitivity of these assays will allow the detection of genetic damage in normal, healthy individuals, either as the result of ongoing, endogenous DNA damaging processes, or as the result of environmental exposure to chemical or physical carcinogens and infectious agents. These developments will have a considerable impact on our understanding of gene-environment interactions and of the early molecular steps of disease. However, their true value will only be assessed by their application into clinical trials and prospective epidemiological studies.
The implementation of these new biomarkers has important implications on the design, cost, conduct, and analysis of molecular epidemiology studies. Two particularly important aspects must be underlined. First, the cornerstone of such studies is the development of high-quality biobanks that include sophisticated systems for specimen collection, storage, and processing. Critical in this process
is the definition of protocols for pre-analytical processing of the samples (from collection to storage and from storage to the bench). Heterogeneity and lack of quality control in these protocols are currently the main obstacles to the application of any type of novel molecular biomarker. Second, it should be anticipated that implementing such biomarkers will lead us to reconsider some statistical aspects of study design. The major problem in this respect will be to develop studies with sufficient power to distinguish between ‘passenger’ and ‘driver’ genetic changes. The use of highly sensitive methods at the single cell level will inevitably generate an unprecedented level of heterogeneity in current data on the human genome. Interpreting and mastering this heterogeneity is an important challenge which will be critical for the cost-effective implementation of molecular biomarkers.

Unit 2 • Chapter 5. Assessment of genetic damage in healthy and diseased tissue 91
Un
it 2
Ch
ap
ter
5
1. Human Genome Sequencing Consortium I; International Human Genome Sequencing Consortium (2004). Finishing the euchromatic sequence of the human genome. Nature, 431:931–945.doi:10.1038/nature03001 PMID: 15496913
2. Curwen V, Eyras E, Andrews TD et al. (2004). The Ensembl automatic gene annotation system. Genome Res, 14:942–950.doi:10.1101/gr.1858004 PMID:15123590
3. Ishikawa K, Takenaga K, Akimoto M et al. (2008). ROS-generating mitochondrial DNA mutations can regulate tumor cell metastasis. Science, 320:661–664.doi:10.1126/science. 1156906 PMID:18388260
4. Czarnecka AM, Golik P, Bartnik E (2006). Mitochondrial DNA mutations in human neoplasia. J Appl Genet, 47:67–78.doi:10.1007/BF03194602 PMID:16424612
5. Fliss MS, Usadel H, Caballero OL et al. (2000). Facile detection of mitochondrial DNA mutations in tumors and bodily fluids. Science, 287:2017–2019.doi:10.1126/science. 287.5460.2017 PMID:10720328
6. Penta JS, Johnson FM, Wachsman JT, Copeland WC (2001). Mitochondrial DNA in human malignancy. Mutat Res, 488:119–133.doi:10.1016/S1383-5742(01)00053-9 PMID:11344040
7. Polyak K, Li Y, Zhu H et al. (1998). Somatic mutations of the mitochondrial genome in human colorectal tumours. Nat Genet, 20:291–293.doi:10.1038/3108 PMID:9806551
8. Taylor RW, Turnbull DM (2005). Mitochondrial DNA mutations in human disease. Nat Rev Genet, 6:389–402.doi:10.1038/nrg1606 PMID:15861210
9. Clayton DA, Vinograd J (1967). Circular dimer and catenate forms of mitochondrial DNA in human leukaemic leucocytes. Nature, 216:652–657.doi:10.1038/216652a0 PMID:6082459
10. Chin L, Gray JW (2008). Translating insights from the cancer genome into clinical practice. Nature, 452:553–563.doi:10.1038/nature06914 PMID:18385729
11. Hanahan D, Weinberg RA (2000). The hallmarks of cancer. Cell, 100:57–70.doi:10.1016/S0092-8674(00)81683-9 PMID: 10647931
12. Herceg Z, Hainaut P (2007). Genetic and epigenetic alterations as biomarkers for cancer detection, diagnosis and prognosis. Mol Oncol, 1:26–41.doi:10.1016/j.molonc. 2007.01.004 PMID:19383285
13. Kunkel TA (2004). DNA replication fidelity. J Biol Chem, 279:16895–16898.doi:10.1074/jbc.R400006200 PMID:14988392
14. Lodish HF. Molecular cell biology. 5th ed. New York: W.H. Freeman and Company; 2003.
15. Lengauer C, Kinzler KW, Vogelstein B (1998). Genetic instabilities in human cancers. Nature, 396:643–649.doi:10.1038/25292 PMID:9872311
16. Vogelstein B, Kinzler KW (1993). The multistep nature of cancer. Trends Genet, 9:138–141.doi:10.1016/0168-9525(93)90209-Z PMID:8516849
17. Albertini RJ, Hayes RB (1997). Somatic cell mutations in cancer epidemiology. Lyon: IARC Scientific Publication; (142):159–184. PMID:9354918
18. Hagmar L, Bonassi S, Strömberg U et al. (1998). Cancer predictive value of cytogenetic markers used in occupational health surveillance programs. Recent Results Cancer Res, 154:177–184. PMID:10026999
19. Hagmar L, Brøgger A, Hansteen IL et al. (1994). Cancer risk in humans predicted by increased levels of chromosomal aberrations in lymphocytes: Nordic study group on the health risk of chromosome damage. Cancer Res, 54:2919–2922. PMID:8187078
20. Sorsa M, Wilbourn J, Vainio H (1992). Human cytogenetic damage as a predictor of cancer risk. Lyon: IARC Scientific Publication; (116):543–554. PMID:1428097
21. Kirkland DJ, editor. Basic mutagenicity tests: UKEMS recommended procedures (UKEMS Sub-Committee on Guidelines for Mutagenicity Testing. Report. Part 1 Revised). Cambridge (England); New York (NY): Cambridge University Press; 1990.
22. Holland N, Bolognesi C, Kirsch-Volders M et al. (2008). The micronucleus assay in human buccal cells as a tool for biomonitoring DNA damage: the HUMN project perspective on current status and knowledge gaps. Mutat Res, 659:93–108.doi:10.1016/j.mrrev.2008. 03.007 PMID:18514568
23. Iarmarcovai G, Bonassi S, Botta A et al. (2008). Genetic polymorphisms and micronucleus formation: a review of the literature. Mutat Res, 658:215–233 doi:10.1016/j.mrrev.2007.10.001 PMID:18037339
24. Majer BJ, Laky B, Knasmüller S, Kassie F (2001). Use of the micronucleus assay with exfoliated epithelial cells as a biomarker for monitoring individuals at elevated risk of genetic damage and in chemoprevention trials. Mutat Res, 489:147–172.doi:10.1016/S1383-5742(01)00068-0 PMID:11741033
25. Natarajan AT, Palitti F (2008). DNA repair and chromosomal alterations. Mutat Res, 657:3–7. PMID:18801460
26. Wilson DM 3rd, Thompson LH (2007). Molecular mechanisms of sister-chromatid exchange. Mutat Res, 616:11–23. PMID:1715 7333
27. Toniolo P, Boffetta P, Shuker DEG et al. (editors). Application of biomarkers in cancer epidemiology. Lyon: International Agency for Research on Cancer; 1997.
28. Sjöblom T (2008). Systematic analyses of the cancer genome: lessons learned from sequencing most of the annotated human protein-coding genes. Curr Opin Oncol, 20:66–71.doi:10.1097/CCO.0b013e3282f31108 PMID:18043258
29. Sjöblom T, Jones S, Wood LD et al. (2006). The consensus coding sequences of human breast and colorectal cancers. Science, 314:268–274.doi:10.1126/science.1133427 PMID:16959974
30. Cooper DN, Ball EV, Krawczak M (1998). The human gene mutation database. Nucleic Acids Res, 26:285–287.doi:10.1093/nar/26.1.285 PMID:9399854
31. Krawczak M, Cooper DN (1997). The human gene mutation database. Trends Genet, 13:121–122.doi:10.1016/S0168-9525 (97)01068-8 PMID:9066272
32. Cooper DN, Krawczak M. Human gene mutation. Human molecular genetics series. Oxford, UK: Bios Scientific Publishers; 1993.
33. Antonarakis SE, Krawczak M, Cooper DN (2000). Disease-causing mutations in the human genome. Eur J Pediatr, 159 Suppl 3;S173 – S178.doi:10.1007/PL00014395 PMID:11216894
34. Stenson PD, Ball E, Howells K et al. (2008). Human Gene Mutation Database: towards a comprehensive central mutation database. J Med Genet, 45:124–126.doi:10.1136/jmg.2007.055210 PMID:18245393
35. Stenson PD, Ball EV, Mort M et al. (2003). Human Gene Mutation Database (HGMD): 2003 update. Hum Mutat, 21:577–581.doi:10.1002/humu.10212 PMID:12754702
36. Besaratinia A, Pfeifer GP (2006). Investigating human cancer etiology by DNA lesion footprinting and mutagenicity analysis. Carcinogenesis, 27:1526–1537.doi:10.1093/carcin/bgi311 PMID:16344267
37. Hainaut P, Hollstein M (2000). p53 and human cancer: the first ten thousand mutations. Adv Cancer Res, 77:81–137.doi: 10.1016/S0065-230X(08)60785-X PMID:1054 9356
38. Wogan GN, Hecht SS, Felton JS et al. (2004). Environmental and chemical carcinogenesis. Semin Cancer Biol, 14:473–486.doi:10.1016/j.semcancer.2004.06.010 PMID:15489140
References

92
39. Guengerich FP (2000). Metabolism of chemical carcinogens. Carcinogenesis, 21:345 –351.doi:10.1093/carcin/21.3.345 PMID:10688854
40. Guengerich FP, Parikh A, Yun CH et al. (2000). What makes P450s work? Searches for answers with known and new P450s. Drug Metab Rev, 32:267–281.doi:10.1081/DMR-100102334 PMID:11139129
41. Burchell B, Coughtrie MW (1997). Genetic and environmental factors associated with variation of human xenobiotic glucuronidation and sulfation. Environ Health Perspect, 105 Suppl 4;739–747.doi:10.2307/3433277 PMID:9255555
42. Guengerich FP (2003). Activation of dihaloalkanes by thiol-dependent mechanisms. J Biochem Mol Biol, 36:20–27. PMID:12542971
43. Guengerich FP (2003). Cytochrome P450 oxidations in the generation of reactive electrophiles: epoxidation and related reactions. Arch Biochem Biophys, 409:59–71.doi:10.1016/S0003-9861(02)00415-0 PMID: 12464245
44. Guengerich FP (2003). Cytochromes P450, drugs, and diseases. Mol Interv, 3:194–204.doi:10.1124/mi.3.4.194 PMID:14993447
45. Miller JA (1994). Recent studies on the metabolic activation of chemical carcinogens. Cancer Res, 54 Suppl;1879s–1881s. PMID: 8137303
46. Hanawalt PC, Ford JM, Lloyd DR (2003). Functional characterization of global genomic DNA repair and its implications for cancer. Mutat Res, 544:107–114.doi:10.1016/j.mrrev. 2003.06.002 PMID:14644313
47. Hoeijmakers JH (2001). DNA repair mechanisms. Maturitas, 38:17–22, discussion 22–23.doi:10.1016/S0378-5122(00)00188-2 PMID:11311581
48. Hoeijmakers JH (2001). Genome maintenance mechanisms for preventing cancer. Nature, 411:366–374.doi:10.1038/350 77232 PMID:11357144
49. Myrnes B, Giercksky KE, Krokan H (1982). Repair of O6-methyl-guanine residues in DNA takes place by a similar mechanism in extracts from HeLa cells, human liver, and rat liver. J Cell Biochem, 20:381–392.doi:10.1002/jcb.240200408 PMID:7183679
50. Samson L, Cairns J (1977). A new pathway for DNA repair in Escherichia coli. Nature, 267:281–283.doi:10.1038/267281a0 PMID:325420
51. Teo IA, Karran P (1982). Excision of O6-methylguanine from DNA by human fibroblasts determined by a sensitive competition method. Carcinogenesis, 3:923–928.doi:10.1093/carcin/3.8.923 PMID:7127672
52. Denissenko MF, Pao A, Pfeifer GP, Tang M (1998). Slow repair of bulky DNA adducts along the nontranscribed strand of the human p53 gene may explain the strand bias of transversion mutations in cancers. Oncogene, 16:1241–1247.doi:10.1038/sj.onc.1201647 PMID:9546425
53. Tornaletti S, Pfeifer GP (1994). Slow repair of pyrimidine dimers at p53 mutation hotspots in skin cancer. Science, 263:1436–1438.doi:10.1126/science.8128225 PMID:8128225
54. Hainaut P, Pfeifer GP (2001). Patterns of p53 G–>T transversions in lung cancers reflect the primary mutagenic signature of DNA-damage by tobacco smoke. Carcinogenesis, 22:367–374.doi:10.1093/carcin/22.3.367 PMID:11238174
55. Pluquet O, Hainaut P (2001). Genotoxic and non-genotoxic pathways of p53 induction. Cancer Lett, 174:1–15.doi:10.1016/S0304-3835(01)00698-X PMID:11675147
56. Livneh Z (2001). DNA damage control by novel DNA polymerases: translesion replication and mutagenesis. J Biol Chem, 276:25639–25642.doi:10.1074/jbc.R1000 19200 PMID:11371576
57. Kumar S, Subramanian S (2002). Mutation rates in mammalian genomes. Proc Natl Acad Sci USA, 99:803–808.doi:10.1073/pnas.0226 29899 PMID:11792858
58. Holliday R, Grigg GW (1993). DNA methylation and mutation. Mutat Res, 285:61–67. PMID:7678134
59. Jones PA, Rideout WM 3rd, Shen JC et al. (1992). Methylation, mutation and cancer. Bioessays, 14:33–36.doi:10.1002/bies.95014 0107 PMID:1546979
60. Olivier M, Hussain SP, Caron de Fromentel C et al. (2004). TP53 mutation spectra and load: a tool for generating hypotheses on the etiology of cancer. Lyon: IARC Scientific Publication; (157):247–270. PMID:15055300
61. Hussain SP, Hofseth LJ, Harris CC (2003). Radical causes of cancer. Nat Rev Cancer, 3:276–285.doi:10.1038/nrc1046 PMID:1267 1666
62. Schmutte C, Yang AS, Nguyen TT et al. (1996). Mechanisms for the involvement of DNA methylation in colon carcinogenesis. Cancer Res, 56:2375–2381. PMID:8625314
63. Greenblatt MS, Grollman AP, Harris CC (1996). Deletions and insertions in the p53 tumor suppressor gene in human cancers: confirmation of the DNA polymerase slippage/misalignment model. Cancer Res, 56:2130–2136. PMID:8616861
64. Antonarakis SE, Lyle R, Deutsch S, Reymond A (2002). Chromosome 21: a small land of fascinating disorders with unknown pathophysiology. Int J Dev Biol, 46:89–96. PMID:11902692
65. Essigmann JM, Wood ML (1993). The relationship between the chemical structures and mutagenic specificities of the DNA lesions formed by chemical and physical mutagens. Toxicol Lett, 67:29–39.doi:10.1016/0378-4274 (93)90044-X PMID:8451766
66. Vrieling H, van Zeeland AA, Mullenders LH (1998). Transcription coupled repair and its impact on mutagenesis. Mutat Res, 400:135–142. PMID:9685614
67. Dogliotti E, Hainaut P, Hernandez T et al. (1998). Mutation spectra resulting from carcinogenic exposure: from model systems to cancer-related genes. Recent Results Cancer Res, 154:97–124. PMID:10026995
68. Hollstein M, Hergenhahn M, Yang Q et al. (1999). New approaches to understanding p53 gene tumor mutation spectra. Mutat Res, 431:199–209. PMID:10635987
69. Pfeifer GP, Besaratinia A (2009). Mutational spectra of human cancer. Hum Genet, 125:493–506.doi:10.1007/s00439-009-0657-2 PMID:19308457
70. Shi H, Le Calvez F, Olivier M, Hainaut P. Patterns of TP53 mutations in human cancer: interplay between mutagenesis, DNA repair and selection. In Hainaut P, Wiman KG, editors. 25 years of p53 research. The Netherlands: Springer; 2005. p. 293–319.
71. Hernandez-Boussard T, Montesano R, Hainaut P (1999). Sources of bias in the detection and reporting of p53 mutations in human cancer: analysis of the IARC p53 mutation database. Genet Anal, 14:229–233. PMID:10084119
72. Rangarajan A, Hong SJ, Gifford A, Weinberg RA (2004). Species- and cell type-specific requirements for cellular transformation. Cancer Cell, 6:171–183.doi:10.1016/j.ccr.2004.07.009 PMID:15324700
73. Furnari FB, Fenton T, Bachoo RM et al. (2007). Malignant astrocytic glioma: genetics, biology, and paths to treatment. Genes Dev, 21:2683 –2710.doi:10.1101/gad.1596707 PMID:17974913
74. Beckmann MW, Niederacher D, Schnürch HG et al. (1997). Multistep carcinogenesis of breast cancer and tumour heterogeneity. J Mol Med, 75:429–439.doi:10.1007/s001090050128 PMID:9231883
75. Warburg O (1956). On respiratory impairment in cancer cells. Science, 124:269–270. PMID:13351639
76. Warburg O (1956). On the origin of cancer cells. Science, 123:309–314.doi:10.1126/science.123.3191.309 PMID:13298683
77. Weinhouse S, Warburg O, Burk D, Schade AL (1956). On respiratory impairment in cancer cells. Science, 124:267–272.doi:10.1126/science.124.3215.267 PMID:13351638
78. Clayton DA, Davis RW, Vinograd J (1970). Homology and structural relationships between the dimeric and monomeric circular forms of mitochondrial DNA from human leukemic leukocytes. J Mol Biol, 47:137–144.doi:10.1016/0022-2836(70)90335 -9 PMID:5265062
79. Clayton DA, Smith CA, Jordan JM et al. (1968). Occurrence of complex mitochondrial DNA in normal tissues. Nature, 220:976–979.doi:10.1038/220976a0 PMID:5701854
80. Clayton DA, Vinograd J (1969). Complex mitochondrial DNA in leukemic and normal human myeloid cells. Proc Natl Acad Sci USA, 62:1077–1084.doi:10.1073/pnas.62.4.1077 PMID:5256408

Unit 2 • Chapter 5. Assessment of genetic damage in healthy and diseased tissue 93
Un
it 2
Ch
ap
ter
5
81. He L, Luo L, Proctor SJ et al. (2003). Somatic mitochondrial DNA mutations in adult-onset leukaemia. Leukemia, 17:2487–2491.doi:10.1038/sj.leu.2403146 PMID:14523470
82. Jerónimo C, Nomoto S, Caballero OL et al. (2001). Mitochondrial mutations in early stage prostate cancer and bodily fluids. Oncogene, 20:5195–5198.doi:10.1038/sj.onc.1204646 PMID:11526508
83. Jones JB, Song JJ, Hempen PM et al. (2001). Detection of mitochondrial DNA mutations in pancreatic cancer offers a “mass”-ive advantage over detection of nuclear DNA mutations. Cancer Res, 61:1299–1304. PMID:11245424
84. Kirches E, Krause G, Warich-Kirches M et al. (2001). High frequency of mitochondrial DNA mutations in glioblastoma multiforme identified by direct sequence comparison to blood samples. Int J Cancer, 93:534–538.doi:10.1002/ijc.1375 PMID:11477557
85. Bianchi MS, Bianchi NO, Bailliet G (1995). Mitochondrial DNA mutations in normal and tumor tissues from breast cancer patients. Cytogenet Cell Genet, 71:99–103.doi:10.1159/000134072 PMID:7606938
86. Horton TM, Petros JA, Heddi A et al. (1996). Novel mitochondrial DNA deletion found in a renal cell carcinoma. Genes Chromosomes Cancer, 15:95–101.doi:10.1002/(SICI)1098-2264(199602)15:2<95::AID-GCC3>3.0.CO;2-Z PMID:8834172
87. LaBiche RA, Yoshida M, Gallick GE et al. (1988). Gene expression and tumor cell escape from host effector mechanisms in murine large cell lymphoma. J Cell Biochem, 36:393– 403.doi:10.1002/ jcb.240360408 PMID:3379107
88. Luciaková K, Kuzela S (1992). Increased steady-state levels of several mitochondrial and nuclear gene transcripts in rat hepatoma with a low content of mitochondria. Eur J Biochem, 205:1187–1193.doi:10.1111/ j.1432-1033.1992.tb16889.x PMID:1374334
89. Tamura G, Nishizuka S, Maesawa C et al. (1999). Mutations in mitochondrial control region DNA in gastric tumours of Japanese patients. Eur J Cancer, 35:316–319.doi:10.1016/S0959-8049(98)00360-8 PMID:10448277
90. Gallardo ME, Moreno-Loshuertos R, López C et al. (2006). m.6267G>A: a recurrent mutation in the human mitochondrial DNA that reduces cytochrome c oxidase activity and is associated with tumors. Hum Mutat, 27:575 – 5 82 .do i :10 .10 02 / humu. 203 3 8 PMID:16671096
91. Petros JA, Baumann AK, Ruiz-Pesini E et al. (2005). mtDNA mutations increase tumorigenicity in prostate cancer. Proc Natl Acad Sci USA, 102:719–724.doi:10.1073/pnas.0408894102 PMID:15647368
92. Shidara Y, Yamagata K, Kanamori T et al. (2005). Positive contribution of pathogenic mutations in the mitochondrial genome to the promotion of cancer by prevention from apoptosis. Cancer Res, 65:1655–1663.doi: 10.1158/0008-5472.CAN-04-2012 PMID:1575 3359
93. Shen M, Zhang L, Bonner MR et al. (2008). Association between mitochondrial DNA copy number, blood cell counts, and occupational benzene exposure. Environ Mol Mutagen, 49:453–457.doi:10.1002/em.20402 PMID:18481315
94. Glass DC, Gray CN, Jolley DJ et al. (2003). Leukemia risk associated with low-level benzene exposure. Epidemiology, 14:569–577.doi:10.1097/01.ede.0000082001.05563.e0 PMID:14501272
95. Coller HA, Khrapko K, Bodyak ND et al. (2001). High frequency of homoplasmic mitochondrial DNA mutations in human tumors can be explained without selection. Nat Genet, 28:147–150.doi:10.1038/88859 PMID:11381261
96. Taylor RW, Barron MJ, Borthwick GM et al. (2003). Mitochondrial DNA mutations in human colonic crypt stem cells. J Clin Invest, 112:1351–1360. PMID:14597761
97. Wardell TM, Ferguson E, Chinnery PF et al. (2003). Changes in the human mitochondrial genome after treatment of malignant disease. Mutat Res, 525:19–27. PMID:12650902
98. Albinger-Hegyi A, Hochreutener B, Abdou MT et al. (2002). High frequency of t(14;18)-translocation breakpoints outside of major breakpoint and minor cluster regions in follicular lymphomas: improved polymerase chain reaction protocols for their detection. Am J Pathol, 160:823–832.doi:10.1016/S0002-9440(10)64905-X PMID:11891181
99. Flaman JM, Frebourg T, Moreau V et al. (1994). A rapid PCR fidelity assay. Nucleic Acids Res, 22:3259–3260.doi:10.1093/nar/22. 15.3259 PMID:8065949
100. Kwok S, Higuchi R (1989). Avoiding false positives with PCR. Nature, 339:237–238.doi:10.1038/339237a0 PMID:2716852
101. Ling G, Persson A, Berne B et al. (2001). Persistent p53 mutations in single cells from normal human skin. Am J Pathol, 159:1247–1253.doi:10.1016/S0002-9440(10)62511-4 PMID:11583952
102. Williams C, Pontén F, Ahmadian A et al. (1998). Clones of normal keratinocytes and a variety of simultaneously present epidermal neoplastic lesions contain a multitude of p53 gene mutations in a xeroderma pigmentosum patient. Cancer Res, 58:2449–2455. PMID: 9622088
103. Hussain SP, Amstad P, Raja K et al. (2000). Increased p53 mutation load in noncancerous colon tissue from ulcerative colitis: a cancer-prone chronic inflammatory disease. Cancer Res, 60:3333–3337. PMID: 10910033
104. Hussain SP, Amstad P, Raja K et al. (2001). Mutability of p53 hotspot codons to benzo(a)pyrene diol epoxide (BPDE) and the frequency of p53 mutations in nontumorous human lung. Cancer Res, 61:6350–6355. PMID:11522624
105. Hussain SP, Raja K, Amstad PA et al. (2000). Increased p53 mutation load in nontumorous human liver of wilson disease and hemochromatosis: oxyradical overload diseases. Proc Natl Acad Sci USA, 97:12770–12775.doi:10.1073/pnas.220416097 PMID:11 050162
106. Ouhtit A, Nakazawa H, Armstrong BK et al. (1998). UV-radiation-specific p53 mutation frequency in normal skin as a predictor of risk of basal cell carcinoma. J Natl Cancer Inst, 90:523–531.doi:10.1093/jnci/90.7.523 PMID: 9539248
107. Chiocca SM, Sandy MS, Cerutti PA (1992). Genotypic analysis of N-ethyl-N-nitrosourea-induced mutations by Taq I restriction fragment length polymorphism/polymerase chain reaction in the c-H-ras1 gene. Proc Natl Acad Sci USA, 89:5331–5335.doi:10.1073/pnas.89.12.5331 PMID:1351680
108. Gormally E, Caboux E, Vineis P, Hainaut P (2007). Circulating free DNA in plasma or serum as biomarker of carcinogenesis: practical aspects and biological significance. Mutat Res, 635:105–117.doi:10.1016/j.mrrev. 2006.11.002 PMID:17257890
109. Diehl F, Li M, Dressman D et al. (2005). Detection and quantification of mutations in the plasma of patients with colorectal tumors. Proc Natl Acad Sci USA, 102:16368–16373.doi:10.1073/pnas.0507904102 PMID:162580 65
110. Welsh JA, Castrén K, Vähäkangas KH (1997). Single-strand conformation polymorphism analysis to detect p53 mutations: characterization and development of controls. Clin Chem, 43:2251–2255. PMID: 9439440
111. Yamanoshita O, Kubota T, Hou J et al. (2005). DHPLC is superior to SSCP in screening p53 mutations in esophageal cancer tissues. Int J Cancer, 114:74–79.doi:10 .1002/ijc.20712 PMID:15523690
112. Børresen-Dale AL, Hovig E, Smith-Sørensen B (2001). Detection of mutations by denaturing gradient gel electrophoresis. Curr Protoc Hum Genet, Chapter 7:Unit 7 5.
113. Gormally E, Vineis P, Matullo G et al. (2006). TP53 and KRAS2 mutations in plasma DNA of healthy subjects and subsequent cancer occurrence: a prospective study. Cancer Res, 66:6871–6876.doi:10.1158/0008- 5472.CAN-05-4556 PMID:16818665
114. Kurg A, Tõnisson N, Georgiou I et al. (2000). Arrayed primer extension: solid-phase four-color DNA resequencing and mutation detection technology. Genet Test, 4:1–7.doi:10.1089/109065700316408 PMID: 10794354

94
115. Le Calvez F, Ahman A, Tõnisson N et al. (2005). Arrayed primer extension resequencing of mutations in the TP53 tumor suppressor gene: comparison with denaturing HPLC and direct sequencing. Clin Chem, 51:1284–1287.doi:10.1373/clinchem.2005. 048348 PMID:15976115
116. Tõnisson N, Zernant J, Kurg A et al. (2002). Evaluating the arrayed primer extension resequencing assay of TP53 tumor suppressor gene. Proc Natl Acad Sci USA, 99:5503–5508.doi:10.1073/pnas.082100599 PMID:11960007
117. Jenkins GJ, Doak SH, Griffiths AP et al. (2003). Early p53 mutations in nondysplastic Barrett’s tissue detected by the restriction site mutation (RSM) methodology. Br J Cancer, 88:1271–1276.doi:10.1038/sj.bjc.6600891 PMID:12698195
118. Kirk GD, Camus-Randon AM, Mendy M et al. (2000). Ser-249 p53 mutations in plasma DNA of patients with hepatocellular carcinoma from The Gambia. J Natl Cancer Inst, 92:148–153.doi:10.1093/jnci/92.2.148 PMID:10639517
119. Wada H, Asada M, Nakazawa S et al. (1994). Clonal expansion of p53 mutant cells in leukemia progression in vitro. Leukemia, 8:53–59. PMID:8289498
120. Zhu YM, Foroni L, McQuaker IG et al. (1999). Mechanisms of relapse in acute leukaemia: involvement of p53 mutated subclones in disease progression in acute lymphoblastic leukaemia. Br J Cancer, 79:1151–1157.doi:10.1038/sj.bjc.6690183 PMID:10098750
121. Behn M, Schuermann M (1998). Sensitive detection of p53 gene mutations by a ‘mutant enriched’ PCR-SSCP technique. Nucleic Acids Res, 26:1356–1358.doi:10.1093/nar/26. 5.1356 PMID:9469850
122. Parsons BL, Heflich RH (1998). Detection of a mouse H-ras codon 61 mutation using a modified allele-specific competitive blocker PCR genotypic selection method. Mutagenesis, 13:581–588.doi:10.1093/mutage/13.6.581 PMID:9862188
123. Parsons BL, Heflich RH (1997). Evaluation of MutS as a tool for direct measurement of point mutations in genomic DNA. Mutat Res, 374:277–285. PMID:9100851
124. Parsons BL, Heflich RH (1998). Detection of basepair substitution mutation at a frequency of 1 x 10(-7) by combining two genotypic selection methods, MutEx enrichment and allele-specific competitive blocker PCR. Environ Mol Mutagen, 3 2 : 2 0 0 – 211.d o i :10 .10 0 2 / (S I C I )10 9 8 -2280(1998)32:3<200::AID-EM2>3.0.CO;2-O PMID:9814434
125. Jackson PE, Qian GS, Friesen MD et al. (2001). Specific p53 mutations detected in plasma and tumors of hepatocellular carcinoma patients by electrospray ionization mass spectrometry. Cancer Res, 61:33–35. PMID:11196182
126. Laken SJ, Jackson PE, Kinzler KW et al. (1998). Genotyping by mass spectrometric analysis of short DNA fragments. Nat Biotechnol, 16:1352–1356.doi:10.1038/4333 PMID:9853618
127. Qian GS, Kuang SY, He X et al. (2002). Sensitivity of electrospray ionization mass spectrometry detection of codon 249 mutations in the p53 gene compared with RFLP. Cancer Epidemiol Biomarkers Prev, 11:1126–1129. PMID:12376521
128. Lleonart ME, Kirk GD, Villar S et al. (2005). Quantitative analysis of plasma TP53 249Ser-mutated DNA by electrospray ionization mass spectrometry. Cancer Epidemiol Biomarkers Prev, 14:2956–2962.doi:10.1158/1055-9965.EPI-05-0612 PMID:16365016
129. Szymañska K, Chen JG, Cui Y et al. (2009). TP53 R249S mutations, exposure to aflatoxin, and occurrence of hepatocellular carcinoma in a cohort of chronic hepatitis B virus carriers from Qidong, China. Cancer Epidemiol Biomarkers Prev, 18:1638–1643.doi:10.1158/1055-9965.EPI-08-1102 PMID:19 366907
130. Diehl F, Li M, He Y et al. (2006). BEAMing: single-molecule PCR on microparticles in water-in-oil emulsions. Nat Methods, 3:551–559.doi:10.1038/nmeth898 PMID:16791214
131. Diehl F, Schmidt K, Choti MA et al. (2008). Circulating mutant DNA to assess tumor dynamics. Nat Med, 14:985–990.doi:10.1038/nm.1789 PMID:18670422
132. Ong ST, Le Beau MM (1998). Chromosomal abnormalities and molecular genetics of non-Hodgkin’s lymphoma. Semin Oncol, 25:447–460. PMID:9728595
133. Rowley JD (1998). The critical role of chromosome translocations in human leukemias. Annu Rev Genet, 32:495–519.doi:10.1146/annurev.genet.32.1.495 PMID:99 28489
134. Hagmar L, Bonassi S, Strömberg U et al. (1998). Chromosomal aberrations in lymphocytes predict human cancer: a report from the European Study Group on Cytogenetic Biomarkers and Health (ESCH). Cancer Res, 58:4117–4121. PMID:9751622
135. Bonassi S, Abbondandolo A, Camurri L et al. (1995). Are chromosome aberrations in circulating lymphocytes predictive of future cancer onset in humans? Preliminary results of an Italian cohort study. Cancer Genet Cytogenet, 79:133–135.doi:10.1016/0165-46 08(94)00131-T PMID:7889505
136. Pedersen-Bjergaard J, Pedersen M, Roulston D, Philip P (1995). Different genetic pathways in leukemogenesis for patients presenting with therapy-related myelodysplasia and therapy-related acute myeloid leukemia. Blood, 86:3542–3552. PMID:7579462
137. Eastmond DA, Pinkel D (1990). Detection of aneuploidy and aneuploidy-inducing agents in human lymphocytes using fluorescence in situ hybridization with chromosome-specific DNA probes. Mutat Res, 234:303–318. PMID: 2215545
138. Gray JW, Pinkel D (1992). Molecular cytogenetics in human cancer diagnosis. Cancer, 69 Suppl;1536–1542.doi:10.1002/1097-0142(19920315)69:6+<1536::AID-CNCR 2820691306>3.0.CO;2-J PMID:1540892
139. Eastmond DA, Schuler M, Rupa DS (1995). Advantages and limitations of using fluorescence in situ hybridization for the detection of aneuploidy in interphase human cells. Mutat Res, 348:153–162.doi:10.1016/0165-7992(95)90003-9 PMID:85 44867
140. Kadam P, Umerani A, Srivastava A et al. (1993). Combination of classical and interphase cytogenetics to investigate the biology of myeloid disorders: detection of masked monosomy 7 in AML. Leuk Res, 17:365–374.doi:10.1016/0145-2126(93)900 25-G PMID:8487586
141. Kibbelaar RE, Mulder JW, Dreef EJ et al. (1993). Detection of monosomy 7 and trisomy 8 in myeloid neoplasia: a comparison of banding and fluorescence in situ hybridization. Blood, 82:904–913. PMID:8338953
142. Poddighe PJ, Moesker O, Smeets D et al. (1991). Interphase cytogenetics of hematological cancer: comparison of classical karyotyping and in situ hybridization using a panel of eleven chromosome specific DNA probes. Cancer Res, 51:1959–1967. PMID:2004382
143. Cohen MM, Rosenblum-Vos LS, Prabhakar G (1993). Human cytogenetics. A current overview. Am J Dis Child, 147:1159–1166. PMID:8237909
144. Gray JW, Pinkel D, Brown JM (1994). Fluorescence in situ hybridization in cancer and radiation biology. Radiat Res, 137:275–289.doi:10.2307/3578700 PMID:8146269
145. Tucker JD, Senft JR (1994). Analysis of naturally occurring and radiation-induced breakpoint locations in human chromosomes 1, 2 and 4. Radiat Res, 140:31–36.doi:10. 2307/3578565 PMID:7938452
146. Dulout FN, Grillo CA, Seoane AI et al. (1996). Chromosomal aberrations in peripheral blood lymphocytes from native Andean women and children from northwestern Argentina exposed to arsenic in drinking water. Mutat Res, 370:151–158. PMID:8917661
147. Rupa DS, Hasegawa L, Eastmond DA (1995). Detection of chromosomal breakage in the 1cen-1q12 region of interphase human lymphocytes using multicolor fluorescence in situ hybridization with tandem DNA probes. Cancer Res, 55:640–645. PMID:7834635
148. Zhang L, Rothman N, Wang Y et al. (1996). Interphase cytogenetics of workers exposed to benzene. Environ Health Perspect, 104 Suppl 6;1325–1329.doi:10.2307/3433184 PMID:9118914
149. Matsumoto K, Ramsey MJ, Nelson DO, Tucker JD (1998). Persistence of radiation-induced translocations in human peripheral blood determined by chromosome painting. Radiat Res, 149:602–613.doi: 10.2307/3579907 PMID:9611099

Unit 2 • Chapter 5. Assessment of genetic damage in healthy and diseased tissue 95
Un
it 2
Ch
ap
ter
5
150. Tucker JD, Breneman JW, Briner JF et al. (1997). Persistence of radiation-induced translocations in rat peripheral blood determined by chromosome painting. Environ Mol Mutagen, 30:264–272.doi:10.1002/(SICI)1098-2280(1997)30:3<264::AID-EM4 >3.0.CO;2-L PMID:9366904
151. Tucker JD, Tawn EJ, Holdsworth D et al. (1997). Biological dosimetry of radiation workers at the Sellafield nuclear facility. Radiat Res, 148:216–226.doi:10.2307/3579605 PMID:9291352
152. Sachs RK, Chen AM, Brenner DJ (1997). Review: proximity effects in the production of chromosome aberrations by ionizing radiation. Int J Radiat Biol, 71:1–19.doi:10.1080/095530097144364 PMID:90209 58
153. Morton NE (1991). Parameters of the human genome. Proc Natl Acad Sci USA, 88:7474–7476.doi:10.1073/pnas.88.17.7474 PMID:1881886
154. Zhang L, Rothman N, Wang Y et al. (1998). Increased aneusomy and long arm deletion of chromosomes 5 and 7 in the lymphocytes of Chinese workers exposed to benzene. Carcinogenesis, 19:1955–1961.doi:10.1093/carcin/19.11.1955 PMID:9855009
155. Xi L, Zhang L, Wang Y, Smith MT (1997). Induction of chromosome-specific aneuploidy and micronuclei in human lymphocytes by metabolites of 1,3-butadiene. Carcinogenesis, 18:1687–1693.doi:10.1093/carcin/18.9.1687 PMID:9328162
156. Scarpato R, Lori A, Panasiuk G, Barale R (1997). FISH analysis of translocations in lymphocytes of children exposed to the Chernobyl fallout: preferential involvement of chromosome 10. Cytogenet Cell Genet, 79:153–156.doi:10.1159/000134708 PMID:95 33038
157. Smith MT, Zhang L, Wang Y et al. (1998). Increased translocations and aneusomy in chromosomes 8 and 21 among workers exposed to benzene. Cancer Res, 58:2176–2181. PMID:9605763
158. Schröck E, du Manoir S, Veldman T et al. (1996). Multicolor spectral karyotyping of human chromosomes. Science, 273:494–497.doi:10.1126/science.273.5274.494 PMID: 8662537
159. Dantonio PD, Meredith-Molloy N, Hagopian WA et al. (2010). Proficiency testing of human leukocyte antigen-DR and human leukocyte antigen-DQ genetic risk assessment for type 1 diabetes using dried blood spots. J Diabetes Sci Technol, 4:929–941. PMID:20663459
160. Biernaux C, Loos M, Sels A et al. (1995). Detection of major bcr-abl gene expression at a very low level in blood cells of some healthy individuals. Blood, 86:3118–3122. PMID:7579406
161. Fuscoe JC, Setzer RW, Collard DD, Moore MM (1996). Quantification of t(14;18) in the lymphocytes of healthy adult humans as a possible biomarker for environmental exposures to carcinogens. Carcinogenesis, 17:1013–1020.doi:10.1093/carcin/17.5.1013 PMID:8640906
162. Liu Y, Hernandez AM, Shibata D, Cortopassi GA (1994). BCL2 translocation frequency rises with age in humans. Proc Natl Acad Sci USA, 91:8910–8914.doi:10.1073/pnas.91.19.8910 PMID:8090743
163. Bell DA, Liu Y, Cortopassi GA (1995). Occurrence of bcl-2 oncogene translocation with increased frequency in the peripheral blood of heavy smokers. J Natl Cancer Inst, 87:223–224.doi:10.1093/jnci/87.3.223 PMID: 7707410
164. Innis MA, Gelfand DH, Sninsky JJ, editors. PCR applications: protocols for functional genomics. San Diego (CA): Academic Press; 1999.
165. Bories D, Dumont V, Belhadj K, et al. (1998). Real-time quantitative RT-PCR monitoring of chronic myelogenous leukemia. Blood, 92(10) (Suppl 1 Part 1–2):73A.
166. Krauter J, Wattjes MP, Nagel S, et al. (1998).AML1/MTG8 real time RT-PCR for the detection of minimal residual disease in patients with t(8;21)-positive AML. Blood, 92(10)(Suppl 1 Part 1–2):74A–75A.
167. Krauter J, Wattjes MP, Nagel S et al. (1999). Real-time RT-PCR for the detection and quantification of AML1/MTG8 fusion transcripts in t(8;21)-positive AML patients. Br J Haematol, 107:80–85.doi:10.1046/j.1365- 2141.1999.01674.x PMID:10520027
168. Luthra R, McBride JA, Cabanillas F, Sarris A (1998). Novel 5′ exonuclease-based real-time PCR assay for the detection of t(14;18)(q32;q21) in patients with follicular lymphoma. Am J Pathol, 153:63–68.doi:10.1016/S0002-9440(10)65546-0 PMID:9665466
169. Preudhomme C, Merlat A, Roumier C, Duflos-Grardel N, Jouet JP, Cosson A, et al. Detection of BCR-ABL transcripts in chronic myeloid leukemia (CML) using a novel ‘real time’ quantitative RT-PCR assay: A report on 15 patients. Blood 1998;92(10)(Suppl 1 Part 1–2):93A.
170. Saal RJ, Gill DS, Cobcroft RG, Marlton P (1998). Quantitation of AML-ETO transcripts using real time PCR on the ABI7700 sequence detection system. Blood, 92(10)(Suppl 1 Part 1–2):74A.
171. Cayuela JM, Gardie B, Sigaux F (1997). Disruption of the multiple tumor suppressor gene MTS1/p16(INK4a)/CDKN2 by illegitimate V(D)J recombinase activity in T-cell acute lymphoblastic leukemias. Blood, 90:3720–3726. PMID:9345058
172. Schlissel MS, Kaffer CR, Curry JD (2006). Leukemia and lymphoma: a cost of doing business for adaptive immunity. Genes Dev, 20:1539–1544.doi:10.1101/gad.1446506 PMID:16778072
173. Aster JC, Longtine JA (2002). Detection of BCL2 rearrangements in follicular lymphoma. Am J Pathol, 160:759–763.doi:10.1016/S00 02-9440(10)64897-3 PMID:11891173
174. Dölken L, Schüler F, Dölken G (1998). Quantitative detection of t(14;18)-positive cells by real-time quantitative PCR using fluorogenic probes. Biotechniques, 25:1058–1064. PMID:9863062
175. Satake N, Maseki N, Kozu T et al. (1995). Disappearance of AML1-MTG8(ETO) fusion transcript in acute myeloid leukaemia patients with t(8;21) in long-term remission. Br J Haematol, 91:892–898.doi: 10.1111/j.1365-2141.1995.tb05406.x PMID:8547135
176. Marcucci G, Livak KJ, Bi W et al. (1998). Detection of minimal residual disease in patients with AML1/ETO-associated acute myeloid leukemia using a novel quantitative reverse transcription polymerase chain reaction assay. Leukemia, 12:1482–1489.doi:10.1038/sj.leu.2401128 PMID:9737700
177. Mensink E, van de Locht A, Schattenberg A et al. (1998). Quantitation of minimal residual disease in Philadelphia chromosome positive chronic myeloid leukaemia patients using real-time quantitative RT-PCR. Br J Haematol, 102:768–774.doi:10.1046/j.1365-2141.1998.00823.x PMID:9722305
178. Heisterkamp N, Stephenson JR, Groffen J et al. (1983). Localization of the c-ab1 oncogene adjacent to a translocation break point in chronic myelocytic leukaemia. Nature, 306:239–242.doi:10.1038/306239a0 PMID:6316147
179. Heddle JA (1973). A rapid in vivo test for chromosomal damage. Mutat Res, 18:187–190. PMID:4351282
180. Matter B, Schmid W (1971). Trenimon-induced chromosomal damage in bone-marrow cells of six mammalian species, evaluated by the micronucleus test. Mutat Res, 12:417–425. PMID:4999599
181. Schmid W (1973). Chemical mutagen testing on in vivo somatic mammalian cells. Agents Actions, 3:77–85.doi:10.1007/BF01986538 PMID:4125456
182. Schmid W (1975). The micronucleus test. Mutat Res, 31:9–15. PMID:48190
183. Heddle JA, Cimino MC, Hayashi M et al. (1991). Micronuclei as an index of cytogenetic damage: past, present, and future. Environ Mol Mutagen, 18:277–291.doi:10.1002/em.28 50180414 PMID:1748091
184. Hayashi M, Morita T, Kodama Y et al. (1990). The micronucleus assay with mouse peripheral blood reticulocytes using acridine orange-coated slides. Mutat Res, 245:245–249.doi:10.1016/0165 -7992(90)90153-B PMID:1702516
185. MacGregor JT, Wehr CM, Gould DH (1980). Clastogen-induced micronuclei in peripheral blood erythrocytes: the basis of an improved micronucleus test. Environ Mutagen, 2:509 –514.doi:10.1002/em.2860020408 PMID:6796407

96
186. Morita T, Asano N, Awogi T et al.; Collaborative Study of the Micronucleus Group Test. Mammalian Mutagenicity Study Group (1997). Evaluation of the rodent micronucleus assay in the screening of IARC carcinogens (groups 1, 2A and 2B) the summary report of the 6th collaborative study by CSGMT/JEMS MMS. Mutat Res, 389:3–122. PMID:9062586
187. Fenech M, Holland N, Chang WP et al. (1999). The HUman MicroNucleus Project–An international collaborative study on the use of the micronucleus technique for measuring DNA damage in humans. Mutat Res, 428:271–283. PMID:10517999
188. Fenech M (2000). The in vitro micronucleus technique. Mutat Res, 455:81–95. PMID:11113469
189. Fenech M, Morley AA (1985). Measurement of micronuclei in lymphocytes. Mutat Res, 147:29–36. PMID:3974610
190. Bolognesi C, Abbondandolo A, Barale R et al. (1997). Age-related increase of baseline frequencies of sister chromatid exchanges, chromosome aberrations, and micronuclei in human lymphocytes. Cancer Epidemiol Biomarkers Prev, 6:249–256. PMID:9107430
191. Fenech M, Morley AA (1986). Cytokinesis-block micronucleus method in human lymphocytes: effect of in vivo ageing and low dose X-irradiation. Mutat Res, 161:193–198. PMID:3724773
192. Anwar WA, Salama SI, el Serafy MM et al. (1994). Chromosomal aberrations and micronucleus frequency in nurses occupationally exposed to cytotoxic drugs. Mutagenesis, 9:315–317.doi:10.1093/mutage/9.4.315 PMID:7968572
193. da Silva Augusto LG, Lieber SR, Ruiz MA, de Souza CA (1997). Micronucleus monitoring to assess human occupational exposure to organochlorides. Environ Mol Mutagen, 29:46–52.doi:10.1002/(SICI)1098-2280(1997)29:1<46::AID-EM6>3.0.CO;2-B PMID:9020306
194. Suruda A, Schulte PA, Boeniger M et al. (1993). Cytogenetic effects of formaldehyde exposure in students of mortuary science. Cancer Epidemiol Biomarkers Prev, 2:453–460. PMID:8220090
195. Cheng TJ, Christiani DC, Xu X et al. (1996). Increased micronucleus frequency in lymphocytes from smokers with lung cancer. Mutat Res, 349:43–50. PMID:8569791
196. Murgia E, Ballardin M, Bonassi S et al. (2008). Validation of micronuclei frequency in peripheral blood lymphocytes as early cancer risk biomarker in a nested case-control study. Mutat Res, 639:27–34. PMID:18155071
197. Holland N, Bolognesi C, Kirsch-Volders M et al. (2008). The micronucleus assay in human buccal cells as a tool for biomonitoring DNA damage: the HUMN project perspective on current status and knowledge gaps. Mutat Res, 659:93–108.doi:10.1016/j.mrrev.2008. 03.007 PMID:18514568
198. Stich HF, San RH, Rosin MP (1983). Adaptation of the DNA-repair and micronucleus tests to human cell suspensions and exfoliated cells. Ann N Y Acad Sci, 407:93–105.doi:10.1111/j.1749-6632. 1983.tb47816.x PMID:63 49490
199. Stich HF, Rosin MP (1983). Quantitating the synergistic effect of smoking and alcohol consumption with the micronucleus test on human buccal mucosa cells. Int J Cancer, 31:305 –308.doi:10.1002/ i jc.2910310309 PMID:6826255
200. Stich HF, Stich W, Parida BB (1982). Elevated frequency of micronucleated cells in the buccal mucosa of individuals at high risk for oral cancer: betel quid chewers. Cancer Lett, 17:125–134.doi:10.1016/0304-3835(82) 90024-6 PMID:6187434
201. Basu A, Mahata J, Roy AK et al. (2002). Enhanced frequency of micronuclei in individuals exposed to arsenic through drinking water in West Bengal, India. Mutat Res, 516:29–40. PMID:11943608
202. Vuyyuri SB, Ishaq M, Kuppala D et al. (2006). Evaluation of micronucleus frequencies and DNA damage in glass workers exposed to arsenic. Environ Mol Mutagen, 47:562–570.doi:10.1002/em.20229 PMID:16795086
203. Das RK, Dash BC (1992). Genotoxicity of ‘gudakhu’, a tobacco preparation. II. In habitual users. Food Chem Toxicol, 30:1045–1049.doi:10.1016/0278-6915(92)90115-2 PMID:1473798
204. Moore LE, Smith AH, Hopenhayn-Rich C et al. (1997). Decrease in bladder cell micronucleus prevalence after intervention to lower the concentration of arsenic in drinking water. Cancer Epidemiol Biomarkers Prev, 6:1051–1056. PMID:9419402
205. Moore LE, Smith AH, Hopenhayn-Rich C et al. (1997). Micronuclei in exfoliated bladder cells among individuals chronically exposed to arsenic in drinking water. Cancer Epidemiol Biomarkers Prev, 6:31–36. PMID:8993795
206. Desai SS, Ghaisas SD, Jakhi SD, Bhide SV (1996). Cytogenetic damage in exfoliated oral mucosal cells and circulating lymphocytes of patients suffering from precancerous oral lesions. Cancer Lett, 109:9–14.doi:10.1016/S0304-3835(96)04390-X PMID:9020897
207. Rajeswari N, Ahuja YR, Malini U et al. (2000). Risk assessment in first degree female relatives of breast cancer patients using the alkaline Comet assay. Carcinogenesis, 21:557–561.doi:10.1093/carcin/21.4.557 PMID:10753185
208. Ramirez A, Saldanha PH (2002). Micronucleus investigation of alcoholic patients with oral carcinomas. Genet Mol Res, 1:246–260. PMID:14963832
209. Saxonov S, Berg P, Brutlag DL (2006). A genome-wide analysis of CpG dinucleotides in the human genome distinguishes two distinct classes of promoters. Proc Natl Acad Sci USA, 103:1412–1417.doi:10.1073/pnas.0510310103 PMID:16432200
210. Issa JP, Baylin SB, Herman JG (1997). DNA methylation changes in hematologic malignancies: biologic and clinical implications. Leukemia, 11 Suppl 1;S7–S11. PMID:9130685
211. Belinsky SA, Nikula KJ, Palmisano WA et al. (1998). Aberrant methylation of p16(INK4a) is an early event in lung cancer and a potential biomarker for early diagnosis. Proc Natl Acad Sci USA, 95:11891–11896.doi:10.1073/pnas.95.20.11891 PMID:9751761
212. Hsieh CJ, Klump B, Holzmann K et al. (1998). Hypermethylation of the p16INK4a promoter in colectomy specimens of patients with long-standing and extensive ulcerative colitis. Cancer Res, 58:3942–3945. PMID:97 31506
213. Kanai Y, Ushijima S, Tsuda H et al. (1996). Aberrant DNA methylation on chromosome 16 is an early event in hepatocarcinogenesis. Jpn J Cancer Res, 87:1210–1217. PMID:9045955
214. Jones PA, Gonzalgo ML, Tsutsumi M, Bender CM (1998). DNA methylation in bladder cancer. Eur Urol, 33 Suppl 4;7–8.doi:10.1159/000052251 PMID:9615197
215. Hayashizaki Y, Hirotsune S, Okazaki Y et al. (1993). Restriction landmark genomic scanning method and its various applications. Electrophoresis, 14:251–258.doi:10.1002/elps. 1150140145 PMID:8388788
216. Estécio MR, Yan PS, Ibrahim AE et al. (2007). High-throughput methylation profiling by MCA coupled to CpG island microarray. Genome Res, 17:1529–1536.doi:10.1101/gr. 6417007 PMID:17785535
217. Toyota M, Issa JP (2002). Methylated CpG island amplification for methylation analysis and cloning differentially methylated sequences. Methods Mol Biol, 200:101–110. PMID:11951646
218. Vaissière T, Hung RJ, Zaridze D et al. (2009). Quantitative analysis of DNA methylation profiles in lung cancer identifies aberrant DNA methylation of specific genes and its association with gender and cancer risk factors. Cancer Res, 69:243–252.doi:10.1158/0008-5472.CAN-08-2489 PMID: 19118009
219. Esteller M, Tortola S, Toyota M et al. (2000). Hypermethylation-associated inactivation of p14(ARF) is independent of p16(INK4a) methylation and p53 mutational status. Cancer Res, 60:129–133. PMID:10646864
220. Lo YM, Wong IH, Zhang J et al. (1999). Quantitative analysis of aberrant p16 methylation using real-time quantitative methylation-specific polymerase chain reaction. Cancer Res, 59:3899–3903. PMID: 10463578
221. Ko E, Kim Y, Kim SJ et al. (2008). Promoter hypermethylation of the p16 gene is associated with poor prognosis in recurrent early-stage hepatocellular carcinoma. Cancer Epidemiol Biomarkers Prev, 17:2260–2267.doi:10.1158/1055-9965.EPI-08-0236 PMID:18723830

Unit 2 • Chapter 5. Assessment of genetic damage in healthy and diseased tissue 97
Un
it 2
Ch
ap
ter
5
222. Ayadi W, Karray-Hakim H, Khabir A et al. (2008). Aberrant methylation of p16, DLEC1, BLU and E-cadherin gene promoters in nasopharyngeal carcinoma biopsies from Tunisian patients. Anticancer Res, 28(4B):2161–2167. PMID:18751390
223. Blazej RG, Kumaresan P, Cronier SA, Mathies RA (2007). Inline injection microdevice for attomole-scale sanger DNA sequencing. Anal Chem, 79:4499–4506.doi:10.1021/ac070126f PMID:17497827
224. Blazej RG, Kumaresan P, Mathies RA (2006). Microfabricated bioprocessor for integrated nanoliter-scale Sanger DNA sequencing. Proc Natl Acad Sci USA, 103:7240 –7245.doi:10.1073/pnas.06024 76103 PMID:16648246
225. Emrich CA, Tian H, Medintz IL, Mathies RA (2002). Microfabricated 384-lane capillary array electrophoresis bioanalyzer for ultrahigh-throughput genetic analysis. Anal Chem, 74:5076–5083.doi:10.1021/ac 020236g PMID:12380833
226. Grover WH, Mathies RA (2005). An integrated microfluidic processor for single nucleotide polymorphism-based DNA computing. Lab Chip, 5:1033–1040.doi:10.1 039/b505840f PMID:16175257
227. Harrison DJ, Fluri K, Seiler K et al. (1993). Micromachining a miniaturized capillary electrophoresis-based chemical analysis system on a chip. Science, 261:895–897.doi:10.1126/science.261.5123.895 PMID:177 83736
228. Lagally ET, Emrich CA, Mathies RA (2001). Fully integrated PCR-capillary electrophoresis microsystem for DNA analysis. Lab Chip, 1:102–107.doi:10.1039/b109031n PMID:15100868
229. Lagally ET, Medintz I, Mathies RA (2001). Single-molecule DNA amplification and analysis in an integrated microfluidic device. Anal Chem, 73:565–570.doi:10.1021/ac001026b PMID:11217764
230. Lagally ET, Scherer JR, Blazej RG et al. (2004). Integrated portable genetic analysis microsystem for pathogen/infectious disease detection. Anal Chem, 76:3162–3170.doi: 10.1021/ac035310p PMID:15167797
231. Paegel BM, Emrich CA, Wedemayer GJ et al. (2002). High throughput DNA sequencing with a microfabricated 96-lane capillary array electrophoresis bioprocessor. Proc Natl Acad Sci USA, 99:574–579.doi:10.1073/pnas.012608699 PMID:11792836
232. Toriello NM, Liu CN, Mathies RA (2006). Multichannel reverse transcription-polymerase chain reaction microdevice for rapid gene expression and biomarker analysis. Anal Chem, 78:7997–8003.doi:10.1021/ac061058k PMID:17134132
233. Kumaresan P, Yang CJ, Cronier SA et al. (2008). High-throughput single copy DNA amplification and cell analysis in engineered nanoliter droplets. Anal Chem, 80:3522– 3529.do i :10.1021/ac80 0327d PMID:18410131
234. Shi Y, Simpson PC, Scherer JR et al. (1999). Radial capillary array electrophoresis microplate and scanner for high-performance nucleic acid analysis. Anal Chem, 71:5354–5361.doi:10.1021/ac990518p PMID:10596215
235. Skibola CF, Smith MT, Kane E et al. (1999). Polymorphisms in the methylenetetrahydrofolate reductase gene are associated with susceptibility to acute leukemia in adults. Proc Natl Acad Sci USA, 96:12810–12815.doi:10.1073/pnas.96.22. 12810 PMID:10536004
236. Zhang K, Martiny AC, Reppas NB et al. (2006). Sequencing genomes from single cells by polymerase cloning. Nat Biotechnol, 24:680–686.doi:10.1038/nbt1214 PMID:16732271
237. Margulies M, Egholm M, Altman WE et al. (2005). Genome sequencing in microfabricated high-density picolitre reactors. Nature, 437:376–380. PMID:16056220
238. Shendure J, Porreca GJ, Reppas NB et al. (2005). Accurate multiplex polony sequencing of an evolved bacterial genome. Science, 309:1728–1732.doi:10.1126/science.1117389 PMID:16081699
239. Ottesen EA, Hong JW, Quake SR, Leadbetter JR (2006). Microfluidic digital PCR enables multigene analysis of individual environmental bacteria. Science, 314:1464–1467.doi:10.1126/science.1131370 PMID:17138901
240. Hemminki K, Thilly WG (2004). Implications of results of molecular epidemiology on DNA adducts, their repair and mutations for mechanisms of human cancer. Lyon: IARC Scientific Publication; (157):217–235. PMID: 15055298
241. Coulet F, Blons H, Cabelguenne A et al. (2000). Detection of plasma tumor DNA in head and neck squamous cell carcinoma by microsatellite typing and p53 mutation analysis. Cancer Res, 60:707–711. PMID:10676657
242. Kopreski MS, Benko FA, Kwee C et al. (1997). Detection of mutant K-ras DNA in plasma or serum of patients with colorectal cancer. Br J Cancer, 76:1293–1299.doi:10. 1038/bjc.1997.551 PMID:9374374
243. Hibi K, Taguchi M, Nakayama H et al. (2001). Molecular detection of p16 promoter methylation in the serum of patients with esophageal squamous cell carcinoma. Clin Cancer Res, 7:3135–3138. PMID:11595706
244. Usadel H, Brabender J, Danenberg KD et al. (2002). Quantitative adenomatous polyposis coli promoter methylation analysis in tumor tissue, serum, and plasma DNA of patients with lung cancer. Cancer Res, 62:371–375. PMID:11809682
245. Fujiwara Y, Chi DD, Wang H et al. (1999). Plasma DNA microsatellites as tumor-specific markers and indicators of tumor progression in melanoma patients. Cancer Res, 59:1567–1571. PMID:10197630

98