
[Rita L. Atkinson, Richard C. Atkinson, Edward E. (Bookos.org)

Publ ic Interest Energy Research (P IER) Program FINAL PROJECT REPORT
ASSESSMENT OF FORT BIDWELL GEOTHERMAL WELL FB‐4
Prepared for: California Energy Commission Prepared by: Fort Bidwell Indian Community Council
JUNE 2012CEC ‐500 ‐2012 ‐061

Prepared by: Primary Author(s): John Vass Paul Atkinson, Ph.D. Fort Bidwell Indian Community Council Fort Bidwell, California 96112 Contract Number: GEO-07-004 Prepared for: California Energy Commission John Hingtgen, M.S. Project Manager Linda Spiegel Office Manager Energy Generation Research Office Laurie ten Hope Deputy Director RESEARCH AND DEVELOPMENT DIVISION Robert P. Oglesby Executive Director
DISCLAIMER This report was prepared as the result of work sponsored by the California Energy Commission. It does not necessarily represent the views of the Energy Commission, its employees or the State of California. The Energy Commission, the State of California, its employees, contractors and subcontractors make no warrant, express or implied, and assume no legal liability for the information in this report; nor does any party represent that the uses of this information will not infringe upon privately owned rights. This report has not been approved or disapproved by the California Energy Commission nor has the California Energy Commission passed upon the accuracy or adequacy of the information in this report.

Acknowledgments This project was funded by the California Energy Commission Public Interest Energy Research Program and carried out on behalf of the Fort Bidwell Indian Community Council. We are appreciative of the Commission’s support for the project. The authors would like to thank Joe LaFleur, Jerry Hamblin, and Ben Barker for their support and valuable input into the project. Clay Jones and Joseph Moore carried out a study of the FB‐4 well cuttings, and this provided valuable insights. This work is also gratefully acknowledged. The authors would also like to thank members of the Fort Bidwell Tribal Council and Tribal Administration for their support and warm reception during the project and visits to the community.
Paul Atkinson is solely responsible for the conclusions and recommendations contained in this report.
Please cite this report as follows:
Atkinson, P. and J. Vass. 2011. Assessment of Fort Bidwell Geothermal Well FB‐4. California Energy Commission, PIER Renewables Program. CEC-500-2012-061.
i

ii

Preface
The California Energy Commission’s Public Interest Energy Research (PIER) Program supports public interest energy research and development that will help improve the quality of life in California by bringing environmentally safe, affordable, and reliable energy services and products to the marketplace.
The PIER Program conducts public interest research, development, and demonstration (RD&D) projects to benefit California.
The PIER Program strives to conduct the most promising public interest energy research by partnering with RD&D entities, including individuals, businesses, utilities, and public or private research institutions.
PIER funding efforts are focused on the following RD&D program areas:
• Buildings End‐Use Energy Efficiency
• Energy Innovations Small Grants
• Energy‐Related Environmental Research
• Energy Systems Integration
• Industrial/Agricultural/Water End‐Use Energy Efficiency
• Renewable Energy Technologies
• Transportation
Assessment of Fort Bidwell Geothermal Well FB‐4 is the final report for Fort Bidwell Reservation Geothermal Well Test project, Grant Number GEO‐07‐004, conducted by the Fort Bidwell Indian Community Council. The information from this project contributes to PIER’s Renewable Energy Technologies Program.
For more information about the PIER Program, please visit the Energy Commission’s website at www.energy.ca.gov/research/ or contact the Energy Commission at 916‐327‐1551.
iii

iv

Abstract
The Surprise Valley in the very northeastern corner of California’s Modoc County has various hot springs that indicate the possible existence of geothermal systems that may have potential for either direct use or commercial power generation. The FB‐4 well was drilled in the Fort Bidwell Indian Reservation in 2007 as an exploration of the underlying resource that began in the 1980s. Lack of funding caused the well to be left untested and, with an open hole in the lower, potentially productive section. The present study was funded by the Geothermal Resources Development Account. Researchers returned to Well FB‐4 to take measurements to complete the planned assessment of the geothermal resource that the earlier drilling had penetrated. These measurements could not be made because the open hole was found to be obstructed above the likely production formation. However, the data obtained from FB‐4 have been analyzed, and the result was consistent with the originally hypothesized model of a lower‐temperature geothermal reservoir with an estimated minimum anticipated reservoir temperature of 143o C (289o F). The study provides recommendations and cost estimates for the activities needed to complete the originally planned assessment of the well and reservoir. It also provides documentation of all underlying data for the well, which is required for any further assessment of the well and resource. Keywords: Geothermal energy, exploration, drill cuttings analysis, well bridging, hydrothermal system model, conceptual models, Surprise Valley
v

vi

Table of Contents
Acknowledgments ............................................................................................................................. i
Preface ................................................................................................................................................ iii
Abstract ............................................................................................................................................... v
Executive Summary ........................................................................................................................... 1
Introduction ................................................................................................................................... 1
Purpose ........................................................................................................................................... 1
Objectives ....................................................................................................................................... 1
Conclusions and Recommendations .......................................................................................... 1
1.0 Introduction .......................................................................................................................... 3
2.0 Well FB‐4 Test and Other Data .......................................................................................... 4
2.1. Basic Well Information .................................................................................................. 4
2.2. Test Data Obtained ........................................................................................................ 4
2.3. Cuttings Analysis ........................................................................................................... 7
2.4. Temperature Implications ............................................................................................. 8
2.5. Wellhead Testing Equipment ....................................................................................... 9
2.6. Why Is the Well Bridged? ............................................................................................. 10
2.7. Modification of the Test Plan ........................................................................................ 12
3.0 Update of the Working Geologic Model .......................................................................... 13
3.1. Introduction .................................................................................................................... 13
3.2. Information Gained While Drilling ............................................................................. 13
3.3. Conceptual Models of the Hydrothermal System ..................................................... 14
3.3.1. Original Model .......................................................................................................... 14
3.3.2. Original Model With Simple Modification ........................................................... 16
3.3.3. Alternative Model With Upflow Fault Farther West ........................................... 17
3.3.4. Discussion of the Concepts ...................................................................................... 18
3.3.5. Resource Summary ................................................................................................... 18
4.0 Recommendation to Clean‐Out, Log, and Test the Well ............................................... 20
4.1. Sequence of Operations for Clean‐out and Rig Test ................................................. 20
4.2. Sequence of Operations for Rigless Flow Test ........................................................... 20
4.3. Cost Estimates ................................................................................................................. 21
5.0 Technology Transfer ........................................................................................................... 23
vii

6.0 Summary and Recommendations ..................................................................................... 24
7.0 References ............................................................................................................................. 25
APPENDIX A – Well Data – FB‐4, FB‐3, FB‐2, and FB‐1 .............................................................. 27
A‐1. Fort Bidwell Geothermal Wells Location Map ................................................................. 28
A‐2. Well FB‐4 Schematic and Description of Activity ............................................................ 28
A‐3. Well FB‐4 Cuttings Analysis ............................................................................................... 36
A‐4. Well FB‐3 Activity Reports and Well Schematic .............................................................. 44
A‐5. Well FB‐2 Schematic (Juncal 1984) ..................................................................................... 47
A‐6. Well FB‐1 Water Well Drillers Report (Atkinson 1981) .................................................. 48
Appendix B – Communications and Emergency Contingency Plans Document ..................... 49
Appendix C – Fort Bidwell Fault Mapping .................................................................................... 53
Appendix D – Well Clean‐Out Cost Estimate ................................................................................ 55
List of Figures
Figure 1 – Well FB‐4 Simplified Schematic (not to scale) ..................................................................... 5
Figure 2 – Results of September 3, 2009, Pressure and Temperature Gradient Survey in FB‐4 ..... 6
Figure 3 – FB‐4 Lithologic Column and Key Drilling Events .............................................................. 7
Figure 4 – FB‐4 Mud Return‐Temperature Kick .................................................................................... 9
Figure 5 – FB‐4 Lithologic Column and Key Drilling Events With Overlay of FB‐3 Open Hole . 11
Figure 6 – Schematic of Original Model With FB‐4 Obstruction Added ......................................... 15
Figure 7 – Schematic of Original Model With Simple Modification ................................................. 16
Figure 8 – Schematic of Alternative Model With Upflow Fault Farther West ................................ 17
Figure 9 – Lithologic Column Constructed for Well FB4 With Information From Thin Sections and Cuttings. Legend Showing Lithologies on the Right; Triangles Mark Depth at Which the Clay‐Sized Fraction Was Analyzed Using XRD Methods (see below). ............................. 37
Figure 10 – Chip of a Tuff From Well FB4 Containing Abundant Pumice Shards (Pmc) as well as Lithic Fragments of Rhyodacite (R‐D) and Andesite (And). A) Plane Polarized Light. B) Crossed Nicols. Field of View is 3.4 mm Across. ........................................................................ 38
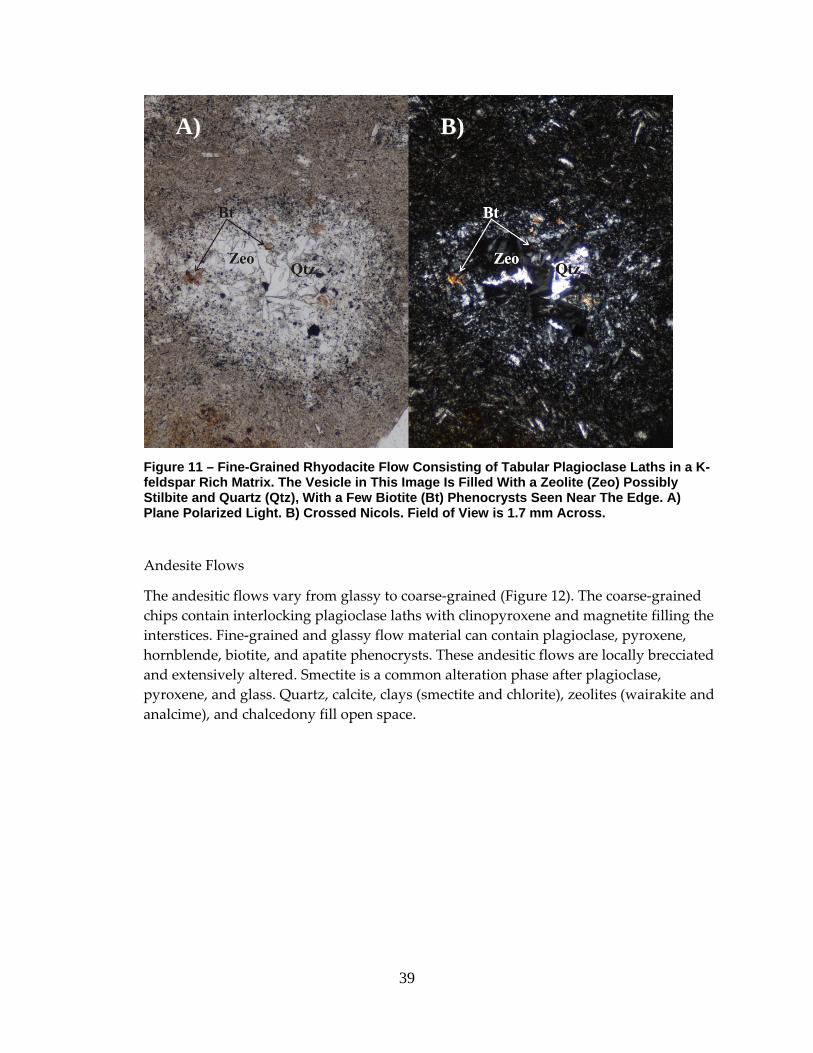
Figure 11 – Fine‐Grained Rhyodacite Flow Consisting of Tabular Plagioclase Laths in a K‐feldspar Rich Matrix. The Vesicle in This Image Is Filled With a Zeolite (Zeo) Possibly Stilbite and Quartz (Qtz), With a Few Biotite (Bt) Phenocrysts Seen Near The Edge. A) Plane Polarized Light. B) Crossed Nicols. Field of View is 1.7 mm Across. ............................ 39
viii

Figure 12 – Coarse‐Grained Andesite Composed of Interlocking Plagioclase (Pl) Laths, With Pyroxene (Px) and Magnetite (Mag) Filling Intersticies. Much of the Pyroxene Has Been Altered to Smectite (Sme). A) Plane Polarized Light. B) Crossed Nicols. Field of View is 3.4 mm Across. ....................................................................................................................................... 40
Figure 13 ‐ A Fragment of Wood in a Paleosol, Which is a Matrix Supported Rock Containing Fragments of Volcanic Glass (VG), Rhyodacite Flow (R‐D), Andesite Flow (And), and a Broken Plagioclase Grain. A) Plane Polarized Light. B) Crossed Nicols. Field of View is 3.4 mm Across. ....................................................................................................................................... 41
Figure 14 – Clay Minerals Identified by XRD Methods Plotted Versus Depth Below Kelly Bushing for Well FB4. ...................................................................................................................... 42
Figure 15 – XRD Plot of the Ethylene Glycol‐Solvated Clay Sized Fraction Versus Depth for Well FB4. The Point at Which the Scan Line Crosses the Left Edge of the Plot Is Its Approximate Depth Below Kelly Bushing in Feet. Red Dotted Line Shows the Location of the Primary Smectite Peak, Blue Illite, and Orange Kaolinite, and Short Solid Green is Only Drawn in the Area Where the Main Chlorite and Kaolinite Peaks Overlap. ............................................ 43
List of Tables
Table 1 – Escalation of Rig Clean‐out and Flow Test Costs ............................................................... 22
Table 2 – Escalation of Rig‐less Flow Test Costs .................................................................................. 22
ix

x

Executive Summary Introduction Based on the presence of local hot springs, it has been known for many years that a potential geothermal resource underlies Fort Bidwell and the Fort Bidwell Indian Reservation in northeast Modoc County, California. The most recent effort to explore this resource occurred in 2007 when the FB‐4 well was drilled. Due to lack of funds, the well was left untested and with an open hole in the potentially productive part of the reservoir.
Purpose Using Geothermal Resources Development Account funds, this project returned to the well and attempted to complete the testing and evaluation planned in 2007. Physical changes in the well bore since the drilling was completed precluded full well testing in this project. However, preliminary work as described below was completed so that interested parties would know the next steps to achieve a full resource assessment.
Objectives The broad objectives of the project were to:
• Make temperature and pressure measurements in the well.
• Flowtest, collect representative samples for chemical analysis, and run a pressure build‐up test.
• Analyze and integrate these results into an assessment of the resource, including potential for power generation or direct use.
Conclusions and Recommendations It was determined that the well has an obstruction that precluded carrying out the planned measurements and assessment. This project analyzed all data gathered for the well and tested the results against the proposed conceptual model of the hydrothermal system that was used to target the well. The project also resulted in full documentation of this data, which is required for any subsequent evaluation of investment in assessing the resource, and therefore, valuable for any further exploration.
All data obtained during drilling is consistent with the proposed model, and the previous estimate of a small geothermal system with a minimum temperature of about 143oC (289oF) remains valid.
It is recommended returning to the well with a drilling rig to clean out the obstruction, rig test the well, and then, if the test results are supportive, run a protective slotted liner into the hole. After this is complete, the authors recommend that the well achieve thermal equilibrium, then temperature and pressure surveys be run in it. Finally, complete the testing program as originally planned.
1

If the geothermal resource at Fort Bidwell is found to have potential for either commercial power generation or direct use, it may provide a variety of benefits to California. These include reduction of greenhouse gas emissions, reduction of energy imports, and the development of jobs and infrastructure.
2

1.0 Introduction The FB‐4 well was drilled on the Fort Bidwell Indian Reservation in September and October of 2007 using a combination of funds provided by the Fort Bidwell Indian Community, the California Energy Commission, and the US Department of Energy Geothermal Technology Program (LaFleur, 2007a, 2007b).
The well was left untested and with an open hole below the 9 5/8” casing shoe at 2785 ft depth due to lack of funding. The purpose of this project was to return to the well, assess its down‐hole temperature state, and then flowtest it in order to provide the basis for an assessment of the hydrothermal resource targeted.
The well was found to be obstructed. Since there were insufficient funds available to clean it out and continue with the flowtest evaluation no further field work was done. This report presents:
• an evaluation of the data available.
• an update of the conceptual model for the reservoir.
• recommended next steps & estimated costs.
• observations about the potential size of the resource.
• data for the resource previously available only in unpublished form.
The materials presented herein are required in order for potentially interested parties or organizations to be able to make an assessment of the tradeoff between benefits and costs of additional investment directed at evaluating the potential of the underlying geothermal resource.
3

2.0 Well FB-4 Test and Other Data
2.1. Basic Well Information Key well and resource data collected during this project is presented in Appendix A. This includes:
• A location topographic map of the four Fort Bidwell geothermal wells, FB‐1, ‐2, ‐3 & ‐4.
• Well FB‐4 schematic and master valve description.
• Well FB‐4 activity reports.
• Well FB‐4 Cuttings Analysis.
• Well FB‐3 activity report on September 3, 2009, temperature & spinner survey on May 18, 1987 and well schematic.
• Well FB‐2 Schematic.
• Well FB‐1 Schematic.
Additional information acquired during the drilling of the well is contained in the daily drilling reports and the geologic log, submitted as Attachments 1 and 3 by LaFleur (2007a, b).
2.2. Test Data Obtained During the course of this project, only the first step in Task 2.2 (Well Testing) could be physically accomplished ‐ run wireline pressure and temperature surveys. This occurred because the first survey attempt on September 3, 2009 encountered a bridge or obstruction at 3030 ft below ground level (GL), which is 3059 ft below the kelly bushing (KB).1 The well was investigated a second time on February 24, 2010 using wireline tools that allowed for the confirmation of a firm obstruction at a depth of 3036 ft GL or 3065 ft KB. The obstruction has not moved ‐ the six‐foot difference between this and the previous depths is due to different wireline operators. The more recent survey depth measurement is used in the remainder of this report.
This obstruction occurs only 280 ft below the casing shoe at 2785 ft KB, and 1605 ft above the well total depth (TD.) This is depicted schematically in Figure 1.
1 Kelly Bushing depth refers to the standard reference point from which depth measurements are made in a drilling operation. The kelly bushing is a specialized part of the drilling equipment that occurs on the drilling rig floor. Different drilling rigs will have kelly bushings at different elevations above ground level.
4

Well Name: Fort Bidwell #4
20" @ 140'
top of 9/5/8" liner hanger at 786'13 3/8" @975'
17-1/2 " open hole to 975'
12-1/4 " open hole to 2788'
9 5/8" @ 2785'
8-1/2 " open hole
TD @ 4670'
Obstruction @ 3065' during wireline surveys
(Sept 3 2009 and Feb 24 2010)
All depths are relative to the kelly bushing of the drill rig used, which
was 29 ft above ground level.
Figure 1 – Well FB‐4 Simplified Schematic (not to scale)
Pressure and temperature gradient surveys were run down to the obstruction on September 3, 2009. Figure 2 presents the results:
• The liquid level was encountered at 300 ft GL; and
• Measured temperatures have a “conductive” gradient down to about 2000 ft GL, below which it is approximately constant.
5

Figure 2 – Results of September 3, 2009, Pressure and Temperature Gradient Survey in FB-4
This figure also shows the small interval of the well which is potentially open to the reservoir in the open hole above the obstruction. Three observations can be made about the temperature and pressure data obtained:
• The temperatures of approximately 175o F below 2000 ft GL should not be taken to be representative of conditions encountered by the well in the hydrothermal system below the obstruction. They, can however, be taken as a stabilized measure of conditions above the obstruction.
• The pressure in the open‐hole section of the well above the obstruction can probably be taken as representative of the hydrothermal system encountered by the well both above and below the obstruction. This is because pressures in the system would be expected to equilibrate more rapidly than the development of the bridge, so would likely have been in equilibrium by the time the bridge formed.
6

• The pressure in FB‐4 just below the casing shoe is in approximate pressure equilibrium with the pressure in FB‐3 at the same datum level, indicating that they are likely to be connected to the same hydrothermal system. This observation is based on an inferred ground level elevation of 4745 ft ASL and slightly positive shut‐in pressure for FB‐3 (for elevation, see the topographic location map on the 1st page of Appendix A, and for wellhead pressure, see Lawrence, 1985, p. 3).
2.3. Cuttings Analysis Following the drilling of FB‐4 a complete set of cuttings from the well were sent to the Energy & Geoscience Institute at the University of Utah. Clay Jones and Joseph Moore from this institute have provided a report describing their petrographic and X‐ray diffraction analyses. This is provided beginning on page 8 of Appendix A.
Figure 3 presents the well’s lithologic column from this report, along with key drilling events and the location of the top of the obstruction. This figure shows that the top of the obstruction is at the top of a major rhyodacite flow. The tops of such flow units are commonly fractured or brecciated, which is consistent with this being the top of the collapsed hole.
FB‐4
Top of obstruction3065 ft KB3200 ft KB Max mud temperature3300 ft KB Major lost circulation
Began adding cold water.
Total lost circulationMassive make‐up water required.
3640 ft KB
Figure 3 – FB‐4 Lithologic Column and Key Drilling Events
7

Figure 3 also shows that the major drilling events indicative of fracturing or hot fluid entry occur below the top of the obstruction:
i. The maximum mud‐out temperature at 3200 ft KB
ii. A major lost circulation zone at 3300 ft KB, after which cold water was added to the mud system to make‐up for lost drilling fluids
iii. A total lost circulation zone at 3640 ft KB, with even more make‐up water needed to be added at this depth and regularly for the rest of the well
2.4. Temperature Implications The maximum mud‐out temperature “kick” at 3200 ft KB as seen on the computer real‐time display of drilling parameters (Pason chart) is presented in Figure 4, which is taken from the FB‐4 drilling final report (LaFleur, 2007a & b, pg. 5.) This increased temperature of the return drilling fluid was strongest in the interval of about 3,080 to 3,260 ft KB depth. The highest mud‐out temperature recorded was 152° F at the depth of 3,200 ft KB. At 3,300 ft depth, the well experienced significant mud loss, so 200 barrels of make‐up water and 60 bags of lost circulation material LCM) were added. The mud temperature began to build again but total lost circulation and massive mud loss occurred when the hole was at a depth of 3,640. After this depth mud losses required the regular addition of cool water to the mud system while making up lost mud volume.
Thus, the only significant hot water entry able to be seen during drilling was the temperature “kick” at 3200 ft KB. The lost circulation events at 3300 and 3640 ft KB may also be strong potential producers of hot water. However their thermal signature was masked by the addition of make‐up water. There may have been additional zones of potential flow below 3640 ft – if so, they were masked by the continued addition of cool make‐up water and lost circulation materials.
8

Figure 4 – FB‐4 Mud Return‐Temperature Kick
The petrographic and x‐ray diffraction results provided by Jones and Moore provide some important insight regarding temperature of the hydrothermal system encountered in the well. No evidence for massive rock alteration or secondary mineralization was found, as would be the case for large high‐temperature hydrothermal systems. Instead, they concluded that, “The persistence of smectite throughout the rock sequence suggests that temperatures during hydrothermal alteration have not exceeded approximately 180oC (356oF). At higher temperatures, interlayered illite‐smectite would be anticipated. No interlayered clays were found.”
2.5. Wellhead Testing Equipment Following the drilling of FB‐4 in 2007 the wellhead was left with a 12” master valve on top of the casing head. No additional equipment was installed due to lack of funds. This left the top
9

of the master valve open to the atmosphere and unprotected, which is not recommended. Additionally, whenever the wireline survey operator came to the well special arrangements had to be made, as they would not normally carry the equipment to attach to a 12” flange.
During the course of this project a 12” top flange with a 3” ball valve and plug were installed on top of the master valve (see the March 12, 2010 well activity report on page 3 of Appendix A.) The top of the master valve is now protected, and well surveying and other evaluation work can be carried out without having to make special arrangements for attaching equipment.
2.6. Why Is the Well Bridged? The cause of bridging is unexplained. However, a reasonable hypothesis is that the rhyodacite flow body which was encountered just above 3100 ft KB is brecciated, and caved in, causing the obstruction.
The occurrence of this obstruction and the need to return to the well a second time with a rig is likely a direct consequence of the funding limitations that applied when the well was drilled. In the normal course of drilling and testing a well, a short period of testing would be done with the drilling rig still over the well. If the well was assessed to be sufficiently productive, or worth protecting from an open‐hole cave‐in, a protective slotted liner would be run to TD. Even if no protective liner were run, the well would be left filled with host aquifer water.
It is possible that the well would have bridged during the originally planned rig test. If this had occurred, the rig would have been available to clean it out and then stabilize the hole. It is also possible that the obstruction resulted from interaction between the fresh water and formations exposed in the open hole. In either case, had there been sufficient funds to test and complete the well as originally planned, the well would most likely not have been left with an obstruction.
This sequence of operations was contained in the Work Statement for the Energy Commission project to drill FB‐4 (Barker, 2005b.) This sequence of operations could not be completed because the costs of the total planned program would have exceeded the available funding. Instead, the drilling was stopped at a TD of 4670 ft KB and the drilling mud in the well was displaced with fresh surface water before laying down the drill pipe. This was done with the idea that it was better to leave fresh water in the well than potentially damaging drilling mud (Hamblin, 2010).
A review of the well history indicates no evidence of unstable hole, so one would not have anticipated that the well would necessarily be subject to unstable hole or the occurrence of obstructions.
Well FB‐3 has had open hole below 286 ft GL since it was drilled in 1985 (see schematic on page 16 of Appendix A). The well was flowed for a short period in September 2009 and showed no obvious reduction in rate from the testing done in October 2004 (see September 3, 2009 Well Activity Report, page 15 of Appendix A). This would suggest that no obstructions to flow have developed in it, and thus that the formations encountered by FB‐4 would also not be expected to experience obstructions. However, this explanation is less compelling when FB‐3 is
10

juxtaposed against the FB‐4 state and formations, as is done in Figure 5. This figure also shows the FB‐3 fluid entry interval of 2150 to 2400 ft GL identified during a flowing spinner survey in the well on May 18, 1987 (see Appendix A, page 16).
Top of obstructionMax mud temperature
3065 ft KB3200 ft KB
FB‐3(openhole)
FB‐4
3300 ft KB Major lost circulationBegan adding cold water.
Total lost circulationMassive make‐up water required.
3640 ft KB
Figure 5 – FB-4 Lithologic Column and Key Drilling Events With Overlay of FB-3 Open Hole
The distance between the two wells is about 0.5 miles, so it is reasonable to hypothesize that they encountered similar formations and at similar depths. If correct, then the experience with FB‐3 is less germane to that with FB‐4 because:
• The failed portion in FB‐4 is below the productive part of FB‐3.
• The productive part of FB‐3 has been cased‐off and protected in FB‐4.
11

2.7. Modification of the Test Plan Only the first step of the test plan in the project Work Statement could be physically accomplished ‐ run wireline pressure and temperature surveys. Appendix B contains the Communications and Emergency Contingency Plans that were in place during the wireline operations.
All of the remaining steps were precluded because of the obstruction encountered. An unsuccessful attempt was made to locate a contractor who could clean‐out and test the well within the project budget.
This report presents all of the data acquired during the project, along with observations and interpretation. Additionally, new interpretation and observations relating to data obtained during the drilling of the well are included, as funding limitations prevented a full reporting and evaluation of these data at that time.
The project status is that the obstruction in the well has prevented the development of a reliable estimate of the well and resource’s commercial potential.
12

3.0 Update of the Working Geologic Model
3.1. Introduction During the drilling of FB‐4 evidence of hot water inflow and good permeability was recorded. Reliable measurement of these parameters could not be accomplished during drilling and was necessarily postponed awaiting additional funding. The delay in returning to the well has allowed the hole to stand open without a protective liner and some caving‐in has occurred, creating an obstruction in the well at 3,059 ft KB. This has prevented an assessment of the well’s potential. Information obtained during drilling and from the temperature profile recorded in September 2009 allows for some conclusions to be made and provide a basis for next step recommendations.
Most significantly (so far) is that an impressive zone of hydrothermal inflow and high permeability, as evidenced by drill mud temperatures and losses, was encountered in a zone roughly between 3,000 and 3,600 ft depth.
The information that was gained during the drilling of FB‐4 and the well temperature profile data recorded in the upper 65% of the well above the blockage, support the original working model (LaFleur, 2005). Although alternative conceptual models for the configuration of the Fort Bidwell hydrothermal system remain potentially valid, the original concept put forth in the grant applications was basically upheld by the drilling and data acquired to‐date. Data additions to the original model, a modification of the original model, and a modestly different alternative model are discussed below.
Until the blockage is cleared and the hole is logged, these models remain speculative. Comprehensive reevaluation of the working model is not possible without the critical equilibrated temperature information from the bottom part of the hole, as well as flowtest results.
3.2. Information Gained While Drilling Tecton Geologic provided on‐site mud logging services during the drilling of FB‐4. The data collected by Tecton was reported as a geologic log (Attachment 3 of LaFleur, 2007a & b), and included:
• lithologic descriptions of the drill cuttings.
• noted secondary minerals.
• in‐ & out‐ drill mud temperatures.
• notes on mud loss.
• drilling parameters such as weight on bit & penetration rates.
The data and information provided in the daily drilling reports (Attachment 1 of LaFleur, 2007a & b) and on the geologic log allow some conclusions to be drawn. One such conclusion is that we will not know what we really have in the well until it can be cleared, properly logged and
13

flow‐tested. Another conclusion is that at least one significant hot water inflow was encountered at about 3,200 ft depth that is definitely worthy of future evaluation. Due to mud losses and the recurring addition of cold make‐up water below that depth, it was not possible to discern if deeper hydrothermal entries were encountered.
The conclusions from petrographic & x‐ray diffraction, and the temperature measurements obtained to‐date in FB‐4 are consistent with the lower‐temperature geothermal reservoir forecasts included in the pre‐drill project description (LaFleur, 2005). The figure of 143o C (289o F) was used in previous reports as the best estimate of minimum anticipated reservoir temperature. That figure was selected as most appropriate from the various geothermometry calculations performed on analyses of water from the FB‐3 hot artesian well (LaFleur, 2005, page 20). Based on the FB‐3 well geothermometry and the absence of significant rock alteration or hydrothermal mineral deposition at the surface, the current best estimate is that the Fort Bidwell resource appears to be relatively small and low temperature by geothermal standards. However, the current best guess of 289oF for the reservoir temperature is high enough to potentially be able to support geothermal energy production. For example, in 2009 the U.S. Department of Energy solicited proposal to demonstrate the technical and economic feasibility of geothermal energy production using off‐the‐shelf technology from low temperature resources in the range 150 to 300oC (USDOE, 2009).
3.3. Conceptual Models of the Hydrothermal System Although complete results of FB‐4 are still to be determined, it can be concluded that the drilling FB‐4 to the west of FB‐3 was an appropriate choice. The hot water entries recognized in FB‐4 indicate that the 210o F outflow zone seen at 2,330 ft depth in FB‐3 is coming from higher up in the Warner Range block west of Fort Bidwell. The following presents three simplistic model cross sections consistent with the data available:
• The original Fort Bidwell geothermal geohydrological model (LaFleur, 2005).
• A modification of the original model.
• An alternative model reflecting a different possible upflow fault than the one targeted.
3.3.1. Original Model
Figure 6 presents the original model proposed (Figure 15 of LaFleur, 2005) with the addition of the obstruction location at 3036 ft GL (1982 ft ASL).
14

Top of FB‐4Obstruction,3036 ft GL
Figure 6 – Schematic of Original Model With FB-4 Obstruction Added
This model showed a possible range of 70º‐80º dip on the target fault (Figure 8 of LaFleur, 2005). This dip and position was estimated from field observations and based on the considerations discussed in Appendix C. There are three ways in which this model might match the FB‐4 data obtained so far.
1. It is possible that FB‐4 did encounter the target fault at a drill depth of about 3,300 ft where major mud loss occurred coincident with a significant rise in mud‐out temperature. If this is the case, it may indicate that the target fault may dip slightly less than 70°. A 66° dipping fault plane was added to the original model to illustrate that small difference.
2. A huge mud loss occurred when the bottom of the hole was at 3,640 ft KB. This apparent loss zone could be the target fault, giving it almost exactly the estimated 70° dip, or it could be that it was just coincident recurring mud loss actually taking place at the 3,300 ft loss zone.
3. Also reflected in the original model is the real possibility that the FB‐4 Well did not penetrate deep enough to reach the target fault. Note on the cross section that if the fault is dipping at 80° (or greater), the real upflow zone may occur below the present bottom hole depth. Temperature gradient measurements from the lower portion of the
15

hole (below the bridge) will be required to evaluate this possibility. Without this data, the possibility of deeper upflow faulting cannot be removed from the original model with confidence.
While this model is still considered the most likely configuration, two additional possible models are described below.
3.3.2. Original Model With Simple Modification Figure 7 presents a modified version of the original geohydrology model which illustrates how the hot water entries observed in all four of the Fort Bidwell wells may relate.
Figure 7 – Schematic of Original Model With Simple Modification
This simplified version is compatible with the data collected to date in the FB‐4 Well. It suggests that the primary upflow fault, dipping at 70°, was encountered as was originally targeted. Also implied is that the upflow is of moderate temperature as indicated by the estimates from mud‐out temperature, the absence of high‐temperature secondary mineralization, and the geothermometry from the FB‐3 water samples.
16

3.3.3. Alternative Model With Upflow Fault Farther West It is entirely possible that the FB‐4 Well did not hit the upflow fault, but rather it encountered outflow from an upflow fault farther uphill to the west. This is depicted in Figure 8.
Figure 8 – Schematic of Alternative Model With Upflow Fault Farther West
As shown in Figure C‐1, large sub‐parallel faulting occurs west of the FB‐4 targeted fault. If the upflow is actually occurring on one of these faults, outflow would be eastward toward FB‐4 and Fort Bidwell. Outflow would take place within a fracture permeability aquifer, as is often afforded by hard, brittle lava flows.
According to the FB‐4 Lithologic Column and Key Drilling Events (Figure 3), the mud temperature kick and mud loss zone are nicely coincident with the top of a thick rhyodacite lava flow described as being ʺ... glassy to fine‐grained and may be flow‐banded, vesicular, auto‐brecciated and/or devitrifiedʺ (Appendix A, Rhyodacite Flows description, pg 10). Auto‐brecciation typically occurs at the top and base of a lava flow. This alternative model is
17

essentially the condition that was encountered in the FB‐ 3 well which penetrated an outflow zone at 2,330 ft depth, about 600 feet above the final bottom‐hole depth. It was the recognition of this outflow condition in FB‐3 that prompted the siting of FB‐4 to the west upstream of the regional hydrology.
3.3.4. Discussion of the Concepts The three basic possibilities are:
1. FB‐4 hit the upflow fault dipping at about 70° and the resource is of modest temperature.
2. FB‐4 did not reach the upflow fault, which may be dipping at 80° or greater, and higher temperature resource can be found within the fault at greater depth beneath the present bottom of the hole.
3. The real upflow fault is at some horizontal distance for the FB‐4 Well. Reasonably, it may be coming from the faulting observed to the west; however, it could also be coming from the faulting to the north.
Each of these possibilities is reasonable from the information in‐hand. The permeability and hot water inflow encountered in the 3,000 ft to 3,600 ft depth range could be associated with either the faulting as projected, or a brecciated lava flow. The temperature logging of the hole after the bridge is cleared and well thermally stabilized may help determine which it is.
Similarly, the location of the bridge in the hole could be associated with either of these possibilities. It is common for a hole to bridge off where it passes through a fault zone. Within the fault zone, the rock is fragmented and often partially altered to clay. It tends to slough into the hole. However, it is also possible that a piece of the fractured lava flow fell out of the side of the hole and created the bridge.
One way to evaluate possibility 2 above would be to wait for and then measure a good stabilized temperature profile in the lower portion of the well after the bridge is cleared. There is a genuine possibility that the upflow fault is actually dipping steeply beneath the bottom of FB‐4. It is not uncommon to measure dips of 85° on some of these Basin and Range faults. The indicators of lower temperature, e.g. the secondary clays and the geothermometry from FB‐3 may not be relevant to conditions in a deeper upflow zone. It is unknown whether the relatively shallow inflow in FB‐3 (2,330 ft depth) has experienced any cold water mixing that would affect the accuracy of the geothermometry calculations of anticipated deep reservoir temperature.
This approach of waiting to obtain stabilized well measurements is not being recommended, as it is far more cost‐effective to simply drill additional hole as part of the clean‐out operation (see section 4 below).
3.3.5. Resource Summary The information gained from the FB‐4 Well indicates the presence of a hydrothermal resource potentially capable of electrical power generation. Hence, the cost of bringing the equipment
18

necessary to clear the obstruction, deepen the well, and run a protective liner is justified. The recommended well operations are discussed in the following section.
19

4.0 Recommendation to Clean-Out, Log, and Test the Well This section provides a recommendation to clean‐out, log, and test FB‐4. The testing would have two parts:
• A short “rig test” before running the liner, in order to confirm that the well’s flow potential is satisfactory.
• A longer and better‐monitored test after the rig has move off the location.
It additionally provides a discussion of the recommended approach, plus cost estimates for the rig work (AFE quality) and the subsequent rig‐less flow testing (order‐of‐magnitude).
4.1. Sequence of Operations for Clean-out and Rig Test The following simplified sequence of operations of operations is recommended as the minimum cost‐effective next action for Well FB4.
1) Mobilize and set‐up on existing location.
2) Clean out bridge at 3036 ft md GL.
3) Drill 8‐1/2” hole to total depth of 5500 ft.
4) Log, test, and evaluate well. (Run wireline temperature & pressure tools. Flow initiation by airlift with 2‐7/8ʺ tubing. Flow well for sufficient time to obtain stabilized thermal & chemical conditions, but limited to two days due to cost considerations. Discharge effluent to sump.)
5) Install 7” slotted liner if necessary. Hang liner from 100’ up inside of 9‐5/8” liner. Disengage from liner hanger and pull out of hole.
6) Lay down drill pipe and all drilling tools.
7) Nipple down and clean location.
8) Release rig.
The addition of a sonic log to the logging activity in step 4) should also be considered as a way to potentially identify the upflow fault in the well – should it have been encountered. This log may also be able to evaluate fracture orientations in the production zone(s). This additional logging activity has not been explicitly included in this recommendation because there was insufficient time to develop the technical justification and cost estimate to do it. However, it is recommended to investigate this further.
4.2. Sequence of Operations for Rigless Flow Test This sequence of operations is recommended if the rig test is successful and a protective slotted liner has been run. It is basically the same activities contained in the Energy Commission Grant Work Statement for the drilling of FB‐4 (Barker 2005b, Task 3.3.1, page 18) as well as for the Grant Work Statement for this project (Barker 2007.) One difference is that the running of a spinner tool under flowing conditions has been added.
20

• Allow well to reach thermal equilibrium.
• Run wireline pressure and temperature surveys.
• Carry out design calculations to determine meter sizing, fluid sampling requirements, and instrumentation needs. Determine the need for pumping or other artificial lifting equipment to conduct the full‐scale flow test. Complete the detail design and budget for test equipment and procedures.
• Mobilize tanks, separator, air compressor, pumps, and related equipment to well site.
• Rig up flow lines so the well can be surveyed with wireline tools during flow periods and so well can be killed with cold water below the master valve. Leave pressure tool or capillary tubing below expected production zone for use during flow test, at the discretion of the geothermal engineer.
• Conduct a 48‐hour flow test followed by 10‐day pressure buildup test. Data to be collected include fluid samples and all wellhead and flow line pressure and temperature measurements needed to accurately assess the well’s commercial potential. It is anticipated that pressures and temperatures will be measured at least hourly and fluid samples taken every six hours. Extend the flow period beyond 48 hr at the discretion of the geothermal engineer.
• Run pressure, temperature and spinner surveys under flowing conditions before closing the well if well conditions permit. Resurvey at the conclusion of the pressure buildup period.
• Rig down and demobilize equipment.
4.3. Cost Estimates An AFE quality cost estimate for the clean‐out and rig test has been provided by Subsurface Excellence Inc. based on the assumption that well operations would comply with the well safety criteria of the California Division of Oil, Gas and Geothermal Resources (DOGGR). Specifically, this means that double‐ram and annular blow‐out prevention equipment would be installed on top of the well master valve, requiring a 12 ft sub‐base.
The sequence of operations 1‐8 described above is estimated to cost $ 562,775 using prices in effect in April 2010. Details are provided in Appendix D. The costs should be inflated for future work:
• At 12% for work to be done at the end of 2010.
• An additional 12% (not compounded) for work to be done at the end of 2011.
This results in a total of 24% increase if the work is to be done at the end of 2011, as depicted in Table 1.
21

Table 1 – Escalation of Rig Clean-Out and Flow Test Costs
Work Done in Estimated Cost of
Steps 1‐8
April 2010 $562,775
December 2010 $630,308
December 2011 $697,841
Cost estimates were solicited from other drillers. One quote was received, which was both more costly than that provided by Subsurface Excellence Inc, and did not meet DOGGR well safety criteria.
A scoping cost estimate to flow test the well after the rig has been moved off location has also been developed. This is based on the originally estimated cost of $170,200 for this activity (Barker 2005a,) escalated at 12% per year, and presented in Table 2. The cost estimates correspond to year‐end.
Table 2 – Escalation of Rigless Flow Test Costs Year 2005 2006 2007 2008 2009 2010 2011 Cost No
spinner survey
$170,200 $190,624 $213,499 $239,119 $267,813 $299,951 $335,945
With spinner survey
$319,951 $355,945
The basis for the original 2005 cost estimate is not available. It is recommended to re‐develop current costs by obtaining quotes from qualified service providers.
The following text from Barker (2005a) is also pertinent to the cost estimate presented in here.
… Note that well testing entails bringing equipment back onto the site after the rig is removed and the well has reached thermal equilibrium. The well testing budget actually serves more than one purpose. If the well is unsuccessful, the well testing portion of the budget will instead, be used to convert the well to a direct use well. If perforation of the casing is necessary, the monies included for well testing should cover it. In the remote possibility of the well being entirely useless, this budget would cover plug and abandonment of the well.
22

5.0 Technology Transfer The results of this project were presented orally at the 2010 Annual Meeting of the Geothermal Resources Council, held in Sacramento, California, October 24‐27. They have also been published in the conference proceedings (LaFleur et al, 2010).
23

6.0 Summary and Recommendations The existence of a bridge shortly below the casing shoe in FB‐4 has prevented continued testing and evaluation of the well and resource. This report has:
• Collected together and summarized what is known about the resource and well.
• Concluded that there is no new information invalidating the original hydrothermal concept and resource estimate made before it was drilled.
• Provided a recommendation for sequence of operations and associated cost estimate to proceed with well clean‐out and testing.
24

7.0 References Atkinson, D.J. (1981), “Geology, Geophysics, and Hydrogeology of the Fort Bidwell Area, and
the Drilling of Geothermal Well FB‐1,” prepared for the Fort Bidwell Indian Tribal Council under California Energy Commission Contract 500‐79‐069, Appendix II, December.
Barker (2005a), “Fort Bidwell Indian Community, Geothermal Exploration Drilling, Assessment and Demonstration in Indian Country, Volume 2: Technical And Cost Information” CEC GRDA Resource Development, Final Application, Section 8, pg. 33.
Barker (2005b), “Work Statement ‐ Fort Bidwell Indian Community ‐ Exploration Drilling, Assessment and Demonstration in Indian Country,” grant number GEO‐05‐002, Task 3.1, pg. 16.
Barker (2007), “Work Statement ‐ Fort Bidwell Indian Community ‐ Fort Bidwell Reservation Geothermal Well Test,” grant number GEO‐07‐004, Task 2.2, pg. 9.
Hamblin, J. (2010), personal communication, March 10.
Juncal, R.W. (1984), “Technical Summary, Drilling and Testing of Exploratory Well FB‐2,” Fort Bidwell Indian Community Council report (049‐9014), Figure 2.1, December.
LaFleur, J. (2005), “Phase I Technical Report, DE‐FG36‐04GO14343 (GRED III), Geothermal Resource Exploration and Definition of the Fort Bidwell Indian Reservation Hydrothermal System,” U.S. Department of Energy Geothermal Technology Program, pp. iv‐v and 28‐30, August 9.
LaFleur, J. (2007a), “Final Report ‐ Technical Report and Lessons Learned, CEC GRDA GEO‐05‐002, Geothermal Exploration Drilling, Assessment and Demonstration in Indian Country” unpublished report, November.
LaFleur, J. (2007b), “Phase II ‐ Drilling, Technical Report And Issues Addressed/Lessons Learned, DE‐FG36‐04GO14343 (DOE GRED III), Geothermal Resource Exploration and Definition of the Fort Bidwell Indian Reservation Hydrothermal Systemʺ,” unpublished report, November.
LaFleur, J., Carter, A., Moore, K., Barker, B., Atkinson, P., Jones, C., Moore, J. and Pollard B. (2010), ʺUpdate on Geothermal Exploration at Fort Bidwell, Surprise Valley Californiaʺ, GRC Transactions, Vol. 34, pp. 581‐583.
Lawrence, D.A. (1985), “Drilling Report, Fort Bidwell Geothermal Test Hole 3, Located at Fort Bidwell Indian Reservation, Modoc County, California,” Prepared for Fort Bidwell Indian Community Council, Figure 2, September 9.
25

USDOE (2009), “Financial Assistance Funding Opportunity Announcement ‐ Recovery Act: Geothermal Technologies Program,” Funding Opportunity Announcement Number: DE‐FOA‐0000109, Topic Area 2 discussion on pages 2 & 9, May 27.
26

APPENDIX A – Well Data – FB-4, FB-3, FB-2, and FB-1
This Appendix contains the test and reservoir data acquired during the project.
• A location topographic map for Fort Bidwell, showing the location of the wells FB‐1 through FB‐4.
• Well FB‐4 information not presented in the final report submitted to the California Energy Commission in November 2007 following completion of the well. This includes the current well schematic, master valve information, plus narrative descriptions of activity at the well on September 3, 2009, February 24 & March 12, 2010. In conjunction with the well drilling information provided in the November 2007 report (Daily Drilling Reports and Mud Log) this information provides most of the information that would normally be found in a well file.
• Well FB‐4 Cuttings Analysis “Petrographic and X‐ray diffraction analyses of cuttings from geothermal well Fort Bidwell‐4” carried out by Clay Jones and Joseph Moore of the Energy & Geoscience Institute at the University of Utah.
• Well FB‐3 well schematic, temperature & spinner survey on May 18, 1987 and report of activity on September 3, 2009.
• Well FB‐2 well schematic.
• Well FB‐1 Water Well Drillers Report.
27

A-1. Fort Bidwell Geothermal Wells Location Map
A portion ofFORT BIDWELL QUADRANGLE
CALIFORNIA-MODOC CO.7.5-MINUTE SERIES (TOPOGRAPHIC)
1 mile
1993
FB-1
FB-2FB-3
FB-4
A-2. Well FB-4 Schematic and Description of Activity
28

Master Valve Description (taken from plate attached to the valve)
WKM 9/07; Size 12 3/8 WKM; OEM SN 121466‐3; Class 400
TNG SN 42‐10; RPR/RMFR RPR; Trim GEO
TNG Energy Services; Repair, Remanufacture, Bakersfield, CA; ph 661‐323‐7031
March 12, 2010 Well Activity Report
Pacific Process Systems, Inc. (P.P.S.) installed the following top flange and other equipment on top of the well master valve.
Description 12” 400 series flange w/ 3” threads 3” X 8“ nipple 3” Ball Valve 3” plug Bolts and nuts 16 API Ring
February 24, 2010 Well Activity Report TAG FILL REPORT ON FT. BIDWELL # 4 2/24/2010
[…]
This tool string consisted of 8’ 1 ¾” sinker bar, 5’ spang jars w/ a 20” stroke. Total weight of tool string was 125#.
[…]
Arrived on location @ 11:00 a.m.
Held tailgate safety meeting. Checked location for safety hazards.
MIRU.RIH/w 1 ¼” spear, tagged bttm. @ 3036’.Jarred down and tried to break through but to no avail.POOH.
RIH w/2 ½” Barrel Grab and sat down on T.O.L. @ 764’.Tried, but could not get past.POOH.
RIH w/1 ½” sample bailer to fill @ 3036, and retrieved sample.POOH
Gave sample to Paul Atkinson and RDMO.
Ken Pitts
Samples of rock particles were examined by Joe LaFleur, who submitted the following report on March 1, 2010.
I have washed, dried, and examined the rock fragments collected from the top of the bridge at 3036' in the FB-4 well. The fragments contain a collection of different
29

volcanic rock types suggesting that the bridge is composed of fill or slough and/or drill cuttings, rather that a singular rock that fell and jammed. By far the dominant rock type is a soft but well-indurated, clay-rich mafic lithic tuff that quickly develops desiccation cracks upon drying.
The bridge could have resulted from sloughing of the sides of hole in the uncased interval between 2765' and the top of the bridge at 3036'. The bridge could also consist of cuttings that were not cleared from the hole at the end of drilling, perhaps having been pushed back into a crack or cavity in the formation during the drilling process.
30

September 3, 2009 Survey Results
31

RIH RIH RIH DEPTH
(FT) TEMP
(F) PRESS (PSIA)
DEPTH (FT)
TEMP (F)
PRESS (PSIA)
DEPTH (FT)
TEMP (F)
PRESS (PSIA)
0 91.11 14.28 1010 82.94 337.08 2020 176.71 762.38
10 91.10 14.28 1020 83.60 341.58 2030 175.93 766.59
20 91.09 14.28 1030 84.28 346.10 2040 175.19 770.91
30 91.07 14.27 1040 84.97 350.43 2050 174.49 775.17
40 91.02 14.27 1050 85.68 354.33 2060 173.85 779.45
50 90.94 14.28 1060 86.40 358.26 2070 173.27 783.65
60 90.84 14.28 1070 87.13 362.15 2080 172.75 787.89
70 90.72 14.28 1080 87.87 365.97 2090 172.26 792.16
80 90.59 14.28 1090 88.64 369.77 2100 171.83 796.48
90 90.45 14.28 1100 89.41 373.61 2110 171.43 800.77
100 90.29 14.28 1110 90.20 377.52 2120 171.08 805.04
110 90.13 14.28 1120 91.01 381.49 2130 170.79 809.34
120 89.97 14.28 1130 91.83 385.43 2140 170.55 813.63
130 89.81 14.28 1140 92.68 389.38 2150 170.37 817.91
140 89.65 14.28 1150 93.55 393.31 2160 170.26 822.20
150 89.49 14.28 1160 94.45 397.31 2170 170.21 826.48
160 89.33 14.28 1170 95.36 401.19 2180 170.24 830.81
170 89.17 14.28 1180 96.28 405.17 2190 170.33 835.08
180 89.02 14.28 1190 97.21 409.10 2200 170.49 839.37
190 88.86 14.28 1200 98.15 412.92 2210 170.70 843.64
200 88.71 14.28 1210 99.10 416.74 2220 170.97 847.89
210 88.56 14.28 1220 100.06 420.66 2230 171.28 852.17
220 88.41 14.28 1230 101.03 424.57 2240 171.63 856.46
230 88.27 14.28 1240 101.99 428.55 2250 172.01 860.73
240 88.12 14.28 1250 102.94 432.52 2260 172.43 865.04
250 87.98 14.28 1260 103.89 436.48 2270 172.86 869.31
260 87.84 14.29 1270 104.84 440.44 2280 173.30 873.59
32

270 87.57 14.30 1280 105.79 444.36 2290 173.75 877.86
280 86.48 14.30 1290 106.75 448.28 2300 174.19 882.12
290 83.86 14.47 1300 107.70 452.24 2310 174.62 886.37
300 80.16 15.47 1310 108.65 456.41 2320 175.01 890.61
310 76.10 20.20 1320 109.60 460.57 2330 175.37 894.87
320 72.22 26.78 1330 110.58 464.74 2340 175.69 899.11
330 68.57 32.13 1340 111.58 468.86 2350 175.94 903.32
340 65.35 36.46 1350 112.59 472.94 2360 176.13 907.50
350 62.74 40.64 1360 113.64 477.10 2370 176.24 911.74
360 60.74 44.71 1370 114.69 481.27 2380 176.28 915.97
370 59.25 48.79 1380 115.74 485.44 2390 176.26 920.17
380 58.17 53.01 1390 116.81 489.75 2400 176.20 924.31
390 57.41 57.21 1400 117.87 494.03 2410 176.12 928.46
400 56.88 61.38 1410 118.94 498.39 2420 176.02 932.65
410 56.53 65.58 1420 120.01 502.81 2430 175.92 936.79
420 56.32 70.02 1430 121.08 507.08 2440 175.81 941.05
430 56.22 74.54 1440 122.15 511.45 2450 175.69 945.28
440 56.20 79.00 1450 123.21 515.81 2460 175.57 949.47
450 56.24 83.46 1460 124.25 520.23 2470 175.45 953.57
460 56.34 87.99 1470 125.27 524.69 2480 175.33 957.74
470 56.48 92.54 1480 126.27 529.21 2490 175.21 961.88
480 56.65 97.14 1490 127.26 533.68 2500 175.10 966.06
490 56.86 101.80 1500 128.23 538.14 2510 174.99 970.22
500 57.10 106.50 1510 129.18 542.69 2520 174.88 974.32
510 57.37 111.46 1520 130.12 547.27 2530 174.78 978.39
520 57.67 116.42 1530 131.03 551.86 2540 174.68 982.53
530 58.01 121.40 1540 131.92 556.33 2550 174.59 986.61
540 58.37 126.46 1550 132.79 560.85 2560 174.50 990.74
550 58.76 131.47 1560 133.66 565.41 2570 174.41 994.82
560 59.17 136.42 1570 134.50 569.96 2580 174.33 998.90
570 59.61 141.38 1580 135.33 574.59 2590 174.25 1003.10
33

580 60.07 146.44 1590 136.15 579.19 2600 174.18 1007.37
590 60.54 151.34 1600 136.96 583.85 2610 174.09 1011.69
600 61.03 155.85 1610 137.75 588.44 2620 174.01 1015.96
610 61.52 160.16 1620 138.54 593.00 2630 173.93 1020.22
620 62.00 164.54 1630 139.31 597.62 2640 173.84 1024.57
630 62.48 168.97 1640 140.09 602.23 2650 173.75 1028.98
640 62.95 173.40 1650 140.86 606.85 2660 173.66 1033.38
650 63.43 177.84 1660 141.65 611.49 2670 173.57 1037.80
660 63.90 182.37 1670 142.44 616.11 2680 173.47 1042.13
670 64.37 186.79 1680 143.24 620.80 2690 173.38 1046.46
680 64.84 191.28 1690 144.07 625.36 2700 173.29 1050.85
690 65.31 195.79 1700 144.95 629.52 2710 173.20 1055.24
700 65.78 200.26 1710 145.88 633.62 2720 173.10 1059.70
710 66.25 204.65 1720 146.85 637.76 2730 173.01 1064.15
720 66.72 209.03 1730 147.90 641.91 2740 172.92 1068.63
730 67.18 213.47 1740 149.01 646.07 2750 172.83 1073.06
740 67.63 217.84 1750 150.22 650.19 2760 172.73 1077.50
750 68.07 222.09 1760 151.49 654.31 2770 172.64 1081.92
760 68.49 226.48 1770 152.83 658.42 2780 172.55 1086.37
770 68.90 230.71 1780 154.23 662.50 2790 172.47 1090.74
780 69.33 234.96 1790 155.69 666.66 2800 172.39 1095.19
790 69.79 239.15 1800 157.20 670.87 2810 172.32 1099.73
800 70.29 243.37 1810 158.78 675.06 2820 172.26 1104.30
810 70.83 247.71 1820 160.40 679.20 2830 172.22 1108.80
820 71.37 252.01 1830 162.06 683.34 2840 172.19 1113.35
830 71.94 256.40 1840 163.72 687.42 2850 172.18 1117.74
840 72.50 260.80 1850 165.40 691.56 2860 172.18 1122.05
850 73.06 265.24 1860 167.07 695.75 2870 172.21 1126.39
860 73.64 269.72 1870 168.75 699.88 2880 172.25 1130.69
870 74.22 274.21 1880 170.40 704.01 2890 172.32 1135.02
880 74.81 278.69 1890 172.00 708.12 2900 172.41 1139.23
34
890 75.40 283.16 1900 173.54 712.24 2910 172.52 1143.26
900 76.00 287.68 1910 174.99 716.37 2920 172.65 1147.29
910 76.61 292.19 1920 176.32 720.54 2930 172.79 1151.27
920 77.21 296.67 1930 177.50 724.76 2940 172.95 1155.27
930 77.82 301.12 1940 178.50 728.93 2950 173.11 1159.25
940 78.44 305.59 1950 179.25 733.10 2960 173.29 1163.25
950 79.06 310.12 1960 179.68 737.19 2970 173.49 1167.22
960 79.69 314.60 1970 179.75 741.40 2980 173.70 1171.21
970 80.32 319.09 1980 179.49 745.58 2990 173.92 1175.21
980 80.97 323.56 1990 178.98 749.74 3000 174.15 1179.19
990 81.61 328.05 2000 178.29 753.94 3010 174.39 1183.14
1000 82.27 332.58 2010 177.51 758.17 3020 174.63 1186.39
3030 174.86 1189.45
POOH
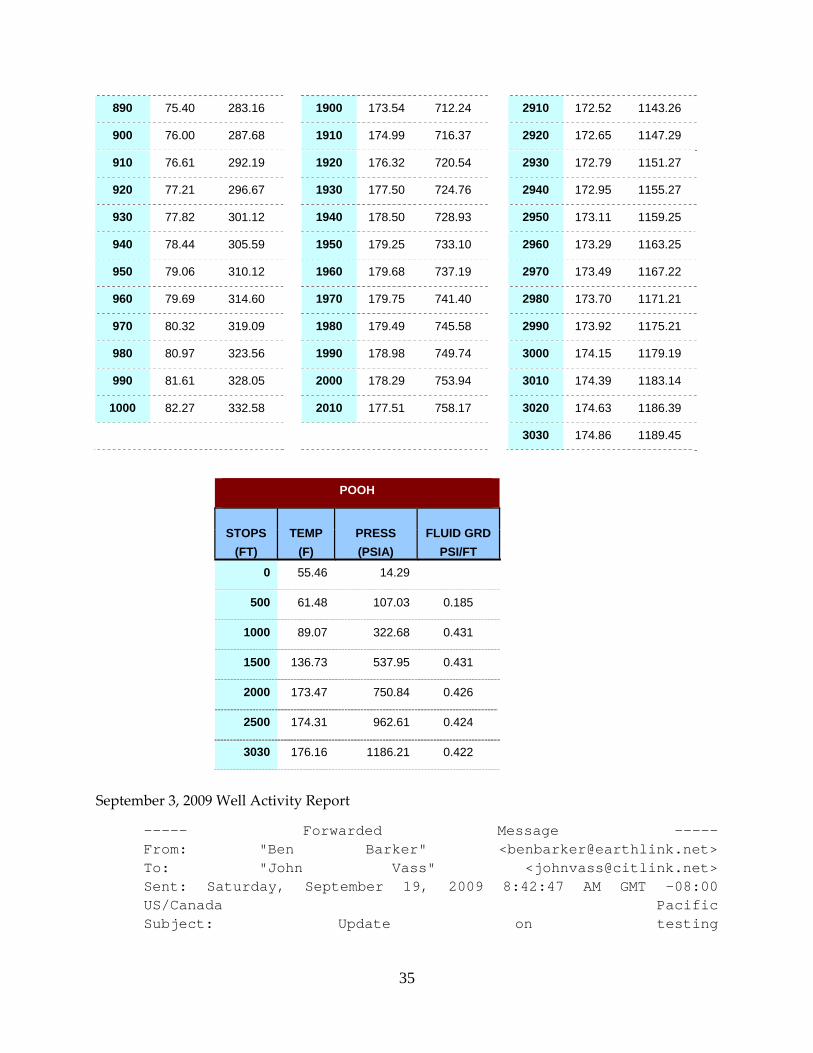
STOPS (FT)
TEMP (F)
PRESS (PSIA)
FLUID GRDPSI/FT
0 55.46 14.29
500 61.48 107.03 0.185
1000 89.07 322.68 0.431
1500 136.73 537.95 0.431
2000 173.47 750.84 0.426
2500 174.31 962.61 0.424
3030 176.16 1186.21 0.422
September 3, 2009 Well Activity Report
----- Forwarded Message ----- From: "Ben Barker" <[email protected]> To: "John Vass" <[email protected]> Sent: Saturday, September 19, 2009 8:42:47 AM GMT -08:00 US/Canada Pacific Subject: Update on testing
35

Here is the status of the testing program. Pacific Process Systems (PPS) logged well FB-4 on Sept. 3 with mixed results. PPS’s first run with temperature and pressure tools set down on an obstruction at 3030 feet below ground level. This depth is 245 feet below casing in the open hole section and 1603 feet above the drilled total depth of 4633 feet. The logging tools indicated a temperature of about 180 F at 3000 feet, substantially lower than expected. However, the pressure tool readings indicated a measurement system failure and PPS changed that tool reran the survey. The second survey showed the same obstruction depth and temperature with consistent pressure readings. The pressure readings show a standing liquid level in FB-4 at 300 feet below ground level. This is an encouraging result that indicates FB-4’s pressure is controlled by the same hot water system that FB-3 found. PPS did not have a full suite of tools for dealing with problems in open hole and was not able to confirm whether the obstruction at 3030 ft was a ledge or a bridge. However, the low temperature points to a bridge, which is preventing the circulation of hot water into the well. […]
A-3. Well FB-4 Cuttings Analysis “Petrographic and X‐ray diffraction analyses of cuttings from geothermal well Fort Bidwell‐4” by Clay Jones and Joseph Moore of the Energy & Geoscience Institute at the University of Utah.
Introduction
Well cuttings from Fort Bidwell‐4 were collected at 10’ intervals from 130 to 4660 ft. From these cuttings 38 thin‐sections have been made at roughly 100 ft intervals from 980 to 4660 ft. Over the same depth range, 18 samples (~200’ intervals) were prepared for X‐ray diffraction (XRD) analysis to identify the clay minerals in each sample. Chip boards were also prepared and examined by binocular microscope.
Lithologies
36

Thin sections and chip boards were examined in order to differentiate and describe lithologies. A lithologic column (Figure 9) and lithologic descriptions are presented.
Figure 9 – Lithologic Column Constructed for Well FB4 With Information From Thin Sections and Cuttings. Legend Showing Lithologies on the Right; Triangles Mark Depth at Which the Clay-Sized Fraction Was Analyzed Using XRD Methods (see below).
37

Tuffs
The ash flow tuffs are generally poorly welded, crystal‐poor, and lithic‐rich (Figure 10). However phenocrysts are observed, in decreasing order of abundance they are: plagioclase, biotite, quartz, sanidine, magnetite, and possibly pyroxene (now altered). Pumice fragments are the most common constituents of the tuff in the upper portions of the well, with the volume of lithic fragments increasing with depth, and pumice decreasing. Variable proportions of rhyolite, volcanic glass, and andesite are often found within the same sample, and pumice shards become increasingly rare. Zeolites (clinoptilolite?) and calcite fill void spaces. XRD analysis indicates that illite, smectite, and kaolinite are the dominant clay minerals within the tuffs.
A) B)
Figure 10 – Chip of a Tuff From Well FB4 Containing Abundant Pumice Shards (Pmc) as well as Lithic Fragments of Rhyodacite (R-D) and Andesite (And). A) Plane Polarized Light. B) Crossed Nicols. Field of View is 3.4 mm Across.
Rhyodacite Flows
The upper rhyodacites range from glassy to fine‐grained (Figure 11) and may be flow‐banded, vesicular, auto‐brecciated and/or devitrified. Plagioclase is the most common phenocryst, with smaller abundances of biotite, hornblende, and tourmaline. Devitrification of the matrix has produced fine‐grained mixtures of quartz and K‐feldspar. Zeolites are present as vug fillings. XRD analysis indicates that illite, smectite, and kaolinite occur within the rhyodacite flows.
38
A) A) B)
Figure 11 – Fine-Grained Rhyodacite Flow Consisting of Tabular Plagioclase Laths in a K-feldspar Rich Matrix. The Vesicle in This Image Is Filled With a Zeolite (Zeo) Possibly Stilbite and Quartz (Qtz), With a Few Biotite (Bt) Phenocrysts Seen Near The Edge. A) Plane Polarized Light. B) Crossed Nicols. Field of View is 1.7 mm Across.
Andesite Flows
The andesitic flows vary from glassy to coarse‐grained (Figure 12). The coarse‐grained chips contain interlocking plagioclase laths with clinopyroxene and magnetite filling the interstices. Fine‐grained and glassy flow material can contain plagioclase, pyroxene, hornblende, biotite, and apatite phenocrysts. These andesitic flows are locally brecciated and extensively altered. Smectite is a common alteration phase after plagioclase, pyroxene, and glass. Quartz, calcite, clays (smectite and chlorite), zeolites (wairakite and analcime), and chalcedony fill open space.
39

A) B)
Figure 12 – Coarse-Grained Andesite Composed of Interlocking Plagioclase (Pl) Laths, With Pyroxene (Px) and Magnetite (Mag) Filling Intersticies. Much of the Pyroxene Has Been Altered to Smectite (Sme). A) Plane Polarized Light. B) Crossed Nicols. Field of View is 3.4 mm Across.
Paleosols
Mineral grains, rock fragments, and pieces of wood are supported by a red‐black matrix, possibly consisting of clays and organic matter(?) stained by hematite (Figure 13).
40

A) B)
Figure 13 - A Fragment of Wood in a Paleosol, Which is a Matrix Supported Rock Containing Fragments of Volcanic Glass (VG), Rhyodacite Flow (R-D), Andesite Flow (And), and a Broken Plagioclase Grain. A) Plane Polarized Light. B) Crossed Nicols. Field of View is 3.4 mm Across.
X‐Ray Diffraction Methodology
XRD analyses of the clay sized fraction (<5 micrometer fraction) of each sample were preformed in the XRD laboratory at the Energy & Geoscience Institute at the University of Utah. A Phillips XRG 3100 generator emitting Cu‐K‐α radiation at 40 kV and 40 mA was used for the analyses. The instrument is equipped with a vertical goniometer, and a compensating slit designed to provide constant sample irradiation.
The samples were ground in a micronizing mill until fine enough to pass through a 325 mesh screen (particle size < 44 micrometers). The clay fraction was separated from the bulk sample using Stokes Law for particle sedimentation. After air‐drying, the samples were scanned from 2o to 45o 2θ with a 0.75o 2θ step size. The samples were then allowed to interact with ethylene glycol vapors to induce swelling of smectite‐bearing clays and additional X‐ray diffraction scans were preformed. The air‐dried and glycolated patterns were then compared to determine which, if any, smectite‐bearing clays were present. Clay abundances were determined from the whole‐rock scans.
Clay minerals are particularly sensitive to temperature and thus can be used as a mineral geothermometer. The persistence of smectite throughout the rock sequence (Figures 14 & 15) suggests that temperatures during hydrothermal alteration have not
41

exceeded approximately 180oC. At higher temperatures interlayered illite‐smectite would be anticipated. No interlayered clays were found.
Fort Bidwell-4
800
1200
1600
2000
2400
2800
3200
3600
4000
4400
4800
0 .5 1 .5 2 .5 3 .5 4 .5
Clay MineralsSa
mpl
e D
epth
(ft)
Kaolinite Smectite Chlorite Illite
Figure 14 – Clay Minerals Identified by XRD Methods Plotted Versus Depth Below Kelly Bushing for Well FB4.
42

Figure 15 – XRD Plot of the Ethylene Glycol-Solvated Clay Sized Fraction Versus Depth for Well FB4. The Point at Which the Scan Line Crosses the Left Edge of the Plot Is Its Approximate Depth Below Kelly Bushing in Feet. Red Dotted Line Shows the Location of the Primary Smectite Peak, Blue Illite, and Orange Kaolinite, and Short Solid Green is Only Drawn in the Area Where the Main Chlorite and Kaolinite Peaks Overlap.
43

A-4. Well FB-3 Activity Reports and Well Schematic September 3, 2009 Well Activity Report
----- Forwarded Message ----- From: "Ben Barker" <[email protected]> To: "John Vass" <[email protected]> Sent: Saturday, September 19, 2009 8:42:47 AM GMT -08:00 US/Canada Pacific Subject: Update on testing Here is the status of the testing program. Pacific Process Systems (PPS) logged well FB-4 on Sept. 3 …
[…]
A positive result of PPS’s visit was the opportunity to check the condition of FB-3. PPS wanted to check their tool function after the initial problem at FB-4, so I rigged them up on FB-3. Their tools set down at 267 feet on the large ledge at the casing shoe, but we were then able to flow the well and observe that its flowing rate and temperature have apparently not diminished.
[…]
44

Temperature/Spinner Survey on May 18, 1987 (from LaFleur 2005, pg. 19)
45

Well FB‐3 Schematic (Lawrence 1985.)
46

A-5. Well FB-2 Schematic (Juncal 1984)
47

A-6. Well FB-1 Water Well Drillers Report (Atkinson 1981)
48

Appendix B – Communications and Emergency Contingency
Plans Document This document contains the Communications and Emergency Contingency Plans for field activity to be carried out on the Well FB4, located within the Fort Bidwell reservation. The work is being carried out under Task 2.2 (Well Testing) of the above‐reference Grant. The information in this document comprises Task 2.1 of the Grant Project.
Emergency Contingency Plan
Call 9‐1‐1 in case of emergency.
Local medical resources include:
A Nurse at the Warner Mtn. Medical Center on the reservation during normal business hours. 530‐279‐6195
A Nurse/Doctor at the Surprise Valley Community Hospital in Cedarville, about 25 miles south. Open 24 Hours. 530‐279‐6111
A Hospital at the Modoc Medical Center in Alturas 50 miles away. Open 24 Hours. 530‐233‐5131
Additional information about emergency medical and fire contacts is provided below.
There will be an onsite, pre‐job safety meeting. This will include a job hazard review and requirements for personal protective equipment (PPE) for all personnel on the location. Below is a copy of the Job Hazard Review form to be used.
Standard PPE includes hart hat, gloves, safety glasses, steel toe shoes and personal H2S monitor. Personnel without the standard PPE may be limited to certain parts of the location as determined by the project engineer.
Project Communication Plan
Data resulting from the well survey will be provided to the Project Engineer, who will then transmit it to the FBIC Grant Manager and the Energy Commission Grant Project Manager.
Below is a listing of names and contact information for the FBIC Project, the Fort Bidwell Tribe, and the Energy Commission. Other local information is also provided.
49

EMERGENCY PHONE LIST
MEDICAL EMERGENCY Emergency Dispatch Modoc County Sheriff, Alturas 911 (from landline phone)
California Highway Patrol, Susanville (from cell phone)
Nurse Warner Mtn. Medical Center 530‐279‐6195 On Reservation Open Business Hrs Nurse/Doctor Surprise Valley Community Hospital 530‐279‐6111 Cedarville – Call Ahead. About 25 mi. Open 24 Hours North of NE corner of main intersection. Hospital Modoc Medical Center 530‐233‐5131 Alturas. About 50 mi. Open 24 Hours
FIRE EMERGENCY Emergency Dispatch Fire 911 Town of Ft. Bidwell Volunteer Fire Department 530‐279‐2045 (Dean Anderberg, Acting Chief) Modoc National Forest, Alturas Forest Supervisor’s Office 530‐233‐5811 Lands south and west of the reservation Bureau of Land Management, Cedarville Office 530‐279‐6101 Lands northeast and south of the reservation 530‐279‐2734 (engine bay)
50

JOB HAZARD REVIEW FORM
51

FBIC PROJECT PHONE LIST Project Role Contact Cell Phone Email
Engineer Paul Atkinson 530‐919‐2981 [email protected] FBIC AND AGENCY CONTACTS Tribal Council Chair: Bernold Pollard Tribal Council Co‐Chair: Jon MacErnie FBIC Grant Manager and John Vass 530‐640‐2128 [email protected] Tribal Administrator FBIC Environ. Manager Leslie Brooks 530‐279‐6310, ext. 1, then 2 [email protected] CA Energy Commission John Hingtgen 916‐651‐9106 [email protected] Grant Project Manager
OTHER USEFUL CONTACTS Sunrise Motel, Highway 299, Cedarville ‐‐ 530‐279‐2161 Surprise Valley Hot Springs, 530‐279‐2040 or toll free 877‐927‐6426
52

Appendix C – Fort Bidwell Fault Mapping Figure C‐1 presents the surface traces of Fort Bidwell area faults. These include the same faults presented previously (Figure 8 of LaFleur, 2005).
FB-4
FB-3 FB-2
FB-1
1 mile
Figure C‐ 1 Surface Traces of Fort Bidwell Area Faults
The fault mapping was conducted as part of the previous study (Figure 8 of LaFleur, 2005) using satellite imagery, aerial photography, and field inspection. The satellite investigation was done using Google Earth, which provides good resolution imagery for this area. The aerial photography was specifically ordered for the purpose of mapping the faults. It was obtained from the USDA field office, Salt Lake City, and consisted of 1:40,000 scale, black & white, stereographic coverage. Several weeks were spent on the ground during the earlier study observing the fault scarps and walking out the drainages.
The remainder of this appendix provides some general comments about the Fort Bidwell area and its relationship to the larger region, and within which the surface manifestation of the fault interpretation was made.
53

Fort Bidwell is located in the western portion of the Basin and Range Province. The primary tectonic features of the area are the result of what is traditionally known as ʺBasin and Range extensionʺ. This tectonic process produces relatively uplifted ʺhorstʺ blocks that form the mountain ranges, and relatively down‐dropped ʺgrabenʺ valleys. The margins of the valleys are defined by the primary ʺrange‐frontʺ faults, which are generally coincident with the abrupt change in slope. Typically, faulting sub‐parallel to the range front can be observed within the uplifted block. This area is also significantly affected by the stress field generated by the interaction of the Eastern Pacific Plate and North American Plate.
Hydrothermal systems are often found coincident with the range front faulting. Geothermal exploration in the Basin and Range is finding more examples of hydrothermal upflow within the sub‐parallel faulting that outcrops higher within the up‐faulted block.
The town of Fort Bidwell is on the northwest margin of the Surprise Valley graben, and the Reservation extends westward up into the Warner Range horst block. The regional alignment of these mega‐features is N‐S; however, locally at Fort Bidwell, the range‐front faulting has a NNW direction. The few hydrothermal features in the area occur along the range front.
Like the rest of California and the western Basin and Range, the tectonics at Fort Bidwell are also subject to the stress field generated by the regional plate motion of the Western US. The ʺdragʺ imparted to the western continental margin by the NW movement of the Western Pacific Plate, propagates eastward through California and into Nevada. The strain produced by tens of millions of years of this ongoing plate motion results in the formation of strike‐slip type faulting or ʺshearsʺ. Unlike the Basin and Range faulting which demonstrates huge vertical offset, the strike‐slip faulting generates conjugate shears that have predominantly horizontal offset. The primary shear direction is NW, parallel to the offshore plate motion, and has right‐lateral offset. The ongoing ground motion produced by these shears is now being monitored by satellite throughout the Basin and Range as well as California. Large NW‐trending shears abound in the western Basin and Range. Examples near Fort Bidwell would include Fandango Pass, 5 miles to the south, and upper Bidwell creek, a mile to the north of the Reservation. Often less recognized, are the NE‐trending conjugate shears but they are observed to be prevalent when conducting more detailed local fault mapping.
54

Appendix D - Well Clean-Out Cost Estimate
55


![Downes v. Bidwell (1901) [Insular Cases]](https://static.fdocuments.net/doc/165x107/568165f6550346895dd91c9d/downes-v-bidwell-1901-insular-cases.jpg)