Assessment of Environmental Enablers and Barriers as Related to Leisure versus Need Anne Kramlinger,...
31
Assessment of Environmental Enablers and Barriers as Related to Leisure versus Need Anne Kramlinger, MSOT/S Julia Sanders, OTD/S Jaren Soelberg, MSOT/S Carolyn Slentz, MSOT/S Elizabeth Williams, MSOT/S
-
Upload
juliet-summers -
Category
Documents
-
view
218 -
download
0
Transcript of Assessment of Environmental Enablers and Barriers as Related to Leisure versus Need Anne Kramlinger,...
Assessment of Environmental Enablers and Barriers
as Related to Leisure versus Need
Anne Kramlinger, MSOT/SJulia Sanders, OTD/S
Jaren Soelberg, MSOT/SCarolyn Slentz, MSOT/S
Elizabeth Williams, MSOT/S


Problem and Purpose• As of 2009 19,425,100 people in the United States reported
having a disability affecting their mobility• Maslow's Hierarchy of Needs shows us that physiological
needs must be met before a person can move to higher levels of need, desire, and self-actualization
• Environment plays a major role in enabling or inhibiting accessibility and thus can affect one's ability to access and obtain food
Purpose: This study utilizes the CHEC-M in hopes of gauging the accessibility of various grocery stores and restaurants in the St. Louis area. We theorized that buildings utilized for need would be more accessible than buildings utilized for leisure activities. It is hypothesized that restaurants in St. Louis will be found to be less accessible as measured by the CHEC-M than grocery stores in the same area.
Participants
• 52 establishments were selectedo25 grocery stores (need)o27 restaurants (leisure)
• InclusionoAnything under "grocery store" or "restaurant" in
the phone book in the 2012 St. Louis metropolitan area
• ExclusionoSafetyoDistance
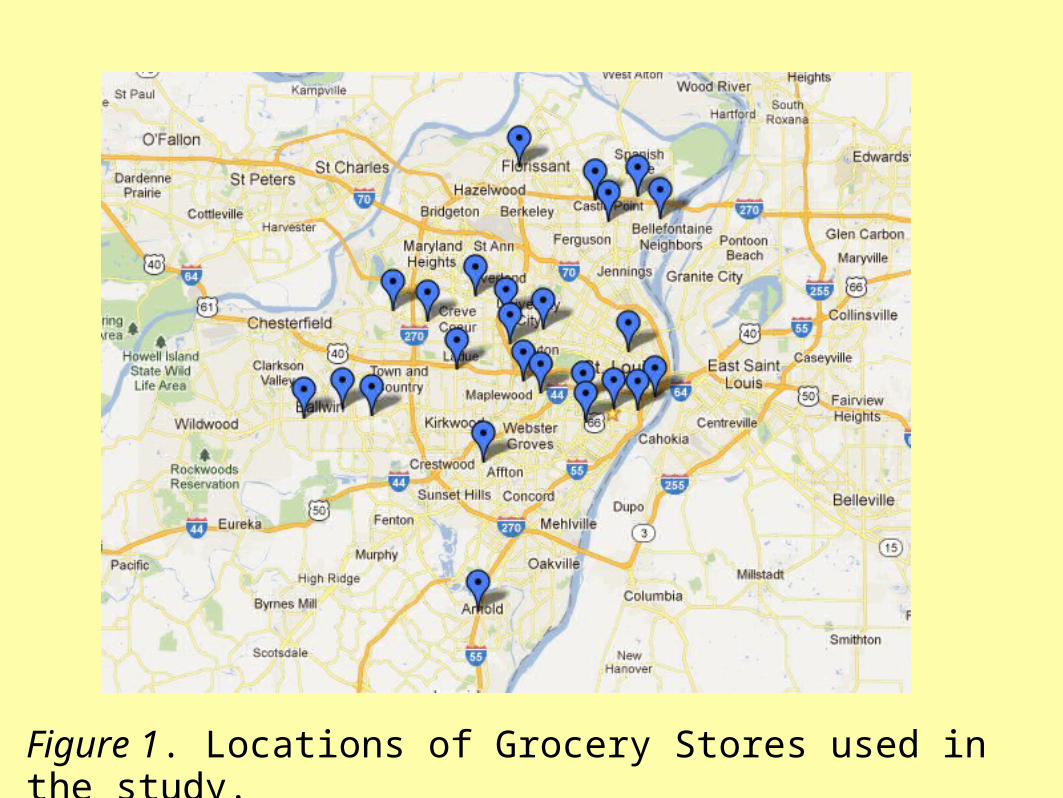
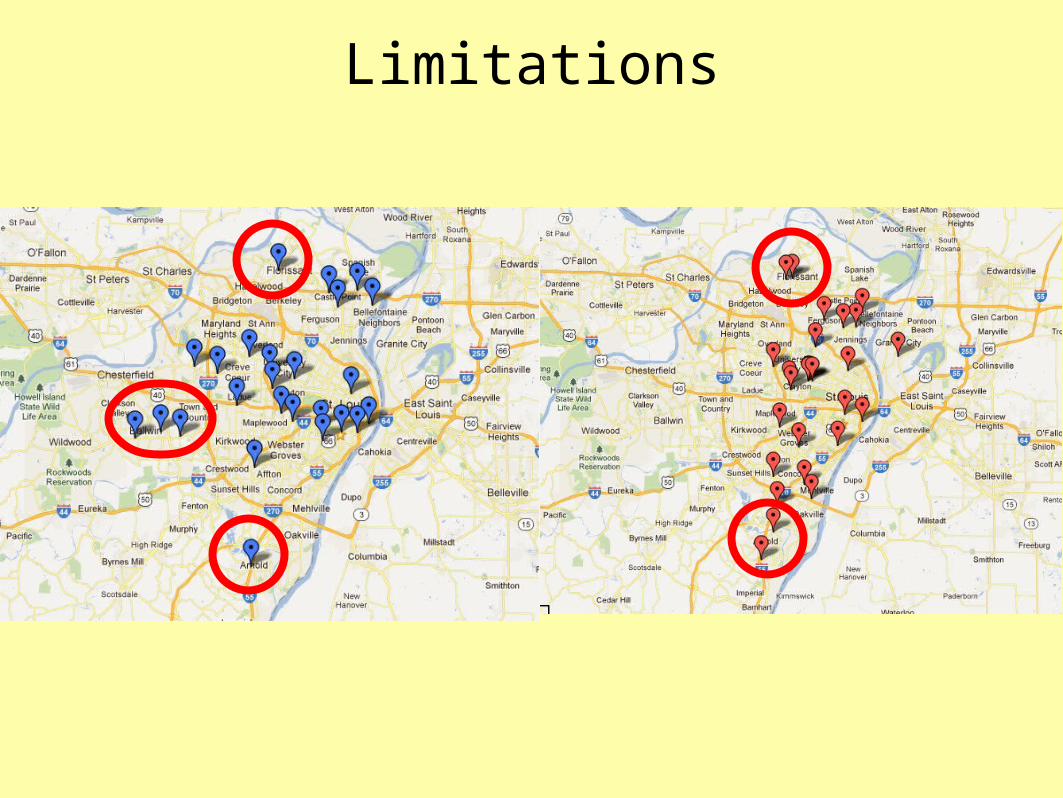
Figure 1. Locations of Grocery Stores used in the study.
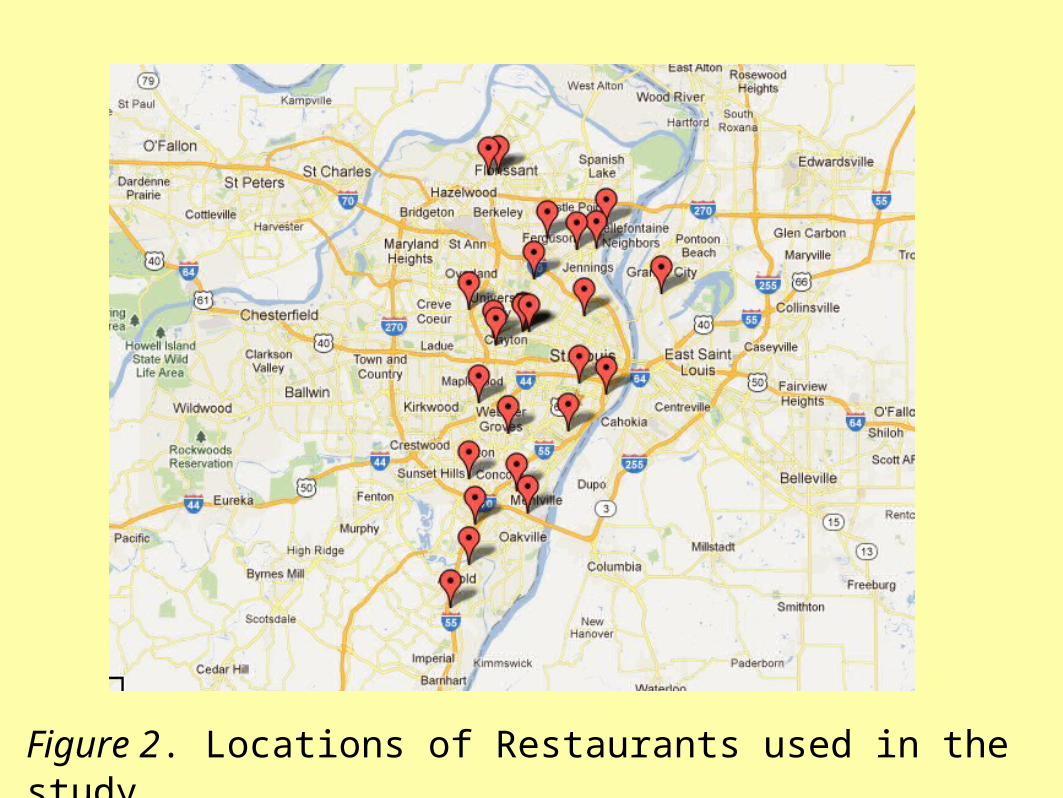
Figure 2. Locations of Restaurants used in the study.
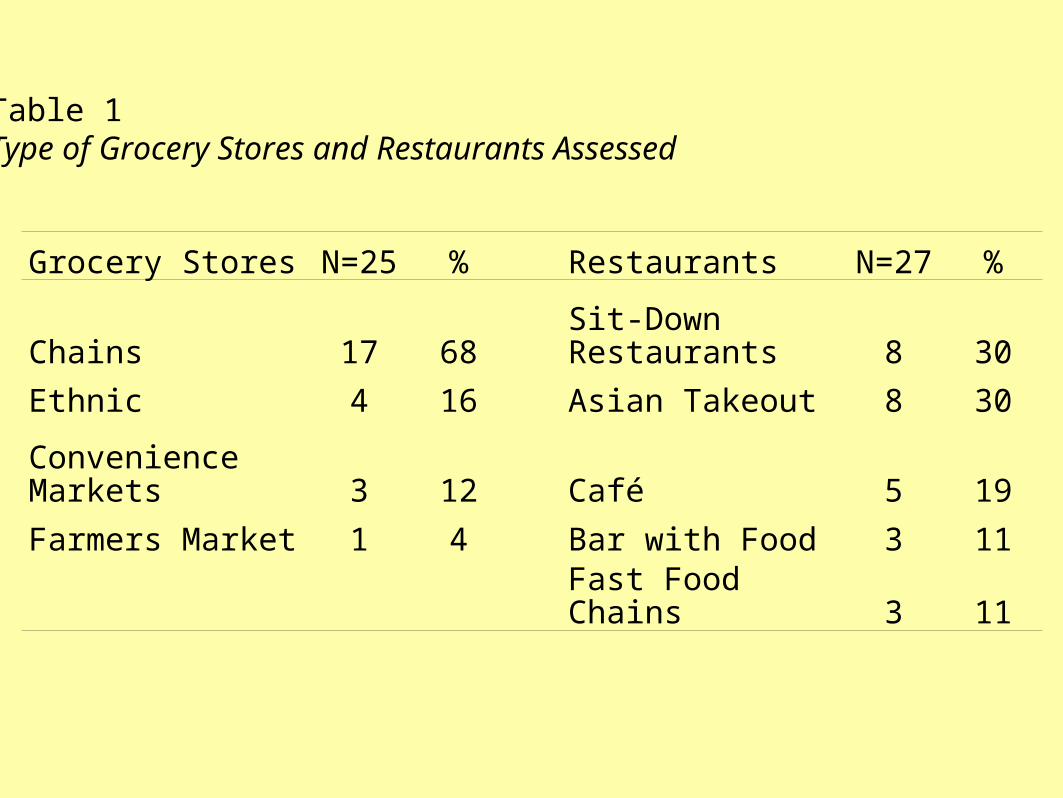
Grocery Stores N=25 % Restaurants N=27 %
Chains 17 68Sit-Down Restaurants 8 30
Ethnic 4 16 Asian Takeout 8 30
Convenience Markets 3 12 Café 5 19
Farmers Market 1 4 Bar with Food 3 11
Fast Food Chains 3 11
Table 1Type of Grocery Stores and Restaurants Assessed
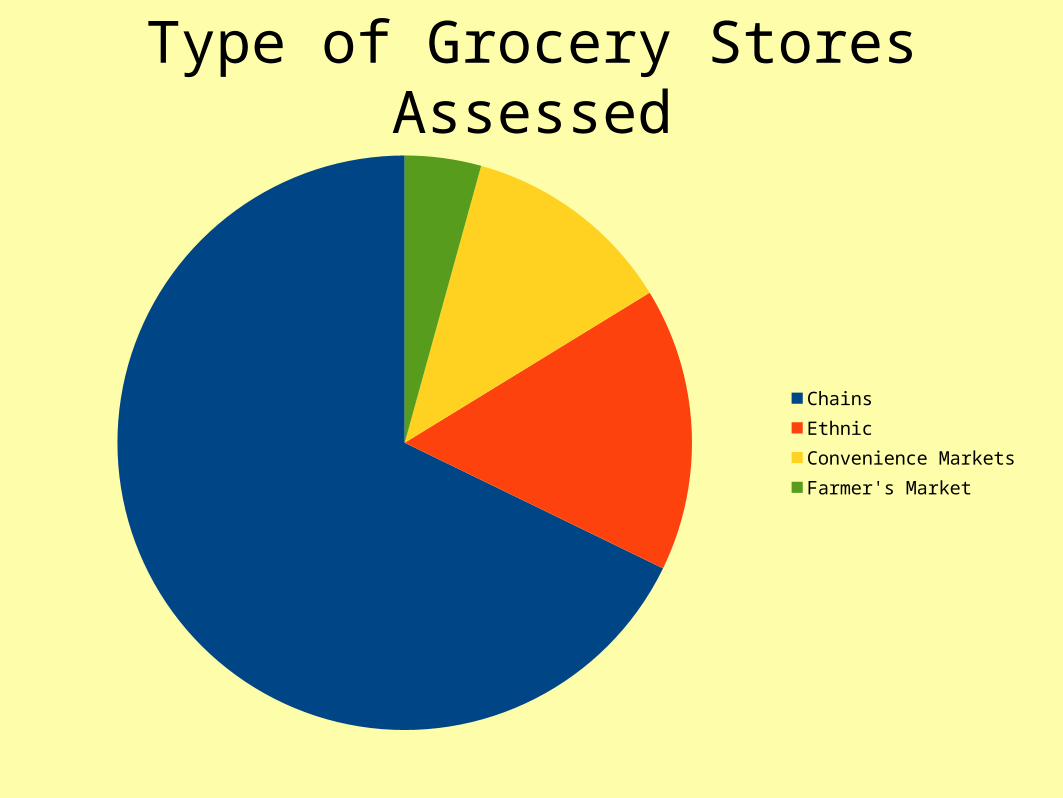
Type of Grocery Stores Assessed
ChainsEthnicConvenience MarketsFarmer's Market
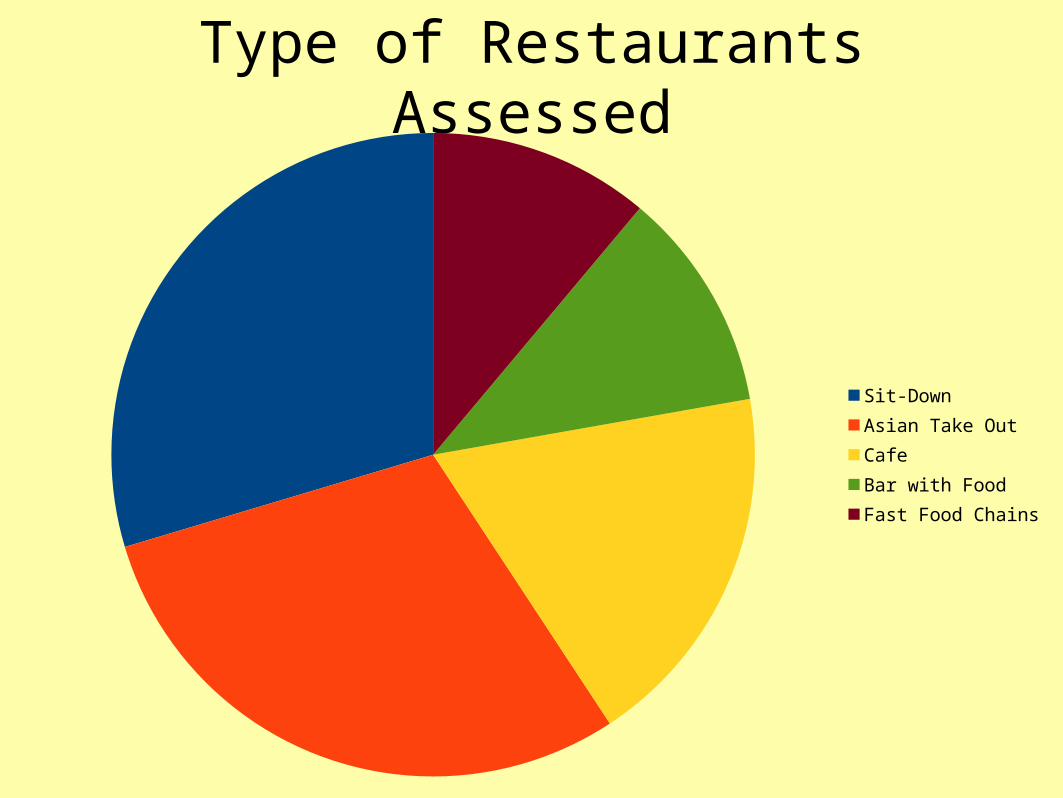
Type of Restaurants Assessed
Sit-DownAsian Take OutCafeBar with FoodFast Food Chains
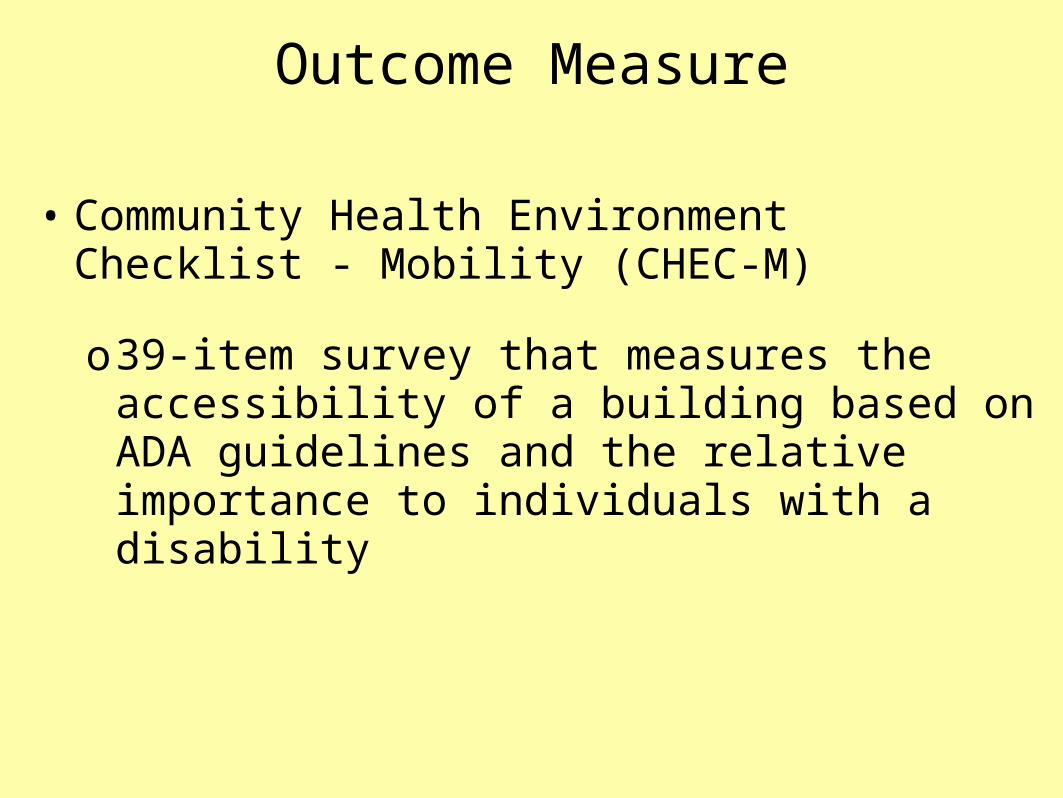
Outcome Measure
• Community Health Environment Checklist - Mobility (CHEC-M)
o39-item survey that measures the accessibility of a building based on ADA guidelines and the relative importance to individuals with a disability
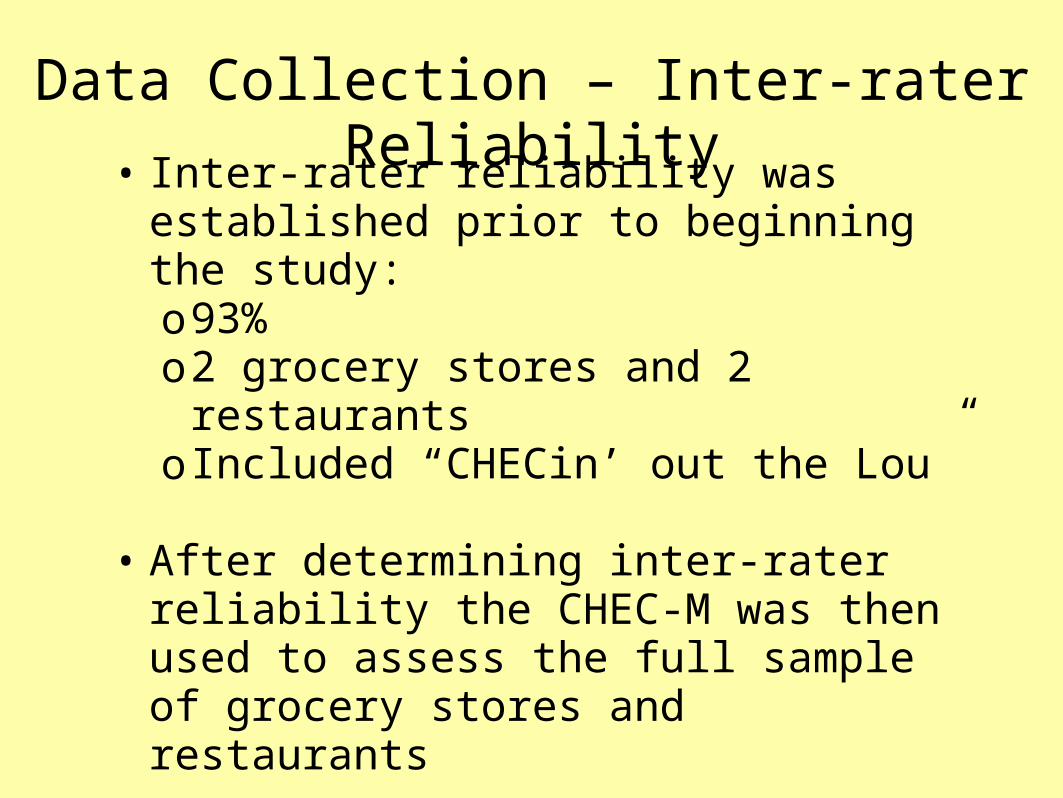
Data Collection – Inter-rater Reliability
• Inter-rater reliability was established prior to beginning the study:o93%o2 grocery stores and 2 restaurantso Included “CHECin’ out the Lou”
• After determining inter-rater reliability the CHEC-M was then used to assess the full sample of grocery stores and restaurants
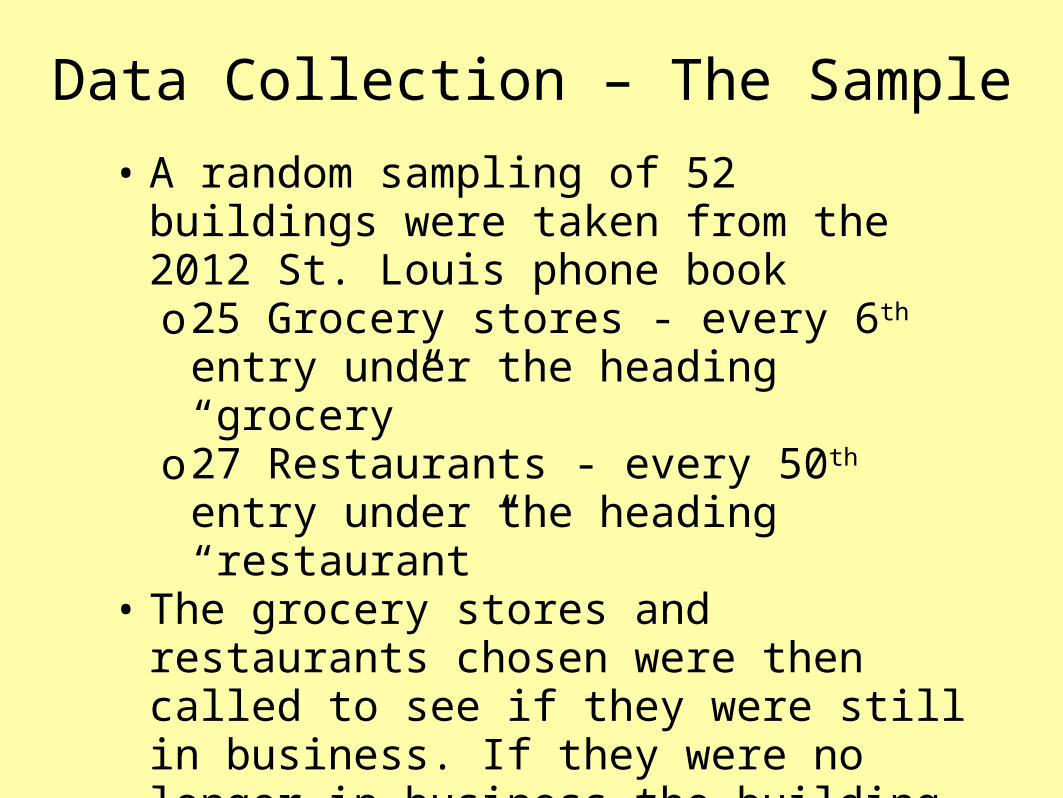
Data Collection – The Sample
• A random sampling of 52 buildings were taken from the 2012 St. Louis phone booko25 Grocery stores - every 6th entry under
the heading “grocery”o27 Restaurants - every 50th entry under
the heading “restaurant”• The grocery stores and restaurants chosen
were then called to see if they were still in business. If they were no longer in business the building listed directly under it in the phone book was selected and included instead.
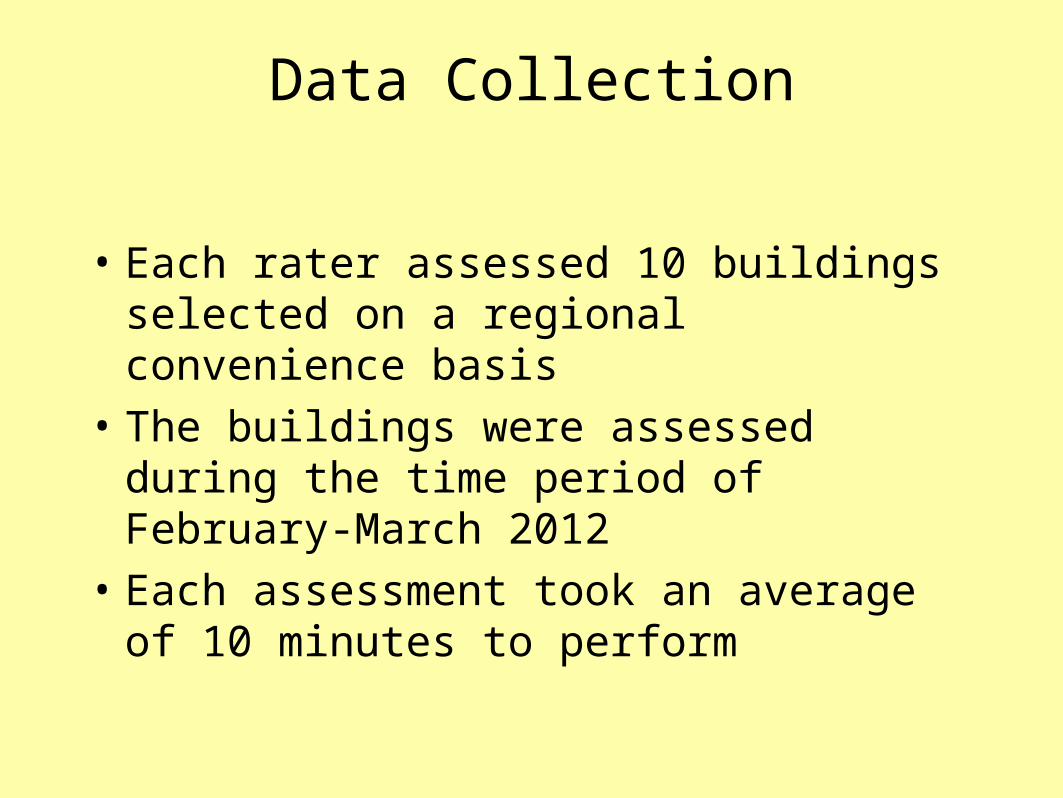
Data Collection
• Each rater assessed 10 buildings selected on a regional convenience basis
• The buildings were assessed during the time period of February-March 2012
• Each assessment took an average of 10 minutes to perform
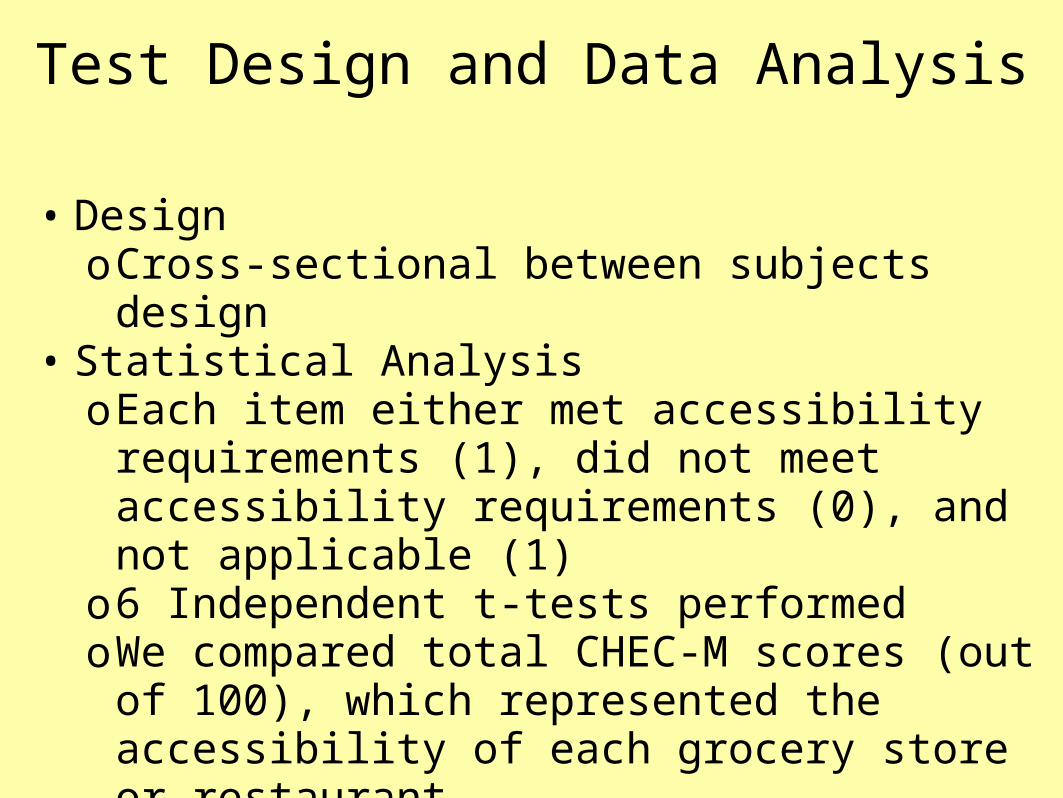
Test Design and Data Analysis
• DesignoCross-sectional between subjects design
• Statistical AnalysisoEach item either met accessibility requirements
(1), did not meet accessibility requirements (0), and not applicable (1)
o6 Independent t-tests performedoWe compared total CHEC-M scores (out of 100),
which represented the accessibility of each grocery store or restaurant
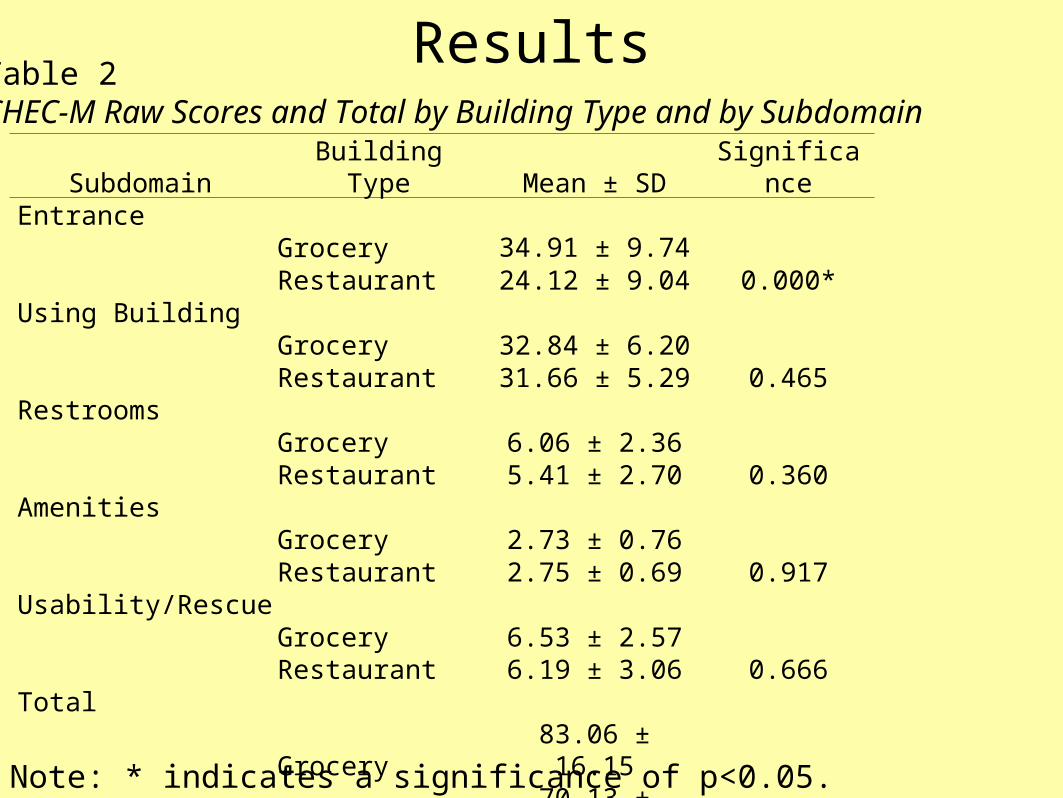
ResultsTable 2CHEC-M Raw Scores and Total by Building Type and by Subdomain
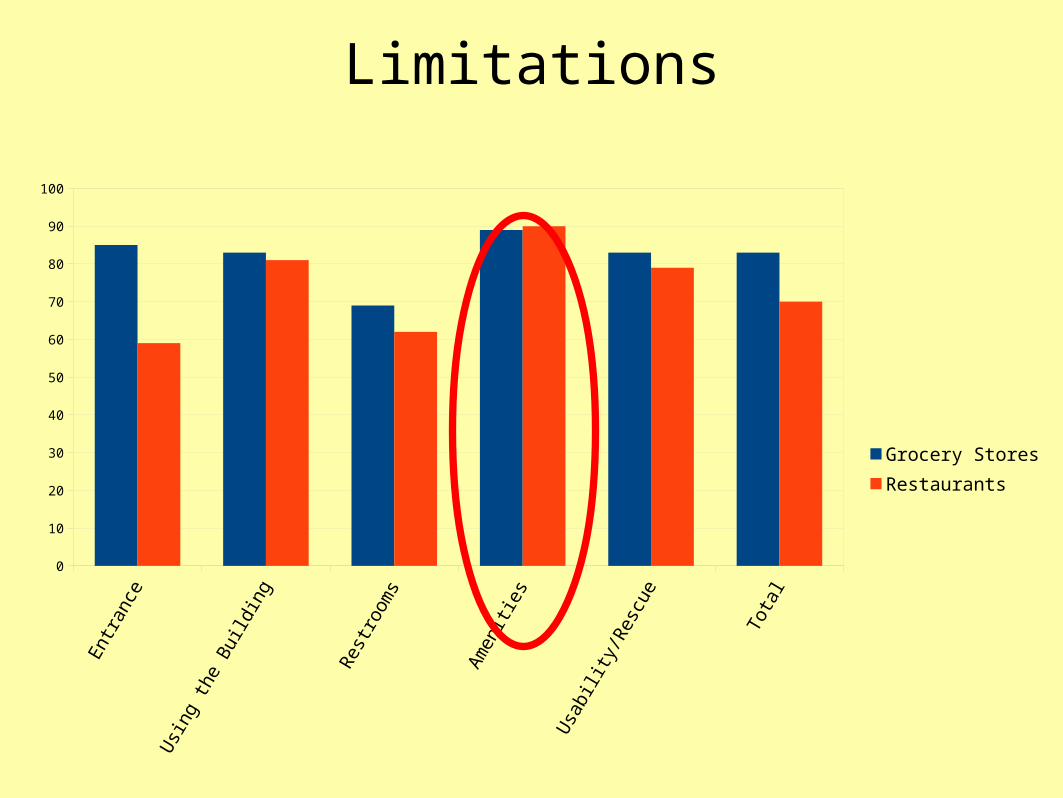
Subdomain Building Type Mean ± SD SignificanceEntrance
Grocery 34.91 ± 9.740.000*Restaurant 24.12 ± 9.04
Using BuildingGrocery 32.84 ± 6.20
0.465Restaurant 31.66 ± 5.29Restrooms
Grocery 6.06 ± 2.360.360Restaurant 5.41 ± 2.70
AmenitiesGrocery 2.73 ± 0.76
0.917Restaurant 2.75 ± 0.69Usability/Rescue
Grocery 6.53 ± 2.570.666Restaurant 6.19 ± 3.06
TotalGrocery 83.06 ± 16.15
0.005* Restaurant 70.13 ± 15.92
Note: * indicates a significance of p<0.05.
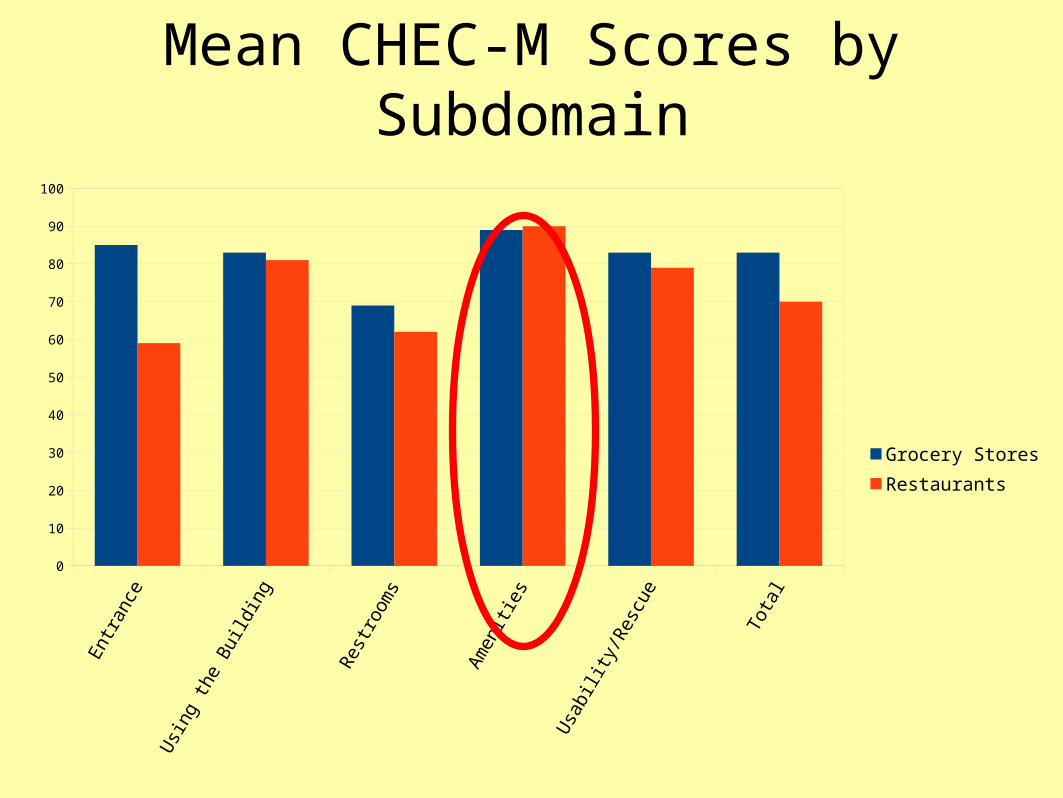
Mean CHEC-M Scores by Subdomain
Ent
ranc
e
Usi
ng th
e B
uild
ing
Res
troom
s
Am
eniti
es
Usa
bilit
y/R
escu
e
Tota
l
0
10
20
30
40
50
60
70
80
90
100
Grocery StoresRestaurants
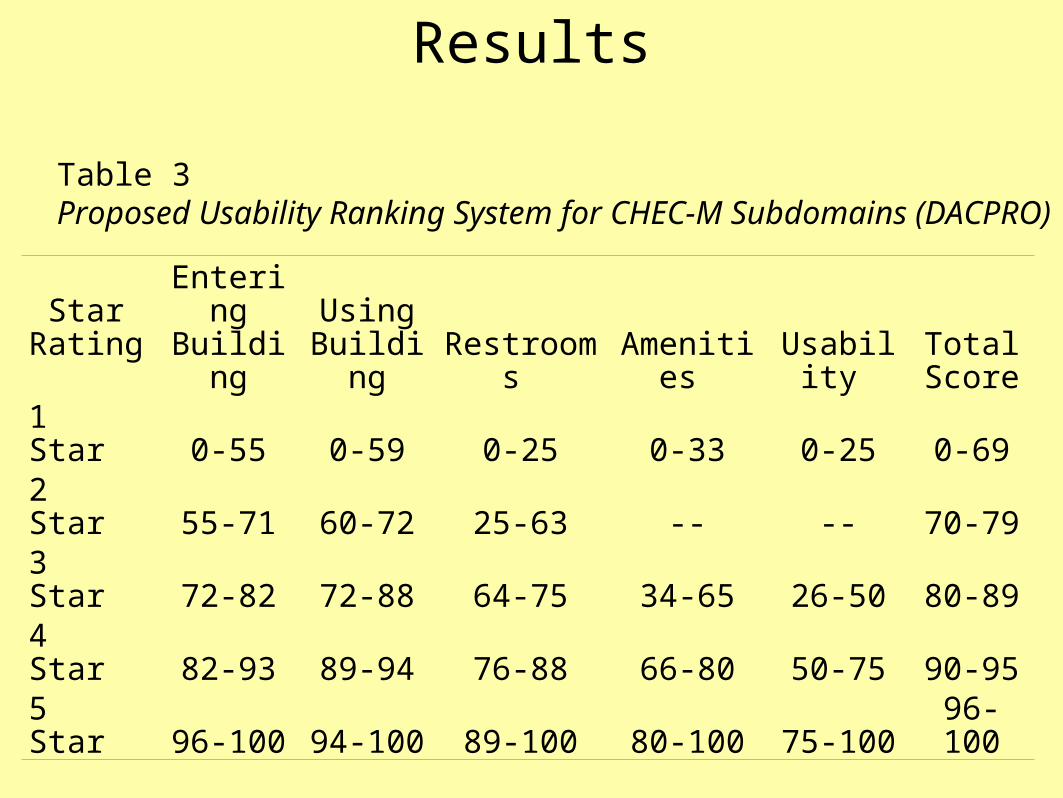
Star Rating
Entering Building
Using Building Restrooms Amenities Usability
Total Score
1 Star 0-55 0-59 0-25 0-33 0-25 0-69
2 Star 55-71 60-72 25-63 -- -- 70-79
3 Star 72-82 72-88 64-75 34-65 26-50 80-89
4 Star 82-93 89-94 76-88 66-80 50-75 90-95
5 Star 96-100 94-100 89-100 80-100 75-100 96-100
Table 3Proposed Usability Ranking System for CHEC-M Subdomains (DACPRO)
Results
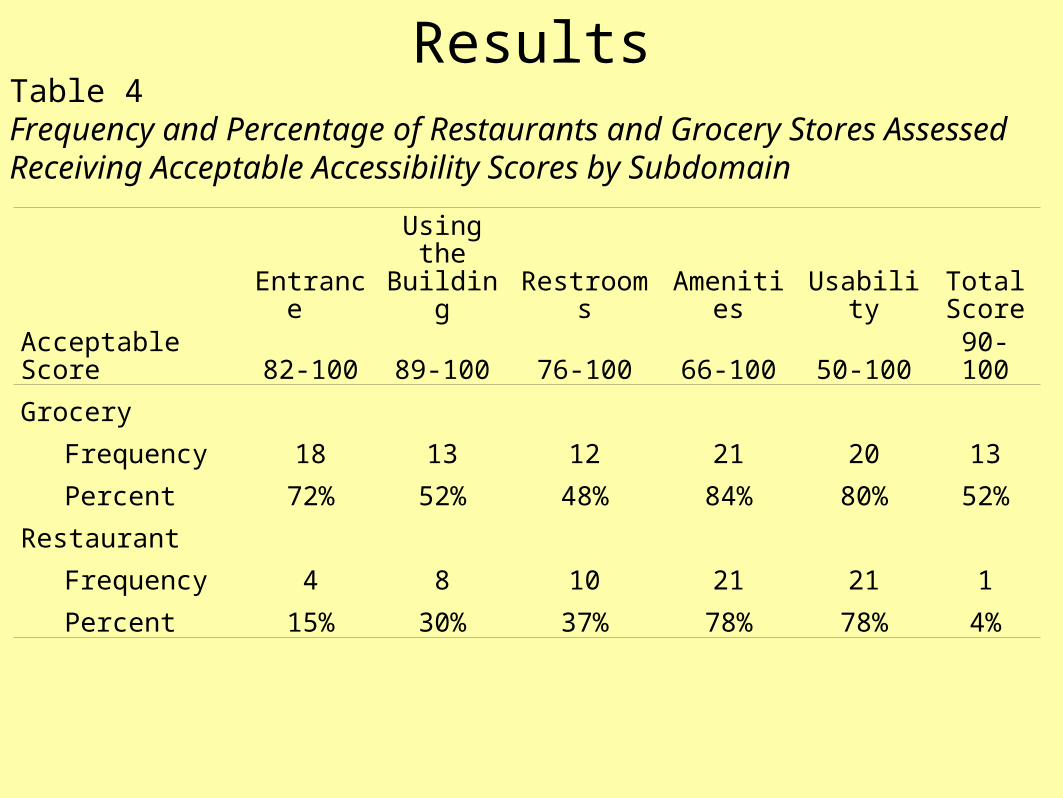
ResultsTable 4 Frequency and Percentage of Restaurants and Grocery Stores Assessed Receiving Acceptable Accessibility Scores by Subdomain
Entrance Using the Building Restrooms Amenities Usability
Total Score
Acceptable Score 82-100 89-100 76-100 66-100 50-100 90-100
Grocery
Frequency 18 13 12 21 20 13
Percent 72% 52% 48% 84% 80% 52%
Restaurant
Frequency 4 8 10 21 21 1
Percent 15% 30% 37% 78% 78% 4%
Discussion
• Statistical InsightsoAs expected, grocery stores are more accessible
than restaurants in the St Louis metropolitan area
oAs a whole, bathrooms are the least accessible part of a grocery store or a restaurant
• Current literature identifies that the need for food is directly related to occupational performance which impacts quality of life
Similar Research Findings
• According to McClain, et. al. 1990 - Convenience stores (78%) are far less accessible than chain grocery stores (100%)
• According to McClain, et. al. 1993 - Getting in the door of an establishment was not an obstacle (66% accessible); handicapped parking was (53%)
Adding to Current Knowledge
• Grocery stores are significantly more accessible than restaurants (p = .005) as measured by the CHEC-M
• Grocery store entrances are more accessible than restaurant entrances
Clinical Implications
• In order to enhance accessibility, architectural modifications are needed
• Both grocery stores and restaurants had ‘inaccessible’ scores
• Leisure as food is not as accessibleo Only 4% of restaurants had total usability in an
acceptable rangeo Only 15% of restaurants had acceptable entrance scores
• Grocery stores had very high scores and can be used as a model of acceptable entrance
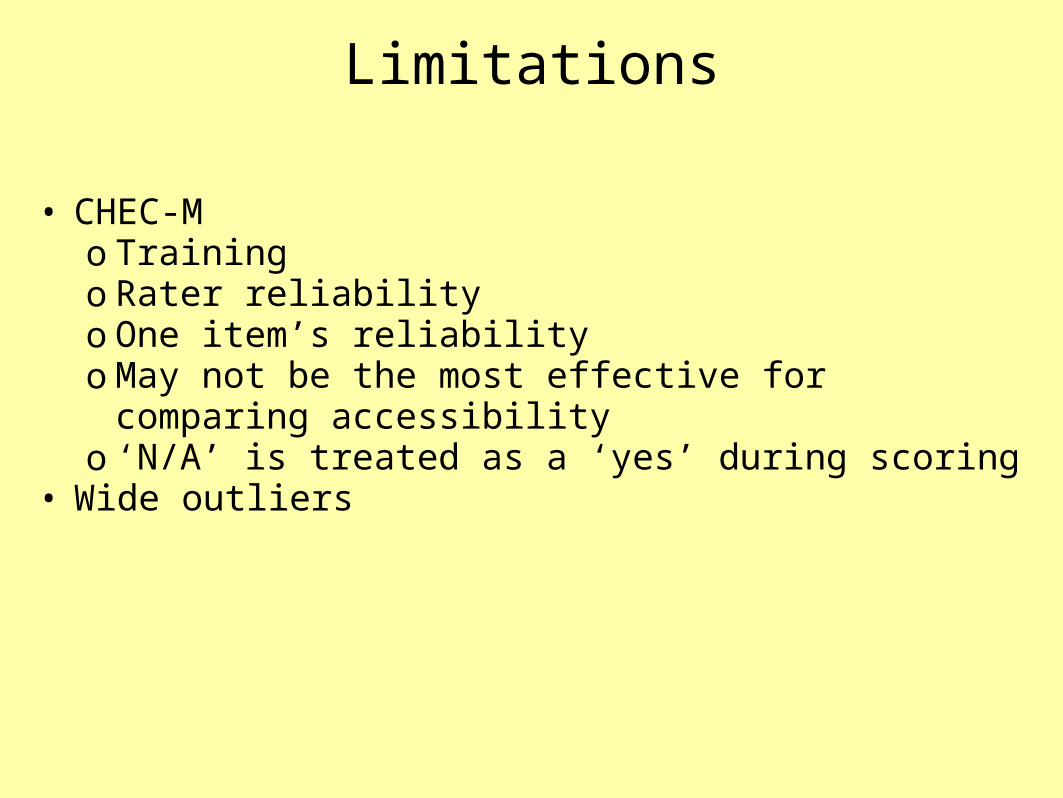
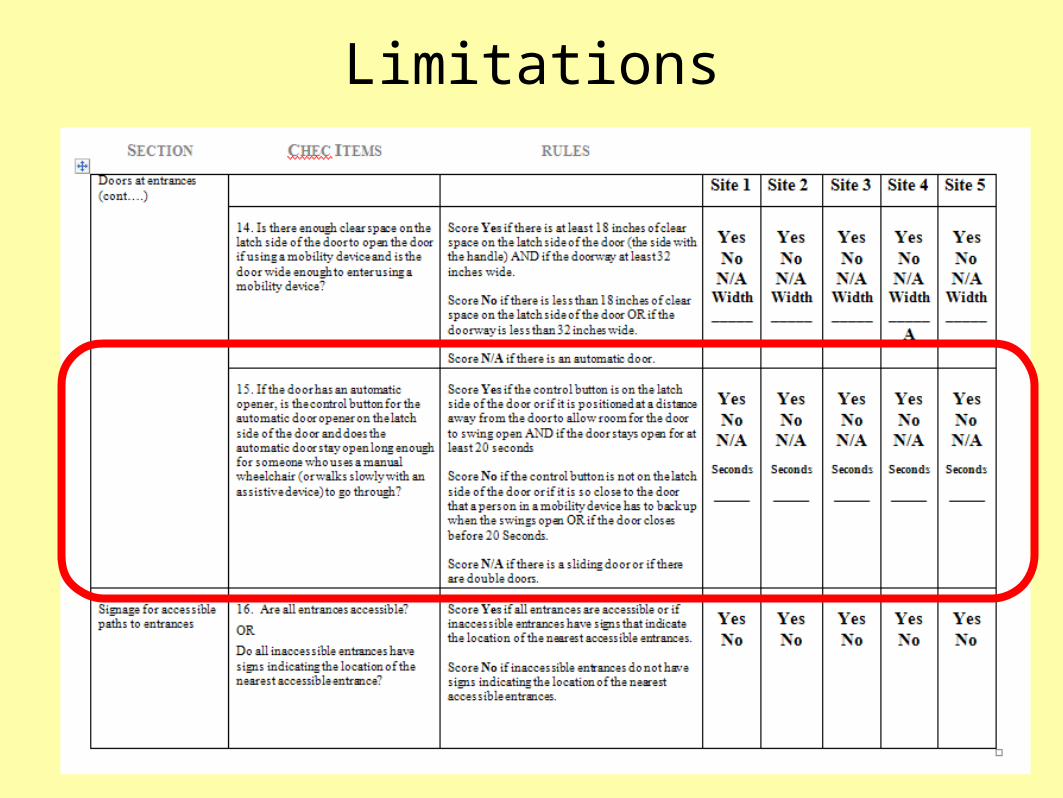
Limitations
• CHEC-Mo Trainingo Rater reliabilityo One item’s reliabilityo May not be the most effective for comparing accessibilityo ‘N/A’ is treated as a ‘yes’ during scoring
• Wide outliers
Limitations
Limitations
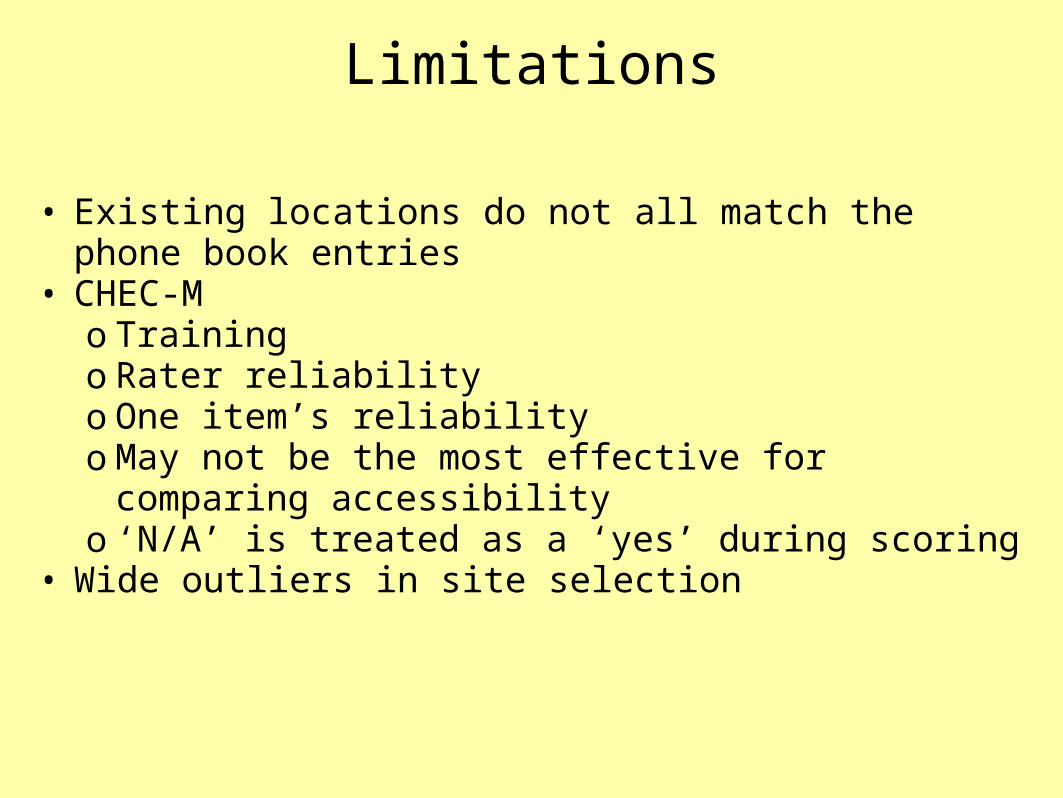
• Existing locations do not all match the phone book entries• CHEC-M
o Trainingo Rater reliabilityo One item’s reliabilityo May not be the most effective for comparing accessibilityo ‘N/A’ is treated as a ‘yes’ during scoring
• Wide outliers in site selection
LimitationsE
ntra
nce
Usi
ng th
e B
uild
ing
Res
troom
s
Am
eniti
es
Usa
bilit
y/R
escu
e
Tota
l
0
10
20
30
40
50
60
70
80
90
100
Grocery StoresRestaurants

Limitations
• Existing locations do not all match the phone book entries• CHEC-M
o Trainingo Rater reliabilityo One item’s reliabilityo May not be the most effective for comparing accessibilityo ‘N/A’ is treated as a ‘yes’ during scoring
• Wide outliers in site selection
Limitations
Future Work
• Usability of restroom accessibility should be further researched
• More studies should be doneoRural environmentsoDifferent socioeconomic areasoOther cities
• The CHEC-HOH and CHEC-LV should be done
References
Erickson, W., Lee, C., von Schrader, S. (2010, March 17). Disability Statistics from the 2008 American Community Survey (ACS). Ithaca, NY: Cornell University Rehabilitation Research and Training Center on Disability Demographics and Statistics (StatsRRTC). Retrieved Feb 07, 2012 from www.disabilitystatistics.org.
Maslow, A. H. (1943). Conflict, frustration, and the theory of threat. Journal of Abnormal Psychology, 38, 81-86.
McClain, L., Beringer, D., Kuhnert, H., Priest, J., Wilkes, E., Wilkinson, S., & Wyrick, L. (1993). Restaurant wheelchair accessibility. American Journal of Occupational Therapy, 47(7), 619-623.
McClain, L., & Todd, C. (1990). Food store accessibility. American Journal of Occupational Therapy, 44(6), 487-491.
Imrie, R. O. B., & Kumar, M. (1998). Focusing on disability and access in the built environment. Disability & Society, 13(3), 357-374. doi: 10.1080/09687599826687
Stark, S., Hollingsworth, H. H., Morgan, K. A., & Gray, D. B. (2007). Development of a measure of receptivity of the physical environment. Disability & Rehabilitation, 29(2), 123-137.
Stark, S. & Sanford, J. (2005). Environmental enablers and their impact on occupational performance.. In C.H. Christiansen, C.M. Baum, & J. Bass-Haugen (Eds.), Occupational therapy: performance, participation, and well-being (pp. 298-331). Thorofare, NJ: SLACK Incorporated.
Vincent, G. K., Victoria, V. A. (2010). The next four decades: The older population in the United States: 2010 to 2050. Retrieved Feb 07, 2012 from http://www.census.gov/prod/2010pubs/p25-1138.pdf.
Wilcock, A. (1993). A theory of the human need for occupation. Occupational Science: Australia 1(1), 17-23.

Questions?