Assessment of Downstream Fish Community's …...2017 Assessment of Downstream Fish Community's...
44
Assessment of Downstream Fish Community's Response and Recovery from Permitted Thermal Discharges PREPARED BY Kevin Gaston Senior Environmental Manager James Stahl Technical Environmental Specialist WATERSHED ASSESSMENT and PLANNING BRANCH (WAPB) Indiana Department of Environmental Management (IDEM) Office of Water Quality (OWQ) 100 North Senate Avenue MC65-40-2 Shadeland Indianapolis, Indiana 46204-2251 June 2, 2017 B-037-OWQ-WAP-XXX-17-W-R0
Transcript of Assessment of Downstream Fish Community's …...2017 Assessment of Downstream Fish Community's...
Assessment of Downstream Fish Community's Response
and Recovery from Permitted Thermal Discharges
PREPARED BY
Kevin Gaston
Senior Environmental Manager
James Stahl
Technical Environmental Specialist
WATERSHED ASSESSMENT and PLANNING BRANCH (WAPB)
Indiana Department of Environmental Management (IDEM)
Office of Water Quality (OWQ)
100 North Senate Avenue
MC65-40-2 Shadeland
Indianapolis, Indiana 46204-2251
June 2, 2017
B-037-OWQ-WAP-XXX-17-W-R0
Assessment of Downstream Fish Community's Response and Recovery from Permitted Thermal Discharges
B-037-OWQ-WAP-XXX-17-W-R0
Date: June 2, 2017
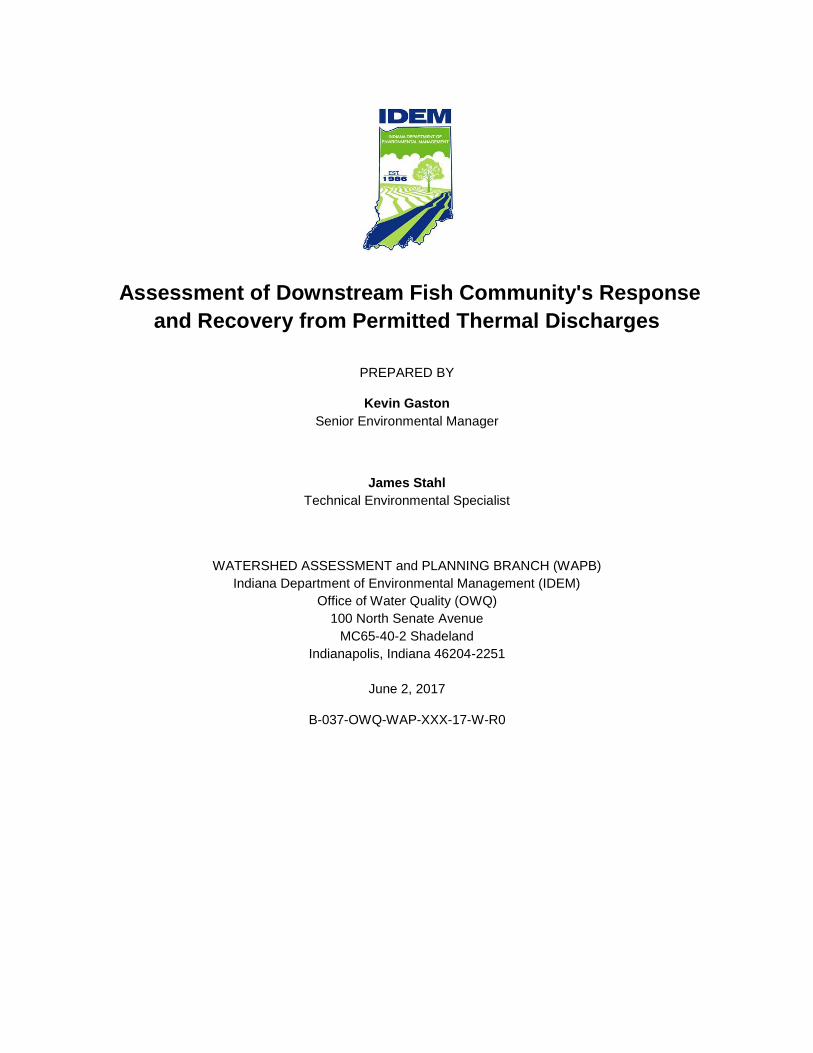
This page is intended to be blank
SIGNATURE PAGE
2017 Assessment of Downstream Fish Community's Response and Recovery from Permitted Thermal Discharges
Indiana Department of Environmental Management
Office of Water Quality Watershed Assessment & Planning Branch
Indianapolis, Indiana
B-037-OWQ-WAP-XXX-17-W-R0

2017 Assessment of Downstream Fish Community's Response and Recovery from Permitted Thermal Discharges
B-037-OWQ-WAP-XXX-17-W-R0
Date: June 2, 2017
ii

2017 Assessment of Downstream Fish Community's Response and Recovery from Permitted Thermal Discharges
B-037-OWQ-WAP-XXX-17-W-R0
Date: June 2, 2017
ii
This page is intended to be blank
2017 Assessment of Downstream Fish Community's Response and Recovery from Permitted Thermal Discharges
B-037-OWQ-WAP-XXX-17-W-R0
Date: June 2, 2017
iii
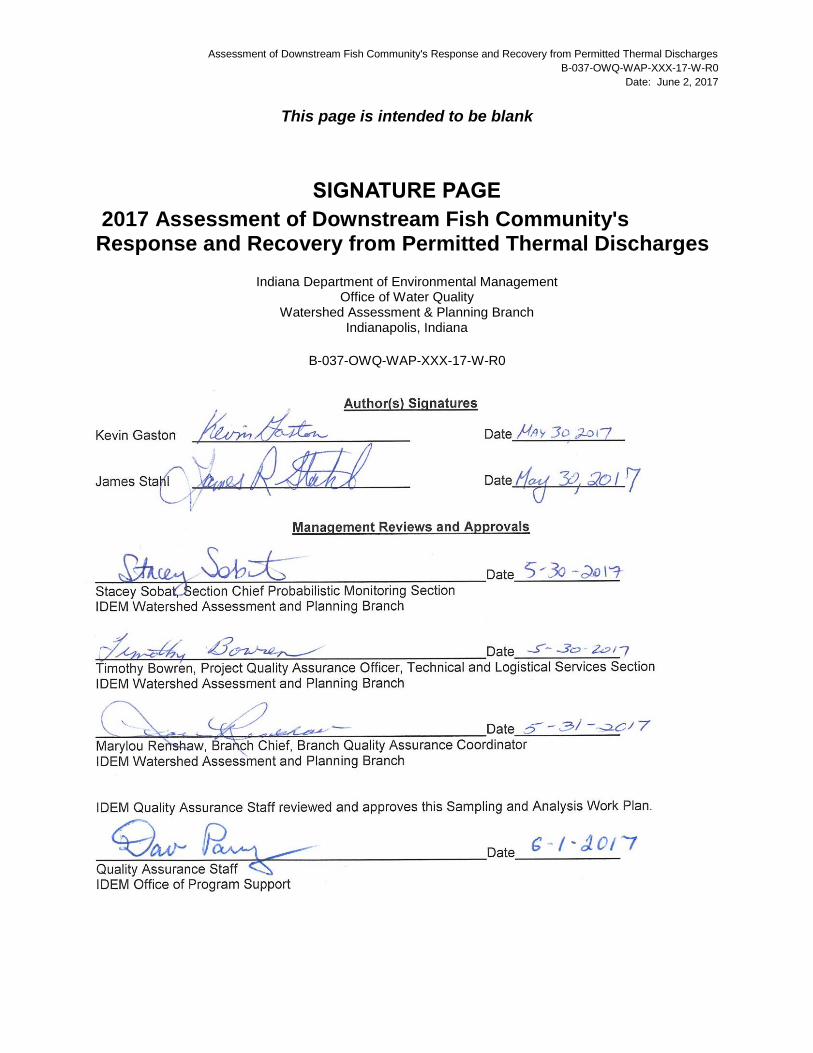
WORK PLAN ORGANIZATION
This Sampling and Analysis Work Plan is an extension of the existing Watershed Assessment and
Planning Branch, October 2004 “Quality Assurance Project Plan (QAPP) for Indiana Surface Water
Quality Monitoring and Total Maximum Daily Load (TMDL) Program” and serves as a link to the existing
QAPP as well as an independent QAPP of the project. Per the United States Environmental Protection
Agency (U.S. EPA) 2006 QAPP guidance (U.S. EPA 2006), this Work Plan establishes criteria and
specifications pertaining to a specific water quality monitoring project that are usually described in the
following four groups (phases) or sections as QAPP elements:
Section I. Project Management/Planning
Project Objective
Project/Task Organization and Schedule
Background and Project/Task Description
Data Quality Objectives (DQOs)
Training and Staffing Requirements Section II. Measurement/Data Acquisition
Sampling Procedures
Analytical Methods
Sample and Data Acquisition Requirements
Quality Control (QC) Measures Specific to the Project Section III. Assessment/Oversight
External and Internal Checks
Audits
Data Quality Assessments (DQAs)
Quality Assurance/Quality Control (QA/QC) Review Reports Section IV. Data Validation and Usability
Data Handling and associated QA/QC activities
QA/QC Review Reports

2017 Assessment of Downstream Fish Community's Response and Recovery from Permitted Thermal Discharges
B-037-OWQ-WAP-XXX-17-W-R0
Date: June 2, 2017
iv
This page is intended to be blank
2017 Assessment of Downstream Fish Community's Response and Recovery from Permitted Thermal Discharges
B-037-OWQ-WAP-XXX-17-W-R0
Date: June 2, 2017
v
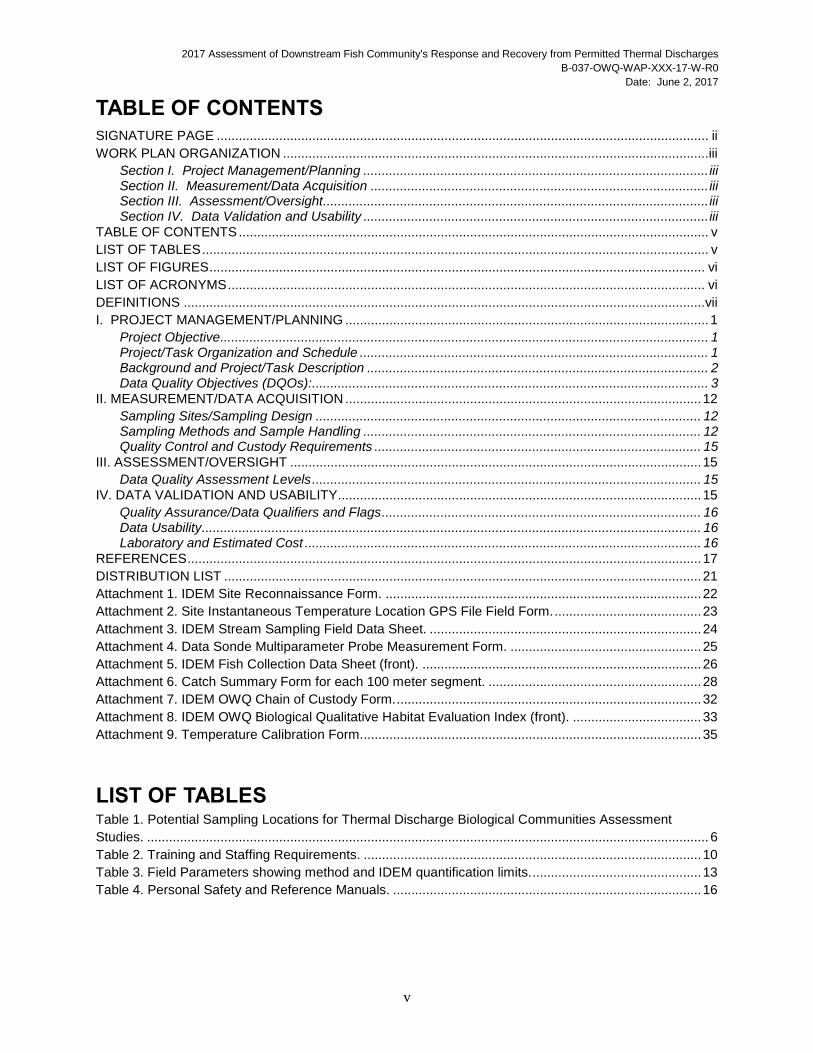
TABLE OF CONTENTS
SIGNATURE PAGE ...................................................................................................................................... ii
WORK PLAN ORGANIZATION .................................................................................................................... iii
Section I. Project Management/Planning .............................................................................................. iii Section II. Measurement/Data Acquisition ............................................................................................ iii Section III. Assessment/Oversight......................................................................................................... iii Section IV. Data Validation and Usability .............................................................................................. iii
TABLE OF CONTENTS ................................................................................................................................ v
LIST OF TABLES .......................................................................................................................................... v
LIST OF FIGURES ....................................................................................................................................... vi
LIST OF ACRONYMS .................................................................................................................................. vi
DEFINITIONS .............................................................................................................................................. vii
I. PROJECT MANAGEMENT/PLANNING ................................................................................................... 1
Project Objective..................................................................................................................................... 1 Project/Task Organization and Schedule ............................................................................................... 1 Background and Project/Task Description ............................................................................................. 2 Data Quality Objectives (DQOs): ............................................................................................................ 3
II. MEASUREMENT/DATA ACQUISITION ................................................................................................. 12
Sampling Sites/Sampling Design ......................................................................................................... 12 Sampling Methods and Sample Handling ............................................................................................ 12 Quality Control and Custody Requirements ......................................................................................... 15
III. ASSESSMENT/OVERSIGHT ................................................................................................................ 15
Data Quality Assessment Levels .......................................................................................................... 15
IV. DATA VALIDATION AND USABILITY ................................................................................................... 15
Quality Assurance/Data Qualifiers and Flags ....................................................................................... 16 Data Usability ........................................................................................................................................ 16 Laboratory and Estimated Cost ............................................................................................................ 16
REFERENCES ............................................................................................................................................ 17
DISTRIBUTION LIST .................................................................................................................................. 21
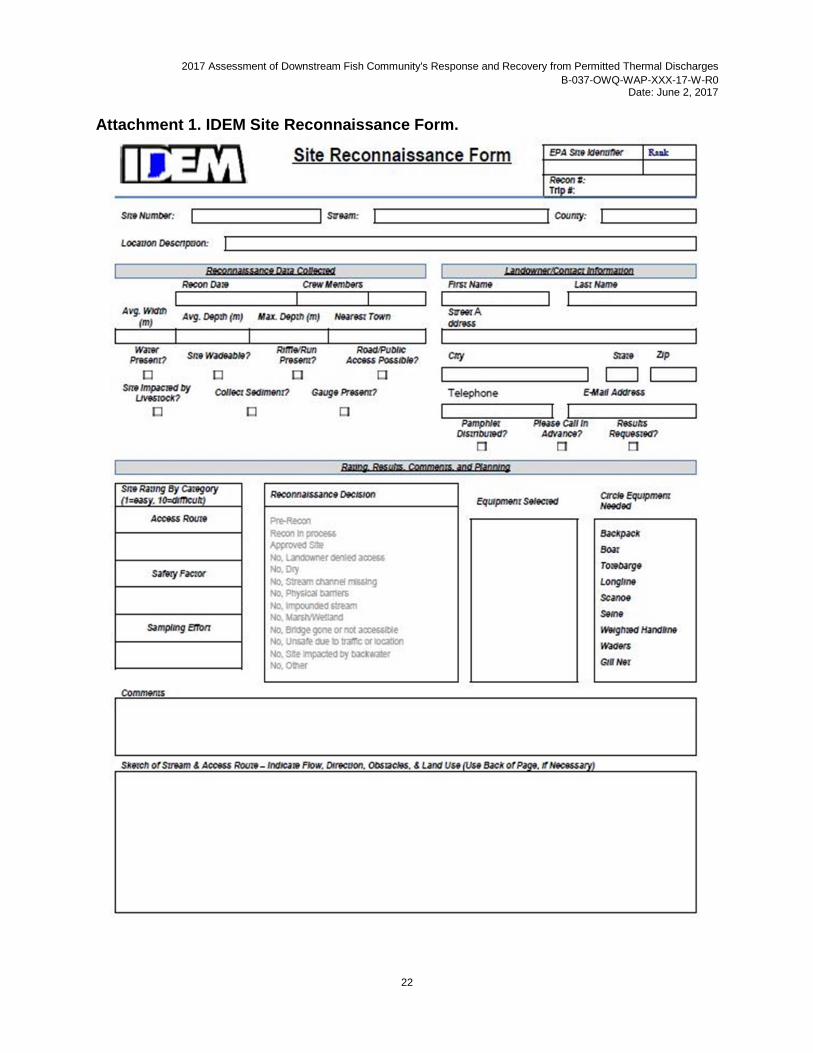
Attachment 1. IDEM Site Reconnaissance Form. ...................................................................................... 22
Attachment 2. Site Instantaneous Temperature Location GPS File Field Form. ........................................ 23
Attachment 3. IDEM Stream Sampling Field Data Sheet. .......................................................................... 24
Attachment 4. Data Sonde Multiparameter Probe Measurement Form. .................................................... 25
Attachment 5. IDEM Fish Collection Data Sheet (front). ............................................................................ 26
Attachment 6. Catch Summary Form for each 100 meter segment. .......................................................... 28
Attachment 7. IDEM OWQ Chain of Custody Form. ................................................................................... 32
Attachment 8. IDEM OWQ Biological Qualitative Habitat Evaluation Index (front). ................................... 33
Attachment 9. Temperature Calibration Form. ............................................................................................ 35
LIST OF TABLES Table 1. Potential Sampling Locations for Thermal Discharge Biological Communities Assessment
Studies. ......................................................................................................................................................... 6
Table 2. Training and Staffing Requirements. ............................................................................................ 10
Table 3. Field Parameters showing method and IDEM quantification limits. .............................................. 13
Table 4. Personal Safety and Reference Manuals. .................................................................................... 16
2017 Assessment of Downstream Fish Community's Response and Recovery from Permitted Thermal Discharges
B-037-OWQ-WAP-XXX-17-W-R0
Date: June 2, 2017
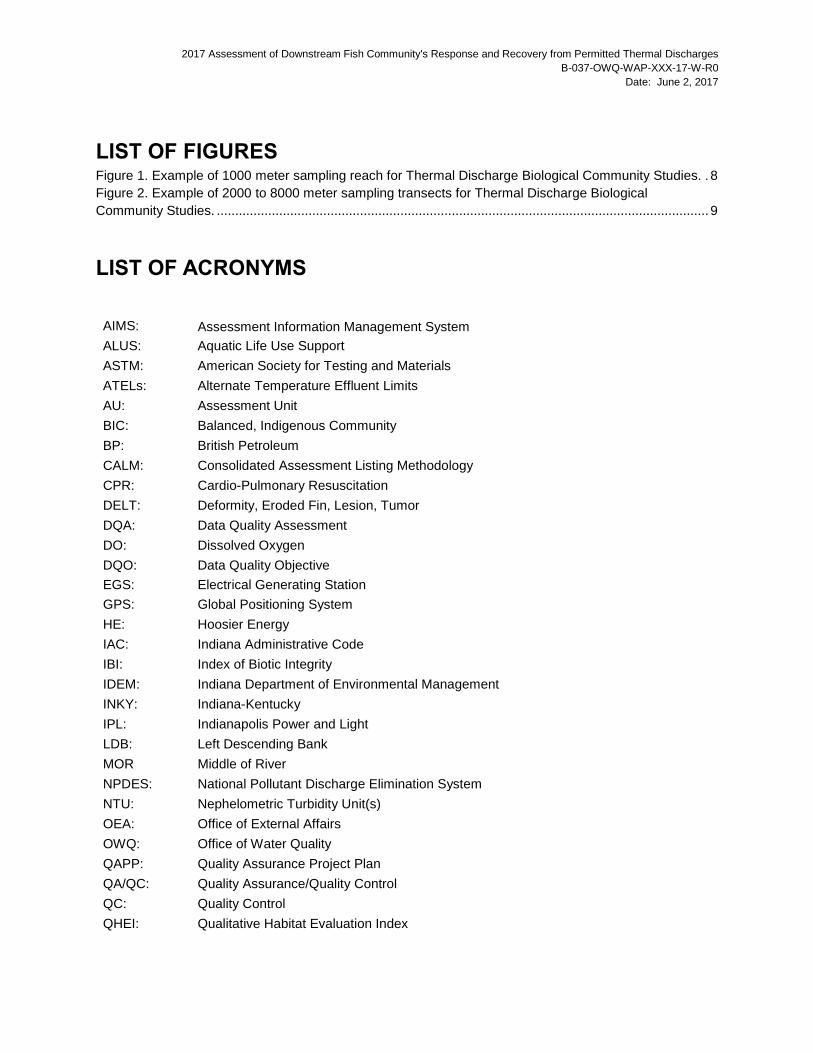
LIST OF FIGURES Figure 1. Example of 1000 meter sampling reach for Thermal Discharge Biological Community Studies. . 8
Figure 2. Example of 2000 to 8000 meter sampling transects for Thermal Discharge Biological
Community Studies. ...................................................................................................................................... 9
LIST OF ACRONYMS
AIMS: Assessment Information Management System
ALUS: Aquatic Life Use Support
ASTM: American Society for Testing and Materials
ATELs: Alternate Temperature Effluent Limits
AU: Assessment Unit
BIC: Balanced, Indigenous Community
BP: British Petroleum
CALM: Consolidated Assessment Listing Methodology
CPR: Cardio-Pulmonary Resuscitation
DELT: Deformity, Eroded Fin, Lesion, Tumor
DQA: Data Quality Assessment
DO: Dissolved Oxygen
DQO: Data Quality Objective
EGS: Electrical Generating Station
GPS: Global Positioning System
HE: Hoosier Energy
IAC: Indiana Administrative Code
IBI: Index of Biotic Integrity
IDEM: Indiana Department of Environmental Management
INKY: Indiana-Kentucky
IPL: Indianapolis Power and Light
LDB: Left Descending Bank
MOR Middle of River
NPDES: National Pollutant Discharge Elimination System
NTU: Nephelometric Turbidity Unit(s)
OEA: Office of External Affairs
OWQ: Office of Water Quality
QAPP: Quality Assurance Project Plan
QA/QC: Quality Assurance/Quality Control
QC: Quality Control
QHEI: Qualitative Habitat Evaluation Index
2017 Assessment of Downstream Fish Community's Response and Recovery from Permitted Thermal Discharges
B-037-OWQ-WAP-XXX-17-W-R0
Date: June 2, 2017
i
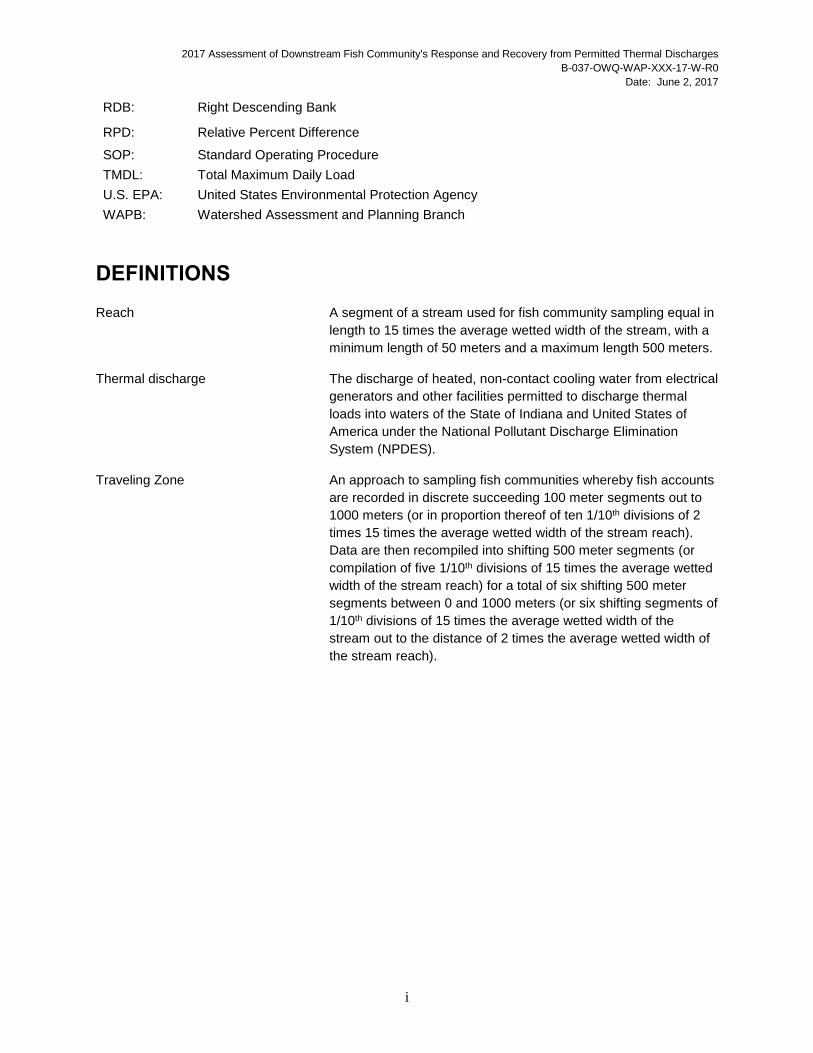
RDB: Right Descending Bank
RPD: Relative Percent Difference
SOP: Standard Operating Procedure
TMDL: Total Maximum Daily Load
U.S. EPA: United States Environmental Protection Agency
WAPB: Watershed Assessment and Planning Branch
DEFINITIONS Reach A segment of a stream used for fish community sampling equal in
length to 15 times the average wetted width of the stream, with a
minimum length of 50 meters and a maximum length 500 meters.
Thermal discharge The discharge of heated, non-contact cooling water from electrical
generators and other facilities permitted to discharge thermal
loads into waters of the State of Indiana and United States of
America under the National Pollutant Discharge Elimination
System (NPDES).
Traveling Zone An approach to sampling fish communities whereby fish accounts
are recorded in discrete succeeding 100 meter segments out to
1000 meters (or in proportion thereof of ten 1/10th divisions of 2
times 15 times the average wetted width of the stream reach).
Data are then recompiled into shifting 500 meter segments (or
compilation of five 1/10th divisions of 15 times the average wetted
width of the stream reach) for a total of six shifting 500 meter
segments between 0 and 1000 meters (or six shifting segments of
1/10th divisions of 15 times the average wetted width of the
stream out to the distance of 2 times the average wetted width of
the stream reach).
2017 Assessment of Downstream Fish Community's Response and Recovery from Permitted Thermal Discharges
B-037-OWQ-WAP-XXX-17-W-R0
Date: June 2, 2017
1
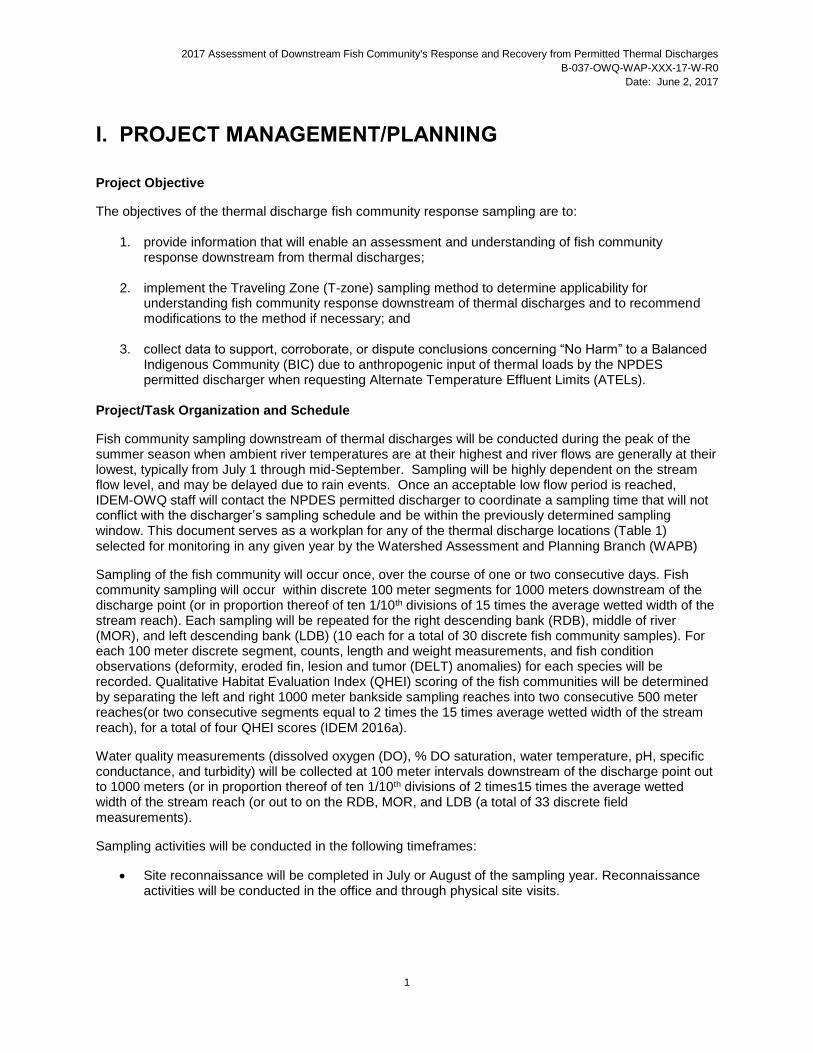
I. PROJECT MANAGEMENT/PLANNING Project Objective
The objectives of the thermal discharge fish community response sampling are to:
1. provide information that will enable an assessment and understanding of fish community response downstream from thermal discharges;
2. implement the Traveling Zone (T-zone) sampling method to determine applicability for understanding fish community response downstream of thermal discharges and to recommend modifications to the method if necessary; and
3. collect data to support, corroborate, or dispute conclusions concerning “No Harm” to a Balanced Indigenous Community (BIC) due to anthropogenic input of thermal loads by the NPDES permitted discharger when requesting Alternate Temperature Effluent Limits (ATELs).
Project/Task Organization and Schedule
Fish community sampling downstream of thermal discharges will be conducted during the peak of the summer season when ambient river temperatures are at their highest and river flows are generally at their lowest, typically from July 1 through mid-September. Sampling will be highly dependent on the stream flow level, and may be delayed due to rain events. Once an acceptable low flow period is reached, IDEM-OWQ staff will contact the NPDES permitted discharger to coordinate a sampling time that will not conflict with the discharger’s sampling schedule and be within the previously determined sampling window. This document serves as a workplan for any of the thermal discharge locations (Table 1) selected for monitoring in any given year by the Watershed Assessment and Planning Branch (WAPB)
Sampling of the fish community will occur once, over the course of one or two consecutive days. Fish community sampling will occur within discrete 100 meter segments for 1000 meters downstream of the discharge point (or in proportion thereof of ten 1/10th divisions of 15 times the average wetted width of the stream reach). Each sampling will be repeated for the right descending bank (RDB), middle of river (MOR), and left descending bank (LDB) (10 each for a total of 30 discrete fish community samples). For each 100 meter discrete segment, counts, length and weight measurements, and fish condition observations (deformity, eroded fin, lesion and tumor (DELT) anomalies) for each species will be recorded. Qualitative Habitat Evaluation Index (QHEI) scoring of the fish communities will be determined by separating the left and right 1000 meter bankside sampling reaches into two consecutive 500 meter reaches(or two consecutive segments equal to 2 times the 15 times average wetted width of the stream reach), for a total of four QHEI scores (IDEM 2016a).
Water quality measurements (dissolved oxygen (DO), % DO saturation, water temperature, pH, specific conductance, and turbidity) will be collected at 100 meter intervals downstream of the discharge point out to 1000 meters (or in proportion thereof of ten 1/10th divisions of 2 times15 times the average wetted width of the stream reach (or out to on the RDB, MOR, and LDB (a total of 33 discrete field measurements).
Sampling activities will be conducted in the following timeframes:
Site reconnaissance will be completed in July or August of the sampling year. Reconnaissance activities will be conducted in the office and through physical site visits.
2017 Assessment of Downstream Fish Community's Response and Recovery from Permitted Thermal Discharges
B-037-OWQ-WAP-XXX-17-W-R0
Date: June 2, 2017
2
Fish community sampling will be scheduled during the month of July, August or September, at up to three electricity generating stations per year, depending on OWQ Permits Branch requests, flow conditions, and IDEM-OWQ staff availability.
Chemical measurements and habitat evaluations will be completed during fish community sampling events.
Background and Project/Task Description
The objective of assessing point source discharge thermal plumes is to determine if impairments are occurring to the biological indicators that have been specifically designed to measure various rivers/streams, lakes, and Lake Michigan nearshore systems. This project will document the current downstream discharge conditions, determine zones of recovery of biological communities, and establish the instantaneous pattern of the outfall discharge plume. An accepted method of determining the effect of an outfall on a stream is to compare biological community assemblage information of the impacted area to an upstream, “control” site. This method can work well and can be very effective in determining the extent of impairment, but it also has several drawbacks that researchers must account for. Primarily, the upstream site must reflect unimpaired study area conditions. Researchers should consider the importance of changes in microhabitat features (i.e., substrate type, depth, stream morphology) within the study area and the upstream reference area, and account for this variability by conducting a detailed examination of the microhabitats of the outfall zone and carefully matching these conditions as closely as possible. However, based on the requirements of 316(a) (U.S. EPA 1977), it is not necessary to evaluate or match upstream locations since reference conditions have already been established for the main stem rivers/streams and inland lakes through the Index of Biotic Integrity (IBI) calibrations (and ORFin for the main stem Ohio River) (Emery and Thomas 2003; Emery et al. 2003b; Simon 1991, 1992, 1994, 1997, 1998a, 1998b, 1998c, 2001, 2004a, 2004b, 2006; Simon and Stahl 1998; Simon and Dufour 2005). Another, limitation of the upstream/downstream comparison method is the occurrence of multiple impairments within a given stream reach. It is often difficult, particularly in large and great rivers, to find an upstream reference site that matches the habitat of a study area, yet is not impacted by another outfall (Dufour et al. 2003). It is common also for the study area itself to be impacted by multiple dischargers (Emery et al. 2003a). Isolating the effect of one particular effluent in an area where several outfalls can sometimes be found within a 500 m segment of a great river can be very difficult using a typical upstream/downstream study. However, using the Traveling-zone (T-zone) method it is possible to detect change in the biological community at the site of each impairment (Emery and Thomas 2003). The T-zone procedure applies to all sites that will be sampled for fish communities for assessing thermal discharges in large and great rivers, lake shorelines, and Lake Michigan nearshore sites. This electrofishing method can be applied for assessing any type of discharge, assuming that the thermal plume characteristics of the stream can be determined by an instantaneous measure, or the stream width is not of sufficient size to warrant differences along different shores. If shoreline differences are suspected (such as temperature) but immeasurable using an instantaneous measurement device, then both shores can be sampled. The T-zone procedure must be implemented with an instantaneous measure of temperature taken immediately prior to sampling and a Qualitative Habitat Evaluation Index (QHEI) data sheet, filled out for each 500 meter reach (or reach distance of 15 times the average wetted width of the stream reach) for an assessment of thermal discharges. For the purpose of this work plan, both shore lines and the middle of the river will be sampled. When properly applied, electrofishing consistently catches more species and individuals in less time and effort than other sampling methods used. It is a widely used method for assessing fish community assemblage and is the standard method by which IDEM’s multi-metric IBI is calibrated, and by which aquatic life use support (ALUS) based on fish community structure is assessed. It is the only fish
2017 Assessment of Downstream Fish Community's Response and Recovery from Permitted Thermal Discharges
B-037-OWQ-WAP-XXX-17-W-R0
Date: June 2, 2017
3
community sampling method that can be used under all habitat conditions thus yielding a database that is easily comparable (in terms of catch/effort) under the variable conditions encountered. All fish collected will be identified to species, enumerated, weighed, measured for total length, examined for external anomalies (DELTS), and either returned to the waterbody or preserved as voucher specimens. Data Quality Objectives (DQOs):
The Data Quality Objective (DQO) process (U.S. EPA 2006) is a planning tool for data collection activities. The DQO for the Characterization and Assessment of Fish Community Response and Recovery Downstream from Permitted Thermal Discharge Points Project is identified in the following seven steps:
1. State the Problem The state needs to establish a demonstrably safe limit on allowable thermal discharges with a confidence interval/margin of error that will reliably protect stream habitats and fish populations from either longer term and/or acute adverse impacts to those habitats and fish, in a manner consistent with maintaining fishable state waters. Determination of “No Harm” to Balanced, Indigenous Community (BIC): Sampling will be conducted on up to three (3) sites per year for fish community on large Indiana rivers, downstream of NPDES permitted non-contact cooling water thermal discharges in order to:
1). test and refine sampling methods; 2). collect data on biological community response and recovery moving downstream from the discharge point of the non-contact cooling water; and 3). as added information for the determination of “No Harm” to BIC.
Assessments: Indiana is required to assess all waters of the state to determine their designated use attainment status. “Surface waters of the state are designated for full-body contact recreation” and “will be capable of supporting” a “well-balanced, warm water aquatic community” [327 Indiana Administrative Code (IAC) 2-1-3]. This project will gather physical field parameters (water temperatures, dissolved oxygen, and other characteristics), chemical, fish community, , and habitat data for the purpose of assessing the designated use attainment status of the assessment unit (AU) adjacent to or downstream of NPDES cooling water thermal discharges.
2. Identify the Decision
The main objective of this study is to reliably measuring the natural rate of decay of thermal plumes created by point source discharges during those generally annual periods of highest ambient water temperature and lowest flow level (stream volume) through the concurrent measurement of chemical and physical stream characters and an evaluation, through the use of the IBI, of the stress placed on the biological characteristics of the impacted stream segments and fish present with it. The resulting information will help with establishing limitations on future such thermal loading consistent with thestandard of no harm to BIC. Determinations of no harm, with an adequate margin of error, will indicate acceptable thermal loading limits. This will be done by:
1). assess the recommended fish community assessment method listed in the “Guidance for Conducting a Demonstration as a Requirement of a 316(a) Alternative Thermal Effluent Limitation Request” (IDEM 2014); 2). make recommendations for method modification (if necessary); 3). gain understanding of biological community response to thermal inputs and their longitudinal recovery and
4). obtain supporting information on “No Harm” to the BIC. The sites listed in Table 1 could
potentially be sampled for fish community structure.
Biological Criteria: Indiana narrative biological criteria [327 IAC 2-1-3] states that “all waters, except as described in subdivision (5),” (i.e., limited use waters) “will be capable of supporting” a “well-balanced, warm water
2017 Assessment of Downstream Fish Community's Response and Recovery from Permitted Thermal Discharges
B-037-OWQ-WAP-XXX-17-W-R0
Date: June 2, 2017
4
aquatic community”. The water quality standard definition of a “well-balanced aquatic community” is “an aquatic community that: (A) is diverse in species composition; (B) contains several different trophic levels; and (C) is not composed mainly of pollution tolerant species” [327 IAC 2-1-9]. An interpretation or translation of narrative biological criteria into numeric criteria would be as follows: A stream segment is non-supporting for aquatic life use when the monitored fish community receives an IBI score of less than 36 (on a scale of 0-60) which is considered “Poor” or “Very Poor” (IDEM 2016b).
Fish data collected during these studies will be considered for inclusion in the 2020 update of Indiana’s Integrated Water Monitoring and Assessment Report to U.S. EPA. Site specific data will be used to classify associated assessment units (AU) into one of five major categories in the State’s Consolidated List, category definitions are available in the Integrated Report (IDEM 2016b, p. 65).
3. Identify the Inputs to the Decision
Biological community sampling (fish community), instantaneous field parameter (DO, % DO Saturation, Water Temperature, pH, Specific Conductance, and Turbidity) data collection, and QHEI scoring will occur as one-time sampling events at the potential locations listed in Table 1. Collection procedures for field measurements, biological, and habitat data will be described in detail under Section II. MEASUREMENT/DATA ACQUISITION.
2017 Assessment of Downstream Fish Community's Response and Recovery from Permitted Thermal Discharges
B-037-OWQ-WAP-XXX-17-W-R0
Date: June 2, 2017
5
4. Define the Boundaries of the Study
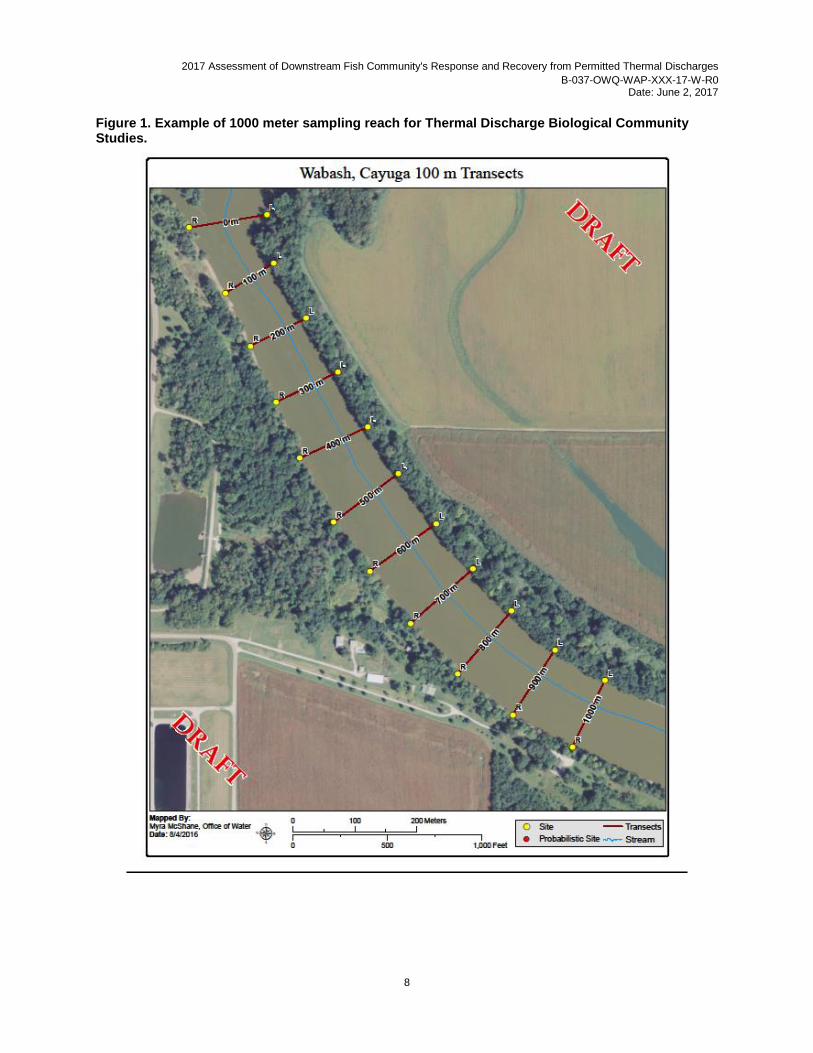
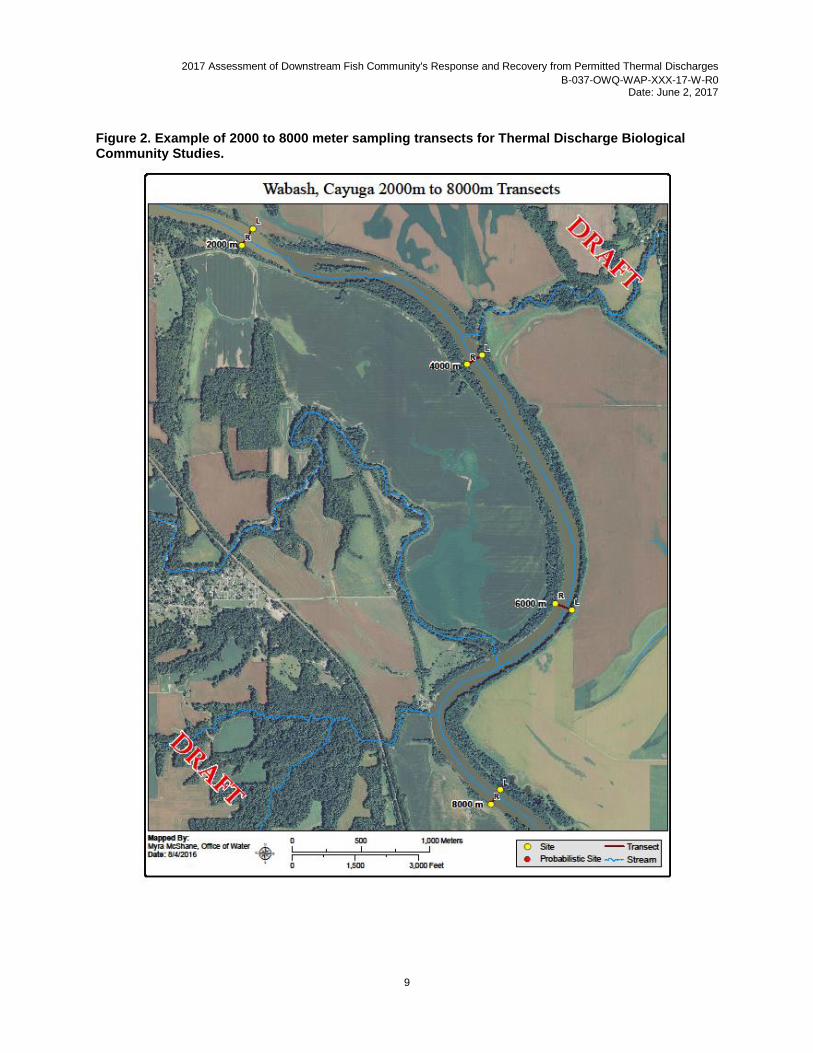
See Table 1 for the list of potential sampling locations. See Figures 1 and 2 for detailed maps of what a representative sampling reach may look like. Overall, any permitted Electrical Generating Station (EGS) within the political boundary of the state of Indiana that discharges into state waters is subject to thermal and biological sampling.
5. Develop a Decision Rule
Water quality field measurements (DO, % DO Saturation, Water Temperature, pH, Specific Conductance, and Turbidity) along tri-section transects (right descending bank (RDB), middle of river (MOR), left descending bank (LDB)) will be collected at 100 meter intervals downstream (or proportion of 1/10th the average wetted width of the stream reach) of the discharge point out to 1000 meters (or out to 2 times 15 times the average wetted width of the stream reach). For assessment purposes, this information will be used to create two dimensional maps to characterize the thermal plume as it moves downstream and distributes. Fish community census will occur in discrete 100 meter segments up to 1000 meters (or discrete segments of 1/10th the distance of 2 times 15 times the average wetted width of the stream reach) downstream from the point of thermal discharge for the LDB, MOR, and RDB of the river.
For assessment purposes, the fish assemblage will be evaluated at each site using the appropriate IBI (Emery and Thomas 2003; Emery et al. 2003b; Simon 1991, 1992, 1994, 1997, 1998a, 1998b, 1998c, 2001, 2004a, 2004b, 2006; Simon and Stahl 1998; Simon and Dufour 2005). IBI scoring for fish communities will be determined by separating the left and right 1000 meter bankside sampling reaches (or reaches of 2 times 15 times the average wetted width of the stream reach) into two consecutive 500 meter reaches (or consecutive reaches of 15 times the average wetted width of the stream reach), for a total of two IBI scores. Specifically, a 500 meter reach site (or reach of 15 times the average wetted width of the stream reach) will be considered non-supporting for aquatic life use when IBI scores are less than 36 for fish community.
6. Specify Tolerable Limits on Decision Errors Good quality data are essential for minimizing decision error. By minimizing errors in the sampling design, measurement, and laboratory for physical, chemical, and biological parameters more confidence can be placed in aquatic life use assessments.
Site specific aquatic life use assessments include program specific controls to minimize the introduction of errors. These controls include data sonde calibrations, field equipment checks, biological site revisits or duplicates, and laboratory controls through verification of species identifications as described in Field Procedure Manuals (IDEM 2002; IDEM 2016a) and Standard Operating Procedures (SOPs, IDEM 1992a, 1992b, 1992c, 1992d, 1992e).
The QA/QC process detects deficiencies in the data collection as set forth in the IDEM QAPP for the Indiana Surface Water Quality Monitoring Program (IDEM 2017). Precision and accuracy goals with acceptance limits for applicable field measurements are provided in the QAPP, Table B2-2: Field Parameters page 81. Criteria for acceptance or rejection of results as well as application of data quality flags is presented in the WAPB QAPP (IDEM 2017). Field techniques used during sample collection, along with laboratory procedures will be subject to periodic evaluation by both WAPB QA and field staff.
7. Optimize the Design for Obtaining Data
Sampling locations in this project have been selected based on the locations of the permitted Electrical Generating Stations (EGSs). As these plants are continually upgrading their technology or being shut down, our sampling location priority could change within a few weeks of actual sampling events. It is pertinent for IDEM-OWQ staff to have the flexibility to adjust our sampling locations based on information gained from the EGSs.
2017 Assessment of Downstream Fish Community's Response and Recovery from Permitted Thermal Discharges
B-037-OWQ-WAP-XXX-17-W-R0
Date: June 2, 2017
6
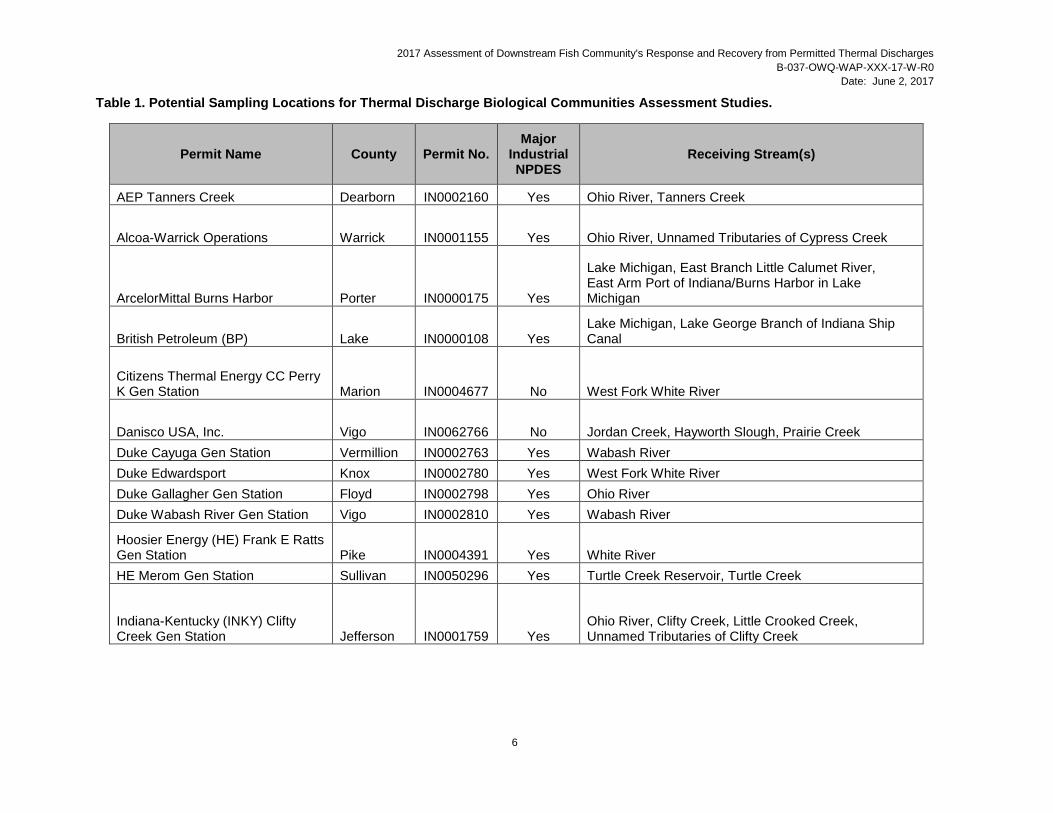
Table 1. Potential Sampling Locations for Thermal Discharge Biological Communities Assessment Studies.
Permit Name County Permit No. Major
Industrial NPDES
Receiving Stream(s)
AEP Tanners Creek Dearborn IN0002160 Yes Ohio River, Tanners Creek
Alcoa-Warrick Operations Warrick IN0001155 Yes Ohio River, Unnamed Tributaries of Cypress Creek
ArcelorMittal Burns Harbor Porter IN0000175 Yes
Lake Michigan, East Branch Little Calumet River, East Arm Port of Indiana/Burns Harbor in Lake Michigan
British Petroleum (BP) Lake IN0000108 Yes Lake Michigan, Lake George Branch of Indiana Ship Canal
Citizens Thermal Energy CC Perry K Gen Station Marion IN0004677 No West Fork White River
Danisco USA, Inc. Vigo IN0062766 No Jordan Creek, Hayworth Slough, Prairie Creek
Duke Cayuga Gen Station Vermillion IN0002763 Yes Wabash River
Duke Edwardsport Knox IN0002780 Yes West Fork White River
Duke Gallagher Gen Station Floyd IN0002798 Yes Ohio River
Duke Wabash River Gen Station Vigo IN0002810 Yes Wabash River
Hoosier Energy (HE) Frank E Ratts Gen Station Pike IN0004391 Yes White River
HE Merom Gen Station Sullivan IN0050296 Yes Turtle Creek Reservoir, Turtle Creek
Indiana-Kentucky (INKY) Clifty Creek Gen Station Jefferson IN0001759 Yes
Ohio River, Clifty Creek, Little Crooked Creek, Unnamed Tributaries of Clifty Creek
2017 Assessment of Downstream Fish Community's Response and Recovery from Permitted Thermal Discharges
B-037-OWQ-WAP-XXX-17-W-R0
Date: June 2, 2017
7
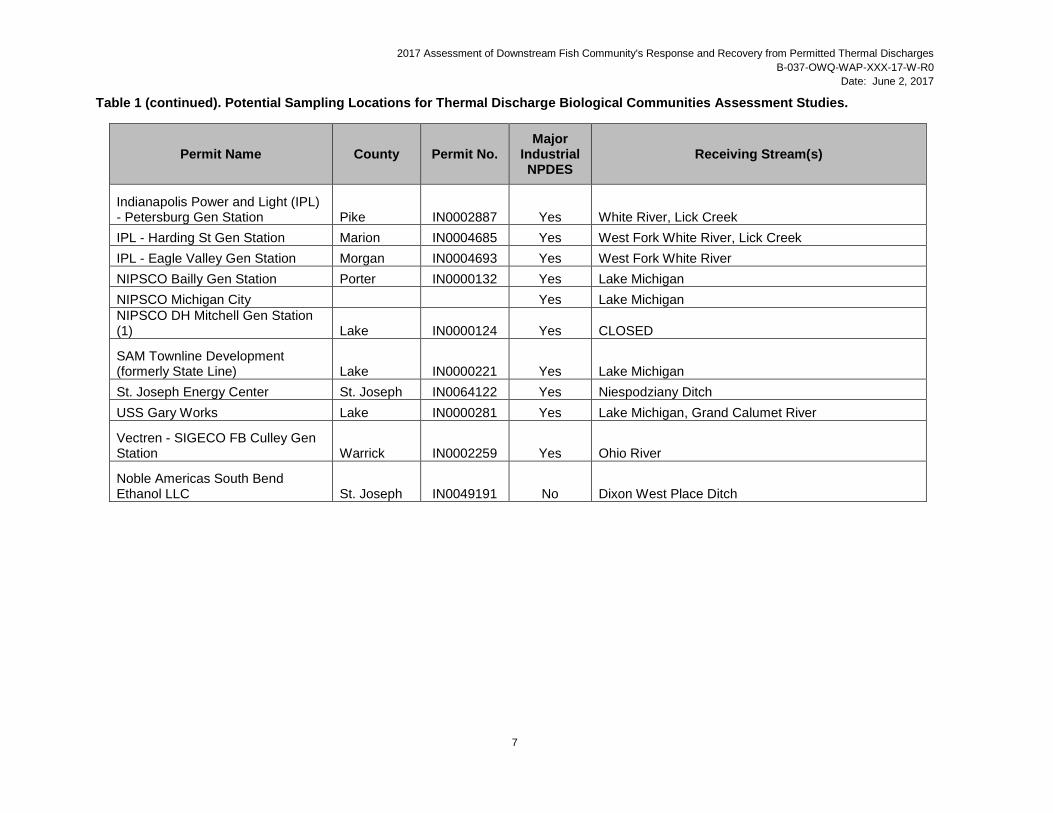
Table 1 (continued). Potential Sampling Locations for Thermal Discharge Biological Communities Assessment Studies.
Permit Name County Permit No. Major
Industrial NPDES
Receiving Stream(s)
Indianapolis Power and Light (IPL) - Petersburg Gen Station Pike IN0002887 Yes White River, Lick Creek
IPL - Harding St Gen Station Marion IN0004685 Yes West Fork White River, Lick Creek
IPL - Eagle Valley Gen Station Morgan IN0004693 Yes West Fork White River
NIPSCO Bailly Gen Station Porter IN0000132 Yes Lake Michigan
NIPSCO Michigan City Yes Lake Michigan
NIPSCO DH Mitchell Gen Station (1) Lake IN0000124 Yes CLOSED
SAM Townline Development (formerly State Line) Lake IN0000221 Yes Lake Michigan
St. Joseph Energy Center St. Joseph IN0064122 Yes Niespodziany Ditch
USS Gary Works Lake IN0000281 Yes Lake Michigan, Grand Calumet River
Vectren - SIGECO FB Culley Gen Station Warrick IN0002259 Yes Ohio River
Noble Americas South Bend Ethanol LLC St. Joseph IN0049191 No Dixon West Place Ditch
2017 Assessment of Downstream Fish Community's Response and Recovery from Permitted Thermal Discharges
B-037-OWQ-WAP-XXX-17-W-R0 Date: June 2, 2017
8
Figure 1. Example of 1000 meter sampling reach for Thermal Discharge Biological Community Studies.
2017 Assessment of Downstream Fish Community's Response and Recovery from Permitted Thermal Discharges
B-037-OWQ-WAP-XXX-17-W-R0 Date: June 2, 2017
9
Figure 2. Example of 2000 to 8000 meter sampling transects for Thermal Discharge Biological Community Studies.
2017 Assessment of Downstream Fish Community's Response and Recovery from Permitted Thermal Discharges
B-037-OWQ-WAP-XXX-17-W-R0 Date: June 2, 2017
10
Table 2. Training and Staffing Requirements.
Role Required Training/Experience
Responsibilities Training References
Project Manager -Bachelor of Science Degree in biology or closely related area plus four years’ experience in aquatic ecosystems (Master’s Degree with two years aquatic ecosystems experience may substitute) - Database experience - Demonstrated experience in project management and QA/QC procedures
-Establish Project in the Assessment Information Management System (AIMS) II database -Oversee development of Project Work Plan -Oversee entry and QC of field data -Querying data from AIMS II to determine results not meeting Water Quality Criteria
-AIMS II Database User Guide -U.S. EPA 2006 Quality Assurance (QA) Documents on developing Work Plans(QAPPs)
Field Crew Chief- Biological Community Sampling
-Bachelor of Science Degree in biology or other closely related area - At least one year of experience in sampling methodology and taxonomy of aquatic communities in the region -Annually review the Principles and Techniques of Electrofishing -Annually review relevant safety procedures -Annually review relevant SOP documents for field operations
-Completion of field data sheets -Taxonomic accuracy -Sampling efficiency and representation -Voucher specimen tracking -Overall operation of the field crew when remote from central office -Adherence to safety and field SOP procedures by crew members -Ensure that multi-probe analyzers are calibrated weekly prior to field sampling activities -Ensure that field sampling equipment is functioning properly and loaded into field vehicles prior to field sampling activities
-Barbour et al. 1999 -Hydrolab Corporation 2002 -IDEM 1992a, 1992b, 1992c, 1992d, 1992e, 2002, 2010a, 2010b, 2015, 2016a -Simon 2006 -Simon and Dufour 2005 -U.S. EPA 1995 -YSI 2002
Field Crew members- Biological Community Sampling
-Complete hands-on training for sampling methodology prior to participation in field sampling activities -Review the Principles and Techniques of Electrofishing -Review relevant safety procedures -Review relevant SOP documents for field operations
-Follow all safety and SOP procedures while engaged in field sampling activities -Follow direction of Field Crew Chief while engaged in field sampling activities
-Barbour et al. 1999 -Hydrolab Corporation 2002 -IDEM 1992a, 1992b, 1992c, 1992d, 1992e, 2002, 2010a, 2010b, 2015, 2016a -U.S. EPA 1995 -YSI 2002
Laboratory Supervisor Biological Community
-Bachelor of Science Degree in biology or other closely related area -At least one year of
-Identification of fish specimens collected during field sampling -Completion of laboratory
-IDEM 1992a, 1992e, 2004, 2010a, 2010b -AIMS II Database User Guide
2017 Assessment of Downstream Fish Community's Response and Recovery from Permitted Thermal Discharges
B-037-OWQ-WAP-XXX-17-W-R0 Date: June 2, 2017
11
Role Required Training/Experience
Responsibilities Training References
Sample Processing
experience in taxonomy of aquatic communities in the region -Annually review relevant safety procedures -Annually review relevant SOP documents for laboratory operations
data sheets -Verify taxonomic accuracy of processed samples -Voucher specimen tracking -Adherence to safety and SOP procedures by laboratory staff -Check data for completeness -Perform all necessary calculations on the data -Ensure that data are entered into the AIMS Data Base -Ensure that required QA/QC are performed on the data -Querying data from AIMS II to determine results not meeting Water Quality Criteria
Laboratory Staff – Biological Community Sample Processing
-Complete hands-on training for laboratory sample processing methodology prior to participation in laboratory sample processing activities -Annually review relevant safety procedures -Annually review relevant SOP documents for laboratory operations
-Adhere to safety and SOP procedures -Follow Laboratory Supervisor direction while processing samples -Identification of fish specimens collected during field sampling -Completion of laboratory data sheets, perform necessary calculations on data, enter field sheets
-IDEM 1992a, 1992e, 2004, 2010a, 2010b -AIMS II Database User Guide
Quality Assurance Officer
-Bachelor of Science in chemistry or a related field of study -Familiarity with QA/QC practices and methodologies -Familiarity with the WAPB QAPP and data qualification methodologies
-Ensure adherence to QA/QC requirements of WAPB QAPP -Evaluate data collected by sampling crews for adherence to project work plan -Review data collected by field sampling crews for completeness and accuracy -Perform a data quality analysis of data generated by the project - Assign data quality levels based on the data quality
-IDEM 2017 -U.S. EPA 2006 documentation on QAPP development and data qualification -AIMS II Database User Guide
2017 Assessment of Downstream Fish Community's Response and Recovery from Permitted Thermal Discharges
B-037-OWQ-WAP-XXX-17-W-R0 Date: June 2, 2017
12
Role Required Training/Experience
Responsibilities Training References
analysis -Import data into the AIMS data base -Ensure that field sampling methodology audits are completed according to WAPB procedures
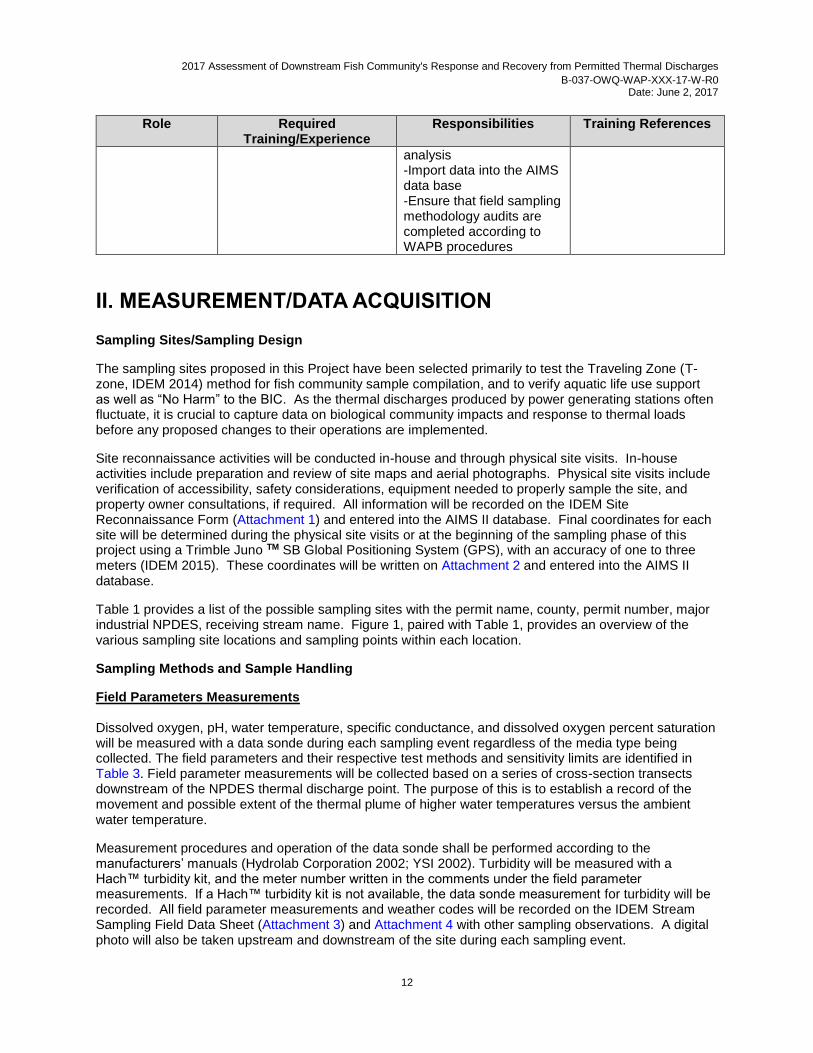
II. MEASUREMENT/DATA ACQUISITION Sampling Sites/Sampling Design
The sampling sites proposed in this Project have been selected primarily to test the Traveling Zone (T-zone, IDEM 2014) method for fish community sample compilation, and to verify aquatic life use support as well as “No Harm” to the BIC. As the thermal discharges produced by power generating stations often fluctuate, it is crucial to capture data on biological community impacts and response to thermal loads before any proposed changes to their operations are implemented.
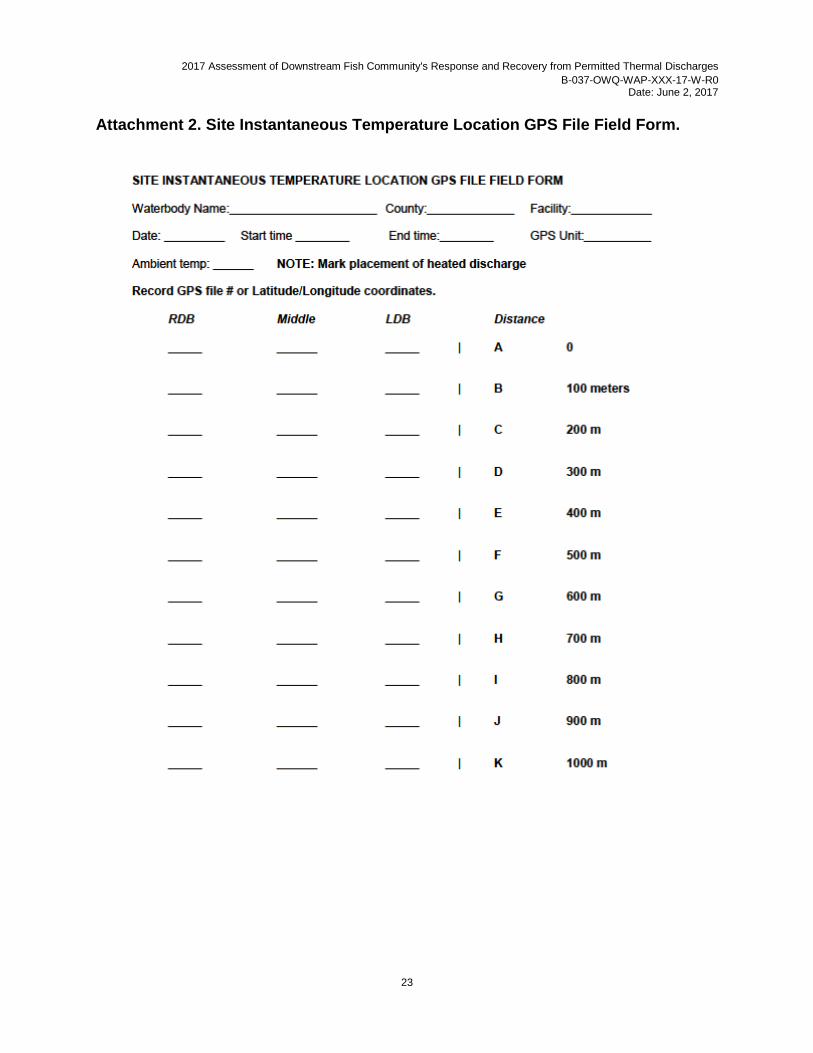
Site reconnaissance activities will be conducted in-house and through physical site visits. In-house activities include preparation and review of site maps and aerial photographs. Physical site visits include verification of accessibility, safety considerations, equipment needed to properly sample the site, and property owner consultations, if required. All information will be recorded on the IDEM Site Reconnaissance Form (Attachment 1) and entered into the AIMS II database. Final coordinates for each site will be determined during the physical site visits or at the beginning of the sampling phase of this project using a Trimble Juno TM SB Global Positioning System (GPS), with an accuracy of one to three meters (IDEM 2015). These coordinates will be written on Attachment 2 and entered into the AIMS II database.
Table 1 provides a list of the possible sampling sites with the permit name, county, permit number, major industrial NPDES, receiving stream name. Figure 1, paired with Table 1, provides an overview of the various sampling site locations and sampling points within each location.
Sampling Methods and Sample Handling
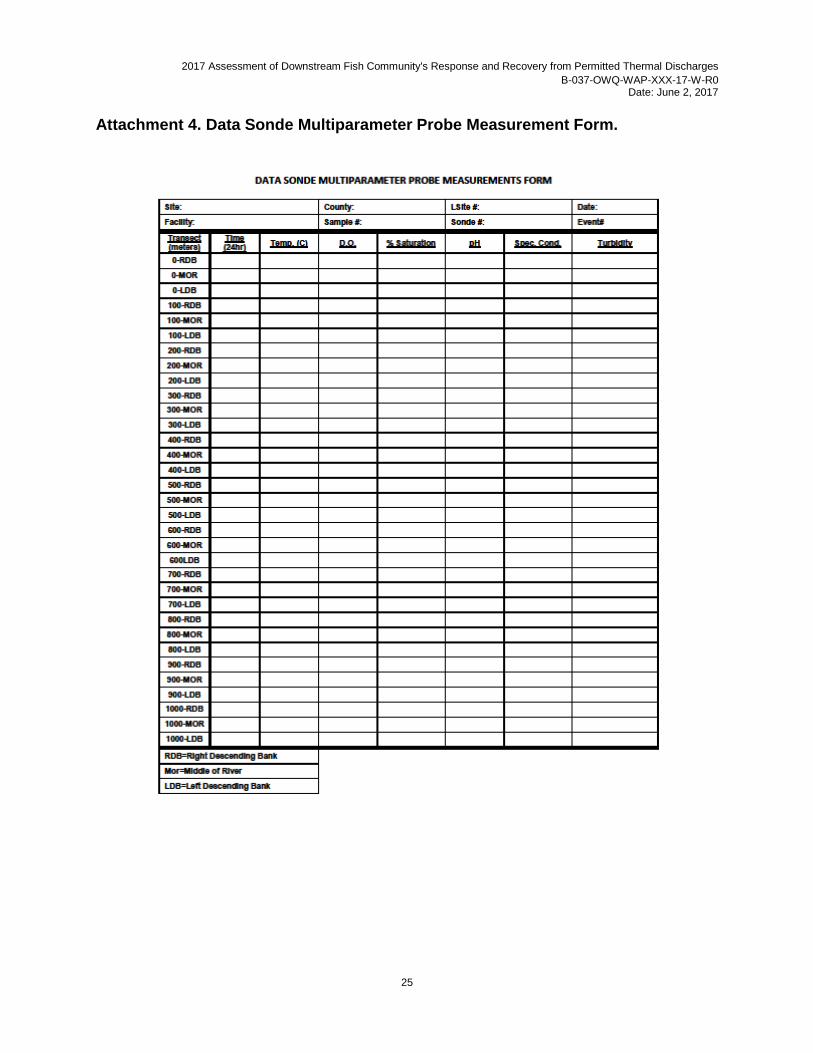
Field Parameters Measurements Dissolved oxygen, pH, water temperature, specific conductance, and dissolved oxygen percent saturation will be measured with a data sonde during each sampling event regardless of the media type being collected. The field parameters and their respective test methods and sensitivity limits are identified in Table 3. Field parameter measurements will be collected based on a series of cross-section transects downstream of the NPDES thermal discharge point. The purpose of this is to establish a record of the movement and possible extent of the thermal plume of higher water temperatures versus the ambient water temperature.
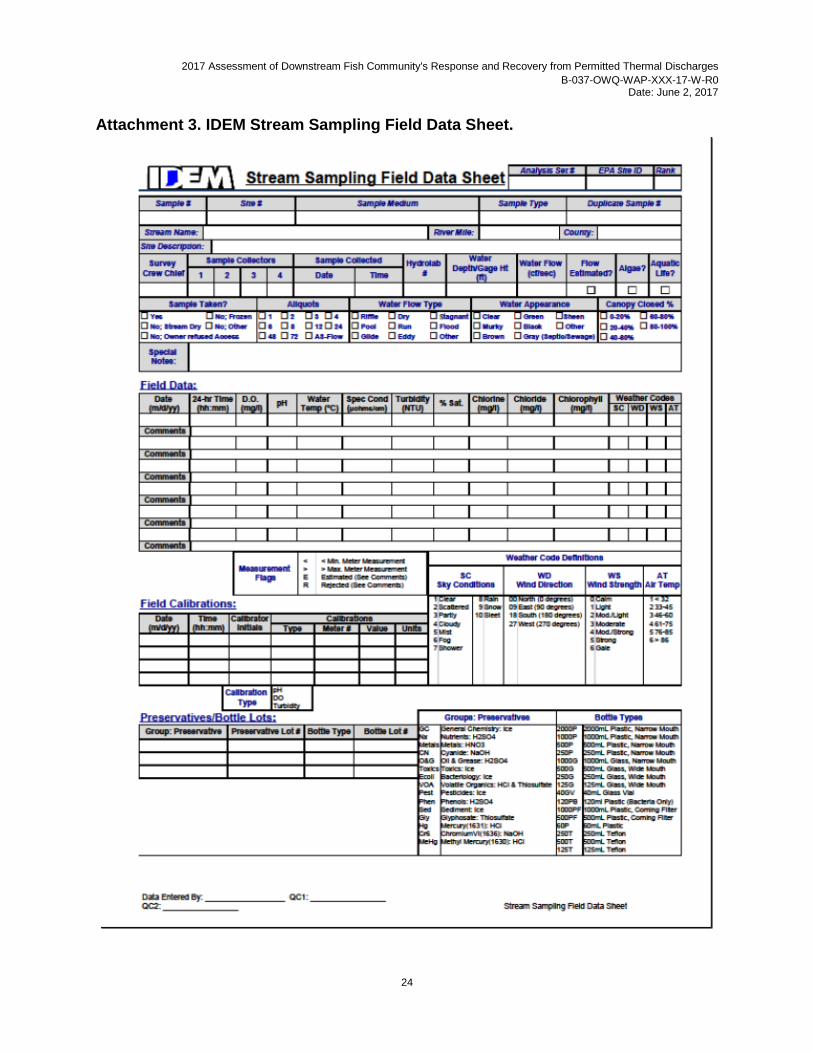
Measurement procedures and operation of the data sonde shall be performed according to the manufacturers’ manuals (Hydrolab Corporation 2002; YSI 2002). Turbidity will be measured with a Hach™ turbidity kit, and the meter number written in the comments under the field parameter measurements. If a Hach™ turbidity kit is not available, the data sonde measurement for turbidity will be recorded. All field parameter measurements and weather codes will be recorded on the IDEM Stream Sampling Field Data Sheet (Attachment 3) and Attachment 4 with other sampling observations. A digital photo will also be taken upstream and downstream of the site during each sampling event.
2017 Assessment of Downstream Fish Community's Response and Recovery from Permitted Thermal Discharges
B-037-OWQ-WAP-XXX-17-W-R0 Date: June 2, 2017
13
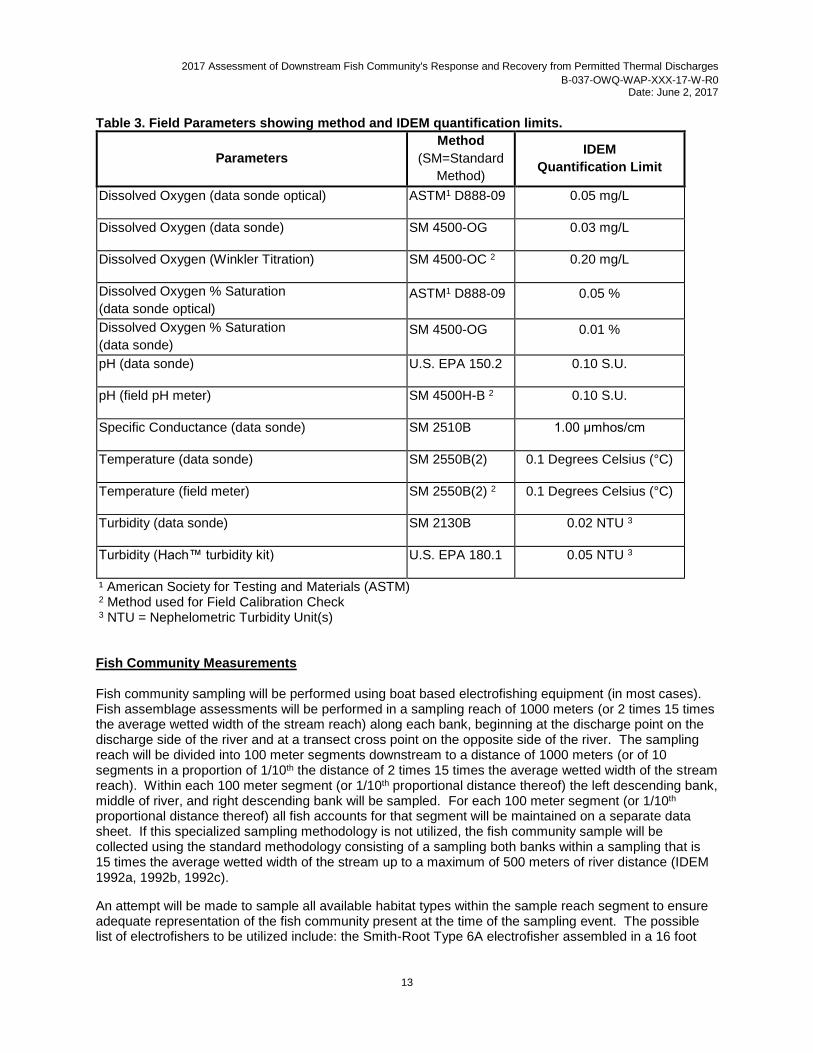
Table 3. Field Parameters showing method and IDEM quantification limits.
Parameters
Method
(SM=Standard
Method)
IDEM
Quantification Limit
Dissolved Oxygen (data sonde optical) ASTM1 D888-09 0.05 mg/L
Dissolved Oxygen (data sonde) SM 4500-OG 0.03 mg/L
Dissolved Oxygen (Winkler Titration) SM 4500-OC 2 0.20 mg/L
Dissolved Oxygen % Saturation
(data sonde optical) ASTM1 D888-09 0.05 %
Dissolved Oxygen % Saturation
(data sonde) SM 4500-OG 0.01 %
pH (data sonde) U.S. EPA 150.2 0.10 S.U.
pH (field pH meter) SM 4500H-B 2 0.10 S.U.
Specific Conductance (data sonde) SM 2510B 1.00 μmhos/cm
Temperature (data sonde) SM 2550B(2) 0.1 Degrees Celsius (°C)
Temperature (field meter) SM 2550B(2) 2 0.1 Degrees Celsius (°C)
Turbidity (data sonde) SM 2130B 0.02 NTU 3
Turbidity (Hach™ turbidity kit) U.S. EPA 180.1 0.05 NTU 3
¹ American Society for Testing and Materials (ASTM) 2 Method used for Field Calibration Check 3 NTU = Nephelometric Turbidity Unit(s) Fish Community Measurements Fish community sampling will be performed using boat based electrofishing equipment (in most cases). Fish assemblage assessments will be performed in a sampling reach of 1000 meters (or 2 times 15 times the average wetted width of the stream reach) along each bank, beginning at the discharge point on the discharge side of the river and at a transect cross point on the opposite side of the river. The sampling reach will be divided into 100 meter segments downstream to a distance of 1000 meters (or of 10 segments in a proportion of 1/10th the distance of 2 times 15 times the average wetted width of the stream reach). Within each 100 meter segment (or 1/10th proportional distance thereof) the left descending bank, middle of river, and right descending bank will be sampled. For each 100 meter segment (or 1/10th proportional distance thereof) all fish accounts for that segment will be maintained on a separate data sheet. If this specialized sampling methodology is not utilized, the fish community sample will be collected using the standard methodology consisting of a sampling both banks within a sampling that is 15 times the average wetted width of the stream up to a maximum of 500 meters of river distance (IDEM 1992a, 1992b, 1992c).
An attempt will be made to sample all available habitat types within the sample reach segment to ensure adequate representation of the fish community present at the time of the sampling event. The possible list of electrofishers to be utilized include: the Smith-Root Type 6A electrofisher assembled in a 16 foot
2017 Assessment of Downstream Fish Community's Response and Recovery from Permitted Thermal Discharges
B-037-OWQ-WAP-XXX-17-W-R0 Date: June 2, 2017
14
jon boat with a spherical dropper anode, or with an array dropper anode (IDEM 1992a, 1992b, 1992c, 1992d).
Sample collections during high flow or turbid conditions will be avoided due to 1) low collection rates which result in non-representative samples and 2) safety considerations for the sampling team. Sample collections during late autumn and seasonal cold temperatures will be avoided due to the lack of responsiveness to the electrical field by some species that can also result in samples that are not representative of the streams fish assemblage (Simon 1990; U.S. EPA 1995).
Fish will be collected using dipnets with fiberglass handles and netting of 1/8-inch bag mesh. Fish collected in the sampling reach will be sorted by species into baskets and buckets. Young-of-the year fish less than 20 millimeters (mm) total length will not be retained in the community sample (Simon 1990; U.S. EPA 1995).
Prior to processing fish specimens and completion of the fish community datasheet, one to two individuals per species will be preserved in 3.7% formaldehyde solution for future reference if there are more than 10 individuals for that species collected in the sampling reach, the specimens can be positively identified, and the individuals for preservation are small enough to fit in a 2000 mL jar. If however, there are few individuals captured or the specimens are too large to preserve, a photo of key characteristics will be taken for later examination. Also, should a crew chief collect a species for the first time during the field season, a photo will be taken for later verification. Taxonomic characteristics for possible species encountered in the basin of interest will be reviewed prior to field work. Fish specimens should also be preserved if they cannot be positively identified in the field (especially those that co-occur like the Striped and Common Shiners), individuals that appear to be hybrids or have unusual anomalies, as well as dead specimens that are taxonomically valuable for un-described taxa (like the Red Shiner or Jade Darter), life history studies, or research projects.
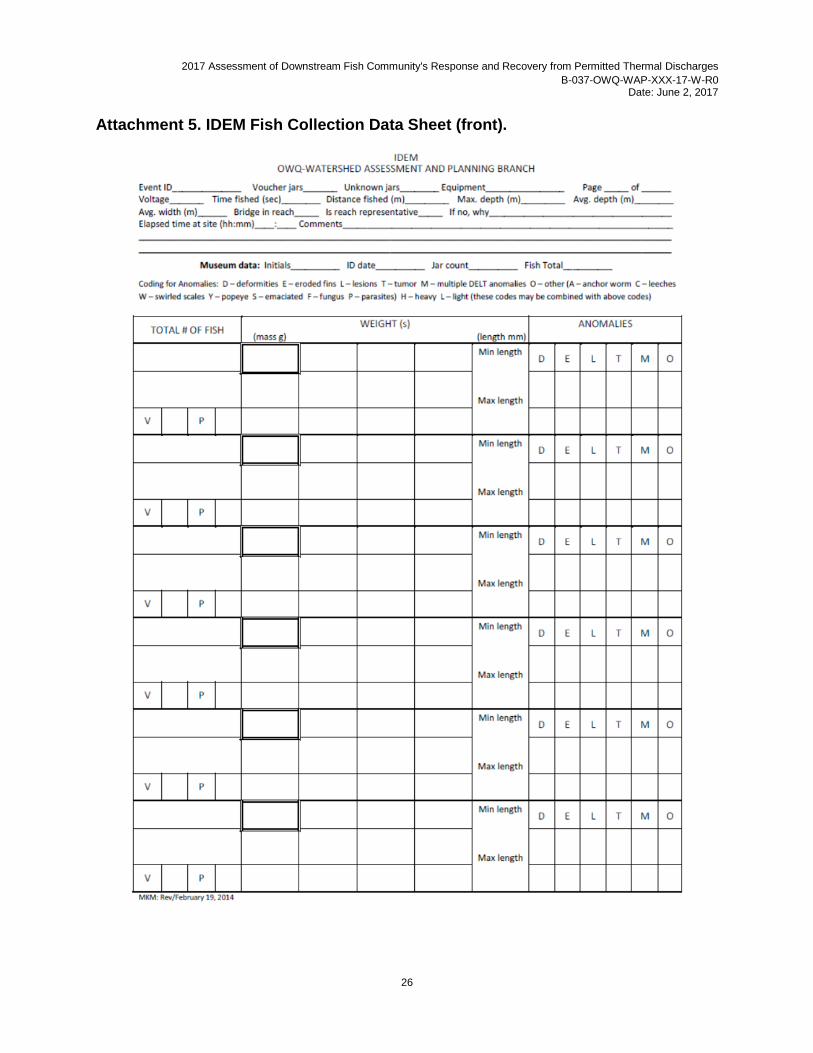
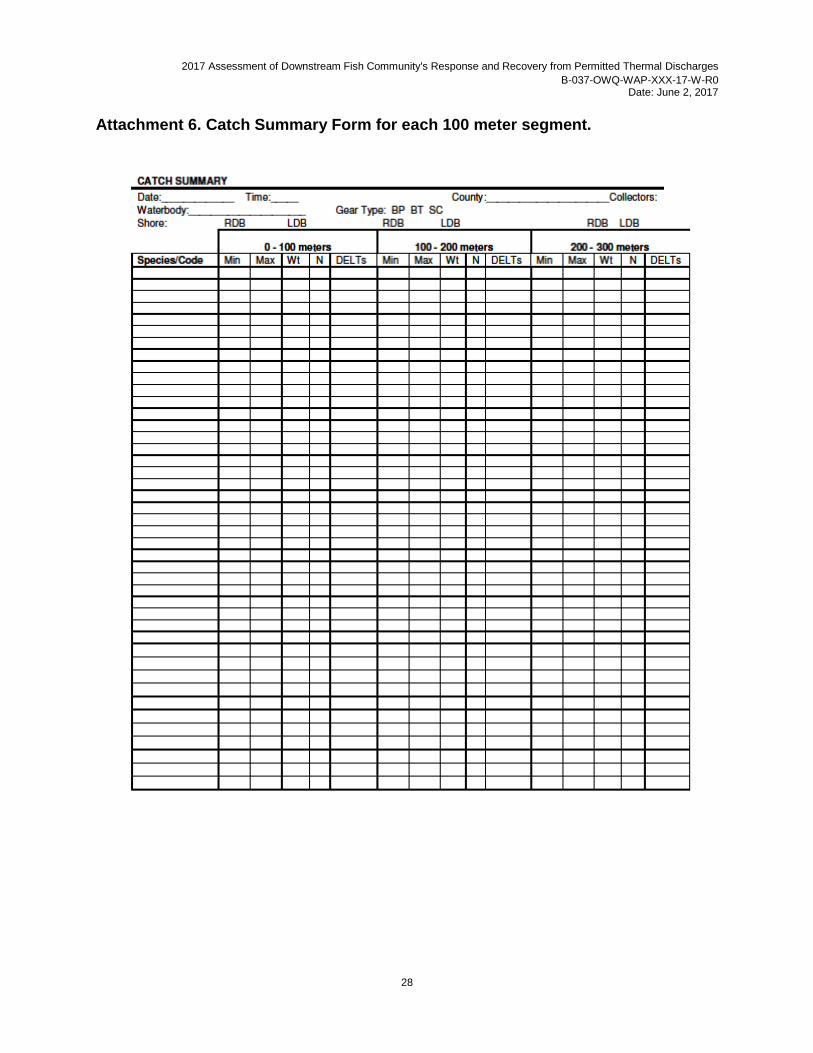
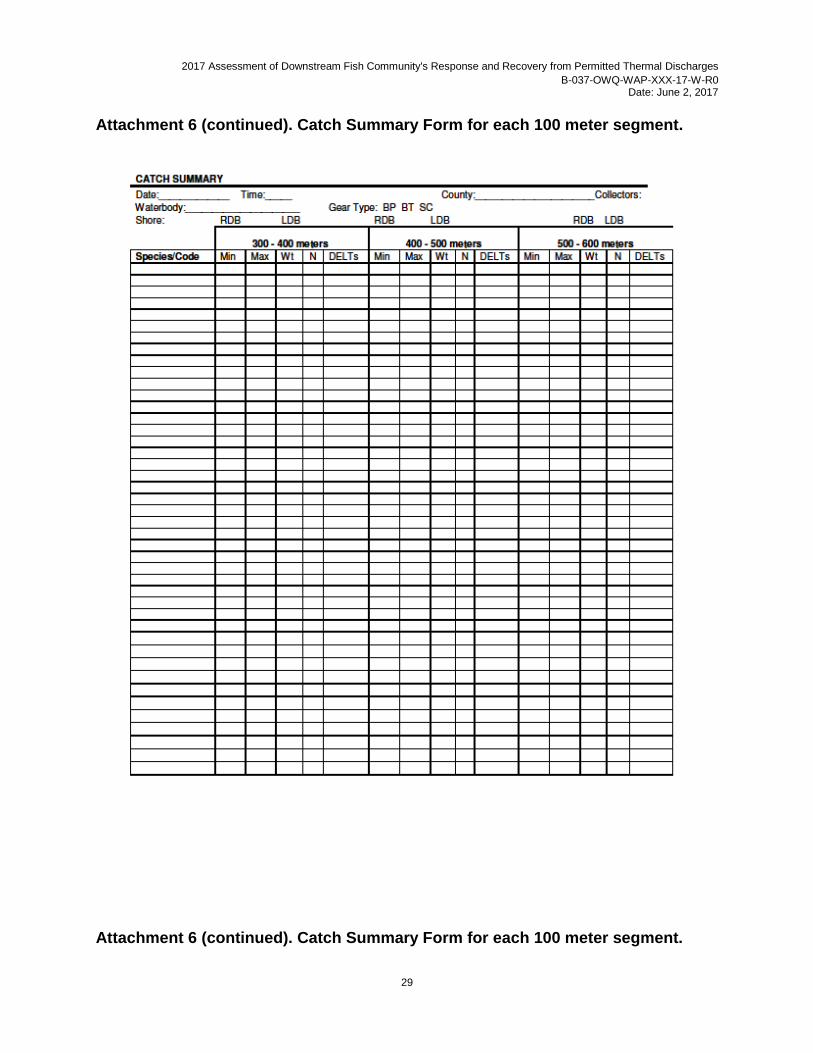
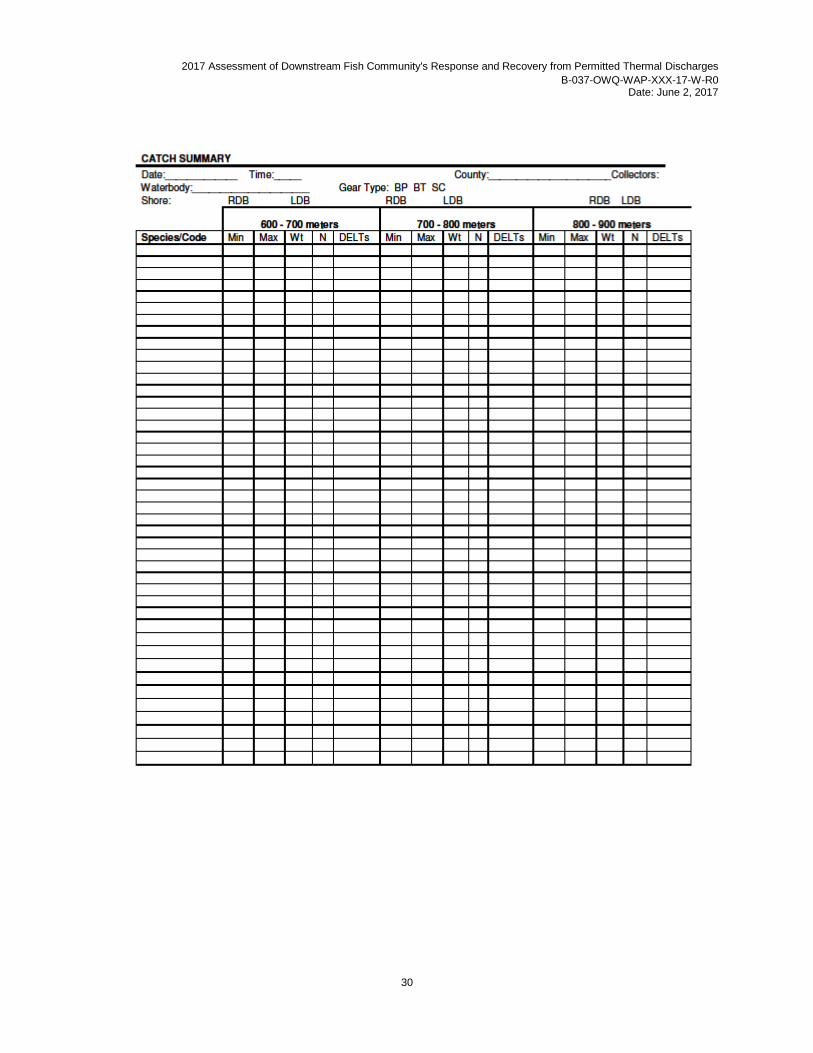
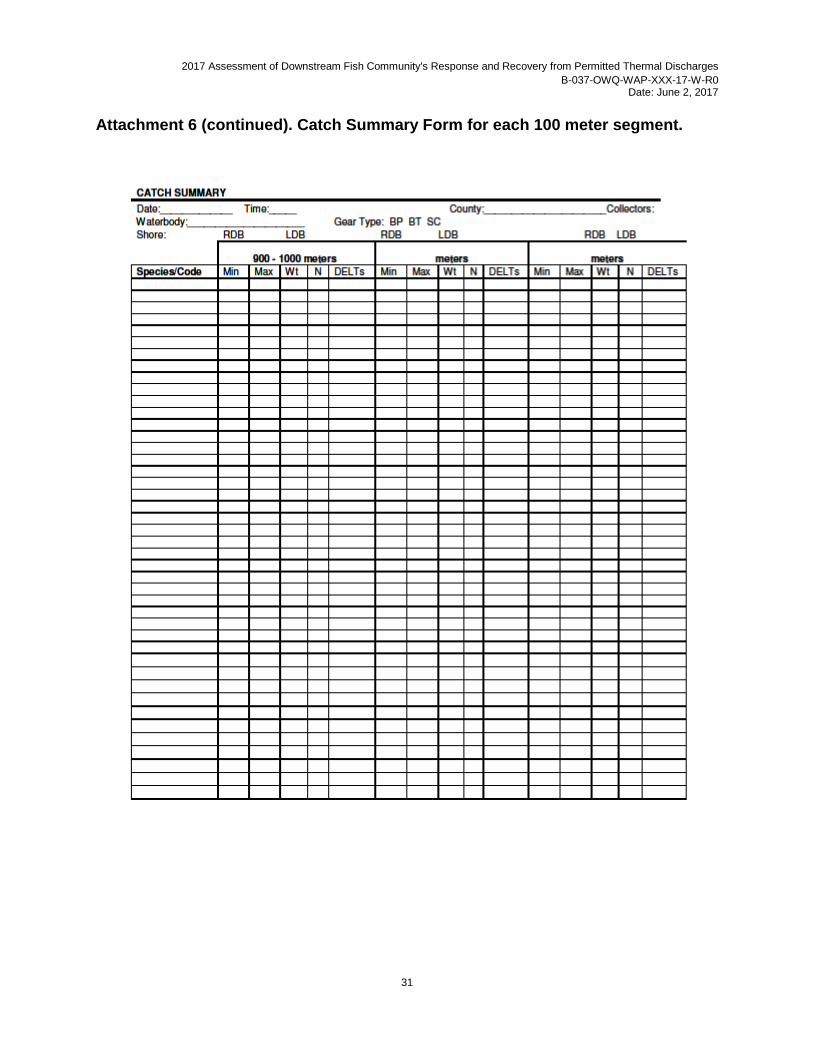
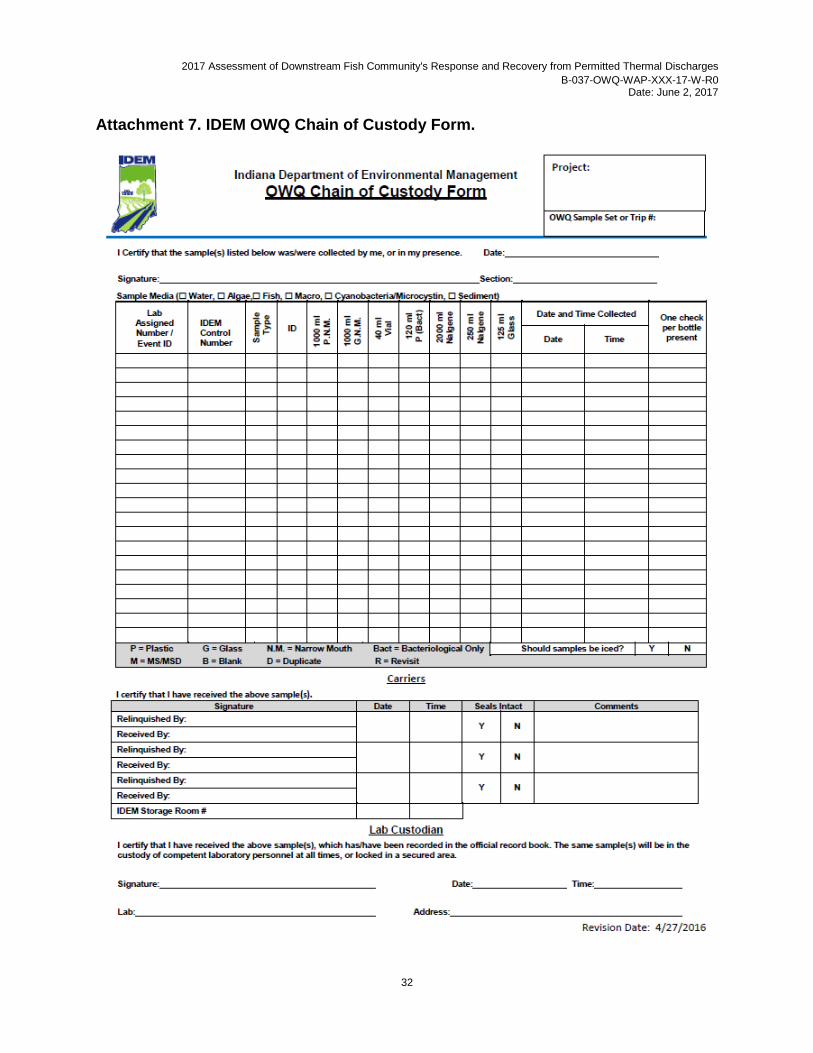
Data will be recorded for non-preserved fish on the Catch Summary data sheet (Attachment 6) consisting of the following: number of individuals, minimum and maximum total length (mm), mass weight in grams (g), and number of individuals with deformities, eroded fins, lesions, tumors, and other anomalies (DELTs). If the standard methodology is utilized, data will recorded on the IDEM Fish Collection Data Sheet (Attachment 5). Once the data have been recorded, specimens will be released within the sampling reach if possible. The OWQ Chain of Custody Form (Attachment 7) will be completed for preserved fish specimens. Data will be recorded for preserved fish specimens following taxonomic identification in the laboratory.
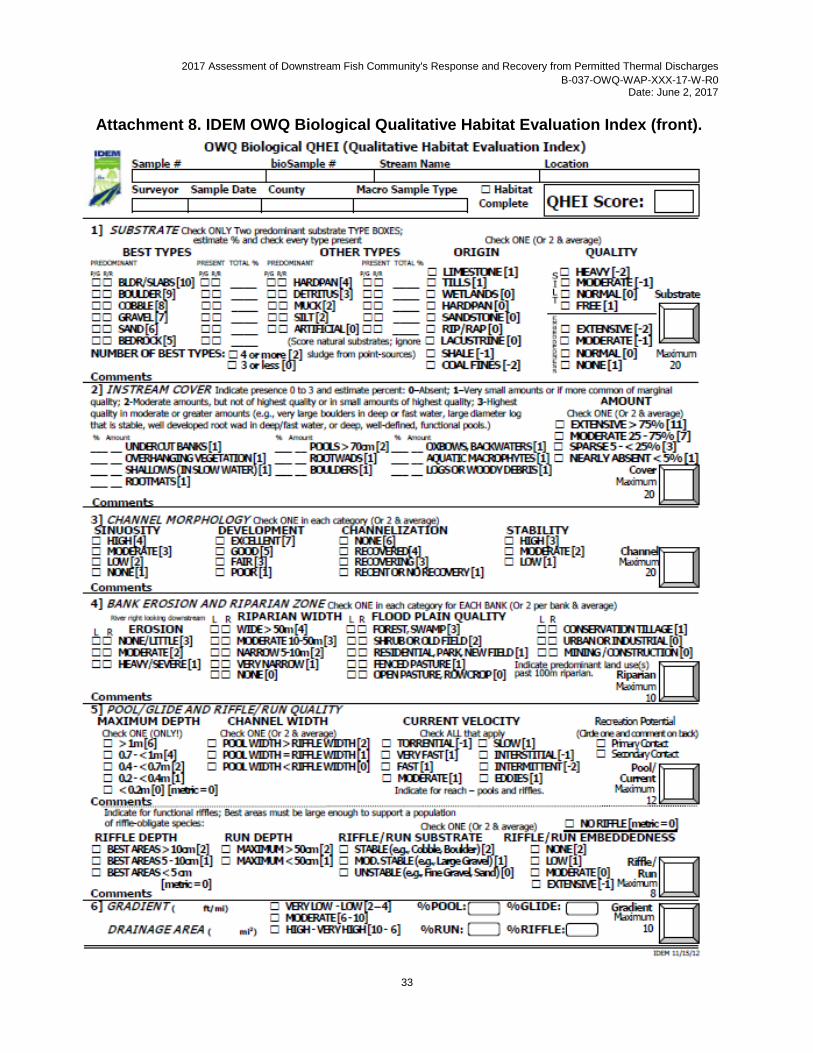
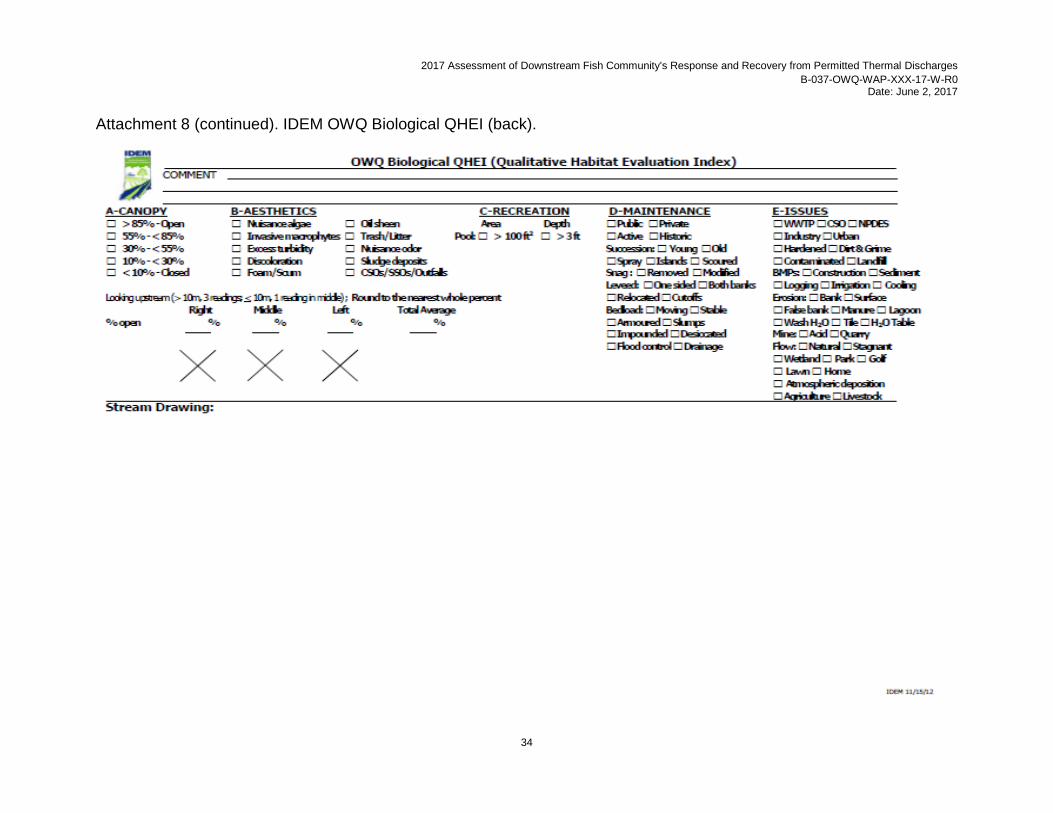
Habitat Assessments Habitat assessments will be completed immediately following fish community sample collections for two 500 meter reaches using the QHEI (IDEM 2016a, Attachment 8). See IDEM 2016a for a description of the method used in completing the QHEI.
2017 Assessment of Downstream Fish Community's Response and Recovery from Permitted Thermal Discharges
B-037-OWQ-WAP-XXX-17-W-R0 Date: June 2, 2017
15
Quality Control and Custody Requirements
Quality assurance protocols will follow part B5 of the WAPB QAPP (IDEM 2017).
Field Instrument Testing and Calibrations The data sonde will be calibrated immediately prior to each week’s sampling (IDEM 2002). Calibration results and drift values will be recorded and stored in log books located in the calibration laboratories at the Shadeland facility. The drift value is the difference between two successive calibrations. Field parameter calibrations will conform to the procedures as described in the instrument users’ manuals (Hydrolab Corporation 2002; YSI 2002). The DO component of the calibration procedure will be conducted using the air calibration method (IDEM 2002). The unit will be field checked for accuracy once during the week by comparison with a Winkler DO test, as well as Hach™ turbidity, pH, and temperature meters. Weekly calibration verification results will be recorded on the stream sampling field data sheets (Attachment 3) and entered into the AIMS II database. A Winkler DO test will also be conducted at sites where the DO concentration is 4.0 mg/L or less.
Field Measurement Data In-situ water chemistry field data will be collected in the field using calibrated or standardized equipment. Calculations may be done in the field or later at the office. Analytical results, which have limited QC checks, are included in this category. Detection limits have been set for each analysis (Table 3). Quality control checks (such as duplicate measurements, measurements of a secondary standard, or measurements using a different test method or instrument) which are performed on field or laboratory data are usable for estimating precision, accuracy, and completeness for the project (Attachment 9).
III. ASSESSMENT/OVERSIGHT Field and laboratory performance and system audits will be performed to ensure good quality data. The field and laboratory performance includes voucher verifications, two rounds of review on all field sheets by at least two different staff who did not fill out the field sheets, and precision measurements by relative percent difference (RPD) of field and laboratory duplicate and completeness measurements by the percent of planned samples that are actually collected, analyzed, reported, and usable for the project (IDEM 2017).
Field audits will be conducted to ensure that sampling activities adhere to approved SOPs. Audits are systematically conducted by WAPB Quality Assurance staff to include all WAPB personnel that engage in field sampling activities
Data Quality Assessment Levels
The samples and various types of data collected by this program are intended to meet the quality assurance criteria and DQA Levels as described in the WAPB QAPP (IDEM 2017, pp 182-183).
IV. DATA VALIDATION AND USABILITY Quality assurance reports to management and data validation and usability are also important components of the QAPP which insures good quality data for this project. A quality assurance audit report will be submitted for this project should problems arise and need to be investigated and corrected. Data validation and usability will be achieved through data reduction (the process of converting raw analytical data into final results in proper reporting units), data validation (the process of qualifying analytical/ measurement data on the performance of field and laboratory QC measures incorporated into
2017 Assessment of Downstream Fish Community's Response and Recovery from Permitted Thermal Discharges
B-037-OWQ-WAP-XXX-17-W-R0 Date: June 2, 2017
16
the sampling and analysis procedures), and data reporting (the detailed description of the data deliverables used to completely document the calibration, analysis, QC measures, and calculations).
Quality Assurance/Data Qualifiers and Flags
The various data qualifiers and flags that will be used for quality assurance and validation of the data are found on pages 130-131 of the WAPB QAPP (IDEM 2017).
Data Usability
The environmental data collected and its usability are qualified and classified into one or more of the four categories: Acceptable Data, Enforcement Capable Results, Estimated Data, and Rejected Data as described on page 130 of the WAPB QAPP (IDEM 2017).
Information, Data, and Reports
Data collected in 2017 will be recorded in the AIMSII database. All data and reports will be made available to public and private entities which may find the data useful for municipal, industrial, agricultural, and recreational decision making processes (i.e. TMDL, NPDES permit modeling, Watershed Restoration Projects, Water Quality Criteria refinement, etc.).
Laboratory and Estimated Cost
All fish samples will be collected and analyzed by IDEM staff.
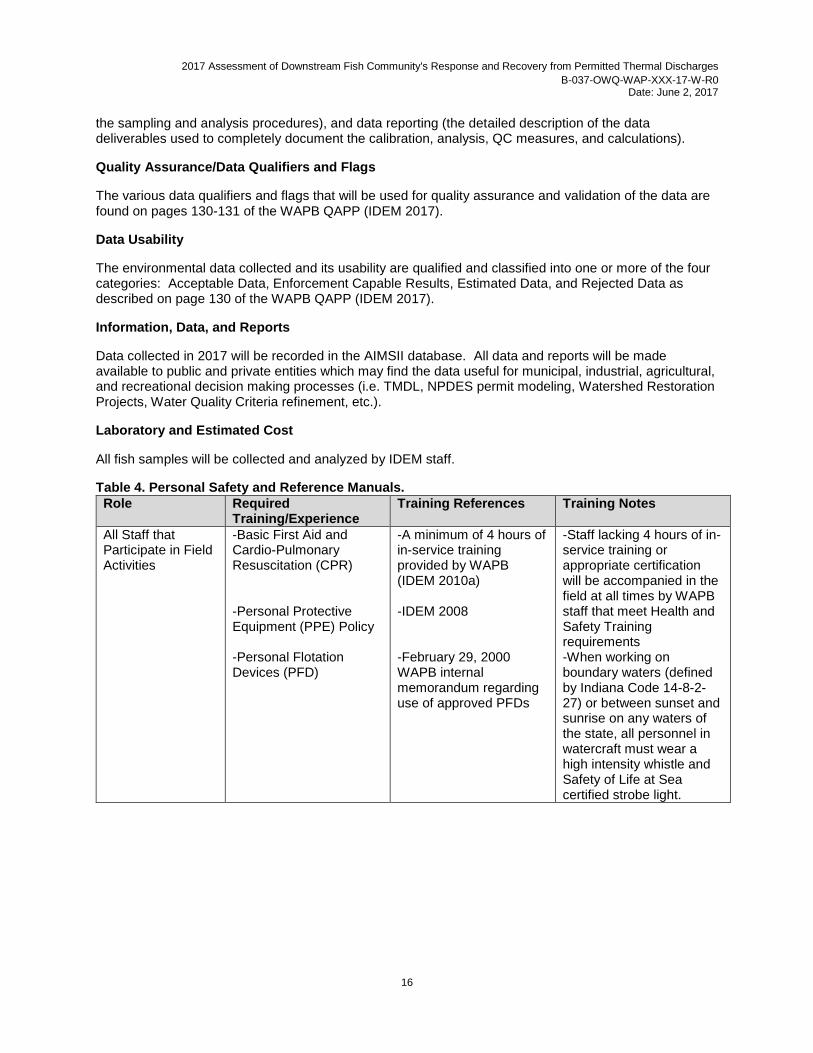
Table 4. Personal Safety and Reference Manuals.
Role Required Training/Experience
Training References Training Notes
All Staff that Participate in Field Activities
-Basic First Aid and Cardio-Pulmonary Resuscitation (CPR) -Personal Protective Equipment (PPE) Policy -Personal Flotation Devices (PFD)
-A minimum of 4 hours of in-service training provided by WAPB (IDEM 2010a) -IDEM 2008 -February 29, 2000 WAPB internal memorandum regarding use of approved PFDs
-Staff lacking 4 hours of in-service training or appropriate certification will be accompanied in the field at all times by WAPB staff that meet Health and Safety Training requirements -When working on boundary waters (defined by Indiana Code 14-8-2-27) or between sunset and sunrise on any waters of the state, all personnel in watercraft must wear a high intensity whistle and Safety of Life at Sea certified strobe light.

2017 Assessment of Downstream Fish Community's Response and Recovery from Permitted Thermal Discharges
B-037-OWQ-WAP-XXX-17-W-R0 Date: June 2, 2017
17
REFERENCES
Dufour, R.L., T.P. Simon, and S.A. Newhouse. 2003. Evaluating the effects of thermal discharges on
aquatic life: Patterns in multi-metric indices from three case studies in large and great rivers of the Midwestern United States. Pp. 495-516. In T.P. Simon (ed). Biological Response Signatures: Indicator Patterns using Aquatic Communities. CRC Press, Boca Raton, FL.
Eaton, A. D. et. al., 2012. Standard Methods for the Examination of Water and Wastewater, 22nd Edition. American Public Health Association, Washington, DC.
Emery, E.B. and J.A. Thomas. 2003. A method for assessing outfall effects on Great River Fish populations: the traveling zone approach. Pp. 157-164. In T.P. Simon (ed). Biological Response Signatures: Indicator Patterns using Aquatic Communities. CRC Press, Boca Raton, FL.
Emery, E.B., F.H. McCormick, and T.P. Simon. 2003a. Response patterns of Great River fish assemblage metrics to outfall effects from point source discharges. Pp. 481-494. In T.P. Simon (Ed.). Biological Response Signatures: Indicator Patterns using Aquatic Communities. CRC Press, Boca Raton, FL.
Emery, E.B., T.P. Simon, F.H. McCormick, P.L. Angermeier, J.E. Deshon, C.O. Yoder, R.E. Sanders, W.D. Pearson, G.D. Hickman, R.J. Reash, and J.A. Thomas. 2003b. Development of a Multimetric Index for Assessing the Biological Condition of the Ohio River. Transactions of the American Fisheries Society 132: 791–808.
Hydrolab Corporation. 2002, revision c. Quanta Water Quality Monitoring System Operating Manual. Loveland, Colorado. http://www.ott.com/download/hydrolab-quanta-manual/
IAC (Indiana Administrative Code), Title 327 Water Pollution Control Division, Article 2. Water Quality Standards. Last updated February 3, 2016. Available at http://www.in.gov/legislative/iac/iac_title?iact=327
IC (Indiana Code), Title 14 Natural and Cultural Resources, Article 8 General Provisions and Definitions. Approved February 27, 2013. Available at http://iga.in.gov/legislative/laws/2015/ic/titles/014/
IDEM (Indiana Department of Environmental Management). 1992a, revision 1. Section 3, Quality Assurance Project Plan, Development of Biological Criteria (Fish) for the Ecoregions of Indiana. Biological Studies Section, Surveillance and Standards Branch, Office of Water Management, Indiana Department of Environmental Management, Indianapolis, Indiana.
IDEM. 1992b, revision 1. Section 4, Standard Operating Procedures for Fish Collections, Use of Seines, Electrofishers, and Sample Processing. Biological Studies Section, Surveillance and Standards Branch, Office of Water Management, Indiana Department of Environmental Management, Indianapolis, Indiana.
IDEM. 1992c, revision 1. Section 5, Standard Operating Procedures for Conducting Rapid Assessment of Ambient Water Quality Using Fish (RBP-V). Biological Studies Section, Surveillance and Standards Branch, Office of Water Management, Indiana Department of Environmental Management, Indianapolis, Indiana.
IDEM. 1992d, revision 1. Section 11, Standard Operating Procedures-Appendices of Operational Equipment Manuals and Procedures. Biological Studies Section, Surveillance and Standards Branch, Office of Water Management, Indiana Department of Environmental Management, Indianapolis, Indiana.
2017 Assessment of Downstream Fish Community's Response and Recovery from Permitted Thermal Discharges
B-037-OWQ-WAP-XXX-17-W-R0 Date: June 2, 2017
18
IDEM. 1997. Water Quality Surveys Section Laboratory and Field Hazard Communication Plan Supplement. IDEM 032/02/018/1998, Revised October 1998. Assessment Branch, Indiana Department of Environmental Management, Indianapolis, Indiana.
IDEM. 2002. Water Quality Surveys Section Field Procedure Manual, Assessment Branch, Indiana Department of Environmental Management, Indianapolis, Indiana. IDEM, April 2002. Located at https://extranet.idem.in.gov/standards/docs/quality_improvement/qapps/owq_surveys_section_field_manual.pdf .
IDEM. 2008. IDEM Personal Protective Equipment Policy, revised May 1 2008. A-059-OEA-08-P-R0. Office of External Affairs, Indiana Department of Environmental Management, Indianapolis, Indiana. Located at https://extranet.idem.in.gov/standards/docs/policies/oea/Personal_Protective_Equipment_Policy.pdf
IDEM. 2010a. IDEM Health and Safety Training Policy, revised October 1 2010. A-030-OEA-10-P-R2.Office of External Affairs, Indiana Department of Environmental Management, Indianapolis, Indiana. Located at https://extranet.idem.in.gov/standards/docs/policies/oea/A-30-OEA-10-P-R2.pdf
IDEM. 2010b. IDEM Injury and Illness Resulting from Occupational Exposure Policy, revised October 1 2010. A-034-OEA-10-P-R2. Office of External Affairs, Indiana Department of Environmental Management, Indianapolis, Indiana. Located at https://extranet.idem.in.gov/standards/docs/policies/aw/A-034-AW-16-P-R3.pdf
IDEM. 2014. Guidance for Conducting a Demonstration as a Requirement of a 316(a) Alternative Thermal Effluent Limitation Request. Office of Water Quality, Indiana Department of Environmental Management, Indianapolis, Indiana.
IDEM. 2015. Global Positioning System (GPS) Data Creation Technical Standard Operating Procedure. B-001-OWQ-WAP-XXX-15-T-R0. Office of Water Quality, Watershed Assessment and Planning Branch. Indianapolis, Indiana. Located at https://extranet.idem.in.gov/standards/docs/sops/owq/B-001-OWQ-WAP-XXX-15-T-R0.pdf
IDEM. 2016a. Procedures for Completing the Qualitative Habitat Evaluation Index. B-003-OWQ-WAP-XX-16-T-R0. Office of Water Quality, Watershed Assessment and Planning Branch. Indianapolis, Indiana. Located at: https://extranet.idem.in.gov/standards/docs/sops/owq/B-003-OWQ-WAP-XX-16-T-R0.pdf
IDEM. 2016b. Indiana’s 2016 Consolidated Assessment and Listing Methodology (CALM). Edited by Jody Arthur. Office of Water Quality, Indiana Department of Environmental Management, Indianapolis, Indiana. http://www.in.gov/idem/nps/files/ir_2016_report_apndx_l_attch_1.pdf
IDEM. 2017. Quality Assurance Project Plan (QAPP) for Indiana Surface Water Programs, (Rev. 4, Mar. 2017). B-001-OWQ-WAP-XX-17-Q-R4. Assessment Branch, Office of Water Quality, Indiana Department of Environmental Management, Indianapolis, Indiana. Located at
https://extranet.idem.in.gov/standards/docs/quality_improvement/qapps/owq_surface_water.pdfR4.pd
f
Lewis, RB, JE Pike, WB Taylor, JM Magalski, and MK Tomasi. 2004. Fish and benthic macroinvertebrate community analysis near the Cayuga Generating Station, 2002. PSI Energy; Tech. Report EPW-082. 61pp. and appendices.
Simon, T.P. 1991. Development of Index of Biotic Integrity expectations for the Ecoregions of Indiana. I. Central Corn Belt Plain. U.S. Environmental Protection Agency, Region V, Chicago, IL. EPA 905/9-91/025.
2017 Assessment of Downstream Fish Community's Response and Recovery from Permitted Thermal Discharges
B-037-OWQ-WAP-XXX-17-W-R0 Date: June 2, 2017
19
Simon, T.P. 1992. Biological Criteria Development for Large Rivers with an Emphasis on An Assessment of the White River Drainage, Indiana. U.S. Environmental Protection Agency, Region V, Water Division, Watershed and Non-Point Branch, Chicago. IL. EPA 905/R-92/006.
Simon, T.P. 1994. Development of Index of Biotic Integrity expectations for the Ecoregions of Indiana. II. Huron-Erie Lake Plain. U.S. Environmental Protection Agency, Region V, Water Division, Watershed and Non-Point Source Branch. Chicago, IL. EPA 905/R-92/007.
Simon, T.P. 1997. Development of Index of Biotic Integrity expectations for the Ecoregions of Indiana. IV. Interior River Lowland. U.S. Environmental Protection Agency, Region V, Water Division, Watershed and Non-Point Source Branch. Chicago, IL. EPA 905/R-96/002.
Simon, T.P. 1998a. Development of Index of Biotic Integrity expectations for the Ecoregions of Indiana. III. Northern Indiana Till Plain. U.S. Environmental Protection Agency, Region V, Water Division, Watershed and Non-Point Source Branch. Chicago, IL. EPA 905/R-96/002.
Simon, T.P. 1998b. Modification of an index of biotic integrity and development of reference condition expectations for dunal, palustrine wetland fish communities along the southern shore of Lake Michigan. Aquatic Ecosystem Health and Management 1:49-62.
Simon, T.P. 1998c. Development of fish community reference conditions for dunal, palustrine wetlands along the southern shore of Lake Michigan. Aquatic Ecosystem Health and Management 1: 57-70.
Simon, T.P. 2001. Development, calibration, and validation of an index of biotic integrity for littoral fish assemblages for inland warmwater lakes in northern and central Indiana. State of Indiana, Department of Environmental Management, Indianapolis, IN.
Simon, T.P. 2004a. Development, calibration, and validation of an index of biological sustainability for oxbow lakes and reservoirs in southern Indiana. State of Indiana, Department of Environmental Management, Indianapolis, IN.
Simon, T.P. 2004b. Evaluation of Lake Michigan nearshore coastal wetlands with emphasis on development of watershed biotic indicators and status. U.S. Department of the Interior, Fish and Wildlife Service, Bloomington, IN.
Simon, T.P. 2006. Development, Calibration, and Validation of an Index of Biotic Integrity for the Wabash River. Proceedings of the Indiana Academy of Science 115(2):170-186. http://monitoringprotocols.pbworks.com/f/Wabash+IBI.pdf
Simon, T.P. and R.L. Dufour. 2005. Guide to appropriate metric selection for calculating the Index of Biotic Integrity (IBI) for Indiana Large and Great Rivers, Inland Lakes, and Great Lakes nearshore. U.S. Department of the Interior, Fish and Wildlife Service, Bloomington Field Office, Bloomington, Indiana. http://monitoringprotocols.pbworks.com/f/IBI+revised+criteria+large+waters.pdf
Simon, T.P. and J.R. Stahl. 1998. Development of Index of Biotic Integrity Expectations for the Wabash River. U.S. Environmental Protection Agency, Region V, Water Division, Watershed and Non-Point Branch, Chicago. IL. EPA 905/R-96/005.
United States Environmental Protection Agency (U.S. EPA). 2006. Guidance on Systematic Planning Using the Data Quality Objectives Process. EPA/240/B-06/001. U.S. EPA, Office of Environmental Information, Washington D.C. https://www.epa.gov/sites/production/files/documents/guidance_systematic_planning_dqo_process.pdf
U.S. EPA. 1977. Interagency 316(a) Technical Guidance Manual And Guide For Thermal Effects Sections Of Nuclear Facilities Environmental Impact Statements. Office of Water Enforcement,
2017 Assessment of Downstream Fish Community's Response and Recovery from Permitted Thermal Discharges
B-037-OWQ-WAP-XXX-17-W-R0 Date: June 2, 2017
20
Permits Division, Industrial Permits Branch, Washington, D.C. https://www3.epa.gov/npdes/pubs/owm0001.pdf
YSI Incorporated. 2002, revision b. 6-Series Environmental Monitoring Systems Manual, Yellow Springs, Ohio. https://www.ysi.com/File%20Library/Documents/Manuals/069300-YSI-6-Series-Manual-RevJ.pdf
2017 Assessment of Downstream Fish Community's Response and Recovery from Permitted Thermal Discharges
B-037-OWQ-WAP-XXX-17-W-R0 Date: June 2, 2017
21
DISTRIBUTION LIST Electronic Distribution Only:
Name Organization Jody Arthur IDEM/OWQ/WAPB/Technical E7 Timothy Bowren IDEM/OWQ/WAPB/Technical and Logistical Services Section Nicole Gardner IDEM/OWQ/Permitting/Industrial Permits Section Chief Paul Higginbotham IDEM/OWQ/Deputy Assistant Commissioner Paul McMurray IDEM/OWQ/Probabilistic Monitoring Section Martha Clark Mettler IDEM/OWQ/Assistant Commissioner David Parry Office of Compliance Support/Planning & Assessment/Quality Improvement Marylou Renshaw IDEM/OWQ/WAPB/Branch Chief Joe Schmees IDEM/OWQ/WAPB/Watershed Restoration and Planning Section Chief Stacey Sobat IDEM/OWQ/WAPB/Probabilistic Monitoring Section Chief Mike Sutton IDEM/OWQ/WAPB/Technical and Logistical Services Section Chief Cyndi Wagner IDEM/OWQ/WAPB/Targeted Monitoring Section Chief
2017 Assessment of Downstream Fish Community's Response and Recovery from Permitted Thermal Discharges
B-037-OWQ-WAP-XXX-17-W-R0 Date: June 2, 2017
22
Attachment 1. IDEM Site Reconnaissance Form.
2017 Assessment of Downstream Fish Community's Response and Recovery from Permitted Thermal Discharges
B-037-OWQ-WAP-XXX-17-W-R0 Date: June 2, 2017
23
Attachment 2. Site Instantaneous Temperature Location GPS File Field Form.
2017 Assessment of Downstream Fish Community's Response and Recovery from Permitted Thermal Discharges
B-037-OWQ-WAP-XXX-17-W-R0 Date: June 2, 2017
24
Attachment 3. IDEM Stream Sampling Field Data Sheet.
2017 Assessment of Downstream Fish Community's Response and Recovery from Permitted Thermal Discharges
B-037-OWQ-WAP-XXX-17-W-R0 Date: June 2, 2017
25
Attachment 4. Data Sonde Multiparameter Probe Measurement Form.
2017 Assessment of Downstream Fish Community's Response and Recovery from Permitted Thermal Discharges
B-037-OWQ-WAP-XXX-17-W-R0 Date: June 2, 2017
26
Attachment 5. IDEM Fish Collection Data Sheet (front).
2017 Assessment of Downstream Fish Community's Response and Recovery from Permitted Thermal Discharges
B-037-OWQ-WAP-XXX-17-W-R0 Date: June 2, 2017
27
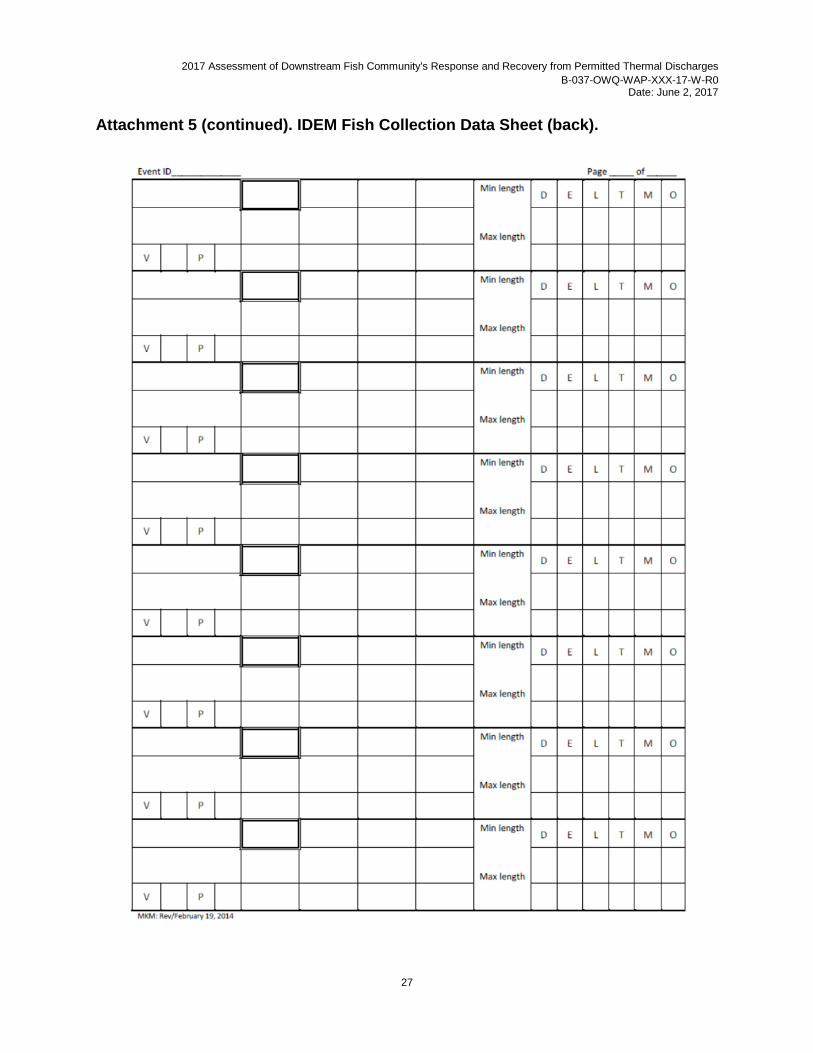
Attachment 5 (continued). IDEM Fish Collection Data Sheet (back).
2017 Assessment of Downstream Fish Community's Response and Recovery from Permitted Thermal Discharges
B-037-OWQ-WAP-XXX-17-W-R0 Date: June 2, 2017
28
Attachment 6. Catch Summary Form for each 100 meter segment.
2017 Assessment of Downstream Fish Community's Response and Recovery from Permitted Thermal Discharges
B-037-OWQ-WAP-XXX-17-W-R0 Date: June 2, 2017
29
Attachment 6 (continued). Catch Summary Form for each 100 meter segment.
Attachment 6 (continued). Catch Summary Form for each 100 meter segment.
2017 Assessment of Downstream Fish Community's Response and Recovery from Permitted Thermal Discharges
B-037-OWQ-WAP-XXX-17-W-R0 Date: June 2, 2017
30
2017 Assessment of Downstream Fish Community's Response and Recovery from Permitted Thermal Discharges
B-037-OWQ-WAP-XXX-17-W-R0 Date: June 2, 2017
31
Attachment 6 (continued). Catch Summary Form for each 100 meter segment.
2017 Assessment of Downstream Fish Community's Response and Recovery from Permitted Thermal Discharges
B-037-OWQ-WAP-XXX-17-W-R0 Date: June 2, 2017
32
Attachment 7. IDEM OWQ Chain of Custody Form.
2017 Assessment of Downstream Fish Community's Response and Recovery from Permitted Thermal Discharges
B-037-OWQ-WAP-XXX-17-W-R0 Date: June 2, 2017
33
Attachment 8. IDEM OWQ Biological Qualitative Habitat Evaluation Index (front).
2017 Assessment of Downstream Fish Community's Response and Recovery from Permitted Thermal Discharges
B-037-OWQ-WAP-XXX-17-W-R0 Date: June 2, 2017
34
Attachment 8 (continued). IDEM OWQ Biological QHEI (back).
2017 Assessment of Downstream Fish Community's Response and Recovery from Permitted Thermal Discharges
B-037-OWQ-WAP-XXX-17-W-R0 Date: June 2, 2017
35
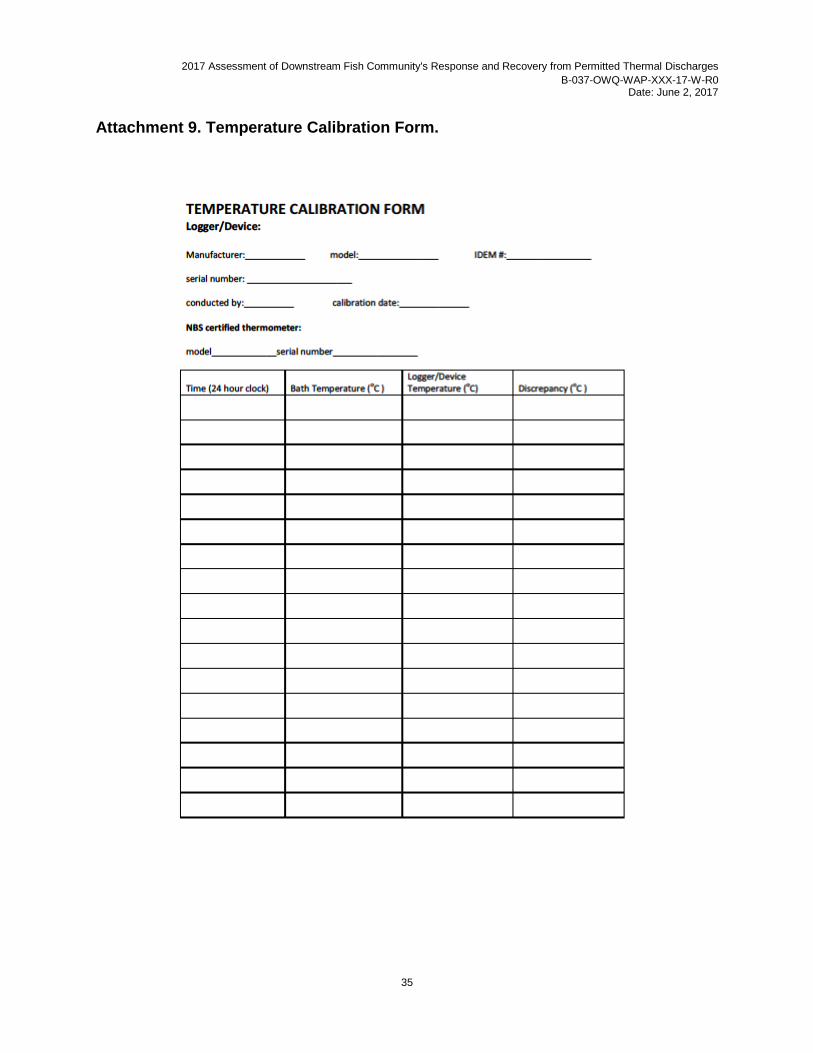
Attachment 9. Temperature Calibration Form.