8. R&D Project Record W5A-061/PR3 - Afflux at bridges and culverts

Kennesaw State UniversityDigitalCommons@Kennesaw State University
Master of Science in Integrative Biology Theses Department of Ecology, Evolution, and OrganismalBiology
Summer 7-22-2019
Assessment of Culverts and Bridges as RoostingHabitat for Perimyotis subflavus (tri-colored bat)and Disease Transmission Corridors forPseudogymnoascus destructansKelly Lutsch
Follow this and additional works at: https://digitalcommons.kennesaw.edu/integrbiol_etd
Part of the Integrative Biology Commons
This Thesis is brought to you for free and open access by the Department of Ecology, Evolution, and Organismal Biology atDigitalCommons@Kennesaw State University. It has been accepted for inclusion in Master of Science in Integrative Biology Theses by an authorizedadministrator of DigitalCommons@Kennesaw State University. For more information, please contact [email protected].
Recommended CitationLutsch, Kelly, "Assessment of Culverts and Bridges as Roosting Habitat for Perimyotis subflavus (tri-colored bat) and DiseaseTransmission Corridors for Pseudogymnoascus destructans" (2019). Master of Science in Integrative Biology Theses. 44.https://digitalcommons.kennesaw.edu/integrbiol_etd/44

Assessment of Culverts and Bridges as Roosting Habitat 1
for Perimyotis subflavus (tri-colored bat) and Disease 2
Transmission Corridors for Pseudogymnoascus 3
destructans 4
5
6
7
8
9
10
11
Candidate: 12
Kelly Lutsch 13
14
Advisor: 15
Dr. Christopher T. Cornelison 16
17
Committee Members: 18
Dr. Jonathan McMurray 19
Dr. Christopher Sanford 20
Dr. Thomas McElroy 21
22
23
24
25
26
27
28
Contents 29
30
Figures 3 31
Tables 4 32
INTRODUCTION 5 33
Fungal pathogens 5 34
Pseudogymnoascus destructans 5 35
White-Nose Syndrome 6 36
Pathogen Transmission 7 37
Bats and Bridges/Culverts 8 38
Species of Interest 8 39
Statement of Problem 10 40
Objectives and Hypotheses 11 41
MATERIALS AND METHODS 12 42
FIELD METHODS 12 43
Culvert Survey and Data Collection 12 44
Sample Collection 12 45
Bat Handling 13 46
Hibernation Season Culvert Surveys 13 47
Representative Culverts 16 48
Temperature Data Loggers 17 49
LABORATORY METHODS 19 50
DNA Extraction 19 51
Standard Curve 20 52
STATISTICAL METHODS 21 53
RESULTS 23 54
Hibernation Season Culvert Surveys 23 55
Environmental Predictor Variables 25 56
Representative Culverts 27 57
Temperature Data Loggers 29 58
qPCR 37 59
DISCUSSION 37 60

P. subflavus Ecology 37 61
Cluster Behavior 38 62
Temperature 39 63
Disease Triangle 40 64
Conclusions 41 65
Integration of Thesis Research 42 66
REFERENCES 43 67
APPENDECIES 49 68
Appendix A. Bridge Survey Data Sheet 49 69
Appendix B. Swab Collection Data Sheet 51 70
Appendix C. United States Geological Survey and National Wildlife Health Center Protocol 52 71
Appendix D. United States Fish and Wildlife Service Decontamination Protocol 54 72
73
74
Figures 75
76
Figure 1 | Map of WNS ................................................................................................................................. 7 77
Figure 2 | Study Area .................................................................................................................................. 14 78
Figure 3 | Total Structures Surveyed .......................................................................................................... 15 79
Figure 4 | Representative Culverts ............................................................................................................. 16 80
Figure 5 | Four Culvert Plots ....................................................................................................................... 17 81
Figure 6 | Data Logger Mount .................................................................................................................... 18 82
Figure 7 | Standard Curve ........................................................................................................................... 21 83
Figure 8 | P. subflavus Observations 2017/2018 ........................................................................................ 24 84
Figure 9 | M. austroriparius Observations 2017/2018 ............................................................................... 25 85
Figure 10 | Habitat Surrounding Surveyed Culverts ................................................................................... 27 86
Figure 11 |P. subflavus in Weep Holes ....................................................................................................... 28 87
Figure 12 | Average Daily Temperature in Culvert 28. ............................................................................... 29 88
Figure 13 | Average Daily Temperature in Culvert 30 ................................................................................ 30 89
Figure 14 | Average Daily Temperature in Culvert 31 ................................................................................ 30 90
Figure 15 | Average Daily Temperature in Culvert 70 ................................................................................ 31 91
Figure 16 | Average Daily Temperature in Culvert 79 ................................................................................ 31 92
Figure 17 | Average Daily Temperature in Culvert 88 ................................................................................ 32 93
Figure 18 | Average Daily Temperature in Culvert 107 .............................................................................. 32 94
Figure 19 | Average Daily Temperature in Culvert 109 .............................................................................. 33 95
Figure 20 | Average Daily Temperature in Culvert 110 .............................................................................. 33 96
Figure 21 | Average Daily Temperature in Culvert 124 .............................................................................. 34 97

Figure 22 | Average Daily Temperature in Culvert 125 .............................................................................. 34 98
Figure 23 | Average Daily Temperature in Culvert 127 .............................................................................. 35 99
Figure 24 | Tukey’s Test Results ................................................................................................................. 37 100
101
Tables 102
103
Table 1 | Species Names and Conservation Status ...................................................................................... 4 104
Table 2 | Variables Included in Logistic Linear Regression ......................................................................... 22 105
Table 3 | Representative Culverts and Species Present ............................................................................. 24 106
Table 4 | Best Fit Models for Predicting Bat Presence ............................................................................... 26 107
Table 5 | Best Fit Models for Predicting P. subflavus Presence ................................................................. 26 108
Table 6 | Weep Hole Temperature ............................................................................................................ 36 109
110
111
112
Species Names and Conservation Status Latin Name Species
Abbreviation Common Name Federal
Conservation Status
Georgia Conservation
Status Perimyotis subflavus PESU Tri-colored bat Species of Concern
(listing petition pending)
Species of Concern
Myotis austroriparius MYAU Southeastern myotis
Not Listed Species of Concern
Myotis lucifugus MYLU Little brown bat Not Listed Species of Concern
Myotis septentrionalis
MYSE Northern long eared bat
Threatened Threatened
Myotis sodalis MYSO Indiana bat Endangered Endangered
Corynorhinus rafinesquii
CORA Rafinesque’s big-eared bat
Not Listed Rare
Tadarida brasiliensis TABR Brazilian free-tailed bat
Not Listed Not Listed
Table 1 | Species Names and Conservation Status. All mentioned species are listed with latin names, common names, 113 abbreviations, and conservation status. 114
115
116
117
118

INTRODUCTION 119
120
Fungal pathogens 121
122
In recent history, emerging fungal pathogens have threatened the survival of numerous species 123
(Daszak et al. 2000; Fisher et al. 2012; Fisher et al. 2016). Historically, pathogenic fungi have been 124
associated with plant health issues and crop loss, but only recently recognized as a pressing threat to 125
animal health. Amphibian population declines in seemingly pristine areas, such as rainforests of Central 126
America, have been attributed to the fungal pathogen Batrachochytrium dendrobatidis, the causative 127
agent of chytridiomycosis (Parkes et al. 1998). North American snake populations have experienced 128
declines due to Ophidiomyces ophiodiicola, the causative agent of snake fungal disease, and often 129
characterized by facial swelling, cloudy eyes, and improper skin shedding (Last et al. 2016). Fungal 130
pathogens have diverse and resilient dispersal mechanisms, facilitating survival in harsh environments 131
until a suitable host is available. This has enabled the spread of several pathogens across spatial and 132
temporal scales (Fisher et al. 2012). Among these emerging fungal pathogens is Pseudogymnoascus 133
destructans, the causative agent of white-nose syndrome (WNS) in North American bats. Since its 134
discovery in New York caves in 2006, WNS has caused precipitous declines in populations of North 135
American bats (Blehert et al. 2009; Warneke et al. 2012). 136
137
Pseudogymnoascus destructans 138
139
P. destructans is a psychrophilic ascomycete that grows optimally between 12.5°C and 15.8°C, 140
which makes it well-suited for inhabiting the same cave environments bats use for hibernation (Turner 141
et al. 2011). P. destructans has been identified as an invasive fungal pathogen in North America and has 142
been linked to mass mortality of bat populations in the eastern U.S. and Canada. In Eurasia, P. 143
destructans has been observed infecting several bat species, although less severe disease symptoms and 144
low mortality rates are reported (Wibblet et al. 2010; Puechmaille et al. 2011). Colonization occurs on 145
the nose, ear, and wing tissue of bats during winter hibernation, when body temperatures are near 146
ambient and immune responses are severely suppressed. Exposed tissue is colonized by mycelia with a 147
fuzzy, white appearance. The fungal biomass invading tissues is characterized by prolific fungal conidia 148
(Meteyer et al. 2009). The histology of P. destructans infection is characterized by cup-like erosions of 149
the epidermis filled with fungal hyphae (Meteyer et al. 2009). Fungal hyphae can colonize multiple 150
tissues such as the hair follicles, sebaceous glands, and apocrine glands (Meteyer et al. 2009). P. 151
destructans can be detected on an individual without associated cupping lesions, suggesting that 152
infection may not always lead to the development of WNS. 153
154
White-Nose Syndrome 155
156
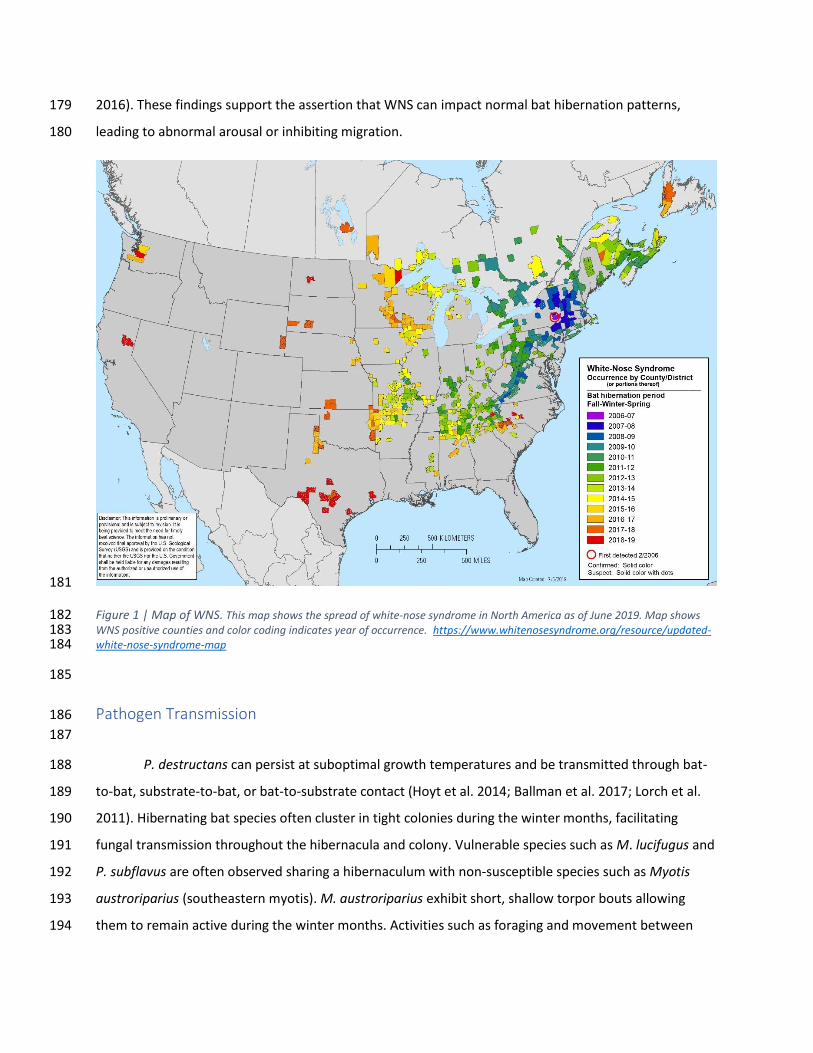
White-nose syndrome (WNS) is the clinical manifestation of disease caused by P. destructans in 157
hibernating bats. White-nose syndrome has been confirmed in 33 U.S. states and 7 Canadian provinces. 158
P. destructans has been detected in an additional 3 U.S. states, without documentation of WNS (Figure 159
1). Population models estimated that within 20 years of introduction of P. destructans, affected North 160
American bat species such as Myotis lucifugus (little brown bat), Myotis septentrionalis (northern long-161
eared bat), and Perimyotis subflavus (tri-colored bat), could experience a 99% regional population 162
collapse resulting in the loss of over 5.5 million bats (Frick et al. 2010; USFWS 2012). 163
Symptoms of infection manifest as lesions, rough patches of skin, and irregular pigmentation. 164
Wing tissue may be more susceptible to fungal invasion and water evaporation due to its relatively 165
increased surface area compared to other exposed tissue. Wing tissue also plays an important role in 166
thermoregulation and immune function, both of which are pivotal to maintain homeostasis in a torpid 167
endotherm (Herreid et al. 1968; Dongaonkar et al. 2009). WNS-infected bats typically exhibit increased 168
torpor arousal frequency and shortened bout lengths. Premature arousal is energetically costly and 169
often leads to premature fat reserve depletion, dehydration, and starvation (Warnecke et al. 2012, 170
Warnecke et al. 2013; Lilley et al. 2016). Torpid bats lack the required inflammatory response to defend 171
against fungal invasion. However, post-hibernation active bats can be observed with severe emaciation 172
and inflammation, suggesting the potential for a rare immune response known as Immune 173
reconstitution inflammatory syndrome (IRIS) to present once immune function returns (Meteyer et al. 174
2012). 175
Studies have indicated that post-WNS bat foraging and hibernation behavior can be inconsistent 176
and often irregular compared to historical data (Reeder et al. 2012). Researchers have observed bats 177
foraging on the landscape during hibernation season in confirmed WNS positive areas (Grider et al. 178
2016). These findings support the assertion that WNS can impact normal bat hibernation patterns, 179
leading to abnormal arousal or inhibiting migration. 180
181
Figure 1 | Map of WNS. This map shows the spread of white-nose syndrome in North America as of June 2019. Map shows 182 WNS positive counties and color coding indicates year of occurrence. https://www.whitenosesyndrome.org/resource/updated-183 white-nose-syndrome-map 184
185
Pathogen Transmission 186
187
P. destructans can persist at suboptimal growth temperatures and be transmitted through bat-188
to-bat, substrate-to-bat, or bat-to-substrate contact (Hoyt et al. 2014; Ballman et al. 2017; Lorch et al. 189
2011). Hibernating bat species often cluster in tight colonies during the winter months, facilitating 190
fungal transmission throughout the hibernacula and colony. Vulnerable species such as M. lucifugus and 191
P. subflavus are often observed sharing a hibernaculum with non-susceptible species such as Myotis 192
austroriparius (southeastern myotis). M. austroriparius exhibit short, shallow torpor bouts allowing 193
them to remain active during the winter months. Activities such as foraging and movement between 194

roosts could facilitate disease transmission between hibernating bat colonies (Lorch et al. 2011). 195
Findings confirm that human activities can also serve as transmission vectors as spores can remain 196
viable on clothing and equipment (Shelley et al. 2013; Ballman et al. 2017). For example, a WNS-positive 197
bat was recovered in King County, Washington in 2016, nearly 1,000 miles from the nearest WNS-198
positive county. Real-time PCR and histopathological testing confirmed the P. destructans strain isolated 199
from the infected bat was indistinguishable from strains collected in the eastern United States (Lorch et 200
al. 2016). 201
202
Bats and Bridges/Culverts 203
204
Numerous bat species are versatile in their roosting selection, choosing anthropogenic 205
structures in addition to natural cavernous structures (Geluso et al. 2009; Allen et al. 2011; Bergeson et 206
al. 2015). It has been hypothesized that bats select bridges for roosting due to the numerous crevices 207
and cracks available for use (Tuttle and Keeley 1999; Allen et al. 2011). Tadarida brasiliensis (Brazilian 208
free-tailed bats) have been documented utilizing bridges in large numbers in south-central Texas as well 209
as Corynorhinus rafinesquii (Rafinesque’s big-eared bat) in South Carolina (Bennett et al. 2008; Allen et 210
al. 2011). Studies have investigated anthropogenic roost-selection and bat condition compared to 211
natural roosts, finding that some bat species in critical conditions, such as pregnant or nursing young, 212
actually experience less stress in anthropogenic roost like a bridge. It is theorized that this is due to the 213
escape from potential stressors related to natural hibernation structures such as resource competition 214
or parasites (Allen et al. 2011). 215
More recently, researchers in Texas, Missouri, and Mississippi have observed P. subflavus 216
roosting in roadway-associated culverts in large numbers (unpublished data Texas and Missouri DOTs). 217
Due to the expansive nature of roadways, bridges and culverts can occur virtually anywhere on the 218
landscape; crossing various ecoregions, topography, and natural borders. 219
220
Species of Interest 221
222
P. subflavus was once abundant across its historic range in the northeast and midwest United 223
States but now faces significant population declines due to WNS (Fujita 1984; Briggler and Prather 2003; 224

Turner et al. 2011). This species is relatively small, with adults weighing between 4-7 g and an average 225
forearm length of 33 mm. They are characterized by three distinct body colors; pale or yellowish fur, 226
black wing membrane, and pink forearms. P. subflavus are insectivorous with a diet consisting of small 227
insects ranging from 4-10 mm in length (Fujita 1984). In the summer months, P. subflavus roost in trees 228
and often remain there throughout the May through August maternity season (Veilloux and Veilloux 229
2004). During the maternity season, female P. subflavus will carry, give birth to, and raise their young, 230
typically giving birth to two pups (Fujita 1984; Veilloux and Veilloux 2004). During the maternity season, 231
they have been observed roosting solitarily or in clusters of 2-3 individuals. 232
As ambient temperatures naturally lower in the winter season, the energy necessary to maintain 233
a euthermic state can increase significantly. Hibernation decreases energy consumption and allows the 234
animal to subsist on stored fat deposits until conditions become favorable for foraging. Torpor is a 235
specialized hibernation strategy that allows a bat to reduce energy requirements to as low as ~1 % of 236
typical metabolic activity during a season of resource scarcity (Ruf et al. 2015). To reduce energy 237
requirements, metabolic processes decrease, waste is not excreted, immune response is suppressed, 238
and body temperature drops to near ambient (Geiser et al. 2009; Burton 1999). During this time bats 239
arouse periodically, depleting up to ~80% of fat reserves (Thomas et al. 1990). Some species remain 240
torpid for weeks at a time, while others experience shallow torpor and more frequent arousals (Thomas 241
et al. 1990). While torpor is energetically efficient it is associated with compromised immune function 242
and dehydration related stress (Burton 1999). 243
P. subflavus have been historically documented hibernating in karst environments during the 244
winter season. They have been consistently observed roosting individually and exhibit a preference for 245
longer cave structures, which is thought to enhance temperature stability (Briggler and Prather 2003; 246
Brack 2007). Records indicate large numbers of P. subflavus entering a hibernacula as early as August 247
and not emerging until April. The typical hibernation season for North American hibernating bats is 248
between December and February, suggesting P. subflavus are generally the first species to enter, as well 249
as the last species to leave hibernation (Davis 1964; Fujita 1984; Briggler and Prather 2003). P. subflavus 250
may be more susceptible to WNS due to their longer hibernation period, and thus greater susceptibility 251
to infection, in addition to other factors such as small body size and presumed prolonged torpor 252
patterns. Across their geographic range, P. subflavus has experienced up to 98% mortality in various 253
states due to WNS, which has led to petitioning for government mandated protection under the 254
Endangered Species Act of 1973. According to the Georgia Department of Natural resources, P. 255

subflavus populations have experienced a 95% population decline in Georgia since the detection of WNS 256
in 2013. 257
258
Statement of Problem 259
260
Roadway associated bridges and culverts serve as a unique disease transmission vector with the 261
ability to supersede unsuitable habitat. Should infected bats utilize culverts as hibernation sites, there is 262
a potential for disease transmission to naive populations and regions. Understanding bat roosting 263
preference is important because it has the potential to influence disease transmission. 264
The theory of island biogeography describes a metapopulation dispersed across habitat patches 265
with varying degrees of connectivity (Merriam et al. 1989; Merriam et al. 1991; Opdam et al. 1991). In 266
Georgia, the metapopulation of P. subflavus is theoretically dispersed from the traditional bat habitat in 267
the northern portion of the state to the coast and coastal plains region. The latter region lacks the 268
topography and associated caves suitable for bat hibernating, but shares a border with karst 269
environments in north Florida. While patches of habitat increase movement of an organism on the 270
landscape, they can also enhance disease transmission throughout a metapopulation (Hess 1994). 271
Roadway culverts create corridors through patches of habitat with otherwise unsuitable features for bat 272
roosting, foraging, or movement. Infected bats moving among these structures can facilitate 273
transmission of P. destructans, creating a chain of potential disease reservoirs spanning across multiple 274
states. This non-traditional interconnectivity could facilitate the spread of P. destructans to previously 275
pathogen-free areas such as north Florida. Novel disease movement and potential development of WNS 276
in naive populations has made such research increasingly critical (Bergeson et al. 2015). 277
Extensive research has been conducted to evaluate the effects of WNS on high-risk species such 278
as M. septentrionalis and M. lucifugus (Grider et al. 2016; Pettit et al. 2017; Langwig et al. 2017). Such 279
focused research has left a void regarding information relating to other affected hibernating bat species 280
and habitat. Understanding how other WNS-susceptible species, such as P. subflavus, use roadway-281
associated structures is critical to understanding pathogen dispersal and identifying potentially 282
vulnerable populations. The Department of Transportation is required by law to consider the potential 283
impact of roadway structure maintenance on threatened and endangered bat species. P. subflavus is 284
currently proposed for such listing and likely to be included as a species to be considered during 285

necessary roadway structure maintenance. Having thorough knowledge of seasonal P. subflavus use of 286
such structures will be of benefit to any invested state and federal agencies. 287
Currently, there is no record of WNS in coastal Georgia. Survey efforts have been concentrated 288
to the northern part of the state where more suitable habitat is located. Similarly, bat presence/absence 289
survey efforts have been focused in northern Georgia. Given the numerous accounts of various bat 290
species using bridges and culverts as roosting sites outside Georgia (including P. subflavus), there is a 291
high probability of observing similar roosting patterns in coastal Georgia. The use of roadway associated 292
bridges and culverts by P. subflavus, could impact the health of susceptible bats in the karst region of 293
north Florida. 294
295
Objectives and Hypotheses 296
297
The objectives of this investigation were to understand the spatial spread of WNS and the 298
roosting preference of P. subflavus populations potentially using roadway-associated culverts in the 299
coastal and coastal plains regions of Georgia. We hypothesized that roadway associated culverts would 300
have physical and ecological characteristics that would increase the likelihood of P. subflavus presence. 301
We hypothesized that surveyed culverts would have characteristics favorable for the growth of P. 302
destructans and the development of WNS in P. subflavus. Finally, we hypothesized that roadway 303
associated culverts in the coastal and coastal plains of Georgia will have the potential to serve as a 304
transmission corridor for white-nose syndrome from karst regions of North Georgia to P. subflavus 305
occupied karst environments in North Florida. The findings from this study can help to fill the knowledge 306
gap regarding WNS burden in coastal Georgia and presence of P. subflavus or other species in bridges 307
and culverts, providing wildlife management officials with the knowledge to better manage critical bat 308
habitat. Understanding of the spatial spread of P. destructans within the state and the potential for 309
disease transmission across state lines is important for monitoring, predicting, preparing for, and 310
potentially preventing disease movement into previously-WNS-free regions. 311
312
313
314
315

MATERIALS AND METHODS 316
317
FIELD METHODS 318
319
Culvert Survey and Data Collection 320
321
Roadway-associated bridges and culverts in the coastal plains and coastal region of Georgia 322
were selected for survey based on several safety factors. Culverts with a height of less than two feet 323
were not surveyed, as bats are not generally observed in culverts of this size (unpublished data from 324
Texas A&M University, Missouri Department of Transportation). Additionally, culverts of this size are 325
highly susceptible to flooding and can be a safety concern for surveyors. Bridges and culverts in areas 326
with high vehicular traffic were assessed for suitability due to potential safety hazards. 327
All surveys were conducted using a standard Georgia Department of Natural Resources (GADNR) 328
datasheet and associated guidelines (Appendix A; Appendix B). Two data sheets were completed for 329
each survey. A GADNR sheet consisted of bridge identification, structural information, and 330
documentation of any use of the structure by bats and birds. The second sheet documented any 331
substrate or animal swabs acquired, including date, site number, type of swab, and associated species 332
sampled. To collect all necessary data, surveyors thoroughly inspected all crevices, joints, and cracks of 333
the bridge or culvert per the methods of Tuttle and Keeley 1999. Indication of bat activity included 334
seeing bats, smelling or seeing guano, observing staining on walls, or hearing clicks or chirps. All 335
indications of bat activity were well-documented on the bridge and culvert data sheet. If bats were 336
observed, the roost location and orientation within the culvert were recorded. Other important culvert 337
features, such as internal height and width, surrounding habitat, conditions under the culvert, and 338
presence of water were also documented. Streams, forests, and vehicular traffic, which could impact bat 339
use, were also documented per the methods of Tuttle and Keeley 1999. Photos were captured of the 340
structure and surrounding habitat. If bats were present, photos were taken to document their location 341
on or within the structure and for identification. 342
343
Sample Collection 344
345

Initial surveys during the 2017/2018 hibernation season, swab samples were collected from 346
every structure surveyed where bats were present. For consistency, all sampling methods were based 347
on the United States Geological Survey and National Wildlife Health Center protocol (Appendix C). Latex 348
gloves were worn while swabbing and changed after each swab, according to United States Fish and 349
Wildlife Service decontamination protocols (Appendix D). Sterile swabs were kept in their original 350
packaging until use. To swab a bat, the surveyor placed the non-dominant hand under the bat to reduce 351
the risk of falling. The surveyor then streaked the forearm tissue five times with a sterile swab, while 352
twisting the swab to ensure greater surface contact. The same method was used for the animal’s 353
muzzle, using the same swab. For consistency, substrate swabs also required five passes using the same 354
streak and twist method. The swab was stored in a new 2ml vial with 250 µl Ctab DNA extraction buffer 355
(OPS Diagnostics, NJ) and labeled accordingly. Six vials were kept in the carrying tray throughout each 356
survey season to serve as negative controls. Swabs were stored in a cooler while in the field and then 357
stored at -80 ºC when available. 358
359
Bat Handling 360
361
In the event a bat could be processed for body metric information, the USFWS 362
recommendations for safe bat handling were followed (Range-wide Indiana Bat Survey Guidelines 2018). 363
Standard measurements were collected, including weight, forearm length, age, sex, and reproductive 364
status. Wings were examined for signs of damage or abnormalities, as lesions or chafing could be 365
indicative of WNS (Meteyer et al. 2009). Active bats were only banded when appropriate and safe for 366
the surveyor and the animal. All bat handling was based on directions from the lead bat biologist for the 367
state of Georgia, Katrina Morris. Each band was uniquely numbered and placed on the forearm of the 368
animal. All band numbers and associated information were submitted to Katrina Morris and the GADNR. 369
All bat handling was conducted under the Federal Collection Permit held by Katrina Morris. Collecting 370
body metrics can be time consuming and distressing to the animal. Stress and irregular arousal is 371
energetically costly to a hibernating bat. For this reason, torpid bats were never disturbed for 372
processing. 373
374
Hibernation Season Culvert Surveys 375
376

Survey efforts were focused in the coastal and coastal plains regions of Georgia, USA (Figure 2), 377
beginning on Interstate 16 at Macon, traveling southeast to Interstate 95 and continuing south to the 378
Florida border. Surveys in the coastal plains region began near Cordele and continued south along 379
Interstate 75 to the Florida border. Sections of smaller roadways such as Highway 441 and 341 were also 380
surveyed. 381
382
Figure 2 | Study Area. Coastal plains and coastal region of Georgia displaying the southern extent of Interstates 16, 75, and 383 95. The pink region represents the northern Florida border. Yellow star indicates Interstate 16. Blue star indicates Interstate 75. 384 Red star indicates Interstate 95. All three interstates were investigated for culverts and subsequently surveyed for bat presence. 385
386
During December, 2017 through March, 2018, Kennesaw State University (KSU), GADNR, and 387
U.S. Fish and Wildlife Service identified and surveyed 109 roadway-associated structures in the coastal 388
and coastal plains regions for bat presence (Figure 3). Following the USGS NWHC 2017-2018 protocol, 389

surveyors collected 146 swabs of bats and substrates. To further characterize P. subflavus seasonal use 390
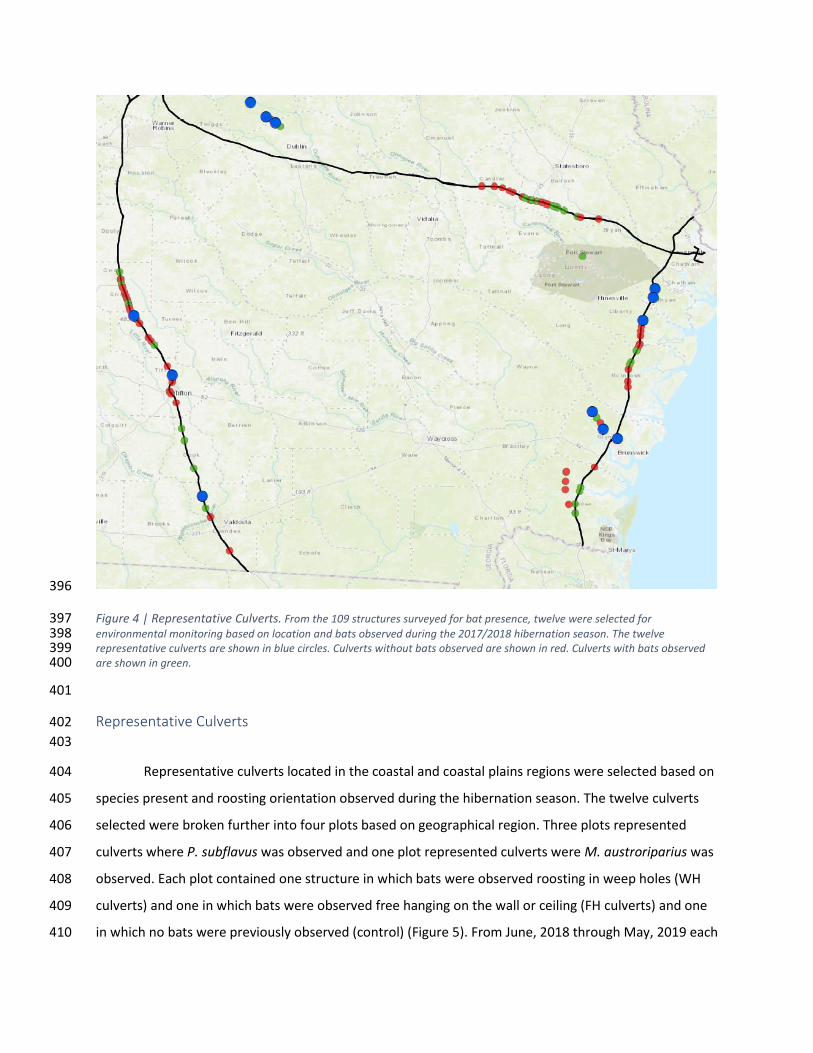
of culverts, twelve representative culverts were selected for environmental monitoring (Figure 4). 391
392
Figure 3 | Total Structures Surveyed. 109 roadway associated structures surveyed by Kennesaw State University, U.S. Fish 393 and Wildlife Service, and Georgia Department of Natural Resources for bat presence in 2017/2018. Green indicated bats were 394 present during the survey. Red indicated that bats were not present during the survey. 395
396
Figure 4 | Representative Culverts. From the 109 structures surveyed for bat presence, twelve were selected for 397 environmental monitoring based on location and bats observed during the 2017/2018 hibernation season. The twelve 398 representative culverts are shown in blue circles. Culverts without bats observed are shown in red. Culverts with bats observed 399 are shown in green. 400
401
Representative Culverts 402
403
Representative culverts located in the coastal and coastal plains regions were selected based on 404
species present and roosting orientation observed during the hibernation season. The twelve culverts 405
selected were broken further into four plots based on geographical region. Three plots represented 406
culverts where P. subflavus was observed and one plot represented culverts were M. austroriparius was 407
observed. Each plot contained one structure in which bats were observed roosting in weep holes (WH 408
culverts) and one in which bats were observed free hanging on the wall or ceiling (FH culverts) and one 409
in which no bats were previously observed (control) (Figure 5). From June, 2018 through May, 2019 each 410
culvert was surveyed monthly for bat presence. Due to variable weather conditions across seasons, 411
culverts were assessed for safety and accessibility upon arrival. Surveyors walked or waded through all 412
accessible culverts and thoroughly inspected all crevices, weep holes, and cracks of the culvert for bat 413
presence. Swabs were collected December, 2018 through March, 2019 using the same protocol 414
previously-described except all swabs were stored dry. During monthly surveys, all culverts including the 415
control culverts, were swabbed in triplicate. 416
417
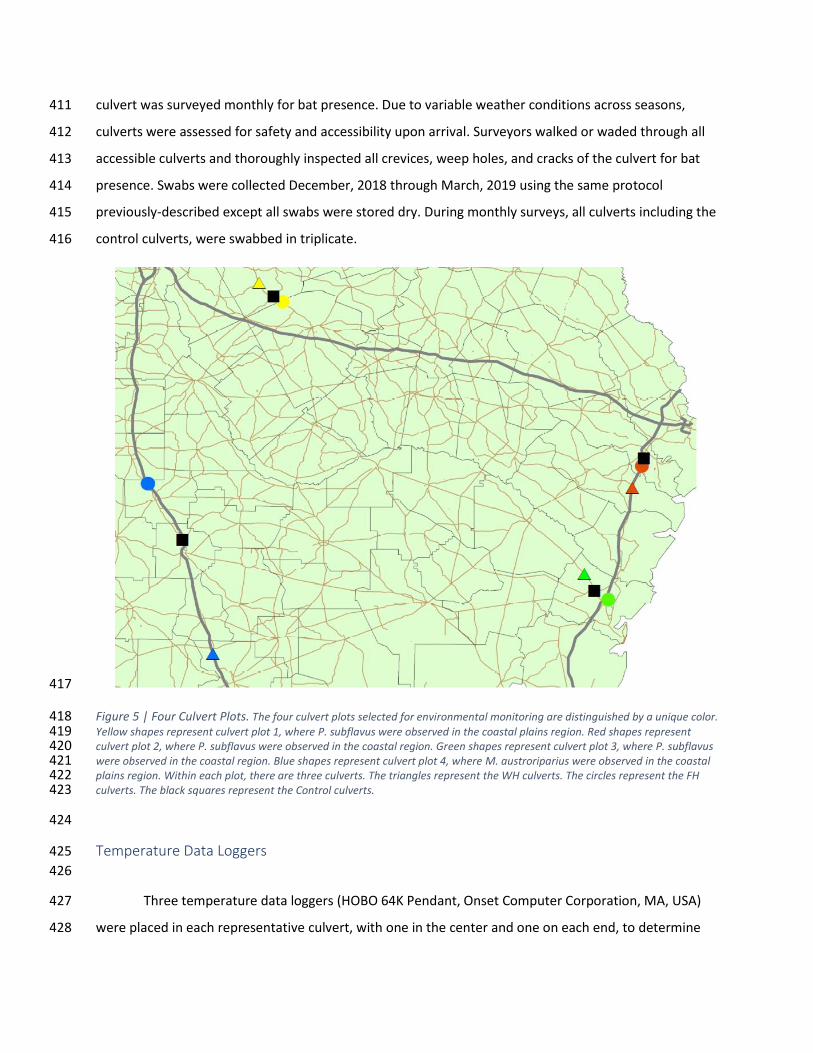
Figure 5 | Four Culvert Plots. The four culvert plots selected for environmental monitoring are distinguished by a unique color. 418 Yellow shapes represent culvert plot 1, where P. subflavus were observed in the coastal plains region. Red shapes represent 419 culvert plot 2, where P. subflavus were observed in the coastal region. Green shapes represent culvert plot 3, where P. subflavus 420 were observed in the coastal region. Blue shapes represent culvert plot 4, where M. austroriparius were observed in the coastal 421 plains region. Within each plot, there are three culverts. The triangles represent the WH culverts. The circles represent the FH 422 culverts. The black squares represent the Control culverts. 423
424
Temperature Data Loggers 425
426
Three temperature data loggers (HOBO 64K Pendant, Onset Computer Corporation, MA, USA) 427
were placed in each representative culvert, with one in the center and one on each end, to determine 428

potential temperature variation. Data loggers were placed in orientations mimicking the bat roosting 429
positions previously observed. Weep hole culverts had one data logger placed in one weep hole using a 430
bolt and toggle. Mesh was secured to the weep hole opening to prevent bats from entering and 431
potentially affecting temperature measurements, while still allowing air to pass with minimal 432
obstruction. To minimize disturbance to the bats, data loggers were only placed in one weep hole per 433
culvert, leaving any others open for roosting. The other two data loggers were mounted on the culvert 434
wall using a 6-inch wooden block, an eye screw, and a carabiner (Figure 6). The eye screw was firmly 435
attached to the wooden block, and all-weather environmental caulk (GE Silicone) was used to adhere 436
the block to the concrete. The data logger was then clipped to the eye using a small carabiner. Free 437
hanging culverts and control culverts had all three data loggers placed throughout the culvert in a 438
similar fashion. Data loggers were deployed at weep hole and free hanging culverts in June and control 439
culverts in July, 2018 and recorded temperature until May, 2019. 440
441
442
Figure 6 | Data Logger Mount. All weather environmental caulk was used to adhere a 6-inch wooden block with an 443 eyelet screw attached to the concrete culvert wall. Data loggers were attached using small carabiner. 444
445
Prior to deployment, each logger was programmed to collect temperature measurements at 10-446
minute intervals using the HOBO Waterproof Data Shuttle (Onset Computer Corporation) and 447
HOBOware Pro software version 3.7.16 (Onset Computer Corporation). Upon collection during monthly 448
surveys, all data loggers were assessed for damage and data was downloaded and stored as a CSV 449
(comma separated values) document. Device battery capacity and free memory were monitored during 450
this process. Loggers were reconfigured by the HOBOware Pro software prior to being returned to the 451
same location within the culvert. 452
453
LABORATORY METHODS 454
455
DNA Extraction 456
457
Field swabs stored at -80 ºC were thawed, resuspended in 140 μl TE buffer, and vortexed. A 0.6 458
ml vial with the bottom cut was placed inside a sterile 2 ml Eppendorf tube. The original field swab was 459
placed into the cut 0.6 ml tube inside the 2 ml tube. If the field swab was stored in liquid, any remaining 460
liquid was pipetted into the 2 ml tube. The 0.6 ml vial containing the field swab was sealed then 461
centrifuged for 1 min at 10,000 rpm. This was done to ensure all liquid, potentially containing DNA, was 462
pulled from the field swab and into the 2 ml tube. The field swab was placed back in its original vial using 463
sterilized tweezers. All original field swabs were stored at -80 ºC. Then, 16 μl of Proteinase K was added 464
to the solution. Samples were then incubated in a heat block at 37 ºC for 5 min, 65 ºC for 30 min, and 80 465
ºC for 20 min, then vortexed for 10 minutes. Equal volume to total sample volume (~156 μl) of 466
phenol:chloroform:isoamyl alcohol (25:24:1) was added to each sample. The samples were then 467
vortexed and centrifuged for 2 min at 10,000 rpm. The top aqueous layer containing DNA was pipetted 468
into a new 2ml Eppendorf tube. The sample was washed with equal volume to sample of absolute 469
ethanol and incubated at -80 ºC for one hour. Following incubation, samples were centrifuged for 10 470
min at 10,000 rpm. Ethanol was removed from the sample and washed with half the sample volume of 471
70% ethanol. Samples were centrifuged for 10 min at 10,000 rpm and left open to allow the ethanol to 472
volatilize. Once the ethanol had volatilized, samples were resuspended in 25 μl TE buffer. 473
474

Standard Curve 475
476
P. destructans cultures were used to create a standard curve of detection in order to quantify P. 477
destructans from field samples. A growing culture of P. destructans was swabbed and DNA extracted 478
using the protocol previously described. After extraction, the amount of DNA present in the sample was 479
quantified in triplicate using a spectrophotometer (BioTek Instruments Inc). Following determination of 480
sample concentration, dilutions were calculated for a curve ranging from 1 ng/μl to 250 ng/μl (Figure 7). 481
A dilution series allowed for relative quantification based on the cycle threshold (Ct) value. The Ct value 482
was determined by the cycle number necessary to achieve amplification above the threshold level. This 483
dilution series was processed using qPCR assay parameters described by Muller et al. (2013) with 484
volume modifications to accommodate a commercial internal control kit (QuantiFast Pathogen + PCR IC 485
Kit, Qiagen). Reactions included 2.5 μl Internal Control Assay from the Internal Control Kit, 2.5 μl Internal 486
Control DNA from the Internal Control Kit, 2.5 μl of a 10X solution comprised of 10 μl forward primer 487
(5’– TGC CTC TCC GCC ATT AGT G –3’), 10 μl reverse primer (5’– ACC ACC GGCTCG CTA GGT A –3’), 10 μl 488
TaqMan probe (5’-(FAM) CGT TAC AGC TTG CTC GGG CTG CC (BHQ-1)-3’) and 70 μl sterile deionized 489
water, 5 μl master mix, 7.5 μl sterile deionized water and 5 μl unknown sample DNA. Forward primer, 490
reverse primer, and probe sequences were adopted from the assay described by Muller et al. (2013). 491
The standard curve was successfully reproduced several times with similar acceptable results, and 492
yielding an R2 of 0.98 - 0.99. The standard curve was used to quantify the 249 field swabs processed for 493
P. destructans detection. 494

495
Figure 7 | Standard Curve. Standard curve of detection created using pure culture P. destructans. All unknown field samples 496 were plotted against this curve to determine relative concentration. Cq value is synonymous with Ct value. 497
498
STATISTICAL METHODS 499
500
Due to the relatively small sample size, all data collected at bridges was excluded from further 501
analyses. All analyses operated under the assumption that all tunnels at any given site had the same 502
dimensional measurements and were treated as one culvert site. Height of the culvert, distance from 503
the base of the structure to the ceiling, width of the culvert, distance from one wall to the opposite wall 504
were recorded at each surveyed culvert. These measurements were used to calculate the hypotenuse or 505
diagonal of each culvert. 506
The diagonal measurement of each culvert, length of the culvert, habitat surrounding the 507
culvert, conditions inside the culvert, and presence of water were used as predictor variables in a logistic 508
R2= 0.98

linear regression in an effort to predict bat presence (Table 2). ‘Month’ was included as a predictor 509
variable to account for both initial surveys and monthly surveys of representative culverts. All 510
combinations of predictor variables were considered during model selection. The Akaike Information 511
Criteria value (AIC) of each model was used to determine which best fit the data. Due to the relatively 512
small sample size of this dataset (n=197 surveys), AIC values were converted into AICc values (Burnham 513
and Anderson 2002). Model selection was then based on the delta AIC value and relative AIC weight of 514
the individual model. Delta AIC values of 4 or less were considered to provide substantial empirical 515
support for the individual model (Burnham and Anderson 2002). Logistic linear regression models were 516
used to predict general bat presence, and P. subflavus presence. A one-tailed t-test was used to assess 517
any differences in roosting preferences P. subflavus may have exhibited. 518
Variable Description
Habitat Environment immediately surrounding culvert
Example: ‘woodland’, ‘riparian’
Conditions Physical and environmental features within culvert
Example: ‘concrete’, ‘bare ground’
Water Presence or absence of water within culvert
Month Time of the year the survey was conducted
Diagonal
diagonal = √(ℎ𝑒𝑖𝑔ℎ𝑡 𝑜𝑓 𝑐𝑢𝑙𝑣𝑒𝑟𝑡)2 + (𝑤𝑖𝑑𝑡ℎ 𝑜𝑓 𝑐𝑢𝑙𝑣𝑒𝑟𝑡)2
Length Distance between culvert entrances
Table 2 | Variables Included in Logistic Linear Regression. Variables were collected during each survey and included as 519 predictor variables in a logistic linear regression. 520
521
Within each culvert, temperature data was averaged per data logger in 24-hour increments. 522
Calculated daily averages were used for all further analyses and charts. A single factor ANOVA variance 523
analysis was used to assess the variance observed between the three data loggers within a single 524
culvert. For each culvert containing a data logger in a weep hole position, the daily average 525
temperatures collected in the free hanging position were averaged and compared to the average daily 526
temperature collected in the weep hole using a two-tailed paired t-test. A variance analysis and two-527
tailed paired t- test was used to compare the variances of average daily temperatures collected by data 528
loggers deployed in weep holes and data loggers free hanging on the culvert wall. After establishing the 529
novelty of the temperature collected inside a weep hole, a single factored ANOVA variance analysis was 530
used to examine any variance between the average daily temperatures collected by the four data 531
loggers deployed in weep holes. Tukey’s test was then used to determine which of the four weep hole 532
oriented data loggers contributed to the significant difference observed in the single-factored ANOVA. 533
All statistical analysis was conducted in Excel or Statistical Analytical System (SAS) Studio (SAS Institute). 534
535
536
537
538
RESULTS 539
540
Hibernation Season Culvert Surveys 541
542
Between December of 2017 and March of 2018, 109 roadway-associated structures in the 543
coastal plains and coastal region of Georgia were surveyed, comprising of 96 culverts and 13 bridges. 544
While roughly half of all culverts surveyed had only one tunnel at each site (n=49), the remaining sites 545
(n=47) contained 2 – 6 tunnels. Culverts whose entrance resembled a square or rectangle, had a 546
prevalence of 82.29 % (n=79). Culverts whose entrance was circular, had a prevalence of 17.71 % (n=17). 547
Culvert diagonal measurements ranged from 0.79 m – 4.15 m with a mean of 2.32 m (standard deviation 548
of ±0.85 m). Arc GIS software (v10.6.1, Environmental Systems Research Institute, Redlands, CA) was 549
used to measure the length of all culverts surveyed. The length of surveyed culverts ranged from 20.4 m 550
– 92.8 m with a mean of 56.13 m (±13.91 m). 551
P. subflavus, M. austroriparius, and C. rafinesquii were observed roosting in surveyed culverts 552
during the 2017/2018 winter hibernation season (Table 3). 49 P. subflavus were recorded in 12 culverts 553
(Figure 8). 132 M. austroriparius were recorded in 31 culverts (Figure 9), and 6 C. rafinesquiis were 554
recorded in 4 culverts. 76 % of P. subflavus were observed clustered in weep holes and 81 % of M. 555
austroriparius were observed roosting in weep holes during the 2017/2018 hibernation season. 556
557

Representative Culvert
Latitude/Longitude
Species Present
Total Number of Bat
Present Site 28 31.90822, -81.32538 MYAU 6
Site 30 31.869703, -81.334253 MYAU; PESU 48; 28
Site 31 31.766016, -81.381426 MYAU; PESU 1; 1
Site 70 31.78705, -83.69124 MYAU 46
Site 79 31.51649, -83.51678
Site 88 30.96825, -83.38108 MYAU 57
Site 107 31.228588, -81.497639 MYAU; PESU 2; 8
Site 109 31.35215, -81.61068 MYAU; PESU; CORA 27; 35; 15
Site 110 31.27178, -81.56145
Site 124 32.75386, -83.16170 MYAU; PESU; CORA 13; 22; 9
Site 125 32.68833, -83.09161 PESU 3
Site 127 32.66219, -83.04816 MYAU; PESU; CORA 1; 3; 2
Table 3 | Representative Culverts and Species Present. The locations of all twelve representative culverts surveyed, bat 558 species observed, and relative number of individuals. 559
560
561
Figure 8 | P. subflavus Observations 2017/2018. All 2017/2018 P. subflavus observations in the coastal plains and coastal 562 region of Georgia. Dot size corresponds to the number of individuals observed. 563

564
Figure 9 | M. austroriparius Observations 2017/2018. All 2017/2018 M. austroriparius observations in the coastal plains 565 and costal region of Georgia. Dot size corresponds to the number of individuals observed. 566
567
568
Environmental Predictor Variables 569
570
While no one environmental variable had significant ability to accurately predict bat presence or 571
P. subflavus presence, models that best fit the data contained ‘month’ ‘habitat’ ‘water’ and ‘conditions’. 572
Models containing only ‘habitat’ ‘conditions’ and ‘water’ provided similarly substantial support, while 573
containing fewer variables (Table 3; Table 4). 574
PREDICTING BAT PRESENCE
Variables Included in Model
Raw AIC
AICc
Delta AIC
AICw
month, water, conditions, habitat 241.938 242.146 0.0** 0.0

length, habitat, month, conditions, water 242.032 242.346 0.094 0.000434
habitat, conditions, water 242.095 242.271 0.157* 0.000725
cross section habitat conditions water 242.826 243.034 0.888 0.004101
cross section, water, habitat, month, conditions 243.078 243.392 1.14 0.005264
cross section, length, habitat, month, conditions, water 243.315 243.757 1.377 0.006359
cross section, water, length, habitat, conditions 243.564 243.878 1.626 0.007508
Table 4 | Best Fit Models for Predicting Bat Presence. Top logistic linear regression models. 575 ** indicates the model containing the lowest delta AIC value. 576 * indicates a simpler model containing an acceptable delta AIC value while containing less variables 577
578
PREDICTING P. SUBFLAVUS PRESENCE
Variables Included in Model Raw AIC
AICc
Delta AIC
AICw
month, water, conditions, habitat 201.398 201.606
0.0** 0.0
length, habitat, month, conditions, water 202.534 202.848
1.136 0.006097
cross section, water, habitat, month, conditions 203.197 203.511
1.799 0.009655
cross section, length, habitat, month, conditions, water 204.29 204.732
2.892 0.015521
habitat, conditions, water 205.5 205.676
4.102* 0.022015
Table 5 | Best Fit Models for Predicting P. subflavus Presence. Top logistic linear regression models 579 ** indicates the model containing the lowest delta AIC value. 580 * indicates a simpler model containing a less acceptable delta AIC value, but contains less variables 581
582
Predicting variable, ‘habitat’ was further investigated for significance within the habitat composition 583
observed between culverts with bats present and culverts with bats absent (Figure 10). While habitat 584
surrounding culverts surveyed varied greatly, no significant difference between surrounding habitat 585
composition was detected. 586
587

588
Figure 10 | Habitat Surrounding Surveyed Culverts. Graphical representation of all habitat types documented around 589 surveyed culverts based on observed bat presence. ‘Partially altered’ refers to habitat containing natural features and few 590 anthropogenic features. ‘Altered’ refers to habitat containing few natural features and numerous anthropogenic features. 591
592
593
Representative Culverts 594
595
The diagonal measurements of representative culverts ranged from 3.72 m – 1.72 m (±0.70 m) 596
and the mean culvert length was 53.58 m (±12.55 m) Representative culverts were surveyed for bat 597
presence in June, September, October, November, and December of 2018, and January, February, 598
March and May of 2019. Due to excessive flooding, culvert sites 31, 79, and 107 were inaccessible in 599
December, culvert sites 31, 107, and 127 were inaccessible in January, and culvert site 107 was 600
inaccessible in March. 601
P. subflavus was observed roosting in representative culverts in all months except June and 602
September. During the February survey, there were significantly more P. subflavus observed roosting 603
inside weep holes than observed free hanging on the culvert walls (p=0.03). While no other significant 604
differences in roosting preference were observed, a consistently higher number of P. subflavus were 605
0%
10%
20%
30%
40%
50%
60%
70%
80%
90%
100%
Present Absent
Woodland Riparian Agricultural Commercial
Residential Woodland (Altered) Woodland (partially altered) Woodland Grassland Riparian
Woodland Riparian Riparian (Altered)

recorded clustering in weep holes then free hanging on the culvert walls for any given winter month 606
(Figure 11). 607
608
Figure 11 |P. subflavus in Weep Holes. Percentage of all P. subflavus observed roosting in the weep hole orientation during 609 December 2018, January 2019, February 2019, and March 2019.WH refers to bats observed roosting inside a weep hole. FH 610 refers to bats observed roosting on the wall or ceiling. Consistently, a higher number of P. subflavus were observed roosting in 611 the weep hole orientation then free hanging. Numbers on stacked graphs represent raw number of individuals observed. 612
613
Three individuals outfitted with unique bands were recovered over the course of the 614
investigation. A non-reproductive male M. austroriparius (ID GA1969) and a non-reproductive male P. 615
subflavus (ID GA0981) were banded at culvert site 109 in June of 2018 and January of 2018, respectively. 616
A non-reproductive female P. subflavus (ID GA0988) was banded at culvert site 127 in March 2018. All 617
three bats were recovered at culvert site 109 between December of 2018 and March of 2019. Bat 618
GA1969 was recovered during both December and February surveys. Interestingly, bat GA0988 was 619
originally banded by the U.S. Fish and Wildlife Service at culvert site 127, located near Dublin, Georgia in 620
March of 2018 and recovered in culvert site 109, near Brunswick, Georgia, in December of 2018. 621
622
1226
34
5
35
4
3
0%
10%
20%
30%
40%
50%
60%
70%
80%
90%
100%
December January February March
WH FH

Temperature Data Loggers 623
624
Temperature data loggers deployed in the 12 representative culverts recorded temperature for 625
a maximum of 321 days between June of 2018 and May of 2019 (Figures 12 – 23). Data loggers 626
displaying less than 321 days of temperature data either malfunctioned or were added to the study at a 627
later date. 628
629
Figure 12 | Average Daily Temperature in Culvert 28. Temperature collected by all three data loggers at culvert site 28 630 during deployment. Data logger location within the culvert described by “west, east, and center” labels. 631
7
9
11
13
15
17
19
21
23
25
27
29
15-Jul 4-Aug 24-Aug 13-Sep 2-Oct 21-Oct 10-Nov 29-Nov 18-Dec 7-Jan 26-Jan 15-Feb 6-Mar 25-Mar 14-Apr 4-May 24-May
Tem
per
atu
re º
C
Logger 034 (west) Logger 026 (east) Logger 030 (center) Ambient Temperature Potential Growth Range Optimal Growth Range

632
Figure 13 | Average Daily Temperature in Culvert 30. Temperature collected by all three data loggers at culvert site 30 633 during deployment. Data logger location within the culvert described by “west, east, and center” labels. 634
635
Figure 14 | Average Daily Temperature in Culvert 31. Temperature collected by all three data loggers at culvert site 31 636 during deployment. Data logger location within the culvert described by “west, east, and WH” labels. 637
5
7
9
11
13
15
17
19
21
23
25
27
29
25-Jun 17-Jul 6-Aug 26-Aug 15-Sep 5-Oct 25-Oct 14-Nov 4-Dec 24-Dec 13-Jan 31-Jan 20-Feb 11-Mar 30-Mar 19-Apr 9-May
Ave
rage
Dai
ly T
emp
erat
ure
(°C
)
Logger 003 (east) Logger 019 (west) Logger 011 (center) Ambient Temperature Potential Growth Range Optimal Growth Range
4
6
8
10
12
14
16
18
20
22
24
26
28
30
25-Jun 17-Jul 6-Aug 26-Aug 15-Sep 4-Oct 23-Oct 11-Nov 1-Dec 21-Dec 10-Jan 30-Jan 19-Feb 10-Mar 29-Mar 18-Apr 8-May
Tem
per
atu
re º
C
Logger 012 (east) Logger 004 (west) Logger 020 (WH) Ambient Temperature Potential Growth Range Optimal Growth Range
638
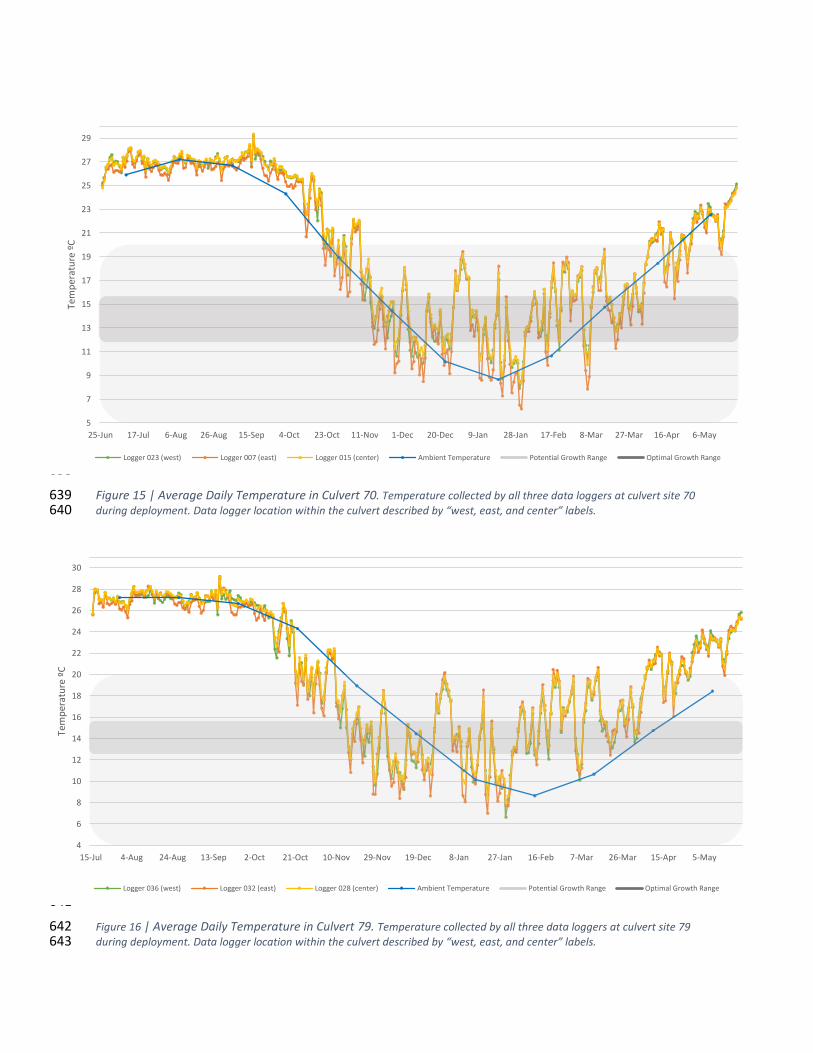
Figure 15 | Average Daily Temperature in Culvert 70. Temperature collected by all three data loggers at culvert site 70 639 during deployment. Data logger location within the culvert described by “west, east, and center” labels. 640
641
Figure 16 | Average Daily Temperature in Culvert 79. Temperature collected by all three data loggers at culvert site 79 642 during deployment. Data logger location within the culvert described by “west, east, and center” labels. 643
5
7
9
11
13
15
17
19
21
23
25
27
29
25-Jun 17-Jul 6-Aug 26-Aug 15-Sep 4-Oct 23-Oct 11-Nov 1-Dec 20-Dec 9-Jan 28-Jan 17-Feb 8-Mar 27-Mar 16-Apr 6-May
Tem
per
atu
re º
C
Logger 023 (west) Logger 007 (east) Logger 015 (center) Ambient Temperature Potential Growth Range Optimal Growth Range
4
6
8
10
12
14
16
18
20
22
24
26
28
30
15-Jul 4-Aug 24-Aug 13-Sep 2-Oct 21-Oct 10-Nov 29-Nov 19-Dec 8-Jan 27-Jan 16-Feb 7-Mar 26-Mar 15-Apr 5-May
Tem
per
atu
re º
C
Logger 036 (west) Logger 032 (east) Logger 028 (center) Ambient Temperature Potential Growth Range Optimal Growth Range

644
Figure 17 | Average Daily Temperature in Culvert 88. Temperature collected by all three data loggers at culvert site 88 645 during deployment. Data logger location within the culvert described by “center, east, and WH” labels. 646
647
Figure 18 | Average Daily Temperature in Culvert 107. Temperature collected by all three data loggers at culvert site 107 648 during deployment. Data logger location within the culvert described by “west, east, and center” labels. 649
5
7
9
11
13
15
17
19
21
23
25
27
29
25-Jun 17-Jul 6-Aug 26-Aug 15-Sep 4-Oct 23-Oct 11-Nov 1-Dec 20-Dec 9-Jan 28-Jan 17-Feb 8-Mar 27-Mar 16-Apr 6-May
Tem
per
atu
re º
C
Logger 024 (east) Logger 016 (center) Logger 008 (WH) Ambient Temperature Potential Growth Range Optimal Growth Range
5
7
9
11
13
15
17
19
21
23
25
27
29
31
25-Jun 17-Jul 6-Aug 26-Aug 15-Sep 4-Oct 23-Oct 11-Nov 1-Dec 21-Dec 10-Jan 30-Jan 19-Feb 10-Mar 30-Mar 19-Apr 9-May
Tem
per
atu
re º
C
Logger 010 (west) Logger 002 (east) Logger 018 (center) Ambient Temperature Potential Growth Range Optimal Growth Range
650
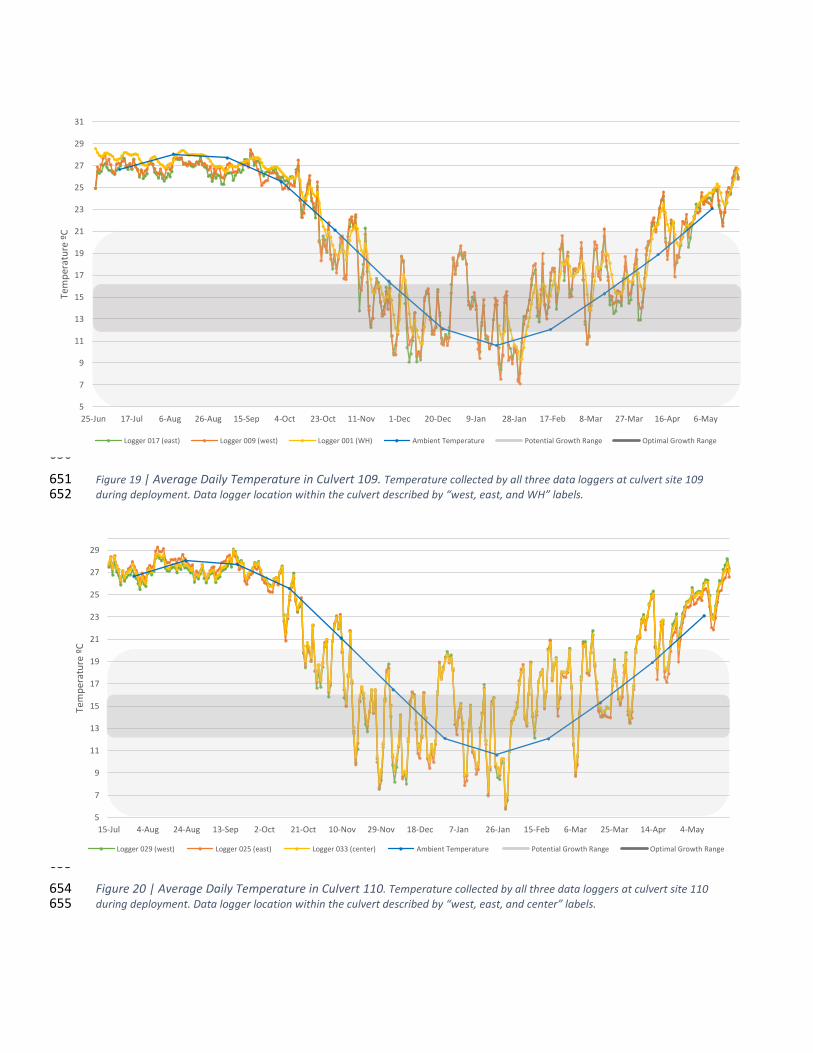
Figure 19 | Average Daily Temperature in Culvert 109. Temperature collected by all three data loggers at culvert site 109 651 during deployment. Data logger location within the culvert described by “west, east, and WH” labels. 652
653
Figure 20 | Average Daily Temperature in Culvert 110. Temperature collected by all three data loggers at culvert site 110 654 during deployment. Data logger location within the culvert described by “west, east, and center” labels. 655
5
7
9
11
13
15
17
19
21
23
25
27
29
31
25-Jun 17-Jul 6-Aug 26-Aug 15-Sep 4-Oct 23-Oct 11-Nov 1-Dec 20-Dec 9-Jan 28-Jan 17-Feb 8-Mar 27-Mar 16-Apr 6-May
Tem
per
atu
re º
C
Logger 017 (east) Logger 009 (west) Logger 001 (WH) Ambient Temperature Potential Growth Range Optimal Growth Range
5
7
9
11
13
15
17
19
21
23
25
27
29
15-Jul 4-Aug 24-Aug 13-Sep 2-Oct 21-Oct 10-Nov 29-Nov 18-Dec 7-Jan 26-Jan 15-Feb 6-Mar 25-Mar 14-Apr 4-May
Tem
per
atu
re º
C
Logger 029 (west) Logger 025 (east) Logger 033 (center) Ambient Temperature Potential Growth Range Optimal Growth Range
656
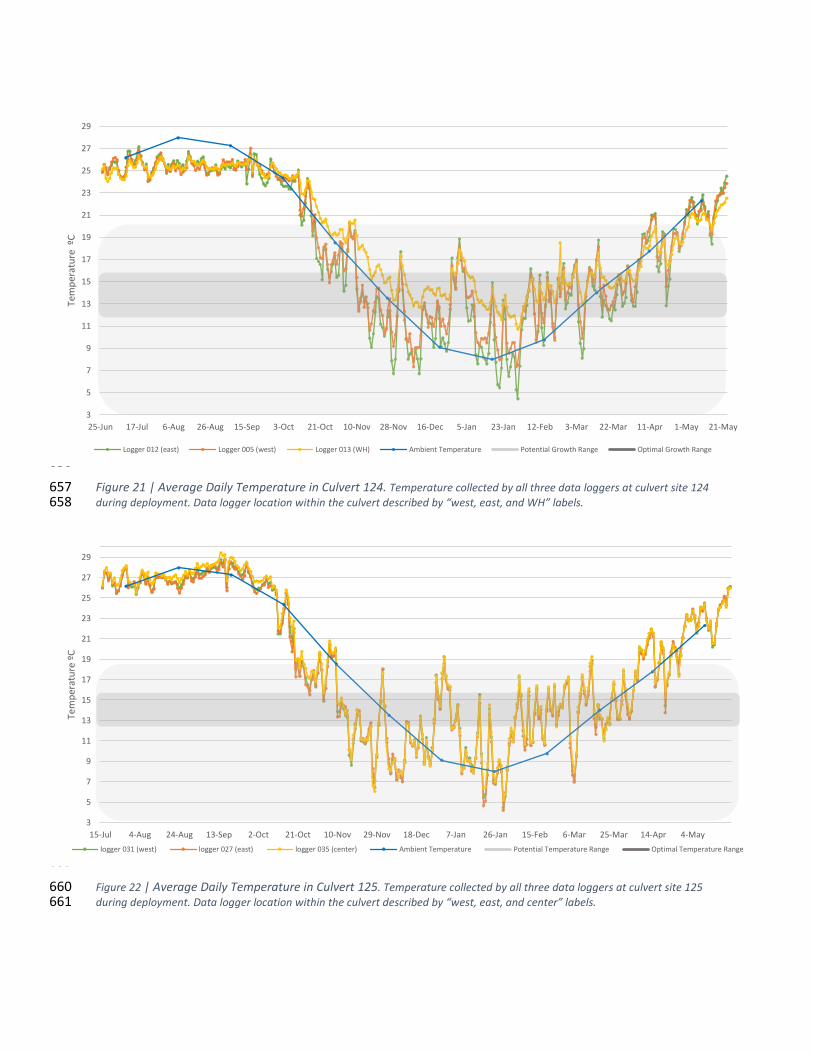
Figure 21 | Average Daily Temperature in Culvert 124. Temperature collected by all three data loggers at culvert site 124 657 during deployment. Data logger location within the culvert described by “west, east, and WH” labels. 658
659
Figure 22 | Average Daily Temperature in Culvert 125. Temperature collected by all three data loggers at culvert site 125 660 during deployment. Data logger location within the culvert described by “west, east, and center” labels. 661
3
5
7
9
11
13
15
17
19
21
23
25
27
29
25-Jun 17-Jul 6-Aug 26-Aug 15-Sep 3-Oct 21-Oct 10-Nov 28-Nov 16-Dec 5-Jan 23-Jan 12-Feb 3-Mar 22-Mar 11-Apr 1-May 21-May
Tem
per
atu
re º
C
Logger 012 (east) Logger 005 (west) Logger 013 (WH) Ambient Temperature Potential Growth Range Optimal Growth Range
3
5
7
9
11
13
15
17
19
21
23
25
27
29
15-Jul 4-Aug 24-Aug 13-Sep 2-Oct 21-Oct 10-Nov 29-Nov 18-Dec 7-Jan 26-Jan 15-Feb 6-Mar 25-Mar 14-Apr 4-May
Tem
per
atu
re º
C
logger 031 (west) logger 027 (east) logger 035 (center) Ambient Temperature Potential Temperature Range Optimal Temperature Range
662
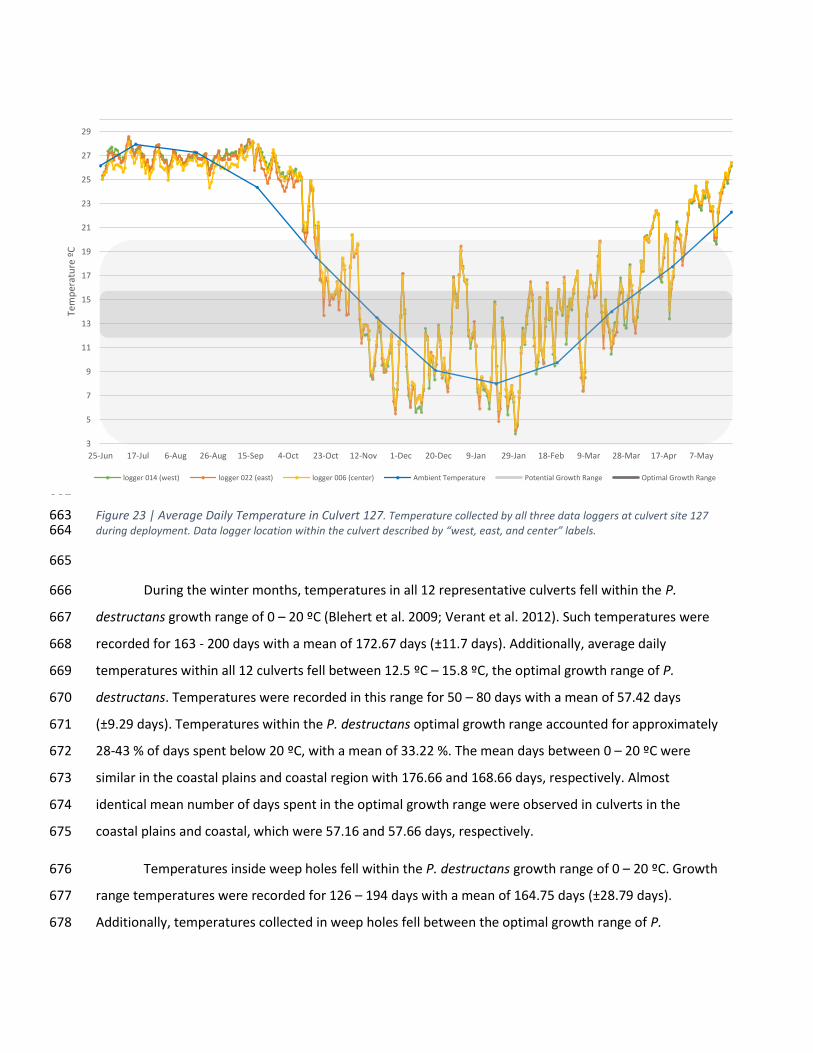
Figure 23 | Average Daily Temperature in Culvert 127. Temperature collected by all three data loggers at culvert site 127 663 during deployment. Data logger location within the culvert described by “west, east, and center” labels. 664
665
During the winter months, temperatures in all 12 representative culverts fell within the P. 666
destructans growth range of 0 – 20 ºC (Blehert et al. 2009; Verant et al. 2012). Such temperatures were 667
recorded for 163 - 200 days with a mean of 172.67 days (±11.7 days). Additionally, average daily 668
temperatures within all 12 culverts fell between 12.5 ºC – 15.8 ºC, the optimal growth range of P. 669
destructans. Temperatures were recorded in this range for 50 – 80 days with a mean of 57.42 days 670
(±9.29 days). Temperatures within the P. destructans optimal growth range accounted for approximately 671
28-43 % of days spent below 20 ºC, with a mean of 33.22 %. The mean days between 0 – 20 ºC were 672
similar in the coastal plains and coastal region with 176.66 and 168.66 days, respectively. Almost 673
identical mean number of days spent in the optimal growth range were observed in culverts in the 674
coastal plains and coastal, which were 57.16 and 57.66 days, respectively. 675
Temperatures inside weep holes fell within the P. destructans growth range of 0 – 20 ºC. Growth 676
range temperatures were recorded for 126 – 194 days with a mean of 164.75 days (±28.79 days). 677
Additionally, temperatures collected in weep holes fell between the optimal growth range of P. 678
3
5
7
9
11
13
15
17
19
21
23
25
27
29
25-Jun 17-Jul 6-Aug 26-Aug 15-Sep 4-Oct 23-Oct 12-Nov 1-Dec 20-Dec 9-Jan 29-Jan 18-Feb 9-Mar 28-Mar 17-Apr 7-May
Tem
per
atu
re º
C
logger 014 (west) logger 022 (east) logger 006 (center) Ambient Temperature Potential Growth Range Optimal Growth Range
destructans, 12.5 – 15.8 ºC. Temperatures were recorded in this range between 36 – 112 days with a 679
mean of 63.50 days (±34.11 days). Approximately 26 – 57% of all days spent under 20 ºC, were within 680
optimal growth range temperatures. Data loggers deployed inside weep holes in the coastal plains 681
region collected an average of 160 days within growth range temperatures as compared to 169.5 days in 682
the coastal region. Conversely, data loggers deployed inside weep holes in the coastal plains recorded a 683
mean of 74 days within the optimal growth temperature range, as compared to 53 days recorded in the 684
coastal region. 685
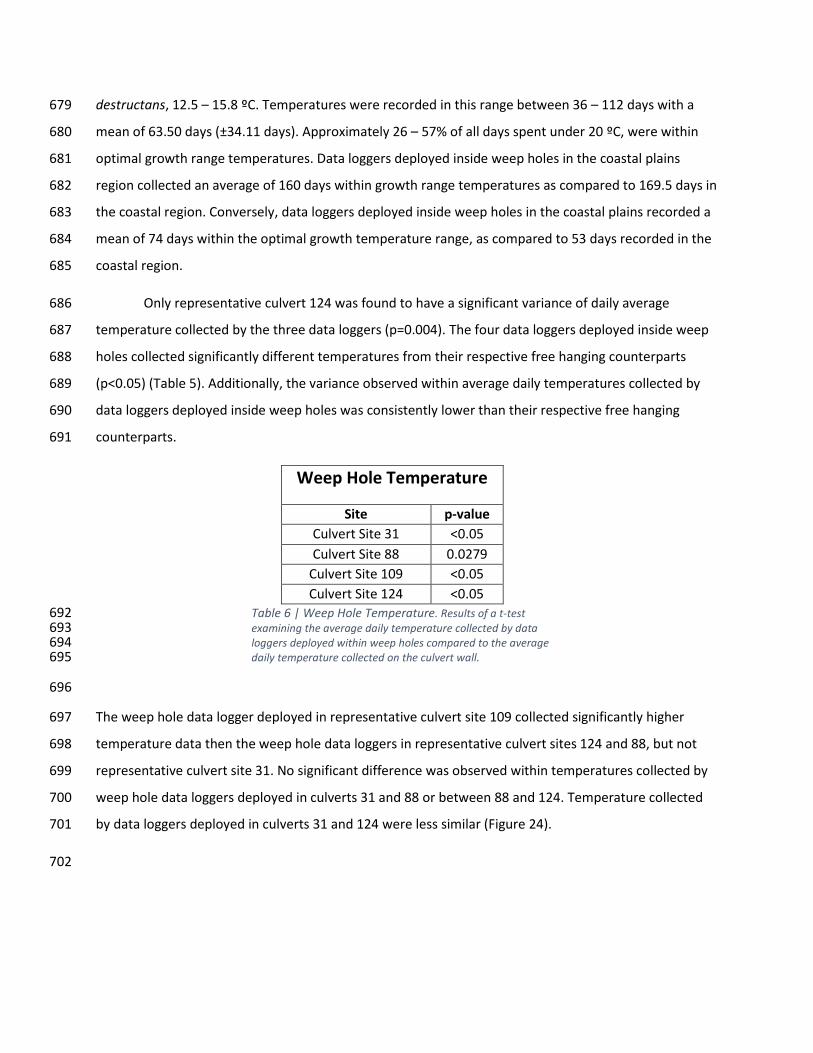
Only representative culvert 124 was found to have a significant variance of daily average 686
temperature collected by the three data loggers (p=0.004). The four data loggers deployed inside weep 687
holes collected significantly different temperatures from their respective free hanging counterparts 688
(p<0.05) (Table 5). Additionally, the variance observed within average daily temperatures collected by 689
data loggers deployed inside weep holes was consistently lower than their respective free hanging 690
counterparts. 691
Weep Hole Temperature
Site p-value
Culvert Site 31 <0.05
Culvert Site 88 0.0279
Culvert Site 109 <0.05
Culvert Site 124 <0.05
Table 6 | Weep Hole Temperature. Results of a t-test 692 examining the average daily temperature collected by data 693 loggers deployed within weep holes compared to the average 694 daily temperature collected on the culvert wall. 695
696
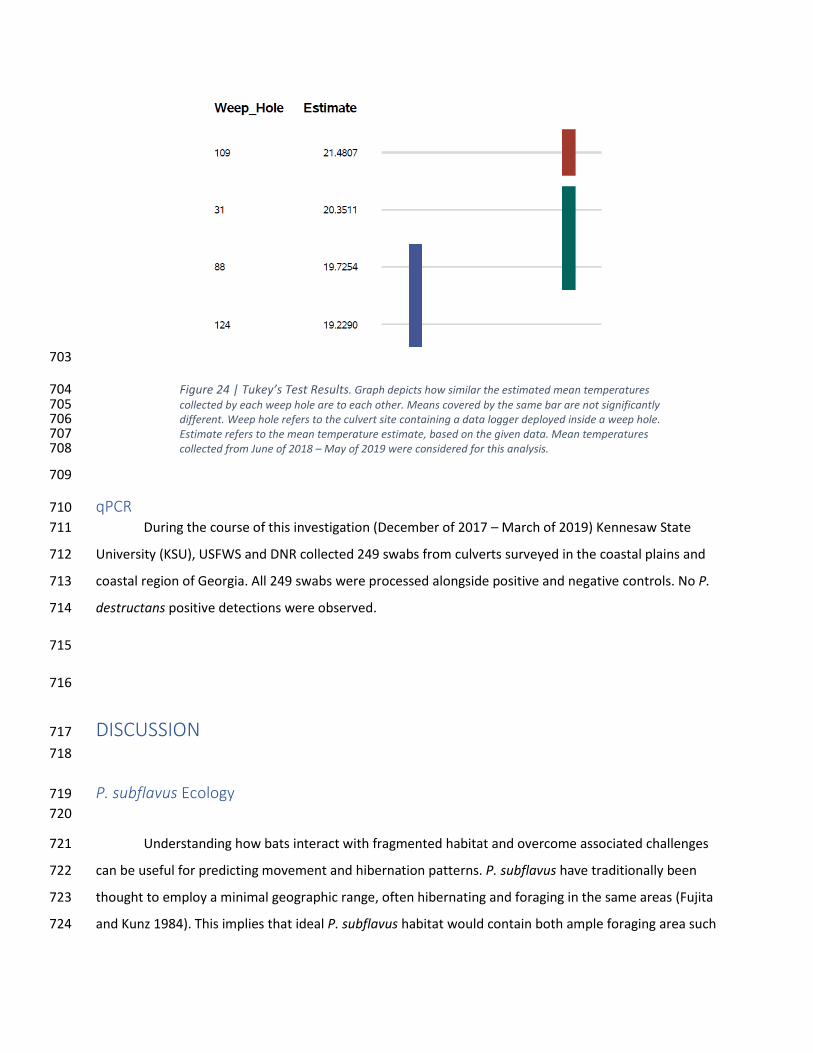
The weep hole data logger deployed in representative culvert site 109 collected significantly higher 697
temperature data then the weep hole data loggers in representative culvert sites 124 and 88, but not 698
representative culvert site 31. No significant difference was observed within temperatures collected by 699
weep hole data loggers deployed in culverts 31 and 88 or between 88 and 124. Temperature collected 700
by data loggers deployed in culverts 31 and 124 were less similar (Figure 24). 701
702
703
Figure 24 | Tukey’s Test Results. Graph depicts how similar the estimated mean temperatures 704 collected by each weep hole are to each other. Means covered by the same bar are not significantly 705 different. Weep hole refers to the culvert site containing a data logger deployed inside a weep hole. 706 Estimate refers to the mean temperature estimate, based on the given data. Mean temperatures 707 collected from June of 2018 – May of 2019 were considered for this analysis. 708
709
qPCR 710
During the course of this investigation (December of 2017 – March of 2019) Kennesaw State 711
University (KSU), USFWS and DNR collected 249 swabs from culverts surveyed in the coastal plains and 712
coastal region of Georgia. All 249 swabs were processed alongside positive and negative controls. No P. 713
destructans positive detections were observed. 714
715
716
DISCUSSION 717
718
P. subflavus Ecology 719
720
Understanding how bats interact with fragmented habitat and overcome associated challenges 721
can be useful for predicting movement and hibernation patterns. P. subflavus have traditionally been 722
thought to employ a minimal geographic range, often hibernating and foraging in the same areas (Fujita 723
and Kunz 1984). This implies that ideal P. subflavus habitat would contain both ample foraging area such 724

as bottomland forest and cavernous hibernation structures. However, more recent studies have 725
determined that P. subflavus actually migrate a much greater distance to hibernation sites then 726
originally assumed (Fraser et al. 2012). This strategy is believed to relieve the animal of the physiological 727
pressures associated with maintaining torpor during a long harsh winter and increase their chances of 728
survival (Fraser et al. 2012). If this latitudinal migration occurs in states like Georgia, overcoming the 729
challenges associated with the lack of cavernous habitat will be critical to survival. Within a patch-730
corridor matrix of habitat, a non-traditional roost may be the safest option, offering a stable 731
environment for hibernation. Our observations could provide evidence supporting that P. subflavus 732
engage in regional latitudinal migration. In March of 2018, a non-reproductive female P. subflavus was 733
collected and given a unique band at culvert site 127, near Dublin Georgia. During the following 734
hibernation season, she was observed roosting at culvert site 109, near Brunswick Georgia. While her 735
summer foraging location is unknown, it could be assumed that she remained near culvert site 127 until 736
the fall months before migrating the 130 miles to the coastal region for hibernation. 737
Logistic linear regression models containing predicting variables ‘month’, ‘water’, ‘conditions’, 738
and ‘habitat’ were selected as models with the strongest ability to predict bat presence and P. subflavus 739
presence. The model containing ‘habitat’ ‘conditions’, and ‘water’ was able to provide comparable 740
support while including less variables. The simplest explanation is probably the most likely, thus the 741
model containing the least number of variables is generally selected as the model to best fit the data 742
(Burnham and Anderson 2002). A relatively small sample size prevented further analysis to determine if 743
a specific habitat or condition type influenced bat presence. Broadly, no significant difference was 744
observed between habitat characteristics surrounding culverts with bats present and culverts with bats 745
absent (Figure 10). Previous research reported an inverse relationship between the amount of non-746
forested land and P. subflavus activity on a large geographic scale, suggesting that bat activity levels 747
decreased in areas that had been cleared for agriculture or residential use (Farrow et al. 2011). 748
Conversely, other investigators modeled bat presence in relation to landscape context, finding that P. 749
subflavus was more likely to be present in areas of sparse vegetation (Loeb and O’Keefe 2003). Based on 750
the literature, the landscape scale being considered is a critical component when assessing P. subflavus 751
response to habitat alteration and distribution. 752
753
Cluster Behavior 754
755

Hibernation strategies vary across species and individuals, each catering to a specific 756
physiological need (Brack 2007). Some myotis species require a warm, thermally stable environment to 757
minimize the amount of energy required to rewarm during arousal. Other myotis species such as Myotis 758
sodalis (Indiana bat), are often observed roosting in small clusters in slightly cooler areas of the 759
hibernacula (Brack 2007). P. subflavus have been consistently documented roosting solitarily in natural 760
hibernacula (Fujita and Kunz 1984; Sandel et al. 2001; Brack 2007; Vincent and Whitaker 2007). During 761
this investigation, P. subflavus was consistently documented roosting in clusters of 2 – 10 individuals 762
inside weep holes. This unprecedented roosting behavior in a traditionally solitary species raises serious 763
concerns regarding the potential transmission of P. destructans and development of white-nose 764
syndrome. Pathogen transmission rates among species that roost in clusters are higher due to the 765
constant skin-to-skin contact during the hibernation season (Hoyt et al. 2018). Species that commonly 766
exhibit clustering behavior such as M. lucifugus and M. septentrionalis have experienced rapid disease 767
transmission and associate population declines. In contrast, P. subflavus has experienced slower disease 768
transmission, and associated population declines were not observed for several years after pathogen 769
detection (Hoyt et al. 2018). 770
Additionally, M. austroriparius were often recorded roosting in the same culvert as P. subflavus. 771
This species is commonly observed roosting in large clusters and can potentially act as an asymptomatic 772
vector species for P. destructans. Only one case of a M. austroriparius developing white-nose syndrome 773
has been recorded (U.S. Geological Survey 2017). These bats remain active all year rarely using deep 774
torpor, allowing the spread of P. destructans spores during the winter months. 775
776
Temperature 777
778
Temperatures within roadway-associated culverts fell between the growth range of P. 779
destructans for the equivalent of five months (172 days), indicating the potential for fungal growth and 780
host infection during almost half of a calendar year. Within this time, the equivalent of almost two 781
months (57 days) fell within the optimal growth range for P. destuctans. During roughly one-third of the 782
year, culverts in the coastal plains and coastal region of Georgia experience temperatures highly 783
conducive to P. destructans growth. As expected, the average daily temperatures within coastal plains 784
culverts were typically lower than culverts in the coastal region (Grider et al. 2016). Interestingly, 785
temperatures collected in culverts in the southernmost plot and the northernmost plot were distinctly 786

different from the other plot in the respective region. Further investigation is required to characterize 787
the geographic component of the temperature patterns within a culvert. 788
Additionally, culverts offer various microclimates. Data from this investigation suggests that bats 789
roosting inside weep holes during the critical winter months, are exposed to significantly higher average 790
daily temperatures then those roosting on the culvert wall or ceiling. Weep holes also offer more 791
thermal stability, an environmental characteristic often appealing to a torpid mammal relying on fat 792
reserves for survival (Hayman et al. 2016). While weep holes offered a warmer environment relative to 793
the rest of the culvert, the average daily temperatures actually remained within the optimal growth 794
range with less fluctuation (Figures 11-22), making weep holes the most susceptible microhabitat inside 795
the culvert. Maintaining temperatures within 12.5 – 15.8 ºC for a multi-week duration provides the ideal 796
environment for efficient P. destructans growth within the weep hole microhabitat (Verant et al. 2012) 797
798
Disease Triangle 799
800
The disease triangle is a concept that suggests an inherent relationship between the host 801
organism, pathogen, and environment in which they interact (McNew 1960). Initially used as a general 802
framework, it is now a fundamental tool for understanding and predicting epidemics in plants, animals, 803
and humans. Epidemics such as Batrachochytrium dendrobatidis infection in amphibians, Malaria in 804
humans, and the Panama disease in Musa spp., have been evaluated within the disease triangle 805
framework (Scholthof 2007; James et al. 2015). In each context, the disease triangle model was used to 806
explain how host susceptibility, environmental conditions and variation, and pathogen virulence 807
influenced varying disease outcomes. The disease triangle model has only been applied to the white-808
nose syndrome epidemic in a laboratory context, investigating mortality in captive bats, or a theoretical 809
context, building predictive models (Johnson et al. 2014; Hayman et al. 2016). Broadening the 810
application of this concept to management activities could aid in identifying susceptible populations, 811
predicting transmission corridors and preemptively implementing mitigation efforts. 812
Roadway-associated culverts can be evaluated for the potential to serve as disease transmission 813
corridors within the context of the disease triangle. Our data confirms such structures provide an 814
acceptable roosting environment for a highly susceptible host species, P. subflavus, during the 815
hibernation season. Roadway-associated culverts in the southern region of Georgia can also provide an 816

acceptable environment for the survival of P. destructans and the development of white-nose 817
syndrome. Data collected during this investigation suggests that the average daily temperature within 818
culverts are highly conducive to P. destructans growth. Further, the data suggests that bats roosting 819
inside weep holes located in the culvert ceiling could be at the highest risk for developing clinical WNS as 820
the temperatures remain within the optimal growth range for weeks at a time. Also, disease severity 821
could be exacerbated due to the novel clustering behavior observed in P. subflavus roosting under these 822
conditions. Because this observation is unique to culverts, the risk of disease transmission may be higher 823
than within natural hibernation structures. While P. destructans was not detected during the course of 824
this investigation, it is evident that roadway-associated culverts provide ideal host and pathogen 825
conditions for pathogen establishment and disease development. 826
827
Conclusions 828
829
In the southern region of Georgia, cavernous hibernations structures are sparse. In the absence 830
of such structures, we hypothesized that non-traditional habitat, roadway-associated culverts, could 831
serve as P. subflavus hibernacula. During this investigation, P. subflavus were observed roosting in 832
roadway-associated culverts during the critical winter months, fall swarm months and one individual 833
during the maternity season. Documenting P. subflavus over two consecutive years directly addressed 834
this objective. We hypothesized that surveyed culverts would have characteristics favorable for the 835
growth of P. destructans and the development of WNS in P. subflavus. Characterizing the temperature 836
within culverts, documenting temperatures within the optimal growth range for P. destructans, directly 837
addressed this objective. Finally, we hypothesized that roadway associated culverts in the coastal and 838
coastal plains of Georgia will have the potential to serve as a transmission corridor for white-nose 839
syndrome from karst regions of North Georgia to P. subflavus occupied karst environments in North 840
Florida. Observing P. subflavus in culverts located along roadways in the coastal plains and coastal 841
region during the winter months, roosting in clusters, and temperature characterization of 842
microhabitats within culverts allowed us to directly address this objective. These novel observations 843
across multiple months imply that roadway-associated culverts play a vital and persistent role in P. 844
subflavus ecology and disease transmission in Georgia. 845
846

Integration of Thesis Research 847
848
This investigation integrated methods and principles from multiple fields. The primary objectives 849
were to understand the spatial spread of WNS and the roosting preference of P. subflavus populations 850
potentially using roadway-associated culverts in the coastal and coastal plains regions of Georgia. The 851
spatial distribution of a population is a primary characteristic of a species ecology. Knowledge of species-852
specific ecological niche, allows research to pose specialized questions regarding movement patterns or 853
disease susceptibility. Understanding disease susceptibility requires monitoring of the host population 854
and the pathogen. In this investigation the pathogen was monitored using methods commonly 855
associated with microbiology and biochemistry related fields. Useful application of methods such as 856
DNA extraction and qPCR require an integrated knowledge of the internal reaction, and the implications 857
for various results. This investigation required methods often associated with community ecology, 858
microbiology, and biochemistry. Information gleaned using principles from one field of study, can inform 859
another field of study to ultimately address a complex question. 860
861

REFERENCES 862
863
1. Daszak, P. 2000. Emerging Infectious Diseases of Wildlife-- Threats to Biodiversity and Human 864
Health. Science (New York, N.Y.), 287(5452), 443–449. 865
https://doi.org/10.1126/science.287.5452.443 866
2. Fisher MC, Henk DA, Briggs CJ, Brownstein JS, Madoff LC, Mccraw SL, Gurr SJ. 2012. Emerging 867
fungal threats to animal, plant and ecosystem health. Nature 484:186–194. 868
3. Fisher MC, Grow NAR, Gurr SJ. 2016. Tackling emerging fungal threats to animal health, food 869
security and ecosystem resilience. Philosophical Transactions Royal Society Publishing B 371: 870
20160332. http://dx.doi.org/10.1098/rstb.2016.0332 871
4. Parkes H, Berger L, Hines HB, Marantelli G, McDonald KR, Slocombe R, Speare R, Lips KR, 872
Cunningham AA, Green DE, Daszak P, Hyatt AD, Goggin CL, Ragan MA. 2002. Chytridiomycosis 873
causes amphibian mortality associated with population declines in the rain forests of Australia 874
and Central America. Proc Natl Acad Sci 95:9031–9036. 875
5. Last LA, Fenton H, Gonyor-McGuire J, Moore M, & Yabsley M J. 2016. Snake fungal disease 876
caused by Ophidiomyces ophiodiicola in a free-ranging mud snake (Farancia abacura). Journal of 877
Veterinary Diagnostic Investigation, 28(6), 709–713. 878
https://doi.org/10.1177/1040638716663250 879
6. Blehert DS, Hicks AC, Behr M, Meteyer CU, Berlowski-Zier BM, Buckles EL, Coleman JT, Darling 880
SR, Gargas A, Niver R, Okoniewski JC, Rudd RJ, Stone WB. 2009. Bat white-nose syndrome: an 881
emerging fungal pathogen? Science (80- ) 323:227. 882
7. Warnecke L, Turner JM, Bollinger TK, Misra V, Cryan PM, Blehert DS, Willis CKR. 2013. 883
Pathophysiology of white-nose syndrome in bats: a mechanistic model linking wing damage to 884
mortality. Biology Letters, 9, 20130177. https://doi.org/10.1098/rsbl.2013.0177 885
8. Lilley TM, Johnson JS, Ruokolainen L, Rogers EJ, Wilson CA, Schell SM, Reeder DM. 2016. White-886
nose syndrome survivors do not exhibit frequent arousals associated with Pseudogymnoascus 887
destructans infection. Frontiers in Zoology, 13(12), 1–8. https://doi.org/10.1186/s12983-016-888
0143-3 889

9. Meteyer CU, Barber D, Mandl JN. 2012. Pathology in euthermic bats with white nose syndrome 890
suggests a natural manifestation of immune reconstitution inflammatory syndrome. Virulence 3. 891
10. Reeder DM, Frank CL, Turner GG, Meteyer CU, Kurta A, et al. 2012. Frequent arousal from 892
hibernation linked to severity of infection and mortality in bats with white-nose syndrome. PLoS 893
ONE 7(6). https//doi:10.1371/journal.pone.0038920 894
11. Grider JF, Larsen AL, Homyack JA, & Kalcounis-Rueppell MC. 2016. Winter activity of coastal 895
plain populations of bat species affected by white-nose syndrome and wind energy facilities. 896
PLoS ONE, 11(11), 1–15. https://doi.org/10.1371/journal.pone.0166512 897
12. Hoyt JR, Langwig KE, Okoniewski J, Frick WF, Stone WB, Kilpatrick AM. 2015. Long-Term 898
Persistence of Pseudogymnoascus destructans, the Causative Agent of White-Nose Syndrome, in 899
the Absence of Bats. Ecohealth 12:330–333. 900
13. Ballmann AE, Torkelson MR, Bohuski EA, Russell RE, Blehert DS. 2017. Dispersal Hazards of 901
Pseudogymnoascus Destructans By Bats and Human Activity At Hibernacula in Summer. J Wildl 902
Dis 53:725–735. 903
14. Lorch JM, Meteyer CU, Behr MJ, Boyles JG, Cryan PM, Hicks AC, Ballmann AE, Coleman JTH, 904
Redell DN, Reeder DM, Blehert DS. 2011. Experimental infection of bats with Geomyces 905
destructans causes white-nose syndrome. Nature 480:376–378. 906
15. Shelley V, Kaiser S, Shelley E, Williams T, Kramer M, Haman K, Keel K, Barton HA. 2013. 907
Evaluation of strategies for the decontamination of equipment for Geomyces destructans, the 908
causative agent of white-nose syndrome (WNS). J Cave Karst Stud 75:1–10. 909
16. Lorch JM, Palmer JM, Lindner DL, Ballmann AE, George KG, Griffin K, Knowles S, Huckabee JR, 910
Haman KH, Anderson CD, Becker PA, Buchanan JB, Foster JT, Blehert DS. 2016. First Detection of 911
Bat White-Nose Syndrome in Western North America. mSphere 1:1–5. 912
17. Geluso K, & Mink JN. 2009. Use of bridges by bats (Mammalia: Chiroptera) in the Rio Grande 913
valley, New Mexico. Southwestern Naturalist, 54(4), 421–429. 914
18. Allen LC, Turmelle AS, Widmaier EP, Hristov NI, Mccracken GF, & Kunz TH. 2011. Variation in 915
Physiological Stress between Bridge- and Cave-Roosting Brazilian Free-Tailed Bats. Conservation 916
Biology, 25(2), 374–381. https://doi.org/10.1111/j.1523-1739.2010.01624.x 917

19. Bergeson SM, Carter TC, & Whitby MD. 2015. Adaptive roosting gives little brown bats an 918
advantage over endangered Indiana bats. The American Midland Naturalist, 174:321–330. 919
https://doi.org/10.1674/0003-0031-174.2.321 920
20. Tuttle M, Keeley B. 1999. Bats in American Bridges. Bat Conservation International Inc Copyright 921
©1999 Bat Conservation International, Inc. 922
https://www.batcon.org/pdfs/bridges/BatsBridges2.pdf 923
21. Bennett FM, Loeb SC, Bunch MS, & Bowerman WW. 2008. Use and Selection of Bridges as Day 924
Roosts by Rafinesque’s Big-Eared Bats. The American Midland Naturalist, 160:386–399. 925
https://doi.org/10.1674/0003-0031(2008)160[386:UASOBA]2.0.CO;2 926
22. Fujita MS, & Kunz TH. 1984). Pipistrellus subflavus. Mammalian Species. 927
https://doi.org/10.2307/3504021 928
23. Briggler J, Prather J. 2003. Seasonal Use and Selection of Caves by the Eastern Pipistrelle Bat 929
(Pipistrellus subflavus). American Midland Naturalist. 930
24. Turner GG, Reeder D, & Coleman JTH. 2011. A Five-year Assessment of Mortality and 931
Geographic Spread of White-Nose Syndrome in North American Bats, with a look to the future. 932
Update of White-Nose Syndrome in bats. Bat Research News, 52:13–27. 933
25. Veilleux JP, & Veilleux LS. 2004. Intra-annual and Interannual Fidelity to Summer Roost Areas by 934
Female Estern Pipistrellus, Pipistrellus subflavus. American Midland Naturalist, 152:196–200. 935
26. Ruf T, Geiser F. 2015. Daily torpor and hibernation in birds and mammals. Biol Rev 90:891–926. 936
27. Geiser F, Turbill C. 2009. Hibernation and daily torpor minimize mammalian extinctions. 937
Naturwissenschaften 96:1235–1240. 938
28. Burton RS, Reichman OJ. 1999. Does immune challenge affect torpor duration? Funct Ecol 939
13:232–237. 940
29. Thomas DW, Dorais M, Bergeron J. 2019. American Society of Mammalogists Winter Energy 941
Budgets and Cost of Arousals for Hibernating Little Brown Bats, Myotis lucifugus Published by : 942
American Society of Mammalogists Stable URL : https://www.jstor.org/stable/1381967 943
REFERENCES Linked references 71:475–479. 944

30. Brack V. 2007. Temperatures and locations used by hibernating bats, including Myotis sodalis 945
(Indiana bat), in a limestone mine: Implications for conservation and management. Environ 946
Manage 40:739–746. 947
31. Davis WH. 1964. Winter awakening patterns in the bats Myotis lucifugus and Pipistrellus 948
subflavus. Journal of Mammalogy 45:645-647. http://www.jstor.org/stable/1377349 949
32. Merriam G, Kozakiewicz M, Tsuchiya E, Hawley K. 1989. Barriers as boundaries for 950
metapopulations and demes of Peromyscus leucopus in farm landscapes. Landscape Ecology 951
2:227-235. 952
33. Merriam G. 1991. Corridors and connectivity: animal populations in heterogeneous 953
environments. Nature conservation 2: the role of corridors. 133-142. 954
34. Opdam P. 1991. Metapopulation theory and habitat fragmentation: A review of holarctic 955
breeding bird studies. Landscape Ecology 5:93-106. 956
35. Hess GR. 1994. Conservation corridors and contagious disease; a cautionary note. Conservation 957
Biology 8:256-262 958
36. Pettit JL, O’Keefe JM. 2017. Impacts of white-nose syndrome observed during long-term 959
monitoring of a midwestern bat community. Journal of Fish and Wildlife Management 8:69-78. 960
doi:10.3996/102016-JFWM-077 961
37. Langwig KE, Hoyt JR, Kilpatrick AM, Frick WF, Parise KL, Foster JT. 2017. Resistance in persisting 962
bat populations after white-nose syndrome invasion. Philosophical Transactions of the Royal 963
Society B: Biological Sciences 372:1712. doi:10.1098/rstb.2016.0044 964
38. National Wildlife Health Center. Bat White-Nose Syndrome (WNS)/Pd Surveillance Submission 965
Guidelines. https://www.nwhc.usgs.gov/disease_information/white-966
nose_syndrome/NWHC%20Winter%202017-2018%20Bat%20submission%20Guidelines.pdf 967
39. United States Fish and Wildlife Service. National White-Nose Syndrome Decontamination 968
Protocol. 2016. White-Nose Syndrome.org 969
40. Muller LK, Lorch JM, Lindner DL, O’Connor M, Gargas A, Blehert DS. 2013. Bat white-nose 970
syndrome: a real-time TaqMan polymerase chain reaction test targeting the intergenic spacer 971
region of Geomyces destructans. Mycologia 105:253–259. http://dx.doi.org/10.3852/12-242. 972

41. Burnham KP, Anderson DR. 2002. Model Selection and Multimodel Inference: A practical 973
Information-theoretic Approach (2nd ed). Library of Congress Cataloging-in-Publication 974
DataEcological Modelling. 975
42. Verant ML, Boyles JG, Waldrep W, Wibbelt G, Blehert DS. 2012. Temperature-Dependent 976
Growth of Geomyces destructans, the Fungus That Causes Bat White-Nose Syndrome. PLoS One 977
7. 978
43. Fraser EE, McGuire LP, Eger JL, Longstaffe FJ, Fenton MB. 2012. Evidence of latitudinal migration 979
in P. subflavus s, perimyotis subflavus. PLoS One 7. 980
44. Farrow LJ, Broders HG. 2011. Loss of forest cover impacts the distribution of the forest-dwelling 981
P. subflavus (Perimyotis subflavus). Mamm Biol 76:172–179. 982
45. Loeb, S. C. & O’Keefe JM. 2003. Habitat use by forest bats in South Carolina in relation to local, 983
stand, and landscape characteristics. J Wildl Manage 70. 984
46. Sandel JK, Benatar GR, Burke KM, Walker CW, Lacher, Jr. TE, Honeycutt RL. 2001. Use and 985
Selection of Winter Hibernacula By the Eastern Pipistrelle (Pipistrellus Subflavus ) in Texas . J 986
Mammal 82:173–178. 987
47. Vincent EA, Whitaker Jr. JO. 2007. Hibernation of the eastern pipistrelle, Perimyotis subflavus, 988
in an abandoned mine in Vermillion County, Indiana, with some information on Myotis 989
lucifugus. Proc Indiana Acad Sci 116:58–65. 990
48. Hoyt JR, Langwig KE, White JP, Kaarakka HM, Redell JA, Kurta A, DePue JE, Scullon WH, Parise KL, 991
Foster JT, Frick WF, Kilpatrick AM. 2018. Cryptic connections illuminate pathogen transmission 992
within community networks. Nature 563:710–713. 993
49. U.S. Geological Survey. 2017. Alabama survey finds first southeastern bat with white-nose 994
syndrome. https://www.usgs.gov/news/alabama-survey-finds-first-southeastern-bat-white-995
nose-syndrome 996
50. Hayman DTS, Pulliam JRC, Marshall JC, Cryan PM, Webb CT. 2016. Environment, host, and fungal 997
traits predict continental-scale white-nose syndrome in bats. Sci Adv 2:e1500831. 998

51. Arthurs S, Thomas MB. 2001. Effects of temperature and relative humidity on sporulation of 999
Metarhizium anisopliae var. acridum in mycosed cadavers of Schistocerca gregaria. J Invertebr 1000
Pathol 78:59–65. 1001
52. Marroquin CM, Lavine JO, Windstam ST. 2017. Effect of Humidity on Development of 1002
Pseudogymnoascus destructans, the Causal Agent of Bat White-Nose Syndrome . Northeast Nat 1003
24:54–64. 1004
53. McNew GL. 1960. The Nature, Origin and Evolution of Parasitism. Horsfall, J. G.; Dimond, a.e. 1005
(ed.). Plant Pathology: An Advanced Treatise. New York, Academic Press V. 2, P. 19-69 1006
54. Scholthof KBG. 2007. The disease triangle: Pathogens, the environment and society. Nat Rev 1007
Microbiol 5:152–156. 1008
55. James TY, Toledo LF, Rödder D, da Silva Leite D, Belasen AM, Betancourt-Román CM, Jenkinson 1009
TS, Soto-Azat C, Lambertini C, Longo A V., Ruggeri J, Collins JP, Burrowes PA, Lips KR, Zamudio 1010
KR, Longcore JE. 2015. Disentangling host, pathogen, and environmental determinants of a 1011
recently emerged wildlife disease: Lessons from the first 15 years of amphibian chytridiomycosis 1012
research. Ecol Evol 5:4079–4097. 1013
56. Johnson JS, Reeder DM, McMichael JW, Meierhofer MB, Stern DWF, Lumadue SS, Sigler LE, 1014
Winters HD, Vodzak ME, Kurta A, Kath JA, Field KA. 2014. Host, pathogen, and environmental 1015
characteristics predict white-nose syndrome mortality in captive little brown myotis (Myotis 1016
lucifugus). PLoS One 9. 1017
1018

APPENDECIES 1019
1020
Appendix A. Bridge Survey Data Sheet 1021
1022
1023

1024
1025
1026
1027

Appendix B. Swab Collection Data Sheet 1028
1029
1030

Appendix C. United States Geological Survey and National Wildlife Health Center Protocol 1031
1032
1033
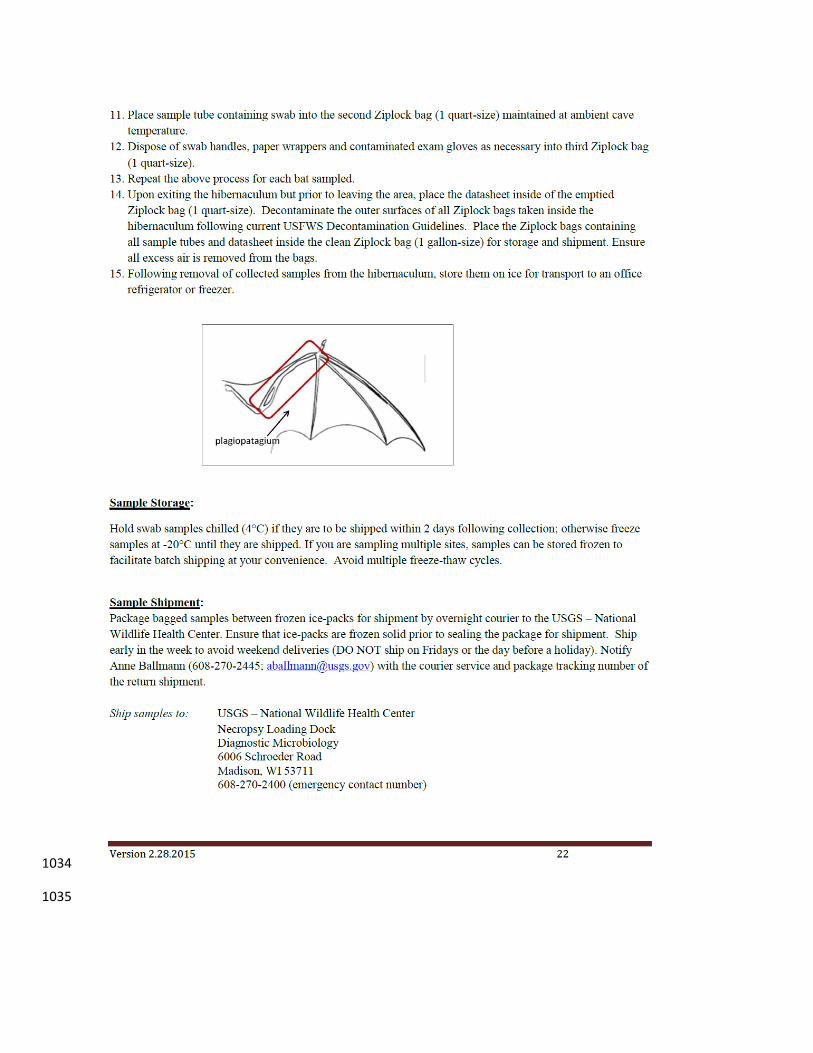
1034
1035

Appendix D. United States Fish and Wildlife Service Decontamination Protocol 1036
1037